assess material properties of concrete using combined ndt …
TRANSCRIPT
Southern Illinois University CarbondaleOpenSIUC
Theses Theses and Dissertations
5-1-2019
ASSESS MATERIAL PROPERTIES OFCONCRETE USING COMBINED NDTMETHODSAbhishek ChittiSouthern Illinois University Carbondale, [email protected]
Follow this and additional works at: https://opensiuc.lib.siu.edu/theses
This Open Access Thesis is brought to you for free and open access by the Theses and Dissertations at OpenSIUC. It has been accepted for inclusion inTheses by an authorized administrator of OpenSIUC. For more information, please contact [email protected].
Recommended CitationChitti, Abhishek, "ASSESS MATERIAL PROPERTIES OF CONCRETE USING COMBINED NDT METHODS" (2019). Theses.2490.https://opensiuc.lib.siu.edu/theses/2490

ASSESS MATERIAL PROPERTIES OF CONCRETE USING COMBINED NDT METHODS
by
Abhishek Chitti
B.E., SCSVMV University, Tamilnadu, India, 2016
A Thesis
Submitted in Partial Fulfillment of the Requirements for the
Master of Science Degree
Department of Mechanical Engineering and Energy Processes
In the Graduate School
Southern Illinois University at Carbondale
May 2019

THESIS APPROVAL
ASSESS MATERIAL PROPERTIES OF CONCRETE USING COMBINED NDT METHODS
by
Abhishek Chitti
A Thesis Submitted in Partial
Fulfillment of the Requirements
for the Degree of
Master of Science
in the field of Mechanical Engineering and Energy Processes
Approved by:
Dr. Tsuchin Philip Chu, Chair
Dr. Rasit Koc
Dr. Farhan Chowdhury
Graduate School
Southern Illinois University Carbondale
April 09, 2019

i
AN ABSTRACT OF THE THESIS OF
ABHISHEK CHITTI, for the Master of Science degree in MECHANICAL ENGINEERING,
presented on April 09, 2019, at Southern Illinois University Carbondale
TITLE: ASSESS MATERIAL PROPERTIES OF CONCRETE USING COMBINED NDT
METHODS
MAJOR PROFESSOR: Dr. Tsuchin Philip Chu
The aim of this research is to assess the material properties of concrete like modulus of
elasticity, compressive strength, and Poisson’s ratio using various nondestructive Testing (NDT)
methods like Ultrasonic Pulse Velocity (UPV) and Rebound Hammer (RH). Assessment of
material properties of concrete are important for structural design process. Various NDT
methods are applied to ensure the quality and determine material properties of concrete
specimens. The UPV method is used to test the internal condition of the concrete specimen. RH
is a surface hardness testing method and can be used to test the homogeneity of the specimen.
For this study, several batches of concrete samples with three different design strengths of 6000
psi, 8000 psi, and 12000 psi were casted. Modulus of elasticity and Poisson’s ratio were
calculated from UPV P-wave and S-wave velocities. A Nomogram was developed by combining
the longitudinal UPV values, rebound numbers, and compressive strengths. This combined NDT
correlation curve can be used to estimate compressive strength of concrete using UPV and
rebound values. The accuracy of these NDT methods were determined by comparing estimated
strength to the actual strength. Furthermore, the effect of moisture content on UPV and rebound
values was reviewed and also studied dynamic modulus of elasticity and its relation with static
modulus of elasticity of the concrete was investigated for better understanding.

ii
DEDICATION
I would like to dedicate this thesis to my beloved parents and sister for their hard work,
sacrifices, unconditional love and endless support to pursue my dream. I would like to thank my
love, Sushmitha Priya, for being a great source of motivation and support during my thesis.
I would also like to thank my friends who believed and supported me while pursuing this
master’s degree.

iii
ACKNOWLEDGEMENTS
I would like to express my sincere gratitude to my advisor Dr. Tsuchin Philip Chu,
Southern Illinois University Carbondale (SIUC), for his expertise, advices, and constant support
during my studies and research at master’s level. Besides that, I would like to thank Dr. Rasit
Koc, SIUC and Dr. Farhan Chowdhury, SIUC for serving as my thesis committee members and
providing me with helpful input for this research. I would like to sincerely thank Dr. Prabir
Kolay, Dr. Sanjeev Kumar, and Mr. Sandeep Goud Burra for extending their support by
providing me their expertise in concrete. I would like to thank Mr. Tim Attig for helping me to
build a fixture for holding concrete sample.
Lastly, I would like to thank my Intelligent Measurement and Evaluation Laboratory
(IMEL) colleagues who assisted me during the course of this research.

iv
TABLE OF CONTENTS
CHAPTER PAGE
ABSTRACT ..................................................................................................................................... i
DEDICATION ................................................................................................................................ ii
ACKNOWLEDGEMENTS ........................................................................................................... iii
CHAPTER 1 - INTRODUCTION ................................................................................... 1
1.1 Objective……………………………………………………………………….2
1.2 Scope…………………………………………………………………………………..2
1.3 Sequence of Presentation………………………………………………………3
CHAPTER 2 - THEORETICAL BACKGROUND ........................................................ 5
2.1Ultrasonic Testing………………………………………………………………5
2.2 Ultrasonic Pulse Velocity (UPV) Testing .......................................................... 8
2.3Rebound Hammer (RH) Testing ....................................................................... 14
2.4 Compressive Strength Testing of Concrete ..................................................... 16
CHAPTER 3 - LITERATURE REVIEW ..................................................................... 18
3.1 Ultrasonic Pulse Velocity Testing .................................................................... 18
3.2 Rebound Hammer Testing ............................................................................... 19
3.3 Combined NDT Methods for Testing Concrete ............................................... 21
CHAPTER 4 - EXPERIMENTS AND EXPERIMENTAL SETUP ............................ 23
4.1 Engineering Approach ..................................................................................... 23

v
4.2 Sample Fabrication .......................................................................................... 25
4.3 Experimental Procedure ................................................................................... 29
4.4 Experimental study of effect of moisture content on UPV and
RH measurements ............................................................................................ 35
4.5 Statistical Regression Analyses ....................................................................... 36
CHAPTER 5 - RESULTS AND DISCUSSION .......................................................... 37
5.1 Preliminary Study ............................................................................................ 37
5.2 Periodic study of UPV, RH, and compressive strength tests ........................... 38
5.3 Effect of moisture content on UPV and RH test results .................................. 41
5.4 Combined NDT correlation curve .................................................................... 43
5.5 Determination of dynamic material properties ................................................ 49
5.6 Investigation of relation between dynamic and static modulus of elasticity ... 50
CHAPTER 6 - CONCLUSIONS AND RECOMMENDATIONS ............................... 55
REFERENCES ............................................................................................................................. 57
APPENDIX A - UPV tests on samples of different shapes and sizes .......................................... 61
APPENDIX B - UPV P-wave and S-wave measurements using Proceq PUNDIT PL-200 ......... 63
APPENDIX C - Concrete Mix design specifications ................................................................... 65
VITA ............................................................................................................................................. 67

vi
LIST OF TABLES
TABLE PAGE
Table 1. Classification of concrete quality based on pulse velocities .......................................... 10
Table 2. Descriptions of Sample Mixes of Concrete .................................................................... 26
Table 3. Overview of sample fabrication based on different studies conducted .......................... 28
Table 4. Compressive strength results from preliminary tests ...................................................... 38
Table 5. Results from UPV and compressive strength measurements ......................................... 39
Table 6. RH and Compressive Strength values for 28-day Cured Samples ................................. 40
Table 7. Results from every stage of study on effect of moisture content.................................... 42
Table 8. Summary of an average compressive strength of concrete cylinders ............................. 43
Table 9. Experimental results from UPV, RH, and compressive strength tests ........................... 45
Table 10. Dynamic material properties of concrete samples from Mix-1 .................................... 49
Table 11. Results from UPV (P-wave) tests on samples with different shape and size ............... 62
Table 12. Mix design specifications for 6000 psi samples ........................................................... 65
Table 13. Mix design specifications for 8000 psi samples ........................................................... 66
vii
LIST OF FIGURES
FIGURE PAGE
Figure 1. Longitudinal wave propagation ....................................................................................... 6
Figure 2. Shear wave propagation .................................................................................................. 7
Figure 3. Surface wave propagation ............................................................................................... 7
Figure 4. Lamb wave propagation modes ....................................................................................... 8
Figure 5. Schematic of UPV test apparatus .................................................................................... 9
Figure 6. Direct transmission mode .............................................................................................. 11
Figure 7. Indirect transmission mode............................................................................................ 11
Figure 8. Semi-direct transmission mode ..................................................................................... 12
Figure 9. Operation of rebound hammer....................................................................................... 15
Figure 10. Conversion curve for rebound hammer ....................................................................... 16
Figure 11. Compressive strength testing of concrete cylinder ...................................................... 17
Figure 12. Flowchart depicting engineering approach ................................................................ 24
Figure 13. Molded cylinders placed on vibratory table ................................................................ 26
Figure 14. Curing the samples in water ........................................................................................ 27
Figure 15. Equipment for UPV testing ......................................................................................... 30
Figure 16. Equipment setup for UPV testing ................................................................................ 31
Figure 17. Ultrasonic dry point contact shear wave transducers .................................................. 32
Figure 18. Grinding concrete surface using a hand held concrete grinder ................................... 32
Figure 19. Rebound hammer testing equipment ........................................................................... 33
Figure 20. Rebound hammer test on concrete cylinder ................................................................ 34
Figure 21. Concrete cylinder crushed for compressive strength ................................................... 35

viii
Figure 22. Compressive strength correlated with UPV ................................................................ 40
Figure 23. Compressive strength correlated with rebound number .............................................. 41
Figure 24. Relation between measured compressive strength and UPV values ........................... 46
Figure 25. Relation between measured compressive strength and rebound number .................... 47
Figure 26. Combined NDT Correlation curve to estimate compressive strength of concrete ...... 48
Figure 27. 3-D fit to predict compressive strength of concrete with UPV and rebound number . 48
Figure 28. Stress –strain relations a) Liner and elastic b) Linear and non-elastic c) Non-linear
and elastic d) Non-Linear and non-elastic .................................................................. 51
Figure 29. Generalized stress-strain curve for concrete................................................................ 52
Figure 30. Measurement of dynamic modulus of elasticity a) Dynamic modulus test setup
b) Ultrasonic pulse velocity test setup ......................................................................... 53
Figure 31. Concrete samples with different shapes and sizes ....................................................... 61
Figure 32. P-wave velocity measurements on Sample (1 & 2) from batch-1 of 6000 psi ............ 63
Figure 33. S-wave velocity measurements on Sample (1 & 2) from batch-1 of 6000 psi ........... 64

1
CHAPTER 1
INTRODUCTION
Concrete is most common material used in construction industry. The need for in-situ
testing of concrete is important for quality controlling and compliance purposes. Usually to find
the strength of concrete core samples are drilled out of the existing structures which will damage
the structure. The location at which core has been removed should be repaired which increases
the cost and labor. NDT methods can be employed to overcome all these issues.
Many NDT methods are capable for both assessing and determining the properties and
strength of the concrete specimen. Based on the requirement, whether to find defects or to
determine the material property or to assess the strength of concrete structure, NDT method can
be selected. Combined NDT methods can be used to increase the accuracy. The current research
is focused on estimating the modulus of elasticity, Poisson’s ratio and compressive strength of
the concrete specimen using NDT methods. Considering the advantages of combining UPV and
RH methods, these are selected as NDT methods of our interest. Factors that mostly affect the
ultrasonic and rebound measurements are aggregate size, moisture content, and water to cement
ratio of the concrete. UPV method is a dynamic NDT method that can be used to assess the
concrete structure in-place. Material property of concrete like modulus of elasticity can be
obtained from UPV tests and this is considered as dynamic modulus of elasticity. Theoretically,
there is a relation between Young’s modulus and compressive strength of the material.
Compressive strength calculated using dynamic modulus of elasticity obtained from UPV tests
show huge difference when compared to actual strength of the material. This issue is addressed
by investigating the relation between dynamic modulus of elasticity and strength of concrete.

2
Multiple regression analyses was performed on results obtained from ultrasonic pulse
velocity, rebound hammer and compressive strength tests. The estimated compressive strength
obtained from regression analyses was compared to actual strength and the difference was
calculated to determine the accuracy of this developed correlation. Digital image correlation is
one of the technique used to determine the Poisson’s ratio by calculating and analyzing full-field
deformation of concrete specimens under splitting tension test. This research aims to determine
to assess the material properties using combined NDT methods. Furthermore, the influence of
moisture content on UPV and rebound values was studied.
1.1 Objective
The existing methods to find the concrete material properties are costly, time consuming
and are destructive. This research deals with assessing the material properties of concrete like
modulus of elasticity, Poisson’s ratio and compressive strength using combined nondestructive
testing methods which would reduce time consumption and cost. A combined NDT correlation
will be able to estimate the compressive strength of the concrete specimen if UPV and rebound
values are known. This knowledge will advance the development of reliable NDT methods to
evaluate quality of concrete accurately. Furthermore, this research is extended in two directions,
one by studying the effect of moisture content on UPV and rebound values and other by
investigating the relation between dynamic modulus of elasticity and compressive strength of
concrete.
1.2 Scope
The scope of this research includes casting of concrete samples for the testing. The UPV,
RH and compression strength tests were performed on concrete samples. The results from these
three tests were fused to perform multiple regression analyses. Combined NDT correlation curve
3
was developed for estimating compressive strength of concrete specimen. The accuracy of this
correlation was determined by comparing the predicted strength values from multiple regression
analysis to actual strength values. To study the effect of moisture content on UPV and rebound
numbers, another new batch of concrete was fabricated. Besides this, another study has been
conducted to investigate the relation between dynamic modulus of elasticity and compressive
strength of concrete. The shear wave velocities through concrete samples were measured using
UPV method and Poisson’s ratio was determined using the relation between longitudinal, shear
wave velocities with Poisson’s ratio of the material. The relation between dynamic modulus of
elasticity and compressive strength of concrete was investigated and necessary recommendations
were provided.
1.3 Sequence of Presentation
Chapter 1 provides readers with the introduction followed by objective and scope of this
research. This includes the motivation and gives brief description regarding different tests
performed during experimental process. The following chapters the principles behind UPV, RH,
and compression strength tests are discussed.
Chapter 2 begins with basic principles of ultrasound and its propagation in general. Also,
brief description about ultrasonic pulse velocity (UPV) testing, basic principle, different types of
transducer configurations are discussed. Then basic principles of rebound hammer (RH) tests,
and compressive strength test are explained.
Chapter 3 reviews the previous and related work, which have been conducted in this
current field of research. Chapter 4 describes the engineering approach applied in this research.
This chapter reviews sample fabrication, test setup and procedures.

4
Chapter 5 presents the results from all the experiments. This is followed by discussions
on the experimental results and investigations from other research studies. Chapter 6 finally ends
the research discussion with concluding remarks about the data and overall information from the
research project. This presentation then ends with a list of future research recommendations.
5
CHAPTER 2
THEORETICAL BACKGROUND
This chapter deals with the theoretical background related to the research experiments. It
explains basic principles behind different testing methods employed in this research. This
chapter begins with basic ultrasonic testing and will move to ultrasonic pulse velocity testing in
specific then followed by rebound hammer, compression strength tests.
2.1 Ultrasonic Testing
Sound generated above the human hearing range (typically 20 kHz) is called ultrasound.
Unlike electromagnetic waves such as light, microwave, and X-rays, ultrasonic waves require an
elastic medium (solid, liquid, air) to propagate. Ultrasound is used in various fields like
sonography (ultrasound imaging) in medicine, it is also used for mixing, cleaning and
accelerating chemical process in industry. Ultrasonic waves have shorter wavelengths i.e., they
will be reflected off very small surfaces like defects inside materials. This property is used for
testing materials in nondestructive testing [1]. The range of frequency used for ultrasonic
inspection in NDE of materials is usually from 40 kHz – 50 MHz, depending upon the
application and material being inspected.
Ultrasound can propagate in four principle modes, in solid materials, based on the
particle oscillation. These four different modes are namely longitudinal waves, shear waves,
surface waves and plate waves. These waves are further explained in following section.
6
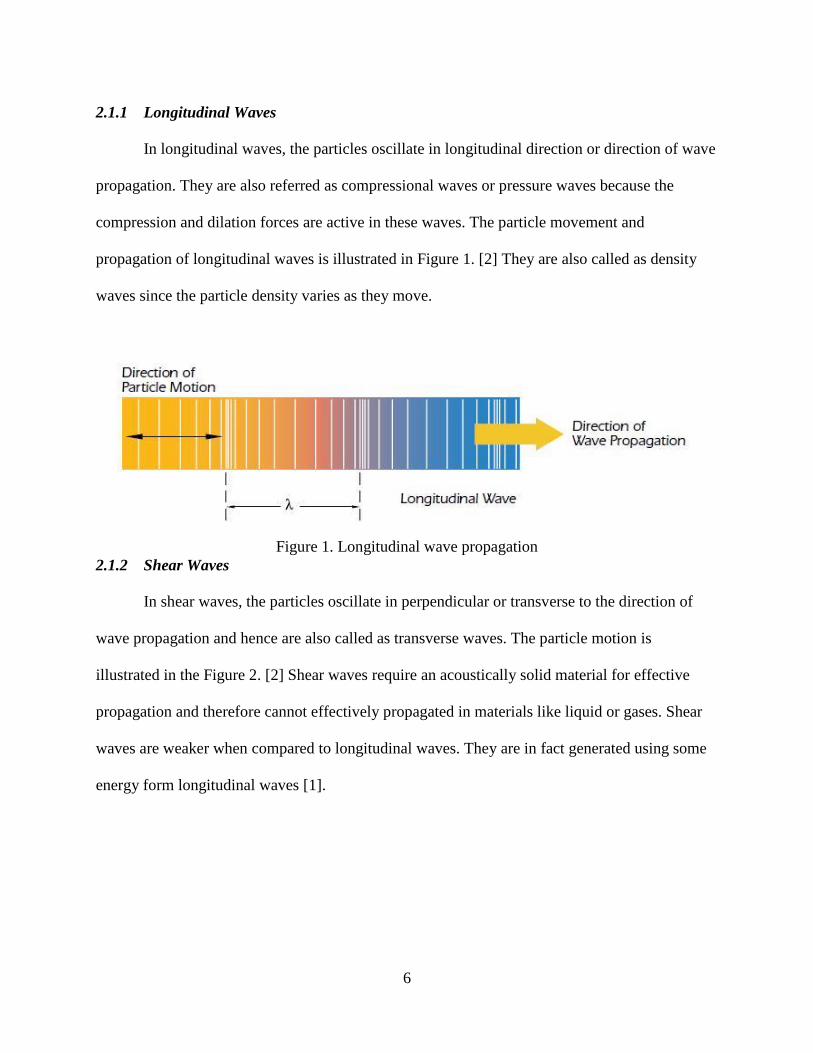
2.1.1 Longitudinal Waves
In longitudinal waves, the particles oscillate in longitudinal direction or direction of wave
propagation. They are also referred as compressional waves or pressure waves because the
compression and dilation forces are active in these waves. The particle movement and
propagation of longitudinal waves is illustrated in Figure 1. [2] They are also called as density
waves since the particle density varies as they move.
Figure 1. Longitudinal wave propagation
2.1.2 Shear Waves
In shear waves, the particles oscillate in perpendicular or transverse to the direction of
wave propagation and hence are also called as transverse waves. The particle motion is
illustrated in the Figure 2. [2] Shear waves require an acoustically solid material for effective
propagation and therefore cannot effectively propagated in materials like liquid or gases. Shear
waves are weaker when compared to longitudinal waves. They are in fact generated using some
energy form longitudinal waves [1].

7
Figure 2. Shear wave propagation
2.1.3 Surface Waves
Surface waves propagate in a relatively thick solid materials penetrating to a depth of one
wavelength (λ). Surface waves combine both longitudinal and shear waves to create an elliptical
orbit motion as illustrated in Figure 3. [1] The major axis of elliptical orbit is perpendicular to the
surface of the solid. They are also called as Rayleigh waves and travel at a velocity of 90% of
shear wave velocity. Rayleigh waves are used to inspect surface around curves or any areas that
other waves have difficulty in reaching.
Figure 3. Surface wave propagation
8
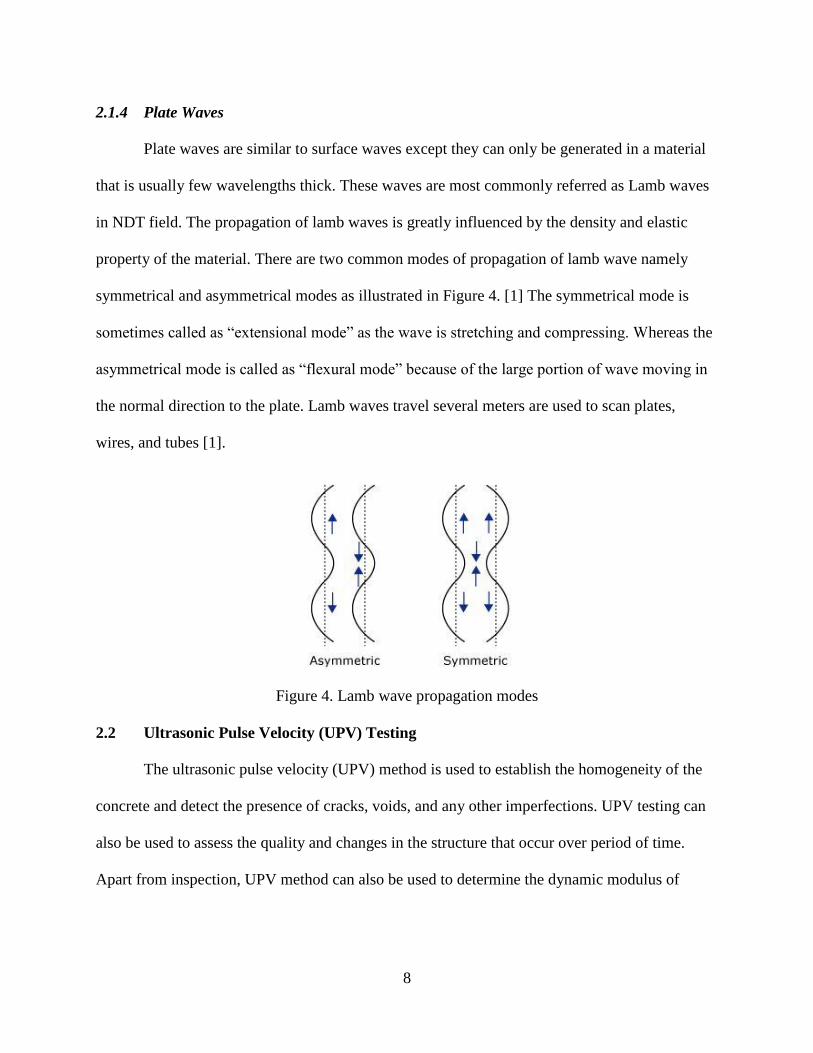
2.1.4 Plate Waves
Plate waves are similar to surface waves except they can only be generated in a material
that is usually few wavelengths thick. These waves are most commonly referred as Lamb waves
in NDT field. The propagation of lamb waves is greatly influenced by the density and elastic
property of the material. There are two common modes of propagation of lamb wave namely
symmetrical and asymmetrical modes as illustrated in Figure 4. [1] The symmetrical mode is
sometimes called as “extensional mode” as the wave is stretching and compressing. Whereas the
asymmetrical mode is called as “flexural mode” because of the large portion of wave moving in
the normal direction to the plate. Lamb waves travel several meters are used to scan plates,
wires, and tubes [1].
Figure 4. Lamb wave propagation modes
2.2 Ultrasonic Pulse Velocity (UPV) Testing
The ultrasonic pulse velocity (UPV) method is used to establish the homogeneity of the
concrete and detect the presence of cracks, voids, and any other imperfections. UPV testing can
also be used to assess the quality and changes in the structure that occur over period of time.
Apart from inspection, UPV method can also be used to determine the dynamic modulus of

9
elasticity. The ultrasonic pulse is generated by an electro-acoustical transducer and this pulse is
induced in to the concrete specimen under testing.
The basic principle of UPV testing is sending an ultrasonic pulse generated by an electro-
acoustical transducer and inducing this pulse in to concrete specimen under testing. This induced
ultrasonic pulse is detected by a receiving transducer which is placed at a known distance. The
receiving transducer detects the onset of the longitudinal waves, which is the fastest. The pulse
velocity is calculated by measuring the time it takes to reach the receiving transducer placed at a
known distance. The testing apparatus consists of a pulse generator, a pair of transducers
(transmitter and receiver), an amplifier, a time measuring circuit and time display in to one unit
as illustrate in Figure 5. [4] An ultrasonic couplant gel with is applied between the transducer
and test surface. This couplant gel plays an important role in UPV testing as it fills any air gaps
and enables to achieve maximum contact between the transducer and test surface.
Figure 5. Schematic of UPV test apparatus
10
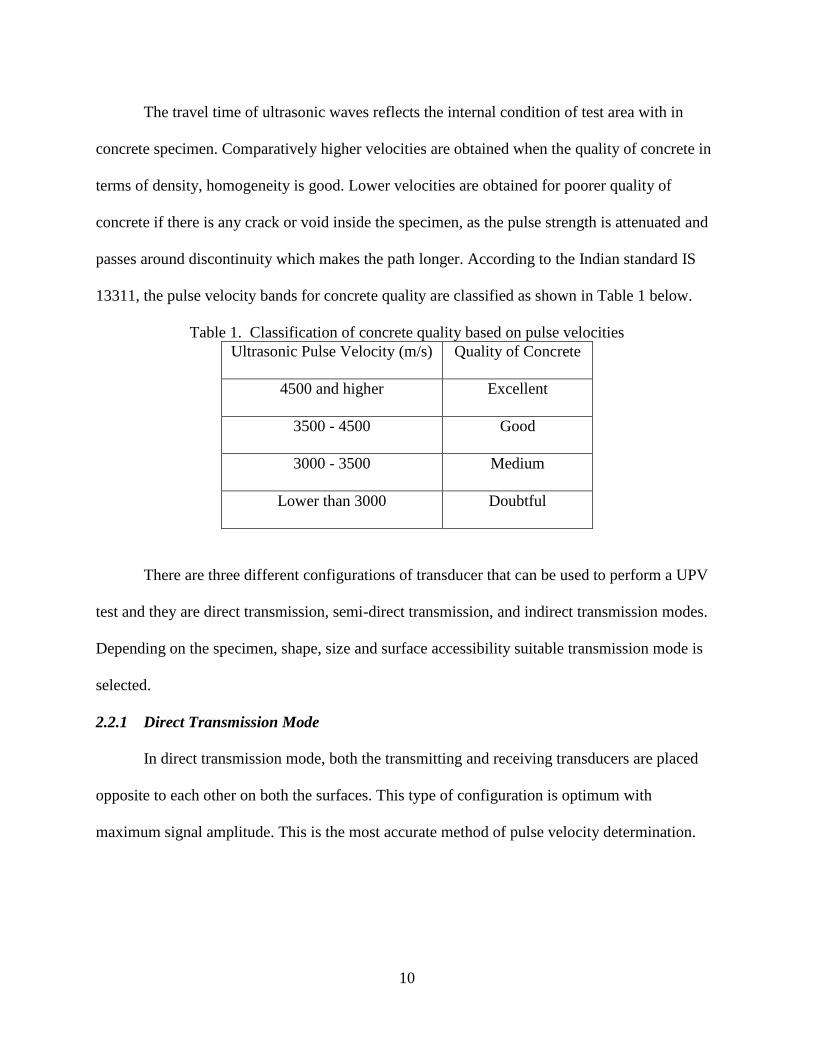
The travel time of ultrasonic waves reflects the internal condition of test area with in
concrete specimen. Comparatively higher velocities are obtained when the quality of concrete in
terms of density, homogeneity is good. Lower velocities are obtained for poorer quality of
concrete if there is any crack or void inside the specimen, as the pulse strength is attenuated and
passes around discontinuity which makes the path longer. According to the Indian standard IS
13311, the pulse velocity bands for concrete quality are classified as shown in Table 1 below.
Table 1. Classification of concrete quality based on pulse velocities
Ultrasonic Pulse Velocity (m/s) Quality of Concrete
4500 and higher Excellent
3500 - 4500 Good
3000 - 3500 Medium
Lower than 3000 Doubtful
There are three different configurations of transducer that can be used to perform a UPV
test and they are direct transmission, semi-direct transmission, and indirect transmission modes.
Depending on the specimen, shape, size and surface accessibility suitable transmission mode is
selected.
2.2.1 Direct Transmission Mode
In direct transmission mode, both the transmitting and receiving transducers are placed
opposite to each other on both the surfaces. This type of configuration is optimum with
maximum signal amplitude. This is the most accurate method of pulse velocity determination.

11
The path length is measured from center to center of the transducers as illustrated in Figure 6. [3]
This type of transmission mode requires access to both sides of the specimen.
Figure 6. Direct transmission mode
2.2.2 Indirect Transmission Mode
In this type of configuration, both the transmitting and receiving transducers are placed
on the same side of the specimen under testing as illustrated in Figure 7. [3] This type of
transmission mode is also called as “surface transmission”. Signal amplitude is very weak in this
type of transmission when compared to direct transmission. This kind of transducer arrangement
can be employed when there is only access to single side of the specimen.
Figure 7. Indirect transmission mode

12
2.2.3 Semi-direct Transmission Mode
In semi-direct transmission mode, transmitting and receiving transducers are placed
perpendicular to each other as illustrated in Figure 8. [3] The sensitivity of this type of
transmission is somewhere between direct and indirect transmission modes. The path length is
measured from center to center of the transducers. This type of transducer arrangement is useful
to inspect a corners of column specimen.
Figure 8. Semi-direct transmission mode
During direct transmission, with one transducer used as a transmitter and another used as
a receiver, the acoustic speed c (𝑐𝐿 for longitudinal or p-waves, 𝑐𝑆 for shear or s-waves) is
calculated as
c = d Dt , (2-1)
where d is the distance from the transmitter to the receiver and Δt is the measured time needed
for the pulse to travel between the transducers. In the case of pulse-echo measurement, the
ultrasonic pulse passes through the material twice from the transmitter to the far wall, and back
to the receiver so Eq. (2-1) is modified to show d = 2z, where z is the thickness of the measured
item.
Furthermore, UPV can be measured using either p- or s-waves. In general, the speeds of
these two types of wave are not equal: 𝑐𝐿 ≠ 𝑐𝑆.
13
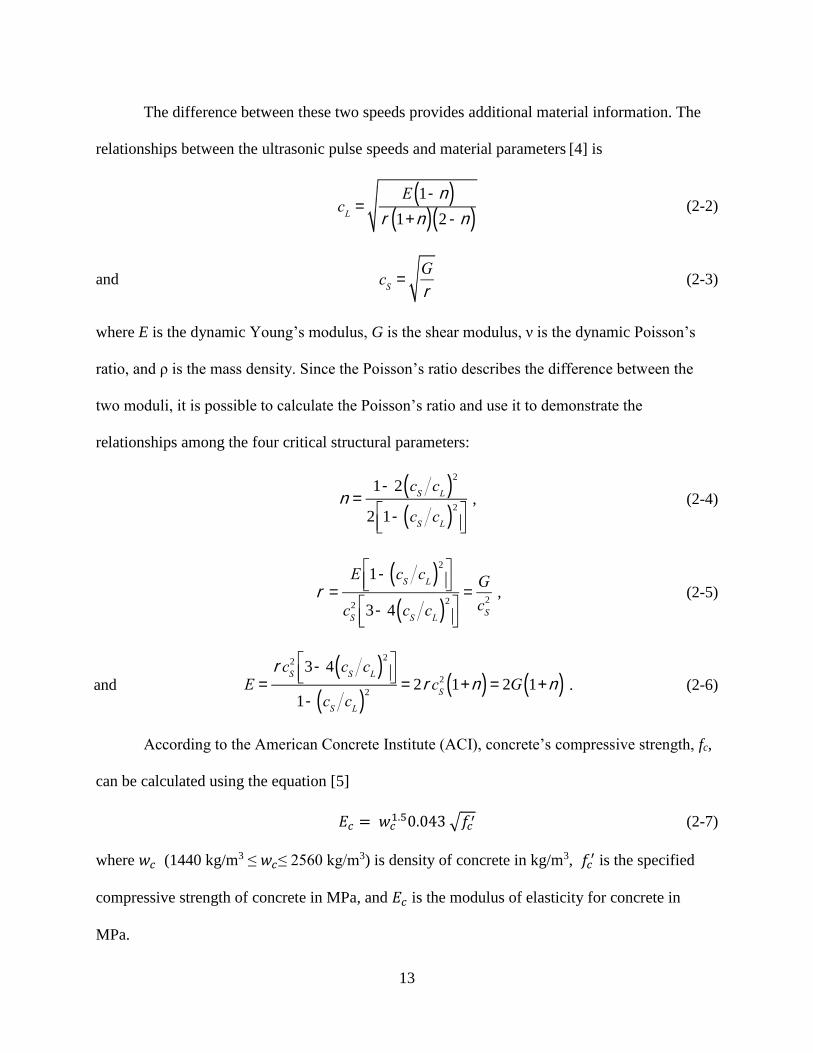
The difference between these two speeds provides additional material information. The
relationships between the ultrasonic pulse speeds and material parameters [4] is
cL
=E 1-n( )
r 1+n( ) 2 -n( ) (2-2)
and cS
=G
r (2-3)
where E is the dynamic Young’s modulus, G is the shear modulus, ν is the dynamic Poisson’s
ratio, and ρ is the mass density. Since the Poisson’s ratio describes the difference between the
two moduli, it is possible to calculate the Poisson’s ratio and use it to demonstrate the
relationships among the four critical structural parameters:
n =1- 2 c
ScL( )
2
2 1- cScL( )
2éëê
ùûú
, (2-4)
r =E 1- c
ScL( )
2éëê
ùûú
cS
2 3- 4 cScL( )
2éëê
ùûú
=G
cS
2 , (2-5)
and E =rc
S
2 3- 4 cScL( )
2éëê
ùûú
1- cScL( )
2= 2rc
S
2 1+n( ) = 2G 1+n( ) . (2-6)
According to the American Concrete Institute (ACI), concrete’s compressive strength, fc,
can be calculated using the equation [5]
𝐸𝑐 = 𝑤𝑐1.50.043 √𝑓𝑐
′ (2-7)
where 𝑤𝑐 (1440 kg/m3 ≤ 𝑤𝑐≤ 2560 kg/m3) is density of concrete in kg/m3, 𝑓𝑐′ is the specified
compressive strength of concrete in MPa, and 𝐸𝑐 is the modulus of elasticity for concrete in
MPa.

14
2.3 Rebound Hammer (RH) Testing
Rebound Hammer is a NDT method which provides an indication of the compressive
strength. Rebound hammer is also called as “Schmidt hammer” as it was first developed by a
Swiss engineer named Ernst Schmidt to measure the hardness of concrete. Rebound hammer test
works based on rebound principle, which states that the rebound of an elastic body depends on
the hardness of the surface against which the body strikes. This distance of rebound is measured
on a graduated scale and this reading is referred to as rebound index or rebound number.
Empirical correlations have been established between compressive strength and the rebound
number.
Rebound hammer test method is conducted to assess the in-place uniformity and strength
of the concrete specimen. This testing method can be used to differentiate the poor quality
regions of the structure by comparing the rebound numbers obtained from test region with
readings obtained from acceptable regions of structure.
Rebound hammer consists of a spring loaded mass that slides on a steel plunger,
indicator, latch mechanism and all these parts are housed in a cylindrical metal casing. The
working principle of rebound hammer is illustrated in the Figure 9. [6] The plunger of the
rebound hammer is pressed against the surface of concrete with increasing force. At a preset
amount of force applied a spring-controlled hammer is released; the energy of the hammer strike
is usually calibrated to 2.207 J. The hammer rebounds from the surface and the amount of
rebound, still pushing against the spring, is measured. This rebound value is read from a
graduated scale. The extent of rebound depends on the hardness of the surface tested. Since
compressive strength correlates with surface stiffness, the rebound value from a surface with
high compressive strength is larger than that from a low-strength surface. Six readings of the
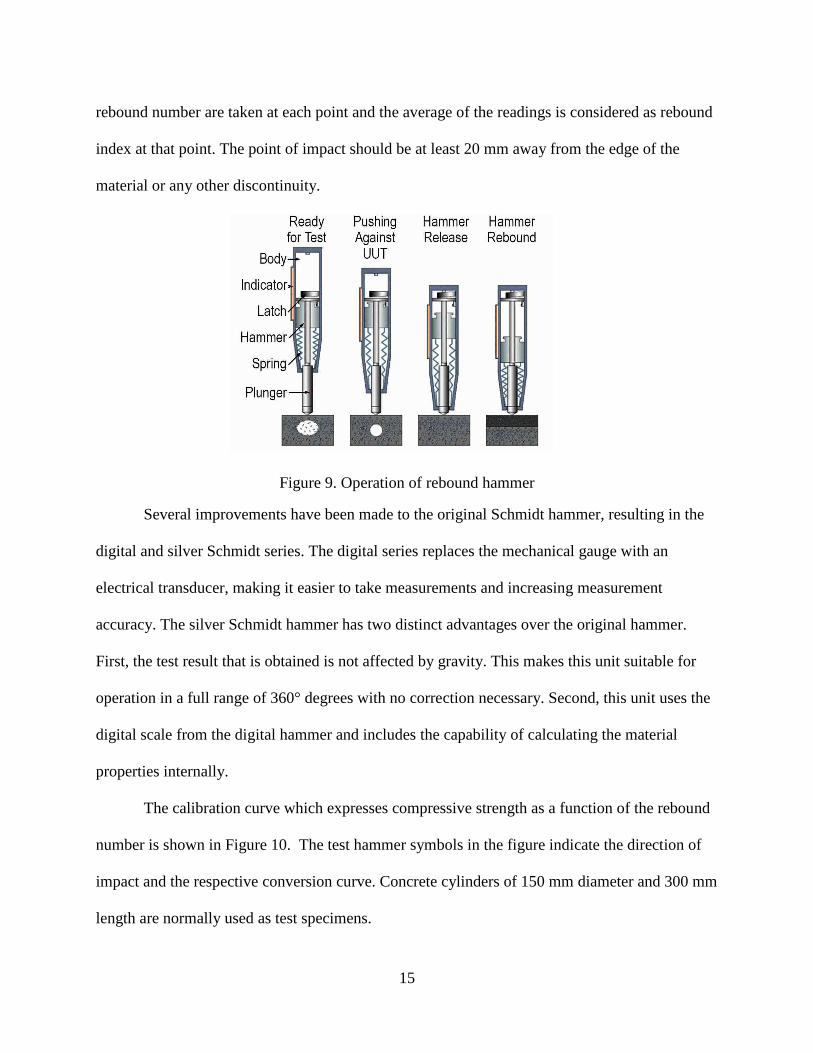
15
rebound number are taken at each point and the average of the readings is considered as rebound
index at that point. The point of impact should be at least 20 mm away from the edge of the
material or any other discontinuity.
Figure 9. Operation of rebound hammer
Several improvements have been made to the original Schmidt hammer, resulting in the
digital and silver Schmidt series. The digital series replaces the mechanical gauge with an
electrical transducer, making it easier to take measurements and increasing measurement
accuracy. The silver Schmidt hammer has two distinct advantages over the original hammer.
First, the test result that is obtained is not affected by gravity. This makes this unit suitable for
operation in a full range of 360° degrees with no correction necessary. Second, this unit uses the
digital scale from the digital hammer and includes the capability of calculating the material
properties internally.
The calibration curve which expresses compressive strength as a function of the rebound
number is shown in Figure 10. The test hammer symbols in the figure indicate the direction of
impact and the respective conversion curve. Concrete cylinders of 150 mm diameter and 300 mm
length are normally used as test specimens.

16
Figure 10. Conversion curve for rebound hammer
Relationship between rebound number and compressive strength provided by instrument
manufacturer can only be used to find the relative strength of concrete at various locations in a
structure [7]. For a specific concrete mixture, rebound number is affected by many factors such
as moisture condition, effect of carbonation and surface condition of the test location. All of
these factors need to be considered while measuring compressive strength of the specimen.
Correlations must be established by correlating rebound numbers measured on structures to the
compressive strengths of the cores taken from that locations. This correlation will enable us to
estimate the compressive strength of that structure with higher accuracy.
2.4 Compressive Strength Testing of Concrete
Combined strength results from cast cylinders are used to ensure that the concrete
mixture meets the design strength. These results may be used for quality control, acceptance of
concrete, for estimating the strength in structure, or evaluating the adequacy of curing of the
structure [8]. Field-cured specimens are tested for estimating the in-place strength. Compressive

17
strength tests are performed on both cylinders and cubes according to different testing standards
followed by different nations. In Unites States, compressive strength tests are performed on
cylindrical specimens. Cylindrical specimens are tested in accordance with the testing standard
of ASTM C39 [9]. Standard sizes of cylindrical specimens are 4×8 in. (100×200 mm) or 6×12 in.
(150×300 mm) concrete cylinders. Smaller cylinders are usually easy to handle in both field and
laboratory.
Figure 11. Compressive strength testing of concrete cylinder
Mostly, concrete specimens are tested for their compressive strength after the curing period
of 28 days. At least two samples taken from same concrete mix and age are tested for their strength
and average value is considered as the compressive strength. Concrete samples are mounted on the
hydraulic press and are capped with neoprene pads to make sure that the uniform load is applied
as illustrated in Figure 11. Load is gradually increased till complete failure using a hydraulic press.
This load at which the specimen has failed is noted and divided by cross-sectional area to find the
compressive strength of that specific sample.

18
CHAPTER 3
LITERATURE REVIEW
This chapter deals about the work done relating to this research are reviewed. Previous
and current research conducted on nondestructive testing of concrete using ultrasonic pulse
velocity, rebound hammer, and combining two or more various NDT methods to inspect or
assess material properties of concrete. Furthermore, factors affecting UPV, RH tests and
concluded with discussion on application of DIC on concrete.
3.1 Ultrasonic Pulse Velocity Testing
The UPV has been successfully used to evaluate quality of concrete by detecting internal
cracks and other defects like voids. Development of Pulse velocity method has begun in Canada
and England at about same time. Since the 1960’s, pulse velocity methods have moved out of
laboratories and to construction sites [10]. Malhotra [11] has complied an extensive list of papers
published on ultrasonic testing of concrete. Bungey [12] has conducted research on validation of
UPV testing of in-place concrete for strength and concluded that detailed knowledge on relative
moisture conditions under test is vital in establishing correlation. Yaman et al. [13] have made
comparisons between direct and indirect wave velocities and found that indirect wave UPV is
statistically similar to direct UPV if there are uniform properties along the specimen. Helal et al.
[14] have identified and described the most common successful methods of NDT as applied to
concrete structures. It was found that the majority of NDT methods rely on comparing tested
parameters with established correlations. Al-Nu’man et al. [15] have conducted an experimental
research on 880 concrete samples received from various construction projects and found that no
unique relation can be established to cover all concrete specimens. Azreen et al. [16] have
conducted tests on concrete slabs with different grades of concrete including ultrahigh

19
performance concrete (UHPC). It was observed from test results that UPV for UHPC was higher
than normal grade concrete specimens. Mahure [17] has conducted research on developing UPV
and strength relationship curves for different mixes of concrete used in concrete structures of
hydroelectric project. The estimated correlation curves are verified to be suitable for prediction
of strength in health monitoring during its service. Popovics and John [18] has studied the effect
of stresses on ultrasonic pulse velocity measurements and found that the ultrasonic pulse velocity
in concrete is independent of the stress level. Ongpeng et al. [19] have conducted a study on
characterizing of damage using ultrasonic testing on different types of concrete. In this study 36
samples of nine different mixtures varying water-cement ratios, aggregate sizes, and mixing steel
fibers have been prepared and tested using UPV before and after the damage of samples. UPV
was found to be less sensitive to characterize micro-damage inside the concrete. Lencis et al.
[20] conducted research to evaluate the impact of reinforcing bars on UPV in concrete. This
research has applied longitudinal, transverse and surface wave propagation by using direct and
indirect transmission to measure in both locations at plain concrete and rebar zones. The
experimental results shown reduction of UPV values, which is an opposite effect to the previous
studies and standards. The reason behind this has been stated to be difference in concrete
properties in transition zone and coarse aggregate concentration around rebar. Lee and Oh [21]
have analyzed the statistical distribution of P-, S-, and R- wave measurements on pre-stressed
concrete slabs and all the P-S-, and R-wave velocities increased by 3% due to pre-stressed
condition.
3.2 Rebound Hammer Testing
In 1948, Ernst Schmidt, a Swiss Engineer has developed a test hammer for measuring the
hardness of concrete by rebound principle [10]. Rebound hammer has been used to find the

20
hardness of concrete which is further correlated to compressive strength of concrete. Mitchell
and Hoagland [22] have attempted to correlate rebound number with modulus of elasticity of the
concrete specimens and concluded that no general valid correlation could be made between
rebound number and statistic modulus of elasticity. Aydın and Saribiyik [23] have conducted a
study on correlating concrete strength and rebound numbers. In order to calibrate the Schmidt
hammer, cube specimens of 28-90 days and a number of core samples from different existing
reinforced concrete structures have been tested. The best fit correction factors for the
compressive strength to rebound hammer relationship were obtained which can be applied to in
situ concrete strength. Sanchez and Tarranza [24] have investigated the reliability on rebound
hammer as a means of estimating the compressive strength of three group of concrete cube
specimens. The high dispersion of data for rebound number plotted against actual compressive
strength has reinforced the prior findings that the rebound hammer test is not substitute for
obtaining compressive strength if used alone. Kim et al. [25] have conducted experimental
research to clarify the influence of carbonation on rebound number and concrete strength
evolution. A new equation was developed from this research for strength reduction coefficient,
which compensates the influence of surface carbonation in the rebound hammer method. Ismail
et al. [26] has conducted a study on concrete chevron samples with hematite aggregates. This
study correlated rebound number to density of concrete. Comparisons were made between
concrete with Hematite aggregates and concrete with normal and granite aggregate. Concrete
with fine aggregate yielded lower rebound numbers and density. In general as density increases
rebound number increases, but the use of finer aggregate and Sike admixture has increased the
density but reduced the rebound number. Concrete with granite aggregate has yielded higher
rebound numbers than hematite aggregate though density is lower when compared. Hinnachi and
21
Guetteche [27] have revisited the rebound hammer method by emphasizing on methodology,
standards, and factors that influence rebound numbers while assessing compressive strength of
concrete. This study concluded that calibration for specific area of concrete under evaluation, at
least 9 test locations for rebound test have to be selected and cores must be drilled and tested for
their strength. Liu et al. [28] attempted to increase the accuracy of calculating concrete strength
using rebound value, material design parameters, and regression analysis. Results from this study
showed that accuracy of calculating strength using this method is based on material design
parameters of concrete mix. Statistical regression analyses of estimating concrete strength using
rebound numbers and various design parameters, including age and moisture content, had an
average accuracy of 5.5%.
3.3 Combined NDT Methods for Testing Concrete
Many investigations have applied more than one NDT method at same time to predict
strength of concrete more accurately. During 1950’s, Kesler and Higuchi [29] has pioneered in
this field. During this study, dynamic modulus of elasticity and damping constant were
determined from resonance tests and they correlated with compressive strength of concrete and
found that this method was unsuitable for in-situ measurements. The results from UPV and RH
methods have been combined to predict the compressive strength of the concrete. Many factors
like moisture content, aggregate size content are likely to affect the reliability, sensitivity, and
reproducibility of results. There are some exceptions in those cases when a variation in
properties of concrete produce opposite effects on result of each component [10]. An increase in
the moisture content increases UPV value but decreases the rebound number. RILEM Technical
Committees 7 NDT and 43 CND [30] has put large efforts on developing the SONREB method.
This method has been developed combining both ultrasonic pulse velocity and rebound hammer
22
measurements to create a correlation curve. These curves can be used to estimate the
compressive strength but the difference between estimated and actual strength is up to 20%.
Tsioulou et al. [31] have examined samples from two different mixes of ultra-high performance
concrete (UHPC), one without reinforcement and other with 3% steel fiber reinforcement. UPV
and RH tests performed at various curing ages are combined with compressive strength tests to
develop models for correlation of NDT and mechanical testing. This study highly recommended
the SonReb method as it offered higher accuracy. Bzeni and Ihsan [32] have correlated the
results from UPV and RH tests with compressive strength results. These tests were carried out on
concrete cube specimens from six different mixes of self-consolidated concrete (SCC) varying in
cementious material content. Various statistical analysis like sum of square residuals, type of fit,
and correlation coefficient were determined for developed correlation equations. The accuracy of
prediction has shown significant improvement on combining UPV values with rebound numbers
and rebound number readings were found to be less sensitive to assess strength of SCC, but
introducing age of concrete has improved strength prediction. Many research studies concluded
that correlations developed by combining UPV and rebound hammer test results with concrete
compressive strength results have been proved to have better accuracy to predict the compressive
strength [27] [33] [34].

23
CHAPTER 4
EXPERIMENTS AND EXPERIMENTAL SETUP
This chapter explains the engineering approach followed to conduct this research and this
approach is illustrated using a flowchart. The approach starts with concrete sample fabrication
with various strength properties. This section is followed by describing the experimental
procedures of UPV, RH and compressive strength tests. Experimental setup which includes the
specifications of test equipment used were also provided in this section. This chapter is
concluded by discussing the statistical regression analyses performed by correlating the test
results from both NDT and destructive tests.
4.1 Engineering Approach
The goal of this research is to estimate the material properties of the concrete samples
using combined NDT methods. This research started with the concrete sample fabrication under
the guidance of concrete experts. Samples with different targeted compressive strengths ranging
from 6000 psi, 8000 psi, and 12000 psi were fabricated. For each targeted strength, 2 batches of
samples will be fabricated and each batch consists of a 9 concrete cylinders. The fabricated
concrete cylinders were 4 inch in diameter and 8 inch in length. These samples have undergone
ultrasonic pulse velocity (UPV) testing, rebound hammer (RH) testing and finally compressive
strength testing. The results from all these tests were used to perform multiple regression
analyses using Microsoft Excel. Furthermore, a combined correlation curve has been developed
by combining the results from above mentioned nondestructive and destructive tests. The
accuracy of this correlation curve has been determined by comparing the estimated compressive
strength to measured compressive strength.

24
Figure 12. Flowchart depicting engineering approach
25
The relationship between dynamic Young’s modulus and the compressive strength of
concrete was investigated by studying various research papers. The schematic of the overall
approach is shown as flowchart in Figure 12.
4.2 Sample Fabrication
This section explains the material used for fabrication and steps followed for sample
fabrication. All the samples were prepared under laboratory conditions and under proper
supervision.
4.2.1 Material Description
Concrete is prepared by mixture of coarse aggregate, fine aggregate, cement, and water in
predefined proportions. In order to improve the properties of concrete, other materials like
admixtures and super plasticizers were added. The purpose of these admixtures is usually to
increase compressive strength.
High strength concrete (HSC) is fabricated with a reduced water/cement ratio, taking care
to reduce porosity, inhomogeneity, and cracks during hydration. These defects usually occur in
the cement paste and the transition zones between the paste and the aggregate. Densification of
the transition zone, due to the improved method, enables efficient load transfer among cement,
mortar, and aggregate.
4.2.2. Sample Specification
Different mixes of concrete cylinders with dimensions of 4 inches × 8 inches were
fabricated based on three different concrete mixtures. These mix designs were targeted to attain
compressive strengths of 41 MPa (6000 psi), 55 MPa (8000 psi), and 83 MPa (12000 psi), as
presented in Table 2. Mix 2 and Mix 3 are considered as high strength concrete. All the mix
designs used for concrete were according to the Illinois Department of Transportation’s (IDOT,

26
2012) method of concrete mixing and ACI 211 (2002) committee report, which provides
guideline for the selection of different proportions for standard concrete with Portland cement.
The consistency of the fresh concrete mixture was assessed using the slump test. Then the fresh
concrete was poured into cylindrical molds, compacted in three layers, and kept on vibratory
platform to eliminate air voids, shown in Figure 13. The molded cylinders were then left in the
open air for 24 hours to set. After that period the cylinders were demolded, labeled, and cured in
a control tank held at a temperature of 74 ˚F (24 ˚C), shown in Figure 14. These samples were
tested for compressive strength after curing for 28 days.
Table 2. Descriptions of Sample Mixes of Concrete
Mix Targeted Compressive Strength,
MPa (psi)
Mix 1 41 (6000)
Mix 2 55 (8000)
Mix 3 83 (12000)
Figure 13. Molded cylinders placed on vibratory table
27
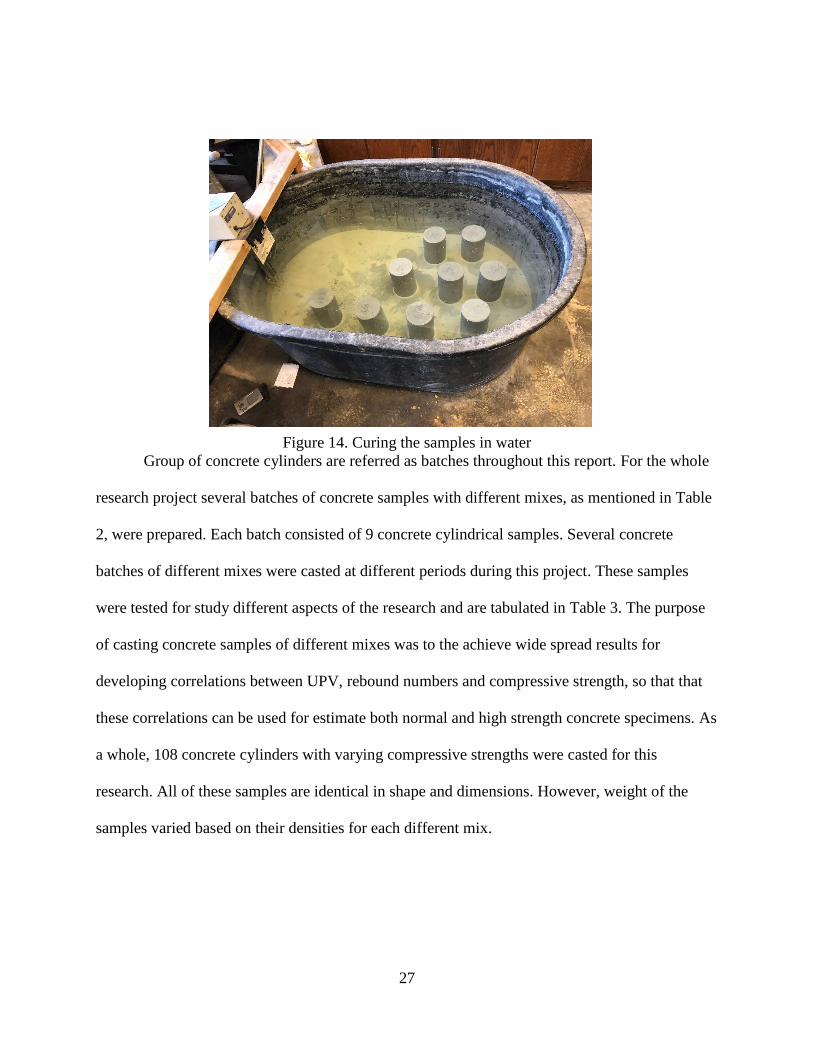
Figure 14. Curing the samples in water
Group of concrete cylinders are referred as batches throughout this report. For the whole
research project several batches of concrete samples with different mixes, as mentioned in Table
2, were prepared. Each batch consisted of 9 concrete cylindrical samples. Several concrete
batches of different mixes were casted at different periods during this project. These samples
were tested for study different aspects of the research and are tabulated in Table 3. The purpose
of casting concrete samples of different mixes was to the achieve wide spread results for
developing correlations between UPV, rebound numbers and compressive strength, so that that
these correlations can be used for estimate both normal and high strength concrete specimens. As
a whole, 108 concrete cylinders with varying compressive strengths were casted for this
research. All of these samples are identical in shape and dimensions. However, weight of the
samples varied based on their densities for each different mix.

28
Table 3. Overview of sample fabrication based on different studies conducted
Study Concrete Mix Number of Batches Number of Samples
Preliminary Mix - P 2 18
Periodic Tests-
UPV,RH, and
Compressive strength
Mix - 1 1 9
Mix - 2 1 9
Mix - 3 1 9
Effect of moisture Mix - 2 1 9
UPV, RH
and combined NDT
correlation
Mix - 1 2 18
Mix - 2 2 18
Mix - 3 2 18
Total number of samples 108
Preliminary study was conducted to make sure that the concrete samples were able to
attain the design strength. A special mix (Mix – P) was designed to attain a targeted compressive
strength of 10000 psi (69 MPa). These samples were tested for their compressive strength after
curing periods of 3-, 7-, 14-, and 28-days.
Initially three batches of concrete cylinders (Mix - 1, 2, and 3) were casted to study to
attain the compressive strengths of 6000 psi, 8000 psi, 12000 psi respectively. The purpose of
selecting this range of strength is to clearly understand the usage of UPV and RH equipment on
concrete members with different strength. UPV and RH tests were performed after a curing
periods of 7-, 14-, and 28- days and then crushed to measure the compressive strength.
Another batch of concrete cylinders of Mix -2 was casted especially to study the effect of
moisture content on results of UPV and RH tests. Detailed explanation of this study is given in
further sections of the report.

29
Finally there are 6 batches of concrete cylinders comprising of two batches from each
mix design (1, 2, and 3) were casted specifically to develop the correlations between UPV and
compressive strength, rebound numbers and compressive strength. This study primarily focuses
on developing a combined NDT correlation to estimate compressive strength.
4.3 Experimental Procedure
There are two different NDT methods and one destructive testing method used in this
research. The NDT methods include ultrasonic pulse velocity (UPV) testing and rebound
hammer (RH) testing. The compressive strength testing method is destructive method employed
in this research. All these three methods are explained this this section.
4.3.1 Ultrasonic Pulse Velocity (UPV) Testing
After the samples have been cured for a specific period, these samples were subjected to
UPV, RH and compressive strength tests in the respective order. All the samples were labeled
and measured for their length and weight. UPV test was performed using Proceq PUNDIT PL-
200 equipment (Figure 15) and following the ASTM C 597 [4] standard. The equipment consists
of following components
Display unit
Pair of 54 kHz Longitudinal
Transducers
Pair of 40 kHz Dry Point Contact
(DPC) Shear Wave Transducers
Calibration / Zeroing block
Zeroing Plate
Ultrasonic couplant gel
Connecting wires
Charging cables

30
Figure 15. Equipment for UPV testing
During the initial UPV tests performed on the concrete cylinders, there was lot of noise
observed in the displayed signal. After consulting a technician from Proceq, it was figured that
improper contact of transducer and test surface would show noises and may affect the measured
readings. It was observed that either sides of concrete cylinder are rough and causing poor
contact between transducer. To overcome this issue, both sides of the cylinder were cut by ¼
inch. Another challenge faced while performing the UPV test was to constrain the sample
movement. As the sample is cylindrical in shape it tends to roll when placed on table, to
overcome this a wooden sample holder was fabricated to constrain the rolling of cylinder, this
fixture has made the test to perform lot easier and smoother.
The samples were held in a sample holder and the couplant gel was applied on both the
transducers and pressed against the surfaces of the cylinder as illustrate in Figure 16. The length
of the samples was provided as input and the UPV values were measured and recorded for each
of the sample.
Display
unit
Transducer
Calibration
block
Connecting
wires
Couplant
gel
31
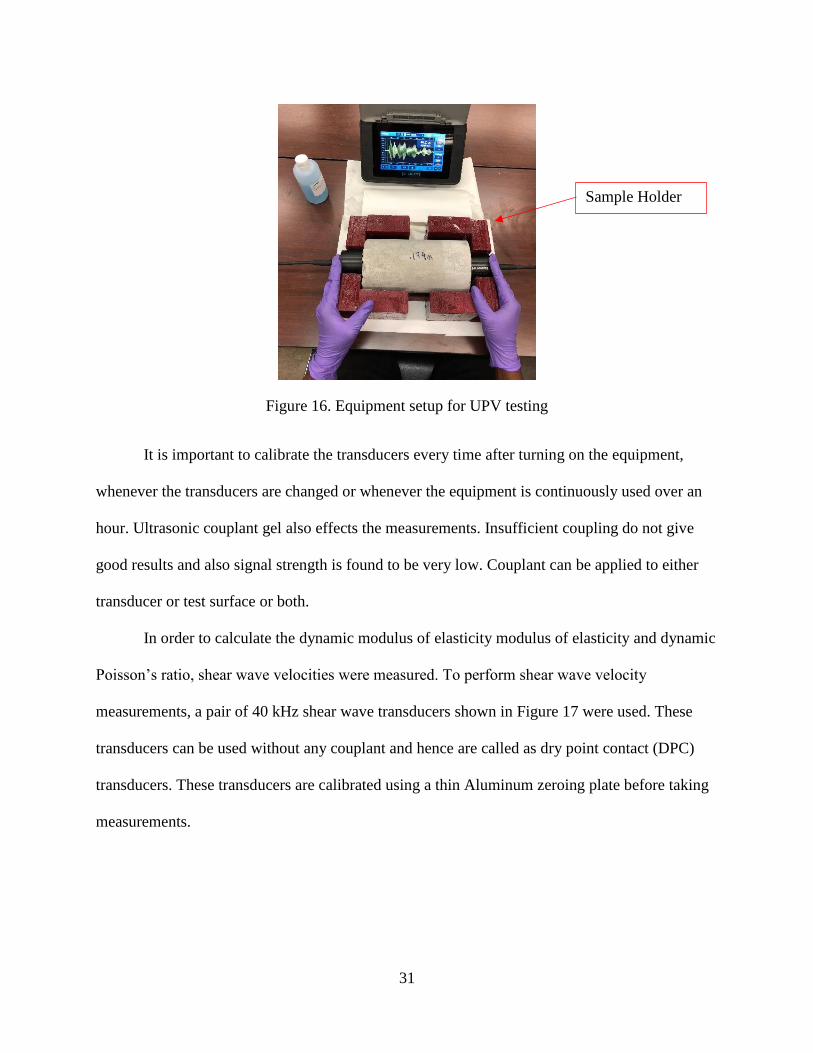
Figure 16. Equipment setup for UPV testing
It is important to calibrate the transducers every time after turning on the equipment,
whenever the transducers are changed or whenever the equipment is continuously used over an
hour. Ultrasonic couplant gel also effects the measurements. Insufficient coupling do not give
good results and also signal strength is found to be very low. Couplant can be applied to either
transducer or test surface or both.
In order to calculate the dynamic modulus of elasticity modulus of elasticity and dynamic
Poisson’s ratio, shear wave velocities were measured. To perform shear wave velocity
measurements, a pair of 40 kHz shear wave transducers shown in Figure 17 were used. These
transducers can be used without any couplant and hence are called as dry point contact (DPC)
transducers. These transducers are calibrated using a thin Aluminum zeroing plate before taking
measurements.
Sample Holder
32
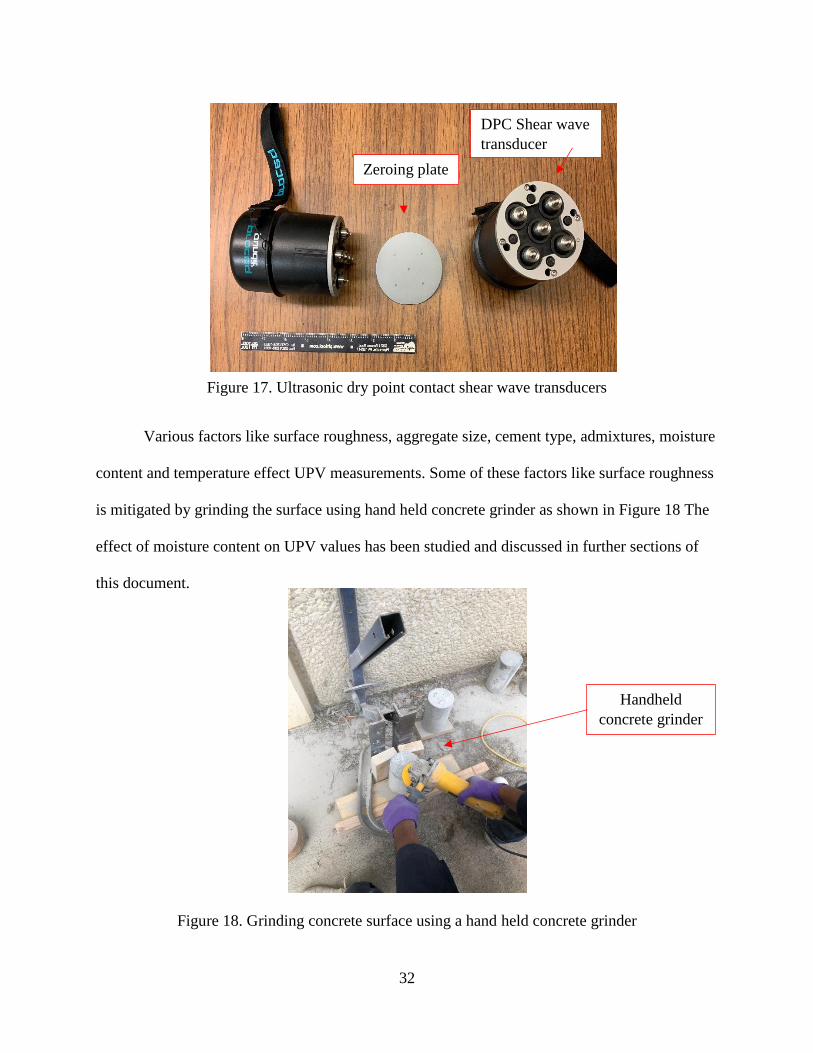
Figure 17. Ultrasonic dry point contact shear wave transducers
Various factors like surface roughness, aggregate size, cement type, admixtures, moisture
content and temperature effect UPV measurements. Some of these factors like surface roughness
is mitigated by grinding the surface using hand held concrete grinder as shown in Figure 18 The
effect of moisture content on UPV values has been studied and discussed in further sections of
this document.
Figure 18. Grinding concrete surface using a hand held concrete grinder
Zeroing plate
DPC Shear wave
transducer
Handheld
concrete grinder
33
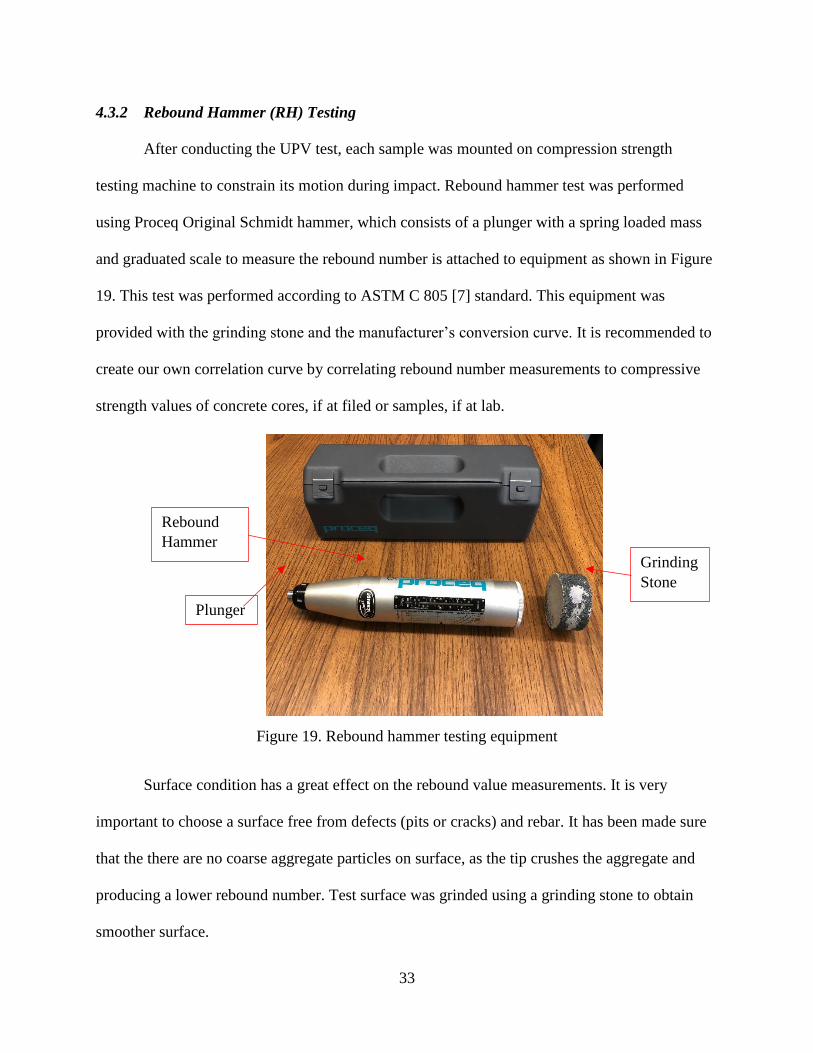
4.3.2 Rebound Hammer (RH) Testing
After conducting the UPV test, each sample was mounted on compression strength
testing machine to constrain its motion during impact. Rebound hammer test was performed
using Proceq Original Schmidt hammer, which consists of a plunger with a spring loaded mass
and graduated scale to measure the rebound number is attached to equipment as shown in Figure
19. This test was performed according to ASTM C 805 [7] standard. This equipment was
provided with the grinding stone and the manufacturer’s conversion curve. It is recommended to
create our own correlation curve by correlating rebound number measurements to compressive
strength values of concrete cores, if at filed or samples, if at lab.
Figure 19. Rebound hammer testing equipment
Surface condition has a great effect on the rebound value measurements. It is very
important to choose a surface free from defects (pits or cracks) and rebar. It has been made sure
that the there are no coarse aggregate particles on surface, as the tip crushes the aggregate and
producing a lower rebound number. Test surface was grinded using a grinding stone to obtain
smoother surface.
Rebound
Hammer
Plunger
Grinding
Stone

34
Rebound hammer was held perpendicular to the surface and plunger was unlocked by
giving gentle push as illustrated in Figure 20. Then the plunger is forced against the surface of
concrete specimen until the spring loaded mass hits the plunger and creates impact on the
concrete surface. Then the extent of rebound was measured using a scale graduated on the
equipment. The reading can be locked by pressing lock button on side of the equipment. Ten
readings were taken at different locations on the concrete cylinder and the average of these 10
values was considered to be the rebound number of that sample. No two readings were taken at
identical locations. The test locations on the sample that were selected were free from visible
pores and discontinuities. The rebound number for each samples was measured and recorded.
Figure 20. Rebound hammer test on concrete cylinder
4.3.3 Compressive Strength Test
After performing the RH tests, the sample was held in same position on compression
strength testing machine as shown in Figure 20. The load on the sample was subsequently

35
increased until the sample was crushed as shown in Figure 21. Then compressive strength results
were recorded for each of the concrete sample. The results obatined from this test are considered
as actual compressive strength of the concrete samples. These strength values are correlated with
UPV and RH test results to develop correlation curves by performing statistical analyses.
This test was performed acording to the ASTM C39 [9] standard. There is a clear
description about this test standard provided in the section 2.4.
Figure 21. Concrete cylinder crushed for compressive strength
4.4 Experimental study of effect of moisture content on UPV and RH measurements
A new batch of concrete with a targeted compressive strength of 8000 psi (Mix-2) was
prepared and nine samples were casted. The present study mainly focused to understand the
influence of moisture content on UPV measurements. These 9 samples were tested after a curing
period of 7-, 15-, and 28- days, with three samples at each period. The observations made from
preliminary tests on concrete samples show that the surface roughness effects the UPV

36
measurements. For this study, ends of all samples were cut by approximately ¼ inch to obtain
straight and smooth surface. Out of three samples, one of the samples were tested for UPV,
rebound number, and crushed for measuring compressive strength on the same day after taking
out from the immersion tank. Whereas the remaining two samples were placed in oven for quick
drying. Both the samples were taken out after 24 hours and allowed to cool down. Then UPV
and RH tests was performed on both the samples and one of these samples was crushed to find
compressive strength and another sample was placed back in oven for another 24 hours. The
same procedure was repeated on third sample after 24 hours of drying in oven.
4.5 Statistical Regression Analyses
In statistical modeling, regression is commonly used for predictive analysis. This analysis
is used to develop a relation between dependent and independent variables. For this particular
study, the main aim is to estimate/predict the compressive strength of concrete by fusing UPV
value and rebound number measurements. This regression analyses were also performed to
predict the compression strength values by correlating with UPV and rebound values
individually.
There are total of 54 samples casted based on three different concrete mixtures (Mix-1,
Mix-2, and Mix-3). Two batches of concrete for each type of mix were casted and each batch
consisted of 9 samples. These samples were tested for UPV, rebound numbers and compressive
strength values after the curing period of 28 days. After gathering all the results, multiple
regression analyses was performed to develop a combined NDT correlation. UPV and rebound
number values are considered to be independent variable and estimated compressive strength as
dependent variable to develop combined NDT correlation.

37
CHAPTER 5
RESULTS AND DISCUSSION
This chapter discusses the results obtained from the experimental tests mention in the
chapter 4. This chapter starts with results acquired from preliminary study and then moves to
periodic study of UPV, RH, and compressive strength tests. Later in this chapter, results from
study conducted on effect of moisture content on UPV and RH measurements are discussed and
this section is followed by discussions on combined correlation curve to estimate the
compressive strength of the concrete. Finally, this chapter is concluded by discussion on the
determination of dynamic properties of concrete and investigating the relation between static and
dynamic modulus of elasticity.
5.1 Preliminary Study
During the preliminary study, two batches of concrete mixes were prepared to achieve
high strength concrete. The targeted strength was 10000 psi (69 MPa). Compressive strength
tests were performed on these samples after different curing periods of 3, 7, 14, and 28 days. The
results from one of the batch are shown in Table 4. The results show that the design mix was
successful to attain targeted strength after a curing period of 28-days. Sample 4 and Sample 9
from that batch were not tested, so the average value of other two samples tested on same day
was assigned in the table below.

38
Table 4. Compressive strength results from preliminary tests
Targeted Strength
10000 psi
Compressive Strength (psi)
3-Day 7-Day 14-Day 28-Day
Sample 1 7559.9
Sample 2 9072.09
Sample 3 8753.78
Sample 4 Average 8912.935
Sample 5 8519
Sample 6 9156
Sample 7
10748
Sample 8 10509
Sample 9 Average 10628.5
5.2 Periodic study of UPV, RH, and compressive strength tests
Three different mixes of concrete samples were casted. These three mix designs were
made to achieve the compressive strengths of 6000 psi, 8000 psi and 12000 psi, respectively. The
purpose of selecting these range of compressive strengths is to clearly understand the usage of
equipment UPV and RH on concrete members with different strengths.
During this study, initially UPV values measured were very insignificant and signals
displayed were noisy and had many glitches. It was figured that the surface hardness has
impacted most of these uncertainties. So, the results achieved from initial results were
insignificant. Later in order to attain smoother and straight surface ends of the sample were cut
by ¼ inch.
Tests were performed in the order of UPV, RH and finally compressive strength tests.
The results obtained from three different mixes are shown in Table 5. Firstly, all the mixes were
successful in attaining the targeted strength. UPV values measured seemed to be increasing as

39
the strength of the sample is increased. UPV is greatly affected by density and high strength
concrete has higher density compared to lower strength concrete samples. Rebound hammer
results have also followed similar trend but the difference in rebound numbers measured for
lower strength and higher strength concrete was very high.
The best-fit line, given the three points measured for only the 28-day curing period (Figure 22),
has the equation
𝑓𝑐 = 7.701 𝑐𝐿 − 115,500 (5-1)
with fc representing the compressive strength in psi and 𝑐𝐿 the UPV in ft/s. The fit is quite good,
as indicated by the high coefficient of determination, R2 = 97.08%.
Table 5. Results from UPV and compressive strength measurements
Sample Curing Period
UPV Compressive Strength
Mix Strength (psi) (ft/s) (m/s) (psi) (MPa)
Mix 1
6000
7 days 15335 4674
6501 44.82 14 days 16193 4936
28 days 15807 4818
Mix 2
8000
7 days 15229 4642
8099 55.84 14 days 16468 5019
28 days 16114 4912
Mix 3
12000
7 days 14855 4528
11479 79.14 14 days 16363 4987
28 days 16457 5016

40
Figure 22. Compressive strength correlated with UPV
The difference between the UPV values measured on low strength and high strength
samples was less than anticipated. This could be due to several factors that are influencing UPV
measurements. Further study is focused on reducing the variables affecting the measurements.
As expected, the higher rebound numbers correlated to the higher compressive strength
measurements, indicating that higher compressive strength correlates to larger surface hardness.
The mixes listed here are the same as those shown in Table. 6.
Table 6. RH and Compressive Strength values for 28-day Cured Samples
Sample Rebound Number Compressive Strength
(psi) (MPa)
Mix 1 – 28 days 17 6501 44.82
Mix 2 – 28 days 21 8099 55.84
Mix 3 – 28 days 25 11479 79.14
The equation of the best-fit line is given in Eq. 5-2, relating rebound number to strength as
𝑓𝑐 = 622.3 𝑛 − 4374 (5-2)
41
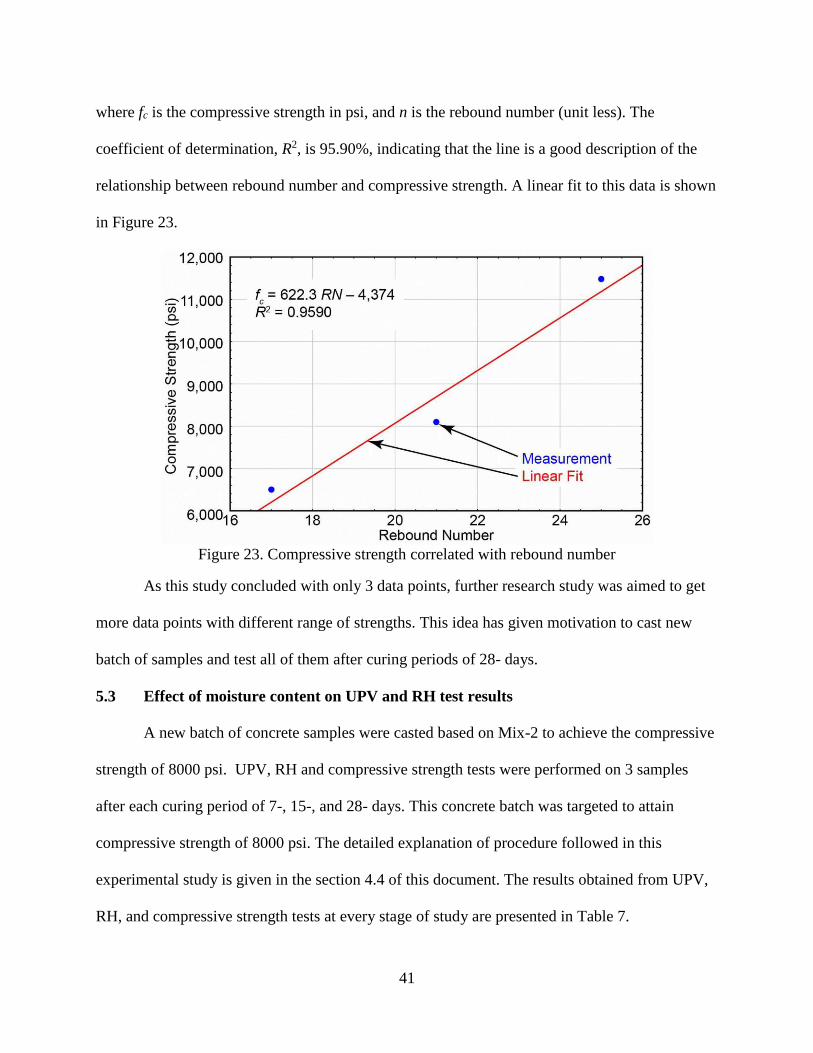
where fc is the compressive strength in psi, and n is the rebound number (unit less). The
coefficient of determination, R2, is 95.90%, indicating that the line is a good description of the
relationship between rebound number and compressive strength. A linear fit to this data is shown
in Figure 23.
Figure 23. Compressive strength correlated with rebound number
As this study concluded with only 3 data points, further research study was aimed to get
more data points with different range of strengths. This idea has given motivation to cast new
batch of samples and test all of them after curing periods of 28- days.
5.3 Effect of moisture content on UPV and RH test results
A new batch of concrete samples were casted based on Mix-2 to achieve the compressive
strength of 8000 psi. UPV, RH and compressive strength tests were performed on 3 samples
after each curing period of 7-, 15-, and 28- days. This concrete batch was targeted to attain
compressive strength of 8000 psi. The detailed explanation of procedure followed in this
experimental study is given in the section 4.4 of this document. The results obtained from UPV,
RH, and compressive strength tests at every stage of study are presented in Table 7.

42
Table 7. Results from every stage of study on effect of moisture content
Sample Drying
Condition UPV (m/s)
Rebound
Number
Compressive
Strength
(psi)
7- Day
Sample- 3 Surface dried 4907 18 6691
Sample- 2 Oven (24- hours) 4920 23 7135
Sample- 6 Oven (48- hours) 4933 24 7331
15- Day
Sample- 1 Surface dried 5029 20 7325
Sample- 5 Oven (24- hours) 5000 25 7246
Sample- 9 Oven (48- hours) 4947 25 7568
28- Day
Sample- 4 Surface dried 5069 21 8161
Sample- 7 Oven (24- hours) 4919 25 7762
Sample- 8 Oven (48- hours) 4912 28 7808
The results from 7, 15, and 28 day tests show that there is a significant effect of selected
drying procedure on the Rebound hammer measurements. It is observed from the results that the
moisture content in the sample leads to decrease in the rebound number. There was a slight
increase in the UPV measurements taken during 7- day tests. But the UPV measurements from
15 and 28 day tests have shown a decreasing trend when compared among the surface dried and
other two oven dried samples. Therefore, slight decrease in the UPV values have been observed
if the moisture content is reduced. The compressive strength results from 28-day tests show that
we have been successful in achieving the targeted strength of 8000 psi. The primary purpose of
this study was to determine the effect of moisture in the concrete samples on the UPV
measurements. The results do not show a conclusive relationship between the presence of
moisture and UPV. The change (increase) in the RH values and any change in the compression
strength may have been impacted by the drying temperature. Therefore, changes in the RH

43
values and compressive strengths are more reliable when the concrete samples are cured and
tested under the conventional conditions.
5.4 Combined NDT correlation curve
The experimental study has been conducted on 54 concrete cylinders with three different
range of compressive strengths. After a standard curing period of 28 days, UPV, RH, and
compressive strength tests were performed on all of the samples from different batches. The
compressive strength is presented by averaging the strength values obtained by 18 samples for
each type of mix (Table 8 summarizes compressive strength results). Our experimental results
indicated that Mix-1(6000 psi) had an average compressive strength of 43.5 MPa (6308 psi),
Mix-2 (8000 psi) had an average compressive strength of 61.2 MPa (8871 psi), and Mix-3
(12000 psi) had an average compressive strength of 75.4 MPa (10942 psi). The test results of
Mix-1 and Mix-2 have exceeded their targeted strength at 28 days. Mix-3, however, did not
reach the targeted strength of 83 MPa but stopped at 75.4 MPa.
Table 8. Summary of an average compressive strength of concrete cylinders
Mix Targeted Compressive Strength Average Compressive Strength Obtained
MPa psi psi MPa
Mix-1 41 6000 6308 43.5
Mix-2 55 8000 8871 61.2
Mix-3 83 12000 10942 75.4
UPV and RH tests were the nondestructive tests performed on concrete cylinders from
three different mixes. All these measurements were performed in accordance with relevant
standards - ASTM C597 [4] for UPV test and ASTM C805 [7] for RH test. The results obtained
from UPV, RH, and compressive strength tests performed on Mix-2 and d Mix-3 are summarized
in Table 9.

44
Longitudinal (p-wave) velocities of the concrete cylinders, across different mixes, were
measured during this study. The average values of UPV and rebound numbers measured for
samples of Mix-1 are 4919 m/s and 20 respectively. The UPV values obtained from all samples
of Mix-1 were higher than expected. The reason for this was found to be higher density of the
samples. As samples from Mix-1 have been targeted to achieve conventional strength. The UPV
values for conventional strength concrete are usually lesser than high strength concrete.
Statistical analysis performed to obtain the relation between UPV and compressive strength did
not show good fit when UPV values from Mix-1 are included. To obtain a better fit and relation
between UPV and compressive strength the Mix-1 values are not considered for analysis.
The average values of UPV measured from all samples of Mix-2 and Mix-3 were 4950
m/s and 4849 m/s respectively. The UPV values ranged from 4800 – 5000 m/s, for samples with
compressive strength ranging from 8000 – 12000 psi. The relatively high UPV values are due to
the higher densities in high strength concrete. The relationship between measured UPV values
and compressive strength, shown in Eq. (5-3), was obtained and illustrated in Figure 24. The R2
fit value, adjusted for degrees of freedom, was 68.3%, with errors up to ~10%.
𝑌1 = 87020 − 15.739 (𝑋1) (5-3)
where 𝑌1 is predicted compressive strength (psi) and 𝑋1 is longitudinal UPV (m/s).

45
Table 9. Experimental results from UPV, RH, and compressive strength tests
Mix (Design
Strength) Batch
UPV
(m/s)
Rebound
Number
Measured Compressive
Strength
psi MPa
Mix
-2 (
8000 p
si)
Bat
ch-1
4926 21 8667 59.8
4975 22 8538 58.9
4975 21 9150 63.1
4927 21 8740 60.3
4926 22 8768 60.5
4976 21 8283 57.1
4939 22 8585 59.2
4939 23 8958 61.8
4951 22 8811 60.7
4950 22 9256 63.8
Bat
ch-2
4927 22 9043 62.3
4951 22 9055 62.4
4903 21 8883 61.2
4988 22 9306 64.2
4951 21 8404 57.9
4988 23 9151 63.1
4975 23 9354 64.5
4939 23 8725 60.2
Mix
– 3
(12000 p
si) B
atch
-1
4819 28 10667 73.5
4902 26 10697 73.8
4831 28 11529 79.5
4819 27 11063 76.3
4879 28 11373 78.4
4832 28 11339 78.2
4821 26 11136 76.8
4832 26 10192 70.3
4843 27 10741 74.1
Bat
ch -
2
4879 27 10882 75.0
4831 27 10869 74.9
4832 26 10487 72.3
4819 29 11063 76.3
4878 28 11207 77.3
4832 27 10892 75.1
4854 27 10769 74.2
4867 28 10957 75.5
4903 28 11097 76.5

46
Figure 24. Relation between measured compressive strength and UPV values
The average values of rebound number measured from all samples of Mix-2 and Mix-3
were 22 and 27 respectively. The rebound number values ranged from 20 – 30, for samples with
compressive strength ranging from 8000 – 12000 psi. The relatively high rebound number values
are due to the higher surface hardness for high strength concrete samples. The relationship
between rebound numbers and measured compressive strength was obtained and illustrated in
Figure 25. The equation to predict the compressive strength from rebound number, shown in Eq.
(5-4), was found. The R2 fit value, adjusted for degrees of freedom, was 92.3%.
𝑌2 = 369.91 (𝑋2) + 812.81 (5-4)
where 𝑌2 is predicted compressive strength (psi) and 𝑋2 is measured rebound number.

47
Figure 25. Relation between measured compressive strength and rebound number
A correlation was developed by performing multiple regression analyses using
spreadsheet. A bi-linear equation was developed considering UPV and rebound numbers as
independent variables and estimated compressive strength as the dependent variable. A
nomogram (Figure 26) was developed by plotting the curves between rebound numbers and
estimated compressive strengths at different UPV values ranging from 4800 – 5000 m/s. The R2
value of the bivariate fit is 92.4%, better than the fit either UPV or RH alone and the fit errors are
~3%. A significant improvement was achieved by combining the UPV and RH values to
estimate the compressive strength, shown in Eq. (5-5).
𝑌 = 3.97 (𝑉) + 599.11 (𝑅) − 24565.65 (5-5)
where Y is the estimated compressive strength (psi), V is the longitudinal ultrasonic pulse
velocity measured (m/s), and is the rebound number (𝑅) measured.

48
Figure 26. Combined NDT Correlation curve to estimate compressive strength of concrete
Plotting this in 3D (Figure 27), it can be seen that while the strength is modeled as linear
in both UPV and RH, the variation with RH is much greater than that with UPV over the range
of measurements considered.
Figure 27. 3-D fit to predict compressive strength of concrete with UPV and rebound number

49
5.5 Determination of dynamic material properties
Shear wave velocities of the samples from all the batches from three mixes mentioned in
section 5.4 were measured using ultrasonic shear wave transducers. These shear wave velocities
and longitudinal velocities (section 5.4) were combined to calculate the dynamic modulus of
elasticity and dynamic Poisson’s ratio using the relations mentions in Eq. (2-4) and Eq. (2-6).
Density of the samples was calculating using the measure length and weight before testing. The
dynamic modulus of elasticity and dynamic Poisson’s ratio calculated for all the samples from
Mix-1 are shown in Table 5.7.
Table 10. Dynamic material properties of concrete samples from Mix-1
Mix Batch P-wave S-wave Density Dynamic - E
Dynamic-v (m/s) (m/s) (kg/m3) (GPa)
Mix
-1 (
6000 p
si) B
atch
-1
4963 2466 2377 38.6 0.34
4890 2451 2400 38.4 0.33
4975 2463 2407 39.1 0.34
4963 2454 2401 38.7 0.34
4866 2415 2354 36.7 0.34
4963 2440 2369 37.8 0.34
4843 2428 2354 37.0 0.33
4890 2451 2398 38.4 0.33
4963 2463 2416 39.2 0.34
Bat
ch-2
4987 2448 2403 38.6 0.34
4938 2451 2384 38.3 0.34
4988 2445 2395 38.4 0.34
4963 2503 2399 40.0 0.33
4866 2424 2395 37.6 0.33
4832 2457 2369 37.9 0.33
4902 2436 2363 37.5 0.34
4809 2445 2357 37.4 0.33
4938 2469 2402 39.1 0.33

50
5.6 Investigation of relation between dynamic and static modulus of elasticity
Concrete is a composite material with many different constituents in it. Concrete behaves
as an elastic material when stress is applied for short period of time, but the behavior of concrete
is complex when subjected to higher loads.
Modulus of elasticity is a used to calculate the deflection and strain of concrete for many
structural design applications. Modulus of elasticity is considered as the slope of stress strain
curve. It can also be referred as Young’s modulus but it is limited only to linear region of stress-
strain curve. A good amount of knowledge on stress-strain curve of concrete is required to
determine different modulus of elasticity of concrete. The stress-strain relations very from
different materials and is explained below.
The material is said to be pure elastic if the strain appears and disappears up on
application and removal of stress. Different materials exhibit different elastic behavior. Pure
elastic can be divided in to a) linear and elastic b) non-linear and elastic. Similarly non-elastic
materials also exhibit two different behaviors namely c) linear and non-elastic d) non-linear and
non-elastic [35]. These stress strain curves for above mentioned behaviors are illustrated in
Figure 28. The main difference in behavior between pure elastic and non-elastic materials is, the
loading and unloading curves coincide for pure elastic and non-elastic materials have different
loading and unloading curves. Concrete exhibits the non-linear and non-elastic behavior as
illustrated in Figure 28. (d).

51
Figure 28. Stress –strain relations a) Liner and elastic b) Linear and non-elastic
c) Non-linear and elastic d) Non-Linear and non-elastic
There are several methods to determine modulus of elasticity of concrete and are
explained using the Figure 29. The tangent to the loading stress-strain curve at zero near the
origin is called ‘initial tangent modulus of elasticity’. This initial tangent modulus (𝐸𝑡𝑜) is
approximately equal to ‘dynamic modulus of elasticity (𝐸𝑑)’. Where dynamic modulus of
elasticity is determined by vibrating the concrete specimen at high frequency (like UPV method).
Dynamic modulus of elasticity represents the pure elastic effects since there is only small amount
of stress applied and there is no micro-cracking [35].

52
Figure 29. Generalized stress-strain curve for concrete
The strain response after applying specific stress (𝜎𝑠) is given by the ‘secant modulus of
elasticity’ (𝐸𝑠) and this is also called as ‘static modulus of elasticity’. The stress and strain during
decreasing load or unloading is given by ‘unloading modulus’ (𝐸𝑢).
Static modulus of elasticity is determined by the loading and unloading the cylindrical
specimen of 150 × 300 mm cylinder/prism at a constant rate according to the respective
standards (like ASTM C 469 or BS 1881-121). Where dynamic modulus of elasticity is
determined by ASTM C215 [36] standard. According to this standard, the resonant frequency is
determined by subjecting the concrete specimen to high frequency longitudinal vibrations. These
vibrations are propagated through specimen by using an electromagnet exciter on one end and
pick up transducer at the other end. The sample is clamped at its midpoint as illustrated in Figure
30.

53
Figure 30. Measurement of dynamic modulus of elasticity a) Dynamic modulus test setup
b) Ultrasonic pulse velocity test setup
Resonance frequency of concrete specimen under testing is determined when the
amplitude reaches maximum. The frequency at this amplitude is considered as n (Hz), and length
of the specimen as L (m), density as ρ (kg/m3), and acceleration due to gravity as g (m/s2). Then
the dynamic modulus of elasticity(𝐸𝑢) is calculated by Eq. (5-6).
𝐸𝑑 = 4𝑛2𝐿2 𝜌
𝑔 (5-6)
This test apparatus is limited to laboratory purpose only, the dynamic modulus of
elasticity of concrete can also be determined by ultrasonic pulse velocity (UPV) method (refer
section 4.3.1) according to ASTM C 597 standard [4].
As the dynamic modulus is approximately equal to tangent modulus of elasticity (𝐸𝑑), it
is always greater than the secant or static modulus of elasticity (𝐸𝑐) due to the shape of stress-
strain curve [36] which is formed due to non-linear behavior of concrete. But the relation
54
between 𝐸𝑐 and 𝐸𝑑 is not always linear because many factors like age of concrete would increase
the strength which results in higher ratio of 𝐸𝑐and 𝐸𝑑. According the British standard, BS 8112-
2, the relation between 𝐸𝑐and 𝐸𝑑 is given as:
𝐸𝑐 = 1.25 𝐸𝑑 − 19 (5-7)
This relation shown in Eq. (5-7) is not applicable to concrete containing a cement content
of more than 500 kg/m3, in this case the relation was given as:
𝐸𝑐 = 1.04 𝐸𝑑 − 4.1 (5-8)
Several attempted to empirically correlate 𝐸𝑐and 𝐸𝑑 for concrete. Lydon and Balendran
[37] have proposed the relation as:
𝐸𝑐 = 0.83 𝐸𝑑 (5-9)
Popovics et al. [38] has conducted a study on range concrete cylinder and beam samples
along with the data matrix from over 200 high strength concrete samples. The samples were
tested with resonance frequency (vibration method) method and ultrasonic pulse velocity
(propagation method) method. This study aimed to obtain better understanding of dynamic
methods to determine 𝐸𝑑 and its relation with 𝐸𝑐. This research group has performed same tests
on cylinder and beam samples made of aluminum. The material properties of aluminum were
evaluated using the above mentioned ultrasonic and resonance frequency method. The
longitudinal vibration method has underestimated the actual value whereas transverse vibrations
has overestimated the value. Dynamic test methods performed on concrete specimens confirmed
that UPV method gives best prediction among other methods employed. Also, 𝐸𝑑is always
higher than 𝐸𝑐 because of the composite behavior, rather than the non-linear behavior of concrete
at various strain levels.

55
CHAPTER 6
CONCLUSIONS AND RECOMMENDATIONS
This chapter summarizes the findings from this research conducted on concrete samples
using two different nondestructive tests and a destructive test. The conclusions drawn from this
research and the recommendations for future works in this research field were provided.
The research was conducted to assess the material properties of concrete using
combination of two NDT methods. The fabrication of concrete specimens (4 × 8 inches) with
normal strength to high strength (6000 psi, 8000 psi, and 12000 psi) made the developed
correlations applicable to wide range concrete specimens. The preliminary fabrication of samples
has confirmed that the concrete design mix is successful to reach the targeted strength.
Initial testing on concrete samples at different curing periods was performed to
understand the testing methods clearly. It was found that the surface roughness and moisture
content of the concrete samples affect the measurements made from UPV and rebound hammer
tests. Effect of surface roughness was eliminated by cutting the samples by ¼ inch on both sides.
Later, instead of cutting the sample, the surfaces were grinded using the concrete grinder to
achieve smoother surface for maximum contact with transducer.
During this initial testing, regression analysis was performed on the results obtained from
UPV tests and RH tests on 3 samples after 28 days curing period. The individual correlations
between UPV, rebound numbers with compressive strength have shown better fits and these
results motivated to fabricate new batch of samples for further research.
Six new batches of concrete samples with three different mixes were casted and tested
after a curing period of 28 days. This study was conducted mainly to get more data points to
develop a correlation with better fit. Regression analysis was performed using the data from Mix

56
-2 and Mix -3 samples to predict the compressive strength from UPV and from rebound numbers
alone. The R2 fit values, adjusted for degrees of freedom, were 68.3% from UPV and 92.3%
from RH, with errors up to ~10%. Both the UPV and RH results were combined to perform
multiple regression analyses and a combined NDT correlation has been developed. This
combined NDT correlation showed the R2 value of the bivariate fit as 92.4% better than the fit
either UPV or RH. A nomogram was developed using this correlation which is more accurate
with only 3% errors.
Study conducted on a batch of samples with Mix-2 design. These samples were tested to
study the effect of moisture condition. The results have shown that there is significant change in
rebound numbers and the value increased as the moisture content is reduced. Whereas UPV
values did not show conclusive relation with presence of moisture condition.
The study was conducted to refer to other research papers to find the relationship between
dynamic modulus of concrete and static modulus of concrete. It is observed that dynamic
modulus of elasticity is always greater than static modus of elasticity due to the non-linear
behavior of concrete during stress-strain curves. A research conducted by a group of 3 people
concluded that it is composite nature of concrete rather than the non-linear behavior of concrete
at various strain deformations.
Recommendations for future work could be implementing UPV, RH and any other NDT
method to completely characterize the material properties of concrete. It is recommended to
make sure that the sample surface is smooth in order to eliminate errors in UPV measurements. It
is recommended to know the effect of other factors like age of concrete, aggregate size, and
admixture on any NDT measurements.

57
REFERENCES
[1] NDT Resource Center, “Introduction to Ultrasonic Testing,” Available from:
http://www.ndted.org/EducationResources/CommunityCollege/Ultrasonics/Physics/wave
propagation.htm
[2] www.olympusNDT.com. (2006). Ultrasonic Transducers Technical Notes. [online]
Available at: https://mbi-ctac.sites.medinfo.ufl.edu/files/2017/02/ultrasound-basics.pdf.
[3] Proceq. (2018). Pundit PL-200. Operating Instructions. Retrieved from
https://www.proceq.com/uploads/tx_proceqproductcms/import_data/files/Pundit%202_O
perating%20Instructions_English.pdf
[4] ASTM C597-16, Standard Test Method for Pulse Velocity Through Concrete, ASTM
International, West Conshohocken, PA, 2016, www.astm.org
[5] Building Code Requirements for Structural Concrete and Commentary, ACI 318-11,
American Concrete Institute, Farmington Hills, Michigan: 2011.
[6] M. Jedidi and A. Abroug, Expertise of reinforced concrete structures by non-destructive
methods. 2017.
[7] ASTM C805 / C805M-18, Standard Test Method for Rebound Number of Hardened
Concrete, ASTM International, West Conshohocken, PA, 2018, www.astm.org
[8] National Ready Mixed Concentrate Associating, 2003 , “Testing Compressive Strength
of concrete,”, from https://concretematerialscompany.com/media/files/CIPs/CIP35.pdf
[9] ASTM C39 / C39M-18, Standard Test Method for Compressive Strength of Cylindrical
Concrete Specimens, ASTM International, West Conshohocken, PA,
2018, www.astm.org
[10] Malhotra, V. M and Carino, N.J., CRC Handbook on Nondestructive Testing of Concrete.
2004.
[11] Malhotra, V.M., “Testing Hardened Concrete: Nondestructive Methods”, ACI
Monograph 9, American Concrete Institute, 1976.
[12] Bungey, J. H., “The validity of ultrasonic pulse velocity testing of in-place concrete for

58
strength,” NDT International, vol. 13, no. 6, pp. 296–300, Dec. 1980.
[13] Yaman, I., Inci, G., Yesiller, N., and Aktan, H.M., “Ultrasonic Pulse Velocity in Concrete
Using Direct and Indirect Transmission”, ACI Materials Journal, 98(6), pp. 450-457,
2001.
[14] Helal, J., Massoud, S., and Priyan, M., “Non-Destructive Testing of Concrete: A Review
of Methods”, Electronic Journal of Structural Engineering, 14(1), 2015
[15] Al-Nu’man, B.S., Bestoon, R. A., Sabr, A. A., and Sirwan, E. K., “Compressive Strength
Formula for Concrete using Ultrasonic Pulse Velocity”, International Journal of
Engineering Trends and Technology, vol. 1, Aug. 2015.
[16] Azreen, M.N., Pauzi, I.M., Nasharuddin, I., Haniza, M.M., Akasyah, J., Karsono, A.D.,
and Yen Lei, V., “Prediction of Concrete Compression Strength Using Ultrasonic Pulse
Velocity”, American Institute of Physics (2016).
[17] Mahure, N.V., Correlation between Pulse Velocity and Compressive Strength of
Concrete. 2018.
[18] Popovics, S. and John, S. P., “Effect of stresses on the ultrasonic pulse velocity in
concrete,” Materials and Structures, vol. 24, no. 1, pp. 15–23, Jan. 1991.
[19] J. Ongpeng, A. Oreta, and S. Hirose, “Characterization of Damage Using Ultrasonic
Testing on Different Types of Concrete,” Materials Evaluation, vol. 76. 2018.
[20] U. Lencis, A. Udris, and A. Korjakins, “Decrease of the Ultrasonic Pulse Velocity in
Concrete Caused by Reinforcement,” Journal of Materials Science and Engineering A1,
Vol.1, pp. 1016-1028.
[21] Young Hak Lee and Taekeun Oh, “The Measurement of P-, S-, and R-Wave Velocities to
Evaluate the Condition of Reinforced and Prestressed Concrete Slabs,” Advances in
Materials Science and Engineering, vol. 2016, Article ID 1548215, 14 pages, 2016.
[22] Mitchell, L.J. and Hoagland G.G., “Investigation of the Impact Tube Concrete Test
Hammer”, Bull. No.305, Highway Research Board, 1961.
[23] Aydın, F. and Mehmet, S., “Correlation between Schmidt Hammer and destructive
compressions testing for concretes in existing buildings”, vol. 5. 2010.

59
[24] Sanchez, K. and Nathaniel, T., “Reliability of Rebound Hammer Test in Concrete
Compressive Strength Estimation”, International journal of Advances in Agricultural &
Environmental Engineering (IJAAEE), 1(2), 2014.
[25] Kim, J., Chin-Yong, K., Yi, S., and Lee, Y., “Effect of carbonation on the rebound
number and compressive strength of concrete”, Cement and Concrete Composites, 31 (2),
pp. 139–144, 2009.
[26] M. P. bin Ismail et al., “Concrete density estimation by rebound hammer method,” AIP
Conference Proceedings, vol. 1704, no. 1, p. 040001, Jan. 2016.
[27] S. Hannachi and M.N. Guetteche, “ Review of the Rebound Hammer Method Estimating
Concrete Compressive Strength on Site,” in International Conference on Architecture
And Civil Engineering, Dubai, December 25-26, pp. 118-127, 2014.
[28] J.-C. Liu, M.-L. Sue, and C.-H. Kou, “Estimating the Strength of Concrete Using Surface
Rebound Value and Design Parameters of Concrete Material,” Tamkang Journal of
Science and Engineering, vol. 12, No. 1, pp. 1-7 (2009).
[29] Kesler, C.E. and Higuchi, Y., “Delamination of compressive strength of concrete by
using its sonic properties”, Proc. ASTM, 53, 1044, 1953.
[30] “In Situ Concrete Strength Estimation by Combined Non-destructive Methods”, RILEM
Committee TC 43 CND, 1983.
[31] O. Tsioulou, A. Lampropoulos, and S. Paschalis, “Combined Non-Destructive Testing
(NDT) method for the evaluation of the mechanical characteristics of Ultra High
Performance Fibre Reinforced Concrete (UHPFRC),” Construction and Building
Materials, vol. 131, pp. 66–77, Jan. 2017.
[32] Bzeni. D. and Ihsan, M., “Estimating Strength of SCC Using Non-Destructive Combined
Method,” in Third International Conference on Sustainable Construction Materials and
Technologies, Kyoto – Japan, August 18-21, 2013.
[33] Ş. Bingöl and A. Çavdar, “A New Nomogram Proposal to Determine Concrete
Compressive Strength by Combined Nondestructive Testing Methods,” Research in
Nondestructive Evaluation, vol. 29, no. 1, pp. 1–17, Jan. 2018.
60
[34] A. Jain, A. Kathuria, A. Kumar, Y. Verma, and K. Murari, “Combined Use of Non-
Destructive Tests for Assessment of Strength of Concrete in Structure,” Procedia
Engineering, vol. 54, pp. 241–251, Jan. 2013.
[35] J. J. Brooks, “4 - Elasticity of Concrete,” in Concrete and Masonry Movements, J. J.
Brooks, Ed. Butterworth-Heinemann, 2015, pp. 61–93.
[36] ASTM C215-14, Standard Test Method for Fundamental Transverse, Longitudinal,
and Torsional Resonant Frequencies of Concrete Specimens, ASTM International, West
Conshohocken, PA, 2014, www.astm.org
[37] Neville, A.M. (1997) Properties of Concrete 4th Ed. John Wiley & Sons Inc., New York.
[38] John S. Popovics, “CRC #43: A Study of Static and Dynamic Modulus of Elasticity Of
concrete,” CRC, Oct. 2008.

APPENDICES

61
APPENDIX A
UPV tests on samples of different shapes and sizes
A study was conducted to verify if the different shapes and sizes of the specimen affect
the ultrasonic pulse velocity measurements. In order to study this a new batch of concrete
samples with Mix-1 (6000 psi) was prepared. This batch of samples consisted of 4 different
samples with different shapes and sizes. Out of 4 samples, 2 concrete cylinders with dimensions
of 6 × 12 inches, one concrete cylinder with dimensions of 4 × 8 inches, and one beam samples
with L×W×D dimensions of 16×4.25×3 inches were casted. These samples are shown in Figure
31.
Figure 31. Concrete samples with different shapes and sizes
As all of these samples are casted from same mix of concrete, it is expected to show the same
UPV values if the shape and size has no effect on the measurements. All of the samples were
taken out of immersion tank after a 7-day curing period and then UPV test was performed.
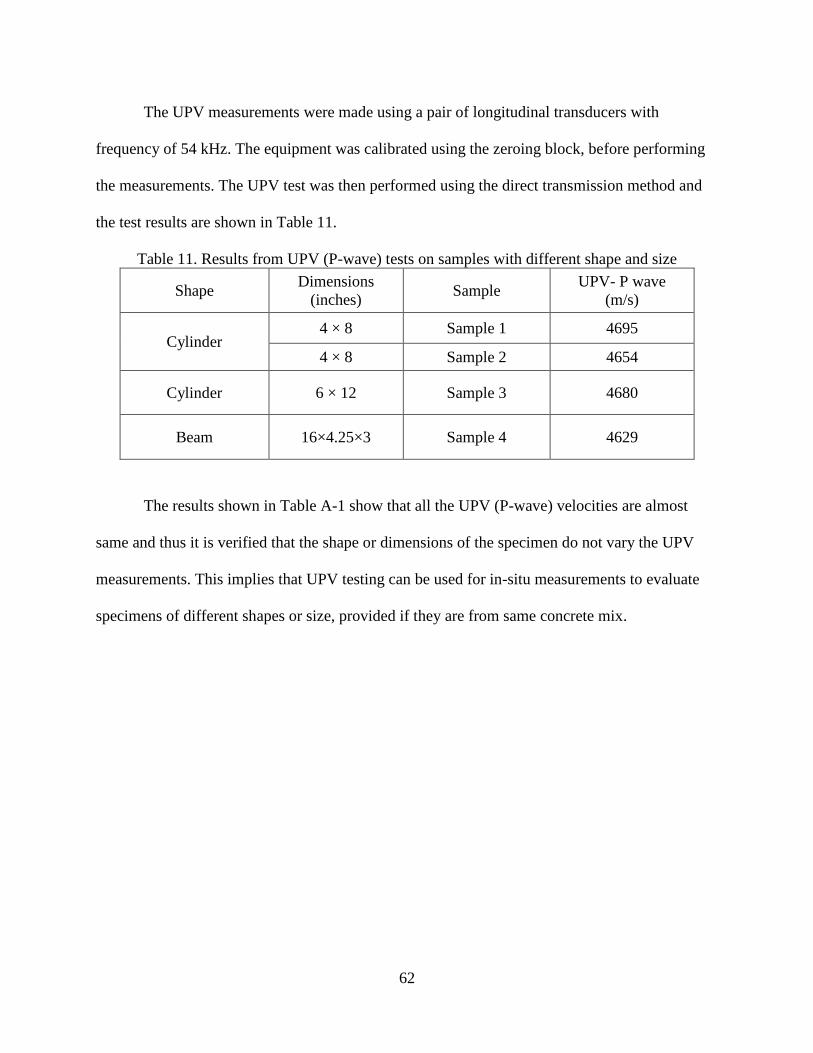
62
The UPV measurements were made using a pair of longitudinal transducers with
frequency of 54 kHz. The equipment was calibrated using the zeroing block, before performing
the measurements. The UPV test was then performed using the direct transmission method and
the test results are shown in Table 11.
Table 11. Results from UPV (P-wave) tests on samples with different shape and size
Shape Dimensions
(inches) Sample
UPV- P wave
(m/s)
Cylinder 4 × 8 Sample 1 4695
4 × 8 Sample 2 4654
Cylinder 6 × 12 Sample 3 4680
Beam 16×4.25×3 Sample 4 4629
The results shown in Table A-1 show that all the UPV (P-wave) velocities are almost
same and thus it is verified that the shape or dimensions of the specimen do not vary the UPV
measurements. This implies that UPV testing can be used for in-situ measurements to evaluate
specimens of different shapes or size, provided if they are from same concrete mix.

63
APPENDIX B
UPV P-wave and S-wave measurements using Proceq PUNDIT PL-200
P- wave and S-wave velocity measurements were made on samples from a batch of 6000
psi mix. Proceq PUNDIT – PL 200 equipment is capable of storing the results while performing
tests. These test results can be retrieved by connecting the equipment to computer. The following
Figures 31 and 32 shown are set of P-wave and S-wave measurements taken on samples (1 &2)
from batch-1 of 6000 psi.
Figure 32. P-wave velocity measurements on Sample (1 & 2) from batch-1 of 6000 psi

64
Figure 33. S-wave velocity measurements on Sample (1 & 2) from batch-1 of 6000 psi
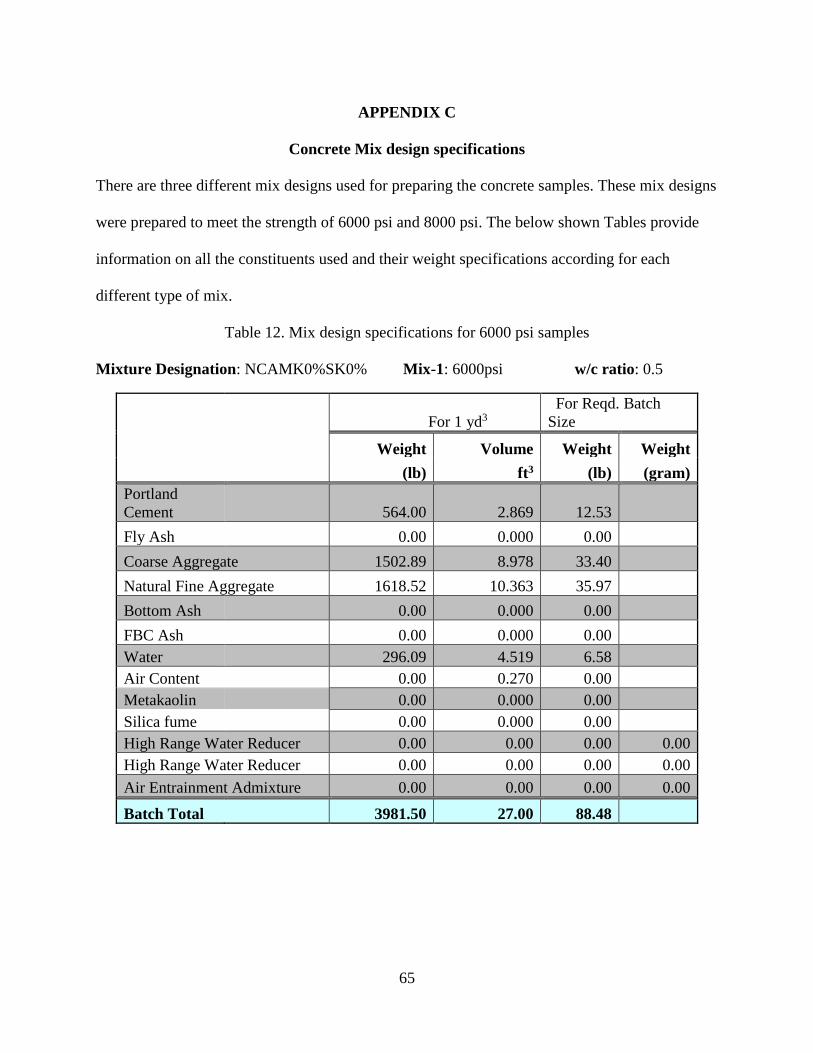
65
APPENDIX C
Concrete Mix design specifications
There are three different mix designs used for preparing the concrete samples. These mix designs
were prepared to meet the strength of 6000 psi and 8000 psi. The below shown Tables provide
information on all the constituents used and their weight specifications according for each
different type of mix.
Table 12. Mix design specifications for 6000 psi samples
Mixture Designation: NCAMK0%SK0% Mix-1: 6000psi w/c ratio: 0.5
For 1 yd3
For Reqd. Batch
Size
Weight Volume Weight Weight
(lb) ft3 (lb) (gram)
Portland
Cement 564.00 2.869 12.53
Fly Ash 0.00 0.000 0.00
Coarse Aggregate 1502.89 8.978 33.40
Natural Fine Aggregate 1618.52 10.363 35.97
Bottom Ash 0.00 0.000 0.00
FBC Ash 0.00 0.000 0.00
Water 296.09 4.519 6.58
Air Content 0.00 0.270 0.00
Metakaolin 0.00 0.000 0.00
Silica fume 0.00 0.000 0.00
High Range Water Reducer 0.00 0.00 0.00 0.00
High Range Water Reducer 0.00 0.00 0.00 0.00
Air Entrainment Admixture 0.00 0.00 0.00 0.00
Batch Total 3981.50 27.00 88.48

66
Table 13. Mix design specifications for 8000 psi samples
Mixture Designation: NCAMK0%SK5% Mix-2: 8000psi w/c ratio: 0.4
For 1 yd3
For Reqd. Batch
Size
Weight Volume Weight Weight
(lb) ft3 (lb) (gram)
Portland
Cement 724.38 3.685 16.10
Fly Ash 0.27 0.000 0.01
Coarse Aggregate 1502.89 8.978 33.40
Natural Fine Aggregate 1388.68 8.891 30.86
Bottom Ash 0.00 0.000 0.00
FBC Ash 0.00 0.000 0.00
Water 317.02 4.859 7.04
Air Content 0.00 0.270 0.00
Metakaolin 0.00 0.000 0.00
Silica fume 38.13 0.268 0.85
High Range Water Reducer 3.57 0.05 0.08 36.06
High Range Water Reducer 0.00 0.00 0.00 0.00
Air Entrainment Admixture 0.00 0.00 0.00 0.00
Batch Total 3933.24 27.00 87.41

67
VITA
Graduate School
Southern Illinois University
Abhishek Chitti
Sri Chandrasekharendra Saraswathi Viswa Mahavidyalaya University, Tamilnadu, India
Bachelor of Engineering, Mechanical Engineering, May 2016
Thesis Paper Title:
Assess Material Properties of Concrete Using Combined NDT Methods
Major Professor: Dr. Tsuchin Philip Chu