assembly operators and visualization - diva...
TRANSCRIPT

Assembly operators and visualization
of information’ contributions on
performance measurements.
PAPER WITHIN Production Systems, specialization Production
Development and Management
AUTHOR: Steve Jehu Batangouna
TUTOR: Professor Mats Winroth
JÖNKÖPING June 2016
Case Study at Dalvich Optic

I
This exam work has been carried out at the School of Engineering in Jönköping in the
subject area Production Systems, specialization Production Development and
Management. The work is a part of the Master of Science programme. The author
takes full responsibility for opinions, conclusions and findings presented.
Examiner: Doctor Hamid Jafari
Supervisor: Professor Mats Winroth
Scope: 30 credits (second cycle)
Date: June 2016

Abstract
II
Abstract
This study analyses the way information regarding performance measurements is
shared among employees working at the shop floor at Dalvich Optic in Sweden. This
study is conducted because many companies failed to implement a system that
facilitates daily performance measurements as they neglected the assembly operators’
role in decision making process. Companies focus on measuring wrong parameters
and visualize information about performance measurements in wrong way. The
purpose of this study is to demonstrate that new Information Technology (IT)
artefacts are designed by experts for use by experts. IT artefacts are designed without
taking into account assembly operators’ skills, education and experiences. Thus,
limiting assembly operators’ ability to achieve daily production goals. Therefore, this
study highlights the role of both assembly operators and visualizing information at
the shop floor and their impact on performance measurements and productivity.
After analysis, this study develops a new IT artefact. The implementation of the new
IT artefact at the company leads to a new leadership where management meet
assembly operators in a daily basis, creating good environment for direct
communication. As a result, the company increased its production by 50 percent
compared to the previous year and it has doubled the production compared to 2010.
The information about production status became visible and accessible to all
employees since the information displayed through the new IT artefact was
monitored in an easy-to- understand way. The presentation and visualization of
information regarding productivity offered assembly operators and managers the
possibility to react quickly when any disparity concerning goal achievement arose. As
a result, the new IT artefact enhances assembly operators’ participation at the
manufacturing process as well. Assembly operators took active role on manufacturing
process since information about performance measurement was compiled and
maintained by themselves; thus, positively influencing production outcomes.
Furthermore, a new IT artefact created an arena where employees contributed to
continuous improvements and problem-solving at work.
This study was conducted during a period of six months. Data was gathered through
observations, interviews, and meetings with managers and assembly operators at a
manufacturing plant. Furthermore, data from books, articles, and journals helped in
analysing the way information was visualized and communicated in a manufacturing
plant. ADR, Action Design Research method was used to design a new and simple IT
artefact that considers employees’ skills, experiences and education.
Keywords
ADR method, Artefacts, IT, and IS

III
Aknowledgements
I would like to thank all people that help me to write this thesis. I would like to thank
all assembly operators working at different industries all around the World. I would
like to thank Professor Mats Winroth at Chalmers University in Sweden for all
support I received from him and Professor Pascal Lissouba for inspiring me. I
dedicate this thesis to my childrens Christopher, Daniel, Victoria, Alex and Isac.
I dedicate this thesis also to all people working with any kind of deficiency, especially
those working at Samhall in Sweden. Through this study I wanted to highlight the
immense strengths you have. I dedicate this study also to all the refugees all around
the World.
In memory, Kally-Mavoungou Prisca!

Contents
IV
Contents
1 Introduction .............................................................................. 1
1.1 BACKGROUND ......................................................................................................................... 1
1.2 PROBLEM FORMULATION ......................................................................................................... 2
1.3 PURPOSE AND RESEARCH QUESTIONS....................................................................................... 4
1.4 DELIMITATIONS ....................................................................................................................... 4
1.5 OUTLINE .................................................................................................................................. 4
2 Theoretical background ........................................................... 6
2.1 INTRODUCTION ........................................................................................................................ 6
2.2 SHOP FLOOR ACTIVITIES .......................................................................................................... 7
2.3 PERFORMANCE MEASUREMENT................................................................................................ 8
2.4 DEVELOPMENT OF MEASUREMENT SYSTEM ........................................................................... 10
2.4.1 Securing management commitment ........................................................................ 10
2.4.2 Relating the strategy and internal goals to the process ........................................... 11
2.4.3 Selection and derivation of dimensions .................................................................... 11
2.4.4 Setting targets for measuring .................................................................................... 11
2.4.5 Implementation of the measurement system ........................................................... 11
2.5 GOAL ACHIEVEMENT ............................................................................................................. 12
2.6 VISUALIZATION OF INFORMATION ......................................................................................... 14
2.6.1 Data capture .............................................................................................................. 15
2.6.2 Compilation ............................................................................................................... 16
2.6.3 Presentation .............................................................................................................. 17
2.3.1 Communication ......................................................................................................... 18
2.6.5 Analysis ..................................................................................................................... 20
2.6.6 Action ......................................................................................................................... 21
3 Method and implementation ................................................. 23
3.1 RESEARCH PROCESS ............................................................................................................... 23
3.2 RESEARCH DESIGN ................................................................................................................. 23
3.3 ADR METHOD ........................................................................................................................ 24
3.3.1 Problem formulation ................................................................................................ 24
3.3.2 Building, intervention, and evaluation .................................................................... 24
3.3.3 Reflection and learning ............................................................................................. 25
3.3.4 Formalization of learning ......................................................................................... 25

Contents
V
3.4 MIXED METHODS ................................................................................................................... 25
3.5 DATA COLLECTION ................................................................................................................ 26
3.5.1 Observations .............................................................................................................. 26
3.5.2 Interviews .................................................................................................................. 27
3.6 RESEARCH QUALITY .............................................................................................................. 28
3.6.1 Validity ...................................................................................................................... 28
3.6.2 Reliability .................................................................................................................. 29
3.7 ETHIC ASPECT OF THE REPORT. .............................................................................................. 29
4 Findings .................................................................................... 30
4.1 THE COMPANY ....................................................................................................................... 30
4.2 SHOP FLOOR ACTIVITIES ........................................................................................................ 30
4.3 VISUALIZATION OF INFORMATION ......................................................................................... 32
4.4 PERFORMANCE MEASUREMENT.............................................................................................. 33
4.5 GOAL ACHIEVEMENT ............................................................................................................. 34
5 Analysis .................................................................................... 36
5.1 ANALYSIS MODEL .................................................................................................................. 36
5.2 SHOP FLOOR ACTIVITIES ........................................................................................................ 38
5.3 VISUALIZATION OF INFORMATION ......................................................................................... 39
5.4 PERFORMANCE MEASUREMENTS ............................................................................................ 40
5.5 GOAL ACHIEVEMENT ............................................................................................................. 41
6 Discussion ................................................................................ 42
6.1 DISCUSSION OF METHOD ........................................................................................................ 42
6.2 DISCUSSION OF FINDINGS ....................................................................................................... 43
6.2.1 Shop floor activities .................................................................................................. 43
6.2.2 Visualization of information ..................................................................................... 44
6.2.3 Performance measurements ..................................................................................... 44
6.2.4 Goal achievement ...................................................................................................... 45
7 Conclusions ............................................................................. 46
7.1 SUGGESTIONS ON FURTHERS STUDIES .................................................................................... 48
8 References ............................................................................... 50
8.1 APPENDICES ........................................................................................................................... 54

Introduction
1
1 Introduction
This chapter describes a background behind this research study. It also describes
previous research that has been done in the same field. The problem formulation
and the purpose of this thesis are highlighted at this chapter. The two research
questions that have been developed at this study are presented at this chapter as
well. This chapter ends up with the description of the report outlines.
The manufacturing plant constitutes of the following components: people, machines,
and the interaction between people and machines. People use machines and
procedures in order to perform different tasks. This is called the technical subsystem
by which shop floor is an essential place and where value-added activities are created
(Scherer, 2011). Visualization of information in real time creates conditions that allow
operators to understand the information in an easier way. But the level of operators’
skills and knowledge determines the way they will perceive, understand, and
translate the information that is visualized and monitored (Almström & Kinnander,
2007; Al-Najjar, 2006).
It is important for decision makers to have an idea about how information about
performance measurements can be visualized at the company so that assembly
operators can understand the purpose of displaying measurement performance (Dilla
et al., 2014; Pearlson & Saunders, 2010). Visual management, for that reason, aims to
communicate information as soon as and in a simple; and easy-to-understand way.
Furthermore, visual management creates a degree of transparency by which all
employees have access to the same information at the same time, at the same place,
in the same format, when is needed (Maskell & Kennedy, 2007).
Today’s work environment is more complex than it was before. As an example,
regarding information management, employees might filter everyday over 200 e-
mails, faxes, and voicemail messages. Therefore, managing knowledge about
information overload is considered as one of the challenges that should help people to
perform tasks in good ways (Dalkir, 2005). Assembly operators nowadays manage a
huge amount of information when they perform their daily tasks. Consequently, the
role of assembly operators has drastically changed at manufacturing processes, from
been passive to active actors. The implementation of the new culture at the plant
through the sharing of information, knowledge, and visualization of performance
measurement might contribute to enhancing the role of assembly operators in
decision making at the production plant (Kumar et al., 2012; Bruch & Karltun, 2009).
1.1 Background Disturbances that occur at the production processes are often caused by wrong
presentation of information. Disturbances on production processes can also occur
when right information has been sent to wrong people (Mattsson & Jonsson, 2011;
Pearlson & Saunders, 2010; Al-Najjar, 2006).

Introduction
2
Good visualization of accurate information instead contributes to enhancing
company performance by facilitating employees to understand the information that is
visualized (Dilla et al., 2014; Purchase & Moere, 2011). Visualization of information
and information sharing enables access to relevant information that constitutes a
foundation for decision-making (Goswami et. al., 2012). The introduction of the
performance measurement at the manufacturing plant aims to ensure a more open
and supportive culture that enhance learning and, cooperation among employees (Eti
et al., 2006). Performance management includes the performance methods,
measures, processes and systems that can be applied to an organization, subunit,
process, subsystem, or employee (Tangen, 2005).
The development of IT enhances the evaluation of performance managements and
ensures that goals are effectively accomplished on time (Kaplan & Norton, 2005;
Maskell & Kennedy, 2007). The increased need of Information Support System,
aiming to boost the production, has led to the fact that performance measurement
has become a key issue in industry. This fact is sustained by the idea stating that
factors such as: information, technique, activities and people have to interconnect
with each other’s (Kraemer et al., 2003; Dilla et al., 2010; Alter, 2008). Therefore, it
is important for a management to establish performance measurement and goal that
are SMART, Specific, Measurable, Acceptable, Realistic, and Time-based (Tonnquist,
2008).
1.2 Problem formulation Manufacturing of products is a complex and sociotechnical system which requires
many parameters in order to guarantee a smoother flow of material. Some necessary
parameters are characterized by: a good harmony between people working at the
plant, the well running and maintenance of machines that are used at the plant, and
the trustworthiness of the information that indicates the production status or the
performance measurement (Al-Najjar, 2006; Alter, 2008). Three main characteristic
problems are faced by people working on shop floor (Scherer, 2011): The short
temporal periods in which joint decision-making is to be achieved, the limited
degrees of freedom for changing original planning, and contradictory goals at the
production plant. These problems emerge at shop floor because assembly operators,
traditionally, almost only comply with to decisions that production management
makes (Bruch et al., 2008). Assembly operators have little possibility to influence
decisions coming from the management in some way. Hence, the raise of assembly
operators ‘authority is one of the factors that can help to improve the situation at
shop floor, and thus to provide solutions to the mentioned three problems (Bruch et
al., 2008).
Extensive research has been done regarding the way information about performance
measurement can be visualized in a good way at shop floor and the way Information
Systems can improve productivity at the manufacturing plant. It has been for
example demonstrated that the use of hand data, concerning maintenance issues,
increases the participation of assembly operators in decision making at the plant
(Kumar et al., 2012; Campos et al., 2009; Cannata et al., 2010).

Introduction
3
Other studies have been previously done in order to help companies to align their
performance measurement systems with their strategic goals (Hudson et al., 2001).
But, even if significant progresses have been observed when information about
performance measurements are visualized, significant efforts additionally need to be
done. Important inputs such as social factors and individual interests are ignored
when new artefacts are designed (Scherer, 2011).
Applications founded on modern IT artefacts that visualize information about
performance measurement are sophisticated and at the same time are designated for
the use of experts. Therefore, research in information visualization has principally
focused on solving functional requirements and place less importance on users as
assembly operators’ experiences (Purchase & Moere, 2011). There is the lack of
integration between the top level strategy and the operational level (Maskell &
Kennedy, 2007; Purchase & Moere, 2011). Many problems such as rush orders,
missing parts lists, backorder lists are still unsolved at shop floor. Consequently, until
today, shop floor is not yet under control. Furthermore, diverse characteristics of
shop floor as a sociotechnical system were not taken into account in previous studies
(Scherer, 2011).
Decisions on the companies are continually, unfortunately, been made based on
wrong measurements without taking into account all parameters at the production
shop floor (Magableh & Mason, 2003). There are few scientific studies that have
focused at the motivation, selection and implementation of performance
measurements. Consequently, people working at the manufacturing plant often
perform measurements and improvements without having an idea about what they
measure and why? Yet performance measurement and continuous improvement are
vital for companies’ competitiveness (Tangen, 2005). Following six main factors are
pointed as reasons that encourage the shift from traditional way of visualizing
information about performance measurement to a new one: wrong measurements,
wrong costs, wrong decision making, wrong presentation of information, complex
systems, and lack of focus to customer value (Brian et al, 2007). New performance
measurements, responding to these criticisms argue that traditional performance
measurement systems are financially driven and historically focused (Hudson et al.,
2001; Ljungberg & Larsson, 2012; Maskell & Kennedy, 2007).
The main contribution of this thesis is to develop a method which will enable decision
makers to make decisions based on accurate data in order to improve productivity
through accurate information. Furthermore, this thesis will enable possibility to
follow and evaluate the result of performance measurement after introducing the
method that visualizes information about performance measurements. The new
method will differ from the previous ones in the way information will be presented to
assembly operators and on the way the information, through visualization, will be
evaluated in short and long term. This point of view is based on the fact that a main
aspect of the effects of IT on the performance has not been taken into account so far
(Dutot et al., 2014).

Introduction
4
1.3 Purpose and research questions The purpose of this study is to design an IT artefact that will visualize information
about the performance measurement at shop floor. The main issue is to follow the
effect of visualization of goal achievement at the production plant. This study,
furthermore, investigates possibility for the IT artefact to increase assembly
operators’ motivation and engagement on the manufacturing process. The study will
therefore focus on answering the two following questions:
1. How can information on performance measurements be visualized on shop
floor in order to increase productivity at the plant?
2. How can visualization of information enhance assembly operators’
participation on decision making at shop floor?
The author will design an artefact where information about performance
measurement will be displayed in good manner at the right place and thus the result
of the implementation of this artefact will be evaluated after a period of six months
taking into account performance measurement and goal achievement as output. This
study will analyse the impact of visualizing information within production
department and its impact on the productivity. The research study will follow up the
variation of the production before and after implementing the artefact at the plant.
The research study will therefore cover the area of interaction between people,
technique and information in an industrial organization perspective.
1.4 Delimitations This study will only analyse the outcomes of the production’ processes in term of the
amount of the items that come out from the manufacturing process. These outcomes
will not be translated into economics terms where other issue such as profitability
could be highlighted. As this thesis is about production development, the economic
issue of productivity will not be taken in consideration.
1.5 Outline The report is structured through eight mains chapters.
1. Chapter 1 begins by giving the reader a broad perspective of both visualizing
information, and assembly operators’ role in industrial environments. This
chapter highlights some theories about previous studies concerning a design
of IT artefact, performance measurements, and about visualization of
information. This chapter develops, and formulates problems that are
founded in the area of performance measurements and visualization of
information.
2. In chapter 2 different theories that will help a reader to understand the
analysis chapter are presented.

Introduction
5
The theories developed in this chapter concern theories about different
activities that take place at the shop floor, theories about performance
measurements, and theories about different forms of information
visualization.
3. In chapter 3 the methodology used in this thesis is presented. At the same
time the chapter explains the way data were gathered. This chapter explains
the choice of the methodology used in this study in relation to the problem
formulation. In this chapter, aspects as validity, reliability and ethics are
taken into account.
4. In chapter 4 the information about the company is presented. Chapter 4
highlights different point of views based in interviews, data from meetings
and internal documents, and data coming from observations on the plant.
Chapter 4 describes how activities about performance measurements and
visualization of information carry out at the company.
5. In chapter 5, it has been compared and analyzed the way activities are carried
out at the company with different theories concerning both performance
achievement and visualization of performance. An analysis model is
developed in this chapter in order to facilitate a reader to understand the
connection between theories, methodology, empirical data, and analysis.
6. In chapter 6 it has been discussed the results coming from the analysis. This
chapter´s inputs considers different theories that are developed in chapter 2.
These choices are discussed in relation to the observations done at the
company where the study is conducted. In chapter 6 it has also been
discussed the reasons behind the choice of method on this report.
7. In chapter 7 the report is concluded by answering the two research questions,
taking into account theoretical background, the findings, the analysis and
discussions. Chapter 7 highlights in a concrete way the connection between
the two research questions and the reality at the industrial environment.
8. In chapter 8 different sources that were used as references are presented.
Chapter 8 emphasises journals, books, articles that are used are references in
this study.

Theoretical background
6
2 Theoretical background
This chapter defines and explains the importance of the information visualization at
the production plant where different performance measurements are performed.
This chapter guidelines the reader to understand how different theories are
developed and used in this thesis. This chapter facilitates the reader to understand
the connection between different areas that are discussed in the thesis.
2.1 Introduction Organizations are subject to prerequisites that require changes. The major changes
concern strategies and structures that organizations might implement in order to
adapt to new market conditions (Scherer, 2011). The greater parts of modern
industries are considerably affected by computerization in general, and thus
digitalization of information (Hitt & Brynjolfsson, 2000; Zhong & Zhou 2011; Chen,
2010). The biggest challenge in industry field since thirty years ago consists of
managing the huge amount of data and to manage the way data can be visualized on
the company. This assertion can be explained by stressing that, the management of
data has a connection with the way both operative and strategic decisions are made
on the company (Pearlson & Saunders, 2010; Kumar et al., 2012; Al-Najjar, 2006).
Companies face problem with the presentation of the data related to performance
measurement. A performance measurement system does not refer only to a number
of measurements and the way measurements are carried out; but it also refers to the
way data are collected, the way data are transformed to information, and the way the
results are gathered and monitored (Ljungberg & Larsson, 2012).
The long-established perception of performance measurement considers this activity
as the way of controlling employees instead of stimulating them. This means that
performance measurement is not regarded as an activity where employees can
exchange experiences and thus get new knowledge which in turn is a sustainable
competitive advantage (Ljungberg & Larsson, 2012). Knowledge is today considered
as other resources and thus need to be protected, cultivated and shared among
employees. This assertion confirms the fact that, organization is nowadays
considered as a socio-cultural entity where building a team- feeling becomes
important. Organizations that succeed on the market today are organizations that
make individual knowledge available to other employees (Dalkir, 2005).
Shop floor is a subsystem of the manufacturing where activities such as personal
management, maintenance and quality assurance take place. For that reason,
communication and information are key factors that facilitate integration and co-
operation among employees working at shop floor (Scherer, 2011). People need to
connect to others people working in the same environment; they need to connect to
an audience where they are accepted and where they feel free to express their
expectations. People reveal themselves through conversations reflecting their
personal agendas, personal style, and ability to receive credit and share blame
(Dalkir, 2005).

Theoretical background
7
2.2 Shop floor activities Shop floor is the part of the organization where employees perform different types of
activities. It requires knowledge and skills to perform these activities. For that reason,
knowledge creation always starts at the individual level. Many activities at shop floor
are performed through processes where more than one person works (Ljungberg &
Larsson, 2012). Therefore, process organization is connected to the team job
perspective; and where a team is defined as (Dalkir, 2005) “a special kind of group
that is characterized by its members work together, integrated, committed and
working to a well-defined common goal”. This definition highlights the fact that
shop floor is considered as the community of people where members participate to
discussions about manufacturing process and consequently help other members.
Thus, interactions among employees at shop floor create an identity which in turn,
depends profoundly on knowledge sharing (Dalkir, 2005).
Assembly operators working at shop floor nowadays face many challenges. The
increased use of automation at shop floor has changed the nature of the tasks that are
performed by assembly operators (Al-Najjar et al., 2010). The changes that occur at
shop floor enhance the idea about decentralization of authority and responsibility
from the management to shop floor through communication and collaboration
(Ljungberg & Larsson, 2012; Bruch et al., 2008). This approach of management is
different from the old one where data might be collected by the assembly operator
before to be sent to the management. After that data is analysed, management will
send it back in form of information or/and decisions to assembly operators
(Ljungberg & Larsson, 2012).
Shop floor activities are divided into two parts. On one side employees use machines
and other tools in order to fulfil their tasks. On the other side, employees use
computer systems in order to plan, monitor and control activities at shop floor. The
situation enhances the statement by which, the use of IT at shop floor has created the
triangle constituted by: employees, production facilities, and information support
system (Scherer, 2011). Managing a company by only using financial measurements
is comparable to a pilot who leads an aircraft by only having access to one instrument
(Ljungberg & Larsson, 2012). This means that manager at a company needs more
facts that visualize effort and results in order to analyse the company performance.
There are different ways to visualize effort and results that have been achieved at
companies. Performance measurement is for example one of the ways that indicates
how resources have been used at the company. Additionally, performances are
measured and visualized in order to monitor different process’ status at a real-time.
Therefore, performance measurement is considered as an umbrella term for all
concepts that display the goal accomplishment at a company (Tangen, 2005; Velcu &
Yigitbasioglu, 2012). The environment where the measurements are performed and
used has an influence on the credibility of the performance measurement. In order to
be effective in the process of decision making, it requires an effective information
system that provides the assembly operators with accurate information in good time
and at the right quantity.

Theoretical background
8
Information system is therefore considered as a trans-disciplinary field that puts
together technique, people and information (Kraemer et al., 2003; Alter, 2008). The
information provided by the information system smoothens the progress of the
decision making at the plant (Zhong & Zhou, 2011; Magableh & Mason, 2003).
The management at the plant where the measurement performance is implemented
might be aware of that the culture and climate at the company may either help or
hinder knowledge sharing. Organizations’ culture that encourages innovation will
help the organization to grow. An organization that rewards collective world
constructs a climate of trust; while a culture that is based on social status hinder
knowledge sharing (Dalkir, 2005). This means that, without an open knowledge-
sharing culture at the organisation, it is difficult to create an effective knowledge
exchanges (Dalkir, 2005; Eti et al., 2006). The climate of trust enhances the
knowledge flow and thus the exchange of experiences among employees. It
establishes grounds for expectations and enforces norms at the organization (Dalkir,
2005). Goal achievement and good performance have a connection with
organizations’ culture (Ljungberg & Larsson, 2012; Eti et al., 2006).
2.3 Performance measurement Performance measurement gets its essence in the proverb stating that, “what gets
measured gets done”. But at the same it is important to measure the right things in
correct manner (Ljungberg & Larsson, 2012). There are two main factors that
decision makers strive when performing measurement (Maskell & Kennedy, 2007):
creating conditions that promote goal accomplishment through an establishment of
clear performance expectations, removing obstacles to performance, and rewarding
performance; and establishing a culture of accountability where decision makers and
employees have a responsibility to meet common goals (Chopra & Meindl, 2010).
There are two main challenges that decision makers experienced when implementing
performance measurement. The first challenge is connected with the alignment of
goals through the organization. This means that, decision makers have to be
persuaded that, every employee at the company shall focus on the same goal. The
second challenge is connected with the visualization of performance and results at the
plant. It is important for decision makers to manage these two challenges if they
aspire to make performance measurement visible; and thus to make decision based
on trustful information (Chopra & Meindl, 2010; Chen, 2010). The top management
uses performance measurements when there is a need for introducing changes at the
company. If there is no measure, then it becomes difficult to improve (Ljungberg &
Larsson, 2012). The key principles for effective management of the performance
measurement development process are identified as (Hudson et al., 2001):
Top management support. Leadership plays a key function in knowledge
process, especially when knowledge needs to be created, captured and shared
(Krogh et al., 2011). Therefore, it is important for employees to have the
support for the management when they perform performance measurements
at the company.

Theoretical background
9
It is necessary to use measures that provide the foundation for the action that
should be taken. Performance measurements are indications showing top
management whether the company is moving in the right direction or not
(Ljungberg & Larsson, 2012). Hence, without measurement it is difficult to
know where you are, where you are going, what had been achieved and how
far it is, etc. The performance measurement has a tight connection with the
type of leadership that is applied at the company. Leadership is the motor that
enables employees to have a problem-solving mind-set which in turn,
generate innovative ideas. Furthermore, leadership creates condition for
sharing knowledge where employees exchange experiences, commitment,
engagement and motivation. These factors facilitate the goal achievement and
continuous learning at the company (Ljungberg & Larsson, 2012). Changes
are often perceived by employees as threats even when changes are necessary.
This situation can be explained by the fact that employees need to understand
in which way changes can affect their tasks (Krogh et al., 2011). Changes affect
employees individually according to their personalities. Therefore, it is capital
for management to take time to inform employees about the benefits they can
get through the changes; and thus the benefits for the whole organization
(Hudson et al., 2001). This situation creates the condition for communicating
goals and objectives; and thus having everybody on board (Tonnquist, 2008).
Everybody on board, and clear explicit objectives. Performance
measurement creates condition for employees to share the same goal. For that
reason, it affects human behaviour. Performance measurement highlights
what is important and what objectives employees might strive for.
Measurement not only reveals problems and opportunities (Ljungberg &
Larsson, 2012; Maskell & Kennedy, 2007). Measurement creates a familiar
language. Before something can be measured, it must be defined and
specified. Measurement therefore elucidates the connection between efforts
and results (Tonnquist, 2008). Performance measurement brings together
employees having different skills and experiences. The main advantage of
performance measurement is that it creates a team work. Thus, it enables
assembly operators to share knowledge and skills. New knowledge and
experiences create proactive skills that enable assembly operators to react
when the problem occur at the process (Ljungberg & Larsson, 2012).
Time framed project management. There are many changes that occur in
performance measurement field. It is important for the management to have a
clear vision of the future. Performance measurement is considered as a
foundation for continuous improvement, by which it is important to establish
a time frame (Ljungberg & Larsson, 2012; Tonnquist, 2008). The importance
of solving an explicit problem is determined not only by its degree of
rigorousness, but also by the regularity with which the problem happens.
Minor problems become harmful if they occur frequently (Ljungberg &
Larsson, 2012). Management might implement activities that enhance
solutions that help companies to remove minor problems at the process.

Theoretical background
10
These activities can be established as project based on a specific time frame.
When performance measurement is introduced as project, it is important to
be aware of that, new values and attitudes must be incorporated into existing
organization culture (Tonnquist, 2008). Changing the culture of a company
requires both action and patience. It is important for the management to
communicate the new vision. Moreover, employees have to understand the
benefits connected to the new way of working (Ljungberg & Larsson, 2012).
Performance measurement should derive from strategy; it might be clearly defined
with an explicit purpose. It shall be relevant and easy to maintain, simple to
understand and use; provide fast and accurate feedback; link operations to strategic
goals; and stimulate continuous improvement (Hudson et al., 2001). The
development of measurement system aims to visualize efforts that companies
accomplish. Hence, efforts are translated in term of strategic and operational goals’
achievement (Chopra & Meindl, 2010).
2.4 Development of measurement system Performance management translates goals and strategies into action by establishing
measurable goals, communicating those goals, monitoring goal accomplishment, and
providing feedback on performance (Chopra & Meindl, 2010; Dilla et al., 2014; Xian
et al., 2014). Hence, it is capital for a management to establish a measurement system
that reveals the efforts and results at the company. The measurement system might
take into account different factors such as management commitment, employees’
skills and the nature of measurements. Following steps are suggested to help to
develop a measurement system (Ljungberg & Larsson, 2012):
2.4.1 Securing management commitment Developing a measurement system is connected to creating a system that supports a
manufacturing process. For that reason, it is important for a management to specify
the strategy to adapt, the process to its customers and their demands (Ljungberg &
Larsson, 2012). Measuring sub-systems at the production environment enhances
excellent control of the processes. This statement is built upon the assertion stating
that companies’ measurements monitor strategy achievement (Maskell & Kennedy,
2007).
Knowledge exists in communities in the form of social capital. Knowledge enables
people to solve problems, to develop new capabilities, to improve work practices, and
to share what is new in the field (Hendriks & Vriens, 1999). Knowledge and skills are
foundations that enable the sharing of values and measurement principles
(Ljungberg & Larsson, 2012). Management should create an arena where employees
can discuss about values and measurement principles. Consequently, communication
is considered as a key factor when implementing measurement system. By creating a
team-sharing environment, management might create a group learning basis that
enhances innovation and knowledge integration (Dalkir, 2005; Eti et al., 2006).
Knowledge integration in operative environment means that, new knowledge is
introduced while the old one is retired. This means that employees acquire new skills
though teaching, knowledge sharing, social activities and meetings (Krogh et al.,
2011).

Theoretical background
11
2.4.2 Relating the strategy and internal goals to the process Well-designed measurement system provides the link between strategy and daily
operations. Since performance measurement activity is regarded as a social system
rather than a mechanical one, it involves changes in people’ behaviour and in their
understanding of how they contribute to goal achievement and customer satisfaction.
Therefore, measurement must be seen in a wider perspective and not just as a
method to record and process data (Ljungberg & Larsson, 2012). The development of
measurement system is strongly connected to the strategy and goals that drive
companies’ process. The success of the measurement system implementation
depends on the strategy that companies adopt. The strategy must be broken down so
that it can be linked to the processes (Ljungberg & Larsson, 2012). By breaking down
goals at different levels, the participation of all employees is enabled. It necessitates
cross-border cooperation between management and operation in order to reduce the
gap that often exists between strategy and operations (Tonnquist, 2008).
2.4.3 Selection and derivation of dimensions This step is the central part of the development of measurement systems. The aim of
this step is to create a document that ensures that measurements are performed in a
consistent manner. Information about data collection, compilation, presentation,
communication, analysis, and action must be identified and documented (Ljungberg
& Larsson, 2012). It is important for the document to provide information in three
dimensions: the source of information such as informal sources, personal contact,
subordinates, superiors, colleagues, customers; and companies associates; the
information itself and the information criteria based on accuracy, comprehensiveness
and timeless, reliability (Karim & Hussein, 2008).
2.4.4 Setting targets for measuring Probably, it might exist goals in the companies before developing new measurement
system. For that reason, it is capital to determine measures before to set objectives
(Ljungberg & Larsson, 2012). It is important to establish such target that enhances
motivation among employees. This means that management should set a target that
is achievable (Ljungberg & Larsson, 2012). The management needs quality
information when they make decisions that contribute to achieve companies’ goals
and objectives. Additionally, the quality of information enables managers to make
decision that improve services and productivity (Karim & Hussein, 2008; Detlor,
2010).
2.4.5 Implementation of the measurement system Implementing a measurement has to be performed in parallel with the other six
steps. A measuring system shall not be mandatory upon an organization. Its purpose
and background must be explained to other employees. Furthermore, the use of
measures should be developed in collaboration with the relevant users. These
elements contribute to the acceptation of the system by all stakeholders (Ljungberg &
Larsson, 2012). Collaboration among stakeholders along the Supply Chain aims to
boost efficiency and performance at the companies (Goswami et al., 2012).
The compilation, presentation, visualization and distribution of data among
employees at the company remain one of the most difficult tasks for decision makers.

Theoretical background
12
Many employees receive rather too little or an overload flow of data from decision
makers. This means that, companies should provide decision makers framework that
provide a balance of information when they communicate with other employees.
Complete, real-time and correct information help decision makers to establish
performances that need to be measured (Chopra & Meindl, 2010). A miss
measurement of performance is one of the principal reasons that impede to consider
productivity as benefit from IT investments (Sims & Hajli, 2015). To make a truthful
estimation of returns of IT investments it is necessary to make accurate
measurements of the inputs and outputs in the production processes of industries
(Kraemer et al., 2003; Hitt & Brynjolfsson, 2000).
Implementation of performance measurement becomes effective with the
decentralization of authority. Objectives and targets give a common orientation to the
employees (Scherer, 2011). Measurement facilitates delegation of tasks and
responsibilities from management to operations. Measurement facilitates to follow
up and set goals. For that reason, measurement is considered as central point to the
effective management (Ljungberg & Larsson, 2012). To achieve this challenge, it is
important for the management to implement a measure system that measures the
right things correctly. Management might establish values that will be measured and
subsequently the company should strive to achieve (Ljungberg & Larsson, 2012.
The form and functionality of an information support system depends on the work
and the people supported. One important challenge is to develop an information
system that simultaneously supports the use of existing knowledge and the creation
of new knowledge as in proactive work settings (Ljungberg & Larsson; 2012). The
system does not only consist of assembly operators and the machines, it also includes
the work domain. It is important to understand that, assembly operators and the
machines are integral parts of the work system (Bruch et al., 2008).
2.5 Goal achievement Setting goal at the companies implies the description of what is going to be achieved.
For that reason, goal is considered as a foundation on which is connected the decision
that determines if the project might start or not (Tonnquist, 2008). Hence, it is
important for the management to establish a goal which is: Specific, meaning that the
goal should be definitely clarified and distinctive for the project; Measurable,
meaning that the goal might offer possibility to answer by Yes or No if the goal has
been accomplished; Accepted, meaning that the goal might be implemented together
with the project group members and users; Realizable, meaning that the goal might
be realizable by using the offered resources; Timed, meaning that the goal might be
achieved at a specified time (Tonnquist, 2008). In order to achieve concrete goals,
companies break down strategic plan into operative plans (Ljungberg & Larsson,
2012).

Theoretical background
13
For that reason, goals are often considered as significant part of shop floor controls.
Different goals are founded at shop floor such as: capacity utilization, minimization
of lead time, minimization of inventory, and increase delivery reliability; but there are
also goal that is considered as part of the companies’ goals such as best quality
(Scherer, 2011).
Goals are achieved in different ways because there are factors that facilitate to
achieving them. One of those factors is IT, which is considered the key factor driving
economic growth in industrial societies (Sims & Hajli, 2015). The use of IT in
industry has revolutionized the nature of the company at the production plant level.
At the conventional organization there are only few people having access to
information concerning performance measurement. But, on the visual plant where IT
is being used, it becomes possible for everyone to get access to information regarding
the way the company is running and goal achievement (Ljungberg, 2000; Detlor,
2010). The visualization of information about goal achievement facilitates sharing
understanding at the plant while all employees are motivated to achieve common
goals (Chopra & Meindl, 2010; Dilla et al., 2014). Sharing understanding and goal
achievement facilitates engagement among employees by highlighting shared
responsibility (Osland et al., 2011).
Shared responsibility increases the possibility for the employees to take proactive
actions on the process (Al-Najjar et al., 2010). This step is the cornerstone when
companies strive to achieve both operative and strategic goal. For that reason, good
leadership is determinant in order to create a clear vision. The determination and
commitment of decision makers in visualization of information, as the result of visual
team, is the key issue that facilitates companies to prosper on the market because
goals and visions are established by executives and decision makers at the company
(Al-Najjar, 2006). For that reason, it is important for decision makers to adopt
appropriate management or leadership style that should boost productivity,
profitability and performance at the plant (Tangen, 2005; Bruch et al., 2008).
Assembly operators have to be part of the journey if decision makers want to succeed
to achieve desired goals. It is important for everybody at the plant to have a same goal
perception (Tonnquist, 2008). For that reason, it needs patience and tenacity on the
part of company’ leaders if they want to achieve improvements in the manufacturing
transformation processes (Maskell & Kennedy, 2007). It takes years of experiences
before people working on shop floor can come up with innovative ideas that can save
millions of dollars to the company. For that reason it is important for a company to
save knowledge and thus to make it available to other employees in an explicit and
easier way (Dalkir, 2005).
The use of IT in processes when performance measurements are performed creates
effective production, both on regarding products and services (Bradley, 2010).
Performance measurement produces huge amount of data. The information about
analysis and statistics is often visualized on tabular and spreadsheet. This
information is difficult to understand and interpret. For that reason, there is a great
demand for creating artefacts that can collect, visualize, and translate information in
an efficient and cost-effective way (Zeng & Zhang, 2013).

Theoretical background
14
This demand is justified on the fact that good and quality information enables good
decision-making, increases efficiency and permits organizations to obtain
competitive advantages (Karim & Hussein, 2008).
2.6 Visualization of information Single people cannot change an entire company even if individual heroes are created
by historians. It is necessary to create environment with employees having common
values. Hence companies need leaders having vision and strategies that enable
changes (Ljungberg & Larsson, 2012). Vision and strategy are habitually already in
the company. But, the biggest challenge is to develop and communicate both vision
and strategy in good way. The employees often do not know what are visions,
strategies and goals at different levels (Ljungberg & Larsson, 2012). Employees’
experiences, combined with the tangible data and knowledge stores at the companies
constitute the companies’ picture of memory (Dalkir, 2005).
The management of information embraces the assessment of information needs and
requirements within a company. Technical solutions within information management
are considered as important from the managerial point of views. But, the real
problem is based on involving people who manage and use information in their daily
tasks (Karim & Hussein, 2008; Detlor, 2010). As society goes through the age of
wisdom, data/information and knowledge become central resources that need to be
managed at a good way (Xian et al., 2014). The same situation is observed in
companies where hard competition has forced companies to restructure their
strategies concerning the way to manage information. Thus, it is capital to adjust the
choice of information’ channel to the purpose of information sharing (Ljungberg &
Larsson, 2012).
The assembly operator nowadays has to adapt to different production situation on
shop floor with his/her daily tasks. In order to achieve this goal, it is necessary for
decision makers to provide adequate information and framework that support
proactive behaviour in the right way and at the right time. The type and amount of
information enable the assembly operator to anticipate and plan changes that can
occur on the production schedule or in maintenance field (Bruch & Karltun, 2009;
Bruch et al., 2008). Therefore, it is important to visualize the information in a proper
manner. This situation enables the assembly operator should understand the value of
information and its impact in his or her daily tasks (Al-Najjar, 2010; Chen, 2010).
The management of information therefore strives to exploit the data, information and
knowledge in an efficient and effective way in companies in order to enhance
continuous improvements (Karim & Hussein, 2008).
One of the most important factors that enable employees to perform tasks in proper
manner and to make good decisions is the quality of information. The quality of
information refers to the degree to which the information convenes to the needs of
the organization (Goswami et al., 2012). Information is a critical factor to support a
proactive behaviour of assembly operators in complex work settings characterized by
flexible levels of automation and need for knowledge-based decision making (Bruch
et al., 2008).

Theoretical background
15
Therefore, it is important for assembly operators to have truthful and error-free
information. Additionally, it is important for assembly operator to have information
that is available and accessible in real time. It is essential that the same information
can be shared and interpreted by the different systems without major changes. It is
the management task to provide assembly operator complete, accurate and objective
data which can be used in the right context and which can be used effectively (Bruch
et al., 2008).
Previous information management systems focused on a small portion of a system,
such as a collection or records of data or simple communication between team
members. New knowledge management system instead, includes the entire activity
system through a focus on the human-use aspects which means people with shared
goals (Dalkir, 2005). The information support system used at shop floor aims to
make available information and knowledge that sustain different work activities. For
that reason, it is important to design information support system that enables
assembly operators to work in a more flexible way. The objective is to provide the
right information at the right time and in the right way (Bruch et al., 2008).
There are four main factors that characterize an information system (Bradley, 2010):
information, users, technology and activities around information. The effectiveness of
information system is connected with: the way different activities are carried out at
the company, the validity of the information, the type of artefact that is used to
visualize the information; and the skills and training that are offered to assembly
operators. It is obvious that, the most part of decisions that are taken at companies
both in strategic and operative level is the result of information management between
different people through the use of some artefacts (Pearlson & Saunders, 2010;
Mattsson & Jonsson, 2011). Both Information System and Physical System are
channels through which employees at the plant having similar interests, problems
and responsibilities can share knowledge and experiences (Dalkir, 2005; Scherer,
2011).
The organizational knowledge management architecture which combine data, user
and interface might include at least three levels: the data layer, which is a word that
is used across different types of data, with potentially diverse storage mechanisms
(e.g. database, text documents, video, audio); the process layer, which describes the
logic that connects the data with its use and its users (other people or other systems
who use the data); and the user interface, which affords access to the information
assets (Dalkir, 2005). The way information is created, acquired, organized, stored,
distributed, and used is determinant for the efficiency and effectiveness of
information accessibility, and the way the information will be used by employees
(Detlor, 2010). Knowledge and data can be presented in following ways: mechanical,
digital, visual and so forth (Hendriks & Vriens, 1999). The process that transforms
data to knowledge is summarized in following steps (Ljungberg & Larsson, 2012):
2.6.1 Data capture
Performances in companies are achieved in a good way when adequate information is
fulfilled (Dutot et al., 2014). Values for a particular variable that are measured at the
plant need to be captured in somehow. For that reason, it is important to register this

Theoretical background
16
data at the right time and at the right place. There are two ways to capture data:
automatically and/or manually (Ljungberg & Larsson, 2012). For example, on the
picture 1 the data about maintenance performance is register automatically. Thus,
assembly operators have possibility to get access to update information through
hand-data anywhere at any time. This means that the assembly operator, through IT
artefact should have access to; correct, real-time and complete information (Campos
et al., 2007).
Picture 1. Visualization of information within industry (Campos et al., 2009).
Picture 1 reveals the importance of capturing information at real time at the plant.
The information on picture 1 is visualized in a simple way. Visualization and
management of information, by excellence, is part of companies’ strategy that
develops performance measurements, collects and displays information in a simply
way, reveals a real state of company at the plant, avoids different wastes at the
processes, and provides an effective control over processes (Bradley, 2010; Campos et
al., 2009; Cannata et al., 2010; Dilla et al., 2010). It is easier, through visualization of
information, to visualize information that concerns the success of the company
strategy, and the way that everyone can understand this success (Ryding, 2010; Dilla
et al., 2014).
2.6.2 Compilation
After capturing data, it is important to compile and take care of them. This stage aims
to create a structure of the data that have been captured. The compilation can be
performed automatically by using simple and understandable formulas. Information
can be presented as percentage after compilation (Ljungberg & Larsson, 2012). Many
decisions are made in companies, after compilation by using artefacts called
Interactive Data Visualization (IDV). This artefact facilitates the visualization process
by allowing users to select both the information types and the types of formats when
making efficient and effective decisions. The use of IDV has amplified with the
increase used of computer-supported interactive visual representation of data in
order to intensify cognition (Dilla et al., 2014).

Theoretical background
17
By using IDV the information can be displayed as table as graphs, words,
cartographies and numbers like on picture 2
Picture 2. QlikView dashboard to display account receivable days trend (Zeng &
Zhang, 2013).
The information provided by picture 2 covers both performance measurements and
economic data. Presenting data by using graphs is more practical for tasks that
necessitate identification and understanding relationships in order to make
comparison (Dilla et al., 2010). Graphic presentations, as presented on picture 2 on
the other hand, are usually preferable when companies strive after a more general
commitment on analysis. A good image facilitates employees to understand the
information. Thus, the way the information is presented is vital for people working at
the plant (Ljungberg & Larsson, 2012). For example, the information presented to
operators should inform them about a reliable up to date picture of the situation but
also present future production demands (Bruch et al., 2008).
2.6.3 Presentation The development of IT on companies has facilitated to solve the problem related to
the information overload and the visualization of information (Velcu & Yigitbasioglu,
2012). Whether information is presented and interpreted as signals signs or symbols;
it relies on the context in which information is perceived and not only the form in
which information is presented. This means that, the very same object observed may
be interpreted as a signal, or symbol, depending on the intentions, expectations and
expertise of the operators (Bruch et al., 2008). Presenting information through IT
artefact to all employees implies sharing information.
Dashboard is used to communicate performance measurement as dashboard’s value
is linked to its features and its use on companies. This assertion is connected to the
fact that, a dashboard is considered as a data driven decision support system that
make available information in a particular format to the decision makers (Velcu &
Yigitbasioglu, 2012).

Theoretical background
18
The presentation of information as on picture 3, by using tables is suitable for tasks
that necessitate extracting specific values and necessary to an overall judgment. This
means that, tables are more used when data are presented in numerical ways, for
example into accountants and financial analysis. The environment where the
information is presented and the decision makers’ knowledge influence the format in
which the information should be visualized (Velcu & Yigitbasioglu, 2012; Dilla et al.,
2010).
Picture 3. QlikView dashboard to display account receivable day´s drill-down detail
(Zeng and Zang, 2013).
Visualizing performance measurement through the use of dashboard enhances the
culture of transparency and accountability on the environment where the information
is presented (Zeng & Zhang, 2013). The information as presented on picture 3
through the use of colour green and yellow could amplify the awareness if the goal
has been achieved or not. Thus the use of colour can also increase the cognition
between the user and the artefact; which is another form to communicate. There are
many benefits that companies can achieve by visualizing and sharing information.
Visualization of information highlights the synchronization of production, develop
forecasts, harmonize inventory decisions, and develop an ordinary understanding of
Supply Chain performance (Goswami et. al., 2012).
2.3.1 Communication Presenting information about performance measurement in a proper way is one
thing, but making this information available to the relevant audience is the other one
(Ljungberg & Larsson, 2012). It is preferable that the information connected to
production facilities takes place where activities are carried out (Scherer, 2011). It is
important to make information available to all employees at the right time, at the
right place and at the right quantity. At the same time, it is indispensable to secure
that right knowledge gets to the right place (Hendriks & Vriens, 1999). It is important
for manager to have communication skills which determine the ability to explain and
inform employees about information architecture (Karim & Hussein, 2008). The
information has to be communicated in the way that every stakeholder can
understand it without ambiguity (Ljungberg & Larsson, 2012).

Theoretical background
19
The communication according to picture 4 takes place on shop floor which is the
environment where assembly operators are familiar. Through information support
system according picture 4, meetings take place around the whiteboard, and
decisions could be made after discussions with different partners which include
assembly operators, line decision makers, production decision makers, maintenance
decision makers.
Picture 4. Typical Cell Measurement Board (Maskell & Kennedy, 2007).
Picture 4 is one channel which is used to spread information. Daily information in
picture 4 is handwritten and is updated regularly by employees who work at shop
floor. This situation illustrates that visual management and visual information
enhance the control of activities at the plant (Maskell & Kennedy, 2007).
Communicating information at shop floor emphasizes the transparency of the
decision making at the plant; which ensures that operations are performed under
control through a smooth continuous flow. It increases the level of information
precision.
Information support system enables meetings to be held at the location where the
work performs as picture 4 illustrates. At the same time, the information is compiled
and maintained by employees that use the measures (Almström & Kinnander, 2007;
Maskell & Kennedy, 2007). Communication is about to adjust the message to the
people where the information is presented. This means that the same information can
be communicated differently to different groups of people at the plant. As on picture
1, 2 and 3 information can be conveyed through graphs, pictures and tables.
Information can be spread in different channels (Ljungberg & Larsson, 2012).
Visualization of information according to picture 4 through the use of a simple visual
system enables managers to present information in a simple manner and at the same
time meets the employees around the white board where information is monitored.
Visual management and visual system make it easier for people to run their activities
in a simple way. Furthermore, visual management through picture 4 rapidly exposes
problems as they occur; thus offering possibility to correct and eliminate these
problems (Maskell & Kennedy, 2007).

Theoretical background
20
It is important for the management to communicate and to explain the reason why
the information is monitored. Management should take a sufficient time to
communicate the vision beyond the visualization of information regarding
performance measurement for example by repeating the same message several times
(Ljungberg & Larsson, 2012).
The main advantage with a high level of information precision is that, it makes it
easier for decision makers to provide customers driven high flexibility in the
production planning. Consequently, the high level of information precision facilitates
monitoring of performance measurement such as: the number of defects that are
founded on the products (quality), the rate of on-time delivery (customer
satisfaction), and day-by-the hour (continuous flow) (Maskell & Kennedy, 2007;
Goswami et. al., 2012). If workers on shop floor are responsible for tasks including
planning, control and execution of assembly, they need adequate information. Each
activity needs information, or collection of data (Bruch et al., 2008). Information
precision, for that reason, facilitates the analysis of the manufacturing process.
2.6.5 Analysis The culture of the organization plays an important role when data need to be
analysed. Performance measurement might be done in the way that permits
appropriate and intelligent analysis (Ljungberg & Larsson, 2012). For example,
operators who will obtain information about upcoming production demands will have
the time needed to collect more information, to think about the best alternative and
to choose the right method to assemble (Bruch et al., 2008). This situation is in
accordance with the definition of the data/information stating that, “the collection of
data, which, when represented in a particular manner at an appropriate time,
improves the knowledge of the person receiving it in such a way that he/she is better
able to undertake a particular activity or make a particular decision” (Bruch et al.,
2008).
The analysis of accurate data enables to analysis even performance measurements
and thus ensures that everyone in the organization share the same objectives (Zeng &
Zhang, 2013). Information support system through the use of IT enables
management, after analysis, to make decision based on real-time information which
in turn minimize the time of reaction when machines broke down, and thus need to
be repaired (Fjällström et al., 2009; Campos et al., 2009 ). Information support
system that enables analysis of information is connected to others areas such as:
informatics, computer science, logistics, accountants, human resources, leadership
and management, advocacy; and education (Campos et al., 2009; Kumar et al., 2012;
Bruch & Karltun, 2009; Chen, 2010; Cannata et al., 2010; Dilla et al., 2014; Purchase
& Moere, 2011; Xian et al., 2014; Maskell & Kennedy, 2007).
Data visualization contributes to helping all employees to make the same analysis of
the information at the plant. Visual dashboard monitors the progress towards the
performance objectives. It is also a well-organized communication and information
sharing tool to motivate additional improvement (Zeng & Zhang, 2013).
Consequently, it is a complete understanding of the value stream performance that

Theoretical background
21
enables decision makers to make good decisions, not a single measure. This means
that, decision makers should have a holistic situation at the plant before to make
decision (Maskell & Kennedy, 2007). Information support system as analysis tool
enables decision makers to monitor the root causes of actions that disturb the
manufacturing transformation processes; and at the same time, offers possibilities to
solve the problems as quick as possible in a simple manner. Visualization of
information, additionally, encourages the use of systems that facilitate people to run
the company at the easier way, and thus offers opportunities to eliminate different
wastes at the processes (Dilla et al., 2014).
Information support system is often frequently updated by assembly operators or
foreman. The main advantage with information support system is that, it gives
employees the chance to understand the way their products, services and processes
generate value for the customers, and especially the way information enables to drive
changes and improvements in the operation (Maskell & Kennedy, 2007; Bruch et al.,
2008). This statement highlights the dual roles that IT, through information system,
plays at the company. Firstly, IT aims to improve labour productivity; and secondly it
aims to coordinate actions at the company (Kraemer et al., 2003; Zhong & Zhou,
2011). The information that is communicated with high precision is the information
which is visually displayed at the location where the activities are carried out and
most often collected and updated by those using the measures (Pearlson & Saunders,
2010; Bergman & Klefsjö, 2010).
2.6.6 Action Lack of measurement indicates that the present performance does not lead efficiency
(Ljungberg & Larsson, 2012). The main purpose of measuring performances is not to
create charts and tables; but also to provide solutions and actions on the problems
that occur at he processes. Therefore, performance measurement establishes a
foundation for analysis and management and to take appropriate actions. Exhaustive
information about performance measurement is mentioned in a specific document.
Its purpose is to make sure that performance measurement takes place in a good
manner (Ljungberg & Larsson, 2012). At the assembly work where there is a need of
flexibility, the combination of the knowledge-based behaviour and information is
necessary (Bruch et al., 2008).
Visualizing information about performance measurement motivates assembly
operators to achieve goals at the plant through actions. Therefore, it is important for
assembly operators to understand what is measured and why the company performs
measurement on performances (Kumar et al., 2012; Bruch & Karltun, 2009). This
situation furthermore allows assembly operators to make appropriate actions.
Information in table 1 reveals the performance measurement every week at the plant.
The information management can be measured though the way people behave when
they perform tasks that involve the use and access to information (Karim & Hussein,
2008; Detlor, 2010).

Theoretical background
22
Table 1 can be considered as the situation where assembly operators and the
management get knowledge about goal achievement at the plant through the
visualization of information. The use of colours aims to create some reaction when
the goal has been achieved or not.
Table 1. Monitoring of the performance measurement at the production plant
Monday Tuesday Wednesday Thursday Friday Total
Goal 400 400 400 400 400 2000
Week 1 420 380 410 400 405 2015
Week 2 380 420 350 410 405 1965
Week 3 410 390 350 350 350 1850
Week 4 400 420 410 400 405 2035
The reason is that information about financial reports is complicated and use
unknowable accounting method that are unclear to most people (Maskell & Kennedy,
2007). Therefore the information on table 1 aims to present information about
performance measurement at the middle of shop floor as on picture 4 where all
employees can have access to the information; but also can understand this
information in an easier way. The use of colour on table 1 is inspired from picture 3.
Few people do not understand information about financial reports even if they exploit
this information to make decisions. It is important for managers to perform
measurement at the plant by considering the system approach which include people,
information and the environment where activities are carried out. This consideration
furthermore enables employees to make accurate decisions (Dalkir, 2005). This point
of view is sustained by the idea by which the information influences the way assembly
operator performs their tasks. For that reason, it is capital to take into consideration
the point of view from assembly operator when designing artefacts aiming to collect,
evaluate, organize, and distribute information (Ljungberg & Larsson, 2012).
The information should be organized in such a way that the assembly operators have
access to relevant information at the required time (Bruch et al., 2008). The nature of
work duties is constantly changing at the companies due to the increased
digitalization of information. Generating information about performance
measurement in a good way at the plant enables decision makers and assembly
operators to make excellent decisions. This situation confirms the statement
highlighting that, performance measurements facilitate the continuous improvement
of the processes (Dilla et al., 2014). Information managers’ tasks comprise the
identification of repeated activities within the company, the requirement of feedbacks
on information provided and the monitoring of changes that occur (Karim & Hussein,
2008). Without an entire understanding of the value stream performance managers
cannot make good decisions (Maskell & Kennedy, 2007).

Method and implementation
23
3 Method and implementation
This chapter explains to the reader how the research will be planned, how the
research strategy will be designed and how data will be collected. The validity and
reliability of the research questions will be highlighted on the chapter as well.
A method is defined as a tool which aims to help, to explain and solve a specific
problem in a well-defined context. The use of method in scientific and social areas
enables the searcher to come up with a new knowledge that can be considered as an
innovation (Holme & Solvang, 1997). The accuracy of a method is determined by
fulfilling the following criteria: matching the reality with the behaviour, collecting
and selecting information in a systematic way, presenting results in a sustainable way
that allows verification and validation of the results; and emphasizing further
research through the new knowledge (Holme & Solvang, 1997).
This report is based on a case study where data were collected through the company
internal document about goal achievement. Other data come from meeting reports
between the company and its customer, and also internal meeting.
3.1 Research process This thesis was conducted within the period of six months. A Gantt chart schedule
with different deadlines is designed in order to facilitate the reader different activities
as table 2 shows. The table 2 explains different activities from the initial planning to
the conclusion.
Table 2. Research Process
January February March April May
Initial planning
Literature review
Observations on the plant
Problem formulation
Design of artefact
Design of theoretical framework
Analysis and Discussions
Conclusions
3.2 Research design Research design in case study aims to connect the data collected during the visit on
the site to the research questions that have been addressed on the earlier stage on the
report. For that reason, research design is also considered as a logical sequence of
activities that help a reader to follow and understand the way research was conducted
before to draw conclusions (Yin, 2002).

Method and implementation
24
Case studies enable researchers to investigate a single unit or phenomenon by
gathering detailed information through diverse types of data collection actions during
a certain time period. The researcher on the case study has a possibility to ask
questions to a participant at the same time as observations are done (Creswell, 2009).
Through case studies researcher has possibility to focus his or her attention to
important and interesting behaviour that can be related to the study (Creswell, 2009;
Yin, 2002). There is a new research method connected to case study and called ADR.
This method aims to design an artefact (DR) and evaluate it (AR) in order to solve a
specific problem in a given context (Lindgren et al., 2011).
3.3 ADR method A design of artefact (DR) and its evaluation (AR) play a key role when the ADR is
chosen as research method (Lindgren et al., 2011). DR, design research, seeks to
create innovative artefacts, taking into account the context and the problem founded
at the organization. The outcome of this action is to identify and solve problems that
are founded at the organization. ADR method is build on followings stages (Lindgren
et al., 2011):
3.3.1 Problem formulation The ADR method begins with the problem formulation in which the input come from
divers sources such as: end-users, practitioners, the researchers, existing
technologies, and/or review of prior research. Furthermore, the problem formulation
emphasizes six tasks (Lindgren et al., 2011): identify and conceptualize the research
opportunity, formulate initial research questions, cast the problem as an instance of a
class of problems, identify contributing theoretical bases and prior technology
advances, secure long-term organizational commitment, set up roles and
responsibilities.
The problem formulation on this thesis emerged from several factors at Dalvich Optic
such as:
Observing the way assembly operators at had access to information
concerning the goal achievement at the production department.
Observing the way this information was presented, processed and stored at
the plant.
Observing the way operators were performing their daily tasks.
The author took active part at the company where he was working at the managerial
level. He has been working as assembly operator for eight years ago at different
companies before writing this thesis.
3.3.2 Building, intervention, and evaluation The first stage of ADR method creates a platform for creating the initial design of
artefacts, which in turn creates foundations for the second stage. Building,
intervention and evaluation as second stage in ADR emphasizes four main tasks
(Lindgren et al., 2011): discovering initial knowledge-creation target, selecting or
customize building, intervention and evaluation form, executing building,
intervention and evaluation cycle, and assessing need for additional cycles.

Method and implementation
25
The purpose of new artefacts is to meet the organizations’ requirements taking into
account: the solution context, people, and technology (March & Storey, 2008).
Different observations mentioned above constituted the inputs that facilitate the
conception of the new type of IT artefact concerning the presentation of the daily goal
and performance measurement. IT artefact has never been used at the plant before in
order to visualize information.
3.3.3 Reflection and learning The reflection and learning stage seeks to create conditions that highlight ideas that
contribute to one step ahead. This means that, reflection and learning stage does not
only deal with the design of the solution, but it also deals with the problems that the
new artefact might deal with. Reflection and learning emphasize three main tasks
(Lindgren et al., 2011): reflect on the design and redesign during the project, evaluate
adherence to principles, and analyse intervention results according stated goals. The
principles of the new IT artefact that shall visualize and monitor information at shop
floor at Dalvich Optic might be elaborated by taking into account the skill level and
knowledge of assembly operators.
3.3.4 Formalization of learning Formalization of learning aims to formalize the learning by which five main tasks are
identified (Lindgren et al., 2011): abstract the learning into concepts for a class of
field problems, share outcomes and assessment with practitioners, articulate
outcomes as design principles, articulate learning in light of theories selected, and
formalize results for dissemination.
The type of the two research questions as presented previously required the
exploration of the literatures and several visits at the plant before drawing
conclusion. Hence, the results and conclusions at this thesis were based on the
analysis and interpretations of observations made at the plant. It was only after
reading literatures, doing observations on the site, and analysing the results of the
observations that it was possible to draw conclusions, not the opposite. The analysis
at this report concerns also the comparison of data about goal achievement before
and after the implementation of the new artefact at the plant. This justifies even the
choice of ADR method in this case study.
The author had a leading position at the plant before writing this thesis. This means
that he could facilitate the implementation of the management of information at the
plant. But, at the same time he kept neutral on this study.
3.4 Mixed methods Collection and analysis of data is one of the most important steps when researchers
conduct case studies. That is why, in order to achieve this objective, qualitative and /
or quantitative approach, or a combination of both methods used in the research
world. The reason that researchers choose to apply mixed methods based on the fact
that the combination of both qualitative and quantitative method gives a clear picture
of the research problem than the one based on using only one of the two methods

Method and implementation
26
(Creswell & Clark, 2007). This assessment is reinforced on the basis of an analysis
stating that, quantitative methods are basically dominated by the use of numbers or
surveys. This approach was first implemented in science to study paranormal
experiences; while qualitative methods on the other hand, are more oriented towards
social sciences such as psychology, where qualitative data sources are based more on
interviews, observations, questionnaires and the researchers' approach to the
environment in which the study is conducted (Myers & Avison, 2002).
Mixed method has been used as method approach at this thesis due to following
reasons. Firstly as qualitative approach, interviews and observations have been used
on this study in order to collect data. Secondly numbers coming from reports
regarding productivity and goal achievement have been used on this report as
quantitative approach. Both qualitative and quantitative approaches are used on this
report as inputs for analysis. The choice of mixed method on this study is justified by
the fact that mixing qualitative and quantitative provide a lot of benefits. The author’s
pre-knowledge may have biased the results, but at the same time, he has behaved as
neutral as possible in the observations, interviews and analysis.
3.5 Data collection There are six main ways to collect data that help to conduct research related to case
studies: documentation, archival records, interviews, direct observation,
participation-observation, and physical artefacts. These six sources of information
can be regarded as sources of evidence which provide several advantages on the case
study process strategy (Yin, 2002).
In order to collect data on this thesis, several observations have been done at the
plant. At the same time, opportunities were offered to explore internal document
from the company. During the preparation phase, many literature reviews located on
different database on following universities: Jönköping University, Göteborg
University, Linnaeus University, and Mid Sweden University were explored.
3.5.1 Observations The observations that are performed on case studies constitute the heart of the
research process in this type of studies. The process starts when researcher firstly
spawns and selects ideas that will be further classified as answerable questions. The
decision of designing the way those questions can be answered in the step that comes
after the classification phase (Graziano & Raulin, 2010). The understanding of
observations during the visit on the company depends strongly on the way the
research pays attention to the activities that are carried out on the environment. After
observation, it is important for the researcher to: analyse, interpret and communicate
data that have been collected (Graziano & Raulin, 2010).
The main purpose with doing observations is to find out different parameters or
information that will further be explained as objective and complete as possible
regarding the environment that will be used in the empirical findings (Eliasson,
2010). For that reason, one of the main roles for the researcher is to determine and
understand the relation between the causes that creates some effects by performing
objective investigations (Björklund & Paulsson, 2008).

Method and implementation
27
The author has acted as active observer as he works at the department were
observations took place. Hence, he had possibilities to directly act on the tasks that
were performed on the company. Thus, he was not just limited to observe how
operators were performing their daily tasks, but he had too possibility to encourage
employees to achieve the operational and daily goal at the production. During
observations, he had a possibility to ask some other questions that was not prepared
in advance in other to strength his observations.
All the questions asked during semi-structured interviews were open and registered
on the block note by the author. He took pictures describing activities related to
production schedules and goal achievements at the plant.
3.5.2 Interviews The main reason why the researcher conducted interviews is to find out the ideas,
opinions or point of views that other persons have regarding the topic that has been
studied. For that reason, it is important for the interviewer to create a trustful and
confident climate with the interviewed in order to have more chance to get relevant
data (Merriam, 1988). Interview is considered as the main important source of data
when doing case study (Yin 2002). In order to achieve this challenge, it is strongly
recommended to prepare in good time the questions that will be examined during the
interview. The good structure of the questions before the interview aims to help the
interviewer to organize his or her interview or order to maintain the focus on the
topic in good way (Eliasson, 2010). One of the most important points regarding the
ethic before to conduct interviews consists on obtaining the approval of the person
who is going to be interviewed (Björklund & Paulsson, 2008).
In total four interviews were carried out by the author of this thesis: one with the
production manager, one with the technician, one with the foreman, and one with
one of assembly operators. The majority of the questions asked during interviews
cover different areas such as: performance measurement, management, quality, work
method, data collection, goal achievement and performance visualization (Almström
& Kinnander 2007). All interviews that have been carried out in the thesis obtained
the permission from the interviewed persons. Having two persons from each side
having different points of view from different perspectives from both management
and shop floor was considered as a positive issue for the analysis perspective. These
interviews were conducted according following plan:
1. One interview was performed with the production manager where were
eighteen questions covering areas such as: management, goal achievement,
goal measurement, work standardization, quality management, knowledge
and competence were addressed. The interview occurred during around two
hours.
2. One interview was performed with technician where twelve questions
concerning main areas as: quality management, error management,
visualization of information, goal measurement regarding quality issues,
measurement deviation about quality issue were addressed. The interview
with the technician occurred during an hour.

Method and implementation
28
3. One interview with one assembly operator was performed where ten
questions covering: goal presentation, information access, work description,
continuous improvements, communication between management and shop
floor were addressed. The interview with the assembly operator covered fewer
questions than the one with the technician and production manager because
the operator deals with issues at operative level while the technician and
production manager deals with strategic questions. The interview with the
operator occurred during an hour.
4. One interview was performed with a foreman where ten questions were
addressed during around an hour. The interview covers the same issues than
the ones with the operator.
All the questions that were stressed during the interviews were elaborated in relation
to the conception and design of the new IT artefact through ADR model. The choice
of ADR as model was justified due to the fact that, the model has been developed
primarily for analysing various data from the social work where people's opinions
play an important role in the work. In this model, it is important to establish a
constructive dialogue between the interviewer and the respondent. The method is
appropriate for this study because it has previously been used in sociology and IT
where the main issue was to design an artefact that enables the visualization of
information to a particular group of people.
3.6 Research quality
3.6.1 Validity The searcher achieves high validity on the case study by offering later searchers
possibility to have the same findings and conclusions if the same study is carried out
several times. There are three ways of defining validity: construct validity, internal
validity and external validity. Those three approaches can be explained by stating that
(Yin, 2002):
In order to achieve high degree of construct validity, the searcher has to
achieve two main goals that consist on; choosing the explicit types of changes
that are going to be studied and later on demonstrating that the chosen
process can reproduce the same types of selected changes.
Internal validity aims to demonstrate the connection between causes and
effects. This means that it helps a searcher to associate previous events to the
present one by using data collected trough documents and interviews during
the case study.
External validity aims to demonstrate the way findings from a case study can
be globalized. This means that the searcher can use the results of a current
situation to generalize them to other situations on other contexts.
The findings on this report come from an industrial environment where both the
visualization of information and performance measurements are common and can be
applied at any plant depending on the management ability to follow goal
achievements and thus encourage employees to achieve them. The same type of

Method and implementation
29
information support system was implemented at one more company and gives the
same result two months after the introduction of the same type of IT artefact.
3.6.2 Reliability A thesis can be considered as reliable only if it provides possibility to check a
reliability of its results. This means that the searcher has to be able to come out with
results that other persons might have possibilities to confirm the reliability on them
(Creswell & Clark, 2007). For that reason, it is important for the researcher to provide
other people reading the thesis, possibility to confirm the authenticity of the data
used in the thesis, because high reliability creates the conditions for high validity for
the thesis (Eliasson, 2010; Yin 2002).
The author will be able to present all the materials that were used in this study in
order to prove the reliability of this thesis. Information about productivity during a
period of five years can be provided. Furthermore, many pictures and reports
regarding monitoring of goal achievement and production’ status can be provided.
Notes concerning interviews with personal working at Dalvich Optic can be provided
as well.
3.7 Ethic aspect of the report. In order to provide a high value of validity to its report, the author has to be as
neutral as possible. This means that the author should not remove factors that are
against his or her point of view. At the same time, it is not allowed for the author to
privilege the facts in his or her advantages. For that reason, it is very important to
analyses facts from different sources such as interviews or enquires (Eriksson &
Wiedersheim-Paul, 1999). The author has to be honest and loyal to the company that
has accepted to be part of the research study (Björklund & Paulsson, 2008; Eliasson,
2010).
The author has got the permission to perform this study at the company.
Furthermore, he has got permission to publish some information and pictures
regarding the company without damaging the image of the company. He has kept
some information confidential and has therefore changed the name of the company
and the nature of technical information.

Findings
30
4 Findings
This chapter describes the environment where data were collected. Its gives a
reader an idea about activities that took place at the department that was used as
case study. In this chapter the role of the production management staff, the line
management staff and the operator on the manufacturing processes were
described.
4.1 The company This research study took place at the company called Dalvich Optic. The company
manufactures optic fibre in North of Sweden where 45 people work at the plant,
performing several activities. The company has previously been producing different
types of material since several decades ago, but the management decided to focus
only on the manufacturing of optic fibre. The production of optic fibre had decreased
due to the hard competition on the market, especially from Asia. Consequently, the
price of optic fibre has decreased on the world market. There are more actors on the
market both in Sweden and abroad. This situation leads to the fact that the
concurrence becomes harder. This situation implies that the requirements regarding
effectiveness, productivity and profitability have increased on the way to manufacture
fibre optic according to the production manager.
4.2 Shop floor activities There are different activities that take place at shop floor. The foreman has a main
responsibility to help his team to work efficiently. He has been working at the
company for about thirty years. Furthermore, he has worked at all the stations at the
manufacturing plant. Both the foreman and the assembly operator state that they
have possibility to influence their daily tasks. The assembly operator comments that
employees perform tasks in a flexible way due to the fact that they rotate all the time.
According to her a level of knowledge and skills for all assembly operators depend on
how long the assembly operator has been working at the plant. This means that the
more the assembly operator works, the more the assembly operator gets experience.
She adds that assembly operators learn by doing. This means, that it can take time
before the assembly operator can manage all the tasks. In order to perform tasks in
good way, the assembly operator stresses that assembly operators have books and
instructions that they can read in case they do not understand. The production
manager on this issue points that the assembly operator working at the next station
has the knowledge and skills required to identify and fix the error that may be
occurred at the previous station. The production manager argues that the company
has a policy stating that all assembly operators should rotate and learn tasks that are
performed at different stations. This situation aims to increase the flexibility at the
manufacturing process; and more important, increase the team feeling at the plant.
The assembly operator points that she and other assembly operators have a good
communication with both the foreman and the management. She argues that the
management staffs walks through shop floor all the time. This situation offers
assembly operators possibility to ask questions if something does not look clear. She,
Findings
31
as others operators, has a possibility to ask team met if they do not understand the
schema on how to assemble the new product for example. This situation was even
commented by the production manager who he states that the management wants to
create a learning environment where employees can grow as a human and in his/her
daily tasks. For that reason, employees share knowledge at all level at the plant. For
example, the production manager has learned the way to assembly all type of
products at shop floor.
The production manager states that he decided to introduce a fifteen-minutes
meeting with foreman and management staff every day at the plant where
information is monitored and updated daily as picture 5 shows. At those meetings
they discuss about the status of the production taking into account aspects such as
personal and material. The foreman argues that the goal is measured, analysed and
commented every day. He is the one who written the goal on the whiteboard. The
whiteboard is located on the middle of the production plan where everyone can see
this data as it is illustrated at picture 5.
Picture 5.The place where the daily meeting takes place at shop floor.
Concerning the visualization of the information at the middle of production the
foreman states that it is a good idea. He adds that employees at shop floor have now
the opportunity to see if they have achieved the goal or not. The foreman points that
employees become more motivate and engaged when they can see the outputs of the
production; compare to the previous situation where he did not have the information
about the production status.
The assembly operator, during the interview, refers to the situation where the
production manager has been cleaning at shop floor together with other employees.
This situation confirms the statement by which according to the assembly operator,
employees at the plant mainly communicate through face-to-face.
Findings
32
The assembly operator reveals during the interview that the production manager has
been working at shop floor as the assembly operator for many years. Thus, he knows
how it feels to work at the shop floor. Even the technician too has started his career at
the shop floor. Additionally, the assembly operator stresses that the management is
always at shop floor and ask if assembly operators have any question. Furthermore,
the assembly operator argues that she has possibility to go to the management office
and ask questions depending on the situation. This situation makes employees to feel
that they work together as a team and a family.
The visualization of information at the plant does not concern only the goal
achievement, but it concerns even the quality deviation on the items that are
produced at the plant. Concerning this issue, the technician during the interview
reveals that the company has newly decided to register all data about the quality
deviation that occur at all stations at the manufacturing process. The data is analysed
in order to respond to the problems or deviations founded during the manufacturing
process. This information is mentioned at the agenda during the production meeting
that takes place every Monday. The technician adds that the data concerning quality
deviations is presented in s statistical way regarding the number of rework activities.
This information is analysed and commented by the technician every Monday during
the production meeting. This information is also included on the agenda when the
company has a meeting with its costumer.
According to the technician information about quality deviation is firstly written by
hand at a special document by assembly operators at shop floor. The technician
provides the document to the assembly operators and the foreman. Furthermore, he
registers the data in the system and presents this information by using Excel
program. The technician adds that the assembly operators are informed about the
deviations and are welcomed to contribute with new ideas and suggestions. The
technician points that the error founded at one station cannot pass through the
second one. Even the production manager confirms this statement by stressing that
all errors are eliminated systematically. The production manager explains this
statement by stating that this is one of the reasons why visual management is
implemented at all level at the plant. This means that stations at shop floor might be
located close to each other. This situation helps the assembly operators to fix the
errors as quick as possible they appear at the manufacturing flow. Visual
manufacturing, according to the technician, enables the assembly operators working
at the following station to discover and correct the error that has been made at the
previous station.
4.3 Visualization of information Information on picture 6 displays the goal that needs to be achieved at the production
plant every day/every week. It means that the management has established after
analysis that 400 items need to be produced weekly in order for the company to be
effective and profitable. When the goal is not achieved the foreman will write the
amount produced items with the red colour.
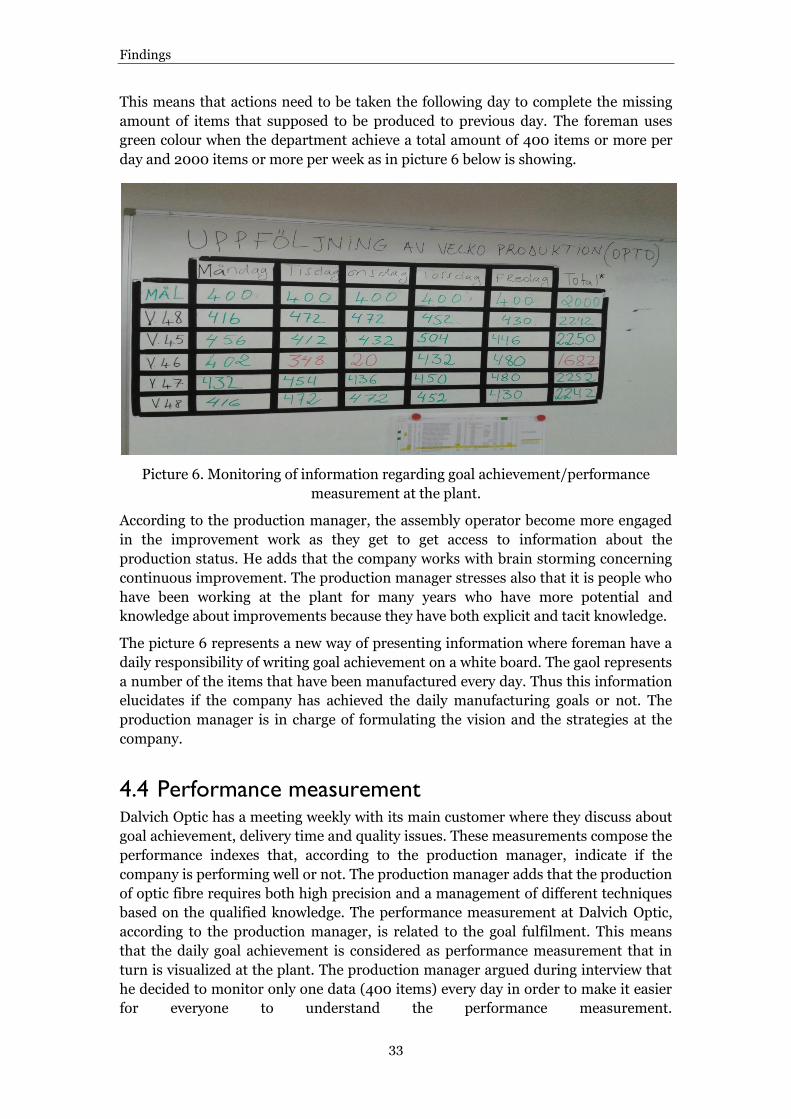
Findings
33
This means that actions need to be taken the following day to complete the missing
amount of items that supposed to be produced to previous day. The foreman uses
green colour when the department achieve a total amount of 400 items or more per
day and 2000 items or more per week as in picture 6 below is showing.
Picture 6. Monitoring of information regarding goal achievement/performance
measurement at the plant.
According to the production manager, the assembly operator become more engaged
in the improvement work as they get to get access to information about the
production status. He adds that the company works with brain storming concerning
continuous improvement. The production manager stresses also that it is people who
have been working at the plant for many years who have more potential and
knowledge about improvements because they have both explicit and tacit knowledge.
The picture 6 represents a new way of presenting information where foreman have a
daily responsibility of writing goal achievement on a white board. The gaol represents
a number of the items that have been manufactured every day. Thus this information
elucidates if the company has achieved the daily manufacturing goals or not. The
production manager is in charge of formulating the vision and the strategies at the
company.
4.4 Performance measurement Dalvich Optic has a meeting weekly with its main customer where they discuss about
goal achievement, delivery time and quality issues. These measurements compose the
performance indexes that, according to the production manager, indicate if the
company is performing well or not. The production manager adds that the production
of optic fibre requires both high precision and a management of different techniques
based on the qualified knowledge. The performance measurement at Dalvich Optic,
according to the production manager, is related to the goal fulfilment. This means
that the daily goal achievement is considered as performance measurement that in
turn is visualized at the plant. The production manager argued during interview that
he decided to monitor only one data (400 items) every day in order to make it easier
for everyone to understand the performance measurement.

Findings
34
The other performance measurement regards the quality deviation. But this
information is only monitored on the report related to production meeting that takes
place every Monday.
4.5 Goal achievement Before the implementation of the new artefact at shop floor, the information was not
visualized at the plant. Both the foreman and the assembly operators did not know
how many items they have manufactured. Only the production management had
access to this information. Concerning the visualization and monitoring about goal
achievement, the foreman states that there is only one number that employees at
shop floor need to focus on every day. Furthermore, he added that they have a daily
meeting where they have a brainstorming concerning the goal achievement.
According to the foreman the main point with the daily meeting with the
management is to have a same idea about the activities they carried out the previous
day. At the same time, they discuss about the daily challenges.
The statistical report of the number items produced during the period of six years is
monitored according table 3. The assembly operator comments the information
regarding the goal achievement issue by stating that she has possibility to interpret
the data by looking at the colour which is used when the data is reported on the
whiteboard. This colour indicates if employees have achieved the goal or not.
Furthermore, she points that all employees know that the goal is to produce 400
items every day. She adds that the information about goal achievement is easy to
understand as the information is updated every day. The foreman has the same point
of view by stressing that information about goal achievement is easy to understand.
Table 3. Number of items weekly produced before and after the implementation of
the new artefact at the plant
20XX 20XX 20XX 20XX 20XX 20XX 20XX
Week X 772 1716 0 0 0 0
Week X 1921 2166 1514 1284 345 1500
Week X 2238 958 1215 1440 1304 2050
Week X 733 430 1024 1500 2032
Week X 1511 1004 878 1000 2328
Week X 736 1742 1342 775 1012 2360
Week X 721 2376 2260 1164 1622 2110
Week X 2972 1104 802 1256 1446 2042
Week X 1630 1664 1190 1464 1666 2122
Week X 1170 883 548 1436 1813 2302
The information in table 3 reveals the number of items that have been produced since
2010 from week 1 to week 11. Every four months a company and its customer have a
meeting where different aspects of the company are discussed.

Findings
35
The customer stresses that “Dalvich Optic has increased production compare to the
past years, both Dalvich Optic and XXXX see this in the statistics. 20XX has been
the best start in 6 years with about 25% higher than last year. Dalvich Optic have
the opportunity to introduce shifts in about 4 weeks, this applies primarily to the
clean room and measurement ". As employees have achieved the goal during the
period of three months after the implementation of the artefact (monitoring the
performance measurement as picture 5 and 10 show), the management offers the
toast to all employees.
Analysis
36
5 Analysis
The main point on the chapter is to analyse the results founded on the case study in
relation with theories founded on literatures and explained previously in chapter 3.
The author will develop a framework which will be used further in order to analysis
different areas that cover the two research questions.
5.1 Analysis model The analysis model that is developed in this thesis is based on the user’s perspective
(assembly operator, foreman, technician and the production manager), the
managerial perspective (technician and the production manager), the technical
perspective (whiteboard), and the performance measurement perspective
(evaluation). The approach is connected to the ADR method which highlights holistic
analysis taking into account information, activities, users and tools. This means that
the analysis model offers possibility to analysed data by taking into account three
important factors people (operators and managers), technology (artefacts) and the
organizational goal (the performance measurement). The analysis model as described
in table 4 aims to facilitate understanding the relation between the problem that are
highlighted, the nature of the artefacts that was implemented in order to solve the
problem and the evaluation that was made in order to draw the conclusion if the
artefacts met its purpose or not.
Interconnections that are established in table 4 are in agreement with the new
requirements within a design science research which strive to fulfil the following
criteria (March & Storey, 2008):
Identification and clear description of a relevant problem within the
organization.
Development and presentation of novel artefacts that is specific to the
problem.
Accurate evaluation of the artefacts that enable the measurement.
Articulation of the value added knowledge.
The four points above demonstrate that, the design science research concerning
performance measurement is the combination of both novelty and utility of the
constructed artefacts. Furthermore, the four points described above are in
accordance with the ADR method that has been developed previously at this thesis
(March & Storey, 2008).

Analysis
37
Table 4. Connection between problem, Artefacts (solution) and evaluation (method)
(March & Storey, 2008, modified)
Problem IT artefacts
(solution)
Evaluation Method References
Operators do not have access to clear and understandable information.
Design artefacts that take into consideration users’ skills and knowledge.
Establish routines where managers and assembly operators discuss regularly about goal achievement.
Kraemer et al., 2003 Bradley, 2010 Pearlson & Saunders 2010. Dilla et al., 2014.
Operators do not have access to clear and understandable information.
Design artefact that visualize information in an understandable way.
Train operators to understand information that is displayed on the dashboard.
Purchase & Moere, 2011. Almström & Kinnander, 2007. Al-Najjar, 2006. Maskell & Kennedy, 2007. Bruch & Karltun, 2009.
There is no method to follow the goal achievement.
Design artefacts that enables the updating of information at real-time. Design Artefacts that display information about goal achievement in an easier way.
Establish a specific, goal, which is acceptable, realisable and time-based.
Dilla et al., 2014. Tonnquist, 2008. Scherer, 2011. Bergman & Klefsjö, 2007. Kumar et al., 2012. Tangen, 2005.
The company wants to increase its productivity, thus it wants to increase its market share.
Design artefacts that enhance motivation and engagement among all employees.
Establish meeting at shop floor which include assembly operators.
Mattsson & Jonsson, 2011. Hudson et al., 2001. Almström & Kinnander, 2007. Kaplan and
Analysis
38
Table 1, picture 4, and picture 6 correspond to the analysis described in table 4. Once
following problem areas as assembly operator skills, access to real time data,
possibility to participate in manufacturing matters, possibility to influence the
productivity at the plant and method to follow up the goal achievement were
identified, the management designs the artefacts and creates the arena that enhance
the evaluation of the performance measurement and thus goal achievement at the
manufacturing plant.
5.2 Shop floor activities Visualisation of information at Dalvich Optic is in accordance with picture 4 where
the information is presented in the middle of the production where activities take
place (Kennedy & Maskell, 2007; Bruch et al., 2008). Presenting information at the
middle of the production plant aims to solve the problem of visualizing information
in a good way, and at the same time, increase the assembly operators’ participation in
decision-making at the plant (March & Storey, 2008).
Presenting information as monitored at table 1 offers many advantages for assembly
operators at Dalvich Optic. This point of view is based on the fact that assembly
operators did not have access to clear and understandable information before the
introduction of IT artefact at the plant. The use of the colour in table 1 is suitable for
the environment where activities take place. Information as presented through table
1, by using green and red colour, facilitates operators to understand if they had
achieved the goal or not (Dilla et al., 2014). The information in table 1 visualizes the
performance measurements in an easier way. Thus the assembly operators and
decision makers build sharing understandable and sharing responsibility (Osland et
al., 2011). The use of the table 1 at Dalvich Optic is in accordance with the ADR
method and the analysis model in table 4 where designer has to take into
consideration: the problem formulation, the context where the artefacts is going to be
implemented, and at the same time, the skills and the knowledge of the users
(Lindgren et al., 2011; March & Storey, 2008).
Information as described on picture 4 aims to increase the participation of the
assembly operators on production matters. This situation has been applied at Dalvich
Optic where information is visualized according picture 5. The environment
described according on picture 5 shows that the daily meeting takes place at shop
floor where assembly operators are active. Presentation of information at shop floor
by using picture 5 has boosted the participation of assembly operator on
manufacturing matters and thus has increased the productivity (Almström &
Kinnander, 2007; Maskell & Kennedy, 2007). The meeting creates a daily arena when
assembly operator and decision makers meet each other (Bruch & Karltun, 2009; Al-
Najjar, 2010; Chen, 2010).
Visualizing the information according to picture 5 at the plant emphasizes the
decentralization of the decision making, which is one of the key factor that enhance
employees’ participation and motivation (Osland et al., 2011; Kraemer et al., 2003).
This assertion was even argued by the technician and the assembly operator at

Analysis
39
Dalvich Optic. The assembly operators, by having access to information, have
possibility to understand the status of the production.
5.3 Visualization of information The use of table 1, picture 5 and picture 6 at Dalvich Optic is in accordance with the
purposes, by which decision makers might provide assembly operators correct, real-
time and complete information (Kraemer et al., 2003; Bradley, 2010; Pearlson &
Saunders 2010; Dilla et al., 2014). The use of yellow and green colours facilitates the
understanding of information from assembly operators’ side. This statement is in
accordance with the affirmation stressing that, the use of colours within industry
enhances possibility to smooth the manufacturing process (Velcu & Yigitbasioglu,
2012). This situation is possible when it is given to assembly operators’ possibility to
discover deviations on the process as quick as possible (Bergman & Klefsjö, 2010).
For that reason, the technician points that, presenting information regarding quality
issues enhances assembly operators’ participation in continuous improvement
regarding quality matters. This means that, the more data about quality deviation are
visualized in an easier way, the more assembly operators become aware in solving
issues that can disturb the whole manufacturing process (Bruch & Karltun, 2009;
Goswami et. al., 2012; Al-Najjar, 2006).
Information as displayed on picture 5 enables assembly operators to make some
adjustments as quick as they found anomalies. This means that the implementation
of artefacts at Dalvich Optic enables employees to have: correct and complete
information at real time. This is one of the prerequisites to run the manufacturing
process in a smooth way (Bruch et al., 2008; Dilla et al., 2014; Kennedy & Maskell,
2007). This means that, presenting information by using picture 5 offers possibilities
to assembly operators to work with high quality of information that fulfil the
requirement needed in order to increase the productivity at the plant (Mattsson &
Jonsson, 2011). This assertion is in accordance with the fact that, the assembly
operators at Dalvich Optic, by using the picture 5 in their daily tasks, have possibility
to follow the production planning at the real time. For that reason, it is clear to point
that, employee at Dalvich Optic work with high precision information. This is an
important factor that enables employees to follow the status of the production
planning at real time (Pearlson & Saunders, 2010).
Employees at Dalvich Optic, through the implementation of the new artefact got the
possibility to build knowledge about goal achievement. This in turn increases the
comprehension about the status of the production (Bradley, 2010; Chen, 2010;
Ryding, 2010). The perception of the goal might differ from the assembly operator to
the management. This means that managers further have possibility to translate the
daily goal into economic term (profitability) while the assembly operators should
limit their analysis at the productivity level. Information according to table 1 is more
simplified than the one in picture 2 due to the fact that, it is easier for users (assembly
operators) at Dalvich Optic to understand numbers than graphs.

Analysis
40
The assembly operator and foreman recognize that the information as monitored on
picture 6 is easier to understand as it only uses two colours and only monitor one
goal. The assembly operators working at Dalvich Optic should appreciate if
information about performance measurement could be compiled, presented and
maintained at the middle of the production as on picture 4 (Kennedy & Maskell,
2007; Almström & Kinnander, 2007). The use of the green colour in table 1 increases
the attention of both the assembly operators and the decision makers. The use of red
colour means that the goal has not been achieved; while the green one means that the
gal has been achieved according to the assembly operator and the foreman.
5.4 Performance measurements The analysis and table 3 shows that the productivity at Dalvich Optic has increased.
This statement is confirmed by the analysis coming from a customer by pointing that
“Dalvich Optic has increased production compare to the past years, both Dalvich
Optic and XXXX see this in the statistics. 20XX has been the best start in 6 years
with about 25% higher than last year…”. This argument can be interpreted that
Dalvich Optic has succeeded to deliver right quantity of goods on time (Chopra &
Meindl, 2010; Sims & Hajli, 2015). This analysis is in accordance with the argument
stressing that, the development of measurement system aims to visualize efforts that
company accomplish and thus translated in term of strategic and operational goals
achievement (Kaplan & Norton, 2005; Maskell & Kennedy, 2007).
The general analysis of the production shows that the productivity has gone forward
after the establishment of the new IT artefacts. Taking into account the balance
between inputs and outputs, it has been demonstrated that Dalvich Optic has used
the same amount of resources as the one use the previous year, but has produced
50% more this year than what it had produced the previous year at the same period.
This statement highlights the fact that, the use of IT artefacts in industry in order to
visualize information generates several benefits (Almström & Kinnander, 2007;
Maskell & Kennedy, 2007). Accordingly, it can be argued that, monitoring
information in the middle of the production plant affects positively assembly
operators’ behaviour and consequently the outcomes of the manufacturing process
(Kraemer et al., 2003; Hitt & Brynjolfsson, 2000) as table 3 illustrates. The same
approach is justified by the assembly operator at Dalvich Optic by stressing that,
before the implementation of the new IT artefacts; the information was not
monitored at the plant. Hence, assembly operators did not know how much items
they have manufactured. Only the production management had access to this
information.
Table 3 reveals the total amount of the items that have been produced during a
certain period. This information is more designated for a managerial use. Table 3
offers possibility to compare the actual productivity to the previous one. The
implementation of the new information support system creates condition for
assembly operators to achieve the SMART goal (Tonnquist, 2008). At the same time
decision makers have possibility to measure and evaluate the inputs that were used to
produce a certain outputs (Chopra & Meindl, 2010; Kennedy & Maskell, 2007).

Analysis
41
Visualisation of information as displayed at table 3 illustrates the important role that
artefacts play to achieve both operational and strategic goals at the company. This
approach is argued on the fact that, it is necessary for the assembly operators and
decision makers to have knowledge about the amount of items that are produced at
the plant as highlighted by the production manager and the foreman. The analysis of
this parameter is vital to determine if the company has achieved a certain level of
productivity or not (Kraemer et al., 2003; Velcu & Yigitbasioglu, 2012). Visualisation
of information by using picture 5 and table 3 enhances the culture of accountability as
all information is presented in form of numbers. It facilitates everyone at the
company to evaluate the status of the production and the level of the goal
achievement (Chopra & Meindl, 2010).
5.5 Goal achievement Goal achievement at Dalvich Optic, according the production manager, is strongly
connected with many factors such as: culture changes about leadership and goal
commitment; and assembly operators’ involvement in manufacturing tasks and
culture change by creating learning environment. The climate of trust among
employees is enhancing as employees themselves are responsible to write by hand the
goal achievement according the production manager and the foreman. The
information visualized on table 1 has only one parameter: the daily goal. The
assembly operators have a specific, measurable, accepted, realistic, and time based
goal to achieve every day, every week and every month (Tonnquist, 2008).
The same situation was highlighted by the assembly operator at Dalvich Optic. Once
information about goal achievement has been visualized at a proper manner, it
becomes easier for the assembly operators to achieve this goal. The goal achievement
as mentioned on picture 6 and table 1 is capital for the productivity (Tangen, 2005;
Almström & Kinnander, 2007; Al-Najjar, 2006). This assertion is in accordance with
the point of view coming from the foreman and the assembly operators who recognize
that the new way of presenting information has facilitated the employees to
understand the production status and become active on production activities.
The results obtain after visualisation of the information at Dalvich Optic highlight the
assertion stressing that, artefacts nowadays, need to be studied and implemented at
the production plant by taking into account parameter such as leadership (Ljungberg
& Larsson, 2012; Dalkir, 2005). Therefore, research about implementation of
information monitoring and its impact on productivity should be done in a holistic
perspective taking into account factors such as: the assembly operator inputs, the
management perspective and the purpose of the change or innovation (Al-Najjar,
2006; Kumar et al., 2012; Bruch & Karltun, 2009). Therefore, the introduction of IT
artefact that monitors information by using two colours was relevant for the type of
activities that take place at Dalvich Optic (Dilla et al., 2014; Pearlson & Saunders,
2010; Purchase & Moere, 2011).

Discussion and Conclusions
42
6 Discussion
In this chapter it is discussed the results obtained through observations and interviews at the company. The discussion will focus also on analysis concerning the choice of ADR and mixed methods on this study.
6.1 Discussion of method This research has been carried out through a holistic perspective which means that
the author has taken into consideration factors as people (assembly operators,
production manager, technician and foreman), IT artefact and activities
(performance measurements and goal achievement). These three factors are in phase
with ADR model (Lindgren et al., 2011). This model suits this study because a case
study was conducted in an industrial environment where it is capital to study the
interaction between people, technique and activities through interviews, observations
and literatures review. Consequently, the choice of both ADR method and mixed
method are justified by many reasons. Firstly, the observations made on the company
contribute to a design of adequate IT artefact that is adapt to the company’ realities
(Kennedy & Maskell, 2007; Bruch et al., 2008). The interviews concern four
employees working with different tasks on the company in order to have a broader
perspective and ideas about performance measurements, visualization of information
and the participation of assembly operators on the manufacturing activities at the
plant.
The author had access to the plant at any time and had opportunities to ask questions
to personnel without restrictions. Consequently, he had made a lot of observations at
the production plant and felt free to ask questions in order to get clear picture for
what he observed. Moreover, a majority of the questions that were address during
interviews has been used before in the scientific research context and has given good
results (Almström & Kinnander, 2007). Therefore, the choice of case study as
research strategy strengths the idea stating that the author had an ambition to
present the report of high validity. This means that same questions can be asked in
another case study done on the same conditions and environment will lead to same
results.
One of the weaknesses connected to the case study and therefore to this report can be
explained by stating that, the author should had improved the quality of the report if
he had opportunity to interview all the assembly operators working at the plant. The
interview with only one assembly operator may not reflect the point of view of all
assembly operators depending of their experiences. This is even one of the reasons
that increase the weakness on the idea of generalizing the findings from Dalvich Optic
to other sites. But despite this weakness the author estimates that ADR and mixed
method were suitable for this study and this issue does not affect the study’ results.

Discussion and Conclusions
43
6.2 Discussion of findings The contributions of this study in academic world aim to highlight the impact of the
artefact at the productivity, but also the significance contribution of the assembly
operators on the performance measurement. Several factors can be argued in relation
to the design and the implementation of new artefact at Dalvich Optic. It has been
demonstrated that, accurate visualisation of information in industry field plays a key
role regarding the way employees can achieve their goals. It is obvious that the use of
IT artefacts enables employees to become active in manufacturing process. Hence, it
increases the decentralisation of decision-making which in turn enhances the value-
added time at the manufacturing process (Almström & Kinnander, 2007; Al-Najjar,
2006). For that reason, it is important to design artefacts that take in consideration
activities that place at the shop floor; not only designing artefacts that address to
solve strategic problems such as profitability (Dilla et al., 2014; Pearlson & Saunders,
2010).
These factors are connected to the analysis model that has being developed on table
4. Firstly, it has been demonstrated that, the design of IT artefact as presented on
picture 6 takes into account assembly operators’ skills and knowledge as information
monitored in picture 6 is presented in an understandable way. Only two colours are
used, data is updated by assembly operators, and meetings take place at the middle of
the production plant. This situation has led to the increased of motivation among
employees and the increased productivity. Daily meetings according to picture 5
establish routines where managers and assembly operators discuss regularly about
goal achievement. Secondly, the design of artefact at Dalvich Optic enables updating
of information at real-time. This means that, information can be updated continually.
This situation offers possibility to employees to follow up the production status based
on the data coming directly from the place where manufacturing activities take place;
which in turn increased the trust between management and operations (Chopra &
Meindl, 2010; Hudson et al., 2001).
6.2.1 Shop floor activities The analysis of the activities that take place at the shop floor at Dalvich Optic leads to
discussions about how to visualize information at the shop floor and how to motivate
assembly operators. Picture 2 aims to visualize performance measurement revealing
goal achievement at the plant during a long period, while information at table 1
reveals goal achievement on a weekly basis. The discussions highlight that picture 2
as the whole combines by itself five ways of presenting information: graphs, tables,
texts, maps and diagrams. Presenting information according to picture 2 is not
suitable for assembly operators’ comprehension because picture 2 presents too much
information at the same time. This approach of visualizing information does not suit
with shop floor context (Dilla et al., 2014; Al-Najjar, 2006). However, the use of
picture 2 is suitable at the managerial level where decision makers manage advanced
tasks that require analysis based on access of a certain amount of information at the
short time.

Discussion and Conclusions
44
Information as displayed in table 3 is the best practice that could be implemented at
Dalvich Optic. This point of view is based on the fact that, the way information is
monitored increases engagement among employees. Additionally, assembly operators
become more active in the manufacturing process. They have possibility to contribute
to continuous improvement. The introduction of the artefact at the production
process has undisputable lead to the increase of productivity at the plant. This
assertion is based on the analysis and the comparison of the produced items since
2010 according table 3. The information support system as proposed on picture 3 is
more suitable for the maintenance issue where operators and mechanics work at
different places Campos et al., 2009; Cannata et al., 2010). The information support
system as illustrates in picture 3 might not be relevant to Dalvich Optic ‘context. This
assertion in founded by fact that the assembly operators at Dalvich Optic do not need
to use the information at separate places. Information need to be visualized through
artefacts that visualize information in a bigger character than the one monitored in
picture 3. Thus the communication with assembly operators is crucial in order to
keep the machine running without interruptions (Bruch & Karltun, 2009; Bruch et
al., 2008).
6.2.2 Visualization of information The main benefit with the use of the table 3, picture 5 and picture 6 is that, the
Artefact was designed taking into account the three key characters that emphasize
design research which are: people (assembly operators and decision makers),
technology (the artefact used to monitor information), and the organization (daily
meeting at the production plant and the establishment of the goal). This assertion is
in accordance with the ADR method that was developed and chosen as method in this
thesis (Lindgren et al., 2011). It might be difficult for the operator to understand
information as it is presented on picture 2 and on picture 3. The reason is that the
information as presented on picture 2 and on picture 3 is too confused and too much
colours are used. Picture 2 and picture 3 are more suitable for the managerial use in
which the decision makers need a holistic picture of manufacturing (Dilla et al., 2014;
Goswami et. al., 2012). On the contrary, presenting information according to picture
6 and table 1 facilitates the visualization of information in an easier way according to
the assembly operator, the foreman and the technician. Operators and managers have
the possibility to follow the performance measurement characterized by the
manufacturing of 500 items every day.
6.2.3 Performance measurements The measurement of performance at Dalvich Optic is clearly displayed at table 3. The
conception and analysis of the performance management at Dalvich Optic can be
divided into two levels: the short term perspective as visualized on picture 5 and the
long term one as monitored at table 3. The short term is principally addressed to the
assembly operators and the foreman, while the long term one is addressed to the
management (Detlor, 2010; Xian et al., 2014). Without clear and understandable
measurement of performance it might be difficult for the employees to find out if the
level of productivity at the plant (Sims & Hajli, 2015; Kraemer et al., 2003).

Discussion and Conclusions
45
The analysis of different items produced during the period of five years at Dalvich
Optic according table 3 reveals that presentation of information according picture 5
and picture 6 had a positive impact on the productivity. This point of view was
highlighted at Dalvich Optic by the foreman. The assembly operators at Dalvich
Optic, according to the foreman, feel now as part of the manufacturing process, thus,
they have same information with the decision makers. They have possibility every day
to discuss their challenges with all the management staff. This situation has created a
good atmosphere at the company enhancing both innovation and engagement
(Dalkir, 2005; Scherer, 2011; Pearlson & Saunders, 2010). The assembly operators
and decision makers, through picture 5 have possibility to bring strengths together in
order to increase productivity. The increase of production is necessary for Dalvich
Optic as it becomes necessary to rebuilt trust with its customer, according the
production manager (Brian et al, 2007; Ljungberg & Larsson, 2012). Table 3 is the
demonstration that Dalvich Optic is in the good way.
6.2.4 Goal achievement The analysis and discussions of the total produced items at Dalvich Optic during
actual and previous year shows that, the year 2016 is the year which excels with
productivity compared to previous years. The company Dalvich Optic has produced
during 2016 almost the double amount of items compared to the same period in
2010. The same analysis can be done comparing to the previous year. The analysis of
the comparison stresses that the company has produced 50 percent more than the
previous year according table 3. This means that the establishment of the goal at
Dalvich Optic leads the stable manufacturing plan (Sims & Hajli, 2015; Kraemer et
al., 2003). Furthermore, the analysis of data from table 3 shows that the goal
achievement of 400 items per day was specific for the department where
manufacturing activities take place; Measurable by following up data through the use
of picture 5; Accepted as all employees at the plant follow the same goal of 400 items
as the foreman states that, as there is only one number we need to focus on every day;
Realistic, as the goal was almost achieved every day according picture 6; and Time
based, as the goal should be achieve every day (Tonnquist, 2008).
Discussion and Conclusions
46
7 Conclusions
This chapter responds the two research questions that have being stressed earlier on
this study. Furthermore, the chapter connects the study’ purpose to the research
questions.
In order to answer the two research questions that highlighted at this thesis, the
author has interview different people performing different tasks at Dalvich Optic.
Furthermore, several observations were made at the plant where he works as
production manager. Different theories from articles, books and Internet, especially
within information system, leadership, performance measurement and visualization
of information were used.
At the beginning of the thesis, the author has stressed two questions that he was
going to study:
1. How can information on performance achievements be visualized on shop
floor in order to increase productivity at the plant?
2. How can visualization of information enhance assembly operators’
participation on decision making at shop floor?
After literatures’ review, analysis of different observations at Dalvich Optic and
interviews, the two research questions can be answered be the following statements:
1. Before the establishment of the new artefact at Dalvich Optic, the assembly
operators did not have access to information regarding the production status.
Thus, they did not know about performance measurement at the plant. Goals
were not established at the manufacturing plant. The company does not have
any communication channel that could bring together the assembly operators
and decision makers. The introduction of information support system at the
shop floor offers all employees possibility an arena to discuss about the
production status. Through daily meetings, daily goal becomes everyone
challenge not only for assembly operators or decision makers. Information
visualised through a new artefact reveals real-time, complete and correct
information. Based on those facts it is clear to state that the implementation
of the artefacts at Dalvich Optic has following benefits regarding productivity:
It has increased the production by 50 percent compare to 2014; and it
has doubled the production compare to 2010.
The information about production status became visible and accessible
for all employees.
The information displayed through the new artefact was monitored in
an easy-to- understand way.
The presentation of data regarding productivity enables both assembly
operators and decision makers to react when the goal is not achieved.

Discussion and Conclusions
47
2. Before implementation of the artefact, the assembly operators only have
limited information about production status. Consequently, it was difficult for
them to contribute to continuous improvement at the plant. But, with
implementation of the new artefact, the assembly operators become active on
the manufacturing process. They had access to formation that suit their skills,
education and experience. Based on those facts it is obvious to state that,
implementation of the new artefact at Dalvich Optic creates following benefits
regarding the increase of participation from assembly operators:
The assembly operators feel more engaged at the manufacturing
process as they can, through the new artefact, update information and
participate to the problem solving. The assembly operators become
more active at the planning and manufacturing process as the
information about performance measurement is compiled and
maintained by them.
Daily meetings with decision makers enhance the possibility for the
assembly operators to highlight their daily challenges. They have the
possibility to discuss face-to face with decision makers. They have
possibility to share understanding and to share responsibility about
productivity.
The assembly operators, through information support system had
capability to influence the production outcomes. This means that they
have possibility to increase their contributions in order to increase or
decrease the number of the produced items.
Implementation of the new artefact at Dalvich Optic brings to light the importance of
IT artefact at the companies. Furthermore, it emphasizes the role of the assembly
operators on the manufacturing and decision making process. The implementation of
the new IT artefact increases the production without increasing the resources. This
statement demonstrates that this study is in phase with the purpose of this study. The
author has kept the delimitation of this study on the production environment which
is characterized on this study by the shop floor.
The same type of It artefact was implemented at another company where employees
have worked at the company for almost thirty years by doing things at the same
manner and without having any management strategy about goal achievement. The
author has worked at this second company having a managerial position where he
had a possibility to influence production outcomes through the implementation and
the use of the same IT artefact. The two companies manufacture different goods in
two different environments and having different approaches regarding performance
measurement, leadership and goal achievement. But the introduction of the IT
artefact has the same results on both companies. This situation demonstrates that the
implementation of the new IT artefact can be generalized within industry.

Discussion and Conclusions
48
This point of view is justified by the fact that Dalvich Optic produces optic fibre while
the second company produces woods. This is one of the main reasons that persuade
the author to state that the results and findings coming from this case study can be
applied on other sites. This means that the results coming from this study can be
globalize to other plants within industry. This is one of the major proofs of validity on
this study.
This study is conducted on the manufacturing environment having different
challenges regarding goal achievement, performance measurements and employees´
motivation that may differ than the challenges founded at other environments.
Hence, the results of this study may be different if the study was conducted on an
organisation that produces services for example. The author is awarded that the
outcomes of this thesis should be different if he has not been involved at the
manufacturing process as member of the management staff. Furthermore, the
outcomes should lay in other issues if he has not studied logistics, leadership,
maintenance and IT before. But, at the other side he is conscientious that it is his
previous experiences as assembly operator for six year ago which strength his
motivation to discover lack that exist between literatures and the reality at the shop
floor. His actual position as manager gave him a chance to highlight this lack in an
academic way based on ADR method. He considers his previous courses as precious
inputs that have facilitated him to study this thesis in a holistic perspective.
7.1 Suggestions on furthers studies There are two different approaches regarding IT artefact’ contribution on
productivity. One side argues that, massive investment in IT during the 1980s did not
contribute to boost productivity. This argument was backed by the fact that, the
growth of IT artefacts investments was followed by a decline in prices of computer
equipment; which unfortunately led to a shift from variable to fixed costs without
related productivity benefits (Sims & Hajli, 2015). Research that support this point of
view stresses that, spending on information technologies is still high and there is no
significant correlation between investments in IT artefacts and labour (Sims & Hajli,
2015).
Previous studies on IT artefacts were not based on well defined methods and they
limited IT artefacts investment to computer hardware. Studies about the impact of IT
artefacts on productivity were not rigorous before; and they were focused on wrong
measurements. However, new studies reveal that, IT artefact investments contribute
largely to the increase of productivity at the plant (Kraemer et al., 2003). As an
example, this study has demonstrated that using IT artefacts that monitor
information in industry field increase its productivity. But, it is necessary to stress
that, productivity do not necessary lead to profitability. This assertion is based on the
fact that, other parameter such as pricing or discounts can influence the outcomes
that determine profitability. Productivity as performance is easier to measure
compare to profitability.

Discussion and Conclusions
49
The impact of IT and information support system can widely vary from companies to
companies and from context to context. The effective use of IT artefacts depends as
well on other factors such as organizational structure, management system control,
the process, and employee training and skills (Kraemer et al., 2003; Hitt &
Brynjolfsson, 2000). Excessive information leads to confusion and thus inaccuracy in
decision making (Velcu & Yigitbasioglu, 2012). Therefore, future studies should focus
on designing. IT artefacts that address only the information that the user needs. The
lack of top management support when artefacts need to be implemented is one of the
drawbacks. IT may be viewed as a competing tool rather than an enhancement on the
existing management control tools in an organization (Velcu & Yigitbasioglu, 2012).
It is therefore necessary for the new artefact to be adapted to suit employees’ skills.
The effects of IT investments are noticeable only through good leadership and
identification of information that are adapted to the environment where the activities
take place (Velcu & Yigitbasioglu, 2012).

References
50
8 References
In this section the author will notice sources such as books, articles and journals
where information has been collected.
Al-Najjar, B. (2006). The lack of Maintenance and not Maintenance which costs: A
model to describe and quantify the impact of vibration-based Maintenance on
company’s business. International Journal of Production Economics, 107, ss. 260-
273.
Al-Najjar, B. (2010). Economic importance of Maintenance planning when using
vibration-based Maintenance policy. Växjö: Växjö University Press.
Alter, S. (2008). Service system fundamentals: Work system, value chain, and life cycle. IBM Systems Journal, 47 (1),1-16. Almström, P. & Kinnander, A. (2007). Productivity potential assessment of the
Swedish manufacturing industry. Swedish Production Symposium, ss. 1-8.
Bergman, B. & Klefsjö, B. (2010). Kvalitet, från behov till användning.
Studentlitteratur.
Björklund, M. & Paulsson, U. (2008). Seminarieboken, Att skriva, presentera och
opponera. Lund: Studentlitteratur.
Bradley, G. (2010). The convergence theory on IT, society and human beings-towards
the good IT society. Triple C, Cognition-Communication-Co-operation 8 (2), ss. 183-
192.
Bruch, J., & Karltun, J. (2009). Information requirements in a Proactive Assembly
Work Setting, in Proceedings from CARV 2009: The 3rd International Conference on
Changeable, Agile, Reconfigurable and Virtual Production, ss. 5-7 October, Munich.
Bruch, J. Karltun, J. & Dencher, K. (2008). Assembly Work Settings Enabling
Proactivity-Information Requirements, in Mitsuishi, M., Ueda, K., Kimura, F. (Eds)
Manufacturing Systems and Technologies for New Frontier: Proceedings of The
41st CIRP Conference on Manufacturing Systems. Springer Verlag, London.
Bruch, J. & Karltun, J. (2007). Human, technological and organizational aspects
influencing the production scheduling process. International Journal of Production
Economics, 110, ss. 160–174.
Campos, J., Jantunen, E. & Prakash, O. (2009). A web and mobile device architecture
for mobile e-maintenance. International Journal for Advance Manufacturing
Technology (45), ss. 71–80.

References
51
Cannata, A., Karnouskos, S. & Taisch, M. (2010). Dynamic e-maintenance in the era
of soa-ready device dominated industrial environments. London: Springer.
Chen, C. (2010). Information visualization. College of information Science and
Technology, Drexel University, Philadelphia, 2, July/August.
Chopra, S. & Meindl, P. (2010). Supply Chain Management. Pearson education.
ISBN: 9780136094517.
Creswell, J.W. (2009). Research Design: Qualitative, Quantitative, and Mixed
Methods Approaches. Thousands Oaks, CA: Sage Publications.
Creswell, J.W. & Clark, V.L. (2007).Designing and conduction mixed methods
research. Thousands Oaks, CA: Sage Publications.
Dalkir, K. (2005). Knowledge Management in Theory and Practice. Elsevier
Butterworth-Heinemann.
Detlor, B. (2010) Information Management, International Journal of Information
Management, 30, ss. 103-108.
Dutot, V.; Bergeron, F.& Raymond, L. (2014). Information management for the
internationalization of SMEs: an exploratory study based on a strategic alignment
perspective. International Journal of Information Management, 34, ss. 672-681.
Eklund, J. (2003). An extended framework for humans, technology and organization
in interaction. In K.J. Zink and H. Luzcak (Eds.). Proceedings of Human Factors in
Organizational Design and Management vol. VII. Aachen: Wissenschaftsverlag.
Eti, M., Ogaji, S. & Probert, S. (2006). Reducing the cost of preventive maintenance
(PM) through adopting a proactive reliability-focused culture, Applied Energy, 83, ss.
1235-1248.
Fassler, A. & Matthias, N. (2011). An Innovative Integrated Research Method:
Estimating Fidelity Using Technology for Model Integration and Development.
British Journal of Social Work, 41, ss. 761-777.
Fjällström, S., Säfsten, K., Harlin, U. & Stahre, J. (2009). Information enabling
production ramp-up. Journal of Manufacturing Technology Management, 20 (.2),
ss. 178-196.
Goswami S., Engel, T. & Krcmar, H.(2012). A comparative analysis of information
visibility in two supply chain management information systems. Journal of
Enterprise Management 26 (3), ss. 276-294.
Graziano, A. & Raulin, L. (2010). Research methods, a process of inquiry. London:
Pearson International edition.

References
52
Hendriks, J. & Vriens, J. (1999). Knowledge-based systems and knowledge
management: Friends or foes? Information & Management, 35, ss. 113-125.
Hitt, L. & Brynjolfsson, E. (2000). Beyond Computation: Information Technology,
Organizational Transformation and Company Performance. Journal of economic
Perspectives, 14 (4), ss. 23-48.
Holme, M. & Solvang, K. (1997). Forskningsmetodik om kvalitativa och kvantitativa
metoder. Lund: Studentlitteratur.
Hudson, M., Smart A. & Bourne, M. (2001). Theory and practice in SME performance
measurement systems. International Journal of Operations & Production
Management. 21 (8), ss. 1096-1115
Janvrin, J., Raschke, L. & Dilla, N. (2014). Making sense of complex data using
interactive data visualization. Journal of accounting education, 32, ss. 31-48.
Janvrin, J., Raschke, L. & Dilla, N. (2010). Interactive Data Visualization: New
Directions for accounting Information Systems Research. Journal of information
systems, 24 (2), ss. 1-37.
Kaplan, R. & Norton, D. (2005). The balanced scorecard, measures that drive
performance. Harvard Company Review January-February. 83(7), ss. 172-180.
Karim, N. & Hussein, R. (2008). Managers’ perception of information management
and the role of information and knowledge managers: The Malaysian perspective.
International Journal of Information Management, 28, ss. 114-127.
Kaplan, R. & Norton, D. (2007). Using the balanced Scorecard as a strategic
management system. Managing for the long term. Harvard Company Review July-
August.
Krogh, G., Nonaka, I. & Rechsteiner, L. (2011). Leadership in Organizational
Knowledge Creation: A Review and Framework. Journal of Management Studies, 49,
ss. 241-271.
Kraemer, L., Jason, D. & Vijay, G. (2003). Information Technology and Economic
Performance: A Critical Review of the Empirical Evidence. ACM Computing
Surveys, 35 (1), ss. 1-28. March 2003.
Kumar U., Aljumaili, M., Tretten, P. & Karim, R. (2012). Usability-based e-
maintenance for effective performance measurement. Luleå: Luleå University.
Lindgren, R., Maung K., Henfridsson, O., Sandeep, P. & Rossi, M. (2011). Action
Design Research. MIS Quarterly, 35 (1), ss. 37-56.
Ljungberg, Ö. (2000). TPM, vägen till ständiga förbättringar. Lund:
Studentlitteratur.

References
53
Ljungberg, A. & Larsson, E. (2012), Processbaserad verksamhetsutveckling, Varför-
Vad-Hur? Lund: Studentlitteratur.
Magableh, G. & Mason, J. (2003). Increased supply chain efficiencies through
integration: proceedings of the 12th Annual Industrial Engineering Research
Conference, Portland, OR.
Mattsson, S-A. & Jonsson, P. (2011). Logistik, läran om effektiva materialflöden.
Studentlitteratur.
Maskell, B.& Kennedy, F. (2007). Why Do We Need Lean Accounting and How Does
It Work? The Journal of Corporate Accounting and Finance, March/April, ss. 59-73.
March, S. & Storey, C. (2008). Design Science in the Information Systems Discipline:
an introduction to the special issue on design science research. MIS Quarterly 32 (4),
725-730/december 2008.
Nyberg, R. (2000). Skriv vetenskapliga uppsatser och avhandlingar med stöd av IT
och Internet. Lund: Studentlitteratur.
Pearlson, E. & Saunders, S. (2010). Managing and using Information Systems, a
strategic approach. New Jersey: Hoboken, John Wiley & Sons, Inc.
Purchase, H. & Moere, A. (2011). On the role of design in information visualization.
Information visualization, 10 (4), ss. 356-371.
Scherer, E. (2011). Shop floor Control, a System Perspective. ISBN: 9783642643491.
Sotiris, K. & Sophia, P. (2007). Information technology as a factor of economic
development: Evidence from developed and developing countries. Economics of
Innovation and New Technology, 16 (3), ss. 179-194.
Sims, J.M., Hajli, M. & Ibragimov, V. (2015). Information technology (IT)
productivity paradox in the 21 st century. International Journal of Productivity and
Performance Management 64 (5), ss. 457-478.
Tangen, S. (2005). Demystifying productivity and performance. International
Journal of Productivity and Performance Management, 54 (1), ss. 34-46.
Tonnquist, B. (2008). Project Management, a guide to the theory and practice of
project, program and portfolio management, and company change. ISBN 978-91-
622-8916-4.
Xian, M., Lv, J. & Xing, W. (2014). Research on the interactive visualization
technique of accounting information system. Advanced materials Research, ss. 998-
999.

References
54
Yin, K. (2002). Case study research. Design and methods. London: Sage
Publications.
Zeng, J. & Zhang, J.(2013). Using Dashboard for Lean Revenue Cycle Management, I-
Business 5.3B, ss. 100-103.
Zhong, H. & Zhou, B. (2011). Using Information Technology to optimize Operations
of third part logistics provider. International Journal of Management and
Information Systems 15 (1), ss. 115-20.
8.1 Appendices Some of the questions that have been ask at different interviews were asked before at
the similar situation (Almström & Kinnander, 2007).
Interview with the production manager Question 1: Can management present a clear production strategy, based on
qualifying and order winning criteria?
Question 2: is the strategy been converted into measurable goals for the
production? And how do you measure performance at the plant?
Question 3: Is the goal measured regularly and is this measure available to the shop
floor personnel?
Question 4: Is the fulfillment of the goals connected to any kind of reward?
Question 5: Is a standardized work method used and is it documented?
Question 6: Is the standardized work method changed if the workers find a better
method?
Question 7: Is there anyone responsible for and competent to measure manual
work?
Question 8: Has the foreman knowledge to do all work tasks on the shop floor?
Question 9: Are the workers engaged in the improvement work?
Question 10: Has the management a realistic idea about the productivity potential?
Question 11: Is information about goal achievement communicated to the main
customer?
Question 12: Is ideal cycle time known and is it based on facts?
Question 13: Are real operation times reported to the planning system?
Question 14: Are the operation times in the planning system updated based on the
real operation times?
Question 15: Is the production planned according to pull principle when possible?
Question 16: Are lead times measured in order to reduce them?
Question 17: Is the single operator responsible for the quality of his own work?
Question 18: Are the systematic methods used to eliminate the occurrence of
errors?
Interview with the technician Question 1: Can management present a clear production strategy, based on quality
criteria?
Question 2: Is the visualization of the information about quality activity clear and
easy-to understand from all employees?
References
55
Question 3: Is the strategy been converted into measurable goals for the
production?
Question 4: Are the goal measured regularly and are these measures available to the
shop floor personnel?
Question 5: Is the fulfillment of the goals connected to any kind of reward?
Question 6: Is a standardized work method about quality issues used and is it
documented?
Question 7: Is the standardized work method changed if the workers find a better
method?
Question 8: Is there anyone responsible for and competent to measure manual
work?
Question 9: Has the foreman knowledge to do all work tasks on the shop floor?
Question 10: Are the workers engaged in the improvement work about quality?
Question 11: Is the single operator responsible for the quality of his own work?
Question 12: Are the systematic methods used to eliminate the occurrence of
errors?
Interview with the foreman Question 1: How do you see the new way of presenting information?
Question 2: Can you understand the goal at the white board?
Question 3: Are the goal measured regularly and are these measures available to the
shop floor personnel?
Question 4: Is the fulfillment of the goals connected to any kind of reward?
Question 5: Is a standardized work method used and is it documented?
Answer: Yes, it is.
Question 7: Is the information about goal achievement understandable?
Question 8: Do you have knowledge to do all work tasks on the shop floor?
Question 9: Are you engaged in the improvement work?
Question 10: Do you have possibility to influence your work?
Interview with the assembly operator Question 1: How do you see the new way of presenting information?
Question 2: Can you understand the goal written at the white board?
Question 3: Are the goal measured regularly and are these measures available to the
shop floor personnel?
Question 4: Is the fulfillment of the goals connected to any kind of reward?
Question 5: Do you have knowledge to do all work tasks on the shop floor?
Question 6: Are you engaged in the improvement work?
Question 7: Do you have possibility to influence you r work?
Question 8: How do you communicate with the management?
Question 9: Is it difficult to work as assembly operator?
Question 10: What do you like more at your work place?