assays to conduct cumulative risk assessments for ... application of pbpk modeling and in vitro...
TRANSCRIPT
1
Application of PBPK Modeling and In Vitro
Assays to Conduct Cumulative Risk
Assessments for Environmental Exposures
Harvey Clewell
Director, Center for Human Health Assessment The Hamner Institutes for Health Sciences
Research Triangle Park, North Carolina, USA

2
PBPK In Vitro Modeling Data
Relationship of Exposure, Biomonitoring
Data, and Health Effects
3
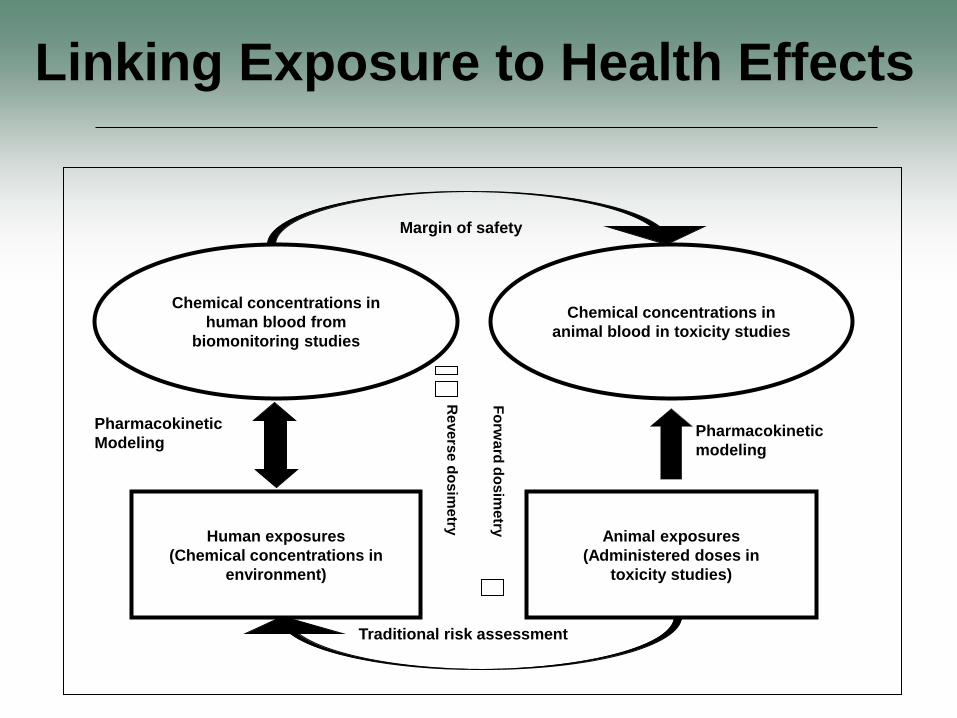
Chemical concentrations in
human blood from
biomonitoring studies
Human exposures
(Chemical concentrations in
environment)
Chemical concentrations in
animal blood in toxicity studies
Animal exposures
(Administered doses in
toxicity studies)
Pharmacokinetic
modeling
Pharmacokinetic
Modeling
Traditional risk assessment
Margin of safety
Fo
rwa
rd d
os
ime
try
Re
ve
rse
do
sim
etry
Linking Exposure to Health Effects

4
Linking Exposure to Health Effects Problems Vary with the Nature of the Chemical
• Volatiles – Complex household exposures
– Rapid clearance • Blood levels highly sensitive to recent exposures
• Highly persistent compounds – Slow approach to steady state
– Apparent clearance confounded by changes in body weight, fat content
• Intermediate persistence compounds – Interpretation depends on rate of clearance
• Need to consider timing of exposures vs. sampling
– May need to deal with active metabolites

5
Linking Exposure to Health Effects Problems Vary with the Nature of the Biomarker
• Active parent chemical / metabolite in blood – Often a good surrogate for target tissue dose
– Directly comparable to blood levels at NOAEL/LOAEL
– Estimation of exposure requires PK modeling
• Inactive parent chemical / metabolite in blood – Any use requires PK modeling
– Not directly comparable to blood levels at NOAEL/LOAEL
• Parent chemical or metabolite in urine – Estimation of exposure (uptake) depends on representativeness
of sample
– Estimation of blood levels requires PBPK modeling

Exposure Reconstruction: An “ILL-Posed Problem” (Many possible solutions)
6
Comparison of PBBK Predicted Comparison of Reconstructed Exposure Blood Concentrations with Conditions with Actual Exposure
Experimental Data Conditions
(Sohn et al., 2004)
Requires population-level, probabilistic approach

7
Monte Carlo Analysis to Simulate Population Exposures (Liao et al. 2007)
Exposure Parameters
Partition
Coefficients
Kinetic
Parameters
Physiological
Parameters KTSD
CI
Fat Tissue
PF CF VF
Rapidly Perfused Tissues
PR CR VR
Slowly Perfused Tissues
PS CS VS
Skin
Gut Tissue
PG CG VG
QCLung
CA
QP CX
QF
QR
QS
QSkn
Liver Tissue
PL CL VL
StomachDuodenum PDOSE
Surface
P
KTD
KASKAD
VMAX, KMKF
CVG
CVL
CVSkn
CVS
CVR
CVF
CV
QC
QG
QL
KTSD
CI
Fat Tissue
PF CF VF
Rapidly Perfused Tissues
PR CR VR
Slowly Perfused Tissues
PS CS VS
Skin
Gut Tissue
PG CG VG
QCLung
CA
QP CX
QF
QR
QS
QSkn
Liver Tissue
PL CL VL
StomachDuodenum PDOSE
Surface
P
KTD
KASKAD
VMAX, KMKF
CVG
CVL
CVSkn
CVS
CVR
CVF
CV
QC
QG
QL
Time of the day
Blood Levels
QSAR
In Vitro
Sampling
8
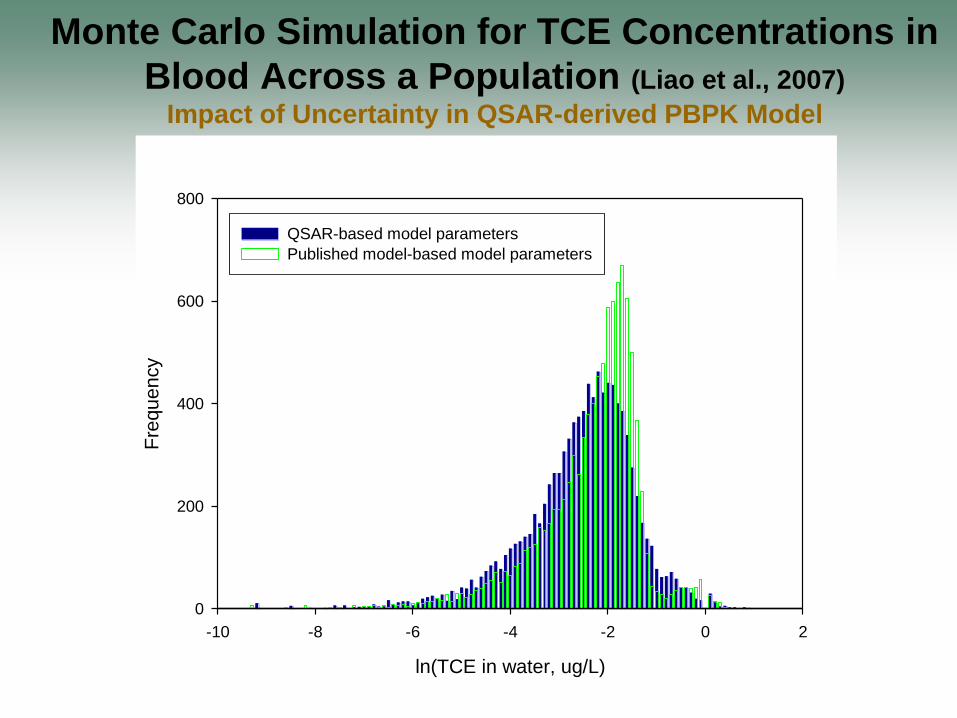
ln(TCE in water, ug/L)
-10 -8 -6 -4 -2 0 2
Fre
qu
en
cy
0
200
400
600
800
QSAR-based model parameters
Published model-based model parameters
Monte Carlo Simulation for TCE Concentrations in
Blood Across a Population (Liao et al., 2007)
Impact of Uncertainty in QSAR-derived PBPK Model

9
0 50 100 150 200 2500
0.005
0.01
0.015
0.02
0.025
0.03
Chloroform level in blood (ppt)
Pro
babili
ty
Probabilistic Reverse Dosimetry Approach (Tan et al., 2006, 2007)
Monte Carlo analysis ppb of chemical in air
or
μg/L of chemical in water
Estimated distribution of
chemical in blood
“Exposure Conversion Factor” distribution
÷ Invert Distribution
Convolute Distributions × Estimated population
exposure distribution
Distribution of measured blood concentrations
10
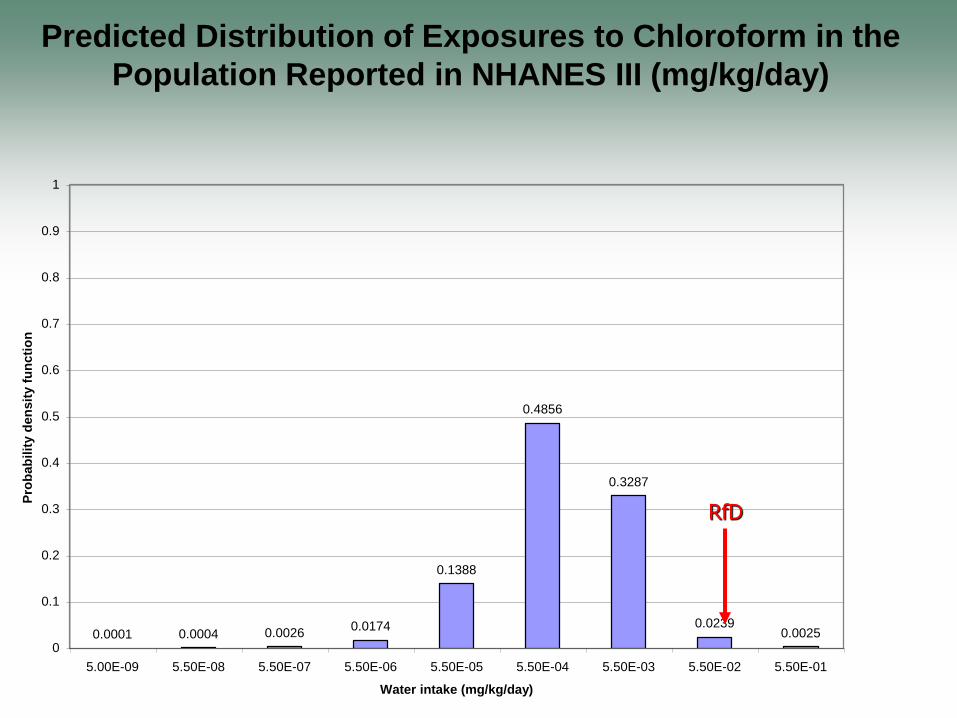
0.0001 0.0004 0.00260.0174
0.1388
0.4856
0.3287
0.02390.0025
0
0.1
0.2
0.3
0.4
0.5
0.6
0.7
0.8
0.9
1
5.00E-09 5.50E-08 5.50E-07 5.50E-06 5.50E-05 5.50E-04 5.50E-03 5.50E-02 5.50E-01
Water intake (mg/kg/day)
Pro
ba
bil
ity
de
ns
ity
fu
nc
tio
n
RfD
Predicted Distribution of Exposures to Chloroform in the Population Reported in NHANES III (mg/kg/day)
11
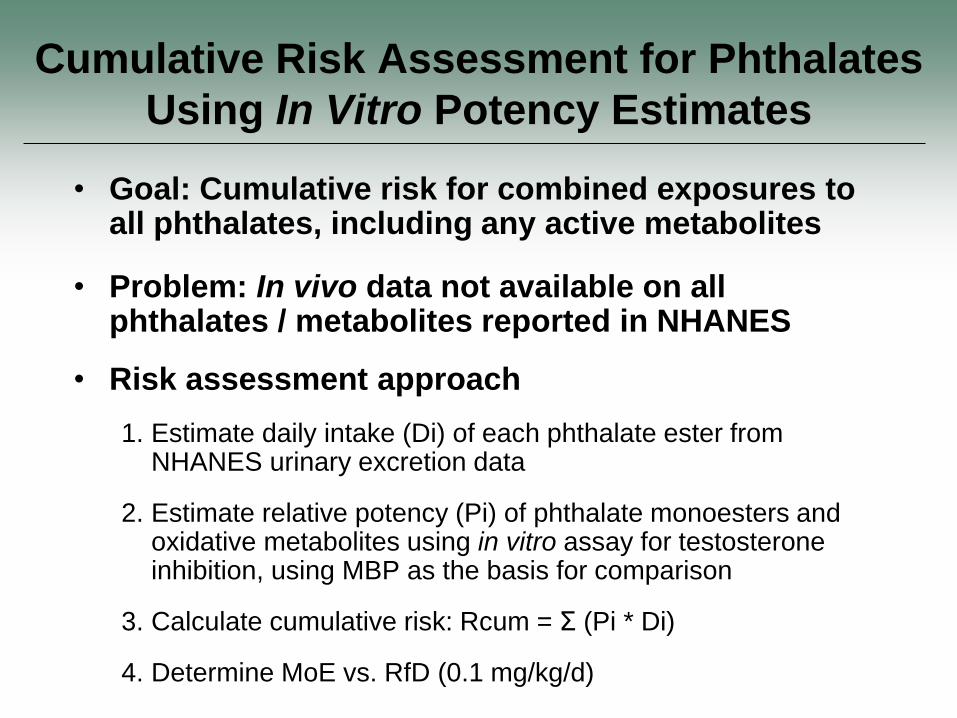
Cumulative Risk Assessment for Phthalates Using In Vitro Potency Estimates
• Goal: Cumulative risk for combined exposures to all phthalates, including any active metabolites
• Problem: In vivo data not available on all phthalates / metabolites reported in NHANES
• Risk assessment approach
1. Estimate daily intake (Di) of each phthalate ester from NHANES urinary excretion data
2. Estimate relative potency (Pi) of phthalate monoesters and oxidative metabolites using in vitro assay for testosterone inhibition, using MBP as the basis for comparison
3. Calculate cumulative risk: Rcum = Σ (Pi * Di)
4. Determine MoE vs. RfD (0.1 mg/kg/d)
12
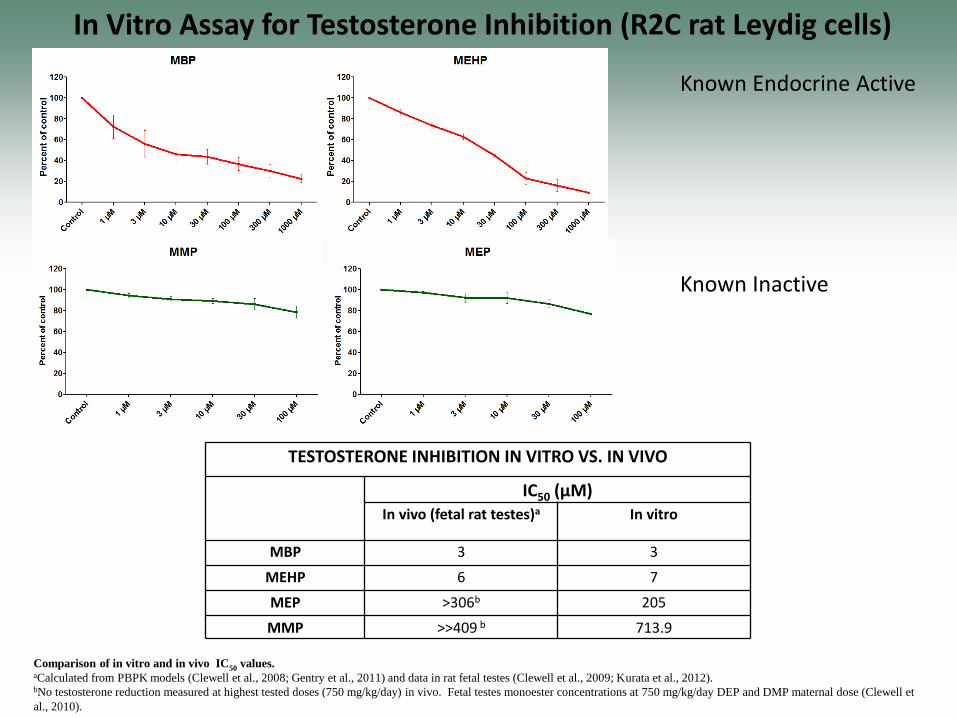
Known Endocrine Active
Known Inactive
In Vitro Assay for Testosterone Inhibition (R2C rat Leydig cells)
TESTOSTERONE INHIBITION IN VITRO VS. IN VIVO
IC50 (µM) In vivo (fetal rat testes)a In vitro
MBP 3 3
MEHP 6 7
MEP >306b 205
MMP >>409 b 713.9
Comparison of in vitro and in vivo IC50 values. aCalculated from PBPK models (Clewell et al., 2008; Gentry et al., 2011) and data in rat fetal testes (Clewell et al., 2009; Kurata et al., 2012). bNo testosterone reduction measured at highest tested doses (750 mg/kg/day) in vivo. Fetal testes monoester concentrations at 750 mg/kg/day DEP and DMP maternal dose (Clewell et al., 2010).

13
Estimating Cumulative Phthalate Risk Concetrati
on in Daily
Relative MBP DBP
% Total
Risk that MoE
COMPOUND Percenti
le Urine
(μg/g
creatinine)
Intake
(μMol/da
y)
spotency
factor
Equivalent
Intake
(μMol/day)
Equivalent
Intake
(mg/kg/day)
results
directly
from DBP
vs RfD = 0.1
(mg/kg/d)
50th % 21.5 0.1016 1 0.1016 Mono butyl phthalate (MBP)
95th % 91.5 0.4323 1 0.4323
Mono-2-ethylhexyl phthalate 50th % 4.43 0.0167 0.53 0.0089
(MEHP) 95th % 35.1 0.1324 0.53 0.0702
50th % 17.6 0.0628 0.194 0.0122 5-hydroxy MEHP
95th % 160 0.5708 0.194 0.1107
50th % 12.5 0.0449 0.029 0.0013 5-oxo MEHP
95th % 92.3 0.3315 0.029 0.0096
50th % 171 0.9255 0.0145 0.0134 Mono-ethyl phthalate (MEP)
95th % 1430 7.7397 0.0145 0.1122
Mono-methyl phthalate 50th % 1.45 0.0085 0.0042 0.0000
(MMP) 95th % 10 0.0583 0.0042 0.0002
Mono (2-octyl) phthalate 50th % < LOD 0.125 0.0000
(MnOP) 95th % 3.1 0.0117 0.125 0.0015
Mono benzyl phthalate 50th % 15.1 0.0714 0.109 0.0078
(MBzP) 95th % 95.8 0.4531 0.109 0.0494
50th %ile 1480.1452 0.00067 70%
Total: 95th %ile 280.7861 0.00365 55%

14
Cumulative Risk Assessment for Phthalates Using PBPK Modeling and Reverse Dosimetry
• Goal: Cumulative risk for exposures to all phthalates, including any active metabolites
• Difficulty: – Exposure estimates are based on urinary concentrations of
total monoester (free plus glucuronide)
– Appropriate dose metric for health effects is free blood concentrations of all active compounds (monoesters and their active metabolites)
• Role of PBPK model: – Relate of total monoester urine concentrations to blood
concentrations of free monoester
– Estimate maternal exposure from NHANES data (reverse dosimetry) and predict associated fetal exposure (forward dosimetry)

15
DBP/DEHP Model Structure
R. Clewell et al. 2008
16
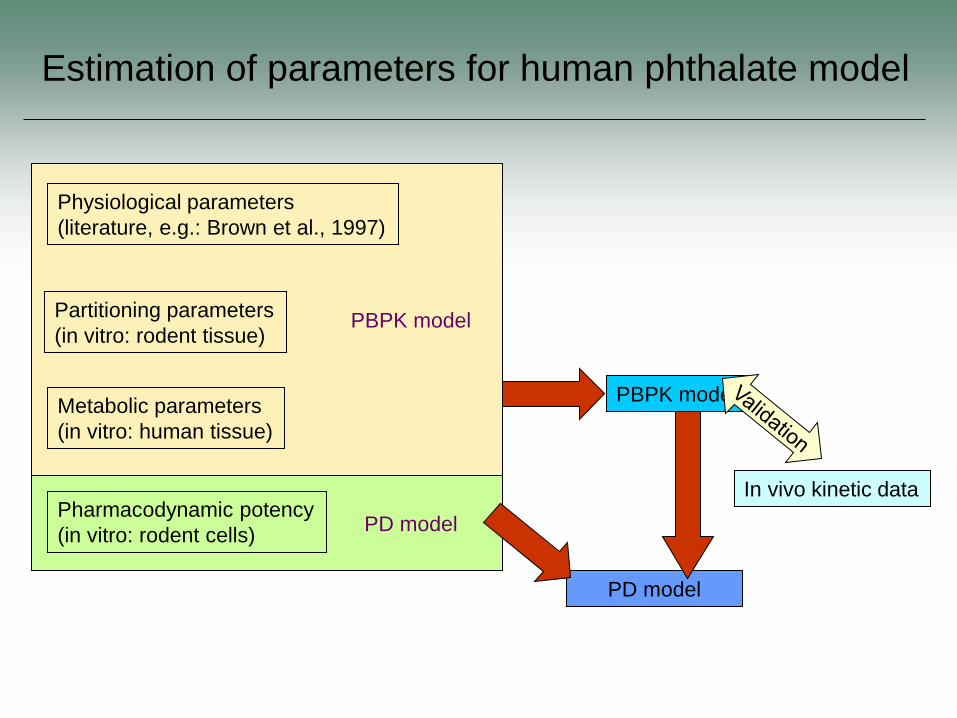
Estimation of parameters for human phthalate model
PD model
PD model
PBPK model
Physiological parameters
(literature, e.g.: Brown et al., 1997)
Partitioning parameters
(in vitro: rodent tissue)
Metabolic parameters
(in vitro: human tissue)
Pharmacodynamic potency
(in vitro: rodent cells)
PBPK model
In vivo kinetic data
17
17
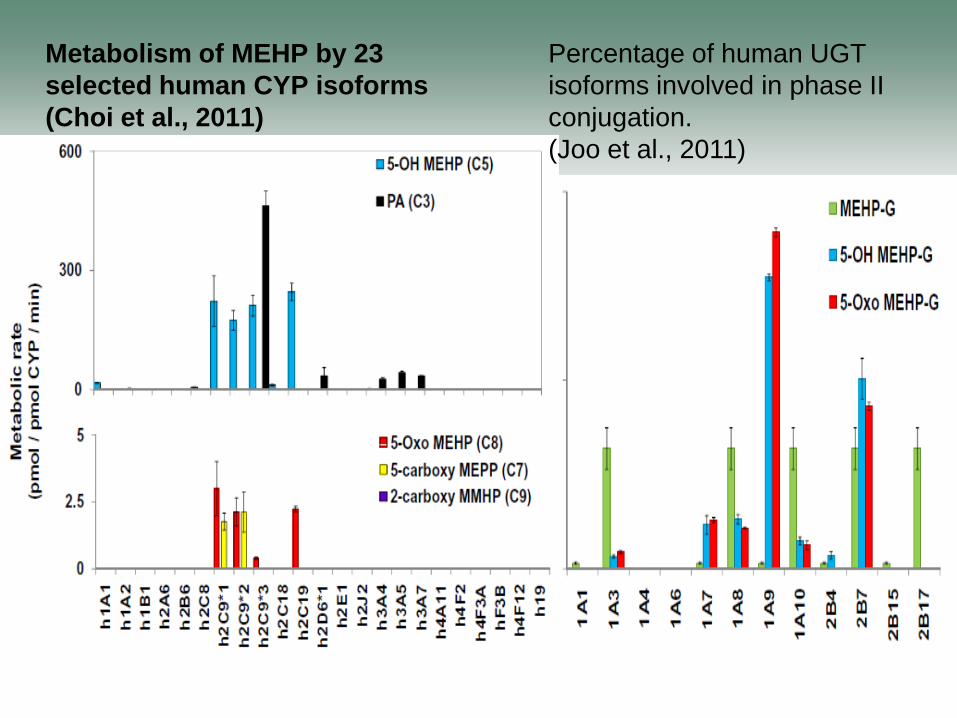
Metabolism of MEHP by 23
selected human CYP isoforms
(Choi et al., 2011)
Percentage of human UGT
isoforms involved in phase II
conjugation.
(Joo et al., 2011)

18
Simulations of 60 exposure concentrations - 0.01 to 10
µg/kg
Exposures - oral bolus (i.e., ingestion of food) occurring
over 15 min
Urine and amount of MBP accumulated for random
lengths of time beginning just prior to ingestion of meal
to 3 h post exposure
Sampling times varied from 0.5 to 3 h post last
elimination event
1,000 iterations were accumulated at each exposure
concentration
Reverse Dosimetry
19
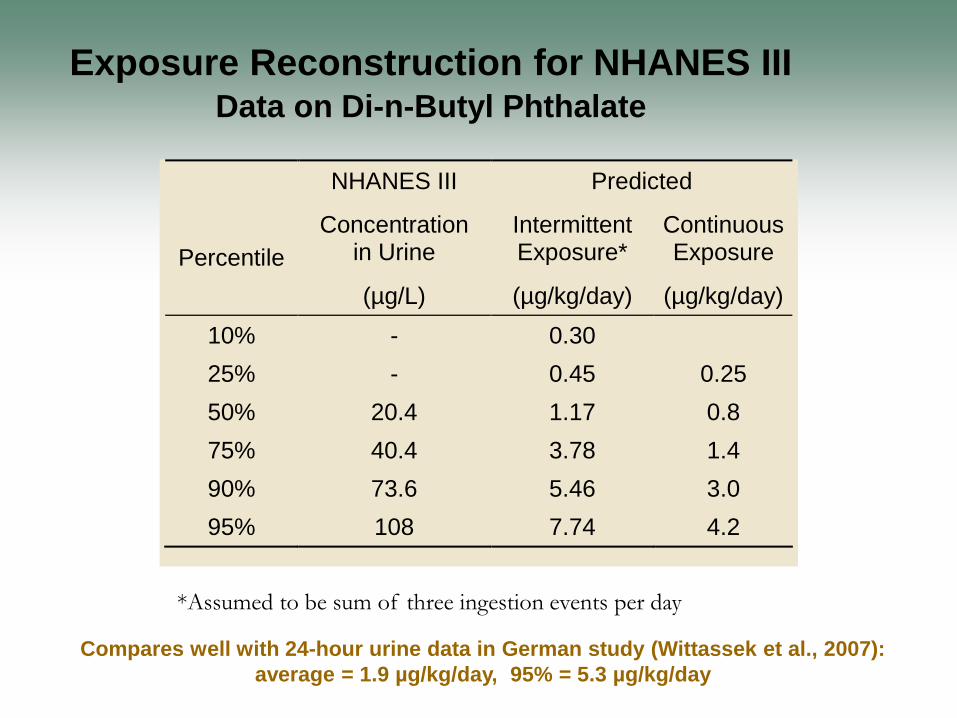
Exposure Reconstruction for NHANES III Data on Di-n-Butyl Phthalate
NHANES III Predicted
Percentile
Concentration in Urine
Intermittent Exposure*
Continuous Exposure
(µg/L) (µg/kg/day) (µg/kg/day)
10% - 0.30
25% - 0.45 0.25
50% 20.4 1.17 0.8
75% 40.4 3.78 1.4
90% 73.6 5.46 3.0
95% 108 7.74 4.2
*Assumed to be sum of three ingestion events per day
Compares well with 24-hour urine data in German study (Wittassek et al., 2007):
average = 1.9 µg/kg/day, 95% = 5.3 µg/kg/day

*Total consists of free MBP and conjugated MBP expressed as
MBP.
20
Daily
Exposure (µg/kg/day)
Maternal Blood
Maternal Blood Total
Fetal Blood Fetal
Testes Amniotic
Fluid Urine
Mean 1.885 0.32 0.52 0.21 0.073 2.02 44.8
Std. Deviation 2.038 0.34 0.55 0.27 0.096 6.87 61.7
CV % 108.1% 108.2% 106.8% 125.8% 131.2% 340.2% 137.7%
Confidence Interval of the Mean
Lower 95% 1.872 0.316 0.51 0.21 0.073 1.98 44.5
Upper 95% 1.897 0.32 0.52 0.22 0.074 2.06 45.2
Percentile 6.38
5th 2.54 0.01 0.02 0.008 0.003 0.003 0.32
25th 1.27 0.08 0.11 0.04 0.017 0.02 7.5
50th 0.51 0.21 0.32 0.12 0.043 0.086 23.9
75th 0.1 0.43 0.76 0.29 0.09 0.2 56.3
95th 1.27 1.00 1.62 0.73 0.25 20.55 167.2
Minimum 0.0025 0.0002 0.0004 0.00005 0.00001 0.00003 0.019
Maximum 10.1 3.96 5.21 3.34 1.48 66.1 732.1
Forward dosimetry analyses with the human
pregnancy PBPK model for DBP
- Based on 100,000 iterations using the reverse dosimetry output
21
Comparison of mono-butyl phthalate concentration in
maternal and fetal tissues in the rodent at the NOAEL
(10 mg/kg/day, Lehmann et al., 2004) and the human at
95th percentile determined in the forward dosimetry.
22
Acknowledgements
Hamner colleagues
Rebecca Clewell – phthalate PBPK model development
– phthalate in vitro assay development
Jerry Campbell – human phthalate PBPK modeling
Pergentino Balbuena – phthalate in vitro assay
Cecilia Tan – reverse dosimetry approach (now at EPA)
Funding
ACC – reverse dosimetry, PBPK model for DBP, in vitro phthalate assay
CCC – trihalomethane reverse dosimetry
EPA NCER STAR Grant – cumulative risk assessment for phthalates