aspi experiment: measurements of fields and waves on board the
TRANSCRIPT

ASPI experiment: measurements of ®elds and waveson board the INTERBALL-1 spacecraft
S. Klimov1, S. Romanov1, E. Amata2, J. Blecki3, J. BuÈ chner4, J. Juchniewicz3, J. Rustenbach4, P. Triska5, L. J.C.Woolliscroft6, S. Savin1, Yu. Afanas'yev7, U. de Angelis13, U. Auster4, G. Bellucci2, A. Best15, F. Farnik5, V.Formisano2, P. Gough8, R. Grard9, V. Grushin1, G. Haerendel4,14, V. Ivchenko16, V. Korepanov1, H. Lehmann11, B.Nikutowski4, M. Nozdrachev1, S. Orsini2, M. Parrot12, A. Petrukovich1, J. L. Rauch12, K.Sauer4, A. Skalsky1, J.Slominski3, J. G. Trotignon12, J. Vojta5, R. Wronowski3
1 Space Research Institute, Russian Academy of Sciences, Moscow, Russia2 Interplanetary Space Physics Institute, CNR, Frascati, Italy3 Space Research Center, Polish Academy of Sciences, Warsaw, Poland4 Max-Planck-Institut fuÈ r extraterrestrische Physik, Auûenstelle Berlin, Germany5 Institute of atmospheric physics, Academy of Sciences of Czech Republic, Praha, Czech Republic6 Department of Automatic Control and Systems Engineering, She�eld University, She�eld, UK7 Institute of Metrology, St. Peterburg, Russia8 Sussex Space Centre, Falmer, UK9 Space Science Department, ESA, Noordwijk, The Netherlands
10 Special Design Division, Ukrainian Academy of Sciences, Lviv, Ukraine11 Institute for Space Sensors, DLR, Berlin, Germany12 Laboratory of Physics and Chemistry of the Environment, CNRS, Orleans, France13 University of Naples, Naples, Italy14 Max-Planck-Institut fuÈ r extraterrestrische Physik, Garshing, Germany15 Geoforschungszentrum Potsdam, Auûenstelle Observatorium Niemegk, Germany16 Kiev University, Kiev, Ukraine
Received: 14 March 1996/Revised: 14 January 1997/Accepted: 28 January 1997
Abstract. The plasma-wave experiment ASPI (analysisof spectra of plasma waves and instabilities) on boardthe INTERBALL spacecraft is a combined wave diag-nostics experiment. It performs measurements of the DCand AC magnetic ®eld vector by ¯ux-gate and search-coil sensors, the DC and AC electric ®eld vector byLangmuir double probes and the plasma current byLangmuir split probe. Preliminary data analysis showsthe low noise levels of the sensors and the compatibilityof new data with the results of previous missions.During several months of in-orbit operation a richcollection of data was acquired, examples of which atthe magnetopause and plasma sheet are presented insecond part of the paper.
1 Scienti®c objectives
The INTERBALL project is orientated towards theinvestigation of the interaction between di�erent partsof the magnetosphere in relation to changes in the solar
wind and ionosphere. First INTERBALL-1 orbitspassed through the solar wind, bow shock, magneto-sheath and magnetopause regions. Several months laterthe orbit apogee shifted to the near-Earth magnetotail,so that INTERBALL-1 observed the tail lobes and theplasma sheet. These orbit parameters allow the neutralsheet region to be studied for several hours.
Plasma waves and ¯uctuations play a crucial role inthe highly collisionless space plasma. Waves and ¯uctu-ations are of particular importance at the plasmaboundaries such as bow shock, magnetopause, neutralsheet, and plasma sheet boundary layer. Wave-particle,interactions in the plasma result in processes like: (1)anomalous transport (pitch-angle and spatial di�usion,conductivity, viscosity); (2) energy redistribution andplasma heating; (3) generation of anisotropic distribu-tion functions and their relaxation; (4) triggering oflarge-scale instabilities.
The speci®c objectives of the ASPI wave and ®eldexperiment on board INTERBALL-1 are:
1. The study of the ¯uctuation characteristics in di�erentregions of the magnetosphere and the use of these data ashigh-time-resolution indicators of plasma phenomena.2. The determination of the micro-scale plasma char-acteristics (e.g. di�usion and anomalous transportcoe�cients, wave-wave and wave-particle coupling).Correspondence to: S. Klimov
Ann. Geophysicae 15, 514 ±527 (1997) Ó EGS±Springer-Verlag 1997

3. The study of temporal and spatial variations ofmacroscopic and quasi-static ®elds and plasma driftmotions.4. Comparative measurements with the nearby ¯yingsubsatellite and the satellite-sub-satellite combination ofthe INTERBALL-2.
2 Experiment description
In the following section and in tables all X, Y, Z vectorcomponents refer to the spacecraft frame of reference(Fig. 1).
2.1 ASPI background and overview
The ASPI (analysis of spectra of plasma waves andinstabilities) experiment is based on the method ofcombined wave diagnostics (CWD). This technique wasused on the PROGNOZ-8,10 spacecraft (Aleksevichet al., 1983; Klimov et al., 1986), Vega-1,2 (Klimov et al.,1987), Phobos-1,2 (Grard et al., 1989) and has parallelswith the S300/Geos and WEC/Cluster collaborations.The method is substantially extended in ASPI andincludes:
1. The conduction of simultaneous measurements ofelectric ®eld, magnetic ®eld, plasma current, spacecraftpotential and cold plasma density.2. The use of the identical signal processing for allmeasured parameters.3. The possibility to change the time-frequency resolu-tion of measurements depending on the mode oftelemetry system.
The ASPI experiment on board INTERBALL-1 isthe plasma wave consortium and is composed of severalinstruments. A more extensive description of the exper-iment can be found elsewhere (Klimov et al., 1995).Locations of the ASPI sensors are in Fig. 1. Basictechnical characteristics of the instruments and sensors
are in Table 1. Description of the ASPI sensors andscheme of on-board processing is in the coming subsec-tions. Analogue ASPI outputs are listed in Table 4.
Fig. 1. Sketch of the INTERBALL-1spacecraft: +X direction is pointing tothe Sun; dimensions are in mm. ASPIsensors are shown
Table 1. Composition of the ASPI experiment
Instrumentblock
Description
MIF-M Magnetic ®eld measurementsBPP Three-component ¯ux-gate sensor
±Frequency range 0±25 Hz±Sensitivity 0.005 nT (waveform)0.2 nT (DC ®eld)
DM2 Search coil sensor±Frequency range 1 Hz±40 kHz±Sensitivity 0.2 nT (1 Hz)0.004 nT (10 Hz)0.0004 nT (100 Hz)
EB-M Electronic box with:Filter bank (7 ®lters)DC/DC converter
PRAM Digital waveform processorOPERA Electric ®eld investigationBD1..6 Three double probe sensors
±Frequency range 0±150 kHz±Sensitivity 10ÿ8V/m=
�������Hzp
OES Electronic box with:Filter bank (24 ®lters)DC/DC converter
FGM-I Flux-gate magnetometerDM1 Three-component ¯ux-gate sensor
±Frequency range 0±25 Hz±noise level 0.005 nT at 1 Hz±Dynamic range/Resolution128 nT/1.0 nTand one-component split probe±Frequency range 0.1±40 000 Hz±Sensitivity 10ÿ15A/cm2=
�������Hzp
BE-DM1 Electronic box with:analogue electronicsand DC/DC converter
S. Klimov et al.: ASPI experiment: measurements of ®elds and waves on board the INTERBALL-1 spacecraft 515

Digital ASPI outputs are described in Table 2. In thissection and in the tables Bx;y;z and ~Bx;y;z stand for DCand AC magnetic ®eld signals; Ex;y;z and ~Ex;y;z stand forDC and AC electric ®eld signals; Iz stands for theplasma current signal.
ASPI instruments are now brie¯y described.
1. MIF-M (Russia, PI: S. Romanov). The MIF-Minstrument consists of the ¯ux-gate (BPP) and search-coil (DM2) sensors, analogue electronics boards withlowpass and highpass ®lters, ®lter bank with sevenanalogue passband ®lters, A/D converter andDC/DC converter.2. OPERA (Italy, PI: E. Amata). OPERA is the electric®eld instrument, including six spherical Langmuirprobes with the preampli®ers, mounted on the boomsand the electronic subsystem with analogue, digitalelectronics, A/D converter and DC/DC converter.Analogue electronics include preampli®ers, lowpassand highpass ®lters and ®lter bank with bandpass ®lters.Digital electronics perform calculations of the FFTspectra, collection of housekeeping data and digitaltelemetry frame formatting.3. FGM-I (Germany, PI: J. Rustenbach). The magne-tometer FGM-I consists of the three-axial ¯ux-gatesensor, the plasma current sensor and the electronic boxall mounted on the boom (marked in Fig. 1 as DM1).The electronic box contains two printed boards with theanalogue and drive electronics, the preampli®er of thecurrent probe, the temperature sensor and the DC/DC-converter.4. PRAM (Czech Rep. PI: S. Romanov). PRAM is thedigital waveform processor unit. It drives the A/Dconverters in MIF-M, accepts digital signals from MIF-M and processes them to ®t the given bit rate. Accordingto the mode of operation, the on-board algorithmperforms the selection between ampli®cation ranges,averaging of DC ®eld and ®lter data, decimation of theAC data and formatting of the telemetry frames. Framesare transmitted to the digital telemetry system. Burstmodes, switched on by the event selection algorithm, arepossible with a bu�er size equivalent to about 4 min ofthe prehistory information in the fastest mode. Thedescription of the parameters processed by PRAM is inTable 2.
One more plasma current sensor is installed on boardthe subsatellite MAGION-4. Close collaboration withthe subsatellite wave experiment is performed duringperiods of simultaneous measurements. This provides agood opportunity for advanced data analysis.
Unfortunately, two more ASPI instruments (ADS,Poland, PI: J. Juchniewicz, J. Blecki and IFPE, Germa-ny, PI: J. BuÈ chner) failed to switch on, likely due tohardware problems.
2.2 ASPI sensors
2.2.1 Flux-gate sensors (in MIF-M and FGM-I)
The ¯ux-gate sensors of the MIF-M (BPP) and ofFGM-I (DM1) instruments consist of three identical¯ux-gate core rings, forming a right orthogonal systemwith ®xed orientation with respect to the spacecraftbody. They are mounted on the end of the boom 11 m(BPP) and 6.5 m (DM1) apart from the spacecraft spinaxis (Fig. 1). They form the second, in addition to theFM3-I experiment (Nozdrachev et al., 1995), dual mag-netometer system.
Signals from the BPP components are divided intotwo frequency ranges 0±2 Hz and 2±25 Hz (DC and ACchannels). These signals are transmitted to PRAM indigital form and in the analogue form directly tospacecraft telemetry system. The signal from one ofthe components (selected by telecommand) is processedalso by MIF-M ®lter bank. The signal from the DM1sensor is transmitted in analogue form to the spacecrafttelemetry system.
2.2.2 Search-coil sensor (in MIF-M)
The search-coil sensor of MIF-M (DM2) performs one-component measurements of the AC magnetic ®eldalong the spacecraft Z-axis (Fig. 1) in the broadfrequency range (Table 1). It is mounted on the boomtogether with its preampli®er. The analogue signal fromthe sensor is transmitted to the telemetry system andprocessed by the ®lter bank in MIF-M.
2.2.3 Langmuir split probes (in FGM-I and on theMAGION-4)
The current sensors consist of two collectors, separatedby a thin (some millimeters) insulator (Bering et al.,1973b). This method was ®rst used in the rocketexperiments (Bering et al., 1973a, b) in order to deter-mine quasi-stationary current ¯ows. The experiment,however, showed a high level of parasitic e�ects, such asphoto-emission. This is not so much a problem for theAC measurements which were implemented on thePROGNOZ-10 spacecraft. The analysis of results of thePROGNOZ-10 wave experiment (Vaisberg et al., 1989;Romanov et al., 1991) has provided evidence that directmeasurements of the current ¯uctuations in the colli-sionless rare®ed plasma by means of split probes arepossible and can be used for plasma wave diagnostics.
On board the INTERBALL-1 the current sensor isintegrated in the FGM-I instrument: the cylindricalsensor itself is part of the FGM-I instrument and its
Table 2. ASPI parameters transmitted via PRAM in the digitalform
Physicalparameter
Frequencyrange, Hz
Measuredrange
Sampling rate (Hz) inmodes slow/normal/fast/superfast
Bx;y;z 0±2 0.3±300 nT 0.05/1/4/4~Bx;y;z 2±25 0.005±30 nT ±/±/32/647 ®lters see Table 3 ± 0.008/0.0625/4/±
516 S. Klimov et al.: ASPI experiment: measurements of ®elds and waves on board the INTERBALL-1 spacecraft

analogue signal is transmitted to the telemetry systemand to the MIF-M ®lter bank. On board the subsatellite,a two-component spherical current sensor is one of theinputs of the SAS instrument.
2.2.4 Electric ®eld sensors (in OPERA)
The electric ®eld experiment includes six sphericalLangmuir probes with the preampli®ers (BD1-BD6),mounted on the booms (Fig. 1). The long dipole BD1-BD2 (Ey) has the length 22.68 m. Two shorter dipolesBD3-BD4 and BD5-BD6 (Ez and Ex, respectively) are4.4 m long. The Ey signal input can be switched to thepairs BD3-BD5 and BD4-BD6 if necessary. The OP-ERA instrument can perform both potential di�erenceand single-probe potential measurements. In the lattercase probe potential is measured with respect to thespacecraft ground. All probes can be biased by theelectric current in the range �100 lA. The bias currentsweep can be performed to measure the Volt-AmpeÁ recharacteristic of the probe. An estimation of thespacecraft potential is necessary for correct plasmaand ®eld measurements and can be performed using thesweep of the bias current.
Techniques of the DC and AC electric ®eld measure-ments in the magnetosphere are discussed by Grard etal. (1986), Fahleson (1967), Tunally (1970) and checked-in-space experiments by Gurnett (1972), Mozer (1983),Aleksevich et al. (1983), Klimov et al. (1986, 1987),Grard et al. (1989).
The analogue electric ®eld signal is transmitted to thetelemetry system in two frequency ranges 0±3 and 0.1±25Hz (DC and AC channels). The full frequency rangesignal is processed by the OPERA ®lter bank.
2.3 On-board data handling
On-board ASPI data handling algorithms include:
1. Filter-bank spectral analysis of the magnetic ®eldand plasma current signal in MIF-M (Table 3). Inputsof the ®rst two ®lters can be switched by telecommandto any magnetic ®eld component, measured by MIF-M¯ux-gate sensor. Inputs of the remaining ®ve ®lters canbe switched between the signal from the search-coilsensor in MIF-M and the signal from the plasma currentsensor in FGM-I.
2. FFT (1±32 Hz) and ®lter bank (0.005±150 kHz)spectral analysis of the electric ®eld signal in OPERA.This information is available for some limited periods.3. All analogue ASPI outputs are transmitted to thespacecraft telemetry system (Table 4). Then they aredigitized at a bit rate, determined by the telemetryoperational mode. The real-time transmission modeprovides a total bit rate of all ASPI analogue data equalto 16 kbit/s. The duration of the real-time transmissionis 2±3 h every 2±4 days. Analogue data can also berecorded on the on-board tape-recorder at a lowsampling rate (10±15 Mbit are available). As all ASPIanalogue signals are digitized by one A/D converter,inter-comparison of the waveform data from di�erentASPI instruments can be easily performed.4. Digital telemetry frames formatted by PRAM aretransmitted to the telemetry system. These framesinclude DC and AC magnetic ®eld waveforms and®lter-bank spectra measured by MIF-M (Table 2).OPERA housekeeping data and electric ®eld spectraare also formatted in the digital telemetry frames andtransmitted to the telemetry system. About 200 Mbit ofthe on-board memory are available for the digital ASPIdata between memory dumps (once every 2±4 days).5. Waveform signals from both INTERBALL-1 andMAGION-4 current sensors can be transmitted also tothe modulators of the spacecraft radio transmitters.That permits the performance of the dual-point high-resolution measurements up to a frequency of about 1kHz. During this mode of operation, signals from bothtransmitters are accepted by one tracking station.
2.4 Ground data handling
Ground handling of ASPI data includes several stages:
1. Preparation of the quick-look data with the delay 1±2 days for the purpose of experiment control.2. Preparation of the key physical parameters. Thefollowing values measured by ASPI are included in thelist of parameters of the INTERBALL project: vectorand total value of DC magnetic ®eld in GSE and GSMframes of reference and amplitudes of magnetic ®eld¯uctuations in the frequency ranges 1±4 and 600±800 Hz.
Table 3. Filters in MIF-M
Sensor Frequency rangeHz
BPP 1.......4BPP 20......30DM2/DM1 20......30DM2/DM1 120.....150DM2/DM1 350.....450DM2/DM1 600.....850DM2/DM1 1900....2100
Table 4. ASPI parameters transmitted to the spacecraft telemetrysystem in the analogue form
Device/sensor Physical Frequency Measured Samplingparameter range, Hz range rate, Hz
MIF-M/BPP Bx;y;z 0±2 0.3±37.5 nT 8~Bx;y;z 2±25 0.005±30 nT 64
MIF-M/DM2 ~Bz 0.1±500 4 � 10ÿ6 ÿ 1 256nT=
�������Hzp
OPERA/BD1±6 Ex;y;z 0±3 1±570 mV/m 8±16~Ex;y;z 0.1±25 0.9±115 m V/m 64±128
FGM±I/DM1 Bx;y;z 0±25 1±128 nT 64Iz 0.1±500 10)14±10)10 1000
A/cm2=�������Hzp
S. Klimov et al.: ASPI experiment: measurements of ®elds and waves on board the INTERBALL-1 spacecraft 517
Key parameters are distributed to all INTERBALLparticipants.3. Preparation of ASPI data bank on optical disksand/or digital tapes and distribution to all membergroups of the ASPI team.
3 First results
ASPI instruments OPERA and MIF-M were switchedon after the booms were deployed at 12:59 UT on 3August 1995. The INTERBALL-1 spacecraft was at thistime in the magnetosheath just outside the magneto-pause on the outbound part of its ®rst orbit. Theinformation was dumped via the analogue telemetrysystem. On 5 August 1995 the PRAM and OPERAinstruments started digital data transmission. On 6August 1995 the FGM-I magnetometer was switchedon. In this section we present initial results of the ASPIobservations.
In the following, in order to di�erentiate between thesimilar notations of the X, Y, Z components in thespacecraft and GSE frames of reference, GSE compo-nents are implied only if explicitly stated. The GSEframe of reference is used only for the DC magnetic andelectric ®eld data in the discussions of particularcrossings. In all other cases (while discussing sensorperformance or speaking about AC waveforms andspectra) the spacecraft frame of reference is implied.
3.1 Performance of ASPI sensors
We describe the background signal levels and sensornoise levels. We also perform a comparison of theINTERBALL-1 data with that from the previousmissions at the rather well-studied plasma boundary ±the bow shock. The detailed analysis of the measure-ment methods and the spacecraft interferences will begiven in the future papers.
3.1.1 Magnetic ®eld measurements
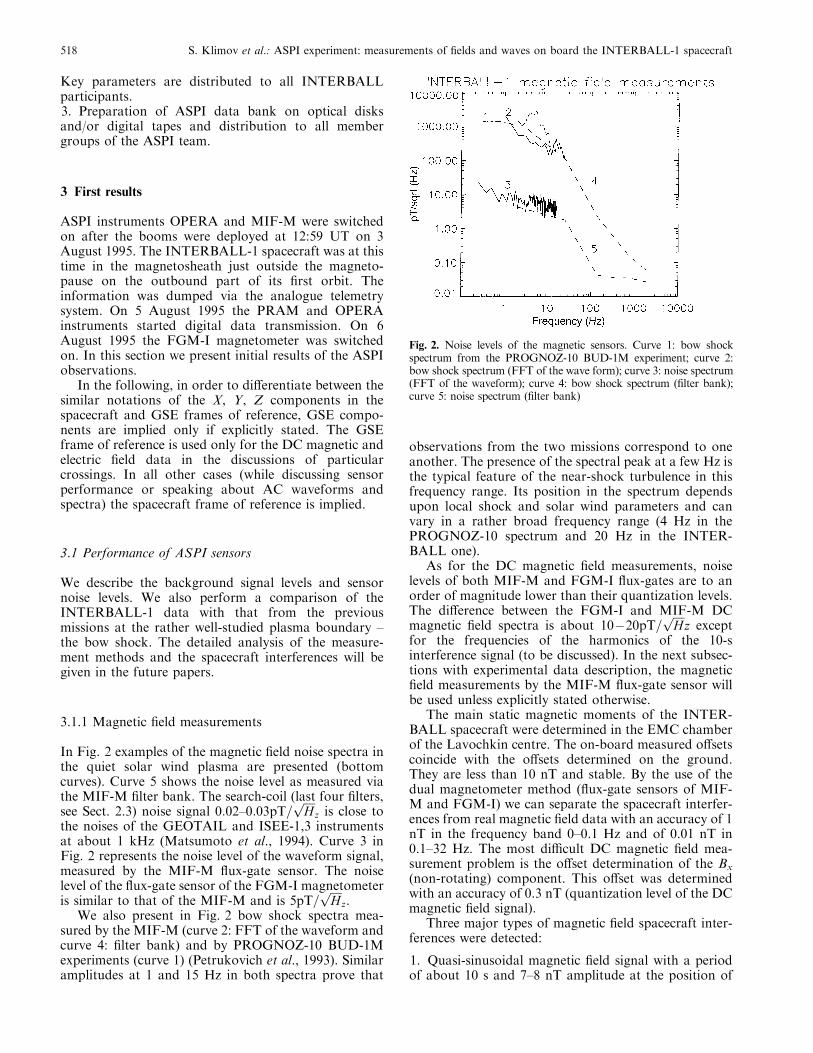
In Fig. 2 examples of the magnetic ®eld noise spectra inthe quiet solar wind plasma are presented (bottomcurves). Curve 5 shows the noise level as measured viathe MIF-M ®lter bank. The search-coil (last four ®lters,see Sect. 2.3) noise signal 0:02±0:03pT=
����Hp
z is close tothe noises of the GEOTAIL and ISEE-1,3 instrumentsat about 1 kHz (Matsumoto et al., 1994). Curve 3 inFig. 2 represents the noise level of the waveform signal,measured by the MIF-M ¯ux-gate sensor. The noiselevel of the ¯ux-gate sensor of the FGM-I magnetometeris similar to that of the MIF-M and is 5pT=
����Hp
z.We also present in Fig. 2 bow shock spectra mea-
sured by the MIF-M (curve 2: FFT of the waveform andcurve 4: ®lter bank) and by PROGNOZ-10 BUD-1Mexperiments (curve 1) (Petrukovich et al., 1993). Similaramplitudes at 1 and 15 Hz in both spectra prove that
observations from the two missions correspond to oneanother. The presence of the spectral peak at a few Hz isthe typical feature of the near-shock turbulence in thisfrequency range. Its position in the spectrum dependsupon local shock and solar wind parameters and canvary in a rather broad frequency range (4 Hz in thePROGNOZ-10 spectrum and 20 Hz in the INTER-BALL one).
As for the DC magnetic ®eld measurements, noiselevels of both MIF-M and FGM-I ¯ux-gates are to anorder of magnitude lower than their quantization levels.The di�erence between the FGM-I and MIF-M DCmagnetic ®eld spectra is about 10ÿ20pT= ����
Hp
z exceptfor the frequencies of the harmonics of the 10-sinterference signal (to be discussed). In the next subsec-tions with experimental data description, the magnetic®eld measurements by the MIF-M ¯ux-gate sensor willbe used unless explicitly stated otherwise.
The main static magnetic moments of the INTER-BALL spacecraft were determined in the EMC chamberof the Lavochkin centre. The on-board measured o�setscoincide with the o�sets determined on the ground.They are less than 10 nT and stable. By the use of thedual magnetometer method (¯ux-gate sensors of MIF-M and FGM-I) we can separate the spacecraft interfer-ences from real magnetic ®eld data with an accuracy of 1nT in the frequency band 0±0.1 Hz and of 0.01 nT in0.1±32 Hz. The most di�cult DC magnetic ®eld mea-surement problem is the o�set determination of the Bx
(non-rotating) component. This o�set was determinedwith an accuracy of 0.3 nT (quantization level of the DCmagnetic ®eld signal).
Three major types of magnetic ®eld spacecraft inter-ferences were detected:
1. Quasi-sinusoidal magnetic ®eld signal with a periodof about 10 s and 7±8 nT amplitude at the position of
Fig. 2. Noise levels of the magnetic sensors. Curve 1: bow shockspectrum from the PROGNOZ-10 BUD-1M experiment; curve 2:bow shock spectrum (FFT of the wave form); curve 3: noise spectrum(FFT of the waveform); curve 4: bow shock spectrum (®lter bank);curve 5: noise spectrum (®lter bank)
518 S. Klimov et al.: ASPI experiment: measurements of ®elds and waves on board the INTERBALL-1 spacecraft

the FGM-I ¯ux-gate sensor (Fig. 1). It is practicallyundetectable at the position of the MIF-M ¯ux-gatesensor on the same boom. Due to the rather stablephase, this interference can be easily extracted from thedata with the use of FFT ®ltering.2. Spurious magnetic ®eld bursts radiated by the space-craft heating system in the range 1±2000 Hz. Theseimpulses have a characteristic appearance in the ®lter-bank data.3. Quasi-periodic interference with a frequency ofabout 80 Hz at the search-coil sensor location. Itsamplitude reaches about 10% of the natural magnetic®eld waveform amplitudes.
3.1.2 Electric ®eld measurements
In Fig. 3 we present the noise levels and characteristicsignals of the electric ®eld measurements. Curves 3 and6 correspond to the background electric ®eld spectrameasured by the OPERA instrument in the solar wind.Curve 6 represents the ®lter-bank spectrum of thesignal from the BD1-BD2 dipole (22 m). The numbersare close to that of the PROGNOZ-8 17-m dipolenoise (Aleksevich et al., 1983). Curve 3 represents theOPERA on-board fast Fourier transform (FFT) spec-trum summed over three components. Comparing thesetwo curves, one should take into account the lesssensitive quantization level of the FFT and a possibleoverestimate of the electric ®eld by the shorter lengthdipoles, spectra of which are summed in the FFToutput.
Curve 1 in Fig. 3 shows the on-board FFT spectrumdetected at the quasi-perpendicular bow shock on 7
August 1995 at 08:34 UT. Comparison with the PRO-GNOZ-8 bow shock spectrum [curve 2 in Fig. 3 (No-zdrachev et al., 1995)] proves that as in the case of themagnetic ®eld spectra, ASPI ELF measurements arecompatible with the results of previous electric ®eldexperiments. The OPERA ®lter-bank spectrum at thesame shock is shown as curve 4 (Fig. 3). It is interferedwith by one of the spacecraft transmitters at 40±60 kHz(this peak is extracted in the Figure), which reduces theelectric ®eld amplitude due to the saturation of the ®lter-bank preampli®er. The plateau at the frequences 0.2±4kHz is characteristic of the ion-acoustic waves at thequasi-perpendicular shocks.
An example of the upstream electric ®eld spectrafrom the long dipole (curve 5) exhibits a well-de®nedpeak at the Langmuir frequencies. Such peaks are oftenregistered in the electron foreshock of quasi-perpendic-ular shocks. Its amplitude (0.02 mV/m/
����Hp
z) is muchstronger than the average one, measured by the ISEE-1(Etcheto and Faucheux, 1984) and IMP-6 (Filbert andKellogg, 1979) long antennas, but is close to the typicalshort-dipole measurements on Phobos-1,2 (Trotignonet al., 1991). Taking into account typical wavelengths ofLangmuir waves (of order of the Debye length), webelieve that the 22-m-long dipole antenna on INTER-BALL-1 is more appropriate for studies of high-frequency electrostatic waves.
The preliminary DC OPERA electric ®eld dataanalysis shows that:
1. In the plasmasphere the DC electric ®eld signals aredominated by the V-cross-B induction signal. Theauroral electric ®elds can be determined by substractionof the model V-cross-B signal.2. Despite the overall symmetry of long dipole withrespect to the spacecraft spin axis, the light non-symmetry of the boom elements near the BD1 andBD2 electric probes causes the spin-modulated photo-current interference signal in the long dipole (Ey)component. This in¯uence is usually less than thenatural electric ®elds in the magnetosheath and denseplasmasheet, but dominates in the solar wind and emptylobes.3. The short BD3-BD4 dipole (Ez component) is themost symmetric with respect to the spacecraft spin axis,nevertheless the spin-modulated signal induced byphoto-current dominates in the DC Ez channel.4. The DC channel of the another short, nearlysunward directed dipole (Ex, probes BD5, BD6) isusually in saturation outside the plasmasphere, intro-ducing di�culties in the measurements of the sunwardDC electric ®eld by the short asymmetric dipole. Inthe dilute plasma once per revolution, photoelectronsfrom the BD6 probe ¯ow to the boom, making anegative pulse of about 250 mV in the DC Ex electric®eld channel. However, this signal often becomesnegligible in the plasmasheet and magnetosheath whenthe boom is shielded by the plasma with smallerDebye length.
The subtraction of the spacecraft- and photocurrent-induced interferences from the electric ®eld measure-
Fig. 3. Noise levels of the electric ®eld sensors. Curve 1: bow shockspectrum (on board FFT); curve 2: bow shock spectrum, measured bythe BUD-E experiment of PROGNOZ-8; curve 3: noise spectrum (onboard FFT); curve 4: bow shock spectrum (®lter bank); curve 5:upstream spectrum (®lter bank); curve 6: noise spectrum (®lter bank)
S. Klimov et al.: ASPI experiment: measurements of ®elds and waves on board the INTERBALL-1 spacecraft 519

ments requires a knowledge of the plasma and magnetic®eld characteristics, measured by other INTERBALL-1experiments. Not all these data were available at thetime of writing. For this reason in Sect. 3.3 we presentonly the long-dipole antenna measurements in themagnetosheath and near-Earth plasma sheet. In thisparticular set of data taken in a su�ciently denseplasma, interferences are proved to be signi®cantlysmaller than natural signals. The GSE frame of refer-ence Ey component is reconstructed using the spacecraftrotation with no additional processing. The use ofshorter-dipole measurements requires the removal ofinterference signals and will be performed in the futurepublications.
As for the AC electric ®eld waveforms, presented inSect. 3.3, we also consider long-dipole measurements asthe most accurate. The signal is given in its original formas recorded on board. Signals from the shorter diploesare modi®ed with the preliminary calibration factorsrelative to the long-dipole signal.
3.1.3 Plasma current measurements
In Fig. 4 curves 2 and 3 show the FGM-I split Langmuirprobe signal (Iz) spectrum from ®ve MIF-M ®lters.Curve 3 represents a typical quiet solar wind signal,whose amplitudes are several times less than thesensitivity threshold of the PROGNOZ-10 split probeat 25 Hz (Romanov et al., 1991). Before the ASPIexperiment, current ¯uctuation measurements had neverbeen performed in the outer magnetosphere in thefrequency range 130±2000 Hz.
Unfortunately, during ®rst two months of theINTERBALL-1 operation no bow-shock crossings were
registered during transmission of the Iz high-resolutionwaveform signal with a 500-Hz sampling rate. Theplasma current spectrum presented in Fig. 4 (curve 2)was measured by the MIF-M ®lter bank at the low-latitude shock crossing on 6 August 1995. PROGNOZ-10 [Fig. 4, curve 1, (Petrukovich et al., 1993)] andINTERBALL spectra agree well, taking into accountpower-law extrapolation to the adjacent frequencyrange.
The main Iz waveform interference was found to bethe same as for the search-coil wide-band channel, name-ly ± a quasi-periodic signal at frequency about 80 Hz.This interference can partially saturate the channel in theregions with the high level of wave turbulence (e.g. bowshock or outer cusp).
3.2 High-latitude magnetopause measurements
We start our experimental data presentation with anexample of the high-latitude magnetospheric boundarycrossing. The INTERBALL-1 crossed the outbound¯ank magnetopause on 26 August at 04:39:22 UT, atthe point with the GSE coordinates (±2.3, ±9.0, 9.1 RE).In Fig. 5 the DC magnetic ®eld data is presented in themagnetospheric boundary coordinate system (Russelland Elphic, 1978). The magnetosphere region is on theleft. The normal direction was found as a vectorproduct of the average magnetic ®elds on both sidesof the discontinuity. The magnetic ®eld rotation and thedrop of its total value Bt occur at 04:39:22 UT. Before
Fig. 4. Noise level of the split Langmuir probe. Curve 1: plasmacurrent spectrum at the bow shock, detected by the PROGNOZ-10plasma wave experiment; curve 2: bow shock plasma currentspectrum from the ®lter bank; curve 3: split probe noise as measuredby the ®lter bank in the quiet solar wind
Fig. 5. High-latitude magnetopause crossing 26 August 1995. Mag-netic ®eld components Bl, Bm, Bn and total value Bt in the boundaryframe of reference. See text for details
520 S. Klimov et al.: ASPI experiment: measurements of ®elds and waves on board the INTERBALL-1 spacecraft

this moment a wave with the period of about 130 s isseen in the Bn component, being absent in the Bt. Webelieve that this signature is due to the magnetopausesurface wave propagation. Just outside of the magne-topause at 04:40:10 UT one can see a wave packet in theBn component, coinciding with the rotation of the Bl
one.The 150-s-long time-interval starting at 04:38:10 UT
was chosen for the minimum variance data analysis, theresult is presented in Fig. 6. The FGM-I magnetic ®elddata is used for this short time-interval analysis as theFGM-I instrument had a sampling rate four timeshigher than that of the MIF-M in this particular case.The ratios of the maximum-to-intermediate and inter-mediate-to-minimum eigenvalues are 38 and 5, respec-tively. The minimum variance direction is just a fewdegrees apart from the normal direction. Also, theeigenvector frame of reference is rotated about 10°around the normal with respect to the boundary frameused in Fig. 5. The bipolar disturbances in the Bk
(Fig. 6) and Bn (Fig. 5) components are similar to the¯ux transfer event signatures (Russell and Elphic, 1978),which were investigated for ®rst time at the highlatitudes by PROGNOZ-8 (Blecki et al., 1987, 1988;Savin, 1994). A comparison with the MHD simulationsof the magnetopause (Nikutowski et al., 1996) wasperformed. It demonstrates the similarity of this eventwith either the magnetosheath pressure-pulse dynamicsor with the Kelvin-Helmholtz instability development.Both models predict signi®cant ¯uctuations of thenormal magnetic ®eld in the second half of the crossing.No similarity with the crossings of the quiet magneto-pause or reconnection region was found. However, thelatter should be checked more carefully using the three-dimensional local reconnection model.
In Fig. 6 one can point out low-frequency waves witha frequency lower than 0.1 Hz and with 0.2±0.3-Hzfrequencies (close to the ion gyro-frequency). At highlatitudes the second type of near-magnetopause wavewas classi®ed and studied in the PROGNOZ-8,10 data(Vaisberg et al., 1983; Klimov et al., 1986; Belova et al.,1991; Savin 1994). The higher-frequency ELF waveactivity can be studied with the help of Fig. 7 whereFFT spectrograms of MIF-M and OPERA waveformsare displayed. The upper panel shows 0.1±32 Hz electric®eld Ez component spectra, the bottom panel shows thesame for the Bx component. The behaviour of the othercomponents is similar to that of presented ones. Themagnetosheath encounter is seen on the magneticspectrogram at 04:39:22 UT as the beginning of theintense signal. Such a signal is known to be a goodindicator of the magnestosheath plasma. However, theelectric ®eld spectra do not exhibit critical magneto-sphere/magnetosheath di�erences in the amplitudes.Outside the magnetosphere they correlate well with theintense bursts of magnetic spectra. The electric ®eldbursts at the inner border of magnetopause at 04:39 UTand at 04:35 UT are almost electrostatic, with up to 8mV/m peak-to-peak amplitudes. To our knowledge, weare the ®rst to show the presence of a weak magneticcomponent during such bursts, which themselves arerather usual for the high-latitude magnetopause cross-ings (Vaisberg et al., 1983; Klimov, 1992). Magneticspectra also have a wider frequency spread in compar-ison with the electric ones, as the magnetic ®eld channelis substantially more sensitive.
Just outside the magnetopause at 04:39±04:46 UTthere exists a region with very high turbulence level(Fig. 7), in which the amplitude of the electric ®eldsignal is more than 5 mV/m, and that of the magnetic®eld more than 5 nT. In this region the Bl component(Fig. 5) is highly disturbed but does not vanish to thenearly zero average level, as happens deeper in themagnetosheath. So, this component here is closer to itsvalue inside the magnetosphere. This feature could bedue to the e�ect of the shocked solar wind magnetic ®eldlines draping around the magnetosphere. We willhenceforth call this region the ``draped layer'' (DL). Inthe DL the biggest ELF wave bursts correlate with thebipolar Bn signatures in Fig. 5. Outside DL the turbu-lence amplitudes are weaker, bursts are rarer and at05:28 UT (not shown on the plots) the turbulencecharacteristics become ®nally typical for the quietmagnetosheath with amplitudes several times less thanin the DL. We call the regions with the turbulencefeatures as at 04:39±05:00 UT the ``turbulent zones''(TZ).
The high-latitude TZ was reported ®rst based on thePROGNOZ-10 data and then studied in detail using thePROGNOZ-8 crossings (Savin et al., 1990; Belova et al.,1991; Savin , 1994; Klimov, 1992). The studies of DL atthe ¯ank magnetopause were unfortunately not per-formed in the ®rst reports on such observations byPROGNOZ-8,10 spacecraft (Klimov et al., 1986; So-kolov et al., 1990; Savin, 1994). In the INTERBALL-1¯ank magnetopause crossings studied so far (18 Octo-
Fig. 6. High-latitude magnetopause crossing 26 August 1995. Mag-netic ®eld components in the minimum variance frame of reference.Bi:maximum variance direction; Bj: intermediate variance direction; Bk :minimum variance direction. See text for details
S. Klimov et al.: ASPI experiment: measurements of ®elds and waves on board the INTERBALL-1 spacecraft 521

ber, 18±20 UT; 2 September, 19:00 UT; 10 September,13:22 UT; 30 August, 00±01 UT) TZ and DL regions arealways present except for the 30 August crossing, wherethe DL could not be identi®ed due to a very complexmultiple magnetopause encounter.
So, the described ¯ank outbound magnetopausecrossing is a fairly representative one. It is compatiblewith the results of earlier missions. As in the case of thePROGNOZ-8 crossing (Blecki et al., 1987, 1988; Savin,1994), in future analysis we expect to ®nd the acceleratedelectrons and ions in the magnetopause vicinity andespecially in the ``turbulent zone''.
3.3 Observations at low latitudes
In August/September 1995 at the inbound part of orbits,INTERBALL-1 was crossing the low-latitude magneto-pause, the low-latitude boundary layer and the plasma-sheet. The case of the 21 September 1995 crossing waschosen for the presentation. Here the plasma sheet,predicted by the orbital analysis (Prokhorenko, 1995)was observed together with the unexpected magneto-pause crossing.
In Fig. 8 the ASPI GSE magnetic ®eld data for theinterval 02:00±03:00 UT, 21 September 1995 are shown.
Fig. 7.High-latitude magnetopause crossing 26 August 1995. Spectrograms of theEx (top) and Bz (bottom) waveform signals. Frequency range is0.1±32 Hz
522 S. Klimov et al.: ASPI experiment: measurements of ®elds and waves on board the INTERBALL-1 spacecraft

On the top of Fig. 9 the GSE frame-of-reference Ey
component, measured by the long dipole of the electric®eld instrument is shown. Only for this dipole theinterference signal is proved to be negligible in thisparticular crossing (see Sect. 3.1.2). As the spacecraftspin period is about 120 s, the resulting electric ®eldvalues are available only once per 60 s. On the bottom ofFig. 9 the RMS amplitude of the plasma current oscil-lations in the range 1±8 Hz is plotted. FFT spectrogramsfor the same period are in Fig. 10.
The GSE spacecraft coordinates for the middle of theinterval are (±3.4, ±12, ±1.8 RE). In the GSM frame onlythe Z GSM coordinate di�ers substantially from the
GSE counterpart, being equal to 2 RE . The Tsyganenkomodel for kp = 2 predicts GSE magnetic ®eld vector at02:00 UT to be (5.3, 8.5, 15.7 nT, Bt = 18.6 nT). Onecan conclude that excluding the disturbed interval at02:26±02:39 UT the experimentally observed magneto-sphere is slightly compressed, having an average totalmagnetic ®eld value 1.4 times higher than the model oneand a nearly vanishing By GSE component.
In the middle of Fig. 8 at 02:28 and 02:33 UT Bt
drops to 3±10 nT, which means most probably that thespacecraft is out of the magnetosphere. Preliminaryanalysis of the plasma particle data con®rms thisconclusion. At the 02:38 UT only the near-magneto-pause turbulent layer is touched for about 2 min. Similarto the high-latitude magnetopause observations themagnetosheath and magnetopause turbulent layer en-counters are accompanied by intense electromagneticnoise (Figs. 9, 10). The most intense wave burstscorrelate with sharp magnetic ®eld changes.
The exit from the magnetosheath at the 02:33 UT isthe only one long enough to determine the value of theDC electric ®eld from the spin-modulated signal of thelong dipole. The Ey GSE component here is about 2.5mV/m (Fig. 9). It corresponds to anti-solar plasmavelocity of the order of 350 km/s, which is reasonable forthe magnetosheath. In the plasma sheet the Ey GSEcomponent is negative with an average value of )2.5mV/m, which implies sunward plasma convection with aspeed of about 100 km/s. Such convection takes placeduring the northward interplanetary magnetic ®eld, andexactly this IMF direction was registered during thisperiod.
The interval 02:32:00±02:32:25 UT, with the mostpronounced magnetopause crossing, was chosen for thedetailed analysis of the AC waveform data (Fig. 11).The magnetopause crossing occurs at 02:32:06±02:32:08UT. The upper panel of Fig. 11 shows the magnetic ®eldwaveform signal. Three AC electric ®eld waveforms areon the bottom panels. The highest-amplitude (up to 10nT!) Bz wave packet is seen exactly at the time intervalof the DC-®eld sharp rotation (02:32:08 UT). Thefrequency of the dominating signal is about 0.8±1.5 Hz.The most intense electric ®eld signal with amplitudesgreater than 5 mV/m is seen just inside the magneto-pause.
Electrostatic waves with a frequency of a few Hz andamplitude of about 10 mV/m just inside the high-latitude dayside magnetopause were reported for the®rst time using one-component measurements by Vais-berg et al. (1983). They were later described for the ¯ankmagnetopause crossings by the PROGNOZ-8,10 space-craft (Klimov et al., 1986; Blecki et al., 1988; Belovaet al., 1991; Savin et al., 1990; Klimov, 1992; Savin,1994), and for the low-latitude magnetopause by ISEE-1and GEOTAIL (Cattell et al., 1995) spacecraft. InFig. 11 vector measurements of such waves are present-ed for the ®rst time.
The higher-frequency waves can be studied inFig. 10. The Ex spectra at the magnetic disturbanceshave an intense 1-10-Hz component (red tones), while inthe rest of the magnetosphere the Ex waveform quan-
Fig. 8. Low-latitude boundary crossing 21 September 1995. GSEframe-of-reference magnetic ®eld components and total value
Fig. 9. Low-latitude boundary crossing 21 September 1995. GSEframe-of-reference Ey electric ®eld component (top panel ) and RMSamplitude of the plasma current ¯uctuations (bottom panel )
S. Klimov et al.: ASPI experiment: measurements of ®elds and waves on board the INTERBALL-1 spacecraft 523

tization is too low. The magnetic ®eld channel, incontrast, registers the 1±10-Hz waves outside suchdisturbances. The comparison with the plasma current1±8-Hz ¯uctuations (bottom panel of Fig. 9) shows thatat 02:20±02:45 UT the spikes in the plasma currentsignal are similar to that of the Bz spectra (Fig. 10). At02:06, 02:09, 02:14, 02:49, 02:56±03:00 UT there areintense events in Fig. 9, which have no counterparts inthe dynamic spectra. We suppose that at these momentselectrostatic waves with smaller amplitudes and higherfrequencies were observed. As the split probe signal hasbetter quantization than the electric ®eld one, suchemissions were registered only by the split probe.
Turning now to the plasma sheet region (Fig. 8, and10 excluding 02:26±02:39 UT) we would like to point outthe electromagnetic waves in the 0.1±20-Hz frequencyrange. Such waves were found to be characteristic for theplasma sheet [see e.g. Blecki et al., (1994) and referencestherein]. However, most of the previous results werebased only on the electric ®eld data studies. At 02:05±02:12 UT the modulation of the magnetic spectra can beseen. The DC magnetic ®eld components at this timealso ¯uctuate with a period of 1.5±2.5 min. The absenceof such oscillations in the plot of the total magnetic ®eldvalue could speak in favour of either an Alfve n wave ora magnetopause surface wave observation.
Fig. 10. Low-latitude magnetopause crossing 21 September 1995. Spectrograms of the Ex (top) and Bz (bottom) waveform signals. Frequencyrange is 0.1±32 Hz
524 S. Klimov et al.: ASPI experiment: measurements of ®elds and waves on board the INTERBALL-1 spacecraft

An example of the low-latitude magnetosphericboundary crossing described here is rather unusual forsuch a spacecraft position. It demonstrates a substantialELF wave activity both in the relatively quiet and in thehighly disturbed periods. Special interest is attracted bythe electric and magnetic ®eld oscillations near themagnetopause transition, which have frequencies near 1Hz. Their amplitudes can reach 10 nT and 5 mV/m,respectively. We have also con®rmed the existence of theELF electric oscillations in the plasma sheet andmeasured their magnetic component. The describedcrossing can be subjected to in-depth studies on a multi-instrument basis, as nearly all INTERBALL-1 experi-ments were operating in fast modes.
4 Conclusions
The ASPI wave and ®eld experiment on board theINTERBALL-1 spacecraft has been successfully oper-ating in the orbit beginning from the 3 August 1995.Unique features of the ASPI instruments, such asreliable multi-sensor magnetic ®eld measurements,three-component electric ®eld measurements and electriccurrent measurements make it possible to providevaluable new information on the plasma dynamics inthe magnetosphere.
Analysis of the in-¯ight instrument operations haveshown the high quality and reliability of the DC
magnetic ®eld measurements. The MIF-M/PRAM DCmagnetometer is working as the primary magnetic ®eldexperiment of the mission. AC magnetic ®eld measure-ments are performed at high sensitivity in the few-Hzrange, thus covering the gap usually existing in thefrequency range between the DC and AC magnetic ®eldexperiments. Measurements of the electric ®eld andplasma current have su�cient sensitivity to study avariety of plasma processes. However, three-componentDC electric ®eld measurements have encountered di�-culties which are mainly due to the non-symmetry of theshort booms with respect to the Sun and the spacecraft.Preliminary analysis of the data collected shows acompatibility of new results with those of previousmissions.
Several examples of data registered in the variousregions of the Earth's magnetosphere are described inthe second half of the paper. The high-latitude magne-topause crossing is a typical representative of suchphenomena. A number of crossings similar to thepresented one were encountered by INTERBALL-1during the ®rst months of operation. Being combinedwith the recent advances in theory and numerics thesedata collections will permit a thorough investigation ofinherent plasma processes forming the magnetosphericboundaries.
An example of the low-latitude magnetosphericboundary crossing described is rather unusual for sucha spacecraft position. It demonstrates substantial ELFwave activity both in the relatively quiet and in thehighly disturbed periods. Properties of these wavescorrespond well to the results of the previous experi-ments and of the high-latitude INTERBALL-1 ones.We have con®rmed the existence of intense electric¯uctuations in the few-Hz frequency range and havestudied their relation to simultaneously observed intensemagnetic waves. The described crossing can be subjectedto in-depth studies on a multi-instrument basis, as nearlyall INTERBALL-1 experiments were operating in fastmodes.
In all described cases high-resolution waveformmeasurements provide a good basis for the studies ofthe ELF turbulence.
The unique constellation of magnetospheric space-craft planned to be in orbit in the immediate future(GEOTAIL, INTERBALL-1,2, WIND, POLAR) isanother promising perspective to perform global studiesof the Earth's magnetosphere.
Acknowledgements. The ASPI team is grateful to F. Scarf andC.Russell for their useful ideasduringASPIdesign.Wewish to thankA. Galeev and L. Zelenyi for their help in data interpretation. Wealso thank other INTERBALL experimenters G. Zastenker, N.Borodkova, E. Budnik, A. Fedorov, Yu. Yermolaev for prelimi-nary particle data. The ASPI team also greatly appreciates theparticipation in the project preparation and operation of theLavochkin association specialists G. Sukhanov, I. Tserenin, A.Nevzorov, A. Rusanov, S. Gorkin, V. Nikiforov, I. Sobachkin, V.Larin, V. Nagornykh, A. Grigorjev, F. Dolgopolicheskij and ofthe Space Research Institute specialists L. Pesotskij, R. Melnikov,
Fig. 11. Low-latitude boundary crossing 21 September 1995. Wave-form snapshots. From top to bottom: Bz magnetic ®eld: Ex;Ey ;Ezelectric ®eld waveform components in the spacecraft frame ofreference (see text for details)
S. Klimov et al.: ASPI experiment: measurements of ®elds and waves on board the INTERBALL-1 spacecraft 525

S. Shamaev, V. Nazarov, T. Lesina, Yu. Agafonov, L. Belyakova,M. Yanovskij, Yu. Lissakov, V. Prokhorenko, M. Mogilevskij,E. Gavrilova.
Topical Editor K. -H. Glaûmeier thanks a referee for his help inevaluating this paper.
References
Aleksevich, Ya. N., Yu. V. Afanasiev, V. M. Balebanov, V. E.Baskakov, Yu. N. Bobkov, N. F. Borodin, O. L. Vaisberg, Yu.Voita, V. N. Gorobey, V. N. Karachevsky, S. I. Klimov, V. E.Korepanov, N. I. Nazarov, S. G. Namestnik, K. Novak, V.Novakevich, M. N. Nozdrachev, C. Oberz, A. M. Pevzner, L. V.Pesotsky, V. N. Por®rov, S. P. Savin, Z. Sikorsky, P. P.Timofeev, P. Triska, and B. N. Turchaninov, Complex waveexperiment aboard satellite PROGNOZ-8 (in Russian), Kosm.Issled., 21, 4418, 1983.
Belova, E. V., J. Blecki, M. Denis, L. M. Zeleny, and S. P. Savin,Excitation of ion cyclotron waves at the boundary of themagnetosphere, Sov. J. Plasma Phys., 17, 555, 1991.
Bering, E. A., M. C. Kelley, and F. S. Mozer, Split Langmuir probemeasurement of current density and electric ®elds in an aurora,J. Geophys., Res.,78, 2201, 1973a.
Bering, E. A., M. C. Kelley, F. S. Mozer, and U. V. Fahleson,Theory and operation of the split Langmuir probe, Planet.Space Sci., 21, 1983, 1973b.
Blecki, J., K. Kossacki, S. I. Klimov, M. N. Nozdrachev, A. N.Omelchenko, S. P. Savin, and A. Yu. Sokolov, ELF/ULF plasmawaves observed on PROGNOZ-8 near the magnetopause,Artif. Satell. 22, 5, 1987.
Blecki, J., K. Kossacki, B. Popielawska, S. I. Klimov, S. A.Romanov, S. P. Savin, and L. M. Zelenyi, ELF plasma wavesassociated with plasma jets near the Earth magnetopause asobserved by PROGNOZ-8, Phys. Scr., 37, 623, 1988.
Blecki, J., B. Nikutowski, P. Koperski, B. Popielawska, K.Kossacki, S. A. Romanov, and S. P. Savin, ELF plasma wavesin the hot and cold plasma ¯uxes observed by PROGNOZ-8 inthe magnetospheric tail, Ann. Geophysicae, 12, 1006, 1994.
Cattell, C. F, J. Wygant, F. S. Moser, T. Okada, K. Tsuruda, S.Kokubun, and T. Yamamoto, ISEE-1 and GEOTAIL observa-tions of low-frequency waves at the magnetosphere, J. Geophys.Res., A100, 11823, 1995.
Etcheto, J., and M. Faucheux, Detailed study of electron plasmawaves upstream of the Earth's bow shock, J. Geophys. Res.,A89, 6631, 1984.
Fahleson, U., Theory of electric ®eld measurements conducted inthe magnetosphere with electric probe, Space Sci. Rev., 7, 338,1967.
Filbert, P. C., and P. J. Kellogg, Electrostatic noise at the plasmafrequency beyond the Earth's bow shock, J. Geophys. Res., A84,1369, 1979.
Grard, R., C. Beghin, M. Mogilevsky, Yu. Mikhailov, O. Molcha-nov, A. Pedersen, J. -G. Trotignon, and V. Formisano, Electric®eld and plasma observations near Halley's Comet (in Russian)Pisma A. Zh., 12, 683, 1986.
Grard R., D. Klinge, S. Klimov, S. Savin, and J. G. Trotignon, Theplasma wave system on Phobos, J. Phys. E., 22, 656, 1989.
Gurnett, D. A., Electric ®eld and plasma observations in themagnetosphere, in Theoretical problems of magnetosphericphysics, Ed. IUCSTP secretariat. Washington, p. 123, 1972.
Klimov, S. I., Energetics of ULF/ELF plasma waves in the solarwind and outer Earth's magnetosphere, ESA SP-346, 95, 1992.
Klimov, S. I., M. N. Nozdrachev, P. Triska, Ya. Voita, A. A. Galeev,Ya. N. Aleksevich, Yu. V. Afanasiev, V. E. Baskakov, Yu. N.Bobkov, R. B. Dunetz, A. M. Zhdanov, V. E. Korepanov, S. A.Romanov, S. P. Savin, A. Yu. Sokolov, and V. S. Shmelev,Investigation of plasma waves by combined wave diagnostic
device BUDWAR (PROGNOZ-10-INTERCOSMOS) (in Rus-sian), Kosm. Issled., 24, 177, 1986.
Klimov, S. I., Z. Kravchek, V. E. Korepanov, S. P. Savin, V. M.Balebanov, G. Simonenko, C. Novak, and Ya. Aleksevich,Plasma waves investigation aboard VEGA spacecraft, (inRussian), Kosm. Issled., 25, 943, 1987.
Klimov, S., S. Romanov, E. Amata, J. Blecki, J. BuÈ chner, J.Juchniewicz, J. Rustenbach, P. Triska, L. J. C. Woolliscroft, S.Savin, Yu. Afanas'yev, U. de Angelis, U. Auster, G. Bellucci, A.Best, F. Farnik, V. Formisano, P. Gough, R. Grard, V. Grushin,G. Haerendel, V. Ivchenko, V. Korepanov, H. Lehmann, B.Nikutowski, M. Nozdrachev, S. Orsini, M. Parrot, A. Petruko-vich, J. L. Rauch, K. Sauer, A. Skalsky, J. Slominski, J.G.Trotignon, J. Vojta, and R. Wronowski, ASPI experiment:Measurements of ®elds and waves onboard of the INTER-BALL-TAIL mission, INTERBALL mission and payload, IKI-CNES, p. 120, 1995.
Matsumoto, H., I. Nagano, R. R. Anderson, H. Kojima, K.Hashimoto, M. Tsutsui, T. Okada, I. Kimura, Y. Omura, andM. Okada, Plasma wave observations with GEOTAIL, space-cract, J. Geomagn Geoelectr., 46, 59, 1994.
Mozer, F. S., Comparison of spherical double probe electric ®eldmeasurements with plasma bulk, Geophys. Res. Lett., 10, 737,1983.
Nikutowski, B., J. BuÈ chner, G. Haerendel, L. Lemke, J. Rusten-bach, H. Wiechen, A. Otto, R. Walker, S. Klimov, and S.Savin, Magnetopause normal determination with the INTER-BALL measurements, Abst. AGU 1995 Fall Meeting, F512,1996.
Nozdrachev, M. N., A. A. Petrukovich, and J. Juchniewicz, ULF/ELF monochromatic oscillations observed by PROGNOZ-8and -10 spacecraft during quasi-perpendicular supercriticalshock crossings, Ann. Geophysicae., 13, 573, 1995.
Nozdrachev, M. N., V. A. Styazhkin, A. A. Zarutsky, S. I. Klimov,S. P. Savin, A. A. Skalsky, A. A. Petrukovich, Yu. V. Lissakov,I. S. Arshinkov, N. Abadgiev, and A. Bochev, Magnetic ®eldmeasurements onboard the INTERBALL TAIL spacecraft:INTERBALL mission and payload, the FM-3I instrument,IKI-CNES, p. 228, 1995.
Petrukovich, A. A., S. A. Romanov, and S. I. Klimov, Dispersioncharacteristics of plasma emissions near the quasi-perpendic-ular Earth's bow shock observed by PROGNOZ-10 space-craft, Proc. START conf. ESA WPP-047, Ed. C. P. Escoubet,ESA Publications division, Noordwijk, The Netherlands.p. 281, 1993.
Pikelner, S. B., and V. N. Tsytovich, Field annihilation and particleacceleration in solar ¯ares (in Russian) Astron. Zh., 52, 738,1975.
Prokhorenko, V. I.,Mission analysis for the INTERBALL project.Pre-launch orbit selection and long-term experiments planning,INTERBALL mission and payload, IKI-CNES, p. 46, 1995.
Romanov, S. A., S. I. Klimov, and P. A. Mironenko, Experimentalderivation of ELF waves dispersion relations and evidence ofwave coupling in the Earth's bow shock foot from the data ofthe PROGNOZ-10, Adv. Space Res., 11, 19, 1991.
Russell, C. T., and R. C. Elphic, Initial ISEE magnetometer results:magnetopause observations, Space Sci. Rev., 22, 681, 1978.
Savin, S. P., ELF waves near the high-latitude magnetopause,Abstr. AGU Chapman conf. Phys. Magnetosph., March 14±18,Ed. published by American Geophysical Union. No otherinformation available. p. 41, 1994.
Savin, S. P., L. M. Zelenyi, and V. I. Prokhorenko, Speci®c tasks ofmultiple-scale plasma measurements in Regatta-Cluster system,Proc. Intern. Worksh. Space Plasma Phys. Investig. by Clusterand Regatta, Graz, Austria, Ed. 1990: Ed. E. J. Rolfe, ESAPublications division, Noordwijk. The Netherlands. ESA SP-306, p. 7, 1990.
Sokolov, A. Yu., I. K. Khabibrakhmanov, M. M. Kuznetsova, J.Lemaire, M. Roth, J. M. Lesceux, and F. Verheest, Detection of
526 S. Klimov et al.: ASPI experiment: measurements of ®elds and waves on board the INTERBALL-1 spacecraft

nonlinear features in plasma and ®eld measurements byPROGNOZ-8, ESA SP-311, 81, 1990.
Trotignon, J. G., M. Hamelin, R. Grard, A. Pedersen, S. Klimov, S.Savin, A. Skalsky, and C. Kennel, A comparison between theEarth's and Mars' bow shocks detected by the PHOBOSplasma-wave system, Planet. Space Sci., 39, 99, 1991.
Tunally, J. K. E., The e�ect of noise on probe measurements in themagnetosphere, Ann. Geophys., 26, 853, 1970.
Vaisberg, O. L., A. A. Galeev, L. M. Zelenyi, G. N. Zastenker, A. N.Omelchenko, S. I. Klimov, S. P. Savin, Yu. I. Yermolaev, V. N.Smirnov, and M. N. Nozdrachev, Fine structure of the magne-topause from the measurements of the satellites PROGNOZ-7and PROGNOZ-8 (in Russian), Kosm. Issled., 21, 57, 1983.
Vaisberg, O. L., S. I. Klimov, and V. E. Korepanov, Current densitymeasurements near the bow shock by the split Langmuir probe(in Russian), Kosm. Issled., 27, 461, 1989.
S. Klimov et al.: ASPI experiment: measurements of ®elds and waves on board the INTERBALL-1 spacecraft 527