aspects of thinning - forestry commissionfile/fcbu055.pdf · yield aspects of thinning, was chaired...
TRANSCRIPT

H M S O £2.50 net Forestry Commission Bulletin
Aspects of ThinningG J Hamilton
Forestry Commission
ARCHIVE

COVER PICTURES
Top left Growing space occupied by competing trees - see Figure 7.3.
Top right Line thinning in Corsican pine, Pimts nigra variety maritima - see page 40, Treatment
Bottom left Extracting thinnings by cable crane.
Bottom right Inter-relationships of factors affecting growth - see Figure 10.1.
Cover Design: Graham J. Hamilton and John Williams.
Photos by Graham J. Hamilton and William O. Wittering.

F O R E S T R Y C O M M I S S I O N BU L L E T INNo. 55
Aspects of Thinning
PR O C E E D IN G S OF A M EETIN G OF P R O JE C T G R O U P P4.02 “EC O N O M IC S
A N D H A R V EST IN G O F T H IN N IN G ” O F T H E IN TE R N A TIO N A L U N IO N O F FO R EST
RESEARCH O R G A N ISA T IO N S, H E L D IN E D IN B U R G H FR O M 30th
SEPTEM BER U N T IL 2nd O CTO BER, 1974
Edited by
G. J. HAMILTON, M.Sc. Forestry Commission
L O N D O N : HER M A J E S T Y ’S S T A T I O N E R Y OFF ICE

© C row n copyrigh t 1976
F irs t pub lished 1976
ISBN 0 11 710147 8

CONTENTSPage
Part I ED IT O R ’S PR EFA C E . 1List o f Participants . . 2
Part II SUM M ARIES O F PAPERS . . . . 4R ESU M E DES CO M M U N ICA TIO N S . . 10ZU SA M M EN D FA SSU N G D E R STU D IEN . 16
Part III P A P E R S : ................................................................................................221. Preliminary Results from Some New Danish Thinning
Experiments with Norway Spruce on Fertile SoilsBy H. B ry n d u m ................................................................. 22
2. Effects o f Line Thinning on IncrementBy G. J. H am ilton . . . . 37
3. Some Results from U nthinned Spruce Plantations in W estern NorwayBy O. Borset . 46
4. The Development o f Thinning and Harvesting Systems in Sitka Spruce and C ontorta Pine CropsBy G. J. Gallagher . . . . 49
5. New Zealand Experience with R adiata PineBy W. R. J. Sutton . . . . 56
6. Thinning Research in South AfricaBy A. van Laar . . . . 62
7. Growing Space M easurements - Complementary to Thinning ExperimentsBy A. M. Jensen 72
General Discussion on Papers 1-7 81
8. D er Einflus Verschiedener Durchforstungsarten auf Wach- stum und Bestandesschaden. Untersuchungsergebnisse aus Fichtenbestanden in der Bundesrepublik Deutschland.(The Influence of Different Types o f Thinning on G row th and Damage to Stands. Results o f Experiments from N orway Spruce Stands in the Germ an Federal Republic).By H. K ram er . . . . . . . 82
9. Views on the Choice of Silvicultural M ethods and Logging Techniques in ThinningsBy J. Fries . . 95
10. The Influence of Different Thinning Systems on Damage to Soil and TreesBy H. A. F r o e h l i c h ........................................................................ 102
iii

11. The Machines are Coming, The Machines are ComingBy H. E. Y o u n g ................................................................. 106
12. D ie Durchforstungstechnik als Mittel und Problem einer pfleglichen W aldbewirtschaftung(The Technique o f Thinning - The Problem and Means of Developing Sound Forest ManagementBy S. Haberle . . . . . 114
13. Thinning, the State o f the A rt in the Pacific NorthwestBy D . E. Aulerich . . . . . . 123
14. Problems of Extraction of Thinnings by Cable-crane in the U nited KingdomBy J. D rum m ond 127
15. Mechanised Thinning SystemsBy C. J. Bredberg . . 130
General Discussion on Papers 11-15 138
All diagrams were provided by the respective authors.
iv

P A R T I
EDITOR'S PREFACEThis Bulletin contains the papers presented at a meeting o f the International U nion of Forest Research
Organisations (IU FRO ) Project G roup P4.02 “Economics and Harvesting of Thinnings” , held in Edinburgh from 30 September until 2 October 1974.
The Project G roup is led by Professor H orst K ram er of the University o f Gottingen, Federal Republic of Germany, and draws its members from research workers engaged in a wide range o f disciplines. These include researchers principally concerned with the effects o f thinning on yield, size-class distribution etc., engineers concerned with harvesting problems, and forest economists.
Regular meetings o f the Project G roup are held, sometimes in conjunction with associated IU FR O Subject or Project Groups, and on other occasions independently. Almost invariably these meetings are held in a different country on each occasion. The Edinburgh meeting was the first to be held by the G roup in Britain.
In welcoming the delegates and setting the scene for the meeting, M r George D. Holmes, Forestry Commissioner for Harvesting and M arketing and a member o f the Executive Board o f IU FR O , stressed the im portance o f thinning to British forestry, pointing out that thinning currently accounted for 55 % of the total production from Forestry Commission woodlands. M r Holmes also referred to the increasing scarcity of forest labour and the parallel trend tow ards increased mechanisation in harvesting operations, which raised the kind o f problems which the Project G roup was well fitted to help solve.
Papers were invited on various aspects o f thinning. The first session (Papers 1-7) concerning mainly yield aspects o f thinning, was chaired by Professor Joran Fries, Royal College of Forestry, Stockholm. The second session (Papers 8-10) chaired by Professor H arold E. Young, was devoted principally to the damage caused to sites and stands by harvesting operations. M r A lastair A. Rowan, o f the Forestry Com mission’s Harvesting and M arketing Division, chaired the final session, Papers 11-15, in which the main consideration was the harvesting operation.
The papers are given more or less in the order in which they were presented. The discussion attending each paper was recorded and a much shortened edited version of this is given immediately following the paper.
I wish to thank the Departm ent o f Forestry and N atural Resources, Edinburgh University, and in particular D r Douglas C. Malcolm, for the use of a lecture theatre for the meeting and for the excellent facilities provided.
I should also like to thank Noreen Busby for assistance during the meeting, for preparing many of the diagrams for publication and for transcribing the tape recording of the discussions.
G. J. H A M ILTO NForestry Commission Research StationAlice H olt LodgeWreccleshamFam hamSurrey

LIST OF PARTICIPANTSAU STR A LIA M r H. Porter
AU STR IA M r H. Enk
CAN AD A M r R. B. Forster
D E N M A R K M r H. Bryndum
M r A. Jensen
F IN LA N DProfessor J. Hamalainen
F RAN C E M r P. Guillon
G E R M A N Y , Federal Republic Professor F. Franz Professor H. Kramer
M r Hans-Ulrich Sinner M r J. Stratmann
IRE LA N D , Republic o f M r G. J. Gallagher
M r M. Swann
N E TH E R L A N D S M r P. J. Faber
N E W Z E A L A N D M r W. R. J. Sutton
N O R W A Y M r Eivind Bauger Professor Ola Borset
PAPUA N E W GUINEA D r J. E. D. Fox
PO LANDProfessor Tr Trampler
SO U TH AFRICA Professor A. van Laar
Forestry Commission of New South Wales, 93-95 Clarence Street, SYDNEY, NSW 2000.
Forstliche Bundesversuchsanstalt, A-1131 VIENNA.
Forest Economics Research Institute, Nicol Building, 331 Cooper Street, OTTAW A, Ontario.
D anish Forest Experimental Station, Springforbirej 4, Springforbi, 2930 KLAM PENBORG.Royal Veterinary & Agricultural College, Departm ent of Forestry, Thorvaldsensdej 57, 1871 CO PEN H A G EN 5.
The Finnish Forest Research Institute, D epartm ent of Forest Economics, Kaisaniemenkatu l.A , 00100 H ELSIN K I 10.
Centre National de Recherches Forestieres, Laboratoire d’Economie Forestiere, 14 rue G irardet, 54042 NANCY.
o fForstliche Forschungsanstalt, D-8000 M U N CH EN 40, Amalienstrasse 52. Institut fur Forsteinrichtung und Ertragskunde der Universitat Gottingen, 34 G O TTIN G EN , Busgenweg 5.D-8031 GROEBENZELL, Brennerstrasse 22.D-3282 Steinheim 2/Westfalen G REV EN H A G EN In der Schwalge 1.
D epartm ent of Lands (Forest & Wildlife Service), Sidm onton Place, BRAY, Co. Wicklow.D epartm ent o f Lands (Forest & Wildlife Service), 22 U pper M errion Street, D U BLIN 2.
Grow th & Yield Section, Forest Research Station, “De D orschkam p” , Postbus 23, W A G EN IN G EN.
Forest Research Institute, ROTORUA.
Norwegian Forest Research Institute, N-5047 STEND.Norges Landbrukshogskole, Institutt fo r Skogskjotsel, Boks 42 - 1432 VOLLEBEKK.
Regional Forest Office, P O Box 267, MT HAGEN.
Forest Research Institute, Instuitut Badawczy Lesnictwa, ul. Wery Kos- trzewy 3, WARSAW 22.
Faculty of Forestry, University o f Stellenbosch, STELLENBOSCH.
2
A SP E C TS OF TH INN IN G 3
S W E D E N M r Carl J. Bredberg Professor Joran Fries M r Hans Liedholm
SW IT Z E R L A N D M r J. Ph. Schutz
U NITED K IN G D O M M r P. A dlard
M r R. J. N . Busby M r J. M. Christie
M r J. D rum m ond M r G. J. Hamilton
M r G. D. Holmes M r G. M. Locke M r R. F. MacKenzie
D r D. C. Malcolm
M r A. A. Rowan M r A. Sutton
U.S.A.Professor D. Edw ard Aulerich
Professor H. A. Froehlich M r J. E. King
M r D. K. Lewis
M r M. Rowley
M r J. E. Todd
Professor H arold E. Young
Royal College o f Forestry, S-770 73 G ARPEN BERG.Royal College of Forestry, S-104 05 STOCKHOLM 50.Royal College of Forestry, S-770 73 GARPENBERG.
Eidgenossisch Anstalt fur das Forstliche Versuchswesen, CH-8903 BIR- M ENSDORF.
D epartm ent o f Forestry, Commonwealth Forestry Institute, South Parks Road, OX FO RD .Forestry Commission, 231 Corstorphine R oad, ED IN B U R G H .Forestry Commission, Forest Research Station, Alice H olt Lodge, FA R N - H AM , Surrey.Forestry Commission, Stable Cottages, Mabie, D U M FR IES D92 8HB. Forestry Commission, Forest Research Station, Alice Holt Lodge, FA R N - HAM , Surrey.Forestry Commission, 231 Corstorphine Road, ED IN B U R G H .Forestry Commission, 231 Corstorphine Road, ED IN BU R G H .Forestry Division, N orthern Ireland D epartm ent o f Agriculture, D undonald House, Upper Newtownards Road, BELFAST BT4 3SB.Departm ent o f Forestry & N atural Resources, Edinburgh University, Kings Buildings, Mayfield Road, ED IN B U R G H .Forestry Commission, 231 Corstorphine Road, ED IN BU R G H .Forestry Commission, 231 Corstorphine Road, ED IN BU R G H .
Forest Engineering D epartm ent, Oregon State University, CORVALLIS, Oregon.School o f Forestry, Oregon State University, CORVALLIS, Oregon. Weyerhaeuser Company, Forestry Research Centre, 505 N orth Pearl Street, CENTRALIA, W ashington 98531.(Weyerhaeuser Company), c/o Commonwealth Forestry Institute, South Parks Road, O X FO RD 0X 1 3RB.Forest Engineering D epartm ent, Oregon State University, CORVALLIS, Oregon, 97330, USA.Forest Service, USDA, Division of Timber Management, 14th & Independence Avenue, SW, W ASHING TON D C 20250.School o f Forest Resources, University of Maine, ORONO, Maine 04473.

P A R T II
SUMMARIES OF PAPERS
PAPER 1
P r e l im in a r y R e s u l t s f r o m so m e N e w D a n i s h T h i n n i n g E x p e r im e n t s w it h N o r w a y S p r u c e o n F e r t il e S o il s
By H. BRY ND U M
This article reports preliminary results obtained from two recent thinning experiments in Norway spruce (Picea abies) on fertile soils in Denmark. Experiments were established in 1953 and 1960 respectively in young unthinned plantations with rather high stem numbers. The latest assessment is from 1973. The thinning treatments, controlled by basal area, are the following:
A, B, C, D , corresponding to no thinning, light thinning, medium heavy thinning and very heavy thinning, and D -B , very heavy thinning in youth with light thinning later.
In both experiments the volume increment was approximately the same in all treatments in the experimental periods of, respectively 20 and 13 years, with some extra increment in the heavier grades during the initial years. The height increment is not, or very little, influenced by the thinning, whereas the diameter increment rises steeply with increasing thinning intensity. The thinning intensity has a decisive influence on the dimensional composition of the total production. W ith increasing intensity there is an increasing shift of the volume production from the middle diameter classes into the higher classes.
The wood quality is somewhat reduced with increasing thinning intensity; the bole height becomes shorter; the taper m ore pronounced, and the branch diameter larger. It has not been possible to demonstrate any connection between thinning intensity and the frequency of rot. The risk of windthrow seems greater with increased thinning intensity, especially at greater stand heights. During the first years after the start o f the heavy thinning operations there is an increased risk of snow damage in these treatments. Later when regular crowns have been formed the heavily thinned stands are very snow resistant.
Until now the heavy thinning grades have yielded by far the greatest net revenue. The total value production, ie the value of thinnings plus main crop at the respective ages at which data were collected, 34 and 38 years respectively, is greatest for the heaviest thinning grades. The same applies to capital value. Value production is still rising markedly with increasing age.
PAPER 2
E f f e c t s o f L in e T h i n n i n g o n I n c r e m e n t
By G. J. HAM ILTON
The results from five experiments involving line thinning treatments show th a t:a. A loss of production is associated with the neutral thinning type implicit in line thinning,b. the zone of influence of line thinning is largely confined to the rows immediately adjacent to
those removed,c. the response o f outside rows rises markedly as the number o f adjacent rows removed increases,
andd. greater losses in volume production are associated with greater numbers of adjacent rows
removed.
4

ASP E C TS OF THINN IN G 5
D e v e l o p m e n t a n d Y ie l d o f U n t h i n n e d N o r w a y S p r u c e P l a n t a t i o n s i n
W e s t N o r w a y
By O. B 0R SE T
Investigations were made in 31 unthinned, densely planted plots o f Norway spruce (Picea abies) in West Norway when the top height o f most plots was in the region of 16-25 m. The plots were mainly on steep slopes in good positions and in a m oist climate (annual rainfall 1500-3000 mm). M ost of the stands were planted at spacings closer than 1 -5 x 1-5 m.
The total production differed little from that o f thinned stands. The volume loss due to natural mortality was always less than 10%. Dead trees appear to have been suppressed at an early stage and generally had died before reaching sawlog size. A t a mean height o f 15 m more than 80% of the volume was generally composed of trees having a breast height diameter o f more than 11 cm. A t a mean height of 20 m more than 80% of the volume consisted of trees with a breast height diameter above 17 cm. Health and stability were considered adequate.
The investigated, unthinned stands have developed better than was expected on the strength of experience with thinning experiments in other parts o f northern regions. The explanation for this may be found in the advantageous water regime o f the stands.
PAPER 3
PAPER 4
T h e D e v e l o p m e n t o f T h i n n i n g a n d H a r v e s t in g S y s t e m s i n Y o u n g S it k a S p r u c e a n d
C o n t o r t a P in e C r o p s
By G. J. G A LLA G H ER
Experimental evidence has shown that the removal o f one-third o f the standing volume at first thinning causes no great loss o f volume increment in Sitka spruce (Picea sitchensis) and, somewhat less noticeably, in C ontorta pine (Pimts contorta). A large num ber of different thinning methods o f m oderate degree appear to have little effect on volume production, although selective thinnings might be marginally superior. These results have led to the investigation of line thinnings in which each third or second row has been removed. These are the least expensive of the methods studied. These thinning methods have been tried in conjunction with different tim ber harvesting and extraction methods. The extraction of whole trees with large machines has not yet had as much success as simpler methods. The skyline systems are being developed for hilly areas. C ontorta pine appears to be more sensitive to storm damage than Sitka spruce. After recent storms the damage done to Sitka spruce was much less than expected.
PAPER 5N e w Z e a l a n d E x p e r ie n c e w it h R a d i a t a P in e
By W. R. J. SUTTON
Unthinned R adiata pine (Pinus radiata) plantations on long rotations incur serious risk of insect or disease attack. The first m ajor attem pt at commercial thinning failed to increase total yields o r secure intermediate financial returns. This led to the development of an alternative regime giving similar volume yield, but economically and silviculturally superior. This regime incorporated wide initial spacing, heavy early thinning (without yield) and severe pruning.

6 F O R E ST R Y C O M M ISSIO N B U LLE TIN No. 55
PAPER 6
T h i n n i n g R e s e a r c h i n S o u t h A f r ic a
By A. VAN LAAR
In South Africa “ Correlated Curve Trend Experiments” have been laid down to investigate the relationship between stand density and growth in even-aged forest stands. Each individual series comprises eight spacing plots with stem numbers varying between 125 and 3,000 per hectare. The experiment is combined with an assessment o f the volume production of thinning plots which form part o f the trial project. This allows the application of CCT growth series for the prognosis o f growth in thinning plots. Total production, as well as other param eters of yield, were decisively influenced by stand density.
Additionally, thinning experiments have been laid down in Pinus radiata and Populus deltoides stands, either as completely random ised experimental plots or as blocks or split blocks, in the latter case in combination with thinning treatments. Because of the existence of reciprocal effects it is advisable to investigate simultaneously in twin factor experiments the influences of thinning and pruning on the growth of pine stands.
Thinning experiments in Populus deltoides stands dem onstrated the superiority of using mean basal area as a measure of stand density. The experiments with Pinus radiata and Populus deltoides showed a curvilinear relationship between stand density and volume production. In order to assess competition within the plots thinned at varying degrees, competition variables were defined and correlated in the first place with the increment of individual trees. The relationship between these com petition variables and increment was investigated using analysis of covariance.
PAPER 7
G r o w i n g S p a c e M e a s u r e m e n t s - C o m p l e m e n t a r y t o T h i n n i n g E x p e r im e n t s
By A. M. JENSEN
In a 76-year old stand of Norway spruce (Picea abies) close to a thinning experiment, 247 single trees have been subjected to accurate measurements of the volume increment. Growing space has been measured and was calculated under different hypotheses of competition. The results from the single tree measurements are compared with the sample plot data from the thinning experiments. The use of growing space measurements is discussed.
PAPER 8
T h e I n f l u e n c e o f D if f e r e n t T y p e s o f T h i n n i n g o n G r o w t h a n d D a m a g e t o S t a n d s . R e s u l t s o f E x p e r im e n t s f r o m N o r w a y S p r u c e S t a n d s
i n t h e G e r m a n F e d e r a l R e p u b l ic
By H. K RA M ER
Maximising forest rents, which is the aim of Norway spruce (Picea abies) management in Central Europe, demands optimal increment and value and the avoidance of damage to stands. Wide spacing at stand establishment and an early reduction of stems raised the value increment and the resistance o f a stand to snow and wind damage. To rationalise the thinning of closely spaced Norway spruce stands, crown, line and strip thinning are recommended as well as combinations of these thinning methods. The effects of systematic thinning on increment and damage to stands are examined. A com parison of low thinning, crown thinning and strip thinning (Table 8.1) shows that low thinning does extremely badly from the economic point o f view. Crown and strip thinning are roughly equally advantageous. According to the increment analysis (Table 8.2) low thinning and crown thinning produce practically the same volume increment. The five year volume increment of the line thinning is 8% lower than the low thinning but is barely noticeable (at 0-6%) in a rotation period of 100 years. The increment o f the 400 trees of largest

A SP E C TS OF TH INN IN G 7
diameter (elite trees) in line thinning is 5 % greater than with low thinnings and with crown thinning 14 % greater. Early heavy thinning encourages crown development (Table 8-3) especially with crown thinning.
W ith extreme line thinning (removal o f every 4th line in a stand with 3 m spacings between lines) with thinning strips o f 6 m width, no definite loss of increment (mean 3 %) could be shown as against selective low thinning (Table 8.4).
A stand o f Norway spruce in the H arz M ountains currently 100 years old in which two-thirds o f the volume was removed 45 years ago by felling every second and third line shows very considerable volume and value production (Table 8.5).
A special “ Caterpillar” tractor was used for the mechanical reduction of stands in extremely dense spruce stands of some 8 m in height. Strips o f 2-5 m in width and a t intervals o f 8 m were cut and flattened. This operation was extremely cheap and no damage occurred in consequence.
W here a short wood m ethod (production of wood for industry 2 m in length, w ith bark) was employed, three different types o f strip thinnings were tested. The strip width in each case was 4-5 m while the distance between the edges of the strips varied from 3-15 m. Except in the case of the closest strip, the strip thinning was combined with crown thinning in the areas between strips. The best perform ance was in pure strip thinning at close intervals. But this was accompanied also by the greatest damage to the trees. Soil and root damage is avoided by means of brushwood covering the strips.
The use of the whole tree harvesting m ethod causes, am ong other things, greater damage especially to the base of the tree than the shortw ood method o f harvesting.
W ind damage occurs especially in older N orway spruce stands. Heavier thinning operations in young stands, including line and strip thinning, enabled the stands to survive the storm catastrophe of November 1972.
Snow breakage on the other hand endangers the younger stands particularly. The percentage o f loss from snow rises in p roportion to the relationship between height and diameter, and inversely with the crown percentage (see Figs 8.1 and 8.2). W ithin a stand, snow breakage decreases clearly with increasing diameter (Fig 8.3). Snow damage after strip and line thinning depends upon the condition o f the stand and the period of time between thinning and the occurrence of damage. The stand is most vulnerable immediately after thinning. Damage occurring after systematic thinning is unim portant as only the weak trees are affected, which would already have been removed in low thinning (see Fig 8.4).
PAPER 9
V ie w s o n t h e C h o ic e o f S i l v i c u l t u r a l M e t h o d s a n d L o g g in g T e c h n i q u e s i n T h i n n i n g s
By JO R A N FR IES
Damage caused by heavy vehicles in thinnings has been investigated. Damage to soil and roots increases rapidly when the bearing capacity of the ground decreases. Slash from felled trees on the haul-roads reduces damage substantially. Damage to roots o f N orway spruce greater than 2 cm in diam eter gives rise to ro t infections which, if the damage is situated close to the tree (less than 0-5 m), in most cases will cause ro t infection also in the stem. Damage to Scots pine seldom causes ro t infection. One example is given of how simulation can be used to find the best com bination of silvicultural m ethod and logging technique.
PAPER 10
T h e I n f l u e n c e o f D if f e r e n t T h i n n i n g S y s t e m s o n D a m a g e t o S o il a n d T r e e s
By H EN R Y A. FR O EH LIC H
The concern about potential soil and tree damage due to thinning is increasing with increasing mechanisation. The actual growth losses to residual trees, o r seedlings after the final cut, is not yet well defined. Highly variable results have been reported from thinning studies. These results vary as a result o f differences in site factors, stand factors and operational factors. A general concept o f the inter-relationshipi.ofi fhese

8 F O R E ST R Y C O M M ISSIO N B U LL E TIN No. 55
factors is given. Soil texture and soil moisture at time o f thinning are the m ajor items affecting soil com paction. Trafficability o f soils as affected by litter o r slashings have also been cited as causing differences in soil and tree damage. Tree species differ markedly in their susceptibility to damage from soil compaction, roo t breakage or stem wounds.
Soil and tree damage due to different thinning systems cannot be completely separated from the site and stand factors. The m ajor difference in the impact o f various thinning systems is apparently due to ground pressure and intensity or frequency of use. A study in thinning a 35-year old Douglas fir (Pseudotsuga menziesii) stand by both skyline and crawler tractor shows a large difference in extent o f soil disturbance and soil com paction. Relatively little difference was observed in percent o f stems with wounds. Tree wounds created by tractor thinning were generally near ground level and possibly subject to a higher incidence of rot infection than skyline wounds.
Much research is needed to make it possible to predict actual gross losses produced by the visible soil and stem damage.
PAPER I I
T h e M a c h i n e s a r e C o m i n g , T h e M a c h i n e s a r e C o m in g
By HAROLD E. Y OUNG
The successful adaptation of the mobile Chiparvestor developed by M orbark Industries, Inc. as a major com ponent o f a mechanical forest harvesting system and the equally successful industrial use of chips with bark attached by Mills M anufacturing Reconstituted Products has ushered in a whole new era in harvesting and use of primary forest products.
This highly lucrative m arket has encouraged a number of equipment companies to design mobile and self-propelled machines of various sizes to be used in both clear cutting and thinning operations. Many foresters are concerned that the use of such machines will result in overcutting and damage to the forest. Both are possible but unlikely as we adapt to and control the machines that will be at our disposal.
Mechanised harvesting is a response to the shortage o f woods labour. Despite the high cost o f the machines there is a decrease in the cost of wood delivered to the mills. Furtherm ore it is anticipated that in time there will be no such thing as a “ pre-commercial” thinning which will mean that professional foresters will be able to manipulate the forest to control species, density and quality at no cost, and sometimes at a profit.
PAPER 12
T h e T e c h n iq u e o f T h i n n i n g - T h e P r o b l e m a n d M e a n s o f D e v e l o p in g S o u n d F o r e s t M a n a g e m e n t
By S. HABERLE
The technique of thinning must be directed to three targets:- A long term target which aims at achieving at rotation age, plots fully stocked with trees of
the greatest possible value and dimensions- A medium term target which is devoted to making the stand accessible- A short term target which takes account of the profitability o f current wood harvesting
methods.An attem pt is made to dem onstrate working techniques for the entire range of Norway spruce (Picca
abies) thinnings, from young pole timber to old timber, which take these three targets into account in the best possible combination.
The following principles apply:The younger the stand the earlier systematic thinnings are permissible. These are accomplished with the help of a thinning and harvesting machine which can create strips o f 4-5 m in width and which carries out the following processes; cutting, de-Iimbing, bucking, bunching, depositing in the strip.
The strips are 20-30 m apart. In the areas between strips a selective thinning is carried out. In the younger

A SP E C TS OF TH IN N IN G 9
stands shortwood is produced in 2 m standard lengths, while in middle-aged and older stands long tim ber is preferred.
W ith old tim ber the SERJAS-system is employed, whereby the trees to be harvested are branched and barked when standing. This system enables selective thinning operations to be carried out with no damage to the stem.
Should it not be possible to sell the removed trees profitably due to the unfavourable relationship between tim ber prices and felling costs, the final crop trees can be prom oted by destroying their oppressors with the arboricide cartridges developed by D r Sterzik. This m ethod is permissible only when there is no danger from insects. Otherwise mechanical operations cannot be avoided even when there is a loss in the short run, for the long term aim in a cultivated forest demands thinning operations independent of the price/ cost situation operating at that time.
PAPER 13
T h i n n i n g : T h e s t a t e o f t h e A r t in t h e P a c i f i c N o r t h w e s t
By D. E. A U LER IC H
Thinning in the Douglas fir (Pseudotsuga menziesii) forests o f the Pacific Northwest is becoming a more frequent practice as many young stands replace old growth. Although the largest proportion of ongrowing operations are by ground based behicles, crawler tractors and rubber-tyred skidders, the interest in cable thinning is increasing. This is due primarily to the steep terrain and fragile soils characteristic o f much of the region.
M ajor problems facing the operator are adapting workers to smallwood harvesting and obtaining equipment designed for handling smallwood.
Smallwood handling problems associated with the machine and system are being identified. This information will aid in the development o f future equipment and techniques for harvesting, primarily yarding smallwood on steep, inaccessible terrain.
PAPER 14
P r o b l e m s o f E x t r a c t i o n o f T h i n n i n g s b y C a b l e - C r a n e i n t h e U n i t e d K i n g d o m
By J. A. D R U M M O N D
Cable-cranes as used in the United Kingdom are of the short/m edium range variety. They are sensitive in sky-line form to the yield produced from thinning especially in earlier stages.
Damage to soil and crop is very limited and there is little indication of instability from wind resulting from the layouts used.
PAPER 15
M e c h a n is e d T h i n n i n g S y s t e m s
By CARL-J. BREDBERG
Rapidly rising costs in thinnings have led to a reduction of thinning activities. If thinning is considered a necessary tool in the future treatment o f stands we have to develop new logging machines and systems especially designed for high productivity and low costs in smallwood. The principle o f handling bundles o f small trees offers some promising solutions. However, a serious obstacle to mechanisation is the damage to the stand caused primarily by the terrain-transportation vehicles. A n expensive and time-consuming development is required to solve this problem. Alternatively, we have to sacrifice the possibilities o f using thinning as an aid in future forest management.

10 FO RESTR Y C O M M ISSIO N B U LL E TIN No. 55
RESUME d e s c o m m u n i c a t i o n se x p o s e i
REsu l t a t s P r el im inaires d e C e r t a in es N o uvelles E xper ien c e s D ano ises D ’Ec la ir c issa g e d e s L p ic Eas d a n s les S ols F ertiles
Par H. BRYNDUM
La communication publie des resultats prEIiminaires de deux essais d’Eclaircies d’Epicea (Picea abies) sur sols riches au Danemark. Les deux essais ont EtE etablis respectivement en 1953 et 1960 dans des jeunes peuplements assez dcnses, qui jusque-la n’ont jamais EtE touches par la hache. Le dernier relevE date de 1973. Les degres d’intensilE d’eclaircies, EtalonnEs par la surface terriere, sont les suivants:
A, B, C, D et D-B, correspondants a des Eclaircies naturelles (temoin), faibles, moyennes, trEs fortes et enfin trEs fortes dans la jeunesse suivies des interventions faibles.Pendant la pEriode d’observation de 20 et 13 ans respectivement, 1’accroissement en volume des deux essais ne semble pas sensiblement influencE par la rEgime d’Eclaircies. Seulement une lcgEre stimulation de l’accroissement fut constatEe dans les intensitEes fortes dans les premiEres annEes. L’accroissement en hauteur est peu correllE avec 1’intensitE d’EcIaircie, par contre l’accroissement en diamEtre est fortement accElErE par les Eclaircies fortes. Ainsi le rEgime d’Eclaircie a eu une influence importante sur la proportion de bois fort dans la production totale, donnant de plus en plus de grandes dimensions avec des intensitEs croissantes. La qualilE du bois d’oeuvre diminue un peu en consEquence d’un dEveloppement plus fort des cimes et des branches, ainsi que d’une decroissance mEtrique plus ElevEe, dans les fortes intensitEs. .
Les risques de chablis semblent plus grands dans les intensitEs fortes, ce phEnomEne est surtout prononcE aprEs une certaine hauteur des peuplements. Dans les jeunes ages les risques de dEgats de neige semblent liEs aux fortes rEductions de tiges. Plus tard, quand les cimes se sont harmonisEs, les faibles intensitEs d’Eclaircies sont par contre les plus sensibles.
Les Eclaircies fortes ont jusqu’a maintenant donnE les revenus nets de loin les plus ElevEs. II va de meme pour la valeur de la production totale (Eclaircies+peuplement sur pied). Aussi les bEnEfices actualisEs sont plus ElevEs dans les degrEs d’intensitEs d’eclaircies fortes.
EXPOSE 2
E ffets d e L ’Ec la ir c issa g e e n L ig n e s u r L ’accro issem ent
Par G. J. HAMILTON
Les rEsultats de cinq expEriences concernant l’Eclaircie en ligne sont prEsentEs. Ils indiquent:a. qu’il y a une rEduction de production tolale en volume qui s’est associEe avec l’Eclaircie neutre, ce
qui est soi-meme implicite par l’Eclaircie en ligneb. que la zone d’influence sur l’Eclaircie en ligne est largement limitEe aux lignes absolument contigues
aux lignes abbattuesc. que la rEaction des lignes extErieures augmente d’une fa?on marquEe a l’Egard de l’augmentation du
nombre de lignes contigues qui sont abattues, etd. que plus les lignes avoisantes sont aballues, plus augmentent en volume les pertes de production.
EXPOSE 3
D E velo ppem ent et R e n d e m e n t d e s P l a n t a t io n s D ’Ep ic Eas N o n L c la ircies en N o r v Ege O c c id e n t a l e
Par O. B0RSET
On a procEdE en NorvEge occidentale it des Etudes sur 31 parcelles de terrain couvertes d’Epaisses [forets d’EpicEas (Picea abies) non Eclaircies alors que l’Etage dominant des arbres de la plupart de ces parcelles Etait de l’ordre de 16 a 25 m. Ces parcelles se trouvaient essentiellement sur des pentes abruptes, bien exposEees et dans un climat humide (quantitE de pluie annuelle de 1500 a 3000 mm). La plupart des arbres sur pied Elaient plantes & des intervalles infErieurs & 1 -50 x 1 -50 m.
La production totale s’est trouvE elre sensiblement la meme que celle des arbres sur pied ayant subi des opErations d’Eclaircies. Les pertes dEcoulant de la mortalitE naturelle ont loujours EtE infErieures a 10%. II semble que les arbres morts aient EtE supprimEs des les premiers stades et que dans 1’ensemble ils soient morts avant d’avoir atteint la

A SP E C TS OF TH INN IN G 11
dimension voulue pour le bloc de sciage. A la hauteur moyenne de 15 m, plus de 80% du volume Etaient generale- ment composes d’arbres ayant un diametre superieur a l l cm, a hauteur de poitrine. A la hauteur moyenne de 20 m, plus de 80% du volume se composaient d’arbres ayant un diametre supErieur a 17 cm, a hauteur de poitrine. On a considere leur santE et leur stability comme Etant adequate.
Les parcelles de terrain non Eclaircies que Ton a considerees se sont mieux developpees qu’on ne l’avait anticipE a la lumiere des resultats obtenus avec les experiences d’Eclaircissage effectuees dans les autres parties des regions septentrionales. L’explication de cet Etat de choses peut se trouver dans le regime favorable des eaux de la parcelle de terrain.
EXPOSE 4
D evelo ppem ent d es S ystemes D ’e c l a ir c issa g e d es C u l t u r e s d e J eu n es fipicEAS S it k a et d e P in s C o n t o r t a
Par G. J. Gallagher
Des experimentations sur le degre d’intensite d’Eclaircie suggerent que l’enlevement d’une troisieme de la metre cube mesuree au compas forestiere de Picea sitchensis a la premiere Eclaircie, et bien que moins sur chez le Pinus contorta, ne donne pas de grandes pertes d’accroissement. Des eclaircies suivantes chez Picea sitchensis de 40-60% d’accroissement periodiques de la surface terriere, ou moins de 40% d’accroissement de contenance au volume doivent permettre la maintenance d’accroissement. Un grand nombre de fagons differentes d’Eclaircir d’intensite assez importante semblent d’avoir un eflet peu considerable sur le rendement au volume, bien que l’eclaircie jardinee puisse etre un peu meilleur. Ces resultats ont engendre des etudes sur d’eclaircie en lignes. Ce sont les methodes les moins cheres que l’on a examinees. Ces poids et ces fafons d’Eclaircir ont ete essayes avec de diverses moyens de recolte et videnage de bois. La recolte d’arbres entiers avec les grandes machines n’a pas encore eu autant de succes que les methodes plus simples avec les tracteurs. On developpe des systemes de cable suspendu pour les terrains accidentes. Pinus cortorta qui a ete eclaircie se montre plus sensible au degat d’ouragon que la Picea sitchensis. Le degat d’ouragon P. sitchensis, eclaircie en lignes, a ete beaucoup moins que l’on aurait cru.
EXPOSE 5
E xper ien c e N eo-Z e l a n d a ise su r le P in R a d ia t a
Par W. R. J. SUTTON
Dans les plantations de Pinus radiata a longue revolution qui n’ont jamais Ete soumises aux eclaircies, il y a des risques serieux d’attaque par les insectes ou par les maladies cryplogamiques. Le premier essai a faire des eclaircies commerciaux n’a pas reussi a augmenter les rendements en bois ou d’assurer des rendements intermediaires en argent. Par consequent, on a developpe un regime alternalif qui donne des rendements pareils en volume mais qui possede une superiorite economique et culturelle. Ce regime comprend un ecartement large, des eclaircies fortes et precoces (sans utilisation du materiel) et des Elagages severes.
EXPOSE 6
R ec h e r c h e s u r L ’ecla ir c issa g e e n A fr iq u e d u S u d
Par A. VAN LAAR
En Afrique du Sud, on a specifie des “experiences sur la tendance des courbes correlatives” de maniEre a pouvoir etudier la relation qui existe entre la densite des parcelles de terrain et la croissance dans les parcelles de futaie reguIiEre. Chaque serie comporte huit parcelles d’espacement oil le nombre des arbres varie entre 125 et 3.000 unitEs a l’hectare. Cette experience est combinee avec une evaluation du volume de la production des parcelles d’Eclaircissage qui font partie des essais. Cela permet l’application des series de croissance a la tendance des courbes correlatives pour faire des pronostics sur la croissance des parcelles d’eclaircissage. La production totale, ainsi que les autres parametres de rendement, ont definitivement ete influences par la densite des arbres sur pied.
On a, de plus, spEcifie des expEriences d’Eclaircissage pour les Pinus radiata et les Populus deltoides sur pied, soit en tant que parcelles expErimentales choisies au hasard ou en tant que blocs ou parties de blocs, et dans ce dernier cas en les combinant avec des opErations d’Eclaircissage. En raison de l’existence d’eflets rEciproques, il est recommandE

12 F O R E ST R Y C O M M ISSIO N B U LL E TIN No. 55
d’etudier simultanEment, par des experiences a facteur jumele, l’influence de PEclaircissage et de l’Emondage sur la croissance des pins sur pied.
Les experiences d’eclaircissage effectuEes sur les Populus deltoides sur pied ont demontre la superiorite de l’utilisation d’une surface basale moyenne en tant que mesure de densite des arbres sur pied. Les experiences effectuees avec les Pinus radiala et les Populus deltoides ont montre une relation curviligne enlre la densile des arbres sur pied et le volume de la production. Pour pouvoir evaluer la concurrence au sein des parcelles Eclaircies a des degres diflerents, les elements variables de concurrence ont ete definis et sont en premier lieu en correlation avec l’accroissement de chaque arbre. La relation qui exisle entre ces elements variables de concurrence el l’accroissement a ElE etudiec grace aux analyses de covariation.
EXPOSE 7
M esure d e L ’espace V it a l - C om plem ent d es E xperiences D ’Ec l a ir c issa g e
Par A. M. JENSEN
Dans un peuplement d’epicEa, (Picea abies) age de 76 ans, et situe a 1 -5 km d’un dispositif experimental d’Eclarcie, 247 arbres individuels ont ete sujet des mesures de precision d’accroissement en volume. L’espace productif de chaque arbre a ete mesure et calcuie avec diflerenls hypotheses de concurrence. Les resultats des mesures sur des arbres individuels sont compares avec les donneees des placetles d’Experiences de I’essai d'Eclarcie. L’applicalion des mesures de l’espace productif d’arbres individuels est finalemenl discutEe.
EXPOSE 8
I n f l u e n c e d e D iffEr en ts T ypes D ’Ec la ircies s u r l a C ro issa n c e et les D o m m ag es a u P eu p l e m e n t . REs u l t a t s d e R ech erch es s u r L ’Ep ic Ea d a n s l a REp u d l iq u e
D ’a l l e m a g n e FEd Erale
Par H. KRAMER
Le but materiel de 1’economie de PEpicEa (Picea abies) en Europe centrale est l’obtention d’une rente foresiierc maximale. En vue d’atteindre ce but il est indispensable d’assurer un accroissement optimal en volume el en valeur et d’eviter les dommages aux peuplements. Un grand ecartement des rangees de plantes a la creation du peuplement et la reduction du nombre d’arbres dans la jeunesse font augmenter I’accroissement de valeur et la resistance a la cassure du peuplement causee par la neige et le vent. II est recommande d’effecluer des eclaircies en bouquets d’arbres, cn lignes ou en tranchees aussi bien que des combinaisons de ces types d’edaircies. Les effets des coupes schemaliques sur I’accroissement et les dommages au peuplement ont ete examines. Une comparaison des 3 differents types d’Eclair- cies, 4 savoir Pedaircie par le bas, l’edaircie par le haut et l’edaircie en lignes montre que, du point de vue economique, les resultats de l’edaircie par le bas sont extremement mauvais (tableau 8.1). Les resultats de I’edaircie par Ie haut et de l’edaircie en lignes sont favorables et a peu pres egaux. D’aprEs l’analyse d’accroissement (Tableau 8.2) l’edaircie par le bas et l’edaircie par le haut fournissent 4 peu pres meme accroissement en volume. L’accroissement en volume dans les 5 premieres annees est inferieur de 8%, mais cetle difference n’est que de 0-6% si on considere une periode de revolution de 100 ans, et est par consequent insignifiante.
L’accroissement des 400 arbres les plus forts=arbres d’avenir est pour l’edaircie en lignes de 5%, pour l’eclaircie par le haut de 14% supErieur 4 l’accroissement sous le rEgime d’eclaircies par le bas. L’eclaircie forte dans les premiEres annEes el particuliErement l’eclaircie par le haut a stimule le developpement de la couronne. ,
Une Eclaircie en ligne extremement forte (Elimination de chaque 4ieme ligne d’arbres dans un peuplement etabli 4 un Ecartement des lignes de 3 m) dans un peuplement 4 Briton n’a pas montrE d’accroissement significatif (en moyenne 3%) en comparaison avec l’Eclaircie individuelle.
Dans un peuplement du Harz qui avait subi 45 ans auparavant une forte rEduction du volume total par l’Elimination de chaque 2icme ou 3ieme ligne, on a pu constater une trEs grande augmentation du volume et de la production de valeur.
La rEduction du nombre d’arbres dans les peuplements jeunes trEs denses 4 EtE effectuEe a l’aide d’un caterpillar spEcial qui coupait 4 8m d’intervalle des coulisses de 2 m 50 de largeur. Ce procEdE de travail est IrEs bon marchE et les dommages au reste du peuplement sont pratiquement inexistants.
A la premiEre Eclaircie, oil une methode de coupe en bris court a EtE employEe (bois d’industrie avec Ecorce d’une longueur de 2 m, 3 diffErents procEdEs d’Eclaircies en tranchEes ont EtE examinEs. La largeur des coulisses Elait de 4 m 50 et l’Ecartement entre deux coulisses variait entre 3 m et 15 m. A (’exception du plus petit Ecartement le procEdE d'Elimination schEmatique d’arbres a EtE combinE avec une Eclaircie de sElection d’arbres dans les entrelignes. L’Eclaircie en tranchEes avec un Ecartement Etroit des coulisses a produit le plus grand accroissement en volume, en meme temps de trEs forts dommages ont EtE causEs aux arbres restanls. Aucun dommage au sol et aux racines

A SP E C TS OF THINN IN G 13
n’a eu lieu a cause de la couverture de brindilles existantes. La methode de coupe en bois long cause plus de dommages (particulierement k l’empatlement des arbres) que le procede de coupe en bois court.
Les degats causes par Ie vent sonl parliculterement frequents dans les peuplements ages. Les jeunes peuplements qui avaient re?u un traitement d’eclaircie forte, egalement ceux qui ont ete l’objet d’eclaircie en lignes et en tranchees ont bien supporte 1’ouragan de novembre 1972. En ce qui concerne les bris de neige les jeunes peuplements d’epicea sont les plus menaces. Le pourcentage des abres endommages augmente proportionnellement au rapport (hauteur/ diametre) et cst inversement proportionnel au pourcentage de couronnes (voir graphiques 8.1 et 8.2). A l’inlerieur du peuplement les bris de neige diminuent sensiblement avec l’augmentation du diametre des arbres. Les experiences concernant les dommages causes par la neige aux peuplements eclaircis en lignes ou en tranchees sont differentes, dependant de 1’etat du peuplement et de l’espace de temps entre l’eclaircie et l’apparition des dommages. La periode de plus grand danger du peuplement se situe immediatement apres l’eclaircie. Les dommages causes apres une eclaircie schematique sont pratiquement sans importance, car les arbres touches sont le plus souvent ceux qui normalcmenl seraienl elimines par une eclaircie par le bas.
EXPOSE 9
P o in t s de V ue su r le C h o ix d es M eth o des d e S y l v ic u l t u r e et d es T ec h n iq u es D ’a b a t t a g e d a n s les O p e r a t io n s D ’eclaircies
ParJORAN FRIES
On a effectue des etudes pour evaluer les degats causes au cours des operations d’eclaircies par les vehicules lourds. Les degats infiiges au sol et aux racines augmentent rapidement lorsque la capacile porleuse du sol diminue. Les dechets provenant des arbres abattus reduisent d’une maniere substantielle les degats sur les routes de traction. Les degats aux racines des epiceas ayant plus de 2 cm de diametre peuvent causer des infections putrides, lesquelles provoqueront, si elles se trouvent situees a proximite de l’arbre (moins de 0-50 m), une infection du tronc meme de l’arbre. Les degats infiiges au pin d’Ecosse provoquent rarement une infection putride. On donne un exemple de la maniere dont on peut utiliser la simulation pour trouver une meilleure combinaison des methodes dc sylviculture et dcs techniques d’abattage.
EXPOSE 10
I n f l u e n c e des D ifferents S ystemes D ’eclair cie su r la D et erio ratio n d u S o l et D es A rbres
Par H. A. FROEHLICH
La deterioration du sol et des arbres causee par la technique d’eclaircie est un sujet d'inquielude grandissant avec le developpement de la mecanisation. Les pertes effectives des arbres restant ou des nouvelles pousses apres la coupe ne sont pas encore bien ddfinies. Des resultats tres variables ont ete rapportes dans les eludes d’eclaircie. La variation des resultats est due aux differences dans Ie facteur de site, le facteurde position et le facteur operationnel. II est expose un concept g6neral d’interrelation de ces facteurs. La nature et 1’humidite du sol au moment de l’operalion d’eclaircie sont les facteurs principaux qui affectent la compacile du sol. La perturbation des sols par les chutes el coupures a aussi 6te mentionnee comme la cause de deterioration du sol et des arbres. Les arbres par leur espece different dans leur reponse a la deterioration due k la compacite du sol, aux racines briseees, ou aux blessures du tronc.
La deterioration du sol et de l’arbre due aux differentes techniques d’eclaircie ne peut pas etre completement separee des facteurs de site et de position. La difference principale dans l’impact des differents systemes d’edaircic est apparemment due a la pression du sol et a l’intensite et a la frequence de l’operation.
Une etude d’eclaircie d’un bois de pins Douglas (Pseudotsuga menziesii) ages de 35 ans par un tracteur operant en l’air et au sol montre une grande difference dans l’etendue de la deterioration du sol et de sa compacite. Relative- ment peu de difference a ete observee dans le pourcentage de troncs endommages. Les blessures des arbres causees par eclaircie au tracteur avaient lieu generalement pres du niveau du sol el etaienl plus souvent sujets au pourissement qu’i des blessures de la cime.
De plus amples recherches sont necessaires pour qu’il soit possible de predire les perles effectives dans la croissance des arbres dues a une deterioration visible du sol et du tronc.

14 F O R E ST R Y C O M M ISSIO N B U LL E TIN No. 55
V o ilA les M a c h in e s q u i A r r iv e n t , les V o ilA q u i A r r iv e n t
Par HAROLD E. YOUNG
L’heureuse adaptation du Chiparvestor mobile realise par les Industries Morbark, Inc. en tant que composant majeur d’un systeme mecanise d’exploitalion des forets et l’emploi tout aussi heureux de copeaux encore non separds de l'dcorce par des usines fabriquant des produits reconstitues nous a fait entrer dans une nouvelle ere en ce qui concerne la recolte et l’emploi des produits principaux de la foret. Le marche extremement lucratif a encourage un certain nombre de compagnies d’equipement a crder des machines de diverses tailles, mobiles et automotrices, destinecs a servir a la fois a couper simplement et a menager des eclaircies. Beaucoup de gens qui s’occupent de sylviculture s’inquietenl de ce que l’cmploi dc telles machines puisse avoir pour resultat de pratiquer des coupes excessives et d’endommager les forels. Ces deux resultats sont possibles mais peu probables car nous nous adapterons aux machines qui seront a notre disposition et nous les controlerons.
La recolte mecanisde est une solution a l’insuffisance dc main d’oeuvre dans ce genre de travail. En depit du cout elcvd des machines, on constate une baisse de prix du bois livrd aux usines. On prevoit de plus qu’apres quelque temps personne ne songera plus a eclaircir les forets avant la pdriode “commerciale”, ce qui veut dire que ccux qui s’occupent de sylviculture pourront agir sur la foret pour controler, sans aucun frais, et parfois d’une maniere lucrative, l’espece, la densite et la qualite.
EXPOSE 12
L a T e c h n iq u e D ’eclaircie - M o yen et P rodleme d ’ u n e S il v ic u l t u r e S o ig nee
Par S. HABERLE
La technique d’eclaircie doit s’orienter a trois objectifs principaux:- en premier lieu elle doit satisfaire le but a long terme qui est d’obtenir des peuplements a plein degre
de couvert et constitues par des arbres de grande dimension et de belle forme.- ensuite, comme but a terme moyen, il s’agit de crder dans le peuplement un systenie de voies pour
faciliter toutes les operations poslcrieures.- enfin, comme but a court terme, elle doit garantir la rentabilite des travaux de recolle.
Pour l’dpicea (Picea abies) un procede est recommande qui comprendrait la periode allant de l’age de perchis jusqu’a la maturitd du peuplement, et qui peut satisfaire a la fois les trois objectifs sus-cites.
En ce contexte il faut prendre en consideration les regies suivantes:Plus un peuplcmcnt cst jeune, plus des coupes schematiques sont convenables.En ce qui concerne la technique du travail, les coupes schematiques s’effectuent a 1’aide d’un “harvester pour faibles dimensions” qui peut dtablier des lignes de 4 a 5 metres de largeur en realisant les travaux suivants: abatlage, dbranchage, fa?onnage, ramassage et deposition du bois dans les lignes.
La larguer des bandes restantes varie de 20 a 30 metres. Sur ces bandes Pintervention s’effectue en forme d’une eclaircie selective.
Dans dcs peuplements jeuncs les tiges sont fa?onnees en troncs d’une longueur standard de 2 metres, tandis que les arbres provenants des peuplements d’un age plus avance se fagonnent comme bois long.
Dans des fulaise le sysleme SERIAS doit s’appliquer. II s’agit lk d’dlaguer et de cortiquer les arbres a recolter sur pied, une intervention selective, qui se realise sans aucun donimage chez le peuplement restant.
S’il n’y a pas de revenu a cause d’une relation defavorable entre le prix du bois et le cout du fagonnage, on pcut favoriser les arbres d’avenir cn tuant lcurs concurrents au moyen des substances toxiques, appliquees en forme d’une cartouche d’injection scion un procedd du docleur STERZIK.
Cette mesure ne pcut pas etrc pratiquee ou l’attaque et l’expansion de coleopteres sont a craindre.En ce cas il faut recourir aux methodes mecaniques meme si celles-ci soient deficitaires a court terme, car l’objectif
it long terme, e’est la foret soignee, capable de remplir ses fonctions ecologiques et dconomiques de fagon adequate. Ce but doit prdvaloir independamment de la relation prix-cout au moment des travaux d’dclaircie.
EXPOSE 13
E c la ir c issa g e F o r est ier : E t a t des C hoses d a n s le N o r d - O uest P a cifiq ue
Par D. E. AULERICH
L’dclaircissage des forets dc pin Douglas (Pseudotsuga menziesii) de la region du Nord-Ouest Pacifique devient de plus cn plus frdquent au fur et il mesure que de nombreux jeunes plants remplacent les vieux. Bien que la majeure
EXPOSE I I

A SP E C TS OF TH INN IN G 15
partie des operations en cours soient effectuees par des vehicules a traction horizontale, des tracteurs munis de chenilles ou de pneumatiques, on se tourne de plus en plus vers la technique de l’eclaircissage a cable. Cet etat de choses est du principalement a la configuration escarpee du terrain et a la fragility des sols qui caracterisent une grande partie de la region.
Le responsable des coupes doit rdsoudre deux problemes majeurs: mettre les foresliers a meme de traiter des jeunes bois ainsi que se procurer du materiel adequat.
Les problemes de charriage mechanique des jeunes bois sont a l’etude. Les resultats permettront d’elaborer de futurs outillages et de futurs techniques destinees a traiter et, en premier lieu, a hisser les jeunes bois le long de penles abruptes.
EXPOSE 14
P roblem es d e L ’e x t r a c t io n des E c la ir c ies a u M o y en d e T reu ils a C ables d a n s le R o y a u m m e - U ni
Par J. A. DRUMMOND
Les grues a cables, utilisees au Royaume-Uni, sont des marques d’une amplitude courtc ou moyenne. Elies sont sensibles au rendement d’eclaircies, particulierement dans les periodes initialles.
Les degats dans la recolte et au sol sont tres limites ct il n'y a aucune indication d’inslabilile aux vents produits par les esquisses utilisees.
EXPOSE 15
S ystem es M eca nises D ’ec l air cissag e
Par CARL J. BREDBERG
L’augmentation rapide des couts d’eclaircir a provoque une reduction du volume de ces travaux. Si Ton estime que l’eclaircie sera necessaire dans le traitement futur des peuplements, nous serons obliges de developper des nouvelles machines et des methodes specialement con?ues en vue d’obtenir une haute productivity et les frais basses, dans le domaine de l’exploitation de bois de petites dimensions. Le principe de manipuler les pelites arbres en paquets, offte une solution avantageuse. Un obstacle s6rieux & la mdcanisation sont cependant les degals au peuplement, qui sont causes surtout par des vehicules tous-terrains de transport. Un developpement couteux qui fait perdre du temps est necessaire pour rcsoudre ce probleme. L’alternative est que dans l’avenir nous serons obliges de renoncer a nos possibility d’eclaircir.

16 A SP E C TS OF TH INN IN G
ZUSAMMENFASSUNG DER STUDIEN
RETERAT I
V o r l a u fig e E rgebnisse E in ig e r N eue r D a n isc h e r D u r c h f o r st u n g sv e r su c h e
m it F ichte
Von H. BRYNDUM
Dieser Berichl enlhalt vorlaufige Ergebnisse zweier Fichtendurchforstungsversuche (Picea abies) auf fruchtbarem Boden in Danemark. Die Versuche sind 1953 und 1960 in jungen noch nicht durchforsteten Pflanzungen angelegt worden; die letzte Aufnahme stammt aus dem Jahre 1973. Die Behandlungen, angepasst an Grundfiiiche, sind wie folgl:
A, B, C, D und D-B, cntsprechen keiner, schwacher, mittelstarker, schr slarker und im jungen Besiand sehr starker, spiiler schwacher Durchforstung.
In beiden Versuchen war der Massenzuwachs wahrend der Versuchsperiode von 20 bzw 13 Jahren bcinahe der gleiche bei alien Behandlungen, mit etwas Mehrzuwachs bei den stiirkeren Graden in den ersten Jahren. Der Hohen- wuchs wird nicht oder nur wenig von der Durchforstung beeinflusst, wogegen der Durchmesserzuwachs mit zuneh- mendem Durchforstungsgrad stark zunimmt. Die Durchforstungsslarke hat einen entscheidenden Einfluss auf die Dimensionsverteilung der Gesamtetzeugung gehabt; mit steigender Inlensitat der Durchforstung verlagert sich die produzierte Holzmasse von den mittleren zu den hoheren Durchmesserklassen.
Die Qualitat des Holzes ist etwas verringert mit zunehmender Durchforstung, die Kronenansatzhohe wird kurzer, die Abholzigkeit grosser ebenso wie der Astdurchmesser. Es wurde kein Zusammenhang zwischen Faulnisbefall und Durchforstung nachgewiesen, es steigt aber die Slurmfallgefahr mit zunehmender Durchforstungsstarke, besonders bei grossercn Bestandeshohen. Wahrend der erslen Jahre nach den starken Eingriffen ergibt sich auch Schneebruch- gefahr, spater allerdings, wenn sich regelmassige Baumkronen geformt haben, ist cin stark durchforsteter Bestand schneebruchsicher.
Bisher haben die starken Durchforstungen den grossten Netloerlos ergeben. Die Gesamtwertleislung, d.i. der Wert der Durchforstungen und des Bestandes, im Alter 38 bzw 34 Jahren ist bei der starker Durchforstung am grbsslen; das glciche gilt fur den Kapitalwert. Die Wertleistung steigl noch mit zunehmendem Alter erheblich an.
REFERAT 2
A u s w ir k u n g e n d er R e ih e n d u r c h f o r s t u n g a u f d e n Z u w a c h s
Von G. J. HAMILTON
Die Ergebnisse von fiinf Reihendurchforstungsversuchen legen die folgenden Schlusse nahe:a. ein Verlust an Gcsamtderbholzleislung tritt im Zusammenhang mit dem neutralen Durchforstungs-
system - unbedingt in der Reihendurchforstung - auf.b. der Einflussbereich der Reihendurchforstung beschriinkt sich zum grossen Teil auf die den abgeraumten
Reihen nachstliegenden Reihen.c. die positive Reaktion der Aussenreihen (d.h. der unmittelbaren Nachbarn der abgeraumten Reihen)
steigt merklich an, wenn die Zahl der nebeneinanderliegenden Durchforstungsreihen vergrossert wird und.
d. grossere Vcrlusle an Gesamtderbholzleistung entstehen in Verbindung mit vergrosserter Anzahl von nebeneinanderliegenden Durchforstungsreihen.
REFERAT 3
E n t w ic k l u n g u n d E r t r a g U n d u r c h fo r ste ter F ic h t e n p f l a n z u n g e n in W estno rw eg en
Von O. B0RSET
Es wurden 31 undurchforstetc, dicht bepflanzte Picea abies Fliichcn in Weslnorwegen unlersucht, wobei die Oberhohe bei den meisten Flachen 16-25 m betrug. Die Flachen lagen hauptsachlich an steilen Hangen in guter Lage und in feuchtem Klima(jahrliche Niederschlagsmenge 1500-3000 mm). Die meisten Bestande wurden mit einem Pflanzabstand von weniger als 1,5 m begrundet.
Die totale Massenproduktion unterschied sich weniger von derjenigen in durchforsteten Bestanden. Der Verlust an Masse in der Selbstdurchforstung betrug fast immer weniger als 10%. Tote Baume scheinen fruh unterdruckt worden zu sein und sind im allgemcinen abgcslorbcn bcvor sie die Sagcholzgrosse erreicht haben. Bei einer mittleren

ASP E C TS OF TH INN IN G 17
Hbhe von 15 m bestand im allgemeinen mehr als 80 % des Volumens aus Baumen mit einem BHD von iiber 11 cm. Bei einer mittleren Hohe von 20 m machten die Baume mit BHD uber 17 cm mehr als 80% des Volumens aus. Gesundheit und Stabilitat wurden als genugend betrachtel.
Die untersuchten undurchforstelen Bestande haben sich bcsser entwickelt als auf Grund von Erfahrungen aus Durchforstungsversuchen in anderen Teilen nordlichcr Gebiete zu erwarten war. Der Grund mag im vorteilhaften Wasserhaushalt der Bestande (hohe Niederschlage) zu suchen sein.
REFERAT 4
D ie E n t w ic k l u n g v o n D u r c h f o r s t u n g s - u n d E r n t e -V er fa h r en in J u n g e n F ic h t e n -u n d K ie fe r n sta n d e n
Von G. J. GALLAGHER
Versuchsergebnisse haben gezcigt, dass der Aushcib von ein Driltcl des stehenden Vorrats gleich bci der erstcn Durchforstung von Sitka-Fichle (Picea sitchensis) keinen grossen Vcrlust von Masscnzuwachs verursacht und bci der Drehkiefer sich noch etwas weniger bemerkbar macht. Eine grosse Anzahl verschiedener Durchforstungsverfahren miissigen Grades scheint die Massenleistung nur wenig zu beeindussen; Plenterdurchforstungen durften vielleicht ein wenig besser sein. Diese Ergebnisse haben zu einer Untersuchung der Reihendurchforslung mit Entnahme jedcr dritten oder zweiten Reihe gefuhrt. Von den untersuchten Verfahren sind diesc Reihendurchforstungen mit dcm geringsten Kostenaufwand verbunden. Diese Durchforstungsverfahren wurden in Verbindung mit verschiedenen Holzernte- und Bringungsverfahren gepruft. Das Ausbringen ganzer Baume mit Grossmaschinen hat sich noch nicht so erfolgreich ervviesen wie einfachere Verfahren. Die Hochseilsysteme werden fur hiigeliges Terrain entwickelt. Pinus coiilorta scheint gegen Sturmschaden mehr empfindlich zu sein als die Sitka-Fichte. Sturme dcr jiingsten Zeil haben an der Sitka-Fichte viel weniger Schaden verursacht als erwartct.
REFERAT 5
N e u seela nder E r f a h r u n g e n mit P in u s r a d ia t a
Von W. R. J. SUTTON
Undurchforslete Pinus radiata Bestande mit langen Umtriebszeiten habcn ein hohes Risiko von Krankheilen und Schadlinge befallen zu werden. Die ersten umfangreicheren Versuche Durchforstungen mit einem Reinerlos durchzufuhren brachten keinen hohercn Gesamlzuwachs und keine hohere Durchforslungsertragc. Daraufhin wurdc ein neues Bewirtschaftungssystem entwickelt, dass in der Gesamtzuw'achsleistung gleichwertig und wirtschaftlich und waldbaulich uberlegen war. Dieses System arbeitet mit weiten Anfangsverbanden, starker fruher Durchforstung ohne Verwertung des Holzcs und starker Wertastung.
REFERAT 6
F o r s c h u n g in d e r D u r c iif o r s t u n g in S u d a f r ik a
Von A. VAN LAAR
In Siidafrika sind Pflanzerbandversuche (Correlated Curve Trend Experiments) angelcgt wordcn zur Erforschung des Zusammenhanges zwischen Bestandesdichle und Wachslumsablauf gleichjahriger Waldbeslandc. Die einzelnc Wuchsreihe umfasst 8 Verbandsflachen mit Stammzahlen zwischen 125 und 3000 je Hektar. Der Versuch wird kombiniert mit einer Erfassung der Volumenleistung auf Durchforstungsflachen, die ein Teil des Versuchsplans sind. Dies ermoglicht die Anwendung von C.C.T.-Wuchsreihen fiir die Wachstumsprognose in Durchforstung- flachen. Die Gcsamtwuchsleistung sowie auch andere ertragskundliche Grossen werden entscheidend durch Be- standesdichte beeinflusst.
Zusatzlich sind Durchforstungsversuche in Pinus radiata und Popuhts flWro/Vfcr-Bestanden angelegt worden, entweder als vollstandig randomisierte Versuchsanlage oder als Block-oder als Spalianlage, im letzteren Fall in Kombination mit Astungsbehandlungen. Wegen der Existenz von Wechselwirkungen ist die gleichzeitige Erforschung der Einflusse von Durchforstung und Astung auf den Wachstumsablauf von Kiefernbcstanden in Zweifaktorvcrsuchen empfehlenswert.
Durchforstungsversuche in Popidus deltoides- Bestanden zeigten die (jberlegenheit der miltleren Grundflachenhaltung

18 FO RESTR Y C O M M ISSIO N B U LL E TIN No. 55
als Kriterium fur Bestandesdichte. Die Versuche mit Pinus radiata und Populus deltoides zcigten einen kurvilinearen Zusammenhang zwischen Bestandesdichte und Volumenleistung.
Zur Erfassung des Konkurrenzdruckes innerhalb der in unterschiedlicher Starke durchforsteten Flachen wurden Konkurrenzvariablen definiert und zunachst mit dem Zuwachs von Einzelbaumen korreliert. Der Zusammenhang zwischen diesen Konkurrenzvariablen und dem Zuwachs wurde kovarianzanalytisch untersucht.
REFERAT 7
M e ssu n g e n des W a c iisr a u m s - eine E r g a n z u n g v o n D u r c h e o r st u n g sv e r su c h e n
Von A. M. JENSEN
In einem 76 jiihrigen Bestand von Fichten (Picea abies) nahe einem Durchforstungsversuche sind an 247 Einzcl- biiumen genaue Massenzuwachsmcssungen gemacht. Slandraum ist gemessen und berechnct unter Beriicksichtigung
In einem 76 jahrigen Bestand von Fichten (Picea abies) nahe einem Durchforstungsversuche sind auf 247 Einzel- biimen genaue Massenzuwachsmenssungen gemacht. Standraum is gemessen und berechnet unler Beriicksichtigung verschiedener Konkurrenzverhaltnisse. Die Ergebnisse der Einzelbaummessungen sind mit dem Ergebnis des Durchforstungsveisuchs vcrgleichen. Die Verwcndung von Standraummessungen ist schliesslich diskutierl.
REFERAT8
D er E in f l u ss v er sc h ied e n er D u iic h f o r st u n g sa r t e n a u f W a c h stu m u n d B e s t a n d s - s c h a d e n . U n t e r su c h u n g se r g e b n isse a u s F ic h t e n b e st a n d e n in d e r B u n d e sr e p u d l ik
D e u t s c h l a n d
Von H. KRAMER
Das maleriellc Ziel der Fichlcnwirlschaft (Picea abies) in Mitteleuropa, dcr hdchste Waldreinertrag, beinhaltet eine optimale Zuwachs- und Wertleistung und die Vermeidung von Bestandesschaden. Weite Bestandesbegriindung und fruhzeitige Stammzahlverminderung erhohen den Wertzuwachs und die Bestandessicherheit gegen Schnee und Wind. Zur Rationalisierung der ersten Durchforstungen eng begrundeter Fichtenbeslande werden Auslese-, Reihen- odcr Gassendurchforstungen sowie Kombinationcn dieser Durchforstungsarten empfohlen. Die Auswirkungen der schemalischen EingrilTe auf Zuwachs und Bestandesschaden werden untersucht. Ein Vergleich von Niederdurchfor- stung, Auslcsedurchforstung und Reihendurchforstung (Tabelle 8.1) zcigt, dass die Niederdurchforstung betriebswirt- schaftlich extrem schlecht abschneidet. Auslese-und Reihendurchforstung sind etwa gleich gunstig. Gemass der Zuwachsanalyse (Tabelle 8.2) haben Niederdurchforstung und Auslesedurchforstung nahezu den gleichen Volumen- zuwachs. Der 5-jahrige Massenzuwachs ist 8% niedriger, wirkt sich aber auf die Umtriebszeit von 100 Jahren (mit 0,6%) kaum aus. Der Zuwachs der 400 starksten Baume (=Zukunftsbaume) ist bei der Reihendurchforstung 5%, bei der Auslesedurchforstung 14% hoher als bei der Niederdurchforstung. Die friihe starke Durchforstung hat die Kronenentwicklung gefordert (Tabelle 8.3), am besten bei der Auslesedurchforstung.
Bei ciner extrcmcn Reihendurchforstung (Entnahmejeder 4. Reihe eines in 3 m-Reihenabstand stehenden Fichlenbe- standes) mit Durchforstungsgassen von 6 m Breite in Brilon konnte gegenuber der individuellen Niederdurchforstung kein gesicherter Zuwachsverlust (im Mittel 3%) nachgewiesen werden (Tabelle 8.4).
Ein heute 100-jahriger Fichtenbcstand im Harz, bei dem vor 45 Jahren 2/3 des Vorrates durch Entnahme jeder 2. und 3. Reihe entnommen wurde, zeigt eine sehr hohe Massen- und Wertleistung (s. Tabelle 8.5).
Fur die Maschinelle Stammzahlverminderung extrem dichter, 8 m hoher Fichtenbestande wurde eine Spezialraupe verwendet, die im Abstand von 8 m 2,5 m breite Gassen abschnitt und niederdruckte. Die Massnahme war extrem billig. Folgeschaden sind nicht eingetreten.
Bci Erstdurchforstung unter Verwendung einer Kurzholzmethode (2 m langes Industrieholz mit Rinde) wurden drci verschiedene Gassendurchforstungen gepruft (Gasscnbreite 4,50 m Gassenabsland von Gassenrand zu Gassenrand 3 m bis 15 m). Mit Ausnahme des extrem engert Gasscnabstandes wurde der schematische Eingriff mit einer Auslesedurchforstung im Zwischenstreifen kombiniert. Die reine Gassendurchforstung im engen Abstand hatte die grosste Leistung, jedoch auch die slarksten Schiiden an den Baumen. Boden- und Wurzelschaden wurden durch die auf den Gassen liegende Rcisigdecke vermieden.
Bei Verwendung der Baumholzerntemethode werden i.a. grossere Schaden (besonders am Stammfuss) als bei der Kurzholzmethode verursacht. .
Windschadcn treten besonders bei alteren Fichlenbestanden auf. Starkere Durchforstungseingriffe in Jungbestanden auch Reihen- und Gassendurchforstungen - haben die Sturmkatastrophe vom November 1972 i.a. gut uberstanden.
Durch Schneebruch sind dagegen besonders die jungeren Fichtenbestande gefahrdet. Das Ausfallprozent durch Schncc steigt proportional mit dem Hohen /Durchmesser= Verhaltnis und umgekehrt mit dem Kronenprozent (s. Abbildung 8.1 und 8.2). Innerhalb eines Bcstandcs nimmt der Schneebruch mit zunehmendem Durchmesser dcutlich ab (Abbildung 8.3). Die Erfahrungen uber Schneebruchschaden nach Gassen- und Reihendurchforstung sind uneinheitlich, abhiingig vom Bestandeszustand und dem Zeitabstand zwischen Durchforstung und Eintritt des

ASP E C TS OF TH INN IN G 19
Schadens. Unmittelbar nach der Durchforstung ist der Bestand am labilsten. Der nach schemalischcr Durchforstung auftretende Schaden ist unbedeutend, da hierbei lediglich die schwachen Baume betroflen werden, die bei ciner Niederdurchforstung bereits entnommen waren (s. Abbildung 8.4).
REFERAT9G e sic h t spu n k t e z u r W a h l v o n W a l d b a u m e t h o d e u n d E r n t e t e c h n ik
bei D u r c h f o r s t u n g e n
Von JORAN FRIES
Schaden durch schwere Maschinen in Durchforstungen sind untersucht worden. Der Umfang der Schaden am Boden und an Wurzeln steigt schnell mit abnehmender Tragfahigkeit der Boden. Reisig und Zweige von gefallten Baumen auf den Transportwegen reduziert die Schaden stark. Schaden an Fichtenwurzeln stacker als 2 cm verursachen Faule, die, wenn der Schaden nahe am Baum gelegen ist (<0-5 m), in den meisten Fallen auch zur Stammfaule fiihren. Schaden an Kiefer verursachen nur sehr selten Fauleangriffe. Ein Beispiel ist gegeben, wie man mit Simulierung die beste Kombination von Waldbaumethode und Erntetechnik finden kann.
REFERAT 10
D er E in fl u ss V ersc h ied e n er D u r c h fo r stu n g ssy stem e a u f S c h a d e n a n B o d e n
u n d B a u m e n
Von H. A. FROEHLICH
Mit zunehmender Mechanisierung wachst die Sorgc, dass Durchforstung potentiell dem Boden und den Baumen schaden kann. Der tatsachliche Wachstumsverlust der Baumruckstande oder Samlinge nach dem endgiiltigen Fallen ist noch nicht genau bestimmt worden. Durchforstungsstudien zeigten sehr unterschiedliche Ergebnisse. Diese Ergebnisse sind so verschieden infolge von Unterschieden in Standort-, Bestand- und Belriebsfakloren. Es wird ein allgemeiner Begriff der Wechselbeziehungen dieser Faktoren gegeben. Bodenstruktur und Bodenfeuchtigkeit zur Zeit der Durchforstung habcn die grosste Auswirkung auf Bodendichtigkeit. Der Einfluss von Mull und Eauni- zertriimmerung auf Passierbarkeit des Bodens sind ebenfalls als Faktoren genannt worden, die Unlcrschicde in Boden- und Baumschaden hervorrufen. Baumarten unterscheiden sich erheblich in ihrer Empfanglichkeit fur Schaden durch Bodendichtigkeit, abgebrochene Wurzeln oder Stammwunden.
Boden- und Baumschaden infolge verschiedener Durchforstungssysteme konnen nicht vollig von den Standort- und Beststandfaktoren getrennt werden. Der Hauptunterschied in der Auswirkung verschiedener Durchforstungssysteme ist offenbar eine Folge des Bodendrucks und der Intensitiit oder Haufigkeit ihrer Anwendung. Eine Untersuchung der Durchforstung eines 35-Jahre alten Douglastannenbeslandes mit Hochseilsystem und Raupenschlepper zeigt einen grossen Unterschied im Ausmass der Bodenbeschadung und Bodendichtigkeit. Relativ geringer Unterschied wurde im prozentualen Anteil dcr Stamme mit Wunden beobachtet. Baumwunden durch Traktordurchforstung waren im allgemeinen nahe dem Boden und moglicherweise anfalliger fur Wurzelinfektionen als Hochseilwunden.
Viel Forschung ist notwendig, um eine Vorherbestimmung des tatsachlichen Wachstumsverlusts durch sichtbaren Boden- und Stammschaden zu ermoglichen.
REFERAT 11
D ie M a sc h in e n k o m m en , D ie M a sc h in e n ko m m en
Von HAROLD E. YOUNG
Die erfolgreiche Anwendung der motorisiertcn Holzhachselmaschine von Morbark Industries, Inc.. als wesentlicher Teil eines mechanisierten Holzernleverfahrens und die ebenfalls erfolgreiche industriellc Vcrwendung der Holzhachsel mit Rinde durch Industrie-zweige, die daraus neue Holzprodukte herstellen, hat eine vollige neue Ara im Ernteverfahren wie auch in der Verwendung der Holzhauplproduktion eingeleitet. Der eintragliche Absalzmarkt hat eine Anzahl von Maschinenfabriken ermutigt, Maschinen verschiedener Grossen mit Fremd- und Eigenantrieb zu konstruieren. die sowohl beim Kahlschlag als auch im Ausleseverfahren Verwendung finden konnen.
Viele Forstwirtschaftler sind jetzt besorgt, dass die Anwendung solcher Maschinen zu einem Ubcreinschlag und zu Waldschaden fiihren wird. Beides ist moglich, doch unwahrscheinlich, da wir uns in zunchmendem Masse an die uns zur Verfugung stehenden Maschinen gewohnen und sie zu kontrollieren lernen.
Mechanisierte Holzernte ist die Antwort auf den bestehcnden Forslarbeitermangel. Trotz dcr hohen Anschaffungs- kosten der Maschinen ist aber dennoch ein Absinken des Holzpreises beim Abliefern bei den Sagcwerken zu verzeichnen.

Es wird ferner erwariet, dass es in Zukunfi keinen “vorkommerziellen” Einschlag mehr geben wird, was bedeuten wiirde, dass professionelle Forstwirischaftler den Wald manipulieren konnen, um die Arten, Dichte und Qualitat zu kontrollieren, und zwar kostenlos und manchmal sogar mit Gewinn.
20 F O R E ST R Y C O M M ISSIO N B U LLETIN No. 55
REFER AT 12
D ie D u r c h f o r s t u n g s t e c h n ik als M ittel u n d P roblem einer P fleg lich en W a l d b e w ir t s c h a f t u n g
Von S. HABERLE
Die Durchforstungslcchnik muss sicli an drci Ziclspharen orientieren:einer langfristigen, welche anstrebt, im Umtriebsalter vollbestockle Fliichen moglichst wertvoller und stark dim:nsionierter Biiume zu haben,eincr mittelfristigen, welche der Besiandeserschliessung gewidmet istund einer kurzfrisligen, welche die Wirtschaftlichkeit der momenlanen Holzcrnlemassnahmen im Auge hat.
Es wird vcrsucht, fur die ganze Spanne der Fichlcndurchforstung vom jungen Stangenholz bis zum Baumholz Arbeitslechniken darzustellen, welche diesen drei Zielspharen in optimaler Kombination gerecht werden.
Dabei gelten folgende Grundsatze:Je junger der Bestand ist, desto eher sind schematische Eingriffe zulassig. Arbeitstechnisch werden die schematischen EingrifTe mit Hilfc eines Durchforslungs-Vollerntcrs bewerkstclligt, der Gassen von 4-5 m Brcite hcrstellen kann und folgende Bearbeitungsgange ausfiihrt: Fallen, Enlasten, Einschneiden, Sammcln, Ablcgen in der Gasse.
Die Gassen haben Abstiinde von 20-30 m. Auf den dazwischen verbleibenden Streifcn finden selektive Entnah- mcn statt. In jungeren Bestanden werden 2 m - Standardlangen ausgcformt, in mittclallen und alteren Bestanden eher Langsortimente.
In Baumholzern kommt das SERI AS - System zur Anwcndung, bei dem die zu erntenden Biiume stehend cnlastet und entrindct werden. Das System gestattet sehr bestanaesschonende seleklive Durchforslungseingriffe.
Ist der ausscheidende Bestand zufolge ungiistiger Relationen zwischen Holzpreisen und Aufarbeitungskosten nicht mit Gewinn verkiiuflich, so kann man die Zukunftsstamme in der Weise begunstigen, dass man ihre Bedranger mit Hilfe der von Dr STERZIK. entwickelten Pflegepatrone abtotel. Dieses Vorgehen ist nur zulassig, wenn keinc Kiifergefahr besteht; andernfalls lassen sich mechanische EingrifTe nicht umgehen, auch wenn die Massnahme kurzfristig gesehen defizitar isl, denn das langfristige Ziel eines geplTegten Waldes verlangt Durchforstungen ganz unabhiingig von der momenlanen Preis-Kosten-Siluation.
REEERAT 13D u r c iif o r s t u n g : D er St a t u s im P azifiscfiem N o r d w e st e n der USA
Von D. E. AULERICH
Mchr und mchr wcrdcn Durchforstungen von Douglasienbesliinden (Pseudotsuga menziesii) im pazifischem Nordweslen der USA durchgefuhrt, wo Jungbestande den Platz des Urwaldes in zunehmendem Masse einnehmen. Obwohl Ketten- und gummibereifte Fahrzeuge zur Riickung bevorzugt herangezogen werden, wachst das Interesse I'iir Durchforstungsseilbahnen hauptsachlich der steilcn Hange und des leicht erodierten Bodens wegen.
Schwicrigkeiten bei der Aufbringung und Ruckung von Durchforstungsholzern ergeben sich besonders bei der Umstcllung, die fur die Arbeitskrafte notwendig wird, und bei der AnschafTung von Maschinen.
Die Probleme, die sich mit Ruckeanlagen- und systemen bei der Aufbringung von Schwachholz ergeben, werden hier aufgezeigt. Diese Information wird fur die zukunftige Entwicklung von Ruckeanlagen und- methoden hauptsachlich fur Schwachholz auf steilem, schwer zuganglichem Gelande wertvoll sein.

ASP E C TS OF TH IN N IN G 21
REFERAT 14
P roblem e der A u s b r in g u n g v o n D u r c h f o r s t u n g s h o l z mittels S e il k r a n im V er e in ig te n K o n ig r e ic h (G r o s s b r it a n n ie n )
Von J. DRUMMOND
Seilkrane, die in Grossbritannien benutzt werden, sind Kurz- und Mittelbereichtypen. Drahtseilkrane sind fur Durchforstungsprodukte und Erstdurchforstungen anwendbar.
Schaden von Bestand und Boden sind sehr beschrankt. Bei der von uns ausgeleglen Anlage besleht nur geringe Windempfindlichkeit.
REFERAT 15
M ec h a n isie r te D u r c h f o r st u n g sv e r f a h r e n
Von C. J. BREDBERG
Die schnell steigenden Durchforsturigskosten haben zu einer Abnahme der Durchforstungseingriffe gefuhrt. Wenn wir der Ansicht sind, dass die Durchforstung in der zukunftigen Bestandsbehandlung notwendig wird, mussen wir neue Maschinen und Systeme entwickeln, die fur hohe Produktivitat und niedrige Kosten in Bezug auf kleine Baume konstruiert sind. Das Prinzip, Bundel von kleinen Baumen zu hantieren, bietel gunstige Losungen. Ein ernstes Hinderniss der Mechanisierung sind aber die Bestandsschaden, die vor allem von gelandegangigen Transport- fahrzeugen verursacht werden. Eine teuere und zeitraubende Entwicklung ist notwendig, um dieses Problem losen zu konnen. Die Alternative ist, dass wir in Zukunft auf unsere Durchforstungsmoglichkeiten verzichten mussen.

Paper 1
PRELIMINARY RESULTS FROM SOME NEW DANISH THINNING EXPERIMENTS WITH NORW AY SPRUCE ON
FERTILE SOILSBy H. BRY ND U M
Danish Forest Experiment Station, Klampenborg, Denmark
IntroductionBefore 1950 there were only four regular thinning experiments in conifers in Denmark, three in Norway spruce (Picea abies) and one in Sitka spruce (P. sitchensis). The results from all of these experiments have now been published (Bornebusch 1933 and 1937, Henriksen 1961, Bryndum 1964, 1969 and 1974), and only one of these experiments is still in existence.
In 1953 the Danish Forest Experiment Station again began establishing thinning experiments, especially in Norway spruce, and during the next 14 years experiments were started in young spruce stands in the most im portant forest localities in this country. The experiments are primarily based on selective thinnings of varying intensity, starting when the stand is fairly young, with the purpose of elucidating the influence of different densities on the development of the stand, its stability, and value yield.
This is a report, chiefly through tabular com parisons and figures, o f the main features o f a recent collection of data from the two earliest experiments in this series, the Clausholm and the East Lolland experiments.
Description o f the Localities and the Experimental LayoutT h e C l a u s h o l m E x p e r i m e n t was established in autum n 1953 in an 18 year old, unthinned Norway spruce plantation. It is situated in east Jutland; the height above sea level is about 50 m, the annual precipitation am ounts to 595 mm, the annual mean temperature is 7-3°C. The ground is flat; the soil is comparatively deep and consists o f clay-mixed fine sand with a low podsolization, the clay content at the depth of 70 cm is approximately 15%. The planting took place in the spring of 1938 with 2 year old plants, spaced at 1 x 1 m. The previous crop was also Norway spruce. The stand data at the time of establishment appear in Table 1.1*.
T h e E a s t L o l l a n d E x p e r im e n t was established in autum n 1960 in three stands of an average age of 21 years. It is situated in Lolland, one o f the southern islands; the height above sea level is
• Prelim inary results, a fter the first 12 years o f the experim ent, have previously been published (eg Bryndum 1967).
5 to 10 m, the annual precipitation am ounts to 605 mm; the annual m ean tem perature is 8 0°C. The ground is flat, the soil is shallow with a high groundwater table and very clayey, the clay content at the depth of 75 cm being, on average, 27 %. Planting was done in spring 1946, and in 1938, w ith 2/2 plants spaced at 1 -25 x 1 -25 m or 1 -25 x 1 -50 m. The site was previously occupied by old hardwood forest. The m ean stand data at establishment of the experiment are stated in Table 1.2.
The experiments involve the following 5 treatments: A thinning no thinningB thinning light thinningC thinning medium-heavy thinningD -B thinning in youth very heavy, later very
light thinning D thinning very heavy thinning
In principle, the thinning treatm ent is determined by the basal area. During the initial years the thinning intensity was the same in the D and D -B grades; from stand height 12 to 14 m the heavy thinnings in the D -B grade was to be discontinued.
In the Clausholm experiment only the A grade was replicated; in the East Lolland experiment all 5 treatments were replicated 4 times.
Results o f AssessmentsThe experiments were measured each 4th (or 5th) year; the results o f the latest measurement o f the stands in autum n 1973 are represented in a condensed form in Tables 1.1 and 1.2. They further show the total thinning volume in the respective experimental periods and the mean volume increment from planting and during the observation period.
The intensity of the thinning grades practised should be apparent from Figures 1.1 and 1.2 which show the development of the stem numbers, and from Figures 1.3 and 1.4, which show the basal area development in the two experiments.
The relationship of thinning intensity to volume increment in the two experiments can be studied in greater detail in Tables 1.3 and 1.4, in which, for each thinning grade, mean basal area and annual volume increment are stated for shorter periods as well as for the whole of the experimental period. Further, the relative periodic increments are represented graphically in Figures 1.5 and 1.6.
22

A SP E C TS OF TH INN IN G 23
T able 1.1T h e C la u sh o l m T h in n in g E xper im en t
Gradeof
thinning
C ro pThinning
a . 1953-73 Increment
N Hl Dg G V per ha m cm m2/ha m’/ha
Vm3/ha
Iv 2-38 m3/ha
Iv 18-38m3/ha
All grades
A
B efore f ir st t h in n in g a t y ea r 1953, 18 years 7865 6-3 6 1 23-23 88-9
A fter t h in n in g a t y ea r 1973, 38 yea rs 2693 17-5 141 42-12 407-3 95-1 14-0 20-8
B 2002 17-6 15-5 37-94 363-9 115.3 13-3 20-0C 918 19-0 20-5 30-23 301-6 206-0 14-1 21-1D-B 925 20-0 21-7 34-28 357-9 187-4 15-1 22-4D 429 20-5 25-8 22-46 232-5 295-9 14-7 21-6
T able 1 .2T he E a st L o l l a n d T h in n in g E x perim ent
(Each treatment is represented by 4 plots).
Gradeof
thinning
C r o pThinning
a . 1960-73 Increment
N Hl Dg per ha m cm
G V m2/ha m3/ha
Vm3/ha
Iv 4-34 m3/ha
Iv 21-34 m3/ha
All grades
A
B efore first t h in n in g , at year 1960, 21 yea rs 4962 8-0 8-5 27-03 124-8
A fter t h in n in g , a t yea r 1973, 34 years 3179 15-8 13-9 48-42 410-2 33-9 14-9 25-0
B 2396 16-8 15-3 43-97 389-9 73-5 15-6 25-6C 1149 17-4 18-9 32-11 286-6 168-5 15-4 25-6D-B 851 17-7 21-3 30-17 268-0 179-2 15-1 25-1D 687 17-7 20-9 23-46 208-3 224-0 14-6 23-9
N8000
Figure 1.1 The Clausholm Experiment. Stem number development per hectare on each of the plots during the observation period, T , in years. The stem number curve for C. M. Mailer’s Site Class 2 (Mailer 1933) is plotted for comparison, labelled Bon 2. KD is the designation of the Clausholm experiment.

24 F O R E S T R Y C O M M ISSIO N B U L L E T IN No. 55
N5000 ■
4000 -
3000 -
2 0 0 0 -
1 0 0 0 -
18 20 22 24 26 28 30 32
Figure 1.2 The East Lolland Experiment. Stem number development per hectare for each of the five thinning treatments during the observation period, T , in years, In one of the four blocks. The stem number curve for Site Class 1 is plotted for comparison, labelled Bon 1. KH is the designation of the East Lolland experiment.
rrf/ha G KD
Figure 1.3 The Clausholm Experiment. Basal area development on each plot during the observation period, T , In years. The basal area between thinnings for C. M. Meller’s Site Class 2 has been entered for comparison, labelled Bon 2.

ASP E C TS O F TH INN IN G 25
m 2/h a G K H
Figure 1.4 The East Lolland Experiment. Basal area development during the observation period, T , in years, in the five thinning grades of one of the blocks. Basal area between thinnings for Site Class 1 has been entered for comparison, labelled Bon 1.
T able 1.3T he C l a u sh o lm T h in n in g E x p e r im e n t : M e a n B a sa l A rea a n d A n n u a l I n c r e m en t
PeriodGade
ofthinning
Mean basal area Annual increment
m2/ha rel. m3/ha rel.
a. 1953-61 A 30-56 100 16-8 100(18-26 years) B 26-30 86 16-4 98
C 22-79 75 17-9 107D-B 20-05 66 19-2 114D 20-84 68 19-2 114
a. 1961-69 A 42-11 100 24-9 100(26-34 years) B 35-54 84 23-7 95
C 28-83 68 23-7 95D-B 27-42 65 25-3 102D 23-34 55 23-6 95
a. 1969-73 A 43-73 100 20-7. 100(34-38 years) B 38-08 87 19-6 95
C 29-51 68 22-3 108D-B 33-41 76 23-0 111D 23-43 54 22-2 107
a. 1953-73 A 37-81 100 20-8 100(18-38 years) B 32-35 86 20-0 96
C 26-55 70 21-1 101D-B 25-67 68 22-4 108D 22-36 59 21-6 104
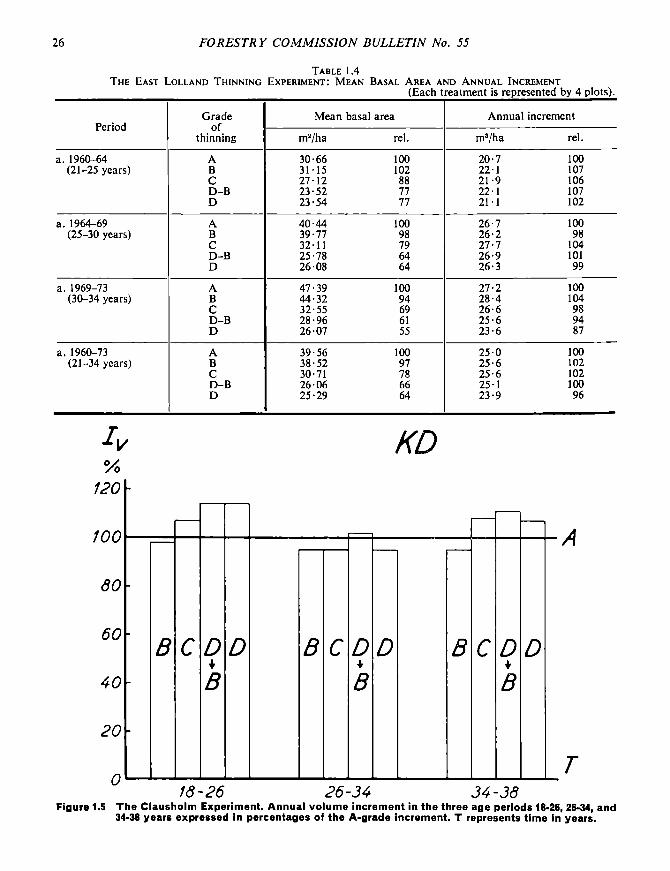
26 F O R E S T R Y C O M M ISSIO N B U LL E TIN No. 55
T a bl e 1 .4T he E ast L o l l a n d T h in n in g E x p e r im e n t : M e a n B a sa l A rea a n d A n n u a l I n c r e m e n t _____________________________________________________(Each treatment is represented by 4 plots).
PeriodGrade
ofthinning
Mean basal area Annual increment
ma/ha rel. m3/ha rel.
a . 1960-64 A 30-66 100 20-7 100(21-25 years) B 31-15 102 22-1 107
C 27-12 88 21-9 106D-B 23-52 77 22-1 107D 23-54 77 21-1 102
a. 1964-69 A 40-44 100 26-7 100(25-30 years) B 39-77 98 26-2 98
C 32-11 79 27-7 104D-B 25-78 64 26-9 101D 26-08 64 26-3 99
a. 1969-73 A 47-39 100 27-2 100(30-34 years) B 44-32 94 28-4 104
C 32-55 69 26-6 98D-B 28-96 61 25-6 94D 26-07 55 23-6 87
a. 1960-73 A 39-56 100 25-0 100(21-34 years) B 38-52 97 25-6 102
C 30-71 78 25-6 102D-B 26-06 66 25-1 100D 25-29 64 23-9 96
KD%
120
100
80 -
60
40
20
0
B C D B C 0 B C D
T18-26 26-34 34-38
F ig u re 1.5 The Clausholm Experiment. Annual volume increment in the three age periods 18-26, 26-34, and 34-38 years expressed in percentages of the A-grade increment. T represents time in years.

A SP E C T S O F TH IN N IN G 27
Iv%
1 2 0 Y
KG-KH-KI-KK
100
80
60
40
20
0
B C D♦
BD B C D B C D
♦
BD
T21-25 25-30 30-34
Figure 1.6 The East Lolland Experiment. Annual volume increment in the three age periods 21-25, 25-30 and 30-34 years, on average, expressed in percentage of the A-grade increment. T represents time in years. The symbols KG, KH, Kl, KK are the designations of the four blocks of this experiment.
After 8 to 9 years, the relative mean basal areas in both experiments were reduced to about 55 in the D grade and about 70 in the C grade; in the B grade the aim was about 85. The response to stem-number reductions has not been the same in the two experiments. In the Clausholm experiment a considerable growth stimulation was recorded during the first 8 year as a result o f heavy thinnings, whereas the growth stimulation was very modest during the first 9 years o f the East Lolland experiment, and in
this experiment most marked in the medium-heavy C thinning. In the latter experiment the low mean basal area seems accordingly to involve a loss in volume production, a result which after 20 years has still not been clearly demonstrable at Clausholm.
Whereas the mean height, as could be seen from Tables 1.1 and 1.2, is increasing with increasing thinning intensity, this does not, or does at least only to a very modest extent, apply to the top height, as appears from Tables 1.5 and 1.6. On the other
T able 1.5T he C la u sh o l m T h in n in g E x p e r im e n t : T o p D iam eter a n d T o p H eig h t a t t h e T ime of
E sta blish m ent a n d A fter 2 0 Y ears
Grade of thinningA. 1953, 18 years A. 1973 38 years Incremen a. 1953-73
Ddomcm
Hdomm
Ddomcm
Hdomm
Ddomcm
Hdomm
A 11-7 8-2 23-2 20-7 11-5 12-5B 11-6 8-2 24-1 20-5 12-5 12-3C 11-6 7-8 2 6 0 20-8 14-4 130D-B 11-4 7-7 27-4 21 -6 160 13-9D 11-1 8-0 29-3 21 -3 18-2 13-3

28 F O R E ST R Y C O M M ISSIO N B U LL E TIN No. 55
T abl e 1.6T he E ast Lo l l a n d T h in n in g E x p e r im e n t : T o p D iam eter a n d T o p H eig h t a t t h e T ime of
E sta b lish m e n t a n d A fter 13 Y ear s
Grade of thinningA. 1960, 21 years A. 1973, 34 years Increment a. 1960-73
Ddomcm
Hdomm
Ddomcm
Hdomm
Ddomcm
Hdomm
A 10-5 8-4 22-3 19-1 11-7 10-7B 10-8 8-8 22-1 18-7 11-3 9-9C 10-8 8-7 24-2 18-6 13-5 9-9D-B 10-9 8-7 26-1 18-8 15-2 10-1D 10-4 8-6 25-0 18-8 14-6 10-2
hand, both the mean diameter (cp. Tables 1.1 and 1.2) and the diameter of the top height trees show an even and heavy increase through the thinning grades.
Quality o f the ProductionThe dimensional composition of both the remaining stand and the total production is strongly influenced by the thinning intensity. Figures 1.7 and 1.8 show for the Clausholm experiment and for one of the blocks in the East Lolland experiment the distribution of the volume produced by 5 cm breast height diam eter classes, for each of the 5 thinning grades. Tables 1.7 and 1.8 contain inform ation about the distribution of the total production on the size
V rn V h a
classes <12, 12-20, and > 20 cm in the two experiments at the respective ages for the last assessment. I t will be seen that with increasing thinning intensity there is an increasing shift o f the production from the medium class into the higher diameter classes; however, this effect is not evident in the B grade. It applies to both experiments that the volume with d j.3 > 20 cm produced in the D and D -B grades was more than three times that produced in the A and B grades, and in the Clausholm experiment this volume am ounts to more than 50% of the total production, in the D -B grade o f the East Lolland experiment to 45%. The am ount o f wood of small dimensions is the same at all grades, obviously depending solely on the initial stem number.
KD250
200
150
100
50
200150
100
50
B
D-»B
C
LL
D
□L
250
200
150
100
50
200
150
100
50
10 20 30 40 10 20 30 40 \ 10 20 30 40 cm £ )Figure 1.7 The Clausholm Experiment. Distribution of the total yield by breast height diameter classes in
each of the treatments, assessed at age 38 years.

A SP E C TS O F TH IN N IN G 29
V tm Y h a
250
200
150
100
50
JJ LL
KH
r
B
1 n
250
200
150
100
50
200
150
100
50n
D B
d ___ r
D
Q .
200
150
100
50
10 20 30 40 10 20 30 40 10 20 30 40 cm DFigure 1.8 The East Lolland Experiment. Distribution of total yield by breast height diameter classes of the
five treatments in one of the four blocks assessed at age 32 years.
Some other quality-deciding factors are represented in Tables 1.9 and 1.10; they are crown height, running taper, and, in the East Lolland experiment, m ean branch thickness at the different grades. In addition, the crown percentage is stated. In the Clausholm experiment the measurements were taken on crop trees, in the East Lolland experiment on the thinnings. W ith increasing thinning intensity
we find a falling crown height, increasing taper (from the B grade to the D grade of the order o f 2 mm per running m) and a t heights more than 2-5 m above ground level, increasing branch diameter (in the D -B and D grades approximately 20 mm at the height o f 7-5 m). Crown length and crown percentage increase steeply with increasing thinning intensity.
T a bl e 1.7T h e C l a u sh o l m T h in n in g E x p e r im e n t : D is
t r ib u t io n o f t h e T o t a l V o lu m e P r o d u c t io n o n D im e n sio n C lasses a t A g e 38 Y ears
T a bl e 1.8T h e E a st L o l l a n d T h in n in g E x p e r im e n t : D istri
b u t io n o f t h e T o t a l V o lum e P r o d u c t io n o n D im en sio n C lasses a t A g e 34 Y ears
Breast-height diameter classGrade
of <12 cm 12-20 cm >20 cmthinning m3/ha % m3/ha % m3/ha %
A 137 27 282 56 84 17B 110 23 273 57 96 20C 107 21 198 39 204 40D-B 111 20 148 27 286 51D 111 21 116 22 301 57
Breast-height diameter class
ofthinning
<12 cm m3/ha %
12-20 cm m3/ha %
>20 cm m3/ha %
A 98 22 296 67 50 11B 100 22 318 68 46 10C 78 17 248 55 129 28D-B 77 17 169 38 201 45D 87 20 186 43 159 37

30 F O R E ST R Y C O M M ISSIO N B U LL E TIN No. 55
T a b l e 1 .9T h e C l a u sh o l m T h in n in g E x p e r im e n t : C r o w n H eig h t , C r o w n p e r c e n t a n d R u n n i n g T a per
a t A g e 36 ( - 3 8 ) Y ear s
Gradeof
thinning
Sample treesCrownheight
m
Crown per cent
%
Running taper
dgcm
hLm 7-5 m
mm/m13-5 mmm/m
A 12-5 16-1 8-5 47 4-9 (7-3)B 14-7 16-8 7-8 54 5-2 7-9C 17-8 17-7 6-8 62 6-1 8-7D-B 18-7 18-4 7-3 60 6-5 9 0D 24-2 19-8 6-8 66 7-5 1 0 0
T a b l e 1 .1 0T h e E a st L o l l a n d T h in n in g E x p e r im e n t : C r o w n H e ig h t , C r o w n p e r c e n t , R u n n in g T a p e r a n d
M e a n B r a n c h D iam eter a t A g e 32 Y ea r s .(Measured on Thinning Trees in Two of the Blocks).
Gradeof
thinning
Sampl trees Crownheight
m
Crown per cent
%
Runnir from 1
g taper •3 m to Mean branch
diameter at 7 • 5 m
mmdgcm
hLm
7-5 m mm/m
13-5 m mm/m
B 10-5 131 8-6 34 6 0 13-9C 15-6 161 7-0 57 6-3 9 0 17-6D-B 18-2 16-8 5-6 67 7-3 100 20-2D 18-7 16-5 5-4 67 7-7 10-6 19-8
T abl e 1 .12T h e E a st L o l l a n d T h in n in g E x p e r im e n t :
R esults o f th e S t u m p D e sc r ipt io n o f A l l F elled T rees
T a b l e 1.11T h e C l a u sh o l m T h in n in g E x p e r im e n t : S um m a ry of
t h e St u m p D e sc r ipt io n s of A l l F elled T trees
Distribution of thinnings ongrades of severity
Gradeof
Number of trees No Stained Decayed
thinning examined symptoms wood wood% % %
T h e pe r io d a . 1 9 5 4 /6 3 (1 9 -2 8 ye a r s)B 869 51 4 4 5C 1324 74 20 6D-B 1239 73 25 2D 1242 64 33 3T he p e r io d a . 1 9 6 5 /7 3 (3 0 -3 8 yea rs)A 198 2 2 64 14B 323 27 57 16C 2 5 4 3 4 38 28D-B 114 42 43 15D 201 36 53 11
Gradeof
thinning
Number of trees
examined
Distribution of thinnings on grades of severity
No Stained symptoms wood
% %
Decayedwood
%
T h e p e r io d a . 1 9 6 0 /6 4 (2 1 -2 5 y ea r s)B 686 78 2 2 _C 209 2 7 7 22 1D-B 215 7 77 23D 2395 77 22 1T h e p e r io d a . 1 9 66 /69 (2 7 - 3 0 YEARS)B 681 4 8 49 3C 1099 4 2 5 2 6D-B 583 38 58 4D 65 2 4 6 50 4T h e pe r io d a . 1971 /73 (3 2 -3 4 yea rs)B 348 31 63 6C 4 1 2 2 6 60 14D-B 89 2 2 59 19D 323 28 56 16

A SP E C TS OF THINN IN G 31
Health and StabilityThe butt ro t frequency in the experiments was followed by a systematic description o f the stump surfaces o f all trees removed in thinning. The results o f these assessments are, for the two experiments, represented in condensed form in Tables 1.11 and 1.12 and shown graphically in Figures 1.9 and
1.10. The ro t intensity has grown steadily during the respective experimental periods, but in none o f the experiments has it been possible to demonstrate any relationship of thinning intensity to ro t frequency; this is inconsistent with the results from a num ber of other D anish and south-Swedish thinning experiments.
%
<901
60
40
20
B C D♦
BD
KD
A B C D DB
19-28 30-38
Figure 1.9 The Clausholm Experiment. Percentage of trees without butt rot in thinnings, summarised for the two age periods 19-28 and 30-38 years. T represents time in years.
%60
60
40
20
0
KG
B D
KH
B
K I
B D
K K
B
27-40 19-32 19-32 19-32
Figure 1.10 The East Lolland Experiment. Percentage of trees without butt rot in the thinning of each of the four blocks during the experimental period.
In Table 1.13 a summary survey is given of the distribution on thinning grades of the wind damages suffered during the experimental period in the two experiments; in 1967 the southern part o f Denmark, where the East Lolland experiment is situated, was struck by two quite extraordinarily violent gales. As appears from the table, the num ber of wind-damaged trees is not very great, but there is a clear tendency
for the num ber to increase with increasing thinning grade, and reckoned in percentages the increase becomes even heavier. It should be noted that in the East Lolland experiment particularly two o f the blocks suffered heavy damage during the 1967 storms, and in both places it was the D grade that suffered most.
Both experiments have also been exposed to

32 F O R E S T R Y C O M M ISSIO N B U LL E TIN No. 55
T a b l e 1.13T h e C l a u sh o l m a n d E a st L o l l a n d T h in n in g
E x p e r im e n t s : S u r v e y o f W i n d D a m a g e t o th e E xper im en t s D u r in g t h e E x per im en t a l
P er io d
Number of harvested wind-Grade damaged trees, per ha
ofthinning Clausholm East Lolland
A 9 18B 11 6C 22 19D - B 45 24D 44 54
snow damage; the East Lolland experiment, however, seriously in one block only. A survey o f the extent and nature of the damage is given in Tables 1.14 and 1.15. In the East Lolland experiment the snow damage occurred only 5 years after the establishment o f the experiment, and reckoned in percentages o f the stem num ber the extent o f the damage was approxim ately the same at all grades, 7 to 8 %. Also the volume cut was the same, 6 to 7 cub. m per ha at all grades. In the heavy thinning grades the damage was by far the m ost serious.
In the Clausholm experiment, 18 years had passed since the start o f the experiment when the snow damage occurred; therefore, the damage picture here was quite a different one. The A and B grades
T a bl e 1.14T h e C la u sh o l m T h in n in g E x p e r im e n t : A n A c c o u n t o f S n o w D a m a g e O c c u r r in g i n t h e W in ter
1971/72; 18 Y e ar s A fter t h e E sta b lish m e n t
Gradeof
thinning
Crop at 36 years before snow damage
Snow-damaged
trees
Extraordinary thinning caused by snow damage
Percentage of damaged trees
with stembreakage
%N
per hah lm
D gcm
Number per ha %
D gcm
Vm3/ha
A 3243 16-5 13-2 574 18 11-9 35-2 38B 2378 16-8 14-5 466 20 131 33-6 44C 1029 180 19-0 81 8 17-7 16-3 67D - B 1019 19-1 20-4 49 5 17-7 8-0 69D 494 19-4 23-8 7 1 23-5 3-2 100
T a bl e 1.15T h e E a st L o l l a n d T h in n in g E x p e r im e n t : A n A c c o u n t o f Sn o w D a m ag es O c c u r r in g o n O n e o f
t h e B l o c k s i n t h e W in t e r 1965/66; 5 Y ea r s A fter t h e E sta b lish m e n t
Gradeof
thinning
Crop at 27 years before snow damage
Snow-damaged
trees
Extraordinary thinning caused by snow damage
Percentage of damaged trees stembreakage
with%
N per ha
h lm
D gcm
Number per ha %
D gcm
Vms/ha
A 4157 10-4 10-7 358 9 8 0 5-4 36B 3826 10-8 11-0 287 8 9-6 7-3 48C 2717 10-9 11-9 179 7 100 5-3 41D - B 1735 11-5 13-1 133 8 11-3 7-1 50D 1840 11-0 12-8 116 6 11-6 6-3 73
were those that suffered most severely, and almost to the same extent, approximately 20% of all trees being damaged; in the C grade the damage was of medium severity, and in the D -B and D grades the num ber of damaged trees was almost of no importance. It should, however, be added that, as appears from the tables, the stem breakage percentage increases with increasing thinning intensity.
Value ProductionThe profit deriving from the thinnings has been calculated on the basis o f the directly ascertained distribution on assortm ent classes o f the thinning yield o f each parcel in the experiments. As might be expected, by far the largest quantities o f sawlog m aterial were produced in the m ore heavily thinned grades; by way of example it may be m entioned
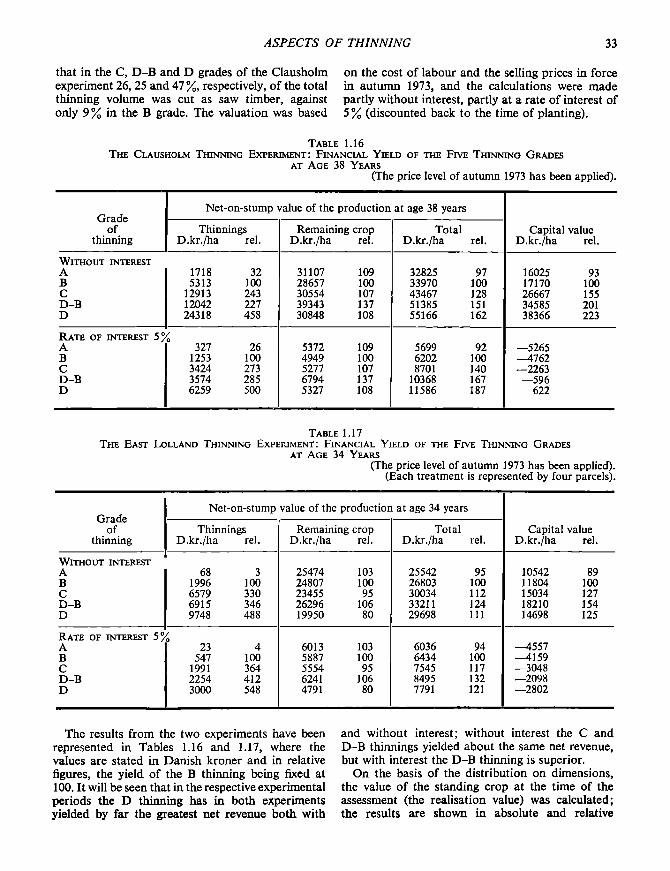
ASP E C TS OF TH IN N IN G 33
that in the C, D -B and D grades of the Clausholm experiment 26, 25 and 47 %, respectively, o f the total thinning volume was cut as saw timber, against only 9% in the B grade. The valuation was based
on the cost o f labour and the selling prices in force in autumn 1973, and the calculations were made partly without interest, partly at a rate o f interest of 5% (discounted back to the time of planting).
T abl e 1 .16T h e C la u sh o l m T h in n in g E x p e r im e n t : F in a n c ia l Y ie ld o f t h e F iv e T h in n in g G ra d e s
a t A g e 38 Y ears(The price level of autumn 1973 has been applied).
Gradeof
thinning
Net-on-stump value of the production at age 38 years
Capital value D.kr./ha rel.
Thinnings D.kr./ha rel.
Remaining crop D.kr./ha rel.
TotalD.kr./ha rel.
W it h o u t in ter e stA 1718 32 31107 109 32825 97 16025 93B 5313 100 28657 100 33970 100 17170 100C 12913 243 30554 107 43467 128 26667 155D-B 12042 227 39343 137 51385 151 34585 201D 24318 458 30848 108 55166 162 38366 223
R a te o f in t e r e st 5%A 327 26 5372 109 5699 92 —5265B 1253 100 4949 100 6202 100 -4762C 3424 273 5277 107 8701 140 —2263D-B 3574 285 6794 137 10368 167 —596D 6259 500 5327 108 11586 187 622
T abl e 1.17T h e E ast L o l l a n d T h in n in g E x p e r im e n t : F in a n c ia l Y ie ld o f th e F iv e T h in n in g G ra d e s
a t A g e 34 Y ears(The price level of autumn 1973 has been applied).
(Each treatment is represented by four parcels).
Gradeof
thinning
Net-on-stump value of the production at age 34 years
Thinnings D.kr./ha rel.
Remaining crop D.kr./ha rel.
TotalD.kr./ha rel.
Capital value D.kr./ha rel.
W it h o u t in ter e st A 68 3 25474 103 25542 95 10542 89B 1996 100 24807 100 26803 100 11804 100C 6579 330 23455 95 30034 112 15034 127D-B 6915 346 26296 106 33211 124 18210 154D 9748 488 19950 80 29698 111 14698 125
R ate o f in t e r e st 5° A
i23 4 6013 103 6036 94 -4557
B 547 100 5887 100 6434 100 —4159C 1991 364 5554 95 7545 117 —3048D-B 2254 412 6241 106 8495 132 —2098D 3000 548 4791 80 7791 121 —2802
The results from the two experiments have been represented in Tables 1.16 and 1.17, where the values are stated in Danish kroner and in relative figures, the yield o f the B thinning being fixed at 100. It will be seen that in the respective experimental periods the D thinning has in both experiments yielded by far the greatest net revenue both with
and without interest; without interest the C and D -B thinnings yielded about the same net revenue, but with interest the D -B thinning is superior.
On the basis o f the distribution on dimensions, the value o f the standing crop at the time of the assessment (the realisation value) was calculated; the results are shown in absolute and relative

34 F O R E S T R Y C O M M ISSIO N B U L L E T IN No. 55
figures in Tables 1.16 and 1.17, without interest as well as discounted back to the time of planting at a rate o f interest o f 5%. It is conspicuous that in both experiments the stand in the D -B grade has the highest value, while the A grade has the second highest; however, in the Clausholm experiment the difference between the A, C and D grades is insignificant.
By adding the realisation value of the stand to the profit from the thinnings we arrive at the value of productions of the thinning grades at the ages when the last assessment was made; these amounts, too, are represented in Tables 1.16 and 1.17. In the Clausholm experiment we find at age 38 years with or without interest a rising value production with an increasing thinning intensity, and the superiority o f the heavily thinned grades is most marked when interest is added; it appears that
the D -B grade is much superior to the C grade in value yield. In the East Lolland experiment, the D -B thinning at an average age of 34 years had the highest value production both with and without interest; the C and D grades had, excluding interest, very nearly the same value yield, while the D grade yielded most when interest was taken into account.
The value production of the thinning grades in the two experiments is, moreover, represented graphically in Figures 1.11 and 1.12. Figure 1.11 shows for the Clausholm experiment not only the value production in the 5 grades at 38 years, but also at the ages 30 and 34 years, and based on the same price level. Figure 1.12 shows the value yield of the thinning grades in each of the four blocks of the East Lolland experiment at the average age o f 34 years.
Finally, the capital values, also shown in Tables
%160
140
120
100
60
60
40
20
B
K D
B B3
30 34 38
Figure 1.11 The Clausholm Experiment. Financial yield of the five thinning grades at the ages of 30, 34 and 38 years, expressed as a percentage of the B grade yield. T ■= time in years.
1.16 and 1.17, were calculated on the basis of cultivating costs and overheads from the accounts published by the Danish Forest Society, 6000Dkr/ha and 300 Dkr/ha per year, respectively. Here the heavy thinning grades show themselves economically even better compared with no thinning or light thinning. In the Clausholm experiment the capital values of the D and D -B grades at rate of interest 5% are very close to nil, which implies an internal
financial yield at age 38 years of about 5 % in these treatments.
In conclusion attention should be drawn to the fact that none o f the ages at which data were collected for the calculations reported here are realistic rotation ages for Norway spruce in Denmark even in the best o f site classes. In localities like East Lolland, however, Norway spruce often does not exceed the age of about 40 years.

ASP E C TS OF TH IN N IN G 35
%140
130
100
SO
60
40
20
0
B D B D B D B B
KG KH K I K K KG.KH.KI.KK
Figure 1.12 The East Lolland Experiment. Financial yield of the five thinning grades in each of the four blocks at age 32 and 40 years respectively and for the average (right) of each treatment expressed as a percentage of the B grade yield.

36 F O R E S T R Y C O M M ISSIO N B U L L E T IN No. 55
REFEREN CES
B o r n e b u s c h , C. H. (1933). E t Udhugningsforsog i Rodgran. (Ein Durchforstungsversuch in Fichte). Forstl.Forsagsv. Danm. 13.
B o r n e b u s c h , C. H. (1937). Storm skaden i H astrup Plantage den 8de Februar 1934. (Sturmschaden in dem H astruper Durchforstungsversuch). Forstl. Forsagsv. Danm. 14.
B r y n d u m , H. (1964). Forsogsvaesenets afsluttede rodgranproveflader. (Terminated Sample Plots in Norway spruce). Forstl.Forsegsv. Danm. 28.
B r y n d u m , H. (1967). E in Durchforstungsversuch in einem jungen Fichtenbestand. M itt. Forstl. Bundes- Versuchsanst. Wien. 11.
B r y n d u m , H. (1969). Rodgranhugstforsoget i Glud- sted plantage. (A Thinning Experiment in Norway spruce in G ludsted Plantation). Forstl.Forstagsv. Danm. 32.
B r y n d u m , H. (1974). Rodgranhugstforsoget p i Ravnholt. (A Thinning Experiment in Norway spruce at Ravnholt Forest Estate). Forstl.Fors0gsv. Danm. 34.
H e n r ik s e n , H. A. (1961). A Thinning Experiment with Sitka spruce in Nystrup D une Forest. Forstl. Forsagsv. Danm. 27.
M o l l e r , C. M . (1933). Boniteringstabeller og bonitetsvise Tilvaekstoversigter for Bog, Eg og R odgran i D anm ark. Dansk Skovforen. Tidsskr. 18.
DISCUSSION
Kramer: Was branch thickness considered in calculating prices?
Bryndum: N o, but branch thickness did not in any case exceed 20 mm and would consequently have little influence on either quality or price.
Kramer: D id the wind damage occur immediately after thinning or sometime later ?
Bryndum: It occurred seven years after thinning. You would not expect very much damage after such a long time, as you would do if the windblow occurred immediately after thinning.

P aper 2
EFFECTS OF LINE THINNING ON INCREMENT
By G. J. H A M ILTO N Forestry Commission, Alice Holt, Farnham, Surrey, England
IntroductionAlmost irrespective of the methods employed in harvesting, line thinning has a num ber o f advantages over selective thinning, which are fairly well understood. In the first place the need for m arking the trees to be removed is more or less dispensed with. Secondly, it is usually unnecessary to undertake the intensity o f brashing which would be required for selective thinning and hence thecostsof this operation are either reduced or eliminated. The third advantage is that line thinning facilitates tree felling operations. Fourthly, it improves general access to the crop and usually assists extraction.
W ith mechanised extraction m ethods the last two attributes o f line thinning become of even greater significance. As machines tend to get larger, so the need for m ore ‘room to manoeuvre’ becomes greater. Added to this, it is particularly the case with expensive machinery - although applying generally whatever the harvesting methods em ployed- that the cost o f harvesting per unit volume is generally reduced as the yield per hectare, ie the weight o f thinning, increases. One way o f accommodating these pressures for manoeuvrability and increased yield per hectare would be to adopt heavy line thinnings, perhaps involving the removal o f two or m ore adjacent lines, in the case o f first thinnings.
N o single thinning operation should be considered in isolation however, since its effect can influence the development of the crop for the rest o f its life. In order to make a rational appraisal o f any one thinning it is therefore necessary to consider both short and long term effects, whether beneficial or otherwise. This paper is confined to the consideration o f one o f these effects, namely the effect o f the various forms o f line thinning on the increment of the remaining crop.
Line thinnings are neutral in type, ie the distribution by dominance or size classes o f the trees removed is the same as that o f the trees remaining. W ith selective thinnings a greater proportion of the larger dom inants and co-dominants are invariably retained. The first effect on increment to be considered is that resulting from the absence of positive selection of the remaining crop.
The effect o f intensity of thinning, o r in this case the weight o f an individual thinning, is o f interest in any kind o f thinning. However, in line thinnings particularly, a given weight may be constituted in
diverse ways. F o r example, the removal o f half of the volume of the crop a t first thinning may be effected by removing every second row, or by removing two adjacent rows in every four, o r by removing three adjacent rows in every six. Clearly, the structure of the remaining crop is significantly different in each treatm ent. The effect on increment o f these different means of removing a given weight o f thinning is the second aspect of increment to be considered here.
The distribution of volume increment between individual trees, o r rows of trees, resulting from line thinning is relevant in that it influences the increase in the value of the stand. This is the third aspect o f increment to be considered in this paper.
The Forestry Commission has five experiments embracing line thinning treatments and it is intended to explore the evidence that is so far available from these experiments. A t this point in time they have not all yielded complete information. All of the experiments are concerned with first thinnings only.
Experimental EvidenceG l e n t r o o l (S o u t h S c o t l a n d )This experiment was established in October 1967 in 20-year old Sitka spruce (Picea sitchensis) o f Yield Class 17, initially spaced at l-5 2 x l-52m . The site is relatively sheltered; it has a 5° slope with an east/south aspect; elevation 120m ; rainfall 1520 m m /annum ; solid geology Ordovician; soil imperfectly drained brown earth.
The experiment consists o f three line thinning treatm ents plus one selective thinning, all o f which were carried out at the time of establishment of the experiment. In each treatm ent one-third of the volume of the standing crop was removed in thinning. The treatments were as follows:
i. Removal o f i o f the volume selectively - 3 replications
ii. Removal of 1 row in 3 (leaving 2 adjacent) - 3 replications
iii. Removal of 2 rows in 6 (leaving 4 adjacent) - 3 replications
iv. Removal o f 3 rows in 9 (leaving 6 adjacent) - 2 replications
All trees in each plot have been girthed annually since the date o f establishment and a full measurement, ie measurem ent of total volume production, was made a t the end o f six growing seasons, ie at
37

38 F O R E ST R Y C O M M ISSIO N B U LL E TIN No. 55
the end of 1973. Owing to the emergence of certain increment patterns in basal area, the crop was sampled such that volume increments could be assigned to the remaining individual rows in the crop. A second thinning was carried out in each plot at the end of 1973, but these treatm ents lie outside the scope of this paper.
The effect o f the various treatm ents on the total
volume increment per hectare is shown in Table 2.1. The periodic increments between the time o f first thinning and the full assessment in 1973 are tabulated in column 2. These show the average for the 3 (or 2) plots in each treatm ent.
The absolute volume increment figures given in column 2 are, o f course, directly useful but it is
T a bl e 2.1
Treatment
(1)
Volume increment in m3/ha from
1967-1973 (2)
Initial volume after thinning
in m3/ha in 1967 (3)
Volume increment as a percentage of initial volume
(4)
Third of the volume removed selectively 173-6 97-4 178-21 row in 3 172-9 105-57 163-82 rows in 6 158-6 98-6 160-93 rows in 9 145-6 91-85 158-6
apparent from the entries in column 3 that there were differences in initial volume stocking o f the different treatm ents after thinning in 1967. In particular, the 1 in 3 treatm ent has a higher initial volume than average, whilst the 3 in 9 treatm ent is somewhat lower than average. It is not possible to ascertain from the data precisely how initial stocking affects the subsequent increment, nor is it suggested that the entries in column 4 can be regarded as conveying the real relativities if the initial stocking had been identical in each plot. Since it is equally unlikely that the volume increment is directly proportional to the initial volume, the real situation probably lies somewhere between the two, and a survey of the individual plot data tends to suggest that a more appropriate entry for column 2 for the 1 in 3 treatm ent would be somewhere in the region o f 165 to 167 and for the 3 in 9 treatm ent the appropriate value would be closer to 150 than 145.
Taking first the question of the neutral thinning as against selective thinning, the m ost appropriate comparison is the selective thinning and the 1 row in 3 treatm ent. Allowing for the greater initial volume in the 1 row in 3 treatment, the results suggest that volume increment is greater with selective thinning, perhaps amounting to 6-8m3/ha over a 6-year period.
The next point o f interest concerns the differences in increment resulting from greater numbers of adjacent rows removed. There is clearly a steady drop in increment as the w idth of the lane created by line thinnings becomes wider. Again, allowing for initial stocking differences the suggestion is that over a 6-year period the difference between the 1 row in 3 treatm ent and the 2 rows in 6 treatm ent is in the
order o f 8 m3/ha and a similar difference is evident between the 2 rows in 6 and 3 rows in 9 treatm ent.
Figure 2.1 shows the average volume increment in each row expressed as a percentage o f the initial volume in the row, over the 6-year period. I t is clear that the response to thinning is virtually confined to the rows immediately adjacent to those removed. Very little response is discernable in the other rows, although the absence of an unthinned control in this particular experiment denies an assertion that the central rows of the 3 in 9 treatm ent have remained absolutely without response. Com parison of these rows with the rows 2 and 5 suggest however, that any response must be minimal. A nother notable feature is that the response of the outside rows increases with the num ber of adjacent rows removed. Basal area responses are incidentally proportionately greater than those of the volume increment responses. Lower form factors are induced on the trees o f the outside rows relative to the inside rows. The pattern o f basal area response is established immediately following thinning and remains m ore or less constant over the 6-year period.
M il l b u ie B l a c k I s l e F o r e s t ( N o r t h S c o t l a n d ) This experiment was designed to com pare two different forms o f systematic thinning and different thinning cycles with selective thinnings. The experiment is in a stand of Scots pine, Yield Class 10, planted at a spacing of l - 4 m x l - 4 m in 1939. The experiment is situated on an irregular 2£° slope with a north-west aspect; rainfall 760 m m /annum ; elevation 195m ; peaty ironpan soil overlying Old R ed Sandstone. There are nine treatm ents in the
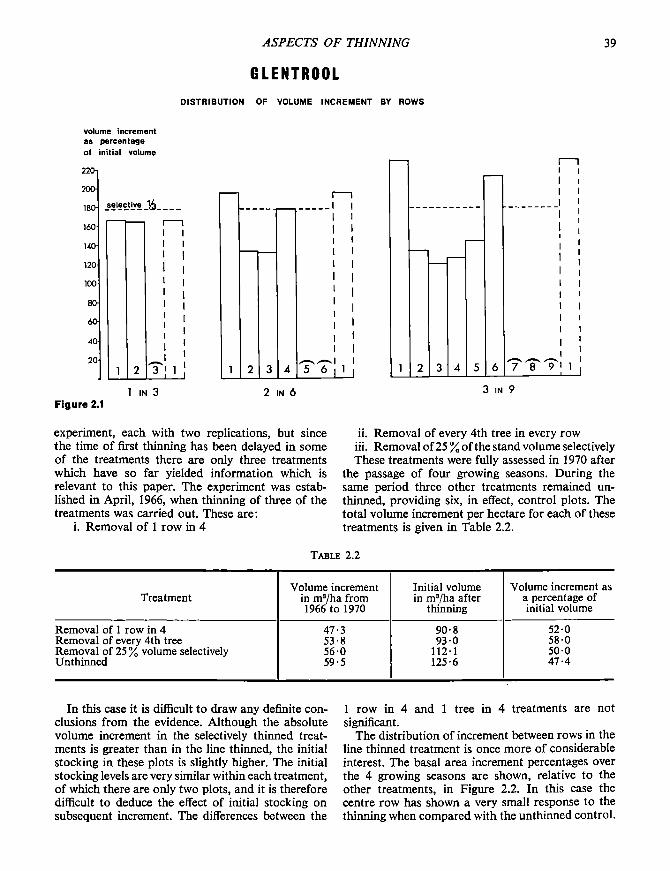
A SP E C TS OF THINN IN G 39
G L E N T R O O LDISTRIBUTION OF VOLUME INCREMENT BY ROWS
selective _____
volume increment as percentage of initial volume
220
200
180
160
140
120
100
80
60
4 0
20 -
1 IN 3Figure 2.1
2 in 6 3 in 9
experiment, each with two replications, but since the time of first thinning has been delayed in some of the treatm ents there are only three treatments which have so far yielded inform ation which is relevant to this paper. The experiment was established in April, 1966, when thinning o f three of the treatm ents was carried out. These are:
i. Removal o f 1 row in 4
ii. Removal o f every 4th tree in every rowiii. Removal o f 25% of the stand volume selectively These treatm ents were fully assessed in 1970 after
the passage of four growing seasons. D uring the same period three other treatm ents remained unthinned, providing six, in effect, control plots. The total volume increment per hectare for each of these treatm ents is given in Table 2.2.
T abl e 2 .2
TreatmentVolume increment
in m3/ha from 1966 to 1970
Initial volume in m3/ha after
thinning
Volume increment as a percentage of initial volume
Removal of 1 row in 4 47-3 90-8 52-0Removal of every 4th tree 53-8 9 3 0 58-0Removal of 25 % volume selectively 56-0 112-1 50-0Unthinned 59-5 125-6 47-4
In this case it is difficult to draw any definite conclusions from the evidence. Although the absolute volume increment in the selectively thinned treatments is greater than in the line thinned, the initial stocking in these plots is slightly higher. The initial stocking levels are very similar within each treatment, o f which there are only two plots, and it is therefore difficult to deduce the effect of initial stocking on subsequent increment. The differences between the
1 row in 4 and 1 tree in 4 treatm ents are not significant.
The distribution of increment between rows in the line thinned treatm ent is once more o f considerable interest. The basal area increment percentages over the 4 growing seasons are shown, relative to the other treatm ents, in Figure 2.2. In this case the centre row has shown a very small response to the thinning when com pared with the unthinned control.

40 F O R E ST R Y C O M M ISSIO N B U LL E TIN No. 55
16
14
12
10*
8
6
4
2
M 1 L L B U 1 EDISTRIBUTION OF BASAL AREA INCREMENT BY ROWS
basal area increment aa percentage of Initial basal area
22r
20-
ip
1 tree In 4 2 5 %selective
control
Figure 2.2
K i n g ’s , T h e t to r d F o r est (E a st E n g l a n d )This experiment was established in 1970 in a stand of Corsican pine (Pinus nigra var maritima) planted in 1951 at a spacing o f l - 4 m x l - 4 m and of Yield Class 18. The site is virtually level and sheltered; elevation 22 m ; rainfall 640 mm per annum ; soil is a brown calcimorphic on Breckland sand overlying chalky till. There are seven treatments, including an unthinned control, replicated three times.
i. Removal of 1 row in every 3 (leaving 2 adjacent), 33$ % volume removed
ii. Removal o f 1 row in 2 (leaving 1 row), 50% volume removed
iii. Removal of 2 rows in every 4 (leaving 2 adjacent), 50% volume removed
iv. Removal of 3 rows in every 5 (leaving 2 adjacent), 60 % volume removed
v. Removal o f 2 rows in every 3 (leaving 1 row), 6 6 |% volume removed
vi. Removal o f 3 rows in every 4 (leaving 1 row), 75 % volume removed
vii. U nthinned controlThe basal area in each plot has been assessed
annually since the experiment was established. A complete measurement was carried out at the end of 1974. There is no selective thinning treatm ent incorporated in the experiment and so this aspect of increment cannot be explored here.
The volume increment between 1970 and 1974 (5 growing seasons) is tabulated below.
T a bl e 2 .3
TreatmentVolume in ms/ha
increment between 1970/1974
Intitial volume after thinning
in ma/ha
Volume increment as a percentage of
initial volume
Unthinned control 106-3 205-6 51-7Removal of 1 row in 3 97-8 141-8 69-0Removal of 1 row in 2 98-0 105-5 92-8Removal of 2 rows in 4 94-5 101-7 92-9Removal of 3 rows in 5 81-7 84-3 96-9Removal of 2 rows in 3 80-7 69-4 116-3Removal of 3 rows in 4 57-5 47-8 120-3

ASP E C TS O F TH INN IN G 41
The above figures indicate that in these treatments, as the weight o f thinning increases so the production decreases. Maximum production is obtained in the unthinned control and the lowest production is obtained in the 3 in 4 treatments. It is also notable when com paring the two 50 % volume removal treatm ents that the volume production of the 1 row removed in 2 exceeds that o f the 2 rows
from 4, ie the larger the gap created in line thinning the lower is the increment for the same weight o f thinning.
The distribution of increment between rows is shown in Figure 2.3. Once again it is dem onstrated that the response of individual rows is increased markedly with the width of the adjacent “gap” .
KI NG ' Svolume increment as percentage of initial volume D IS T R IB U T IO N OF VOLUME INCREM ENT BY ROWS
100
50
Control 1 in 3
n n
1 2 3 4 5J L_
3 in 5l i i 32 in 3
1 2 3J L
Figure 2.3
E l w y , C l w y d F o rest ( N o r t h W a l es)This experiment was established in 1971 in Sitka spruce (Picea sitchensis) established at a spacing of l - 5 m x l - 5 m in 1952 and of Yield Class 22. The site is approximately level; elevation 259 m ; m oderately exposed; rainfall 762 m m /annum ; brown earth soil overlying Silurian. There are eight treatments with three replications each. These are:
i. Unthinned controlii. Removal of 1 row in every 4 (leaving 3 ad
jacent), 25 % volume removediii. Removal of 1 row in every 3 (leaving 2 ad
jacent), 33 % volume removediv. Removal o f 2 rows in every 5 (leaving 3 ad
jacent), 40% volume removedv. Removal o f 1 row in 2 (leaving 1 row), 50%
volume removedvi. Removal of 2 rows in every 4 (leaving 2 ad
jacent), 50% volume removed
vii. Removal of 3 rows in every 5 (leaving 2 adjacent), 60% volume removed
viii. Removal o f 2 rows in every 3 (leaving 1 row), 67 % volume removed
The basal area of each plot has been assessed annually since establishment, which to date means that the production of only three growing seasons has been assessed. Unfortunately, the experiment has suffered an attack by Elatobium abietinum (Green spruce aphid) which has caused irregular defoliation over at least two growing seasons, throughout the experiment. This attack has clearly affected increment in many of the plots and consequently devalued the data collected so far. Table 2.4 contains basal area increment data for the period of three growing seasons.
Given the circumstances it is considered unwise to draw any refined conclusions from the results. The distribution of increment between rows is shown in

42 F O R E S T R Y C O M M ISSIO N B U L L E T IN No. 55
T a b l e 2 .4
Treatment
Periodic basal area increment from 1971/74
in m2/ha
Initial basal area in ma/ha after thinning
Basal area increment as a percentage of initial basal
area
Unthinned control 4-73 39-53 11-97Removal of 1 row in 4 4-92 30-46 16-15Removal of 1 row in 3 4-74 27-15 17-46Removal of 2 rows in 5 4-73 24-16 19-58Removal of 1 row in 2 4-90 20-55 23-84Removal of 2 rows in 4 4-35 20-93 20-78Removal of 3 rows in 5 3-40 16-08 21-14Removal of 2 rows in 3 2 ’83 13-37 21-17
Figure 2.4. In this connection it should be recorded treatments. It is consequently difficult to accuratelythat the control plots have suffered from aphid gauge the response of centre rows in the two treat-infestation more consistently than most o f the other ments where three adjacent rows have been left.
.......... E L W YIncrement as percentage ofinitial basal area DISTRIBUTION OF BASAL AREA INCREMENT BY ROWS
24
22
20
18
16-
14-
1 2 + -C
10
8
6
4
2
0- 1 2 3 1 1 2 11 In 4 1 In 3 2 in 5 2 in 4 1 in 2
1 |2 |3 ,4 , 5| 1 3 in 5 3 in 4
Figure 2.4
D o w n h a m , T h e t f o r d F o r e s t ( E a s t E n g l a n d ) This experiment was established in 1943 in 19-year old Corsican pine at a time when line thinnings were first carried out in this country. The site is relatively level at an elevation of 18 m and is relatively sheltered; rainfall 635 mm per annum ; sandy soil overlying chalk.
Unfortunately, the experiment is not replicated and in addition suffers from the lack of a conven
tional unthinned control. There are only 3 treatments, one plot o f each:—
ii. Removal o f 50% o f the volume selectivelyii. Removal o f 2 adjacent rows in every 4
iii. Removal of 3 adjacent rows in every 6F o r each of the first three years after thinning the
volume was accurately assessed in each treatm ent. A further assessment was m ade six years after thinning, but owing to deficiencies in sampling, the

ASP E C TS OF TH INN IN G 43
volume assessments were unreliable so tha t only basal area increments are shown for the six year period in the table below:
Top heights were clearly similar at the time of
first thinning, suggesting no m ajor site differences. The selective thinning treatm ent emerges clearly as having produced greater increment than either o f the line thinning treatments. In this case however,
T abl e 2 .5
TreatmentTop height
at first thinning
m
Volume increment over
3 growing seasons after
thinning in m3/ha
Volume increment as percentage of
initial volume
Basal area increment over
6 growing seasons after
thinning in m2/ha
Basal area increment as percentage of
initial basal area
50 % selective 9 0 49-1 65-1 16-25 87-12 rows in 4 9-1 40-1 46-4 14-11 57-43 rows in 6 9 0 39-2 47-1 13-48 55-6
the differences are presumably a combination of the effects o f the neutral thinning and the effects of creating a sizeable gap in the canopy by removing a t least 2 adjacent rows. Although the relative production o f the two line thinnings are in the expected order, the magnitude of the differences appears to be rather small.
The now familiar pattern of the distribution of
basal area increment by rows is dem onstrated in Figure 2.5 echoing the experience of the other experiments.
DiscussionThe first aspect o f line thinning to be discussed, in the light of experimental evidence, concerns the effect of removing trees o f all dominance classes in
2 80-
70
-- 60-
50-
40-
30-
10-
selective % DOWNHAM
d i s t r i b u t i o n o f b a s a l a r e a i n c r e m e n t b y r o w s
Figure 2.5

44 F O R E S T R Y C O M M ISSIO N B U LL E TIN No. 55
line thinning as opposed to selective thinning in which a greater proportion of the better dominants and co-dominants are retained. The evidence from Glentrool and from Thetford (Downham) tends to indicate that some loss in production follows such neutral thinnings, probably in the order o f 3-8 m3 in a normal thinning cycle depending on species and thinning treatments. The evidence from Millbuie is not clear. This general trend is a reasonable expectation given that in general the m ore efficient p roducers in a stand are those of greater dominance. (Ham ilton 1969).
The second aspect is the question of the weight o f thinning and subsequent volume increment and, at least in the more extreme treatments, it would appear that the volume increment is negatively correlated with the weight o f a single thinning. However, it is much m ore relevant in practice to consider the effect o f the pattern rather than simply the weight of thinning. The expectation here is that the removal o f two or three adjacent rows would create such gaps in the canopy that the remaining trees could not sufficiently respond in order to utilise the site fully, whereas those parts o f the stand which are unaffected by the treatm ent are losing the opportunity of diameter and hence value increment gains. This is indeed borne out by the evidence particularly from the Glentrool and Kings experiments which show greater losses in increment with increased numbers of adjacent rows removed.
One clear feature that has emerged from the experiments is that the zone of influence of thinning is very limited and there is little evidence that there is any sizeable response in rows which are not immediately adjacent to the rows removed.
Regarding the effects o f line thinning on quality, there are no apparent differences between the three treatm ents at Thetford (Downham) but here the effects have been wholly masked by pruning. Under m ore extreme treatm ents, as with any other type of thinning, there will be a risk of poorer quality in at least a proportion of the crop.
In order to explore the economic implications of the above evidence, yield models have been constructed for a num ber of line thinning treatments. The scope for modelling line thinning treatm ents is unlimited, particularly when considering chevron patterns of removal. However, only conventional
treatm ents which are thought to have a bearing on field practice have been considered here. Models have been constructed for two species, Corsican pine and Sitka spruce. The first thinning treatm ents considered have been:
1 row removed in 4 1 row removed in 31 row removed in 22 adjacent rows removed in 4 2 adjacent rows removed in 5
I t has been assumed that subsequently the models have been thinned selectively according to normal Forestry Commission practice (Ham ilton & Christie1971). In effect this has m eant that the average volume stocking in each of the treatm ents has subsequently been approximately the same at any given age. A yield class o f 18 has been assumed. Initial stockings were 3860 and 3250 stems per hectare for Corsican pine and Sitka spruce respectively. The models have been constructed to incorporate volume losses broadly suggested by the experimental evidence. Relative to selective thinning the volume losses assumed a re :
Corsican pine S itka spruce Selective 0 01 row in 4 5 m3/ha 6 m3/ha1 row in 3 7 m 3/ha 8 m 3/ha1 row in 2 8 m 3/ha 10 m 3/ha2 rows in 5 10 m 3/ha 14 m 3/ha2 rows in 4 12m 3/ha 18m 3/haThe standard Forestry Commission m ethods of
economic appraisal have been employed. This means that a standard (high) stumpage price/size curve has been applied to the revenues of all thinnings and fellings and discounted at a rate o f 5 % com pound interest to the year o f first thinning, ie 20 years from planting in the case o f Sitka spruce, 19 years for Corsican pine. The price/size curve assumes an average harvesting cost per unit volume and makes no allowance for the effect o f different thinning methods on harvesting costs. Relative to normal selective thinnings the maximum discounted revenues per hectare for the different treatm ents are as shown in Table 2.6.
Clearly, any form of line thinning reduces the discounted revenue relative to selective thinning, using the methods of com parison described above. However, since no account has been taken of
T able 2 .6
Selective 1/4 1/3 1/2 2/5 2/4
Corsican pine 0 —£92 —£98 —£91 —£110 —£110Sitka spruce 0 —£86 —£94 —£95 —£122 —£140

A SP E C TS O F TH IN N IN G 45
differences in harvesting costs the above figures do no t make the com parison wholly valid. The volume removed in the 1 row in 3 treatm ent is similar to that removed in the selectively thinned model. The difference in discounted revenue between the two am ounts to approximately £94-£98/ha. Given a volume of removal approximately 63m3 per hectare then a saving o f approximately £1-50 per cubic m etre in harvesting costs must be achieved in order to justify this treatm ent in crops such as described here. Of course there may be further gains in harvesting costs at subsequent thinnings to be considered, as a result of easier access in the line th in ning treatment.
In comparing the treatm ents involving single row removal there are no large differences in the discounted revenues indicated above. A lthough felling costs may be similar in each treatm ent, higher yields per hectare should normally effect a reduction in harvesting costs per unit volume which will favour the 1 row in 2 treatm ent and diminish the relative merits o f the 1 row in 4 treatment. T reatments involving the removal o f 2 adjacent rows show up least favourably in the above comparison. It is not unreasonable to expect some reduction in harvesting costs in these treatments com pared with the single row removal treatments.
The above comparisons have been drawn between a num ber of conventional line thinning treatments and selective thinnings all planted at conventional spacings. Of course there are numerous other possible treatm ents, including chevron thinning, com binations of line and selective thinning, and different original planting spacings. The results which have emerged from the conventional line thinning experiment could relatively easily be applied to chevron thinnings. W here a combination of line thinning and selective thinning is used then it follows that the higher the element o f selective thinning used the greater will be the revenue calculated on the basis described above. Once more the problem is one of setting this increased revenue against any possible increases in harvesting costs which result from such treatments. Where the spacing between rows is greater than normal, ie 1 -8 m, then the volume losses associated with line thinnings, particularly where two adjacent rows are removed, may be greater than indicated above. Consequently, the loss in revenue can be expected to be greater than is suggested here.ConclusionsTo summarise the conclusions from the experimental evidence it might be said th a t:
a. a loss o f production is associated with the neutral thinning type implicit in line thinning,
b. the zone o f influence o f line thinning is largely confined to the rows immediately adjacent to those removed,
c. the response o f outside rows rises markedly as the num ber o f adjacent rows removed increases, and,
d. greater losses in volume production are associated with greater numbers o f adjacent rows removed.
Specific recom m endations about line thinning treatm ents are not possible without considering both the harvesting system to be used and the harvesting costs which will result. As a result of economic analyses of various yield models depicting selective and line th in n ing treatments, some indication is given o f the savings in harvesting costs required to justify the choice o f one treatm ent in preference to others.
REFEREN CES H a m il t o n , G. J. (1969). The dependence of volume
increment o f individual trees on dominance, crown dimensions and competition. Forestry 42(2).
H a m il t o n , G. J. and C h r ist ie , J. M. (1971). Forest Management Tables Bklt 34. For. Comm. Lond. (HMSO).
DISCUSSION Kramer: The data for the Downham plots show the relative increments only three years after thinning. Is it not so that over a much longer period these differences disappear?
Hamilton: The subsequent thinning of the plots has not been consistent in the three treatm ents and so it is not possible to distinguish between the effects of the first thinning and the effects of the subsequent thinning. As far as the other experiments are concerned I do not expect the volume production differences between treatm ents to diminish over a longer period. I see no reason why they should.
Stratmann: D id you notice any consistent increment pattern emerging regarding the geographical orientation of the rows after thinning ?
Hamilton: The diagrams were drawn with this point in mind. In G lentrool, for example, the rows run approximately east and west (so that the left hand margin in Figure 2.1 represents south). You can see that there appears to be a greater overall response on the edge rows which face south, although this pattern is not consistent in each individual p lot within a treatment.

46 F O R E ST R Y C O M M ISSIO N B U L L E T IN No. 55
P a p e r 3
YIELD AND DEVELOPMENT OF UNTHINNED NORWAY SPRUCE STANDS IN WESTERN NORWAY
By OLA B 0R SE TDepartment o f Silviculture, Agricultural College o f Norway, A s
Current economic trends in Norway, characterised by a m arked increase in wages and social costs have greatly affected our silvicultural practice. One of the results is that an ever-larger part of the annual cut is taken out by clear-fellings. While in the 1930’s, it was commonly considered advantageous to take out around 50 per cent o f the to tal yield in spruce stands by frequent thinnings, consideration is currently being given to one single, two or three thinnings per ro tation and sometimes, even no thinning.
The steep terrain of West Norway causes special
problems in carrying ou t profitable thinnings. Therefore there is now a commonly held opinion that the planting espacement - when new stands are established in such terrain - should be widened so much tha t the plantations can be left unthinned and the to tal yield harvested in a final cut at the age of 50 to 60 years.
To elucidate m ore closely the development o f unthinned spruce plantations, the D epartm ent of Silviculture has studied 31 sample plots in different parts o f western Norway. Forest Research Officer, Helge Frivold, has done the field measurements. He
M 3/ ha V B
Figure 3.1 Total volume yield in sample plot (V m) compared to total volume yield by yield tables of Brantseg (1951) at the same age and for the same site class (V b). Sample plots at sites exceeding site classification of Brantseg are omitted.

ASP E C TS OF TH IN N IN G 47
has also w ritten a report of the studies which will be published next year. Practical forestry has shown a considerable interest in this work.
A brief discussion of the most im portant results o f the study is given below.
The Sample PlotsAll stands examined are situated in a humid climate (annual precipitation 1500 to 3000 mm). M any lie on steep slopes with good soil. Ten plots have gradients of 50 per cent or more, another ten have gradients between 20 and 50 per cent. By the site classifications for spruce plantations in West Norway (Brantseg, 1951), twenty plots are of Site 1 or better (Site 1 - mean annual increment 14-8 m3 after 60 years).
YieldA remarkably large basal area of living trees was found in many plots as illustrated by the following distributions:
Basal area, livingtrees (m2 per ha) 26-50 51-75 76-100 N o of plots 15 14 2
The distribution by volume per hectare is: Volume(m3 per ha) 300 301-500 501-700 701 N o. ofplots 5 11 10 5
The total yield in each plot has been compared to the to tal yield according to the yield tables of Brantseg (1951) (Successful, lightly thinned West Norwegian spruce plantations). Such a comparison
is attended by some uncertainty, one o f the reasons being that Brantseg’s site classification is based on m ean height. As may be seen from Figure 3.1 the to tal yield on the unthinned, plots seems to be largely the same as on “Yield table plots” .
Natural ThinningsThe loss from natural thinning is expressed in terms of ‘death percentage’, ie volume o f all planted, naturally dead trees that could be observed when plots were measured, as a percentage of the total volume in the plots. This death percentage is likely to be a little lower than the natural thinning percentage but the difference is certainly small in most plots.
The distribution by death percentage is as follows: D eath
percentage 0-5 6-10 11-15 16-20 all N o. of plots 21 5 0 2 28
(3 plots om itted because of cuttings etc.)The proportion o f dead trees is remarkably small
when m easured by volume but it is large when expressed in term s o f num bers of trees. Accordingly, the dead trees must have been suppressed early, expiring before reaching any considerable size. The m ore vigorous trees then presumably have been capable o f establishing and strengthening their leadership even without help from thinnings. This is probably due to the very favourable climate for spruce in West Norway - high rainfall and a long growing season.
Diameter DistributionThe tree size is very im portant to economic results.
LIVING TREES
Mean height, m
Figure 3.2 Distribution of volume by diameter classes in relation to mean height.

48 F O R E S T R Y C O M M ISSIO N B U L L E T IN No. 55
The diameter com position is expressed by the p roportion o f “ large trees” in a stand. “Large trees” are defined in two ways, as trees with a dbh greater than 17 and 25 cm respectively.
The following may be seen from Figure 3.2:M ean heights exceeding 15 m at least 80 per cent
by volume of living trees were large enough to yield pulpwood (dbh 11cm). A t m ean heights exceeding 20 m at least 80 per cent by volume were large enough to yield saw tim ber (dbh 17 cm). A t mean heights exceeding 20 m m oreover a considerable part o f cubic mass consisted of trees w ith dbh 25 cm.
This diameter distribution has been com pared to distribution tables for spruce plantations in SouthEast, middle and N orth Norway (Vestjordet, 1972). It was found that there were m ore large trees per hectare on the West Norwegian unthinned plots than on thinned plots at the same stage of development in other parts o f Norway - where the limits for large trees were set at 17 or 25 cm. M ean diameter, however, is somewhat smaller on the unthinned plots.
The conclusion from this must be that the diameter development o f the unthinned plots in West Norway has been surprisingly good and “norm al” . Again, we see that the m ost vigorous trees are fighting their way through even without help from thinnings, probably because of the favourable climate for growth.
Soundness and StabilityIt sometimes happens that overstocked, unthinned stands suffer from calam ities- mainly snow breaks and windthrow. But the plantations in West Norway seemed to have been spared this. Vitality of the unthinned stands has been surprisingly good.
ConclusionEven if the basic material o f this study is comparatively modest, it shows that spruce plantations in the humid West Norwegian climate can develop favourably even without thinnings. A great majority of sample plots show that a very small part o f the merchantable volume yield is being lost. W ood quality seems to be good, the dry m atter content is probably higher than in heavily thinned stands. Of course, consideration must be given to the fact that diameter development will be somewhat retarded when stands are left unthinned. But, sometimes, it is considered as an advantage that the growth of the largest trees is slowed down a little, both on account
of wood quality and because dimensions may be too large for the Norwegian market. However, the differences in tree dimensions within unthinned stands can be considered as disadvantageous to the economy of logging.
Altogether, a “no-thinning” forestry might be the most economical solution for difficult logging conditions in West Norway, and maybe also in coastal areas o f N orth Norway.
REFEREN CES B r a n t s e g , A. (1951). Kubikk- og produksjonsunder-
sokelser i vest-norske granplantninger. Summary: Investigations on volume and yield in spruce plantations in West Norway. Meddr. Vestl. forstl. ForsStn 9: 1-109.
V e st jo r d et , E. (1972). Diam eterfordelinger og haydekurver for ensaldrede granbestand. Summ ary: D iam eter distributions and height curves for evenaged stands o f Norway spruce. Meddr. norske SkogforsVes. 29: 469-557.
DISCUSSION W. Sutton: You raised the question o f wider spacing. How wide do you think we can go, and is there enough research on the effects o f wide spacing on quality and so on?
Borset: We do not have many spacing experiments in Norway but when we put together what we have in Norway with those in Sweden, then we probably have a real programme. Those in the best position to make recommendations suggest 2 -0 m x 2 -0 m but not closer, and we can go up to 2-5 m x 2 -5 m but not much more.
Kramer: W hat ro tation would you recommend for unthinned stands ?
Borset: The stands we have investigated were 40- to 70 years old, but I think we should recommend 2-5 m spacings and harvest at 50 years.
Fries: D o you expect to get sawtimber a t that ro tation?
Barset: Yes. In Norway at present we cannot sell the larger material, so that, for example, in thinning 40-60 year old stands it is often very useful to remove the larger trees before they reach a size which you cannot sell.

P aper 4
THE DEVELOPMENT OF THINNING SYSTEMS IN YOUNG SITKA SPRUCE AND CONTORTA PINE CROPS
By G. J. G A LLA G H ER Forest and Wildlife Service, Department o f Lands, Republic o f Ireland
The predominance o f young plantations of Sitka spruce (Picea sitchensis (Bong.) Carr.) and coastal contorta pine (Pinus contorta Douglas ex Loudon) in State forests o f the Republic o f Ireland highlights problems associated with the management o f fast growing exotic conifers in an Atlantic climate. Thinning these plantations poses m ajor difficulties.
There is little forestry tradition in the Republic. State forestry, the main enterprise, is less than 75 years old. Re-forestation was undertaken only to a limited extent until the I950’s. Since then, however, 10,000 ha have been planted annually. M ost o f this has been on land, not previously wooded. Over 70% o f these plantations comprise Sitka spruce and almost 20% contorta pine. The lack of a forest tradition has bo th advantages and disadvantages. On the debit side there is a lack o f long term growth and yield inform ation, the absence of historical silvicultural lessons, and scanty inform ation on the effects o f managing forests on sites heretofore unplanted. On the credit side, this lack of tradition has m eant that problems could be tackled without the inhibiting influence of deeply held classical views. In addition the need to maintain a forestry programme through the purchase of new land has increased sensitivity to economic factors.
The question o f rationalising thinnings and reducing their cost is com mon to all countries, but the development o f thinning systems in a re-afforestation program m e emphasises some m ajor problems.
Row an (1972) describes a system as a group of
interdependent items that together achieve a single purpose. The search for a system which links the silvicultural and operational steps needed to produce tim ber cheaply from intermediate cuttings, while benefiting the remaining crop, is a continuing one. Some of the steps have been investigated in the Republic, and the extent to which these contribute to a system for Sitka spruce and contorta pine is described.
Silvicultural AspectsThinning practice in the Republic has until recently involved frequent and light thinnings. Various pressures have led to changes. The most im portant are:—(1) The need for quick return on investment in
terms of rapid diameter growth, leading to shorter rotations.
(2) The demands from w ood processing industries (mainly chipboard and hardboard producers) for continued supplies o f material from forests which are still young.
Plantations have been established at 3000 trees per ha and though wider spacings are now used competition between trees at an early stage means that diameter growth is slow.
One of the first aspects to be investigated was the intensity of thinning required to allow high early yields and to maintain increment. A num ber o f experiments have been laid down since the early 1960’s to deal with these questions.
T able 4 .1
T h in n in g I n t e n sit y E xperim ents
Species Established Age Replications Treatment
Sitka spruce 1964 21 3 x 2 3 intensitiesSitka spruce 1968 17 5x3 5 intensitiesSitka spruce 1971 18 2 x 3 x 3 3 intensities
3 fertiliser treatments
Contorta pine 1962 14 8x3 Different numbers of thinnings during rotations
Contorta pine 1962 17 8 x 2 Different numbers of thinnings during rotations
Contorta pine 1965 12 7x3 Different numbers of thinnings during rotations
Contorta pine 1964 17 4 x 2 4 intensities (all contorta pine experiments wind damaged)
49

50 F O R E S T R Y C O M M ISSIO N B U L L E T IN No. 55
Thinning Intensity heavy (up to 33% standing basal area or volumeFollowing an analysis o f early results from thinning removal) without increment loss. Subsequent moder-experiments (Gallagher 1969) an examination of ately heavy thinnings (40-60% periodic basal arearecent data from these experiments gives some guide increment removed) may cause a small loss. Verylines on thinning intensity. Table 4.2 suggests that heavy first and subsequent thinnings appear to resultfor Sitka spruce first thinnings can be moderately in some loss in increment.
T a bl e 4 .2
T h e E ffec t o f T h in n in g I n t e n sit y o n S it k a S p r u c e
AgeL ight
15% BA removed 20-40 % BAI removed
M oderate 30 % BA removed
40-60% BAI removed
H eavy 45 % BA removed
60-80 % BAI removed
21-25 117Volume increment (m3)
121 106(100) (103) (91)
25-29 187 164 155(100) (88) (83)
21 13-8Main crop Diameters (cm)
161 18-2(100) (117) (132)
25 1 6 0 18-9 21-9(100) (118) (137)
29 18-0 21-8 26-6(100) (121) (148)
diam (cm) Vol. (m3)Thinnings removed
diam (cm) Vol. (m3) diam (cm) Vol. (m3)21 8-1 24 10-3 80 12-8 138
(100) (100) (127) (333) (158) (575)25 10-8 14 14-5 33 17-6 43
(100) (100) (134) (236) (1621 (307)29 12-1 17 17 0 48 22 0 70
(100) (100) (140) (282) (182) (412)
Brackets denote data as a % of Light Thinning.
T abl e 4 .3
T h e E ffec t of T h in n in g I n t e n sit y o n C o n t o r t a P in e
Agevery light
15% BA removedLIGHT
25 % BA removedHEAVY
38 % BA removedVERY HEAVY
45 % BA removed
Volume increment (m3)17-23 128 134 125 134
(100) (105) (98) (105)
Main crop Diameters at 1st and 2nd thinning (cm)17 12-4 11-0 12-9 12-1
(100) (89) (104) (98)23 14-2 15-1 161 160
(100) (106) (113) (113)
Volume of thinnings removed (m3)17 14 28 62 64
(100) (200) (443) (457)23 7 24 39 57
(100) (342) (557) (814)
Brackets denote data as a % of very light thinning

A SP E C TS OF TH INN IN G 51
The effect o f the first thinnings on volume increment is reasonably consistent with the concept o f a ‘marginal thinning’ (Bradley 1969, Ham ilton and Christie 1971) though possibly after second thinning crops are m ore sensitive to thinning weight than expected. A t this stage differences in volume increm ent are not statistically significant. Some recent measurements from a m ore extensive Sitka spruce experiment are not inconsistent with the results but require further study. The position with contorta pine seems to be less clear so far. Over a range of thinning intensities no definite trend is discernible (Table 4.3). Again there are differences in diameter measurements at 1 -3 m.
The suggestion is then that while there may be some loss in Sitka spruce from very heavy first thinnings, thinnings o f about 33 % standing volume removal have not had a serious effect. G ood volumes
can be achieved and the mean diameter increment at 1 -3 m on the remaining crop is increased. This is a consideration while the very m arked difference in price between pulp sized material and sawlogs operates. A t a 5 % interest rate a rotation producing sawlog material a t 50 years might be worth twice that o f a pulp ro tation a t 30 years. Thinnings, which involve time in selection and measurement, are costly however, and as Fries (1969) points out, costs at first thinning stage are critical.
Thinning TypeAs results from thinning intensity trials began to emerge the need for the study into varying types at moderately heavy intensity was realised.
Table 4.4 lists thinning type experiments established in Sitka spruce.
The first comparisons were between various
T a b l e 4 .4
T h in n in g T y p e E xper im en t s in S it k a S p r u c e
Year Age of crop Replications Treatments
1963 18 2 x 2 Low and Scottish Eclectic1968 17 6 x 2 6 types including normal low and row1971 17 8x3 8 types including row-mechanised and semi-mechanised
selective methods. N o differences w orth mentioning were noted between conventional low thinning and the m ore complex selective Scottish Eclectic m ethod (M cDonald 1961, Gallagher 1969).
In the 1968 experiment 5 thinning types, each removing systematically 33 % of standing basal area a t first thinning, and, in 4 o f the treatments, 25 % of standing basal area removal at second thinning, were com pared with conventional low thinning of the same weight.
First01 Conventional low02 Every 3rd tree
removed03 Every 3rd row
removed
Second Selection continued Unthinned
Every 4th row removed to leave gaps of 2 rows
04 Every 5th and 6th Every 4th row removedrow removed to leave gaps of 3 rows
05 Rows in two Every 4th row removeddirections to leave gaps of 1 row
06 Largest trees Largest trees removedremoved
Variation in increment within blocks m eant that differences were not significant though, there was a slight suggestion that low thinnings did better. (Table 4.5).
Mean diameters at 1 -3 m, where largest trees were removed, were reduced; also reduced were diameters a t l ’3 m in rows between unthinned adjoining rows.
The second thinning was designed to increase the differences in crop structure caused by first thinning to effect differences which would m ore easily be detected.
T able 4 .5
E ffect of T h in n in g T y p e o n S it k a S p r u c e
Treatment 01 02 03 04 05 06
Volume increment 1968-72 (ms) 141 130 117 122 136 119(increment as a % of 01.) (100) (92) (82) (87) (96) (84)

52 F O R E S T R Y C O M M ISSIO N B U LL E TIN No. 55
T able 4.6T ime C ontent of T h in n in g T ypes (% of Conventional Low T h in n in g )
Treatment 01 01 02 03 04 05 06
FItime in minutes per plot 14-4 100 42 1 2 36 2
F2 14-5 100 49 52 47 66 73LI 1 4 4 100 42 44 44 63 97L2 14-5 100 49 52 47 66 73L3 14-5 100 49 49 44 74 84
L4 2-2 100 217 187 145 151 241G1 129-6 100 102 111 94 116 128G2 227-6 100 72 92 79 89 113G3 26-1 100 87 96 93 105 109HI 223-7 100 147 142 161 150 200
ALL 731-5 100 86 83 76 92 112
Forester 28-9 100 46 26 24 37 38Worker 702-6 100 96 97 88 102 131
CostingsA time study was done during the establishment of the thinning type experiment. The following elements were m easured:—F I SelectionF2 BookingLI M arkingL2 PaintingL3 MeasuringL4 Volume sampling (tariff) 2 workers*G1 Felling ")G2 Snedding > 2 workersG3 Stump protection JH I Extraction 2 workers and horse
It clearly emerged that both row thinnings by removal of every 3rd row and every 5th and 6th row were less costly than others. Removal of largest trees came next. Removal o f every 3rd tree was time consuming because of trees left hanging during felling. Brashing, a very costly operation, was not listed for this study. It is obvious, however, that any form of row thinning would reduce this operation. Heavier row first thinnings are now being tried.HarvestingA committee was established in 1970 and given the following objectives.
1. To study all aspects o f forest crop harvesting including the present practice, techniques and trends;
2. To make recommendations on harvesting techniques, engineering services and m arketing.
This basically involved investigations of harvesting systems for different patterns and intensities of thinning. The emphasis was on variants of the thinning types and intensities described earlier.
These incorporated:—
(a) Shortwood row thinning methods(b) Skylines
As W hayman (1973) points out machines and working systems cannot be considered in isolation. A fairly extensive project was undertaken to investigate thinning systems, operational m ethods and machines together.
Four machine m ethods of extraction were investigated.(1) T ractor with pallets;(2) H iab loader unit;(3) Igland winch attached to F ordson four-
wheel drive;(4) Rom e guillotine.
The thinning grade comprised a systematic thinning involving removal o f every 3rd row. Details are as follows:—
A. Felling, stump treatm ent, trimming and joining by chainsaw operator. Shortwood was stacked in 0-5 m 3 piles on pallets for extraction by tractor with m ounted fork lift. Pallets are 12-18 metres apart.
A1. As for A except that shortwood from three lines are thrown into the centre line. Pallets are 4-6 metres apart.
A2. As for A except that shortwood is produced from one to three trees and piled in untouched rows at right angles for extraction by Hiab loader.
B. Chain saw operator fells, treats stumps and trims. Extraction is by Igland winch attached to four wheel drive tractor.
C. W hole tree removal by ‘Rome Guillotine’. Shears attachm ent on a standard Caterpillar 920 with split frame hydraulic powered steering.
•Felling o f experim ental sample trees included
1 Forester
1 worker

ASP E C TS O F TH IN N IN G 53
T able 4.7St a n d a r d T imes a n d C osts for T h in n in g /E xtraction Systems
ThinningTime
Cost pence/m8Standard
Man MinutesStandard
Machine Hours
A 98-4 6-4 (Pulp) 133A1 107-6 6-4 (Pulp) 145
A 104-0 6-4 [85% Pulp 1 148166-0 16-2 [15% commercial lengths]
A1 107-6 6-4 [85% Pulp I 159166-0 16-2 [15% commercial lengths]
A2 71-2 19-5 140B 169-0 0-38 182C Method rejected be
cause of difficulties.
Limitations for A were twofold, (1) brashing would be required (2) Palletting proved tedious for operators. Type B did not require intensive brashing but there were problems associated with drains and fences. Type C caused considerable damage to roads and trees at the end of rows while very rapid accumulation of lop and top occurred at road edges.
Further investigations have dealt with extraction by skyline associated with row thinning and with weights o f thinning varied up to 40% standing basal area removal. D irect comparisons have not been made between tractor and skyline methods, but some studies have been done to improve the skyline m ethod by comparing lengths of racks and the distance between them. W ork is also in progress to allow for an overall thinning design to suit tractor o r skyline at moderately heavy intensity row thinning.
Wind DamageM ost wind damage in Sitka spruce and contorta pine plantations has been associated with gusting during severe storms when gusts o f over 80 kilometres per hour were experienced. Specific investigations to associate windblow with thinning have been limited but the 1974 storms with gusting of 115 kilometres per hour did provide an opportunity to review damage in sample plots (Gallagher 1974). Table 4.8 shows that out o f 64 contorta pine plots,
including unthinned plots, only 8 were undamaged and these were unthinned plots. The situation was not as severe for Sitka spruce. O f 129 plots 96 were undam aged and though the damage was greater in row or systematically thinned plots, nevertheless 40 out o f 55 escaped damage.
ConclusionResults are tenuous but do suggest that first row thinning types of moderately heavy intensity (33% standing volume removal) will be feasible for Sitka spruce. The alignment o f these rows needs further investigation but the cheapness of the system is attractive. Small machines can operate these thinnings and provided the basic framework is established a t first thinning, further reduction in costs will depend on technology and operations research- whether through wheel machines or winches. Large and costly machines are not now suitable for small scattered operations. Study of subsequent thinnings - with regard to crop structure and diameter assortments are required. W indthrow may pose considerable problems for contorta pine, but the range of Sitka spruce sites in the Republic suggests less difficulties with this species. The question of increased spacing has not been dealt with but will form an integral part of future studies of crop structure and thinning.

54 F O R E S T R Y C O M M ISSIO N B U L L E T IN No. 55

ASP E C TS OF TH IN N IN G 55
R E F E R E N C E SB r a d l e y , R. T. (1969). The influence o f thinning
grade and thinning m ethod on stand increment. Proc. IUFRO meeting-.Thinning and Mechanisation, Stockholm, 108-109.
F r ie s , J. (1969). Value of residual stand principal views. Proc. IUFRO meeting. Thinning and Mechanisation. Stockholm 21-28.
G a l l a g h e r , G . J. (1969). The thinning o f Sitka spruce; two experiments: Irish Forestry, Vol. 26.1. 4-20
G a l l a g h e r , G . J. (1974). W indthrow in State Forests o f the Republic o f Ireland. Irish Forestry, 31, 2. 154-167.
H a m il t o n , G . J. and C h r ist ie , J. M. (1971). Forest management tables. Booklet 34 F or Comm. Lond. HM SO.
M c D o n a l d , J. A. B. (1961). The simple rules o f the Scottish Eclectic thinning method. Scottish Forestry, 15, 220-226.
R o w a n , A. A. (1972). Harvesting systems present and future. Supplement to Forestry, Harvesting and marketing 13-35. Oxford University Press.
W h a y m a n , A. (1973). Forest testing of machinery. Work Study in Forestry. Bull. 47. F or Comm. Lond. 76-77. HMSO.

P aper 5
NEW ZEALAND EXPERIENCE WITH RADIATA PINE
By W. R. J. SUTTON*Forest Research Institute, Rotorua, New Zealand
Although New Zealand is no t the only country which relies on plantations as the m ajor source of wood, it is probably unique in that m ost o f its wood comes from clearfellings and not thinnings. Since thinning cannot objectively be considered independent of the total management system, and since New Zealand is probably nearer to a balanced wood supply from her plantations than any other country, her experiences in thinning may be of some relevance to this meeting.
Historical BackgroundA t the beginning of this century it was recognised that New Zealand’s indigenous forests could not provide the country’s wood needs beyond the 1960s and large plantations (mainly of R adiata pine - Pinus radiata D. Don) were established in the late 1920s and early 1930s. It was always intended that m ost o f these plantations would be thinned, but absence of money, the Second W orld W ar and, most im portant, the absence of markets m eant that little or no thinning was done. By the late 1940s, stands of R adiata pine were approaching 30 m, or m ore, in height and 60 m2/ha, or more, basal area, and com petition within the stands was intense. In the absence of any action by management, nature took the m atter into her own hands, and, through the agent of the Sirex wood wasp, thinned the stands “ naturally” . The Sirex epidemic was certainly not the disaster with which it is generally credited in the world forestry literature. True, the losses do appear dram atic (on a good average site 450 m 3/ha over 35 years - equivalent to an M AI of 13 m3/ha/yr - the to tal volume left was 810m 3/ha, an M A I of 23 m3/ha/yr) (Spurr, 1962) but losses were usually confined to small lower dominance trees and growth was concentrated on to fewer stems which could be felled and utilised earlier than would have been possible without the “ thinning” . Clearfellings from these Sirex thinned stands now make up m ore than 90% of the R adiata wood supplied to New Zealand industry for export.
The experience o f the Sirex epidemic demonstrated that stands must be thinned. Early conversion experience also indicated that pruning would be desirable.
The Need for PruningR adiata’s intrinsic wood properties make it a potentially useful species for a wide range of end uses: peeling, sawntimber (both finishing and strength grades) and chipping (mechanical and chemical pulps, chipboard etc). These properties, particularly density, are not greatly affected by treatm ent, especially those, such as thinning, which affect the rate o f growth (see Sutton and Harris, 1974). By far the m ost im portant degrading factor are the branches or, m ore correctly, the size, condition and distribution of the resultant knots.
Attem pts to control branch size and condition by silvicultural means have largely proved unsuccessful or impracticable:
Attem pts to restrict branch size by close initial spacing and holding stands until the nonresponse of the branches within the bottom 1£ to 2 log lengths can be assured has meant that first thinning must be delayed until stands are 20 m or m ore high. Such treatm ents suffer wind damage and require long rotations. The potential for restricting branch size by genetic selection appears limited (Shelbourne, 1970).Attempts to control branch condition by m aintaining deep live crowns to ensure that resultant knots would remain intergrown have also proved unsuccessful because the knots are large and because R adiata pine almost always produces whorls o f branches within the green crown which die after only one season’s growth.
Branch distribution is not influenced by silvicultural treatm ent. Sawn knotty Radiata, no m atter how it is grown, is not o f a high grade. Rarely would it be better than Scandinavian fifths o r N orth American lower com m on’s grades. Yet free of knots its grade (ignoring the restriction on ring width) could be Scandinavian firsts o r N orth American “B” Select.
The only way to grow quality R adiata pine for peeling, finishing and strength uses is to grow it free of knots. This means pruning. (There is one other alternative - viz. grow uninodal trees from which the long clear internodes can be cut and used as such or finger-jointed - but selected seed from uninodal parents is needed first).
'Currently N.R.A.C. Post Graduate Research Fellow at Oxford University.
56

A SP E C TS OF TH INN IN G 57
The First Tending SchedulesRecognising the need for thinning and pruning, and influenced by classical thinning teaching, U re (1949) developed a schedule which incorporated pruning, early thinnings to waste and two later thinnings with
yield. This was later modified to include only one thinning with yield (Penistan, 1960). Virtually the same schedule is in operation today in some forests of New Zealand. Details are given in Table 5.1.
T a bl e 5.1
T e n d in g S c h e d u l e - ‘Y ie l d T h in n in g R eg im e ’
Mean Height Crop Trees (m) Operation
_ Plant 2,240 stems/ha (spacing approximately 2-4x 1 - 8 m)6 0 Prune 500 stems/ha 0-2-4 m9 1 Prune 320 stems/ha 2-4-4-3 m
12-2 Prune 320 stems/ha 4 • 3-6 ■ 1 m12-2 Thin to 500 stems/ha (no yield)2 7 0 Thin to 198 stems/ha (with yield)41-46 Clearfell
In 1959-60 the first stands treated on this regime were thinned and the extracted material was sent to a sawmill. A fter the initial intake the sawmill refused to continue sawing because it claimed the grades were poor, conversion low and the cost o f the sawing high. The cost o f extracting the thinnings also proved high and the whole operation made a loss. The subject o f thinning for yield has been controversial ever since.
Research on Tending and the Development o f an Alternative RegimeInitial research took the form o f investigations into the quality o f thinnings as sawlogs, the effect of thinning on the residual stand, and the economics of the operation. W hen these investigations confirmed that thinning for yield may not increase overall yields, produce intermediate returns or allow greater selection of the final crop, the research effort was
intensified on the development of tending regimes which did not include thinning yields.
The research approach was to study the total system, in particular: the interactions between initial spacing, pruning, thinning and the final crop; the importance o f the timing and intensity of silvicultural operations; and the quality of, and price differentials for, the extracted end products.
The work indicated that pruning could greatly enhance the quality and value o f the final crop but only if the pruning was severe and associated with thinnings. The quality and economics of a regime are determined primarily by the timing and intensity o f the silvicultural operations.
The first proposals for an alternative regime were those for a “ Short R otation Sawlog Regime” (Fenton and Sutton, 1968) and further refinements were presented in the ‘Direct Regime” (Fenton, et al.,1972). Details of the regime are given in Table 5.2.
T able 5 .2
T e n d in g S c h e d u l e - “ D ir ec t R eg im e”
Mean Height Crop Trees (m) Operation
_ Plant 1,500 stems/ha (spacing approximately 3 • 7 x 1 • 8 m)4-9 Prune the best 740-620 stems/ha 0-2-4m
Thin all others (no yield)7-9 Prune the best 370-320 stems/ha 2-4-4-3 m
(If incorporating grazing, thin all others)10-7 Prune the best 198 stems/ha 4-3-6-1 m
Thin all others (no yield)13-7 Prune 198 stems/ha (multinodals) 6-1-8-5 m16-8 Prune 198 stems/ha (multinodals) 8-5-11-0 m

58 F O R E ST R Y C O M M ISSIO N B U L L E T IN No. 55
The object o f this regime is to m aintain maximum diameter growth on the crop trees; quality being achieved by selective frequent early pruning to restrict the defect core to a minimum. Unselected trees are eliminated as early as possible because their retention is now known to restrict growth of the pruned trees (Sutton and Crowe, 1972) and because the earlier their removal the lower the cost.
W ith genetically superior stock even wider initial spacings are possible - 7-3 x 1-8 m are under investigation.
Comparison o f the Two RegimesThe two regimes have been very fully investigated and
m uch o f the research is already published (Fenton and Sutton, 1968; Fenton et al., 1972). All I have attem pted to do here is to summarise the m ajor findings under the headings proposed for this meeting. Com parisons are for the same site (good average N orth Island forest site),a. Growth and StabilityCom pared in Table 5.3 are the expected growth rates o f the two regimes and, in Table 5.4, the expected extracted volumes. The ro tation for the regime with a “ Yield Thinning” is 36 years (with the commercial thinning at 19 years); the ro tation for the “D irect” Regime is 26 years. Also in Table 5.4 are MAIs for the two regimes.
T a b l e 5 .3
C o m p a r iso n o f P r e d ic t e d G r o w t h R ates
Height(m)
Yie
Stems/ha
d Thinning Reg Basal Area
(m*ha)
meMean
dbh ob (cm)
Stems/ha
Direct Regime Basal Area
(m'ha)
Mean dbh ob (cm)
10-7 198 4-66 17-312-2 494 9-18 15-513-7 198 8-56 23-415-2 494 17-08 21-1 198 12-23 28-218-3 494 24-94 25-4 198 19-70 35-621-3 489 32-71 29-2 198 27-13 41-924-4 484 40-36 32-5 198 34-55 47-227-4 Before
Thinning
27-4 Thinning 277 22-36 32-0
27-4 Main Crop 198 25-23 40-4 198 41-99 52-130-5 198 31-45 45-0 198 49-40 56-433-5 198 37-70 49-3 198 56-84 60-536-6 195 43-55 51-1 195 63-73 64-539-6 193 49-33 57-242-7 191 55-05 60-1
T a bl e 5 .4
E x t r a c t e d V o lum es ( N et of L o g g in g W aste) a t R o ta t io n A g e (m 3/h a )
Yield Thir Volume
ining Regime Mean dbh ob (cm)
DirecVolume
t Regime Mean dbh ob (cm)
Thinning 147 Clearfelling 660
32-060-0 577 61-7
Total 807
Mean Annual Increment 22 ■ 4 ms/ha/annuin
577
22-2 ms/ha/annum

A SP E C T S OF TH IN N IN G 59
In term s o f total volume yield there is a negligible wood quality the direct regime is far superior. (Seedifference between the two regimes, but in terms o f Table 5.5).
T abl e 5 .5
M e a n A n n u a l I n c r e m en t s b y E n d U se C ateg o ries (m 3/ h a p er year)
Yield Thinning Regime Direct Regime
A. SAWN TIMBERClears and superior grades 2-6 6 1Other grades 4-5 4-1
Total sawn timber 7-1 10-2
B. PULPWOODFrom sawmill slabs 3 0 4-3From logs 9-3* 3-2
Total pulpwood 12-3 7-5
C. LOSSES IN SAWMILUNG PROCESS 3 0 4-5
TOTAL 22-4 22-2
•Includes all logs extracted in the thinning; these are not suitable for sawing.
U nder New Zealand conditions “yield thinning” does not increase to tal volume yields but it does result in poorer quality wood than is possible if the thinning (without yield) is done early to ensure that growth can be concentrated on the final crop trees only.
Stability is difficult to quantify but under New Zealand conditions trees become increasingly susceptible to windthrow after height 15-20 m, particularly if exposure is then increased by thinning. Yield thinning at height 27 m incurs this risk and many stands have suffered serious wind losses. On the other hand, “ . . . since stand stability is undoubtedly increased by heavy early thinning . . .” , (Chandler, 1970) the direct regime is less likely to suffer loss.
b. Damage to Soil and Trees Removal o f thinnings involves considerable soil disturbance and this must involve some roo t damage to residual trees, especially those along extraction tracks and near loading areas. As yet the effect of this damage on growth has not been assessed. R oot infection is not usually a problem in New Zealand.
Damage to the tree stem in extraction thinning has been assessed - butt damage (the loss o f some
bark from the lower portion o f the tree) has been observed in every thinned stand - up to 25 % of the remaining trees can be damaged in this way (Fenton e t a l , 1965; Park, 1972).
F ar m ore serious, though, than actual damage is the loss of potential final crop trees from m ajor extraction roads and the loading areas. Management claims that this loss can be reduced to 3 % but aerial photographs of the best thinned stands have shown area losses o f 7 % (J. B. Crowe, pers. comm.). Since these areas rem ain non-productive for the remainder o f the rotation, this loss is serious. (The yield estimates for the yield thinning regime are therefore probably overestimates, since only a 3% area loss has been allowed for).
c. Costs and RevenueThe economics of the two regimes (and many others) have been intensively researched (Fenton, 1972a and b) and summarised (Fenton, 1972c). The relative profitability and break-even growing costs for the two regimes are given in Table 5.6.
In the calculations the thinnings are assumed to have made a net profit o f $1 per m 3 - in practice the operation would probably have made a loss.

T a b l e 5 .6
R e l a t iv e P r o f it a b il it y (In c l u d in g S o c ia l C osts) (1968 C o sts a n d P rices)
60 F O R E S T R Y C O M M ISSIO N B U L L E T IN No. 55
Criterion Thinning Regime Direct Regime
Land Expectation Value per ha (SNZ)*at 7 % compound interest —14 +240at 10% compound interest —65 +14
Internal Rate of Return 6-66 10-5Break-even growing cost (S per m3)
7% 7-33 3-9210% 19-08 7-55
•Excludes the price of land. SNZ 1 -00=£0-56 approximately.The direct regime is far more profitable than the yield thinning regime.The real cost of yield thinning is the delay in the growth of the final crop trees.
DiscussionIn discussing the results o f his economic comparisons Fenton (1972c) concluded that the regime with a thinning yield was “ . . . inferior in every respect to the direct regim e; it costs m ore than twice as much per (m3), produced lower grades, needs as much labour, has greater managerial, physical, fire and marketing risks . . . Results are so different that no such production thinning should be prescribed; it has no advantage to compensate for its disadvantages” .
The new direct regime has one additional major attraction. Soon after it was first proposed it became obvious that the very open stand conditions created by the heavy early thinning and pruning favoured the development o f understorey weeds, grass, etc.
I t was logical that this growth could be used for grazing (Knowles et al., 1973) and research on this is now well beyond the experimental stage.
The concept o f combined forestry and farming has won wide acceptance in New Zealand. When implemented it eliminates the one objection most theoreticians have to the direct regime: viz, that we are not fully utilising the site. W ith grazing the direct regime can claim to utilise the site fully and can produce intermediate yields o f high quality, viz, animal products, which can be walked off the forest - this is in contrast to a thinning yield o f poor quality wood that can only be removed at considerable expense and with at least some damage to the remaining stand, and can only be grown on regimes which are economically inferior.

A SP E C TS OF TH IN N IN G 61
REFEREN CES
C h a n d l e r , K . C . (1970). Site Limitations on Pruning and Thinning. New Zealand Forest Service, Forest Research Institute Symposium 12(2): 85-88.
F e n t o n , R. T. (1972a). Economics of R adiata pine for Sawlog Production. New Zealand Journal o f Forestry Science 2(3): 313-47.
F e n t o n , R. T. (1 9 7 2 b ) . Economics of Sawlog Silviculture which includes Production Thinning. New Zealand Journal o f Forestry Science 2 ( 3 ) : 3 4 8 - 6 8 .
F e n t o n , R. T. (1 9 7 2 c) . Implications o f R adiata pine Afforestation Studies. New Zealand Journal o f Forestry Science 2(3): 378-88.
F e n t o n , R. T., J a m es, R. N ., K n o w l e s , R. L. and S u t t o n , W. R. J. (1972). Growth, Silviculture and the Implications o f Two Tending Regimes fo r Radiata pine. Proceedings Seventh Geography Conference, New Zealand. New Zealand Forest Service Reprint No. 635.
F e n t o n , R. T., M a c k in t o s h , J. D. and H o sk in s , M. R. (1965). Assessment Results fro m Production Thinnings o f Young Stands o f Radiata pine and Douglas fir. New Zealand Forest Service, Forest Research Institute Silviculture R eport No. 40 (unpublished).
F e n t o n , R. T., and S u t t o n , W. R. J. (1968). Silvicultural Proposals fo r R adiata pine on High Quality Sites. New Zealand Journal o f Forestry 13(2): 220-8.
K n o w l e s , R. L., K l o m p , B. K., and G il l in g h a m , A. (1973). Trees and Grass - A n Opportunity for the Hill Country Farm er. Proceedings o f the Ruakura Farmers' Conference 1973. 110-21.
P a r k , J. C. (1972). Assessments o f Production Thinned Stands - Pinus radiata. New Zealand Forest Service, Forest Research Institute, Economics o f Silviculture Report No. 52 (unpublished).
P e n ist a n , M. J. (1960). T hinning Practice. Forestry 33(2): 149-73.
S h e l b o u r n e , C. J. A. (1970). Genetic Improvement in Different Tree Characters o f R adiata pine and the consequences for Silviculture and Utilisation. New Zealand Forest Service, Forest Research Institute Symposium 12(2), 44-58.
S p u r r , S. H. (1962). G row th and M ortality of a 1925 Planting o f Pinus radiata on Pumice. New Zealand Journal o f Forestry 8(4): 560-9.
S u t t o n , W. R. J., and C r o w e , J. B. (1972). Pruning o f R adiata pine D om inants. P art 4. Effect o f Pruning on Dominance, G row th and Stem Characteristics. New Zealand Forest Service, Forest Research Institute Economics o f Silviculture Report No. 53 (unpublished).
S u t t o n , W. R. J., and H a r r is , J. M a d d e r n . (1974). Effect o f Heavy Thinning on W ood Density in R adiata pine. New Zealand Journal o f Forestry Science 4(1): 112-5.
U r e , J. (1949). The N atural Regeneration o f Pinus radiata on K aingaroa Forest. New Zealand Journal o f Forestry 6(1), 30-38.
DISCUSSION
Van Laar: In South Africa there are serious doubts about the economics of so called high-pruning. Do you feel that there is any value in pruning to a height greater than 13 feet (approximately 4-0 m )?
Sutton: In what I have called the Yield Thinning regime, with relatively long rotations, I would not recommend pruning to the second log. W ith the Direct regime which involves a short ro tation and where the effect o f com pound interest on costs is less, pruning of the second log is really worthwhile.
W hether or no t one should prune the second log depends on the size of tree one is aiming at and the ro tation length.
Busby: W hat do you mean by ‘social costs’ in Table 5.6?
Sutton: The social costs cover things like housing, septic tanks, cookhouses etc for employees. That is they are direct social costs incurred by the employees in the forestry department.

P ap er 6
THINNING RESEARCH IN SOUTH AFRICABy A. VAN LAAR
Faculty o f Forestry, University o f Stellenbosch
INTRODUCTIO NIn South Africa, afforestation with exotic tree species began around the tu rn of this century. Pinus radiata, P. elliottii and P. taeda were im ported from U.S.A., P. patula from Mexico, P. caribaea from the Caribbean, P. canariensis from the Canaries, P. pinaster from Southern Europe, Eucalyptus and Acacia species from Australia. During the initial stage of forestry, the emphasis was on experiments to select species for specific climatic zones. Thereafter the emphasis shifted towards silvicultural operations such as pruning and thinning. During the early days of forestry, prior to 1935, thinnings were light and concurred with contem porary thinning practices in Europe. Economic conditions and the
m arket situation in South Africa between 1930 and 1940 necessitated a drastic revision o f the thinning regime. Planting espacement was increased from1-60x1-60 to 2-70x2-70 m and rules, which were subsequently also adopted by private growers, were laid down to regulate stand density in state- owned plantations on sites o f different qualities. After some m inor changes, introduced in 1948, the recommended stem numbers per hectare, o f the remaining stand, in plantations of fast-growing pines, such as P. radiata, P. patula, P. elliottii and P. taeda were as shown in Table 6.1.
These thinning prescriptions served as a guide in forest management, with the understanding that
T a bl e 6.1
S tem N u m ber o f R e m a in in g St a n d
Site quality I Site cluality II Site quality III
Stems per Stems per Stems perAge hectare Age hectare Age hectare
0 1310 0 1310 0 131010 820 6 520 6 74015 540 18 370 14 37020 370 23 300 20 25025 300 40 0 50 030 0
they should be adapted to local conditions. During this period a regime of heavy early thinnings was economically justified because a m arket for smallsized tim ber e.g. for pulpwood, was virtually non-existent and the steep price-size gradient, which existed between 1930 and 1940, rendered heavy thinnings m ore profitable. The above thinning regime was based on Craib’s growth studies in pine plantations (Craib 1939, 1947). Craib assumed that total volume production per hectare might be depressed as a result o f heavy thinnings, but there was meagre statistical evidence with regard to the magnitude o f the rate o f depression. M arket conditions and economic considerations however were o f overriding importance.
THINNING RESEARCHSince 1935 three directions in thinning research have been pursued.
1. Correlated Curve Trend projects2. The application of growth models to men-
surational studies in temporary sample plots3. Replicated thinning experiments
1. Correlated Curve Trend ProjectsC.C.T. experiments, devised by O’Connor (1935), are spacing trials, established with the ultimate goal o f constructing sets o f real growth series, for sites of different qualities. A single replicate contains 8 one- fifth acre plots with stem num ber varying between 125 and 3000 per hectare. As the establishment of sample plots with this range of stem numbers was impractical, all plots o f a series were planted at 1 -80 x 1 -80 m (3000 stems per hectare) and p rogressively thinned, prior to the onset o f competition. To this end, plot 1, selected at random from the group of 8 plots, was left unthinned and plots 2 and 8 were thinned during the second year after planting,
62

A SP E C TS O F TH INN IN G 63
the stem num ber being reduced from 3000 to 1500 stems per hectare. Plots 3 to 8 were thinned from 1500 to 1000 stems per hectare, as soon as the diameter growth o f plot 1 dropped 0*05 inches below that o f p lot 2. Plots 4 to 8 were thinned from 1000 to 750 stems per hectare as soon as the diameter increment of plot 2 was below plot 3 etc. A fter the last thinning, which was carried out at the age of 9 to 10 years, the series contained plots with nominal densities o f 125, 250, 375, 500, 750, 1000, 1500 and 3000 stems per hectare. Because of mortality, the actual stocking at 30 years however was below nominal stocking. The rate o f mortality was dependent on stand density and was invariably highest in plots 1 and 2 with nominal densities of 3000 and 1500 stems per hectare respectively.
Preliminary results o f C.C.T. experiments were published by M arsh (1957) and Pienaar (1965). Pienaar’s studies are o f particular interest. They deal with the application o f the Chapm an-Richard growth model to test the hypothesis that live basal area per hectare reaches an asymptotic level which - within a certain range o f stand densities - is independent o f stocking density. This asymptotic yield level is therefore a site param eter and expresses the capability o f a site to support a certain live basal area. Pienaar’s studies were based on mensurational records in the C.C.T. experiment at M ac-M ac in the Transvaal. The following conclusions were drawn:
1. The hypothesis o f a common asymptotic live basal area yield for stand densities between 750 and 3000 could not be rejected.
2. The age of culmination o f the rate o f basal area growth was related to stand density. In plots with 3000 stems per hectare it culm inated at 4 years, in plots with 500 stems per hectare at 7 years and in plots with 125 stems per hectare at 13 years.
3. The rate o f basal area growth at culmination was directly related to stems per hectare. It was 2*20 m 2 per hectare for N = 3000, 0'72 m 2 per hectare for N = 5 0 0 and 0'30 m 2 per hectare for N = 125.
4. A fter culmination, the rate of basal area growth in plots with high stand densities declined faster than in plots with wider spacings. The rate of basal area growth in plots with N = 3000 dropped below the growth in plots with N = 1500 at 9*8 years, below those with N = 5 0 0 at 15 years and below plots with N = 1 2 5 at 25 years.
5. A t 14 years the mean true form factor in plots with N = 3 0 0 0 was 0*565, in those with N = 5 0 0 it was 0'524 and in plots w ith N = 125 the form factor was 0*495.
A m ore recent study (Reinstorf 1970) indicated that growth curves for live basal area in plots at Mac-Mac, with stand densities o f 750, 1000, 1500 and 3000 per hectare converged a t the age of 29 years. There were indications however that live basal area at the age o f convergence did not represent an asymptotic value. D ue to the excessively high m ortality rate on plots, with a nominal stem number o f 3000, basal area growth drops, after the age of 29 years, below that observed in plots with N = 1500. This raises the question as to whether mortality must be explained in terms of the inability o f a site to support live basal area beyond a certain level, or whether other factors are operative, in addition to competition. In plots with 3000 stems per hectare, the roo t system might, a t older ages, be inadequate to meet the dem and for water, thereby making the stand m ore vulnerable to drought conditions, prevailing in certain years.
Reinstorf’s studies were carried out in P. elliottii, in C.C.T. experiments a t Mac-Mac, Kwa-M bonambi and Border. Similarly to Mac-Mac, the plot data for Kwa-M bonambi indicated a tendency for a convergence o f basal area growth curves, but the point of convergence had not yet been reached at the age o f 31 years. The mensurational records of the Border-experiment however did not indicate the occurrence of an asymptotic live basal area. A pparently, site factors are o f decisive importance and influence the observed growth patterns.
Each C.C.T. experiment includes 8 sample plots which are thinned at different ages and represent different degrees o f thinning; these thinnings are carried out after competition has commenced, with the purpose of predicting the growth rate o f thinned stands. Pienaar formulated the hypothesis that the growth rate o f thinned stands is equal to that of those unthinned stands which have the same density as the former after thinning. In the unthinned stand this specific density will have been reached at an earlier age. Statistical tests were carried out by Pienaar (1965) in Pinus elliottii and by Joubert (1964) in Pinus patula. The growth rate of thinned plots was com pared with that o f unthinned plots of similar density but o f different age, the observations being conceived as a random sample from a population of growth differences with a mean equal to zero. The tests confirmed M arsh’s earlier postulation that the above growth hypothesis for thinned stands holds true for a wide range o f stand densities. U ndoubtedly the sample size, i.e. the num ber o f thinned plots, available in each experiment was insufficient to conduct a high-powered statistical test and thus to detect small differences between the observed and hypothetical growth rate. This however does not impair the usefulness and scientific value o f C.C.T.-

64 F O R E S T R Y C O M M ISSIO N B U L L E T IN No. 55
projects which constitute an imaginative approach in thinning research.
2. The Use of Response Equations Multiple regression equations relating stand density and other stand characteristics to growth, were used by G ru t (1970) and Crowe (1965). G ru t’s studies were based on mensurational records in perm anent sample plots in P. radiata, the observations a t different ages being interpreted as independent estimates of growth. A prediction equation was developed and tested for significance, including log stem number, age2, height/age, height x stem num ber as explanatory variables and basal area increment as dependent variable. Crowe’s studies were based on tem porary plots in stands of P. patula o f different ages and stand densities. They were m easured once only and estimates for basal area growth were derived from increment cores. The regression equation included reciprocal values o f age and stand density/age as explanatory variables to estimate basal area growth.
3. Replicated Thinning Experiments3.1 Thinning Research in PoplarsPrior to 1965 the silviculture of poplar plantations
followed the general pattern in South African man-m ade forests (Tingle 1966). Populus deltoides was generally planted a t an espacement o f 2-70 x2-70 m. The severity o f thinning varied slightly according to site quality. Site class I stands, with a m ean height o f approximately 31 m at the age of 20 years, were thinned at 4, 7, 10 and 12 years, site class II stands, with a m ean height o f 25 m a t 20 years a t 5, 8, 11 and 13 years. The trees o f the first thinning, with a mean diameter o f 13 to 14 cm, had no commercial value. In South Africa, Populus deltoides, is planted for matchwood, with a diametero.b. a t the thin end of the log of 15 cm and over. Theoretically, the first thinning could be utilised for chipboard and wood-wool, for which tim ber between8 and 15 cm diameter is used, but in practice it is no t utilised. The pre-1965 thinning regime, when expressed in stems per hectare are S% o f the remaining stand, the latter defined as
100 x mean height, . . ..-------------- ;---------- is given in Table 6.2.
y s te m s per hectare
In 1965 two replicated thinning experiments (Red- clyffe) were established in site quality 1 stands, 8 and9 years old respectively (Van Laar 1970). The S% after thinning was introduced as criterion for stand
T able 6.2Stems per H ectare a n d S% in P o pulus D eltoides
Site quality I Site quality II
Age N/hectare s% Age N/hectare s%
4 890 350 5 890 3707 590 250 8 590 28-0
10 440 220 11 440 26-012 360 22-0 13 320 26-5
density and severity o f thinning. Three severities of thinning were tested in an unrestricted random lay-out with 4 replications. In experiment I, S% index-values o f 21, 27 and 32 and in experiment II index-values o f 26, 29 and 34 were tested. In the analysis o f variance, S % and error were identifiable sources o f variation. A subsequent regression analysis, however, indicated that basal area level during the growth period was m ore suitable to predict the rate o f volume growth. It reduced the standard error o f the estimated growth rate significantly. Basal area level and S% of the remaining stand are obviously interrelated but the relationship is o f a stochastic nature, primarily because S % as an
index of stand density does not account for differences between diameter distributions. If S % is replaced by basal area, the factor level does not represent a discrete variable. In consequence the effect of thinning can not be assessed by a norm al analysis of variance. F or this reason a regression analysis was carried out with basal area level instead of S% as explanatory variable to assess the effect o f stand density on growth.
The relationship between periodic current volume and basal area level, during a response period of 6 years, shown in F ig 6.1, was:
Experiment I : = Y - 39-266+61 '0504 log x . . . (1) Experiment I I : = Y - 4 7389 + 27’9248 log x . . . (2)

A SP E C TS OF TH IN N IN G 65
BASAL AREA LEVEL (m 2/h e c ta re )
BASAL AREA LEVEL (m 2 /h e c ta re )
Figure 6.1 Relationship between basal area level and volume growth In Redclyffe 2 and 1.

66 FO RESTR Y C O M M ISSIO N B U LL E TIN No. 55
The statistical analysis revealed a significant, curvilinear increase in the rate o f volume growth with increasing stand density. The standard errors of the regression coefficients were 0971 and 0 -890 respectively. This indicates a significant difference between the rates o f volume growth per unit increase basal area level. In experiment I, the periodic current increment was 34-2 m 3/hectare/annum for a basal area level of 16 m 2 per hectare and 47-1 m3 for a basal area level o f 26 m 2 per hectare. In experiment II the relevant growth estimates were 28-9 and 34-8 m 2 per hectare per annum respectively.
In experiment I, the rate of diameter growth was curvilinearly related to basal area level. It was 2'68 cm per annum for a basal area level o f 16 m2 per hectare and 1-57 cm for a basal area level of 26 m2 per hectare. In experiment II there was no statistically significant departure from linearity. The rate of diameter growth was 1*98 cm for a basal area level of 16 m 2 per hectare and 1'15 cm for a basal area level of 26 m 2 per hectare.
F or a study of the growth distribution within stands, during a 5-year growth period, the volume of the individual tree was regressed on DBH. The regressions were calculated for the lightest degree of thinning in experiment II, for the beginning and end of the growth period separately.Beginning of period: V1= b 0(DBH1)br End of period: Vj = c0(DBH 2)ci Furtherm ore D BH 2 was regressed on D B H j:
DBH j= aQ+ aJ^BHx+ ajDBHi2
iv= c 0(a0+ a 1D B H 1+ a 2D B H 12)''i—^ ( D B H ^ - P ) The result is given in Table 6.3.
T able 6 .3
V olume G row th in R elation to DBH
DBHi(cm)
iv(dm’/annum/tree)
iv(in % of average)
15 35.5 19.117 43.1 17.919 52.7 17.221 64.6 16.823 79.4 16.6
25 97.5 16.627 119.5 16.729 146.2 17.031 178.0 17.3
The rate o f volume growth increases steeply and curvilinearly with increasing DBH. The volume growth percentage is also related to DBH but reaches a minimum for D B H = 2 4 cm.
The relationship between value increment per unit area and basal area level reveals a trend, which
is similar to that o f volume growth. Due to a lower value of standing tim ber in the more heavily thinned plots, the indicating per cent, for a 5-year growth period, was negatively related to basal area and decreased from 20% for a basal area level o f 20 m 2 per hectare to 18% for a basal area level o f 25 m 2.
The thinning experiments revealed the necessity o f a revision of planting espacement and thinning (Tingle and van Laar 1970). Planting espacement has been increased from 2*70x 2*70 to 4 x 4 m . A first, commercial thinning will be carried out at 7 years in site class I and at 8 in site class II plantations, bringing the remaining stand to an S% of 32-33. It is recommended that the second and last thinning be carried out at 10 years in site class I and a t 13 years in site class II plantations, again to an S % index of approximately 32 % and a stem num ber o f 220 per hectare.
3.2 Thinning Research in Pinus radiata When sawtimber is grown in plantations of P. radiata, P. patula and other fast-growing pines, live-pruning is imperative to prevent the form ation o f excessive knots. M any studies reveal the effect of pruning on diameter and height growth, but few studies have been conducted to evaluate, quantitatively, its interaction with thinning.
In 1963 a combined thinning-pruning experiment was laid out in a 10-year old P. radiata plantation in the S.W. Cape Province (Van Laar 1973). The experimental plan was a split-plot design with stand density applied at three factor levels to whole- plots and severity o f pruning assigned to sub-plots, also at three factor levels. There were 4 replications in an unrestricted random lay-out o f treatm ent combinations. Stand density was expressed by S% of the stand after thinning, severity o f pruning by % branch-free length of the tree after pruning. Stand densities with S % = 30 , 40 and 50 and severities o f pruning corresponding with branch-free lengths o f 50%, 65% and 80% respectively were tested. This produced 9 treatm ent combinations and a total o f 36 sub-plots. Ignoring severity of pruning as a predictor-variable, the relationship between stem num ber after thinning and rate of volume growth during the 8-year period after the establishment o f the experiment w as:
Y = 8-411+0-05997 X—0-0000333 X 2 ................ (4)where X = stem num ber per hectare
Y = ra te o f volume growth in m3 per annumThe relationship is shown in Fig 6.2.The analysis of variance indicated that the linear
and quadratic components o f the regression sum o f squares were highly significant.
The influence o f both thinning and pruning on growth was re-assessed by a regression analysis

A SP E C TS O F TH INN IN G 67
20
10
0
30
300 600 900 1200
n /h a
Figure 6.2 Relationship between stems per hectare and rate of volume growth.
with basal area level ( XJ , severity o f pruning (X2), X x2, X22, X ^ X x2X2, X xX 22 and X x2X22 as predictor-variables. It disclosed the existence of a curvilinear increase o f basal area growth with increasing basal area level, a curvilinear decrease o f basal area growth with increasing severity of pruning and significant interactions pruning x thinning. Similar results were obtained for volume growth. The relevant regression equations for volume growth were:First year after pruning and thinning:
Y = 7-3170+0T 190 Xx2— 1-2753 X2—0-00334Xx2X2 .................................................................. (5)
Seven-year period thereafter:Y = 1-313 + 1-2753 Xx—0-00232 Xx2X22 . . . (6)
with Xx=average basal area during growth period
X 2=severity o f pruning Y = ra te o f volume of growth in m 3/
hectare/annum There was no statistical evidence of a relationship
between stand density and rate of height growth or taper, but the rate o f height growth during the 7-year response period was severely depressed by pruning, whereas the stems showed a tendency towards a cylindrical form.
In 1964 a thinning experiment was established in a 10-year old, site quality I stand of Pinus radiata on the slopes of Table M ountain. In each of three replicates one plot was left unthinned, a second and third plot were thinned. The mean S % after thinning, in this case defined as the mean distance between the trees expressed as a percentage of the regression height o f the 20% thickest trees, was:
A-degree: S % = 18 '2 B-degree: S % = 2 3 -5 C-degree: S % = 3 1 ‘5
The following rates of volume growth have been recorded:
Series Degree Volume growth in m3jhectare j annum1964- 1968- 1970-1968 1970 1974
5 A 28-9 32-3 260B 32-5 30-1 28-7C 17-0 20-6 27-4
6 A 35-2 23-9 31-1B 36-5 28-7 28-3C 25-7 26-3 24-9
7 A 41-5 330 19-4B 45-3 35-1 38-8C 28-9 23-7 26-4
A statistical analysis disclosed highly significant differences between severities of thinning. Differences associated with blocks, periods and the interaction periods x thinning were non-significant. The average periodic current volume increment during the 10- year period 1964-1974 was:
A-degree: iv= 30*3 m 3/hectare/annum B-degree: iv= 34-3 m 3/hectare/annum C-degree: iv= 2 4 '7 m 3/hectare/annum The experimental data indicate, but do not present
convincing statistical evidence, that the rate of volume growth o f unthinned stands is below that of stands exposed to the B-degree of thinning.
The diameter distribution was studied by fitting the beta-distribution:
f (x )= c (x—a)a • (b—\ ) r ....................................... (7)to the plot data in 1964, 1968, 1970, 1971 and 1974 o f series 5. Table 6.4 gives the characteristics o f the distributions. (See also Fig. 6.3).
Volume growth o f the individual tree, between

68 F O R E S T R Y C O M M ISSIO N B U L L E T IN No. 55
1964 and 1974 was regressed on D B H 1064. In series 5 the relationship was curvilinear in the A -plot and linear in the B- and C-plots (see Fig. 6.4). The relevant regression equations were:
A-degree: log Y = —2-832+2-79277 log X . . . (8)B-degree: Y = —5-941+0-70755 X (9)C-degree: Y = — 3-672+0-56680 X (10)
T a b le 6.4 V a l u e o f a, b , a a n d y
a b a y
A-degree1964 7-5 20-5 1-93 2-571968 7-5 27-5 2-39 2-211970 7-5 30-5 3-43 6-031971 7-5 32-5 3-43 6-031974 7-5 35-5 3-11 5-55
B-degree1964 11-5 21-5 2-08 2-841968 16-5 28-5 1-62 1-261970 17-5 31-5 1-48 0-821971 18-5 33-5 1-40 0-701974 20-5 36-5 1-21 0-64
C-degree1964 10-5 20-5 1-42 1-691968 15-5 ITS 0-66 0-741970 16-5 31-5 0-99 0-791971 19-5 33-5 0-66 0-691974 20-5 37-5 1-28 0-99
The differences between slopes and intercepts of B- and C-plots were non-significant. F or the same
initial D BH however, the growth rate in the B- and C-plots was significantly greater than that observed in A-plots. The periodic current volume growth of the individual tree was also expressed as a % of the stem volume at the m idpoint o f the 10-year growth period and subsequently regressed on D BH in 1964. The regression was non-significant in 5 plots, in2 plots it was significant with a positive and in3 plots significant with a negative value of the regression coefficient.
The relationship between crown size, degree of thinning and growth rate o f individual trees as well as the relationship between needle-biomass and growth rate, and the effect of com petition on growth was investigated in series 5, 6 and 7 at Tokai. The crown diameter, crown length and tree height o f all trees were measured as well as the distance between the study trees and 7, 8 o r 9 adjacent ones. Multiphase sampling was used to estimate the needle- biomass o f 12 trees, distributed over thinning treatm ents A, B and C.
Crown diameter and crown length decreased linearly with increasing stand density. The relevant equations were:
m ean crown width (m )=4T 919—0-0017 (stemsper h e c ta re ) ........................................................ (11)
mean crown length (m )=21'410—0-0081 (stems per h e c ta re ) .........................................................(12)
crown length . , , , , ,T h e ------------r-rr- ratio was also related to stand
crown widthdensity. I t had a value o f 5.12 for 200 stems per hectare and 5.45 for 1400 stems per hectare.
8
2
8 10 12 14 16 18 20 22
DBH (cm)
Figure 6.4 Relationship between breast height diameter (DBH) and rate of volume growth of single trees. It (dm3)=> volume increment in cubic decimetres.

A SP E C TS OF TH IN N IN G 69
10 14 10 22 26 30 34DBH (cm.)
DBH (cm.)
D BH (cm.)
Figure 6.3 Beta-function fitted to diameter distributions of A (top), B (centre) and C (bottom) degrees of thinning.

70 F O R E ST R Y C O M M ISSIO N B U LLE TIN No. 55
F o r each tree in all A-, B- and C-plots the volume growth over the 7-year period 1964-1971 was determined and subsequently related to the area of the horizontal crown projection in 1971. The relationship could be satisfactorily expressed by a second-degree equation. An analysis o f covariance did not disclose heterogeneity am ongst slopes, but growth-means, adjusted to a com mon value of the area crown projection, differed highly significantly. The relevant equations w ere:
A-degree: Y = 7 2 0 7 + 4 4 ‘6808 X— 1-2496 X2
B-degree: Y = 113-30+44-6808 X— 1 2496 X 2(13)
C-degree: Y = 169-57+44-6808 X— 1-2496 X 2.(14)
(15)F or trees o f a given crown area, the growth rate
o f single trees in heavily thinned stands is greater than that in lightly thinned stands, possibly because of reduced roo t competition.
Needle-biomass studies revealed the effect o f stand density on certain relationships. F o r secondary branches of a given diameter, needle biomass in C-plots was greater than in A-plots. F o r a branch diameter of 0-5 cm the difference was 16%. The relationship between volume growth - derived from stem analyses - and needle-biomass disclosed the effect of thinning on growth rate per unit needle weight. In the A-, B- and C-plots it was 2’70, 2-92 and 3T6 dm 3 per kg needles respectively.
In order to assess the effect o f com petition within stands, the trees surrounding a study tree were arranged according to the ratio:
_ D B H of adjacent tree distance from study tree
from small to large values of Q.The 1-tree sample plot, i.e. the plot with n = l , contained the tree with the largest value o f Q, the study tree itself not being included. I t represents a basal area per hectare:
B A - A L4D X2
where d4= DBH, and D j=distance.The com petition index Cl, was defined as
d i!4D 42
F o r n = 2 , the basal area per hectare is
Clr- BA1= ^ a
B A ,=d a+ d 2
1 r-4- and CL is defined a s :
'-'12 2‘■ < '+ § 0
In general: C I„=
dl* (i5?+ § 7 + - • 1) +da2( s ? + S7+ ' ' 0 +dn24nDn2
In the A-plots, CIn was calculated for n= 1 . . . 9, in the B-plots for n = l . . . 8 and in the C-plots for n= 1 . . . 1. These indices were subsequently related to volume growth, tree height being introduced as a second explanatory variable, but primarily serving as a concom itant variable. The sum of squares, associated with the partial regression of volume growth on C l was expressed as a percentage of the total sum of squares of dependent variable, but after fitting tree height. The relevant regression sum of squares were:n = 1 2 3 4 5 6 7 8 9
SS regression in % of total, after fitting tree height
A-degree 9-4 9 8 10 8 13-3 14-3 15 6 16-9 184 19*8 B-degree 6-4 12 0 12 8 12-5 11 0 9 6 10 0 10 0 - C-degree 5-1 6 1 5*1 5-0 3 9 3-2 3 2 - -
In the A-plots the regression sum of squares increases from n = 1 to n = 9 . This seems to indicate that the first adjacent 9 trees compete with a study tree, but it remains undisclosed whether the 9th tree makes a significant contribution towards this regression. In the B-plots, the regression sum of squares decreases beyond n = 3 and in the C-plots beyond n = 2 . A general trend is also apparent that CIn contributes less to the regression of growth on competition index, as stands are more heavily thinned.
An analysis o f covariance with volume growth as dependent variable, C I4 and tree height as explanatory variables did no t disclose heterogeneity amongst slopes, but highly significant differences amongst levels. The relevant regression equations are:
A-degree: iv= —309-23 + 26-128 (H)—2-575 (CI4) (16)
B-degree: iv= — 182-724+26-128 (H)—2-575 (CI4) .................................................................... (17)
C-degree: iv= — 73-012 + 26-128 (H)—2-575 (CI4) (18)
F or a given value of CI4 and for a given tree height, the rate o f volume growth in heavily thinned sample plots exceeds those in m ore lightly thinned plots significantly. This indicates that the index of competition satisfactorily explains the observed growth differentiation within stands, associated with competition, but does not account for all factors which define competition.

A SP E C TS OF TH INN IN G 71
LITER ATU RE
C r a ib , I. J. (1939). Thinning, pruning and management studies on the m ain exotic conifers in South Africa. Dep. o f Agr. and For., Bull. 196.
C r a ib , I. J. (1947). The silviculture of exotic conifers in South Africa. Fifth Brit. Emp. For. C onf, London 1947.
C r o w e , N. B. (1965). Growth, yield and economics o f Pinus patula in the N atal Midlands. D.Sc. thesis, Stellenbosch.
G r u t , M. (1970). Pinus radiata; Growth and Economics. Cape Town 1970.
Jo u b e r t , A. F. (1964). An analysis o f the relative profitability o f various thinning degrees in stands of Pinus patula in the Eastern Transvaal. M .Sc. thesis. Stellenbosch.
M a r s h , E. K. (1957). Some preliminary results from O’Connors Correlated Curve Trend (C.C.T.) experiments on thinning and pruning and their practical significance. Comm. For. Conf. Austr. and N. Zealand 1957.
P ie n a a r , L. V. (1965). Quantitative Theory on Forest Growth. Thesis, University o f Washington.
R e in st o r f , L. O. (1970). The influence o f Stand Density on G row th o f Pinus elliottii. M .Sc. thesis, Stellenbosch.
T in g l e , A. C. (1966). Silviculture, volume and yield o f Populus deltoides. Ann. o f Univ. o f Stell. Vol. 41, Series A, N o. 10.
T in g l e , A. C. and V a n L a a r , A. (1972). The Economics of Thinnings in Poplar Plantations Comm. No. 31/1972, Faculty o f Forestry, Stellenbosch.
T in g l e , A. C. and V a n L a a r , A. (1970). The Silviculture of Populus deltoides in South Africa.
V a n L a a r , A. (1970). Vorlaufige Ergebnisse eines Pappel- Durchforstungs-Versuches in Sudafrika. Forstw. Centrallblatt 89:141-152.
V a n L a a r , A. (1973). Needle-biomass, Grow th and G row th D istribution o f Pinus radiata in South Africa in Relation to Pruning and Thinning. Forschungsbericht N o. 9/1973, Forstl. Forschung- sant. Munchen.
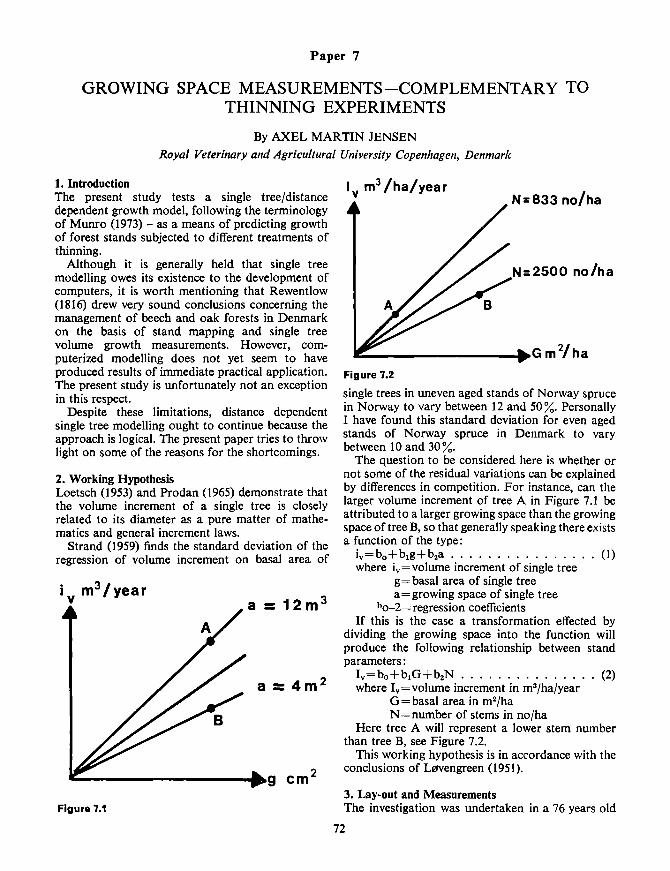
P aper 7
GROWING SPACE MEASUREMENTS-COMPLEMENTARY TO THINNING EXPERIMENTS
By A X EL M A RTIN JEN SEN Royal Veterinary and Agricultural University Copenhagen, Denmark
1. IntroductionThe present study tests a single tree/distance dependent growth model, following the terminology of M unro (1973) - as a means o f predicting growth o f forest stands subjected to different treatm ents of thinning.
Although it is generally held that single tree modelling owes its existence to the development of computers, it is w orth mentioning that Rewentlow (1816) drew very sound conclusions concerning the management o f beech and oak forests in D enm ark on the basis o f stand mapping and single tree volume growth measurements. However, computerized modelling does not yet seem to have produced results o f immediate practical application. The present study is unfortunately not an exception in this respect.
Despite these limitations, distance dependent single tree modelling ought to continue because the approach is logical. The present paper tries to throw light on some of the reasons for the shortcomings.
2. Working HypothesisLoetsch (1953) and Prodan (1965) dem onstrate that the volume increment of a single tree is closely related to its diameter as a pure m atter of m athematics and general increment laws.
Strand (1959) finds the standard deviation of the regression of volume increment on basal area of
single trees in uneven aged stands of Norway spruce in Norway to vary between 12 and 50%. Personally I have found this standard deviation for even aged stands o f Norway spruce in D enm ark to vary between 10 and 30%.
The question to be considered here is whether or not some of the residual variations can be explained by differences in competition. F o r instance, can the larger volume increment o f tree A in Figure 7.1 be attributed to a larger growing space than the growing space of tree B, so that generally speaking there exists a function of the type:
iv= b 0+ b 1g + b 2a ..................................................... (1)where iv=volum e increment o f single tree
g= basa l area of single tree a= grow ing space of single tree
bo-2=regression coefficients If this is the case a transform ation effected by
dividing the growing space into the function will produce the following relationship between stand parameters:
Iv= b0+ b iG + b2N ..................................................(2)where Iv= volum e increment in m 3/ha/year
G = b asa l area in m2/ha N = n u m b er of stems in no/ha
Here tree A will represent a lower stem number than tree B, see Figure 7.2.
This working hypothesis is in accordance with the conclusions of Lovengreen (1951).
3. Lay-out and MeasurementsThe investigation was undertaken in a 76 years old
72

ASP E C TS O F TH INN IN G 73
even-aged stand o f Norway spruce, situated on a sim ilar locality 1 ■ 5 km away from the thinning experiment in Gludsted Plantation, described by Bryndum (1969). The stand had the following param eters:
Age 76 yearsStem number, N 1200 no/haHeight, H g- 15-4 mDiameter, D 17-7 cmBasal area, G 29-3 m 2/haStem volume, V 248 m 3/haSite class 5-3 CM M
It corresponds well with the thinning grades B in the thinning experiment, but has a slightly better site class. However, a com parison of the results from the single tree measurements with the sample plot data from the thinning experiment should be possible.
The area chosen was divided into 10 equal parts o f 100 trees each. In each part a perm anent sample plot was established, which was m easured for the first time in the autum n o f 1967 and for the second time in the autum n o f 1973.
The following measurements were undertaken on each p lo t:
1967 1973—dj.j with precision tape, one measur
ing mark. E rror 0-2% , Jensen (1967) X X
— dx . 3 on 25 sample trees with precision tape, but with two measuring marks. E rror 0-12 mm, Jensen (1967)
X—h on the 25 sample trees with JAL.
E rro r about 1 % X
—do.jh on the 25 sample trees with precision tape. X X
—fQ.lh the true stem wood form factor,by felling 6 of the 25 sample trees X
—x- and y-coordinates o f the 25 sample trees and their neighbours X
The volume increment o f the sample trees was calculated making the following assumptions:
1. That fQ.lh within each plot did not vary with the stem dimensions, Prodan (1965).
2. That if0.!h the increment in true form factor, in a mature stand of Norway spruce is insignificant and can be put equal to zero, Jensen (1971).
4. The Growing Space MeasurementThe model used in this investigation is similar to
that of Jack (1967) and Schulz (1968) and takes, as in the model o f Schulz, the diameter o f the tree and its neighbours into account. Only in the present programme the growing space has been calculated assuming com petition proportional to different powers o f the diameters in the following manner:
e =1- ( - H - )Cl '* \d sc+ d i0/ (3)
1 ;= distance of i’th neighbour e;=distance o f bisector on the joining line from
the sample tree to the i’th neighbour ds= d iam eter o f sample tree d ;= diam eter o f i’th neighbour
See Figure 7.4.The growing space has been calculated under the
following hypothesis:c= 0-0 , 0 - 5 ,1 0 ,1 -5 ..................................................5 0In Figure 7.3 and 7.4 the growing space is demon
strated for 3 test trees with com petition respectively c = 0 -0 and c = 2 -0 . U nder the last assum ption it will be seen on Figure 7.4 that tree B and C exert com petition on A even if they are no t immediate neighbours. By raising the power in the competition equation (3) the whole neighbourhood of the sample tree is taken into account, and not only the surrounding trees.
The growing space giving the biggest reduction in mean square in the equation (1) is defined as the best measure.
5. ResultsThe function used in the regression analyses is the simple linear model, equation (1), logarithmic transform ation gave in all cases bigger m ean squares.
F or the material as a whole, significant influence of the growing space was found only when using the com petition factor c = 5 -0 :
iv= b0+ b 1g s= 2 4 -6 %iv= b 0+ b 1g + b 2a s= 2 4 -4 %
Even if the influence of the growing space is significant, F 1/241= 4-48 , one must adm it that it is o f no importance as a means o f predicting tree growth besides the diameter.
The growing space, taking the diameters o f the neighbouring trees into account, embraces a small bias. The figures for the material as a whole are as follows:
c = 0-0 1-0 1-5 2-0 2-5Bias % + 0 -0 + 2 -6 + 3 -4 + 3 -9 + 4 -0
c = 3 0 3-5 4-0 4-5 5-0Bias % + 3-8 + 3 -0 + 1 -9 + 0 -6 -0 -6

74 F O R E S T R Y C O M M ISSIO N B U LL E TIN No. 55
d*18
4 4
42
36
3 2 .
30-
d a 18
Bd . 20
d -1 7
0 2 4 6 B 10 12 1 4 m
Figure 7.3 Growing space with equal competition between neighbours.
34
d a i s
d » 1 6
d - 1 7
d a 19
10 12 14 m
Figure 7.4 Growing space with competition proportional with the square of the diameter.

ASP E C TS OF TH INN IN G 75
S%
X
*
v = b0 + b,gv = b0 + b,g + b2a
iy — bg + b]G + b2N
a or N not significant a or N significant at 0.05 level ■■ ■ ■■ •• 0 .0 1 ••
4 0
30
20
10
0
Sample plot No 2
S%
40
30
20
1 0
0
S%
Sample plot No 10
Figure 7.5 Standard deviation, significance and bias in relation to power of competition for 25 single trees on 3 selective sample plots.

76 F O R E ST R Y C O M M ISSIO N B U LL E TIN No. 55
In respect o f bias it seems that the growing space measures can be used to reflect stand param eters.
Analysis o f variance shows, however, that the m aterial is heterogeneous. Accordingly each sample plot has been considered separately. Regression analysis o f each sample p lo t reveals a significant correlation with the growing space in 3 sample plots whereas in the 7 others the growing space does not seem to have any influence. The results for the three significant plots are represented in Figure 7.5.
If the data are divided by the growing space and equation (2):
Iv = b 0+ b 1G + n2N ................................................. (2)is used in the regression analysis, one gets rather confusing results especially for high powers of competition. This means of analysis has therefore been abandoned.
Figure 7.6 shows the fit o f the function (1) to the data o f sample plot 2 using the com petition factor: c = 2 . In Figure 7.7 this regression equation is transform ed into stand param eters by dividing by the growing space, dem onstrating the relationship between volume increment, basal area and stem num ber o f the stand.
In Figure 7.8 the results from the single tree measurements are com pared with the increment figures from the thinning experiment described by Bryndum (1969), by entering the sample plot basal
I y dm3/ i r
Figure 7.6 Sample plot 2. Volume Increment plotted against diameter for single trees. Ivdmar/ar ■= annual volume increment in cubic decimetres. dt-3 = dlameter In centimetres, measured at breast height.
I y m 3/ha /yea r
Figure 7.7 The regression equation from Figure 7.6 converted into stand parameters.
areas and stem numbers from the thinning experim ent in the regression equations from the three significant sample plots, and consequently calculating the m ean for each thinning grade.
Taking into consideration that it is a mature stand of Norway spruce, and that the single tree measurements refer to a stage 10 years older, the correspondence between the thinning experiment and the results from the 75 single tree measurements is quite impressive.
In Figure 7.9 a possible use of the single-tree approach to spacing is finally dem onstrated. In the D 3 grade a D-B thinning is simulated by leaving the plots untouched from 1951 and onwards. It is thus the stem number in 1951 and the basal area in 1951 plus 20 years’ increment which is entered into the regression equations. It appears that this treatment 20 years later gives the highest current increment o f all plots.
Single tree measurements may in this way complete established thinning experiments by indicating a possible result o f treatm ent not included in the original lay-out.
6. DiscussionThe crucial problem is that in only 3 sample plots out o f 10 the measures of inter-tree competition contribute significantly to a better prediction of tree growth than the mere use of tree diameters. This is

A SP E C TS OF TH INN IN G 77
Results of thinning experiment, 1957-63, Bryndum (1969).Results of growing space measurements on 75 single trees, 1967-73.
m3/h a / year
10
Figure 7.8: Single tree measurements for all three significant plots, 75 trees in all, compared with sample plots results from thinning experiment.
not exceptional in com petition studies, Adlard (1973). The following discussion aims at clarifying some of the reasons.
Stem rotAbout half o f the trees are attacked by stem ro t in varying degree. An analysis o f the 60 trees felled for the form factor measurements revealed no correlation between the degree of attack and the volume increment. This is in accordance with the findings of Henriksen (1952).
Errors o f measurements There are two possibilities:a. The growing space measurement Used is inadequate as a measure o f competition.Newnham (1972) discusses different growing space measurements and suggests that in a humid fertile region it is the crown competition which is important, com petition is consequently only exerted by the immediate neighbours, whereas in dry regions with poor soils it is a question of root competition, where an individual tree can have up to 30 competitors. The growing space model used makes room for both situations. The better performance of growing space with high competition power of c, see Figure 7.5, indicates that the latter is the case on the locality in question. In accordance with the results o f Hamilton (1969) it is believed that refinement o f the growing space model is not the most important problem.
b. The volume increment o f the individual tree is
Figure 7.9: Single tree measurements for all three significant plots only simulating a D-B thinning initiated on the Da plots in 1951.
determined with an error, which overshadows the effect o f the growing space.As pointed out by Mitchell (1972) the relation between growing space and the individual tree is a m atter o f physiology. Therefore stem volume increment might be an inadequate measure, dry m atter production would be better, bio-mass the best. With this reservation the error of measurement o f the volume increment o f the individual tree will be subjected to an estimation.
A regression analysis on the whole m aterial: iy — bo -j- bp'g
reveals that the basal area increment counts for 86-4% of the variation in volume increment among individual trees. Errors in the other components can therefore be more or less disregarded and approximately assessed to 50%.
The volume increment is determined in two ways, one on the basis o f the d ^ measurements, the other one on the basis of the do-ih
A regression analysis of: ivO-hi = b o + b i i v i - 3
gives a standard deviation of 14-5%. As this standard deviation is composed of the error on both estimates, the error o f ivi.3 which is used in the analysis may have the following proportion:
V 102+ (0 - 136x 50)2= 12%Therefore a defective measurement of the volume
increment o f the individual tree is probably not the reason for lack of significance.

78 F O R E S T R Y C O M M ISSIO N B U LL E TIN No. 55
Variation in Site Factors and Genetic Variation.The very reason for introducing the basal area as first variable in the stepwise regression analyses has been to get hold o f the genetic variation, variation in micro site as well as past history of the tree in the stand. The result o f the regression analyses may indicate that these factors are by far the most
im portant in determining the current volume increm ent o f a single tree rather than the actual growing space.
On the other hand it suggests that if site factors could be kept constant, one may have a significant influence o f the actual growing space. This is believed to be the case on the three significant plots.

ASP E C TS OF TH INN IN G 79
REFERENCES
A d l a r d , P. G. (1973). Development o f an empirical competition model fo r individual trees within a stand. IU FR O , Proceedings o f Meetings 1973, W orking Party S4.01-4. D epartm ent of Forest Yield Research, Research N otes nr. 30. 1974. Royal College of Forestry. Stockholm. Pg. 22-37.
B r y n d u m , H. (1969). A thinning experiment in Norway Spruce in Gludsted Plantation. Det Forstl. Forsogsv. Damn. Bd. XXXII, hf. 1. Koben- havn, pg. 5-187.
H a m i l t o n , G. J. (1969). The Dependence o f Volume Increment o f Individual Trees on Dominance, Crown Dimensions, and Com petition. Forestry, Vol. 42, no. 2. Oxford, pg. 133-144.
H e n r ik s e n , H . A. and J o r g e n s e n , E r i k , (1954). Fomes annosus A ttack In Relation To Grade Of Thinning. An Investigation On The Basis Of Experiments. Det Forstl. Forsogsv. Danmark, Bd. XXI, pg. 215-252.
H e n r ik s e n , H. A. (1958). The Increment and Health Condition of Sitka Spruce in Denmark. Det Forstl. Forsogsv. Damn. Bd. XXIV, hf. 1. Koben- havn, pg. 1-372.
J a c k , W. H . (1967). Single Tree Sampling In Even- Aged Plantations fo r Survey And Experimentation. Papers XIV. IU FRO -KO N G RESS, VI, section 25, Miinchen, pg. 379^103.
J e n s e n , A. M. (1967). Eine Versuchsmessung mit Umfangmessband. Dansk Skovforen. Tidsskr. 52:167-188. Kobenhavn.
J e n s e n , A .M .(1971). Masse til vaekstmalingens metode og nojagtighed belyst pa grundlag a f stammean- alyser. Royal Veterinary A nd Agricultural U niversity. D epartm ent O f Forestry. Copenhagen, pg. 1-31.
L o e t s c h , F. (1953). Massenzuwachsermittlung durch Bohrspanproben unter Anwendung Mathema- tisch-statisticher Methoden. Zeitschrift F. Welt- forstwirtschaft 16-3.
L o v e n g r e e n , J. A. (1951). Thinning o f beech in D enm ark since 1900, illustrated statistically and assessed theoretically. D et Forstl. Forsogsv. Damn. Kobenhavn, pg. 271-354.
M it c h e l l , K. J. (1972). Suppression And Death. Proceedings: Tree Growth Simulation Workshop. Forest Management Institute, Ottawa, Ontario. Internal Report FM R-25 pg. 71-78.
N e w n h a m , R. M. (1972). Stand Models - Where Do We Go From Here? Proceedings: Tree Growth Simulation Workshop. Forest Management Institute, Ottawa, Ontario. Internal Report FM R-25, pg. 7-17.
R e v e n t l o w , C. D. F. (1816). A Treatise on Forestry.3. ed. published by the society of Forest History, Horsholm, Denmark, 1960. Pg. 1-142.
S c h u l z , B. (1968). Programm zur Berechnung des Standraumes in einschichtigen Bestanden (APAC). Allgem. Forst- u. Jagdz. 139. Jahrg. Frankfurt am Main I. Pg. 232-234.
S t r a n d , L. (1959). The accuracy of some methods for estimating volume and increment on sample plots. Det Norske Skogforsoksvesen nr. 52. Norge, pg. 283-392.
P r o d a n , M. (1965). Holzmesslehre. Sauerlanders Verlag. Frankfurt a.M.
M u n r o , D . D. (1973). Forest Growth Models - a Prognosis. IU FR O , Proceedings of Meetings 1973, W orking Party S4.01-4. Departm ent of Forest Yield Research, Research Notes. N r. 30, 1974. Royal College of Forestry. Stockholm. Pg. 7-21.

80 F O R E ST R Y C O M M ISSIO N B U LL E TIN No. 55
DISCUSSION
Bredberg: In equation (I) (iv= b 1g + b Ja) the variable ‘g’ (basal area of a single tree) must be in tu rn the result o f the growing space, variable ‘a ’,available to the tree in the past. Researchers working in Sweden on models like this have found that if you omit ‘g’, which is highly correlated with ‘a ’, you would find that the com petition variable was much more significant.
Jensen: F rom the practical viewpoint, if ‘g’ is as significant as ‘a ’, you don’t need to consider ‘a ’. My point is that ‘g’ is very easy to determine, but
including ‘a ’ adds to the overall significance.
Bredberg: In order to establish the effect o f ‘a ’, one m ust make radical changes in the growing space of individual trees by thinning. W ith light thinnings, as in this case, there is no such radical change.
Jensen: Y ou are suggesting that I should have chosen a heavily thinned stand?
Bredberg: I suggest that both lightly and heavily thinned stands should have been used.

A SP E C TS OF TH INN IN G 81
GENERAL DISCUSSION ON PAPERS 1-7 (FIRST SESSION)Bredberg: Today we have had a lot o f inform ation about research into yield aspects, but my main interest is in the logging operation of thinning. We have heard o f two alternatives, namely, selective thinning and geometric thinning. I think each of these is unrealistic. Selective thinning is not realistic because paths must be created for machine access. Geometric thinning is not very realistic for silvicultural reasons in many conditions. W hat is the proper compromise between selective and geometric thinnings? Experiments showing the difference between geometric and selective thinnings don’t really tell you the proper combination of the two.
Hamilton: I think I would go along with much of that. I would say that by experimenting with extreme treatm ents o f line thinning and selective thinning, you can expect to simulate the effects o f com binations of these treatm ents. I do not think it is necessary to put down specific experiments of specific combinations of all these. F o r one thing you are highly unlikely to experiment with treatments that you would choose at the end of the day. You would be very lucky in fact if you did. By straddling various alternatives and simulating various combinations of these you can get results which are sufficiently accurate for our needs.
Bredberg: Can you really simulate a treatment involving removal of rows but selective thinning between rows ?
Hamilton: Well, I am quite confident about doing this. Perhaps the answers will not be perfect but I think the results you get will be good enough for the kind o f decisions you will have to make.
Kramer: While most o f us are concerned with short periods in the lives o f forests we should be careful to consider the whole rotation, which means that we may pass from a phase o f geometric thinning to selective thinning. The losses we make in the first place will be for a short period of the rotation only. The whole rotation may give only a small loss or perhaps no loss at all. Secondly, we should be less concerned with the production of all trees but rather more concerned about the final crop trees and their production.
Rowan: I think the key word from the title of this Project G roup is ‘economics’ because it is perfectly clear that it is the economics of a particular country that is going to determine what in fact happens. In those countries which are suffering severe fibre
shortage I am quite sure we are going to need a rather different approach to yield studies. F or example, most o f the discussions today are centred on the stemwood but in may parts of the world we are looking at prospects o f using branches, tops, needles and other parts o f the tree besides the stem. So far this has not been a popular study with research people, not least because it is highly difficult to measure. Research along these lines probably has not been done because it was of very little practical value. I think this is no longer the case. We are already now wanting to know how much total fibre we can get and this is going to have an influence on our thinning regimes and other related topics such as the correct provenance of the various species. We have to get away from this fixation about the stem.
Young: I would like to disagree with you in that the total forest is not difficult to measure. I have been doing it for 15 years.
Fries: Perhaps by measuring branches, roots etc yield researchers will come to a better understanding o f thinning because it is rather stupid to try to explain their biological process by measuring just one part o f the plant.
W. Sutton: I cannot understand this obsession with total mass. The agriculturist isn’t worried about the top of the carrot. He is only interested in the part that really m atters, the root, and for us it is the main stem.
Rowan: W ith respect I disagree. He would certainly be interested in the tops if you could sell them and, in fact, he can sell them.
Fries: We have seen some figures today which show that systematic thinning like line thinning, instead o f selective thinning, leads to a loss. But this is not a very great loss. Should we not move over to line thinning, bear this loss and harvest much more cheaply? I doubt it.
van Laar: If it means we cannot improve our seed by selective thinning then this would be a bad policy. If we adopt line thinning exclusively we will lose a num ber of the best trees.
Kramer: Systematic thinning is the solution we must choose because of the fact that stands were established much too densely and this is the only way to improve the stands. Perhaps in future we will not need to do this as we will have given the trees enough room from the start, and we could then go direct to selective thinning.

P aper 8
DER EINFLUSS VERSCHIEDENER DURCHFORSTUNGSARTEN AUF WACHSTUM UND BESTANDESSCHADEN
UNTERSUCHUNGSERGEBNISSE AUS FICHTENBESTANDEN IN DER BUNDESREPUBLIK DEUTSCHLAND
Von H. K R A M ER
1. GrundsatzlichesAls materielles Ziel der Fichtenwirtschaft (Picea abies) in M itteleuropa wird heute i.a. der hochste W aldreinertrag angestrebt. Dieses Ziel beinhaltet eine gute Zuwachs- und Wertleistung, sowie eine hohe Resistenz des Bestandes gegen Schaden. Zu diesem Zweck sollen die Bestande relativ weitstandig begrundet (etwa 3000 Pflanzen je ha), in der Jugend stark und im spateren Alter nur noch schwach durchforstet werden.
G ro Bere Probleme bestehen bei der Bestandespflege der friiher eng begriindeten (mit 4500 bis 10000 Pflanzen je ha) Fichtenjungbestande. Je dichter die K ultur gepflanzt war und je groBer die standorts- bedingten Gefahren, wie Schnee und Wind sind, um so fruher mu B aus waldbaulichen G riinden eine Stammzahlverminderung erfolgen. Aus wirtschaft- lichen G runden ist m an bemiiht, insbesondere diese ersten Stammzahlverminderungen durch Lauterung oder Durchforstung zu mechanisieren. Durch schematische Eingriffe, wie Reihen- und Gassenhieb, kann der Einsatz von Maschinen sehr gefordert werden.
In 12 bis 20-jahrigen Fichtendickungen mit Bestandesmiltelhohen zwischen 2 und 6 m wurde die Stammzahl durch Entnahme jeder 2., 3. oder 4. Reihe reduziert. Diese friihzeitigen Eingriffe forder- ten den Zuwachs (9, 16) und insbesondere die Resistenz des Bestandes gegen Schnee- und Wind- schaden ganz erheblich.
Bei der ersten Durchforstung wird an Stelle der fruher allgemein iiblichen Niederdurchforstung eine Auslese-, eine Reihen- oder Gassendurchforstung bzw. K om binationen dieser Durchforstungsarten ver- wendet. Bei der Auslesedurchforstung werden eine bestimmte Anzahl herrschender Baume (300 bis 600 Baume je ha) durch Entnahm e anderer herrschender Baume intensiv gefordert (1, 13, 16). Diese Durch- forstungsart ist betriebswirtschaftlich und waldbau- lich giinstiger als die Niederdurchforstung. Eine starkere Mechanisierung ist jedoch nur bei Reihendurchforstung (11) und Gassendurchforstung mog- lich (14). Die Reihendurchforstung, bei der wir i.a. jede 4. Reihe schlagen, eignet sich fur die “ Langholz-
m ethode” ; hierbei werden die Baume in langer Form durch Pferd oder Seil geriickt. Bei der Gassendurchforstung werden mehrere nebeneinanderlie- gende Reihen oder schrag zur Pflanzrichtung laufende Streifen gehauen. Diese etwas breiteren Streifen dienen als Riicke- und Arbeitsgassen. Die Gassendurchforstung kann mit einer gleichzeitig durchgefiihrten individuellen Auslesedurchforstung kom biniert werden. Sie wird v.a. bei der “ Kurzholz- m ethode” angewendet.
Diese sehr schematischen Eingriffe und hiermit verbundenen stark mechanisierten Durchforstungs- systeme rufen viele biologische Probleme hervor. Im folgenden soli insbesondere auf den EinfluB verschiedener Durchforstungsmethoden auf den Massen- und Wertzuwachs sowie au f Bestandes- schaden eingegangen werden.
2. Massen und Wertzuwachs2.1 AllgemeinesZur Priifung des Massen- und Wertzuwachses bei verschiedenartiger D urchforstung wurden in Fichten- jungbestanden der Bundesrepublik Deutschland einige Versuche angelegt, bei denen schematische Eingriffe m it individueller D urchforstung verglichen wurden.
Bei der bisher iiblichen Aufarbeitung mit Ein- m annmotorsagen haben Auslesedurchforstung und schematischer Reihen- oder Gassenhieb viele be- triebswirtschaftliche Vorteile gegeniiber der N iederdurchforstung. D a bei den beiden erstgenannten Durchforstungen die Dimensionen deutlich starker sind als bei der Niederdurchforstung, sind hier die Arbeitsleistung und der Verdienst der W aldarbeiter groBer, die W erbungskosten geringer. Brutto- und Nettoerlos fiir das eingeschlagene H olz sind bei diesen D urchforstungsarten wesentlich hoher als bei der Niederdurchforstung.
Bei der geometrischen D urchforstung (Reihen- und Gassenhieb) ist der Arbeitsfortschritt wegen geringerer Laufwege zusatzlich groBer; auflerdem sind hierbei Riickekosten und Verwaltungskosten niedriger als bei einer individuellen Durchforstung (17).
82
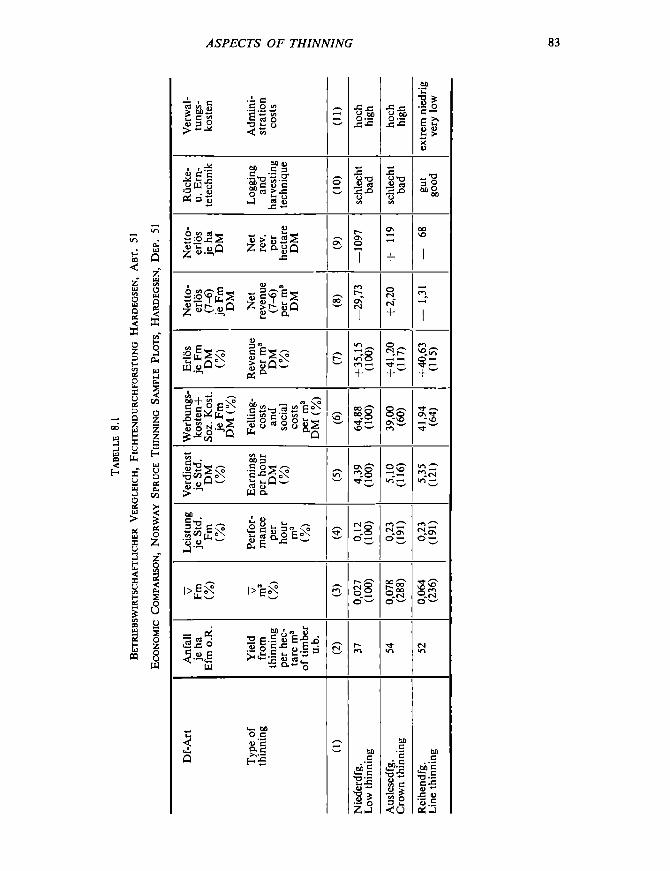
Be
tr
ieb
swir
tsc
ha
ft
lic
he
r
Ve
rg
le
ich
, F
ich
te
nd
ur
ch
fo
rst
un
g
Ha
rd
eg
se
n,
Ab
t.
51
A SP E C TS O F TH IN N IN G 83
Qz
Q(C<XHoJOh
s</Io222EEHUJu3
><*aso22o2cusouyso2ouW
Ver
wal
-tu
ngs-
kost
en
Adm
ini
stra
tion
cost
s
hoch
high
hoch
high
extre
m ni
edrig
ve
ry lo
w
Ruc
ke-
u. E
rn
tete
chni
k
Logg
ing
and
harv
estin
gte
chni
que
©
schl
echt
bad
schl
echt
bad
gut
good
Net
to-
erlo
s je
ha
DM
Net
rev. per
hect
are
DM
—10
97
+ 11
9
— 68
Net
to-
erlo
s (7
-6)
je Fm
D
M
Net
re
venu
e (7
-6)
per
ms
DM 00
N—✓
—29
,73
+ 2,
20
1
Erlo
s je
Fm
DM
(%)
Rev
enue
pe
r m
3 D
M
(%)
+ 35
,15
(100
)
+41,
20(1
17)
+40,
63(1
15)
Wer
bung
s-
kost
en+
Soz.
Kos
t.je
Fm
DM
(%)
Felli
ng-
cost
s an
d so
cial
co
sts
per
m3
DM
(%)
'w ' 64,8
8(1
00)
39,0
0(6
0)
41,9
4(6
4)
Ver
dien
st
je St
d.
DM
(%)
Earn
ings
pe
r ho
ur
DM
(%) /'''N
V ) 4,39
(100
)1
5,10
(116
)
5,35
(121
)
Leis
tung
je
Std.
Fm (%
)
Perf
or
man
cepe
rho
ur m3
(%) (001)
Zl‘0 0,
23(1
91)
0,23
(191
)
l > E 0 [ > g g
0,02
7(1
00)
0,07
8(2
88)
0,06
4(2
36)
Anf
all
je ha
Efm
o.
R.
Yie
ld
from
th
inni
ng
per
hec
tare
m3
of tim
ber
u.b.
( N'w' 37 54 52
Df-
Art
Type
of
th
inni
ng
(1)
Nie
derd
fg.
Low
thin
ning
Aus
lese
dfg.
Cr
own
thin
ning
Rei
hend
fg.
Line
th
inni
ng

84 F O R E ST R Y C O M M ISSIO N B U L L E T IN No. 55
2.2 Hardegscn, Abt. 51 bIn einem seinerzeit 34-jahrigen, im 1,25 x 1,25 m- Verband erwachsenen Fichtenbestand I/II Ertrags- klasse (Ertragstafel W iedemann, mail. D urchforstung 1936/42=dG Z 11) wurden im M arz 1967 drei verschiedene D urchforstungsarten in dreifacher Wiederholung angelegt. Bei der Erstdurchforstung wurden 25 % der Grundflache entnommen a ls :
1. N iederdurchforstung2. Auslesedurchforstung3. Reihendurchforstung.
Tabelle 8.1 gibt einen betriebswirtschaftlichen Vergleich. Aus der Ubersicht ist zu erkennen, da 13 die N iederdurchforstung besonders ungiistig ab- schneidet. D er Nettoerlos je ha betrug hier bereits im Jahr 1967 minus 1100, — D M je ha, wahrend bei den beiden anderen Durchforstungen die Werbungs- kosten durch den Erlos etwa gedeckt waren (13).
In Tabelle 8.2 wird der 5-jahrige Volumen- zuwachs der drei D urchforstungsarten verglichen(13).
Die Zuwachsanalyse macht deutlich, da 13 der
T abelle 8 .2
ZU W A C H S V E R G LEIC H VON N IE D E R D U R C H FO R S TU N G , AUSLESEDUR CH FO R STUN G U N D R EIH EN D U R C H FO R S TU N Gbei F ic h t e : H a r d e g se n A b t . 51 b 5 -jahfuger V o l u m e n z u w a c h s
5 -Y ear V o lum e I n c r e m e n t in N o r w a y S p r u c e A fter D iffer en t T h in n in g M et h o d s H a r d e g se n ,D e p . 51 b
D urchfor- Zuw achs Z uw achsverlust Z uw achs der Zuw achs derstungsart je ha je ha bezogen 800 starksten Baume 400 sta rksten Baum e
Vfm s in Vfm au f 100 J. je ha je ha(% ) (% ) (% ) Vfm s Vfm s
(% ) %Type of Volume loss o f increm ent Increm ent o f the Increm ent o f thethinning increm ent m 3 m 3 in 100 800 thickest trees 400 thickest trees
per ha s per ha years per ha s per ha s(% ) (% ) (% ) m 3 (% ) m 3 (% )
(1) (2) (3) (4) (5) (6)
Niederdfg. 86,0 ± 5 ,0 _ 57,8 ± 5 ,3 35,4 ± 3 ,9Low thinning (100) (100) (100)
Auslesedfg. 84,3 ± 5 ,0 1,7 0,1 62,9 4-5,5 40,3 4-4,0C row n thinning (98) (2) (109) (114)
Rcihendfg. 79,3 ±5,1 6,7 0,6 57,0 ± 5 ,4 37,3 ± 3 ,9Line thinning (92) (8) (99) (105)
T a belle 8 .3
E n t w ic k l u n g d es K r o n e n pr o z e n t e s d e r 4 0 0 Sta r k st e n B a um e je h a
D ev elo pm ent o f C r o w n P er c e n t o f t h e 4 00 T h ic k e st T rees pe r H ectare
D urchforstungsart
Type o f th inning
III . 1967 X II. 1971
U ndurchforsletU nthinned
53% 38%
N iederdurchforstung Low thinning
54% 48%
A uslesedurchforslung C row n thinning
53% 52%
R eihendurchforslung Line thinning
53% 48%
5-jahrige Volumenzuwachs bei Niederdurchforstung und Auslesedurchforstung nahezu gleich hoch ist. Die Reihendurchforstung hat einen nicht gesicherten Zuwachsverlust von 8% ; dieser Zuwachsverlust wirkt sich au f die gesamte Umtriebszeit von 100 Jahren nur m it 0,6% aus. D urch die Reihen- und besonders durch die Auslesedurchforstung wird der Zuwachs der starksten Baume m ehr gefordert als durch eine Niederdurchforstung. D er Volumenzuwachs der 400 starksten Baume ist bei der Reihendurchforstung 5%, bei der Auslesedurchforstung 14% hoher als bei der Niederdurchforstung.
F iir den nachhaltigen Massen- und Wertzuwachs der Zukunftsbaum e und fur deren Resistenz gegen Schneebruch ist die K ronenausbildung von groBer Bedeutung. In der Ubersicht wird die Entwicklung der relativen Kronenlange (Kronenlange im Ver- haltnis zur B aum hohe=K ronenprozent) der Ver- suchsflachen bei verschiedener Behandlung angegeben.

A SP E C TS OF TH IN N IN G 85
Aus der Ubersicht ist zu erkennen, daB die 400 starksten Baume je ha bei der Versuchsaniage eine gute K ronenausbildung(K ronenprozent=53) hatten. Innerhalb von nur 5 Jahren sank das Kronenprozent dieser Baume bei den undurchforsteten Vergleichs- flachen von 53 auf 38%. D ie individuelle Nieder- durchforstung und die schematische Reihendurch- forstung hatten den gleichen Effekt auf die Kronen- entwicklung. M it einem Kronenprozent von 48 konnte hierbei eine sehr gute K rone erhalten werden. Am wirkungsvollsten konnten die K ronen durch die Auslesedurchforstung gefordert werden (Rronen- p rozent= 52) (13).
Als Ergebnis dieser Versuchsflachen ist fest- zustellen: Die Auslesedurchforstung erlaubt die beste Zuwachspflege. Die Reihendurchforstung bietet die groBten wirtschaftlichen und technischen Vorteile und gestattet eine durchaus befriedigende Bestandespflege.
2.3 Brilon, Abt. 131 aIn einem seinerzeit 45-jahrigen, in 3,0 X 1,0 m Reihenverband begriindeten Fichtenbestand I. Ertragsklasse (Ertragstafel W iedemann, maB. Durch- forstung 1936/42= d G Z 12) wurden im H erbst 1969 25% des Vorrates einmal in individueller Nieder- durchforstung, zum anderen durch Aushieb jeder 4. Reihe entnommem (15). Bei dem Reihenhieb ent- standen somit 6 m breite Gassen. D ie Behandlungsart wurde 2 x wiederholt. In Tabelle 8.4 wird der 4-jahrige Grundflachenzuwachs angegeben (15).
D er 4-jahrige Grundflachenzuwachs liegt zwischen 8,9 m 2 und 11,1 m 2. Es ist kein eindeutiger Unter-
schied des Zuwachses beider Durchforstungsarten festzustellen. Im D urchschnitt liegt der 4-jahrige Zuwachs bei der Reihendurchforstung 3 % niedriger.
D er Zuwachsverlust bei diesem extremen Eingriff ist erstaunlich gering. E r diirfte sich auf die 100- jahrige Umtriebszeit nur unbedeutend auswirken.
Bei einer K om bination von geometrischen Ein- griffen m it Auslesedurchforstung diirften kaum Zuwachsverluste auftreten.
2.4 Lautenthal, Abt. 158 bIm H arzforstam t Lautenthal (11) wurde vor 45 Jahren in einem seinerzeit 55-jahrigen Fichtenbestand II/III Ertragsklasse (Ertragstafel Wiedem ann, maB. D urchforstung 1936/42=dG Z 9) 2/3 des Vorrates durch Aushieb jeder 2. und 3. Reihe entnommen. D er Bestand zeigt heute eine gute Massen- und Wertleistung. D a leider keine Ver- suchsflache existiert, werden in Tabelle 8.5 die Aufnahm edaten der Weiserflache mit den entspre- chenden D aten der W iedemann’schen Ertragstafel fur maBige und starke Durchforstung vergleichen.
Obwohl ein Vergleich mit der Ertragstafel gerade hier sehr fragwiirdig sein muB, ist doch aus der Tabelle zu erkennen, daB der Bestand tro tz eines extremen geometrischen Eingriffs heute eine gute M assen- und W ertleistung hat. Bei einer Stammzahl- haltung, die zwischen der der maBigen und der der starken Durchforstung liegt, hat er die gleiche Vorratshaltung wie die maBige Durchforstung. Seine Dimensionen sind noch groBer als bei der starken Durchforstung. D er W ert des Bestandes je ha - ausgedriickt in werbungskostenfreiem Erlos - ist
T abelle 8 .4
ZuWACHSVERGLEICH VON STARKER NlEDERDURCHFORSTUNG UND REIHENDURCHFORSTUNG BEI FlCHTEB r il o n , A b t . 131 a 4 -ja h r ig e r G r u n d f l a c h e n z u w a c h s
4 -Y e a r V o lu m e I n c r e m e n t A fter Lo w T h in n in g a n d L in e T h in n in g in a 4 5 Y ear O l d N o r w a ySp r u c e S t a n d P l a n t e d 3 x 1 M etres
Flachen-Nr.
Number of sample plot
Durchfor-stungsart
Type of thinning
Grundflache vor Durchforstung
m2 je ha
Basal area before thinning
m2 per ha
4-j. Grundflachenzuwachs je ha (1970-1973)
m2
4 year basal area increment
(1970-1973) m2 per ha
Zuwachsprozent1970-1973
%
Percentage of basal area increment
1970-1973 %
I a Reihendfg. 35,23 11,1 28,6I b Line thinning 37,26 8,9 23,7I a + I b Line thinning 36,25 9,5(97%) 26,1
II a Niederdfg. 33,48 9,6 28,7II b Low thinning 35,82 10,0 27,7II a + I I b Low thinning 34,65 9,8 (100%) 28,3

86 F O R E S T R Y C O M M ISSIO N B U LL E TIN No. 55

A SP E C TS OF TH INN IN G 87
daher ganz besonders hoch. Trotz des sehr starken Eingrilfs im Alter von 55 Jahren entsprachen Ast- starken, Jahrringbildung und Ausformung der Fich- ten weitgehend denen eines angrenzenden Bestandes, der individuell durchforstet worden war (11).
3. Schaden an Boden und Baumen3.1 AllgemeinesDie besonders in Schweden (2) beobachteten starken Zuwachsverluste infolge von Gassenhieben sind fast ausschlieBlich durch die verwendete Technik bei der Holzernte und beim Holzrucken verursacht. Boden- und Wurzelschaden sind nach Fries (7, 8) bei Raupenfahrzeugen geringer als bei Radfahrzeugen und konnen bei Abdecken der Gassen mit Reisig ganz vermieden werden. Aufbauend auf die schwe- dischen Untersuchungen wurden einige geometrische Verfahren der Stammzahlverminderung gepriift.
3.2 Maschinelle StreifenlauterungIm Forstam t Hardegsen, Soiling (danach auch in anderen Forstam tern Stid-Niedersachsens und Nord- Hessens) wurde zur streifenweisen Stammzahlre- duzierung in extrem dichten Fichtenjungbestanden eine Spezialraupe eingesetzt. Die Bestande hatten eine M ittelhohe von 8,5 m, einen mittleren Brust- hohendurchmesser von 9 cm und einen maximalen Brusthohendurchmesser von 23 cm. Verwendet wurde eine 75 PS H anom ag Raupe K 7 B mit V- formigen Planierschild und einem Gleichrichter. Das Schild war nach dem Schneepflugprinzip konstruiert und besitzt an der Unterseite ein waagerecht laufendes Schneidmesser. Im Abstand von ca. 8 m wurden mit diesem G erat auf 2,50 m breiten Streifen Baume bis zu 23 cm Brusthohendurchmesser abgeschnitten und umgedruckt. Die Stunden- leistung dieser Streifenlauterung betrug 1/2 ha. Die Kosten je ha (einschlieBlich der Kosten fiir zwei weitere W aldarbeiter fiir Hilfsarbeiten) betrugen 120, - - bis 160, — D M je ha (10).
Boden- und Wurzelschaden wurden durch diesen Einsatz ganz vermieden, da die Raupe iiber den Teppich der abgeschnittenen Baume fuhr. Eine unbedeutende Anzahl der stehenden Randbaum e wurde verletzt. Diese Baume wurden von den begleitenden W aldarbeitern mit der M otorsage abgeschnitten, so daB keine bcschadigten Baume im Bestand stehenblieben. D er Kaferbefall an dem liegenden, nicht aufgearbeiteten M aterial war unbedeutend. Eine Bekampfung der K afer war nicht erforderlich. 4 Jahre nach der MaBnahme ist das Kronendach iiber den Streifen weitgehend geschlos- sen. Die gut bekronten Baume haben die erheblichen Schnee- und Windschaden der letzten Jahre sehr gut iiberstanden.
3.3 Gassendurchforstung in KurzholzmethodeBei einer Gassendurchforstung in einem 35-jahrigen Fichtenbestand I. Ertragsklasse aus Pflanzung im 1,5 x 1,5 m-Verband in Hardegsen wurden 3 ver- schiedene Verfahren gepriift.Block I. Entnahm e jeder 9. und 10. Reihe.
Auslesedurchforstung im Zwischenstrei- fen. Gassenbreite 4,50 m.
Block II. Entnahm e jeder 12. und 13. Reihe. Zu beiden Seiten der Gasse bei 4 Reihen Auslesedurchforstung, 3 Mittelreihen un- durchforstet.
Block III. Entnahm e jeder 4. und 5. Reihe. Keine MaBnahme im Zwischenstreifen.
Das Holz wurde in der Kurzholzmethode auf- gearbeitet (2 m langes Schichtholz mit Rinde). Vorriicken mit H and zur Gasse. Belassen der Aste und Kronenspitzen auf der Gasse. Riicken des Holzes au f Gassen mit Kurzholz-Rtickezug B.M. Volvo SM 868.
Bei diesen Verfahren traten keine Boden- oder Wurzelschaden auf.
D ie Leistung und die verursachten Stammschaden sind aus Tabelle 8.6 zu entnehmen.
Aus der Ubersicht ist zu ersehen, daB die reine Gassendurchforstung im Block III die grdflte Leistung und damit den hochsten Verdienst fur die W aldarbeiter ermoglicht. Dieses Verfahren ware auch fur eine weitere Technisierung durch Erntema- schinen am geeignetsten. A uf der anderen Seite sind gegen dieses Verfahren erheblich biologische bes- timmte Bedenken vorzubringen. W ahrend im Block I und II nur 4% bzw. 3 % der Zukunftsbaume stark beschadigt wurden, wurden hierbei 9 % der zur Astung ausgewahlten Endstamme schwer verletzt(14).
3.4 Verwendung der Baumholzerntemethode in FichtenjungbestandenIm Miinchener Institut fiir Holzkunde und Forst- nutzung (21, 22) wurden zur Erstdurchforstung in Fichtenbestanden verschiedene Methoden der Lang- holzaufarbeitung gepriift. Die Durchforstung wurde nach rein waldbaulichen Griinden durchgefiihrt. Je ha wurden zwischen 700 und 2300 Baume, bzw. zwischen 15 und 42 Festmeter cntnommen. Hierbei wurden die Baume unentastet auf Riickegassen und fischgratenangeordneten Seillinien mit Schlepper geriickt. Die Arbeit wurde zu verschiedenen Jahreszeiten durchgefiihrt. Die hierbei insbesondere am StammfuB auftretenden Rindenschaden waren bedenklich hoch. Beim Riicken wahrend des Winters wiesen 4% bis 14% der vorherrschenden und herrschenden Baume mittlere und groBe Schaden auf. Im Sommer wurden sogar 17% bis 20% dieser Baume starker beschadigt. Aus biologischen Griinden

F O R E S T R Y C O M M ISSIO N B U LL E TIN No. 55
auEu
1 53O
* o0) iig
tetim
e je 10
0 lfd
. m
G
asse
' da
mag
ed
trees
per
100
m st
rip
leng
th
2,0 v o
2,0
uC3cA* B
esch
atZ-
Ba
je ha
ab
sol.
(in %
)
iN
umbe
r oi
eli
te i
per
ha 1
(%)
S0 0
VOCN
r -<N
(%6)
0
Anz
ahl
d. Z-
Bau
me
je ha
Num
ber
of
elite
trees
for
pru
ning
pe
r ha
327
305
300
zUJOzD
O
zzzx
HCl
£0 0 R
ucke
kost
en
je R
m
DM
Brin
ging
co
sts
per
st. c
. m
.
DM 7,60
7,60
7,60
VO0 0
J
3!OOC3QZUJt/il/l<o
U*OmaoXtSCO
Wer
bung
s ko
sten
je
Rm
D
M
Felli
ng
costs
an
d so
cial
co
sts
per
EO
CO
DM
14,3
0
14,3
0
14,3
0
wn<H
tC2UJ
SaU2Si
XO2<>zUJ
Ver
dien
st
je St
d.
DM
Earn
ings
pe
r ho
ur
DM 7,91
7,91
9,00
XuUJuoaZUJ
>
m
zoco
<CL.so
u
Leis
tung
je
Std.
R
m
Perf
or
man
ce
per
hour
st
. c.
m.*
0,58
0,58
0,66
Hie
bsan
fall
je ha
Efm
o.
R.
(%d.
Vor
rats
)
Yield
fr
om
thin
ning
pe
r ha
m3
of tim
ber
harv
este
d u-
b. (%
)
92,8
/—s
! 79,8 m
I
92,0
/■“ N
!
Bloc
k N
r. B
ehan
dlun
gsar
t
Num
ber
of sa
mpl
e pl
ot
Type
of
thin
ning
I. G
asse
ndur
chfo
rstu
ng
10,5
m Zw
isch
enst
reife
n m
it A
.Df.
I. Cu
tting
of
every
9th
an
d 10
th ro
w.
Betw
een
the
cutti
ng-s
trips
cro
wn
thin
ning
II. G
asse
ndur
chfo
rst.
15 m
Zwisc
hens
treife
n m
it tei
lw.
A.D
f.
II. C
uttin
g of
every
12
th
and
13th
row
. Cr
own
thin
-nin
g in
the
4 ro
ws
on
each
sid
e of
the
strip
s. N
o th
inni
ng
in 3
rem
aini
ng
row
s
III.
Gas
send
fg.
3 m
Zwi
sche
nstre
ifen
ohne
D
fg.
III.
Cutti
ng
of ev
ery
4th
and
5th
row
. No
th
inni
ng
in the
re
mai
ning
3
row
s

A SP E C TS OF TH IN N IN G 89
sollten diese Ganz-Baumm ethoden nur wahrend des Winters angewendet werden.
In Hardegsen verwendeten wir die Langholz- Erntem ethode bei der Reihendurchforstung. Im Gegensatz zu den Miinchener M ethoden wurde hierbei schematisch jede 4. Baumreihe geschlagen und au f der entstehenden Arbeitsgasse geastet. Aste, Kronen und schwache, nicht verwendbare Baume blieben au f der Gasse liegen. Das H olz wurde anschlieflend m it Pferd iiber den entstandenen Reisigteppich geriickt. Irgendwelche nennenswerten Boden- oder Rindenschaden konnten bei diesem Verfahren nicht beobachtet werden (16).
4. Wind- und Schneebruchschaden4.1 WindschadenIn der Jugend und somit zur Zeit der ersten Stamm- zahlreduzierung sind die Fichtenbestande noch weniger von W ind bedroht. Die Gefahrdung durch den W ind steigt abhangig von der Baumhohe deutlich m it zunehmendem Bestandesalter (5, 6, 18, 19). Zur Vermeidung von W indschaden sollten daher starkere Durchforstungseingriffe nur in Jungbe- standen durchgefiihrt werden; altere Bestande sind dagegen moglichst geschlossen zu halten, urn dadurch ein zu starkes Ausschwingen der Baumkronen zu vermeiden. Besonders wurfgefahrdet sind die Fichten unm ittelbar nach der Duchforstung, sowie auf flachgriindigen und nassen Boden. Diese allgemein bekannten Gesetzmafligkeiten traten auch bei der
W indwurfkatastrophe in Norddeutschland am 13.11. 1972 deutlich hervor. Unsere Fichtenjungbestande in Hardegsen haben auch nach Reihen- und Gassen- durchforstung i.a. den W ind gut ausgehalten. Starker geschadigt wurden lediglich die Bestande, die unm ittelbar vor dem Sturm durchforstet waren. Ein EinfluB der D urchforstungsart war nicht fest- zustellen. In unseren 1972 durchforsteten Versuchs- flachen war die starke Niederdurchforstung sogar erheblich starker geschadigt als die Reihen- und die Auslesesdurchforstung.
4.2 SchneeschadenDie Schneebruchschaden treten im Gegensatz zu den Windschaden vor allem in Jungbestanden auf. Die Bestande, die zur ersten Durchforstung anstehen, sind daher besonders schneebruchgefahrdet. Unsere Untersuchungen im Soiling (4, 15, 24) bestatigten bereits bekannte Untersuchungen (23). Lang be- kronte und m ehr abholzige Fichten sind besonders schneebruchresistent. D as Ausfallprozent infolge Schneebruch steigt proportional mit dem mittleren Schlankheitsgrad und sinkt mit dem K ronenprozent (s. Abb. 8.1 und 8.2). Innerhalb eines Bestandes nimmt das Ausfallprozent mit zunehmendem Durch- messer ab (Abb. 8.3).
Eine M inderung der Bestandessicherheit gegen Schnee wird allgemein als Folge schematischer geo- metrischer Eingriffe befiirchtet. D ie Erfahrungen der Praxis iiber Schneebruch nach Reihen- und Gassen-
(N )
y = - 1 4 . 9 2 + 0 . 6 3 x
r = 0 . 6 7 7
6 0 7 0 8 0 9 0 1 0 0 h g / d g
Abb. 8.1 Ausfall % (N) im Abhangigkeit vom mittleren Schlankheitsgrad (hg/dg).
Figure 8.1 Mortality percentage (N) as related to mean taper (hg/dg).

90 FO RESTR Y C O M M ISSIO N B U LL E TIN No. 55
(N )
20 30 40 50
Abb. 8.2 Ausfall % (N) im Abh'angigkeit vom mittleren Kronen %
Figure 8.2 Mortality percentage (N) as related to mean crown per cent
60 70 mitt I. Kr.%
(4 cm - Stufen)
Abb. 8.3 Ausfall % (N) in den verschiedenen Durchmesserklassen.
Figure 8.3 Mortality percentage (N) in various diameter classes. Abtellung = compartment.4cm Stufen = 4 cm steps, d 1-3= breast height diameter.

A SP E C TS OF TH INN IN G 91
N /h aZeichenerklarung
Abb. 8.4
Figure 8.4
Stadtforstamt Brilon, Abt. 131. Stammzahlverteilung bei Starkeklassen nach Gassendurchforstung und Schneebruchschaden im Vergleich zur starken Niederdurchforstung. Schneebruchschaden entstand nach der Gass endurchforstung fast ausschliesslich in den schwachen Baumen der Starkeklassen 8-16 cm auf. Nach dem Schneebruch hat die Gassendurchforstung immer noch erheblich mehr schwache Stamme als die nicht geschadigte starke Niederdurchforstung.
Stadtforstamt Brilon, Compt 131. Distribution of stems by diameter classes after strip thinning and snow damage in comparison to heavy low thinning.In the strip thinning, snow breakage occurred almost exclusively among the weaker trees in the diameter classes of 8-16 cm. After the snow breakage the strip thinning still has considerably more weak stems left than the undamaged heavy low thinning.Key: N nach Df = number of stems after thinning.
Schneebruch = Snow breakage.N nach Schneebruch = number of stems after snow breakage.Gassendf. = strip thinning, st. Ndf. = heavy low thinning.
durchforstung widersprechen sich. Dieses ist zu erklaren durch Unterschiede im Bestandeszustand und dem Zeitabstand zwischen D urchforstung und E intritt des Schadens (15). Im W inter nach dem Eingriff sind die Bestande besonders labil. Ferner sind eng erwachsene und spat durchforstete Fich- tenbestande sehr anfallig, da die Baume infolge des Engstandes nur kleine K ronen und ein hohes h/d-Verhaltnis haben. In unseren Versuchsbestanden, bei denen sehr friihzeitig - im Alter von 20 bis 35 Jahren - jede 4. Reihe entnommen war, hatten die herrschenden Baume noch ein Kronenprozent von iiber 50. H ier tra t selbst in dem in Niedersachsen extremen Schneebruchwinter 1969/70 kein nennens- werter Schaden auf. Bei unseren Versuchsflachen mit Nieder-, Auslese- und Reihendurchforstung traten bei Auslese- und Reihendurchforstung unbe-
deutend Schaden bei den schwachen Baumen auf, bei der Niederdurchforstung war kein Schneebruch verursacht, da hier die schwachen gefahrdeten Baume bereits vorher entnommen waren.
Ein besonders drastisches Beispiel bietet der extreme Reihenhieb im Forstam t Brilon, Abt. 131 a. D ie starke D urchforstung mit Reihenhieb (Gassen- breite 6 m) und Niederdurchforstung war im Herbst 1969 unm ittelbar vor dem Schneebruch durchgefiihrt worden. Bei der starken Niederdurchforstung trat kein Schneebruchschaden auf, beim Reihenhieb wurden dagegen 18% der Baume und 10% der Vorrates durch Schnee gebrochen. In Abbildung 8.4 ist die Stammzahlverteilung der Gassendurchforstung ( = Reihendurchforstung) und der starkcn N iederdurchforstung verglichen. Bei der Reihendurchforstung sind im wesentlichen nur die Durch-

92 F O R E S T R Y C O M M ISSIO N B U LL E TIN No. 55
messerklassen 8,5 bis 16 cm betroffen, also Durch- m ehr schwache Baume, als die nicht geschadigtemesserklassen, die bei der starken Durchforstung Niederdurchforstung. D ie wuchskraftigen Zukunfts-schon ganz stark reduziert waren. Auch nach dem baum e waren auch bei der geometrischen Durch-Schneebruch hat die Reihendurchforstung noch viel forstung nicht vom Schneebruch betroffen.

A SP E C TS OF TH INN IN G 93
LITER ATU R
1. A b e t z , P. (1970). Schwachholzmarkt und waldbau- liche Konsequenzen bei Bestandesbegrundung und J ungbestandespflege. Allgemeine Forstzeitschrift.
2. A g r e n , A . (1963). Produktionsfoluster till fo ljd av virkestransport i gallringsskog. - Ska vi gallra? Sveriges Skosvardsforbund, Stockholm S. 30-34.
3. D u m m , G. (1970). D er EinfluB des Verbandes auf Schneebruchgefahrdung und Astbildung. Hessi- scher Forstverein, Jahresbericht, Schotten 1970, S. 23-26.
4. G r ie sb a c h , E. u n d M a sc h e r , E. (1970). Unter- suchungen in stark schneebruchgefahrdeten Fichten- bestanden im Siidost-Solling. Seminararbeit d. Forstl. Fakultat der Universitat Gottingen.
5. H u t t e , P. (1967). Die standortlichen Vorausset- zungen der Sturmschaden. Forstw. Centralblatt, S. 276.
6. H u t t e , P. (1969). Investigations concerning the influence of thinnings on the resistance o f spruce stands against wind. Thinning and Mechanizations, Stockholm , S. 158.
7 . F r i e s , J. (1 9 6 9 ) . Value o f residual stand. Principal views. Thinning and Mechanization, Stockholm, S. 2 1 .
8. F r ies , J. (1973). Thinning - why and how. Thinning in the Forestry o f the Future, Elmia, Jonkoping, Schweden.
9. K r a m e r , H. (1968). Zur Behandlung und Beurteilung junger Fichtenbestande. Allgemeine Forstzeitschrift, N r. 28.
10. K r a m e r , H. u n d B e h r n d t , W. (1969). Maschin- elle Streifenlauterung in Fichtenverjungungen. Allgemeine Forstzeitschrift, S. 754-758.
11. K r a m e r , H. u n d v o n K o r t z f l e isc h , A. (1970). Erfahrungen m it starker Reihendurchforstung bei Fichte im Westharz. Der Forst- und Holzwirt,S. 177-181.
12. K r a m e r , H. (1 9 7 1 ) . Treatment o f Young Norway Spruce Stands. Svensk Skogsvardsfdrbunds Tid- skrift, S. 2 8 1 - 2 9 4 .
13. K r a m e r , H. (1974). Ertragskundliche und holz- meBkundliche Forschungsergebnisse als Ent- scheidungshilfen fiir die forstliche Planung und den laufenden Betrieb. Allgemeine Forst- und Jagdzeitung, S. 25-30.
14. K r a m e r , H. u n d K e u ffe l , W. (1974). Gassen- durchforstung. Allgemeine Forstzeitschrift, S. 137— 140.
15. K r a m e r , H. (1974). Biologische Kriterien als Ent- scheidungshilfe fiir die Wahl stark mechanisierter Durchforstungssysteme. Foistarchiv, S. 217-221.
16. K r a m e r , H. (1966). Zur Kulturbegriindung und Jungbestandspflege bei Fichte. Aus dem Walde, N r. 12.
17. K r a m e r , H. u n d P e in e , J. (1968). Erstdurchfor- stung bei Fichte. Der Forst- und Holzwirt, N r 20.
18. M it s c h e r l ic h , G. (1968). Zur Frage der Sturm- sicherung, der Bestande. Allgemeine Forstzeitschrift, N r. 36/37.
19. M it s c h e r l ic h , G. (1973). W ald und Wind. Allgemeine Forst- und Jagdzeitung, S. 74.
20. N il s o n , P. O. u n d H y p p e l t , A. (1969). Studies on decays in scars o f Norway spruce. Thinning and Mechanization. IU FR O meeting Royal College of Forestry. Stockholm.
21. P a b st v o n O h a in , G. (1974). Rinderverletzungen beim Riicken von Baumen mit Asten in schwachen Fichtenbestanden. Allgemeine Forstzeitschrift, S. 141-143.
22. P e c h m a n n , H. v o n . (1974). Der EinfluB der D urchforstung au f die Holzqualitat, Forstarchiv,S. 34-38.
23.PERSSON,P.(1972).Vind-ochsnoskadorssamband med bestandsbehandlingen - inventering av yngre gallringsforsok. Institutionen fd r Skogsproduktion, Rapporter och Uppsatser, Stockholm, N r. 23.
24. K r a m e r , H. (1975). Erhdhung der Produktions- sicherheit zur Forderung einer nachhaltigen Fichten- wirtschaft. Forstarchiv, S. 9-13.

94 F O R E S T R Y C O M M ISSIO N B U LL E TIN No. 55
DISCUSSION
Adlard: These are a series o f very interesting experiments. It seems a little difficult to tie them together. I t seems to me that it would be better to lay out factorial experiments including type and intensity so that the interaction between these could be evaluated.
Franz: I agree that a factorial design would be much
better to answer such questions.
Fries: In Table 6 good revenues were obtained from the removal o f two rows in five. D o you intend to thin these treatm ents selectively at a later stage ?
Kramer: Yes. This will involve removing trees from all three remaining rows.

P ap er 9
VIEWS ON THE CHOICE OF SILVICULTURAL METHODS AND LOGGING TECHNIQUE IN THINNING
By JO R A N FRIES Royal College o f Forestry Stockholm, Sweden
1. IntroductionWhen the harvested wood has to be transported out of the thinned stands, damage is often caused to soil and remaining stand. This damage may be in the form of deep trails caused by the tractors with roo t damage, ro t infections and yield losses as a consequence. The transport may also lead to damage to remaining trees, causing ro t infections and decreased quality. The opening up of corridors may also lead to yield losses because of the fact that the corridors are not fully utilized by the remaining stand.
It is im portant to be able to foresee these losses and to have a knowledge o f how they could be limited or avoided. Having this knowledge, it would be possible to choose the combination of silvicultural m ethods and logging technique giving the best result.
The aim of the project on transport damage, started in 1971 at the Royal College o f Forestry, is to give the facts necessary for these considerations. Participating in this project are Dr. Uno Bjorkhem (soil science), Dr. Arne Hyppel (botanies, mycology), Dr. G oran Lundeberg (botanies, mycology), Dr. Jan Scholander (technique) and Professor Joran Fries (yield research, economics, project leader). The field w ork of the project is finished and the work on the publications is under way. This paper is based on results from this project. Preliminary
results have earlier been published by Fries (1973) and by Bjorkhem et al (1974).
2. Soil Breakage and Trail FormationThe primary effects o f logging by tractor on forest soils are soil breakage and trail form ation as well as damage to the tree trunks along the haul-road.
By soil breakage we mean that the humus layer has been to m off from the surrounding untouched humus layer and either been pressed down or crumpled by the wheels or the tracks of the tractor. There is, as could be expected, a strong relationship between trail depth and soil breakage (Figure 9.1). The variation around this relationship is caused to some extent by the fact that even if the soil has a good bearing capacity and thus the trail depth is minor, soil breakage could still be important due to the fact that the humus layer is very thin.
Soil breakage as well as trail depth increase with the number of runs along the road, i.e. with the total am ount of transported wood. There is, however, the difference that trail depth after a number of runs seems to reach a fairly constant level (Figure 9.2), while the frequency of soil breakage seems to increase fairly linearly (Figure 9.3). This figure also examplifies the effect of slash from the thinning covering the road. As an average the fre-
c .. W h e e l Track? ° " . N o slash o abreakage s ,Qsh . .
%10CH
5 0 -
o
o o
o* o •
oo
10 15Trail depth, cm
Figure 9.1 Trail dep th and soil b reakage.
95

96 FO RESTR Y C O M M ISSIO N B U LL E TIN No. 55
Number of turns
Figure 9.2 Number of turns and trail depth. Tractor: BM Volvo SM 462.
o W hee l, no slash o W heel,slash
2Transported volume, m
Figure 9.3 Transported volume, and soil breakage. Tractor: BM Volvo SM 462.
S o i l
Figure 9.4 Soil breakage as a percent of road length for various total quantities transported along the road and for various types of moraln. Type of morain: 1 gravelly, 2 sandy, 3 sandy-loamy, 4 loamy- clayey. Track - track on rear wheels and bogey.
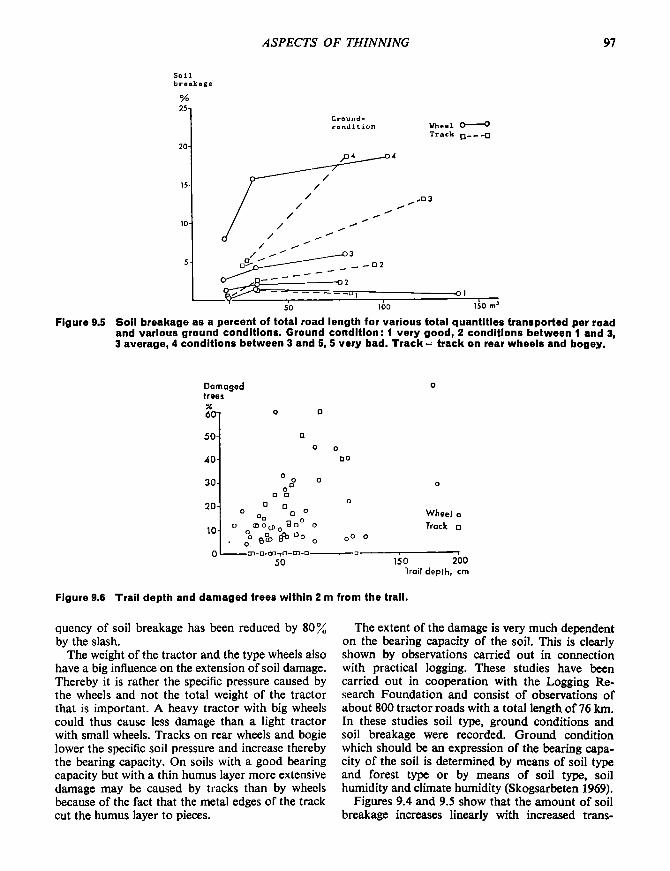
A SP E C TS OF TH IN N IN G 97
S o i lb r e a k a g e
%
Figure 9.5 Soil breakage as a percent of total road length for various total quantities transported per road and various ground conditions. Ground condition: 1 very good, 2 conditions between 1 and 3, 3 average, 4 conditions between 3 and 5, 5 very bad. Track = track on rear wheels and bogey.
Damaged trees X 60 '
5 0
4 0
3 0
20
10
0
0 co° □ □
0 o6s> ° o ,
-m-a-aa-rO-CD-o-50
Wheel o Track □
150 200Trail d e p th , cm
Figure 9.6 Trail depth and damaged trees within 2 m from the trail.
quency of soil breakage has been reduced by 80% by the slash.
The weight o f the tractor and the type wheels also have a big influence on the extension of soil damage. Thereby it is rather the specific pressure caused by the wheels and not the total weight o f the tractor that is im portant. A heavy tractor with big wheels could thus cause less damage than a light tractor with small wheels. Tracks on rear wheels and bogie lower the specific soil pressure and increase thereby the bearing capacity. On soils with a good bearing capacity but with a thin humus layer more extensive damage may be caused by tracks than by wheels because of the fact that the metal edges of the track cut the humus layer to pieces.
The extent of the damage is very much dependent on the bearing capacity of the soil. This is clearly shown by observations carried out in connection with practical logging. These studies have been carried out in cooperation with the Logging R esearch Foundation and consist o f observations of about 800 tractor roads with a total length o f 76 km. In these studies soil type, ground conditions and soil breakage were recorded. G round condition which should be an expression o f the bearing capacity of the soil is determined by means o f soil type and forest type or by means of soil type, soil humidity and climate humidity (Skogsarbeten 1969).
Figures 9.4 and 9.5 show that the am ount o f soil breakage increases linearly with increased trans

98 F O R E S T R Y C O M M ISSIO N B U L L E T IN No. 55
ported quantity o f wood and that there is a strong correlation between soil type or ground condition and the am ount o f soil breakage. It should be observed that the values for wheel and for track (track on rear wheel and bogie) are not directly comparable as tracks apparently have been used to a greater extent on soils with less bearing capacity.
The bearing capacity decreases, as could be expected, with increasing soil type and ground condition class. The following average values concerning ground condition were attained for the various types of moraine in the data.
Type 1. 2. 3. 4.of Grav Sandy Sandy- Loamy,
moraine elly loamy clayeyG roundcondition 1-06 1-87 2-28 3-50
3. Root Damage and Rot InfectionsAs could be expected, there is a strong correlation
between trail depth and the num ber of damaged trees (Figure 9.6). By damaged tree we mean a tree which has got at least one root thicker than 2cm damaged by the transport.
The risk of a tree getting a root damaged increases also with the diameter of the tree at the same time as it decreases with the distance of the tree from the trail. Trees standing further away from the tractor trail than two metres are running a very m inor risk of getting roo t damage. The leaving of slash on the roads decreases the risk of road damage considerably. The frequency of damaged trees was twice as high when the road was free of slash as when it was covered with slash.
The risk of rot infection caused by damage on roots may be summarized in the following way for Norway spruce. Damage close to the trees (< 0 -5 m) will in most cases lead to ro t in the root as well as in the stem. Damage far away from the trees (> 0 -7 -1 -0 m) may lead to ro t in roo t and stem if the damage is deep, whereas shallow damage that far away from the tree seldom gives rise to any stem infection. Damage to roots smaller than 2 cm seldom gives rise to any rot infection. Corresponding damage on Scots pine seldom leads to ro t infection.
4. Yield LossesSome preliminary results from studies of the effect o f transport on yield may be concluded in the following way. The opening up of corridors seems to have had a moderate positive effect on the increment o f pine trees close to the roads. F or spruce no corresponding effect has been noted. The transport has caused a reduction of the increment close to the roads in the two trials where soil damage and trail formation were important. In both these trials
spruce is dominating. The third trial was m ade in a pine stand on soil with good bearing capacity. Trail form ation here was insignificant and there was no negative effect o f the transportation to be seen.
5. Damage to TrunksIn the previously mentioned study in connection with the regular transportations the appearance of trunk damage along the roads was also recorded. Damage to the trunk lower than 1 • 6 m above the ground and damage inflicted to the trunk above l - 6 m were kept separate. This part o f the investigations has not yet been analysed, but as an average for all the collected m aterial two trees in every 100 m of road were damaged, the lower damage being m ore com mon than the higher one.
A more detailed analysis o f these data has not yet been done. It is, however, apparent that the frequency of stem damage varies with the width of the road, the width of the tractor and its equipment, the num ber of runs and last but not least the ability of the driver.
6. Views on the Choice of Silvicultural Method and Logging TechniqueThrough the simulation of stand development, damage and yield in volume and value of various alternatives of stand treatm ent and logging it will be possible to judge what m ethods which will yield the best results.
One example of such a simulation is given by Fries in a preliminary summary of the mentioned project (Bjorkhem et al 1974). This example (Table 9.1) shows that the alternatives no thinning and one corridor thinning are very much inferior to those alternatives containing selective thinnings. Furthermore the alternative with one selective thinning is inferior to the alternatives with three thinnings if excessive yield losses could be avoided. On the good site this example is dealing with it is advisable to choose a silvicultural alternative with at least two thinnings, whereby the first one should be a corridor thinning combined with selective thinning and the next and eventually the third one should be purely selective.
The example also shows that if the logging will lead to excessive yield losses and eventually also root damage it should be feasible to avoid this damage by the introduction of more expensive but also less harmful methods, e.g. winching with 80-100 m between the haul-roads. I t is assumed that this m ethod does not give a larger extent o f stem damage than the other methods.
Based on what is said above concerning the risk of

A SP E C TS OF TH INN IN G 99
TABLE 9.1A lternative C hoices of T h in n in g M ethods
Norway spruce, h100=32, 2,000 trees per hectare before the first thinning at age 35. Remaining stand at age 80, total yield in m8 and Kr. Sw. at 80 years rotation, present value at the first thinning, calculated with a compound rate of interest of 4% and the value of the first thinning for various treatment- and damage alternatives. By present value
is meant net values of all harvests discounted to the time of the first thinning.
Nothinning
Oneselectivethinning
Onecorridorthinning
Three thinnings
Onlyselective
Cc+s
irridor thinr elective thin
ingning
Alternative No. 1 2 3 4 5(1) (2] 7(3)Remaining '1 meanstand at 1 diameter 24-5 29-9 25-2 371 38-8 35-9 35-9age 80 | cm
J volume, ma 744 659 428 620 584 494 494Total yield at \ m8 744 760 510 824 789 680 680age 80 / % 90 92 62 100 96 83 83Total yield at I Kr 26 332 30 286 17 912 35 342 34 943 28 267 27 045age 80 / % 74 85 51 100 99 80 77Present value I Kr 4 509 5 623 4 980 7 832 7 945 6 548 6 340at age 80 r % 58 72 64 100 101 84 81Net value of the firstthinning, Kr 0 670 2 308 313 752 752 752
I1’ Insignificant yield losses <2> Important yield lossesl8> Important yield losses and losses through decay
damage on soils w ith various bearing capacity, the following guide-lines could be given concerning the choice of logging technique at various ground condition on m oraine soil. The use of a heavy forwarder equipped with big rubber tyres, e.g. BM Volvo SM 868 is assumed. See Table 9.2.
According to this example hauling to roads with a distance of 20 m in between should be used on mineral soils with a bearing capacity corresponding
to ground condition 1-3. The hauling and transport should be made with a forwarder with big low pressure tyres, e.g. BM Volvo SM 868. If the bearing capacity is inferior winching with a distance of 80^100 m between the haul-roads should be employed. F o r the transport along the haul-roads the same tractor should be used as in the above-mentioned case, but equipped with tracks on rear wheels and bogie.

100 F O R E S T R Y C O M M ISSIO N B U L L E T IN No. 55
T a bl e 9 .2
E x am ple s o n t h e C hoice o f L o g g in g T e c h n iq u e a t V a r y in g B e a r in g C a p a c it y o fM in e r a l S oils
Ground condition (mineral soil)
(1)
Quantity per road m3 Equipment
(2)Slash
(3)
Transporttechnique
(4)
1 0-50 W _ H1 50-100 W _ H1 100+ W S H
2 0-50 W H2 50-100 W s H2 100+ w s H
3 0-50 WT s H3 50-100 T s H3 100+ T s HW (HF)
4 0-50 T s W (HF)4 50-100 T s W (HF)4 100+ T s W (HF)
5 0 + T s W (HF)
Explanations(1) Ground condition
1. Very good2. Conditions between 1 and 33. Average4. Conditions between 3 and 55. Very bad
(2) Equipment W = wheelsT = track on rear wheels and bogieWT=wheels ev with tracks on rear wheels and bogie
(3) SlashS=the road should be covered with slash
(4) Transportation techniqueH = hauling with around 20 m between the haul-roads W = winching with about 100 m between the haul-roads HW=hauling or winching HF =hauling if the soil is frozen

ASP E C TS OF TH INN IN G 101
REFERENCES
F r ie s , J. (1973). Thinning - why and how? - Reprint o f papers from the International conference at ELM IA 1973 Thinning in the forestry o f the future. Departm ent o f Operational Efficiency, Royal College of Forestry. Garpenberg, Sweden.
B jo r k h e m , U., F r ies , J., H y p p e l , A., L u n d e b e r g , G. a n d S c h o l a n d e r , J. (1974). Damage by heavy vehicles in thinnings. - Journal o f the Royal Academy o f Agriculture and Forestry, 1974. Stockholm.
DISCUSSION
M alcom: Were you talking about perm anent extraction roads or tem porary extraction racks?
Fries: These are corridors opened up in the stand. I could not say whether they would be used once or several times. The investigations however, were made after they were used just once. This is a good question because if you carry out repeated logging in these corridors then the damage might be even more serious.
Malcolm: In Britain something like 40% of the soils which we are concerned with have some degree of impeded drainage and I think it extremely important that some attention be paid to this. W hat you call soil breakage, disturbance of the humus horizons, in fact may be a good thing in some conifer stands, but it is the soil com paction on fine textured soils that is im portant and I do not think we know anything about the recovery of soils which have been compacted.
Fries: We have given some thought to this and I know from agricultural experience that compaction can have quite bad effects. I also know from ex
periments in Holland, where seedlings were planted in compacted soils. The roots did not penetrate at a certain degree of com paction but remained on the surface. We have also had an example from Sweden in a military area where there was very heavy traffic. H ere there were undoubtedly large losses due to compaction. In forest soils we don’t know whether frost will break up compacted soils.
Malcolm: If the roots are incapable o f penetrating soil of high density then they remain on the surface. Surface traffic can then affect the surface feeding roo t system.
Stratmann: You tested a wheeled tractor and a half track tractor. D id you test a full track machine?
Fries: No, we used only the two you have mentioned. There is o f course a tendency that on soils with a lower bearing capacity for tracks to cause less damage than wheels. However, on very sturdy soils with a thin humus layer the tracks might cut through the thinned humus layer and thus cause more soil breakage than wheels.

P aper 10
THE INFLUENCE OF DIFFERENT THINNING SYSTEMS ON DAMAGE TO SOIL AND TREES
By H EN R Y A. FR O EH LIC H Associate Professor o f Forest Engineering Oregon State University, Corvallis, Oregon
Damage to soil and residual trees while thinning young forest stands has been o f increasing concern. This concern parallels the increase of mechanization of the thinning process. Soil damage as discussed in this paper is taken as any impact on soil which reduces the potential growth of residual trees or of the seedlings to be established at the conclusion of the thinning cycle. Tree damage is taken to be any impact on tree boles o r roots which is sufficient to reduce tree growth either directly through physical damage or indirectly through the introduction of wood rotting fungi.
A t the 1969 IU FR O conference in Stockholm on thinning and mechanization, recent reports given at the ELM IA conference in Jonkbping, and in the research literature of Europe and America, a wide array of responses to soil and stem damage is reported. Some of the data seems conflicting and it is disappointing to note that we still are not able to predict what growth response to expect from a given level of impact. It is relatively easy to measure the extent o f soil disturbance, degree of com paction or num ber and size of tree wounds. It is obviously much more difficult to measure the actual impact of these factors on tree growth. We need to recognise that tree damage as expressed in number, size and location of wounds is only an index to possible ro t infection and subsequent wood fibre losses. Likewise, measured soil disturbance or compaction is only an index to possible growth impacts. Since it is unlikely that we can intensively manage forests w ithout causing some disturbance, especially with increased ground-based mechanization, it is important to separate actual damage from simple visual efTects.
The highly variable results observed in soil and stem damage studies appears to be largely due to the high variability that exists in site, stand and operational factors. It is not possible to consider only the thinning system without examining the other two. Site factors would include:
(1) topography(2) soil type and depth(3) soil moisture at time of thinning(4) degree of soil protection from litter or
slashings
Stand factors would include:(1) tree species(2) age or size(3) stand density before and after thinning(4) seasonal differences in bark strength(5) rooting characteristics
Operation factors would include:(1) ground pressure and vibration of equipment(2) operator skill and attitude for given type of
equipment(3) product size (loadsize) being removed(4) pattern o f extraction routes(5) frequency of entry
Some generalities I have drawn from the scattered research results are illustrated in Figure 10.1. In this diagram the three elements o f site, stand and operations are arranged in a fashion that illustrate the trends evident from much of the research.
Soil compactibility is most strongly characterized by soil texture and soil moisture and might represent m ajor site factors. We could also indicate increasing slope as a site factor which tends to cause increasing soil disturbance.
The stand factors most often recorded are related to the tree species’ susceptibility to damage. Thus it may be possible to rank species from relatively resistant to most sensitive to roo t damage or soil compaction. In the Pacific N orthwest, we might place Ponderosa pine or lodgepole pine at the relatively resistant end o f the scale followed by Douglas-fir, Sitka spruce and W estern hemlock towards the most sensitive end of the scale.
The effect o f the thinning system on soil and tree damage may be m ost strongly related to the com- pactive energy applied to the soil surface. Here we see some differences created by small crawler tractors with bearing pressures of 3-4 psi com pared with rubber-tyred skidders with ground pressures of 25-30 psi.
Very little work has been reported which shows the relative impact o f different thinning systems on direct tree damage. In my recent measurements, as shown in Table 10.1, the differences in tree wounding even between cable and crawler tractor appeared to be relatively small.
Some of the research results clearly indicate that
102
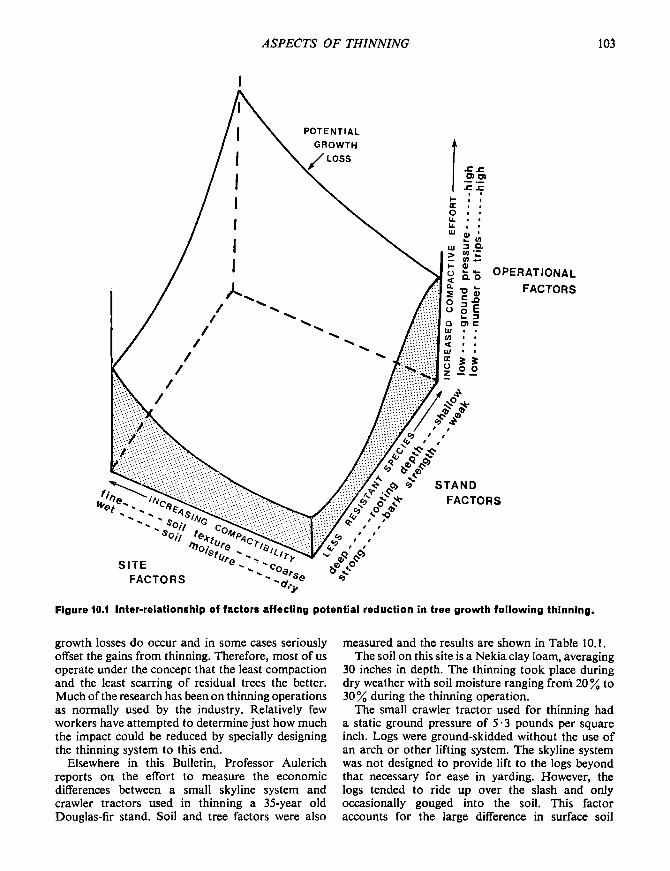
A SP E C TS OF TH IN N IN G 103
Figure 10.1 Inter-relationship of factors affecting potential reduction in tree growth following thinning.
growth losses do occur and in some cases seriously offset the gains from thinning. Therefore, most o f us operate under the concept that the least compaction and the least scarring of residual trees the better. Much of the research has been on thinning operations as normally used by the industry. Relatively few workers have attem pted to determine just how much the impact could be reduced by specially designing the thinning system to this end.
Elsewhere in this Bulletin, Professor Aulerich reports on the effort to measure the economic differences between a small skyline system and crawler tractors used in thinning a 35-year old Douglas-fir stand. Soil and tree factors were also
measured and the results are shown in Table 10.1.The soil on this site is a N ekia clay loam, averaging
30 inches in depth. The thinning took place during dry weather with soil moisture ranging from 20% to 30 % during the thinning operation.
The small crawler tractor used for thinning had a static ground pressure of 5-3 pounds per square inch. Logs were ground-skidded without the use of an arch or other lifting system. The skyline system was not designed to provide lift to the logs beyond that necessary for ease in yarding. However, the logs tended to ride up over the slash and only occasionally gouged into the soil. This factor accounts for the large difference in surface soil

104 F O R E S T R Y C O M M ISSIO N B U LL E TIN No. 55
T able 10.1
I m pa c ts o f S m all S k y lin e a n d T r a c t o r T h in n in g o n S oils a n d T rees in T h in n in g 35 -y ea r o ld
D o u g l a s -F ir
Skyline Tractor Soil disturbed 4 % 18-28 %
Soil density U ndisturbed Skyline roads M ajor trac to r trails Secondary trails Lightly used trails
Stem woundsTrees with wounds > 9 sq. in. 26% 28%Trees with w ounds > 7 2 sq. in. 7% 11%W ounds below 1 foot 33% 58%W ounds above 5 feet 22% 2%
disturbance between the tractor and skyline systems.The clay loam soil o f this site is rated as having a
high susceptibility to compaction. The densities indicated in Table 10.1 are lower than might be expected and would probably be appreciably higher if thinning had continued into wet weather. The highest densities observed were 1-64 g/cc on major trails. Landings which occupy a very small percent o f the area were not included in the density measurement.
The stem wound figures indicate that there is not a large difference in percent o f trees with scars over nine square inches. The most im portant difference may be in the larger number of wounds close to
ground level following tractor thinning. The incidence of wound infection with serious wood rotting fungi is highly variable geographically. In portions of the Douglas-fir region even this level o f scarring may not lead to significant loss. In other areas and also in other species this would likely be cause for concern. W estern hemlock and Sitka spruce are generally much m ore susceptible to attack.
A t this point, it is not possible to predict what either the soil changes or stem wounds mean in loss in wood growth. The reaction of the stand thinned in this project to the thinning treatments, as well as soil and stem impacts, will be observed over time. In addition, we have undertaken a study in an attem pt to measure the effect o f increasing soil density on residual trees in Douglas-fir stands thinned five or m ore years ago. One hundred sample trees were selected which were uniform as possible in most respects except for the degree o f disturbance to the soil in their roo t zones. Four increment cores were taken from each tree to determine the response to basal area growth. G row th responses observed to date vary from 34% to 552% of their pre-thinning growth rate. Detailed measurements on the soil density in the upper rooting zone is still underway.
Additional research is needed to make it possible to predict, on both a tree and stand basis, just what specific growth losses occur from a given degree of soil, roo t o r bole impact. While most of us are interested in keeping any impact as low as possible, it appears that most efforts in this direction will increase thinning costs. We must be certain that any added costs will produce a true reduction in damage to soil and trees not only a reduction in the visible impact.
1-04 g/cc 1-04 g/cc 1 ■ 04 g/cc —
— 1-26 g/cc— 1-21 g/cc— 1-17 g/cc

A SP E C TS OF TH INN IN G 105
DISCUSSION
Fries: I think Figure 10.1 is an adm irable way of explaining some o f the correlation between factors but the fact that you have included not one factor but several on each access illustrates how complex this situation is. To take account of each of them would m ean a multi-dimensional figure. This means that the only way to study the problem is in some way factorial.
Froehlich: This diagram is a sort o f plea for future researchers to include these variables or to account for them in some fashion in reporting, such that one might be better able to translate it. It was very complex.
Fox: Is it correct to say that with the sky-line you had 78% of wounds occurring below 5 ft?
Froehlich: Yes. The location o f the wound means that the trees are obviously close to the extraction routes. Removing these trees at the next thinning means widening of the corridor rather than a selective thinning and consequently flexibility in future thinnings is greatly reduced.
Fries: In our project we have developed a device to measure the density of the soil. It is a kind of needle about 1 cm thick with which you penetrate the soil and record the pressure put on the device as well as
the degree of penetration. You then get a curve showing how the soil varies in density.
Froehlich: This is something like a penetrometer. We found that the stoniness of the ground we were working on made this very difficult but certainly with a uniform soil it would be highly desirable.
Kramer: How serious are the wounds in terms of economics?
Froehlich: The economic effect would be related to some wood quality loss in the stem but I visualise that in many cases healing would prevent serious effects. W ounds would become more important where they affected the highest quality peeler logs.
W. Sutton: In New Zealand we have found with Douglas fir and Pinus radiata that wounds in the upper part o f the tree are m ore im portant than those occurring at the base for two reasons. One is that the defects caused at the bottom of the stem tend to be lost in slabs. Secondly the tree appears to have a more active defensive mechanism in the lower half of the stem than in the upper part.
Froehlich: I think this depends on specific fungi, some of which are more prevalent in the lower regions of the stem, others in the upper regions.

P ap er 11
THE MACHINES ARE COMING, THE MACHINES ARE COMING
By H A RO LD E. Y O U N G School o f Forest Resources
University o f Maine Orono, Maine 04473 USA
IntroductionApproximately ten years ago an extremely hum orous American film was first shown publicly. It was “The Russians are Coming, the Russians are Coming” . I have quite obviously based the title o f this paper on the title of that film. There are more important reasons for doing so. In the film a Russian submarine with mechanical problems is forced to send a few men ashore on the New England coast of the USA. The local townspeople are certain that it is an invasion. A series of hum orous incidents lead to a confrontation which is forgotten as Americans and Russians join forces to rescue a child precariously hung on a church roof. Then the townspeople in an array of fishing and pleasure boats safely led the Russian submarine out to sea despite the ominous threat o f American military aircraft.
I see a parallel situation as forest harvesting machines are being developed for both thinning and harvesting purposes. There is already an outcry of damage to regeneration, increased soil erosion and deterioration of the site by removal of a greater am ount of the available nutrient supply from the forest ecosystem. The outcry, in my judgment, is possibly more an outrage against a highly mechanized system than justifiable cause for alarm about the forest ecosystem. I believe that as we learn to use the new types of machines we will learn how to protect the forest ecosystem. Eventually, as in the case o f the film, those who are now alarmed will staunchly defend the thinning and harvesting machines.
Forty years ago this fall I transferred to the University o f Maine as a second year forestry student. Almost immediately I became aware of silviculture treatm ents called thinnings that would permit professional foresters to control the quality and species composition of the forest crop. Virtually in the same breath the professor made it clear that particularly in younger stands that such thinnings were “pre-commercial” and therefore the costs could seldom be justified. This same philosophy was expressed as recently as the meeting of this Working Party in Nancy in June 1973. I had the temerity then to suggest that the development of proper machines and utilization of the material harvested could eliminate the “pre-commercial” notion from
our professional vocabulary. A t that time absolutely no consideration was given to my views.
I t is the purpose of this paper to briefly sketch historical developments in forestry, to present the case for the Complete Tree Concept and its most recent evolutionary developments and to present the case for thinning machines that are already here today and for those being developed.
Forestry HistoryEvidences of forestry practices go back to pre- biblical times with simplified regulation appearing in England nearly a thousand years ago. Serious national concern about an impending wood shortage in England is very evident in Sir John Evelyn’s m onum ental work, Sylva, which appeared in 1668. The establishment o f the forestry masters schools in Germany in the latter part o f the eighteenth century (Heske 1938), the forerunners o f the forestry schools, confirms national com mitm ent to widespread applications of forest management. It was only a short time later that C otta (1817) admonished the forester by writing “O ur foresters can still be divided into empiricists and scientists, rarely are both united” . Unfortunately his rem arks are as appropriate today as they were then.
For some, forestry begins with the seed and ends with the harvest. However for many, including the writer, forestry begins with the seed and extends to the public who consumes the m anufactured product and who uses the forest for clean air, clean water and recreation. Thus there are four dimensions of forestry: forest science, forest management, m anufacture and sale o f forest products and the social use of the forest. There is very little communication between these four dimensions of forestry. In fact an objective assessment shows that these four dimensions exist virtually independent of each other despite philosophic policy statements that imply a close working relationship between them. If Heinrich von C otta were alive today and preparing, let us say, the twentieth edition of his Silviculture I am confident that he would adm onish with great force and clarity the four dimensions of forestry, as he did the two dimensions 161 years ago, for failing to become intimate with each other for mutual benefit and the long-range survival o f our society.
106

ASP E C TS OF TH INN IN G 107
Even though some may decry the situation as I have depicted it none can deny the essence of my sketch. Forest scientists arm ed only with axes dem onstrated as much as two hundred years ago that by thinning, the density, species composition and quality o f the forest can be controlled. The practising forester has seldom been able to apply this because of the cost o f thinning and the absence of m arkets for the harvested material. Unfortunately the practising forester has kept away from both equipm ent developers and manufacturers. A t the same time m anufacturers have only used more of a usable species o r added species to the usable list when their supply was threatened. In other words the manufacturers have kept away from the foresters. A lthough I am obviously critical o f this mutual indifference, this system, if it can be called a system, did work reasonably well for a very long time. It is my contention that this system is totally inadequate for our small world with a m ore or less fixed forest base and a rapidly expanding human population.
The Complete Tree ConceptThe Complete Tree Concept (Young 1964) is: biological and technological investigation of the entire tree from the ro o t tips to the leaf hairs inclusive. W ith the inclusion of shrubs, successional species and seedlings and saplings of commercially used species this concept was extended into the Complete Forest Concept. Then it evolved into woody fibre production, production and use of vegetation on right-of-ways and m ore recently into the commercial use of thinnings, a topic which will be dealt with separately at the end of this section. W hen the Com plete Tree Concept came into focus the major products considered were boards, paper, paperboard, particleboard and fibreboard illustrating the m ajor solid and reconstituted uses of wood. This list has been expanded within the past five years to include wood, bark and leaves or needles as food for animal and hum an consumption, organic compounds, fuel for power plants, a prim ary source of ethanol and methanol and mulch on right-of-ways and gardens. To this imposing list o f uses o f forest products must be added at the very top the primary uses of forest ecosystems for m ankind which are clean air, clean water and recreation.
My publications have repeatedly stressed the importance of a continuous exchange o f information between the specialists constituting the four dimensions of forestry. I t is more than mutual benefit; it is m utual survival. Two illustrations will hopefully bring this salient point to the foreground. Shioga (1967) states that as a result of extensive and repeated forest fires plus very bad forest land practices, all of which took place more than a thousand years ago,
portions of China amounting to millions of acres are still barren wasteland. It not only could happen anywhere it could happen here. Kelly (1967) states that in 1962 a plant scientist and an agricultural engineer culminated ten years of plant and machine developm ent by producing a practical tom ato harvester. That could also happen in our forests. The first illustration demonstrates the irreparable damage that could result if our forests are destroyed by neglect and indifference. F or emphasis may I point out again that such a sad state o f affairs would not only reduce our supply of raw material for industrial products but would also reduce our supply of clean air, clean water and recreation. The second illustration demonstrates the optim um of cooperation between plant growers (may I remind you that a tree is merely a long lived plant) and technologists. A continuous flow of inform ation between forest scientists and managers and between engineers and marketing specialists is essential for the perpetual survival and health of our society. The lack of such cooperation can assure the downfall o f society as we know it today.
ThinningsThe puckerbrush pulping studies (Case et al. 1973) established that seedlings and saplings of hardwood commercial tree species as well as the non-commercial hardwood shrub and tree species can be used to produce usable pulp. In most instances pulp made from everything above ground (bark on stem and all o f the small branches) is mixed with hardwood chips without bark ranging from 10-50% puckerbrush depending on the quality of pulp being manufactured. This has already been extended by M orey (1974) as a technique for thinning less desirable species and defective trees in hardwood stands ranging from up to 60 feet in height that will eventually produce sawtimber. M orey has demonstrated that such thinnings provide an income to the landowner, provide a net profit to the operator of a M orbark Chiparvestor system and provide acceptable material for a hardwood pulpmill. It has been reported on a casual basis that similar thinnings have been conducted on softwood stands. To determine the yield and physical characteristics of thinning material in stands for seven softwood species and the biomass of thinning material that might be removed during the life of the stand a study was initiated in the summer of 1974 at the University o f Maine. Preliminary results are given in Table 11.1. Table 11.2 shows the range in stand density and biomass in representative plots o f natural softwood stands, mainly of spruce and fir. Smith (1974) has suggested that the biomass in thinnings over the life of the stand may equal the tonnage o f the merchant

108 F O R E ST R Y C O M M ISSIO N B U LL E TIN No. 55
able bole. Final results should be available by 1976.
Complete Tree UtilizationThe philosophy behind application o f the Complete Tree Concept is: use as much of the standing vegetation as possible to minimize waste consonant with the principles of forest ecology. This means that the forest ecosystem must not be allowed to deteriorate as a result o f harvesting by the prevention
of erosion and by fertilizing, when necessary, to maintain a reasonable nutrient supply.
A t the present time the harvesting industry uses such terms as “ whole tree, tree length, full tree and total tree” when they only m ean the above ground portion of the tree (Keays 1971 and Keays and H atton 1972). The implication o f these words to the general public is that the entire tree is harvested when in fact the above ground portion is only 75% of the
T able 11.1
P a r t ia l R esults of t h e P u l p in g P h ase o f th e S o ft w o o d T h in n in g s S t u d y
GREEN
Species PulpedPermanganate
Number
Pulp Yield (%)
Grams of Active Alkali Consumed
Per 100 Grams of MaterialTotal Acceptable Rejects
Norway Spruce WOOD 23-5 46-1 46-1 0 13-1„ „ Stem 30-4 42-0 39-8 2-2 14-5,, „ Top 36-2 32-8 29-0 3-8 160„ „ Whole 31-5 3 8 0 34-9 3-1 15-6
Red Pine Stem 22-6 40-9 40-1 0-8 14-6„ „ Top 22-6 29-3 28-8 0-5 15-5„ „ Whole 27-7 37-1 35-5 1-6 15-9
Eastern Larch Stem 30-7 40-4 38-3 2-1 15-6„ „ Top 35-6 33-2 29-5 3-7 16-3„ ,. Whole 30-3 40-1 35-5 3-6 15-7
Eastern Hemlock Stem 32-1 41-1 40-4 0-7 14-6„ „ Top 35-0 33-6 32-4 1-2 16-1„ „ Whole 32-7 38-3 37-5 0-8 14-8
White Cedar Stem 29-1 43-2 4 2 0 1-2 14-7„ „ Top 34-2 35-6 34-4 1-2 15-8„ „ Whole 33-4 40-6 39-6 1 0 15-9
White Pine Stem 29-5 42-4 40-6 1-8 16-3„ „ Top 35-5 2 9 0 27’6 1-4 17-0„ ,, Whole 28-5 38-5 35-4 3-1 15-9
Balsam Fir Stem 33-2 43-2 40-8 2-4 16-5„ „ Top 37-2 34-8 33-1 1-7 16-9„ „ Whole 34-8 35-6 33-8 1-8 16-2
D R Y
Norway Spruce Whole 31-7 39-3 34-8 4-5 15-4
Red Pine Whole 28-3 3 6 0 32-5 3-5 160
Eastern Larch Whole 31-6 40-7 35-5 5-2 16-1
White Cedar Whole 34-0 40-3 36-5 3-8 15-9
Eastern Hemlock Whole 32-4 41-7 39-9 1-8 15-2
While Pine Whole 28-1 38-6 36-5 2-1 15-2
Balsam Fir Whole 34-3 37-6 34-9 2-7 15-6
NOTES: 1. Stem is defined as wood and bark of the bole from the stump to the first live branch.2. Top is defined as wood, bark and needles from the first live branch to the tip.3. Whole is defined as wood, bark and needles proportionate to weight of stem and top.

Re
pr
es
en
ta
tiv
e
Plo
ts
S
ho
win
g
Ra
ng
e
in S
ta
nd
D
en
sit
y
an
d
Bio
ma
ss
on
th
e
Th
inn
ing
s
St
ud
ies
of
N
at
ur
al
S
of
tw
oo
d
THAT
AR
E PR
IMAR
ILY
SPRU
CE
AND
FlR
*
A SP E C TS O F TH INN IN G 109
Tota
l bi
omas
s -
abov
e an
d be
low
grou
nd
cubic
m
etre
eq
uiva
lent
s pe
r he
ctar
e Tot
al o n0O00 370
727
654
386
428
316
712
Stan
di
ngD
ead >/■) 89 38 § 43 27 5 1
Cut 308
297
422
253
238
136
356
Leav
e
576 00 392
192 06
163
136
356
Below
gr
ound
bi
omas
s cu
bic
met
re
equi
vale
nts
per
hect
are Tot
al
192 82 s 134 98 OOt-*
69
150
Stan
di
ngD
ead
- VO f- r- O n O n 1
Cut r- r-m 65 84 57 46 30 75
Leav
e
120 29 92 43 20 27 30 75
O u cd
V-, o o c E JSa 2 «-2 15 S
Tot
al
697
288
563
520
300
350
247
562
Stan
di
ngD
ead
52 mm 34 22 m 1
ID U ^! i s < 1 1 .
Cut 237
134
232
338
196
192
106
281
-O CT1 V
Leav
e
456
102
300
P 14
9 70 136
106
281
UiUw> Tot
al
3,02
2
5,34
6
7,43
9
11,6
24
17,0
00
19,7
50
32,5
00
90,0
00
terns
pe
r he
ctar
e :m
. (D
BH)
and
h
Stan
di
ngD
ead
232
2,09
2
1,86
0
2,32
5
6,00
0
5,00
0
7,50
0
1
Cut
ovo00
2,55
7
3,95
2
8,13
7
9,50
0
12,2
50
12,5
00
45,0
00
<N
Leav
e
930
697
1,62
7
1,16
2
1,50
0
2,50
0
12,5
00
45,0
00
Hei
ght
(met
res)
OO O n VO - o r- m
Age
(yea
rs) 09 § 75 57 55 27 24 m

110 F O R E S T R Y C O M M ISSIO N B U L L E T IN No. 55
Complete Tree. In other words for every three tons o r three cord equivalents rem oved by the most m odern harvesting machines, The M orbark Chip- arvestors, one to n o r one cord equivalent is left in the ground as the stum proot system.
The Chiparvestor type o f harvesters is a large mobile machine. A single operator controls a boom that places the entire stem and branch section of a tree on a platform near the chipper with the chips blown directly into a van a t the back side o f the machine. This machine can handle boles up to 20 inches in diameter and can average 120 tons of chips in an eight-hour day. The M orbark Industries Com pany has an assembly line completing one machine a day and may have as many as three assembly lines producing a machine a day o f different size classes within a year. It is likely that between 5 and 7% o f all chips for reconstituted products will come from such machines this year and it is very possible that such machines will produce as m uch as 60% of the chips for reconstituted products within ten years.
Koch (1974) has developed a successful prototype to sever the lateral roo ts and to remove the main taproot o f southern pines. It can be used in place of a feller-buncher o r it can be used where the boles have previously been harvested. A lthough untested to date for species with a diversified roo t system typical o f the central and north tem perate zones there are no obvious reasons why it should not work as well there.
It is already apparent that smaller self-propelled harvesters requiring only a single operator will shortly be in demand. These should be able to commercially clearcut puckerbrush on right-of-ways and other areas and to thin stands o f trees up to eight inches in diameter a t ground level. The Vecoplan Company, a G erm an firm, has developed a p ro to type that fulfils these requirem ents except for cutting the tree. It can pick up previously felled trees which are fed directly into a drum type chipper and then the chips go directly to a van. One or m ore companies in each of the Scandinavian countries is also experimenting along these lines. N o doubt we will eventually have a complete array of size classes of mobile and self-propelled harvesters to accommodate a wide variety of management objectives and terrain conditions. It appeals to common sense that large m anufacturers of farm, forestry and highway equipment are sensitive to this rapidly expanding market. N o doubt they are already developing and testing prototypes but will make no public announcements o f their achievements until their harvesters are available for sales and sales prom otion.
The Palleri Stumparvester (Hakkila and M akela 1973) was developed in Finland to be used in swamps
to reduce the stum p-root system to smaller pieces after removing it from a peat bog. Stone and earth are not a m ajor problem in swamp forests but will be a technical problem in order to commercially remove the stum p-root system of trees growing in soil. Koch reduced this problem by severing the lateral roots. Believing that such a problem can be solved is already going a long way towards solving such a problem.
One American and one Scandinavian firm are already interested in developing a Complete Tree harvester which will, by definition, include the stum p-root system. The first generation of Complete Tree harvesters m ost likely will appear before 1980 with, no doubt, an improved second generation within the next five years.
Ecologically sound forest management demands regeneration methods appropriate to each particular site. On right-of-ways and certain forest areas, coppicing, the development o f shoots from the stump, may be the preferred m ethod of regeneration. It would be foolish to remove the stum p-root system on such sites and it might be equally true on steep hillsides covered with fragile soils. In sharp contrast to such situations would be portions of the southeast where the present practice is to remove and burn the stum p-root system before planting. There the use of the stum p-root system could convert a sizable cost into a profit.
It must be pointed out that increased mechanization will:
(a) reduce the forest work force.(b) require machine operators of greater skill and
increased training.(c) change from piece rate to hourly rate with
bonus.(d) move in the direction of year-round employ
ment with increased benefits to employee.(e) increased value of employees with increased
years o f service.
Complete Tree Biological StudiesIn the past ten years there has been an exponential increase in the num ber of biomass and nutrient studies that have been published. As an illustration of this, there were eight papers presented in a Symposium on Primary Productivity and Mineral Cycling in N atural Ecosystems in 1967,16 papers on Forest Biomass Studies were presented at the IU FR O Congress in 1971 and there were 39 papers presented in IU FR O Biomass Studies in 1973. These attest not only to the num ber of studies in the techniques of conducting biomass and nutrient studies but also are indicative of the application of these measures to assess biological processes in trees.
There are more individual biological studies in

A SP E C TS OF TH IN N IN G 111
progress than individual technological studies of processes and harvesting equipment within the Com plete Tree Concept. The reason is quite simple. There are m ore biological research centres comprising a much greater scientific staff than there are in the staffs of a fewer number of technological centres. The effectiveness of the latter group is so strong that one must assume that the two halves of the concept are progressing at about the same rate.
Integrated StudiesMuch, but fortunately not all, o f the effort referred to in the two previous sections has been entirely industrially oriented or entirely biologically oriented. Those studies are not complying with the spirit of the Complete Tree Concept in which a constant exchange of inform ation within the biological half and within the technological half as well as between the two halves. The importance o f exchanging inform ation between the two halves cannot be over emphasized.
A n integrated study, as I define one, is a combination of biology and technology in the planning phase, experimental phase and writing phase. These studies should involve forest scientists and forest technologists who are interested in obtaining new inform ation and who then are concerned with industrial applications. Some of the most staunch supporters of this approach are: Keays and his associates in the Canadian Forestry Service; Hakkila and his associates in the Finnish Forest Research Institute; Steinbeck and his associates in Georgia; Auchter, K och and associates in the U.S. Forest Service; Benson, Einspahr and associates of the Institute of Paper Chemistry; and Young, Chase and associates in Maine. Their studies have been characterized by interest in the biomass and technological potential o f shrubs and trees; above ground in all cases and below ground in some.
Summary and ForecastIn the past ten years there have been a number of
separate biological, technological and integrated studies within the Complete Tree Concept. These have yielded so m uch inform ation on the total availability in the standing forest and the possibilities of using bark, branches and leaves o r needles and the stum p-root system that commercial applications already exist a t a num ber of mills manufacturing a variety of reconstituted products. Harvesting machines, such as the M orbark Total Tree Chiparvestor, are being used for above ground portion of trees and the Palleri Stumparvester has been developed to utilize the stum p-root system in swamps. Smaller self-propelled harvesting machines are on the drawing boards in equipment companies in several countries. This portends a future with harvesting machines ranging in size from one man-one machine system to large machines in a multi-machine system for clearcutting to thinning under terrain conditions ranging from steep rocky slopes to swamps.
The future is both challenging and exciting. We must learn the upper limits of dry m atter production for forests by region and site conditions. Even with the most advanced forest management that will include fertilization and genetics, there will be forest production limits. W hen these limits are established, it will be essential for hum an society to restrict its appetite for growth and development accordingly if hum an society is to continue with present living standards. In addition to a variety of forest products, our forests provide much of our clean air, clean water and recreation. Harvesting systems must be developed that will minimize if not eliminate damage to the forest ecosystem in order to m aintain the nutrient vitality. To accomplish this trem endous undertaking, we must expand integrated research and the application of such research within the Com plete Tree Concept. This must be a fact rather than a dream by the end o f the century and as an incurable optimist I really think it will be.
112 FO RESTR Y C O M M ISSIO N B U L L E T IN No. 55
LITER A TU RE CITED
A u c h t e r , R. J. ( 1 9 7 2 ) . Pulping w it h o u t barking increases fiber yield. Pulp and Paper. June. p. 46.
B e n s o n , M. K. a n d E i n s p a h r , D. W. (1972). Yields from 18 year-old aspen via total tree harvesting. Genetics and Physiology N otes No. 14. Institute o f Paper Chemistry, Wisconsin.
C h a s e , A. J., H y l a n d , F. a n d Y o u n g , H . E. (1973). The commercial potential o f puckerbrush pulp. Tech. Bui. 65. Life Sciences and Agr. Exp. Sta., University o f Maine.
C o t t a , H. (1817). Anweisung zum W aldbau 1st ed. preface translated in Forestry Quarterly. 1 :3-5.
E v e l y n , J. (1670). Sylva 2nd ed. p. 245.
Heske, F. (1938). German Forestry. Yale University Press New Haven, Conn. p. 342.
H a k k i l a , P. (1971). Branches, stumps and roots as a future raw material source in Finland. In Forest Biomass Studies (H. Young, ed.). p. 51-62.
H a k k i l a , P. a n d M a k e l a , M . (1 9 7 3 ) . Harvesting of stum p and roo t wood by the Palleri Stump- arvester. Com. Inst. Forest. Fenniae. 7 7 .5 .
K e a y s , J. L. (1971). Complete tree utilization - An analysis o f the literature information reports VP-C-69, 70, 71, 77, 79. W estern Forest Products Laboratory, Vancouver, B.C., Canada.
K e a y s , J. L. a n d H a t t o n , J. V. (1972). Complete Tree utilization studies. H. The yield and quality of kraft pulp from the com ponents o f Piceaglauca. Tappi. 54(10)1721.
K e l l y , C. F. (1967). Mechanical harvesting. Scientific American. 217:50-59.
K o c h , P. (1974). W hole-tree harvesting of pines with taproot attached. Southern Lumberman. 228:13-14.
M o r e y , H. (1974). Personal communication.
S h io g a , T. (1967). A short history of forestry and forestry research in eastern Asia. In International Forestry Review Vol. 2:1-36. Rom berger and Mikola, ed.
S m it h , D. M. (1974). Impact o f forest management practices. In a symposium on availability of residuals to be published by American Institute of Chemical Engineers; 1974 national meeting in Pittsburgh.
S t e in b e c k , K. a n d M a y , J. T. (1971). Productivity o f very young Plantanus occidentalis. In Forest Biomass Studies, p. 152-164. H. Young, ed.
Y o u n g , H. E. (1964). The Complete Tree concept - a challenge and an opportunity. Proc. Soc. Amer. For. p. 231-233.
-------------. (1967). Symposium on primary productivity and mineral cycling in natural ecosystems.H. Young, ed. University of Maine Press.
-------------. (1971). Forest Biomass Studies (workingparty on forest biomass of Section 25, IUFRO).H. Young, ed. University of Maine Press.
-------------. (1973). IUFRO Biomass Studies (Workingparty on forest biomass o f IUFRO ). H. Young, ed. University of Maine Press.

A SP E C TS O F TH INN IN G 113
DISCUSSION
Van Laar: Is it necessary to increase fertilisation because the whole tree is utilised ?
Young: I am m ore interested in the nutrient cycle, but obviously the m ore of the tree you use the m ore nutrient you take from the forest. I don’t know any place in the world where we really have a good assessment o f the available nutrient pool in a given locality. There have been studies in Europe and some that I am undertaking suggesting that about half the nutrient requirements come from rain. In fact, if we never cut a tree m ore nutrients will flow into the sea every year than are tied up in the biomass. Certainly we may have to add to the nutrient pool but there are other things which are worthy of even greater concern than the loss of nutrient.
Fries: I recall a trial in northern Sweden where in a clear felled area branches were removed from half the area but left in the other half. The area was restocked with spruce. In the sixth year after planting the area on which the branches had been left showed a substantially greater height increment than in the
remaining area. This does not necessarily mean that we should try to retain branches but we should encourage research into this field. In this case it might not have been the effect o f nutrients but perhaps a mulching effect that accounted for the difference in heights.
Bredberg: A series o f experiments in Sweden show that it is probably less o f a danger on the very best soils but the loss o f nutrients is m ore a problem of the poor sites. This means that on the best sites for both technical and biological reasons whole tree utilisation could be employed. This is one o f the few cases where technical biological and economic requirements all fit together.
W. Sutton: I am all for maximum utilisation and while maximum volume production is important, quality is no less im portant. If the bottom half of the tree is worth 30 times as much as the roots or the leaves it is better that we should try to obtain more of that part, even if it means a loss somewhere else in the tree.

P aper 12
DIE DURCHFORSTUNGSTECHNIK ALS MITTEL UND PROBLEM EINER PFLEGLICHEN WALDBEWIRTSCHAFTUNG
erortert am Beispiel der FichteVon S. HABERLE*
Institut fu r Waldarbeit und Forstmachinenkunde der Universitdt Gottingen
Gegenstand meiner Ausfuhrungen ist die “Durch- forstungstechnik” . D arunter verstehe ich die A rt der waldbaulichen Bestandesbehandlung ebenso wie “Technik” im Sinne von “Technologie” oder “Arbeitsverfahren” .
Als K oordinaten der Durchforstungstechnik fun- gieren drei Zielspharen:Die Sphare 1 wird bestimmt durch das Globalziel,
im Um triebsalter volbestockte Flachen mog- lichst wertvollen und stark dimensionierten Holzes zu haben.Bei der D urchforstung schauen wir unter solchem Blickwinkel allein au f den verblei- benden Bestand, und zwar sollen hier die DurchforstungsmaBnahmen im einzelnen.(a) die Q ualitat des Bestandes erhohen und(b) den verbleibenden Baumen m ehr Wuchs-
raum verschaffen.D ie Zielsetzungen der Sphare 1 sind langfris- tiger N atur. In der Prioritatenliste rangieren sie vor alien andern.
Die Sphare 2 umfaBt die Problem atik der Feiner- schlieBung, d.h. der Anlage geeigneter Orient- ierungs-, Geh- und Fahrschneisen.Ohne ErschlieBungsnetz bleibt ein Bestand gerade im friihen Stangenholzalter, wo die entscheidenden Weichen fur Pflegeeffekte gestellt werden, unzuganglich.Die Pflegeeingriffe selbst bestehen darin, daB man den verbleibenden von der K onkurrenz des ausscheidenden Bestandes befreit; zum letzteren gehort auch das Holz, das au f den Schneisen direkt anfallt.Diese Wechselbeziehungen bewirken, daB die Sphare 2 sowohl den verbleibenden als auch den ausscheidenden Bestand angeht. Ihre Zielsetzungen sind mittel bis kurzfristig, denn man kann unterstellen, daB eine heute angelegte FeinerschlieBung spatestens in 2 bis 3 Jahrzehnten, groBenteils aber auch schon mit einem einzigen Pflegeeingriff ihre Funktionen erfullt hat.
Die Sphare 3 betrifft die technische Ausfiihrung der vorgesehenen Durchforstungsma Bnahmen. Hier verfolgen wir das Ziel, den ausscheidenden Bestand mit Hilfe okonomisch optimaler
Arbeitsverfahren und ggf. Sortierungs m cdali taten zu ernten oder doch abzutoten.Die Optimierungsiiberlegungen, die m an dafiir anstellt, miissen in jedem Fall halt machen vor den langfristigen und mittelfristigen Schranken, die durch die Ziele der Spharen 1 und 2 gesetzt sind.
Die Ubersichten 1-3 (Tabelle 12.1) zeigen nun den Versuch, die vorgenannten Grundsatze des Durch- forstens in abgestimmter Sequenz vom jungen Stangenholz bis zum alteren Pflegebestand in konkrete Vorschlage umzusetzen. Die Darstellung beschrankt sich au f “ befahrbare Lagen” , worunter die Ebene und Hange bis 40% Neigung verstanden werden. Sie beschrankt sich ferner auf die Arbeits- phasen im Bestand.
Die Obersichten sind so eingeteilt, daB die Iang- und mittelfristigen Funktionen der Durchforstung die waagerechte Gliederung liefern, wahrend die Haupteinteilung in der Senkrechten nach der kurzfristigen okonomischen Oberlegung getrofTen wurde, ob das Aufarbeiten des ausscheidenden Bestandes mehr einbringt als kostet (Kategorie A) oder ob es defizitar ist (Kategorie B). Bei Kategorie B wird fur die Entscheidungsbildung noch weiter difTerenziert, ob Kaferbefall droht oder nicht.
Befassen wir uns zunachst mit Ubersicht 1, Kategorie A :
Die BestandeserschlieBung geschieht hier durch 4-5 m breite Gassen, die u.a. zum Befahren mit GroBmaschinen geeignet sind.
D er A bstand 20 m von Gassenmitte zu Gassen- m itte erscheint forstschutztechnisch und ertragskund- lich verantw ortbar, sofern keine besondere Schnee- druck- oder Sturmdisposition vorliegt. - Die ver- wertbare Gassendurchforstungsmasse betragt 25-35 EFm oR je ha.
Um die Gassen rationell herstellen zu konnen, entwickeln wir zur Zeit eine Holzerntemaschine. Auftraggeber ist die nordrhein-westfalische Landes- forstverwaltung, bei der ich mich fiir ihre Hilfe und Aufgeschlossenheit zu bedanken habe. Die Kon- struktion erfolgt in Zusam menarbeit zwischen dem Institut fiir W aldarbeit und Forstmaschinenkunde
•P ap e r presented by J. S tra tm ann
114

A SP E C TS OF TH IN N IN G 115

116 F O R E ST R Y C O M M ISSIO N B U LL E TIN No. 55

A SP E C TS OF THINN IN G 117

118 FO RESTRY COM M ISSION BULLETIN No. 55
der Universitat Gottingen und einigen Industrie- firmen.
Die Maschine wird von einem M ann bedient. Sie kann fallen, entasten, abzopfen und im Endstadium Rohschafte bis 15 m Lange oder wahlweise 2 m Standardlangen einschneiden, sammeln und ablegen.
Die Forderungen der Boden- und Bestandes- pfleglichkeit haben die Eigenschaften unseres Vollernters stark beeinfluBt; ich darf dies kurz begriinden:
1. D as Astreisig und die Kronenenden werden beim EntastungsprozeB vor dem Fahrzeug aus- gebreitet. Es entsteht also au f der Riickegasse ein Teppich, der die Wurzeln der Randbaum e beim O berfahren schiitzt.
2. Die lang ausgehaltenen Holzer laufen nach dem Entasten hinter der Maschine in die freie Gasse hinein. Dadurch wollen wir Rindenver- letzungen an den W urzelanlaufen und Erd- stiicken der Randstam m e vorbeugen.
3. Die Maschine besitzt ein Raupenfahrwerk. Dieses gewahrleistet(a) geringen Bodendruck und also i.V. m it der
Reisigauflage besonders gute Wurzel- schonung
(b) eine relativ geringe Hohe des Gesamt- fahrzeugs, so daB die A ufbauten bei Bodenunebenheiten und entsprechenden Kippbewegungen die Stamme und Kronen der Randbaum e moglichst wenig bescha- digen.
W eitere Vorteile hat das Kettenfahrzeug durch seine Gelandegangigkeit und den niedrigen Schwerpunkt, der Abstutzungen entbehrlich macht. Gewisse Schwierigkeiten verursacht das Umsetzen iiber groBere Distanzen und ins- besondere offentliche StraBen. M an darf diesen Gesichtspunkt aber nicht iiberbewerten. Der RationalisierungsefFekt eines Vollernters beruht namlich au f der Integration mehrerer Bearbeit- ungsgange und gar nicht so sehr au f hohen M engenleistungen; wir konnen einen Flachen- verzehr von 1-1,5 ha pro Tag unterstellen und brauchen also nicht zu befiirchten, vom Umsetzen organisatorisch erdriickt zu werden, selbst wenn m an Tieflader benotigt. Abgesehen davon ist es natiirlich in der Raupengestaltung auch noch nicht aller Tage Abend.
Die maschinelle Vollernte spielt sich allein au der Gassenflache ab. Zu diinne Baumchen werden umgedriickt und bleiben liegen. Seitliche Eingriffe entfallen, denn die Such- und Schwenkbewegungen des Fallkrans wiirden dabei zu lange dauem und zu viel kosten. D as haben schon die Simulationen mit unserem ersten Funktionsmodell gezeigt.
Auf den Streifen zwischen den Gassen erscheinen
selektive Entnahm en m it konventioneller Ausfor- m ung von 2 m - Standardlangen am Stock und manuellem Vorliefern optimal. Die verwertbare Erntemasse mag 30 EFm oR je ha betragen. Zu diinne, nicht kostendeckend nutzbare Baumchen bleiben auf den Zwischenstreifen unbehandelt stehen und sterben allmahlich von selbst ab. Bis dahin bremsen sie die starkeren Baume beim Aussch- wingen in der Windbewegung und vermindern so die Sturmwurfgefahr. - Ein besonderer Vorteil der Kurzholz-M ethode ist ihr bestandesschonender Arbeitsablauf. E r gestattet es, jiingere Stangen- holzer auch im Sommer zu durchforsten, was die betriebliche Disposition auBerordentlich erleichtert.
Fiir Gassen und Streifen zusammen werden rund 60 EFm oR je ha in einem Durchgang entnommen. Diese Masse bedeutet etwa ein Viertel des Vorrats und liegt nach Ansicht kom petenter Ertragskundler noch im Unbedenklichkeitsrahmen; andererseits bildet sie aber fur die Auslastung der beteiligten G ro Bmaschinen auch bereits eine giinstige GroBen- ordnung.
In der Obersicht fehlt die Variante, daB die Gasse neben der ErschlieBung auch die Standraumerweite- rung fur den verbleibenden Bestand voll bewerk- stelligt. Diese Zielkombination wiirde voraussetzen, daB m an die Gassenabstande - vom M itte zu M itte - au f etwa 10 bis 12 m verkurzt. So vorzugehen, kame zwar der Wirtschaftlichkeit unseres Vollernters zugute und erscheint m ir in Jungdurchforstungen auch waldbaulich durchaus denkbar, es fehlen aber ausreichende Erfahrungen, um dazu heute schon ein fundiertes Urteil abgeben zu konnen. - W ir haben allerdings im Raum Gottingen zusammen m it der Niedersachsischen Forstlichen Versuchsanstalt der- artige Versuchsflachen eingerichtet, um die not- wendigen Langzeitbeobachtungen anzustellen.
Werfen wir nun einen Blick auf die Kategorie B, die als kurzfristiges Ziel eine Verlustminimierung beim momentanen Durchforstungseingriff verfolgt.
Besteht keine Kafergefahr, so wird man hier nach dem erfolgreichen Vorgang, den Prof. K R A M ER im Forstam t Hardegsen geschaffen hat, die Gassen mit Hilfe schwerer Raupen herstellen, die das aufstok- kende H olz einfach niederwalzen.-In den Zwischenstreifen gilt es, die Bedranger der Z-Stamme moglichst billig auszuschalten, was zweckmaBiger- weise m it der von Dr. STERZIK entwickelten Pflegepatrone geschieht. Sie einzuschlagen, dauert kaum langer als das Anbringen eines Schalms. Die MaBnahme laBt sich also im gleichen Zuge mit der Z-Stamm-Auswahl durch den Betriebsbeamten selbst erledigen. - Ubrirrens schlieBen sich mecha- nische Eingriffe und Pflegepatrone nicht aus, sondem m an kann selbstverstandlich beide Techniken in ein und demselben Bestand nach dieser oder jener

A SP E C TS OF TH INN IN G 119
Oberlegung verkniipfen. D arin sehe ich sogar kiinftig einen Haupteffekt der Patrone.
In Sp. 6 der Obersicht 1 tritt die Reihendurchfor- stung auf. Sie ist den bisher besprochenen Alter- nativen im allgemeinen technisch und wirtschaftlich unterlegen. Andererseits gibt es aber doch spezifische Zielsetzungen, die man durch reihenweise Ent- nahm en optim al verwirklichen kann, so zum Beispiel, wenn m it geringstmoglichem Verwaltungs- aufwand Selbstwerber eingesetzt werden sollen oder wenn es unter Verzicht auf eine Holzverwertung darum geht, jiingere Stangenholzer zu erschlieBen, zur Wuchsraumerweiterung aufzulockem und ggf. die entnommenen Baume aus Forstschutzgriinden auBerhalb des Bestandes zu verbrennen.
D am it komme ich zu Ubersicht 2, also zu den DurchforstungsmaBnahmen im Bestandesalter 35 bis 50.
Auch hier dient unser Vollernter, wenn noch kein ErschlieBungsnetz vorhanden ist, zur Herstellung der Gassen, nur muB m an deren Abstande jetzt wegen der hoheren Baume und damit auch hoheren Sturmgefahr etwas erweitern.
D ie Sortimentierung wird m it zunehmendem Bestandesalter zu groBeren Langen tendieren. Eine Generalempfehlung ist aber nicht moglich. D ie konkrete Sortierentscheidung miissen die Preis- Kosten-Relationen und die ortlichen Aspekte der Marktpflege bringen, die im Zeitpunkt des Hiebs gelten.
U m das Vorriicken langer Schwachholzer zu erleichtern, dienen tragbare oder schleppermontierte Kleinseilwinden mit Funkfemsteuerung. Sie sind bei guter Arbeitsorganisation einigermaBen wirtschaftlich und arbeiten, da der Holzhauer den laufenden Stamm begleitet, recht bestandesschonend.
F iir Reihendurchforstungen ist es im Bestandes- A lter 35-50 meist zu spat. M an wird also, wenn Kafergefahr droht, tro tz mom entan erhohter Ver- luste nicht umhin konnen, den Durchforstungsein- griff rein mechanisch zu gestalten und das anfallende Holz auch aufzuarbeiten.
D en dritten Sektor des Durchforstungsbereichs - dem die Ubersicht 3 entspricht - bilden die alteren Stangenholzer und Baumholzer zwischen 50 und 80 Jahren. Als giinstigste Erntetechnik konnen wir hier das SERIAS-System bezeichnen, jedenfalls fur Baume iiber BH D 25. Verfahrens- und Kosten- details sind in der Fachliteratur ausfuhrlich be- schrieben. - U nterhalb BHD 25 werden am besten unentrindete Langholzer oder Rohschafte ausge- halten, evtl. auch Industrieholz 2 m lang. Fichten- bestande zwischen 50 und 80 Jahren stehen im allgemeinen schon so locker, daB Rtickegassen dort, wo sie fehlen, leicht durch den Auszug relativ weniger Stamme freigehauen werden kbnnen. D er
weit iiberwiegende Anteil der Erntemasse entfallt au f selektive Entnahm en zugunsten der Zukunfts- baume. - Hinsichtlich der Reihendurchforstung gilt das, was ich bereits zu Obersicht 2 ausgefiihrt habe.
Die Obersichten 1-3 sind dam it zu Ende be- sprochen.
Eiene Diskussion der Durchforstungsprobleme bliebe jedoch allzu unvollstandig, wenn nicht zumindest noch zwei Fragenkreise mit angerissen wurden, nam lich als K ontaktpunkt zur Zielsphare 1 die W ertastung und als K ontaktpunkt zu den Ziel- spharen 2 und 3 das Riicken.
Astreines Fichtenstarkholz liefert nach ein- schlagigen Erfahrungen die 1,5 bis 2 fachen Verk- aufserlose der Massenware. Alle Prognosen deuten darauf hin, daB diese Relation in Zukunft eher weiter als enger wird. - W ir sollten deshalb die starken Auslesedurchforstungen, wie sie den Obersichten 1-3 entsprechen, und bei denen m an ja sowieso die Z-Stamme sehr gewissenhaft auswahlen muB, kiinftig vermehrt mit W ertastungen koppeln. Sie in Angriff zu nehmen, empfiehlt sich bei der Fichte, wenn die Brusthohendurchmesser der Z-Stamme 10 bis 15 cm erreicht haben.
Die Arbeitstechnik ist fur Hochastungen gut gelost, denn dafiir gibt es die SACHS-Klettersage KS 31; arbeitstechnisch eher problematisch er- scheinen noch die untersten 5-6 m am Stamm, da hier m it hohen ergonomischen Belastungen manuell geastet wird, und die Produktivitat vergleichsweise gering ist. - Wir hoffen jedoch, der Praxis in Balde ein geeignetes Maschinenwerkzeug fur Astungshohen bis 5 m vorstellen zu konnen.
N un zum Riickeproblem :D as Riicken schlieBt sich an die Bereitstellungs-
stadien des Rohholzes an, mit denen die Obersichten 1-3 enden. Es bildet eine untrennbare Erganzung zu den dort aufgezeigten Arbeitsverfahren und kann weder unter dem Aspekt der Boden- und Bestandes- schonung, noch bei kurzfristigen Wirtschaftlichkeits- uberlegungen unbeachtet bleiben.
Kurzholz riicken wir aus Durchforstungsbestanden am besten mit Forwardern oder Kranriickeziigen heraus. Sie befordern 10-15 Rm in einer Fuhre. Das ergibt in Verbindung mit dem erheblichen Eigenge- wicht besonders hohe Bodendrucke, die auf wenig tragfahigen Boden zum Einbrechen fiihren konnen. Andererseits ist die groBe Ladekapazitat aber auch wieder ein Vorteil, denn sie reduziert den Schlupf und bewirkt, daB jede Riickegasse meist nur ein Mai mit Last befahren werden muB.
Abgesehen davon pflegen in den Riickegassen, besonders bei Ersteingriffen, beachtliche Reisigmen- gen aufzuliegen, die eine ausgezeichnete Schutz- und Trageschicht liefem.
Die Forw arder und Kranruckezuge sind ein-

120 F O R E S T R Y C O M M ISSIO N B U LL E TIN No. 55
m annbedient. Bei guter Auslastung riicken sie im Schwachholzbereich konkurrenzlos billig. Technisch und organisatorisch ist ihr Einsatz in Verbindung mit der 2 m - A ushaltung bestens erprobt und zwar nicht nur in Schweden als Standardverfahren, son- dern auch in der Bundesrepublik. Ich erwahne die richtungsweisenden Bemiihungen des Graflich Ko- nigsegg’schen Forstam ts Konigseggwald schon zu Beginn der 60er Jahre und 10 Jahre spater den GroBversuch des Instituts fur W aldarbeit und Forstm aschinenkunde in der Kiefer der Liineburger Heide.
Lange Holzer rticken wir gewohnlich mit Seil- windenschleppern. Sie milssen jede Riickegasse mehrfach befahren, da ihre Lasten pro F ahrt bei kleinen Stiickmassen einen Festm eter selten iiber- steigen, wohl aber oft darunter liegen. H angt man wesentlich gro Bere Mengen an, so erhohen sich durch das Auseinanderfachern der Last die Schaden an den stehenden Stammen progressiv, wie iiberhaupt die Schadwirkungen des Langriickens fiir den verblei- benden Bestand die des Kurzriickens eindeutig iiber- treffen. Ich verweise dazu auf die Untersuchungen, die BACKHAUS in der Buche angestellt hat. Auf- grund dieser Zusammenhange kommt das Rticken mit Seilwinden-Schleppern je Masseneinheit im Schwachholz sehr viel teurer als das Riicken mit Forwardern. M an kann also die Vergleichskosten- vorteile, die die Langaushaltung am Stock gegeniiber dem Kurzholz dank geringerer Arbeiterzeiten erbringt, leicht beim Rucken sowie beim spateren Sortieren und Einschneiden oder - wenn man
Rohschafte verkauft - auch beim Holzpreis wieder verlieren.
Ober die Leistungsmoglichkeiten und Kosten hoher mechanisierter Schleifriickefahrzeuge wie Klem mbank- oder Grapple-Skidder wissen wir unter Verhaltnissen, die au f unsere Durchforstungen passen, noch nicht viel. Es wird eine wichtige Auf- gabe der naheren Zukunft sein, fiir diese Technolo- gien brauchbare Indizes zu erarbeiten.
D am it komme ich zum SchluB meiner Ausfiih- rungen. Ihr Zweck war, die wesentlichen Grundsatze aufzuzeigen, die uns bei unseren Versuchen geleitet haben. V orallem gingesm irdarum , zu verdeutlichen, daB hier nicht nur punktuell vorgegangen wurde, sondern im Rahmen eines abgestimmten. technischen Konzepts, das sich iiber den Gesamtbereich der F ichtendurchforstung erstreckt und speziell auf die Mechanisierung der Holzerntearbeiten im Bestand abzielt. Diese Blickrichtung ist insofern einigerma Ben originell, als m an sie zugunsten der Propaganda fiir Holzhofe und fur mobile Mechanisierungslosungen an WaldstraBen und Aufarbeitungsplatzen jeden- falls in der Bundesrepublik Deutschland allzulang vernachlassigt hat.
Mit dem Vollernter am Anfang, dem SERIAS- System am Ende und der Pflegepatrone als ultima ratio der Durchforstungsphase besitzen wir nun ein Geriist, das selbstverstandlich im einzelnen fort- wahrend mit aktuellen Verfahrensbausteinen gefiillt und auch nach auBen erganzt werden muB, das aber an sich schon ohne Zweifel eine neue Epoche unserer Durchforstungstechnik verkorpert.

A SP E C TS OF TH INN IN G 121
LITER ATU R
A b e t z , P. Z u t Bestandesbegriindung und Jung- bestandspflege in Fichte. Der Forst- und Holzwirt 1966, S. 77-88.
A b e t z , P. D er W ald und die Forsttechnik. Der Forst- und Holzwirt N r. 15/1973.
B a c k h a u s , G. Leistungs- und Kostenvergleich zwi- schen Pferd, R adiotir und D rabant beim Vor- riicken von Laubindustrieholz in langer Form . Holz-Zentralblatt N r. 69/1970.
B a c k h a u s , G. Rationelle Schwachholzbringung und Bestandespfleglichkeit-ein Gegensatz ? Forsttechn. Informationen N r. 3/1972.
H a b er l e , S. u . R a u s c h , E. Das Riicken schwacher Langholzer mit Schlepper und funkferngesteuerter Kleinseilwinde. Forsttechn. Informationen Nr. 4/1970.
H a b e r l e , S. Mechanisierte Kiefernschwachholzernte in der Luneburger Heide - Modell und Realitat - (Vortrag anlaBI. d. Forstl. Hochschulwoche 1971 in Gottingen). Forsttechn. Informationen N r. 10/ 1971.
H a b er l e , S. Die Stehendbearbeitung von Durchfor- stungsholzern der Fichte im Systemvergleich. Allgem. Forstzeitschrift N r. 28/1973.
H a b er l e , S. Wie bietet sich das SERIAS-System bei differenzierterer Betrachtung dar? Allgem. Forstzeitschrift N r. 5/1974
H a b e r l e , S. Ist die Stehendentastung und -ent- rindung eine wirtschaftliche Alternative zur Werks- entrindung? Holz-Zentralblatt vom 6.2.1974.
H o fle , H. H. Holzaufarbeitung m it stationaren Einrichtungen. Vortrag anlaBlich der Fachtagung IN TER FO R ST 1974 in Miinchen.
H o h e n l o h e -W a l d e n b u r g , K a r l P r in z z u u . B u r g m a n n , P . D as Konigseggwalder Holzemte- Verfahren und seine Auswirkungen au f Masse, Leistung und Ertrag. Allgem. Forstzeitschrift N r 18/1966.
K r a m e r , H. u . K e u f f e l , W . Gassendurchforstung. Allgem. Forstzeitschrift N r 7/1974.
M a l m b e r g , C. E. Holzaufarbeitung mit mobilen Einrichtungen. Vortrag anlaBlich der Fachtagung IN TER FO R ST 1974 in Munchen.
S t e r z ik , H. K. Zur Anwendung der drahtlosen Fernsteuerung bei der Holzbringung. Forsttechn. Informationen N r 2/1971.
S t e r z ik , H. K. Systeme der Hochmechanisierung bei der Schwachholzernte. (Vortrag anlaBlich der Forstl. Hochschulwoche 1971 in Gottingen). Forsttechn. Informationen N r 10/1971.
St e r z ik , H. K. Zur mechanisierten A uf bereitung des Rohholzes am Fallort. Holz-Zentralblatt vom 14.6.1974.

122 F O R E S T R Y C O M M ISSIO N B U LL E TIN No. 55
DISCUSSION
Busby: Y ou suggest in the final paragraph of your summary (Page 9) that “ for the long term aim in a cultivated forest demands thinning operations independent o f the price/cost situation operating at that tim e” . I wonder how you can justify this in term s of allocation of resources. Y ou seem to be avoiding economics altogether.
Stratmann: We regard a thinning which costs us more than the revenue we obtain from it as an investment. Of course, we have to consider the whole ro tation and we are concerned with increasing the revenue obtained from the final crop.
Busby: If the cost of removing these thinnings is, in terms of net present value, greater than the extra revenue from your felling surely this is not a correct allocation of your resources.
Stratmann: I would agree with you if we considered com pound interest but our principle is to maximise the annual forest rent. We use the whole forest as a production unit and com pare our costs and revenues for a single year.
Busby: I think nonetheless that there is a cost of
capital in the sense that there are alternative uses which you can m ake o f capital and therefore you must, in fact, use com pound interest.
Kramer: I th ink the question you are asking is one o f forest policy. In Germany and A ustria the m ethod o f financial appraisal differs from those in certain other countries.
Rowan: I think this particular question is extremely difficult to answer. There are many different attitudes adopted by different countries according to whether they have got the forest given to them by G od in the first instance or whether, as in Britain, we have to help the G ood Lord along.
Fries: Regarding machines which climb, delimb and debark, it is my impression that the time is past for such machines in view of the fact that they m ust be carried from tree to tree.
Stratmann: We are trying at the moment to use a small tractor for carrying the machines from tree to tree because undoubtedly the main drawback of these machines is that they have to be transported in the stand by hand.

P aper 13
THINNING; THE STATE OF THE ART IN THE PACIFIC NORTHWEST
by B. D . E. A U LER IC H Oregon State University, Corvallis, Oregon, USA
Commercial thinning in Douglas-fir (Pseudotsuga menziesii) is finally coming into its own in the Pacific Northwest (Oregon, Washington, and British Columbia). This type o f intensive forest management has been a long time in coming and is welcomed by bo th forester and logger. But there are some m ajor obstacles to overcome before commercial thinning is really a viable part o f the total wood supply system.
The availability o f stands in need of thinning is abundant as is the m arket for these thinnings. In western W ashington and Oregon there are nearly 3-3 million acres (1-3 million hectares) o f Douglas- fir forests between 20 and 70 years old. The estimated volume is 38 billion board feet (269 million cubic metres). The activities necessary to bridge the gap between stand and mill will be the subject o f this paper. This area of operation is the m ajor problem facing the industry. How do we economically harvest stands which are located on steep ground, in high rainfall areas, and with woods workers who are trained to operate large, expensive equipment to log large old-growth timber.
State of the ArtBefore we delve very far into the equipment and techniques used let us look at how thinning is viewed by the average logger in the Northwestern United States. In a survey of thinning operations in Oregon and Washington conducted in the spring of 1973, 11 percent of the operators who were thinning were doing so in stands more than 100 years old and 38 percent were operating in stands in excess of 50 years o f age (2). F o r instance, using a Site Class H I stand classification, 11 percent o f the operators were “ thinning” stands that averaged in excess of 13,270 cubic feet per acre (926 cubic metres per hectare) and 38 percent were thinning stands containing 7,050 cubic feet per acre (492 cubic metres per hectare). Can this really be called thinning? The attitude, in short, has been one which considers thinning as a means of capturing mortality or preparing the stand for final harvest rather than stimulating growth in young stands. In tru th much o f the harvest is really a partial cut.
Let us take a brief look at some of the equipment being used to thin these stands. Because o f the steep
topography, fragile soils and regulation o f logging practices found in our region, cable systems are used extensively (33 percent). However, ground-based systems such as crawler tractors and rubber-tyred skidders still accounted for 62 percent o f the equipment used. Five percent o f the operations used other systems such as horses o r helicopters.
If we focus our attention on the cable systems we find that 28% of the operators use large tower systems or loaders commonly used for harvesting old-growth timber. A nother 31 percent used machines classed as medium in size but would be considered “large” in most parts o f the world. A machine classified as medium-sized would have a 200-300 horsepower engine with a 50 to 60 foot (approximately 15 to 20 metres) tower and cost between $80,000-$ 120,000 or, in the case of an interlock system, $160,000.
The study further showed that 41 percent were using cable systems that can be considered smallwood harvesting machines. These include the Skagit S J . series (SJ4, SJ5, and SJ8) which still have ratings of 300+ horsepower. Also included in this group are the Urus (90 hp) and the Schield-Bantam T-350 (100 hp).
This survey illustrates very clearly that the Western United States is not being flooded with cable equipment economically capable of harvesting smallwood (under 100 b.f. o r 0-7 cubic metres). M ost of the equipment in use is obsolete mobile-Ioaders with short distance capabilities (up to 600 feet o r 200 metres) or units of foreign manufacture designed for use under other conditions.
Why all the big equipment for such little logs? There are several reasons presented by loggers, all o f which may be valid. One reason can be traced to a landowner policy of requiring all old-growth trees left from former operations be taken along with the thinnings. Consequently, the occasional 4-foot “hooter” left from previous logging must now be taken. Either it has value now that it never had before or it is to be removed to “clean up” the stand. As a result, the thinning operator must gear his equipment to enable him to yard this occasional large log rather than scale his operation to the smaller stems which may comprise 95 to 99% of the stand. This is
123

124 F O R E ST R Y C O M M ISSIO N B U LL E TIN No. 55
a management problem that takes some careful analysis in order to determine whether or not scattered old-growth should be removed.
A key reason that large equipment is used for thinning is that nothing else is presently available. No major American logging equipment company is currently m anufacturing a cable yarder designed especially for thinning under our forest conditions. Operators, therefore, must rely on obsolete, expensive systems for removal o f the thinnings. Such equipment is not appropriate for use on the steeper slopes and fragile soils which cover a large part of our thinnable stands.
Since most o f the thinning is presently being done with ground-based equipment some discussion is in order. These systems are being criticized primarily because of excessive soil com paction that may retard stand growth rate and also residual stand damage. Extensive research is being conducted on the soil problem by both private and public agencies. Dr. Henry Froehlich, o f our staff, is involved in one of these projects. Some public agencies now prohibit the use of ground equipment for harvesting on slopes greater than 20%. As thinning becomes m ore extensive in the Pacific Northwest, the proportion of the thinning activity carried out by ground equipment will drop.
Much of the logging and nearly all o f the access road construction is done by blade-equipped crawler tractors. Therefore, it is not surprising that many small operators have only tractors in their machinery inventory. These independent operators or contract loggers are also the primary source of thinning contracts in the region.
Our survey revealed that of 138 operators using ground-based units, 34% used crawler tractors only and 23% used rubber-tyred skidders exclusively, but the majority, 43%, used a com bination of the two for thinning.
All sizes of crawler tractors are being used for thinning, but large machines are most common. Large machines, 125 to 180 flywheel horsepower class, are used primarily because they are available from other operations. The most com mon crawler being used was the Caterpillar D-6.
Rubber-tyred skidder use is increasing, primarily due to the lower initial investment and also due to the fact that smaller logs make the units more economical than cable systems (9). Skid distance is a large factor and the speed of the skidder can be an advantage in long skid situations.
New types of track laying machines are coming into the industry primarily because of the interest of ground pressure influence on soil compaction. The Washington Iron W orks “Tracm ac” , FM C logging tractor, and the Foremost soft-tracked log skidder
are all designed to be all-terrain, low ground pressure machines. M ore research and development in smaller models will be required before these machines v/ill be widely used in thinning operations.
Research Activities on Thinning Systems Several different thinning operations have been m onitored over the past two years by the Forest Engineering department at Oregon State University. The purpose has been to identify and measure the factors that influence the production rates of different thinning systems. Heretofore inform ation of this sort was minimal.
A study in 35-year old Douglas fir using a Schield- Bantam skyline yarder was conducted in the fall of1972 (1). The results of this study were reported at the IU FR O meeting in Vancouver, B.C. in August1973 and are to be printed in the proceedings of that meeting (2).
The objective of that study was to compare skyline and tractor operations according to cost, production, and soil and stand damage. As was expected, skylining was m ore expensive and resulted in more slash remaining on the site. It also produced less soil com paction and fewer serious wounds to residual trees. The higher costs were due primarily to the higher capital investment in equipment and larger crew requirements on the skyline. On gentle slopes (20%), the tractor outproduced the skyline but on steeper slopes (40%) the output was reversed. The primary factors that influenced skyline production were distance out on the skyline and lateral distance from the skyline. The production of both systems was influenced by thinning intensity, logs per turn, and slope (4).
A nother study conducted by the Forest Engineering Departm ent was an analysis o f the production of a low investment, “homemade” yarder. This yarder is operating on private land in Western Oregon. The yarder was powered by a 352 F ord V8 gasoline engine with a Fordam atic transmission. The drum assembly was a Skagit BU-30. Regressions developed from time studies showed lateral distance and slope as the most significant variable in predicting turn time (7). Total production costs and residual stand damage have not been analysed at this writing.
The major difference between this operation and the Schield-Bantam operation described above is that the skyline roads were not precut for the “homem ade” yarder. Also, the machine is unable to rotate while landing the logs. This results in a swing machine being required to skid the logs away from the landing. The requirem ent to have another piece o f equipment available for swinging is also one of the main disadvantages of the Urus system.

A SP E C TS OF THINNING 125
Decking turns on very narrow landings is a major problem in thinning our western Douglas-fir stands. Since environmental concern for soil stability will continue to reduce the size of landings, much of our work is based upon the premise that the road prism alone will be our landing in a majority o f the thinning operations. Narrow landings pose special problems in the 30-40 years age class where a substantial portion of the stems removed are poles (4). Long poles make landing difficult and sorting imperative, especially when the turns include both long poles and short sawlogs. Studies are now being conducted to determine the minimum percentage of poles necessary in a stand to warrant their exclusion from a thinning operation based upon decking difficulties alone.
A carriage design with slackpulling capabilities operating from a continuous line system has been designed by Mr. Marvin Rowley, and is being tested by the Forest Engineering Department. The p ro totype is large for thinnings. However, a smaller version of the design has possible application. The carriage will allow lateral yarding and remain stationary on the skyline. This feature is vital to thinning activities to minimize skyline road changes and also to keep residual stem damage down.
In my opinion, the ideal machine for thinning in the Douglas-fir forests of the Western United States would be a small, mobile, low initial investment, cable machine capable of reaching out 1,000 feet
(305 metres) o r m ore on a skyline with line speeds of 1,000-1,500 feet (305-457 metres) per minute. The system must be capable of lateral skidding from the skyline a minimum o f 150 feet (46 metres). This system must be mobile enough so that it can be moved easily and set up rapidly. The carrier should be narrow enough to allow decking on the roadway beside the machine. The operator’s cab should be constructed to allow the operator easy access on and off the machine. This would permit the operator to unhook the chokers. An interlock between mainline and haulback drums should be standard. And finally, the total cost should be under $50,000 to enable small contract loggers to get into the business. To this end, Prof. Lin Johnson, Mechanical Engineering Department, Oregon State and I are working on a conceptual yarder design that will attem pt to meet these specifications. Although this concept is in the development stage we hope to have a prototype operating in 1975.
In conclusion, the two major problems we are facing in the western United States are, first, lack of small cable yarding systems designed specifically to handle smallwood, and second, the general attitude among operators, land owners, and equipment manufacturers that only large logs harvested with large equipment and big crews are economical. We are going to have to “ think small’ and at the same time “ think m ore” .

126 F O R E S T R Y C O M M ISSIO N B U LL E TIN No. 55
REFERENCES
1. A u l e r ic h , D. E. (1973). Production rates and economic opportunities in thinning. Paper presented at the Joint Meeting Project G roup F 4.02, International U nion o f Forest Research Organizations, Vancouver, B.C. August 20-24, 1973.
2. ------------ . (1974). Survey o f thinning operationsand equipment in western Oregon and Washington. Unpublished data. Forest Engineering D epartment, Oregon State University.
3. A u l e r ic h , D. E d w a r d , a n d Jo h n s o n , K. N o r m a n . (1973). Cable thinning in young-growth Douglas-fir: A case study. In : Management o f young Douglas-fir and Western Hemlock Symposium, June 11-13,1973. A. B. Berg, ED. School o f Forestry, Oregon State University, Corvallis. (In Press).
4. A u l e r ic h , D. E d w a r d , Jo h n s o n , K. N o r m a n , a n d F r o e h l ic h , H e n r y . (1974). Thinning young- growth Douglas-fir: tractors or skylines? Forest Research Laboratory, School o f Forestry, Oregon State University, Paper 954. p. 14.
5. B e r g , A l a n B. (1970). Skidding with a horse. In : Managing young Douglas-fir and Western Hemlock, June 10-14, 1968. A . B. Berg, Ed. School of Forestry, Oregon State University, Corvallis, p. 94-96.
6. H e l l a n d , M a r v in L. (1970). Commercial thinning - how we do it. In : Managing young Douglas-fir and Western Hemlock, June 10-14, 1968. A. B. Berg, Ed. School o f Forestry. Oregon State University, Corvallis, p. 114-121.
7. J o n a s , W il l ia m a n d S t in n e t t , B r e n t . (1974). Production estimates o f a homemade yarder in skyline thinning operations. Unpublished data. Forest Engineering D epartm ent, Oregon State University.
8. M c C u l l e y , R o b e r t D. (1970). Thinning in conifers o f the W estern United States. I n : Thinning and Mechanization, IU F R O Meeting, Royal College of Forestry, Stockholm, Sweden September, 1969.
9. S c h il l in g s , P a u l L. (1969). A technique fo r comparing the costs o f skidding methods. Inter. For. and Range Exper. Sta. Research Paper INT-60, p. 23.
10. S in n e r , H a n s - U l r ic h . (1973). Simulating skyline yarding in thinning young forests. A paper presented at IU F R O meeting in Freiburg, Germany, O ctober 1-5, 1973. Unpublished.
11. T essier , J. P. (1970). Logging techniques in thinnings today and tom orrow on the N orth American West Coast. In : Thinning and Mechanization, IU FR O Meeting, Royal College of Forestry, Stockholm, Sweden, September, 1969.

P ap er 14
PROBLEMS OF EXTRACTION OF THINNINGS BY CABLE CRANE IN THE UNITED KINGDOM
By J. A. D R U M M O N D Forestry Commission o f Great Britain
1. IntroductionIn the mountainous areas o f the U nited Kingdom where slopes exceed 50% the standard m ethod of extraction since 1963 has been by cable crane, first in the form of high lead and later as a skyline system. (See cover picture, bottom left).
The cable cranes used at present are in the short to medium range groups. W ith loads of one tonne the maximum ranges are 140 m for high lead working and 450 m for skylines. Those skylines which are rated at 1J tonne load have a range of 350 m. Cable crane systems of these ranges and load capabilities are currently available on the British m arket and will cover the majority of m ountain harvesting situations until 1980 when there will be a need for some longer range cranes.
2. Requirements of the Cable CraneTo work efficiently a cable crane must have:
(a) A suitable road system with spacing at from 600 to 800 m.
(b) Correct layout o f the working area and racking system.
(c) Correct presentation of produce.(d) A thinning yield sufficient to optimise the
costs o f erection and dismantling.(e) A mean tree size which is large enough to
permit collection of a payload in reasonable time.
(f) A small num ber of products (one or two) for economic handling.
(g) G ood trees to act as masts and anchors.
3. Racks or TracesRack spacing which depends on the harvesting system employed is generally set at 25 m for manual shortw ood and 40 m for manual length methods. Racks 3 m wide are set along the best extraction alignment and they seldom coincide with planting lines. W here tree rows are 1-8 m apart some 9% of the standing volume is removed when racks are at 25 m spacing, o r 7 % at 40 m spacing. In rack layout the rack is usually stopped 20 m short o f the perimeter o f the area to be thinned.
4. Thinning Yield and Average Tree SizeThe use o f the cable crane for extraction of thinnings
is sensitive to the volume per hectare and, as with many other extraction systems, the mean size o f tree being removed. Yield and mean tree size are generally both low in first thinnings o r in low yield crops and it has been found that it is necessary to obtain a minimum output o f 10 m3 per 100 m run o f rack in order to justify economically the set-up of a cable crane. W ith a rack length o f 300 m and a yield of 10 m 3 per 100 m run of rack it has been found that the erection and dismantling of a cable crane takes 20 standard minutes per m 3. I f the yield is increased to 15 m 3 per 100 m run of rack the time drops to 13 standard minutes per m 3, a reduction of 35%. If the rack length reduces to 200 m, a common distance in first thinning, and only part of the area is thinnable, the difference between 10 m3 and 15 m3 per 100 m run of rack is again over 30% so that it clearly pays to delay thinning where yields are low or to reduce range even further to allow the use of a highlead system which is very much less sensitive to yield.
In a low yield situation one may have to delay thinning, thin m ore heavily than normal, or increase the rack espacement but in the last case there is a penalty in terminal time because of the increased side haul, except for tree length working in a chevron type of thinning pattern. (See Figure 14.1).
The same effect of low yield is found in areas of variable growth, and if blank or unthinnable areas are encountered the average extraction distance is increased as well as yield being further reduced. Non-selective line (geometric) thinnings are advantageous to cable crane working in that produce is concentrated in one place, but straightforward removal o f one row in every three or four rows is no t acceptable because of the low yield obtained from each set up of the cable crane. A pattern of non-selective thinning, which results in the removal of up to 40% o f the standing volume, has been devised for cable crane extraction. It employs side racks at right angles to the main rack, but is suitable only for manual shortwood working.
Load collection in manual shortwood systems is carried out during the felling phase, but in tree length systems this is done by the chokerman. The smaller the m ean tree size the greater is the load
127
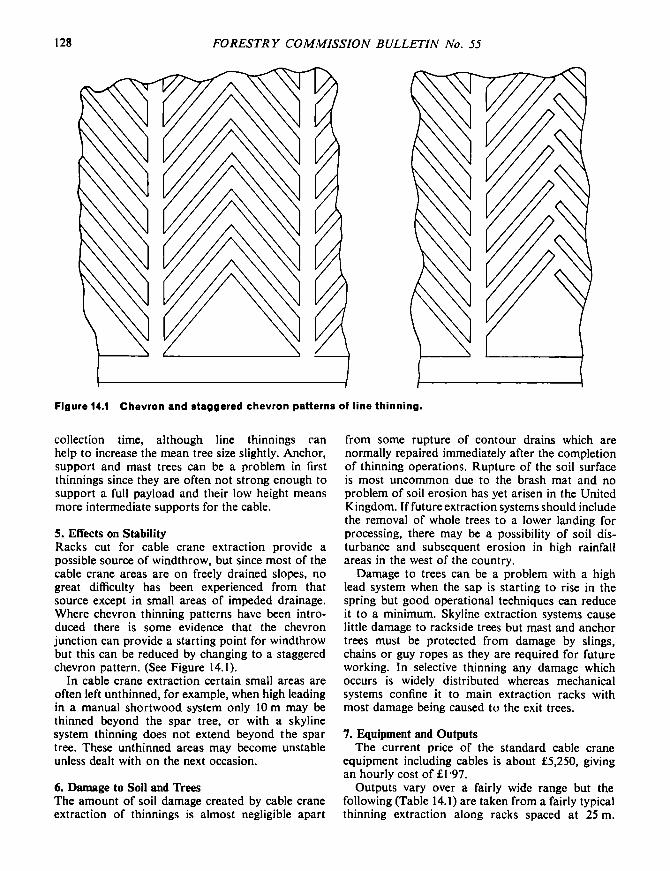
128 F O R E ST R Y C O M M ISSIO N B U LL E TIN No. 55
Figure 14.1 Chevron and staggered chevron patterns of line thinning.
collection time, although line thinnings ran help to increase the m ean tree size slightly. Anchor, support and mast trees can be a problem in first thinnings since they are often not strong enough to support a full payload and their low height means more intermediate supports for the cable.
5. Effects on StabilityRacks cut for cable crane extraction provide a possible source o f windthrow, but since most of the cable crane areas are on freely drained slopes, no great difficulty has been experienced from that source except in small areas of impeded drainage. Where chevron thinning patterns have been introduced there is some evidence that the chevron junction can provide a starting point for windthrow but this can be reduced by changing to a staggered chevron pattern. (See Figure 14.1).
In cable crane extraction certain small areas are often left unthinned, for example, when high leading in a manual shortw ood system only 10 m may be thinned beyond the spar tree, o r with a skyline system thinning does not extend beyond the spar tree. These unthinned areas may become unstable unless dealt with on the next occasion.
6. Damage to Soil and TreesThe am ount o f soil damage created by cable crane extraction of thinnings is almost negligible apart
from some rupture of contour drains which are normally repaired immediately after the completion of thinning operations. Rupture of the soil surface is most uncom mon due to the brash mat and no problem of soil erosion has yet arisen in the United Kingdom. If future extraction systems should include the removal o f whole trees to a lower landing for processing, there may be a possibility o f soil disturbance and subsequent erosion in high rainfall areas in the west o f the country.
Damage to trees can be a problem with a high lead system when the sap is starting to rise in the spring but good operational techniques can reduce it to a minimum. Skyline extraction systems cause little damage to rackside trees but mast and anchor trees must be protected from damage by slings, chains or guy ropes as they are required for future working. In selective thinning any damage which occurs is widely distributed whereas mechanical systems confine it to main extraction racks with most damage being caused to the exit trees.
7. Equipment and OutputsThe current price of the standard cable crane
equipment including cables is about £5,250, giving an hourly cost o f £1 *97.
Outputs vary over a fairly wide range but the following (Table 14.1) are taken from a fairly typical thinning extraction along racks spaced at 25 m.

A SP E C TS OF THINN IN G 129
T able 14.1
Max Rack Length,
m
Output per hour in m3
Load size in m3
0-2 0-4 0-6
100 1 -66 2-27 2-59
150 1 -69 2-48 2-94
200 1-64 2-51 3-06
250 1-56 2-48 3 09
300 1-48 2-41 3-05
Terminal, movement and set-up and take-down times are included.
One of the major problems yet to be solved satisfactorily is the severe limitation of stacking space on mountain roads. Although more serious in clear felling it can still cause difficulty in thinning areas unless produce is removed rapidly from the end of the cable crane. In some circumstances it has been found advantageous to work with two sets of rigging and move the winch tractor to a fresh set-up whilst the previous set-up is being cleared.

Paper 15
MECHANIZED THINNING SYSTEMS
By C. J. BREDBERG Royal College o f Forestry, Department o f Operational Efficiency, Garpenberg, Sweden
Only 20 years ago thinnings were the main source of wood in Sweden. Rapidly increasing costs for cutting small wood has made it necessary to reduce the am ount of wood from thinnings and increase the clear-cutting. Today about 20 per cent o f the total w ood cut comes from thinnings. This development has been achieved by reducing the num ber of thinnings during the ro tation and making the few remaining thinnings heavier. Similar changes can be noticed also in many other countries. As a m atter o f fact a large proportion of the increase in labour productivity during the last decades may be explained by the change-over to bigger trees. If this development continues we may have to manage our forests without thinning - one of our most
Figure 15.1 Motor-manual cutting.
manual systems that make them so unsuitable that they cannot survive in the future? First, the labour cost is as much as 70-80 per cent o f the total cost which means that the cost will increase rapidly over time. By comparison, the labour cost in some mechanized systems is estimated at 20-30 per cent of the total. The motor-manual felling and processing of small trees in thinnings is not feasible under snow conditions. In such areas thinnings are made mainly during the bare-ground season. This in tu rn interferes with a peak in labour demand for other silvi
efficient tools to regulate the stand development towards the product wanted for clear-cuttings. If we consider that thinning is a necessary tool in the future development o f stands, we have to develop new logging machines and systems especially designed for high productivity and low costs in smallwood.
Today the conventional logging system in Swedish thinnings is a short-wood system where the trees are felled, delimbed and bucked using a chain-saw. The logs are gathered in small piles at 4 metres wide strip-roads, spaced at 18-20 metres. The wood is then forwarded to the road-side by using small and medium sized rubber-tyred forwarders.
So, what are the features o f this and similar m otor-
cultural work. Furtherm ore, it is questionable if the m otor-m anual cutting can be accepted in the long run considering the poor ergonomical and environmental conditions.
The manual gathering of wood to strip-roads makes it necessary to keep the distance between the roads short. This in turn will reduce the selective part o f the cutting and increase the strip-rack area (geometric) as well as the frequency of damage on remaining trees caused by the forwarders. A high road density also reduces the volume of harvested
130

A SP E C TS OF TH INN IN G 131
wood per unit o f road length, causing an increase have been made especially to reduce the damagein the cost for subsequent terrain transportation. from the forwarding operations. In this connection
It is probably impossible to find a solution that winching systems, e.g. the Radiotir-system (1) haveeliminates all these disadvantages. Lately, efforts been introduced.
Figure 15.2 Principles of the winching methods (m = metres).
By winching the trees, the distance between the strip-roads may be increased to 80-100 metres. In the R adiotir system, the trees are felled towards the strip-road and delimbed by using a chain-saw. The stems are then pulled in bundles by a radiocontrolled, portable winch into the previously cut strip-road area, where they are bucked by means of a chainsaw. The conditions for forwarding are favourable because of the high concentration of wood along the roads. This winching system does not increase the labour-productivity, but makes the manual work less heavy and reduces the damage caused by the forwarder. However, it has been claimed that serious damage to the remaining trees appear also after winching.
Winching systems are now being further developed. M ore powerful tractor-m ounted winches are being introduced. Some short-wood processors are being tried to work on the strip-roads. W hole-tree chipping has been tried in this connection as well. However, no near-future solutions are available for the
mechanization of the motor-manual felling and the time-consuming winching.
Another thinning system being developed in Sweden is based on the LIVAB G1 short-wood harvester. This machine fells and extracts trees within the 10 metres reach of the boom. (See Figure 15.3).
The trees are automatically processed into 3-metre pulp-wood bolts and separated into two assortments. Sawlogs o f varying lengths may also be produced. The machine is expected to harvest about 2 trees per minute. Since the felling-head handles one tree a t a time only, the cost per cubic metre is heavily affected by tree size, as is the case for similar machines in clear-cuttings. This harvester, therefore, is prim arily suited for later thinnings or clear-cuttings where trees are small enough. The LIVAB project has recently produced a second prototype (G2), substantially different from the one just shown.
Probably none of these systems being developed represent long-term solutions to the thinning problem. The mechanization of thinnings is a matter of
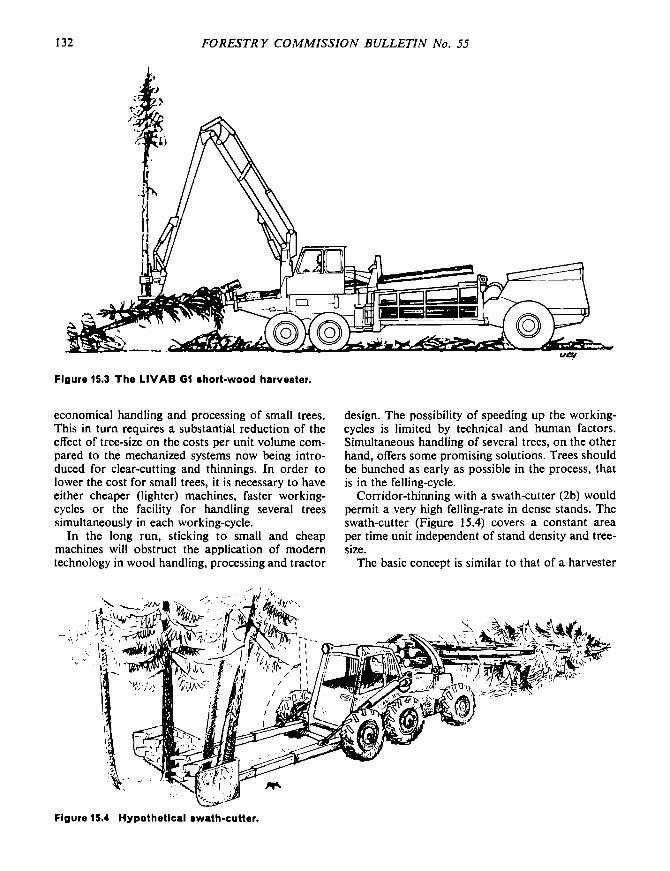
132 FO RESTR Y C O M M ISSIO N B U LLE TIN No. 55
economical handling and processing of small trees. This in turn requires a substantial reduction of the effect o f tree-size on the costs per unit volume compared to the mechanized systems now being introduced for clear-cutting and thinnings. In order to lower the cost for small trees, it is necessary to have either cheaper (lighter) machines, faster working- cycles or the facility for handling several trees simultaneously in each working-cycle.
In the long run, sticking to small and cheap machines will obstruct the application of m odem technology in wood handling, processing and tractor
design. The possibility o f speeding up the working- cycles is limited by technical and human factors. Simultaneous handling of several trees, on the other hand, offers some promising solutions. Trees should be bunched as early as possible in the process, that is in the felling-cycle.
Corridor-thinning with a swath-cutter (2b) would permit a very high felling-rate in dense stands. The swath-cutter (Figure 15.4) covers a constant area per time unit independent o f stand density and tree- size.
The basic concept is similar to that o f a harvester
Figure 15.4 H ypothetical sw ath-cu tte r.

A SP E C TS OF TH INN IN G 133
used in agriculture. Felling-rates of 5-10 trees per minute may be achieved this way. However, corridor- thinning seldom meets the silvicultural requirements concerning the spatial distribution of remaining trees. Often thinnings are not motivated unless the cutting is selective, favouring the best trees o f the stand.
In selective thinnings, the mechanized felling of small trees may be speeded up by designing the felling-head so that it will manage to collect several
trees (2c) and swing them into the machine as a bundle rather than one tree at a time (See Figure 15.5).
The smaller the trees are, the shorter will be the felling time per tree, since a greater number of trees may be collected into the same bundle. This way the time per tree may be reduced by 30-40 per cent compared to the time taken using felling-heads that handle only one tree at a time (3).
The processing of small trees in bundles offers a
Figure 15.5 Feller handling several trees.
few different technical solutions (2c). In order to limit the size of a bunch-delimber, the bundles should first be cut to even lengths and then fed into the delimber. Trials have shown that the delimbing is unsatisfactory when the logs just wear against each other, e.g. by tumbling. Some kind o f shearing tools has to be used. The “ Kockum bunch-delimber” is one example, where rotating spiral-edged screws are used for the delimbing. (See Figure 15.6).
O ther concepts of bunch delimbing that have been tried out experimentally are the drum-delimber (Figure 15.7) and the delimbing cradle (Figure 15.8). The delimbing is here made with the aid o f knives mounted on the outside of the drum and between the cross-conveyors of the cradle. These delimbing methods are similar, but the cradle admits faster delimbing and a more simple feeding installation compared to the drum. Furtherm ore the construction of the cradle is less complicated.
The handling of several trees at a time in the felling, bucking and delimbing activities might be brought together in one machine - a bunch-delimbing harvester (See Figure 15.9).
The harvester accumulates trees in the felling- head. The tree-bundles are slashed and delimbed to pulp-wood bolts that are collected in a cradle at the rear o f the machine. When the cradle is filled, it is emptied at the side o f the strip-road, for subsequent transportation by a conventional forwarder.
Bunch-processing can also be achieved by chipping the trees with tops, branches and bark. However, chips in the woods, are a problem. Containers may be used, but then we create a “hot” system with strong demands on the planning and organisation of transportation. It can also be questioned if it is sensible to mix low quality chips from branches and tops with more valuable chips from the stem. Another alternative to achieve a more efficient use

134 F O R E S T R Y C O M M ISSIO N B U LL E TIN No. 55
Figure 15.7 A se t-up for de-lim bing In a drum .

A SP E C TS OF TH INN IN G 135
Figure 15.9 Bunch-delimbing harvester.
of the tree would be a system which would separate the pulp-wood from branches and tops so that they could be used for different purposes. In order to facilitate the transportation of branches and tops to the mill for processing, they could be compressed to convenient-sized bales. Studies have shown that branches and tops may be compressed to a volume weight o f 400-600 kilos per cubic metre. The volume weight of chips is in the order of 300 kilos per cubic metre.
Anyway, whole-tree utilization in thinning is certainly promising, considering that the merchantable part o f the trunk accounts for only some 30-50 per cent of the total weight o f a small tree. A con
siderable increase in fibre-yield and revenues may therefore be expected.
I would like to summarize my view of the different concepts by a schematic com parison of the costs for harvesting and terrain transportation. (Figure 15.10). The comparison refers to early thinnings where the average DBH of thinned trees is about 10 cm. The cost forecast is based on the assumption that the labour cost per cubic metre increases twice as fast as the machine cost.
The graph may serve as an aid when discussing the expected development o f logging systems for thinnings.
Obviously, the expected cost development of

136 F O R E ST R Y C O M M ISSIO N B U LL E TIN No. 55
Figure 15.10 Schematic comparison of the cost of harvesting and terrain transportation.
today’s thinning systems - short-wood or tree- length - will make the thinnings obsolete if we cannot find other solutions. The most serious obstacle in the mechanization of thinnings seems to be the damages on the stand caused primarily by the terrain-transportation vehicles. This may be solved by an expensive and time-consuming development of chassis, transmission and ground contacts (tyres, tracks etc). In the meantime winching-systems with wide road spacing offer solutions with varying degree of mechanization. The processing of bundles may also be employed in this connection. Hopefully, at the end of the 1980s the technology will allow fully mechanized systems with bunch-delimbing (or chip
ping) harvesters and forwarders operating on closely spaced strip-roads. Looking still further into the future the swath-cutting of strip-roads or corridors offers a possibility for further increase in productivity.
Finally, it has to be emphasized that a development o f this kind requires special efforts. If people involved in silviculture and logging don’t start working seriously on technical solutions 10-15 years ahead, there will be no new machines on the market when we need them. Then we have sacrificed our possibilities to use thinning as an aid in forest management.

ASP E C TS OF TH IN N IN G 137
REFERENCES
(1) L a r s s o n , T. a n d P e r m a lm , H. (1971). Study o f winching by the Radiotir System. Logging R esearch Foundation. R eport N o. 7, 1971.
(2 ) Thinning in the forestry o f the future. R eprint of papers from the international conference at ELM IA 1973. Dept, o f oper. eff. Royal College of Forestry. Research N otes No. 69.
(2 a ) F r i e s , J. Thinning - why and how ?
(2b) B r e d b e r g , C-J. Some mechanized thinning systems.
(2c) M y h r m a n , D. Techniques for mechanized thinning.
(3) B r e d b e r g , C-J. a n d M o b e r g , L. (1972). Felling heads designed for simultaneous handling o f several trees. Dept, o f oper. eff. Royal College of Forestry. Research N otes No. 51.
DISCUSSION
Stratmann: I would expect that in thinning, tree felling by a machine is more costly than tree felling using a power saw. D id you find this in your studies?
Bredberg: I would guess that you are right if you are only considering the felling of the tree but when you take into account all other operations, extraction etc, the cost levels would be about the same.
Fries: I think it is quite im portant that in all these studies one should take account o f as many factors as possible. That is, one should consider not merely the profitability but also the time consumed, the volume yielded and so on. The manager ought to have the complete details so that when prices etc change he is still in a good position to make a decision.
Jensen: It may be that we should also take into
account when we are comparing machines with manual labour, the notion of a shadow price of manual labour and not the nominal price.
Rowan: Could Mr. Busby define the shadow price?
Busby: The shadow price is the resource cost of labour. F or example, if forest workers could not find other employment then if they cease to work in forestry they would become unproductive and thus the social opportunity cost o f continuing to employ them in forestry would be zero. In other words, the shadow price would be zero. Usually, however, at least a proportion of forest workers would be able to move from their present occupations to other occupations. By considering the overall re-employment position a weighted shadow price can be calculated.

138 F O R E S T R Y C O M M ISSIO N B U LL E TIN No. 55
GENERAL DISCUSSION ON PAPERS 11-15
Fox: Industry is seeking uniform material so that we have a trend towards uniformity. I would expect that the silvicultural system aiming a t a uniform product would imply a short rotation.
Stratmann: I would say that in Germany we are tending to move from short rotations of about 60 years to longer ro tations of about 120 years.
Busby: I think this is entirely due to the cost of capital. If you have zero cost o f capital then you can reasonably have long rotations. The higher the cost of capital the shorter the optimum economic rotation length.
Forster: On this subject I think we could argue endlessly about rates of interest etc. As a researcher I think it is really im portant not only to outline in physical term s but also in economic terms all the consequences and all the logical alternatives, and then let the manager choose.
Fries: I agree with this. F or example, many pulp- wood companies claim that they are interested only in pulp and are not concerned about dimensions or saw tim ber quality, but in the event when they harvest timber you will frequently find they sell the saw timber element as saw tim ber and get useful revenues from that material. Therefore we should not always take the practitioners requirements at face value but should continue to consider the various alternative products in our research activities.
Young: In Maine we have a num ber o f paper companies, none of which were connected with a saw
mill, but in the last three years at least six of these have bought an existing sawmill or added a mill. I see a movement in the United States away from massive fibre production towards maximising the product and getting fibre from the residual material, that is the smaller trees. In Maine we are using Finland, Norway and Sweden as our models because they have been doing this for a long time.
Bredberg: In Sweden we try to m aintain a management regime that gives us the greatest possible flexibility in the future. Turning towards short ro tation forestry will not give us flexibility because it will consume a lot o f the “ storage” we have in terms of the growing stock. Once we find that we need to produce larger tim ber we would have to build up our storage once again, which would imply a serious reduction in harvesting for a considerable period. That is the situation we put ourselves in if we want to tu rn to short ro tation forestry.
Sutton: I must protest against the idea that short rotations always imply low quality smallwood. The whole point o f short rotations in New Zealand is to produce high quality sawnwood.
Rowan: I think underlying all the discussions today we see that research must be integrated research, so that all the people concerned, engineers, mensura- tionists, economists and industry are there to help us. I, as a manager, draw great com fort from the fact that no m atter what decision I may come to I am certain to find some kind of authority among researchers somewhere for whatever course of action I choose to adopt.
Printed in England for Her Majesty’s Stationery Office by J. Looker, Ltd., 82 High Street, Poole, Dorset
Dd. 289242 K36 12/75


Available Forestry C om m ission publications are shown in H M SO Sectional List 31, Forestry Commission, obtainable from the Forestry C om m ission Headquarters, 231 Corstorphine Road, Edinburgh EH 12 7A T or from the Stationery Office addresses given overleaf.

' H er M ajesty’s S tationery Office
Government Bookshops 49 H igh H olborn , L ondon W C1V 6HB 13a Castle Street, Edinburgh E H 2 3AR
41 The Hayes, C ardiff CF1 1JW Brazennose Street, M anchester M 60 8AS
Southey House, W ine Street, Bristol BS1 2BQ 258 B road Street, B irm ingham B1 2H E 80 C hichester Street, Belfast BT1 4JY
Government publications are also available through booksellers
ISBN 0 11 710147 8