aspects of seasonality study touristic …seaopenresearch.eu/journals/articles/spas_13_10.pdfthe...
TRANSCRIPT

SEA - Practical Application of Science Volume V, Issue 13 (1 / 2017)
73
Mariana C. JUGANARU, Kamer Ainur M. AIVAZ,
Ion Danut I. JUGANARU Ovidius University of Constanta
ASPECTS OF SEASONALITY TOURISTIC ACTIVITY SPECIFIC TO
MAMAIA STATION
Case Study
Keywords Tourism at Mamaia,
Seasonality, Indicators of seasonality,
Mobile average
JEL Classification C10, C21, C53, M21, J63, Z33
Abstract The study of phenomena and social-economic processes under the aspect of their evolution in time, mainly on a short term or intra-annual represents a preoccupation at a micro and macroeconomic level. For the tourism operators, this process includes knowing the touristic market and the anticipations of its evolution, as an important condition for taking decisions in their activity. The aim of this work is to analyze the touristic activity according to seasonality in Mamaia station, using qualitative and quantitative research methods. The study is important through the aspects that emphasize the specific evolution of the touristic activity from this station. For this aim, a database was formed by the monthly values of three indicators of the touristic activity (number of arrivals, number of overnights and the average duration of the stay) from the period 2010-2016, using a series of statistic and econometric instruments. The results of the research can be proved by the units that maintain or are connected to the touristic activity, but also to the local administration, in making up the attenuation strategy of the touristic activity concerning the seasonality of Mamaia. Also, the work is a case study for the work with the students (especially, for tourism economy, applied statistics in tourism and marketing).

SEA - Practical Application of Science Volume V, Issue 13 (1 / 2017)
74
INTRODUCTION
In economic theory, the concept of seasonality
defines an evolution made of the activity
characterized by annual or intra-annual repetition
and it is manifested through an important variation
or even the emergence of discontinuity in the
manifestation of the activity from a domain and/or
area. This observation draws the attention upon the
fact that, not any oscillating movement can be
considered seasonality. If we refer to the touristic
activity/market, it is known that touristic offer and
demand deal permanently with oscillations. In the
situation where these oscillations are not random or
of conjuncture and repeat themselves on a calendar
period, we can talk about seasonality. Also, in order
to establish correctly if we are talking about
seasonality, it is better to consider the fact that the
repetitive trait should accompany concentrations of
the activity, in certain periods, as well as of obvious
gaps between the minimum and maximum values.
(Grigorescu, 2003). In this context, we can assert
that, in the analysis of the importance of seasonality
in tourism, we mainly consider two aspects, thought
of as very important: intensity and the dynamics of
the concentration of seasonality (Bigovic, 2012).
In the practice activity, seasonality is
perceived as a negative phenomenon, manifested
under different aspects: from the misuse of natural
and antropic resources, preocupation on long term of
invested capital, difficulties in providing the well
qualified work force , until the creation of crowded
touristic destinations, which may generate
complaints from the tourists and the inhabitants, but
also difficulties in manifesting the activity of some
economic operators, social and cultural institutions,
local administrations. (Koenig-Lewis, Bischoff,
2005; Minciu,2004)
In our study, the aspects related to the theoretic
approach of the seasonality are part of the
quantitative research, while the elements through
which the seasonality is manifested in the practical
activity are presented in the qualitative research.
QUALITATIVE APPROACHES OF
SEASONALITY IN THE TOURISTIC
ACTIVITY OF MAMAIA STATION
One of the most appreciated touristic stations on the
Romanian seaside is Mamaia. A lot of tourists
associate Mamaia with the sun, the beach, the water
of the sea and the fun during the summer vacation.
The beach strip, situated at 7 kilometers North of the
city of Constanta, represented an attraction for
several segments of tourists (“protipendad” of
Bucharest, the ones that were part of the upper social
classes and had high incomes) since the end of the
19th century. (Păuleanu, 2006) Improvement works
of a new beach for the balneary station Constanta
began in 1905 and on 28th of August 1906 the beach
of Mamaia was inaugurated, about which, in the
newspaper “La Roumanie”, was written “Constanta
has today a beach that will situate it between the big
stations in the Orient” (http://constanta-imagini-
vechi.blogspot.ro/2012/07/). Statistics of that period
show that, every year, the number of tourists that
came to the beach of Mamaia was growing, even if
the investments in hosting, alimentation and
recreation units were, at the beginning, pretty low
(in the period 1906 - WW 1, then between the
2WW). Also even from the beginning of the touristic
activity at Mamaia, in the press, it was written that
the tourists chose to spend here their vacations
during summer, because they were attracted by the
special natural environment, they preferred the sun
baths, the water of the sea but also the fun activities.
These aspects show, on one side, that the natural
factors had from the beginning, the biggest
importance over the touristic offer and demand for
the station of Mamaia and, on the other side, that the
tourists enjoyed these factors only during summer.
Through the qualitative research we made we can
say that the touristic activity during the seasonality
of Mamaia station represents a preoccupation topic
that has been manifesting for a long time. In the
meeting of Communal Council (of Constanta) from
26th of March 1887, it is mentioned that “the station
of the baths started on 15th of June” (DJAN
Constanta, dosar nr4/1887; Păuleanu, 2006).Then,
in the regulation of the balneary station Constanta,
from 1892, it was established that:”the station of the
sea baths began at 15th of June and is extended until
15th of September (DJAN Constanta, dosar
nr.19/1892; Păuleanu, 2006). After a few years, in
the central publication “La Roumanie” from 3rd of
July 1899, it was mentioned: “It is brought to the
general public the fact that on the 1st of June, the
current year, the sea bath seasonality has began in
Constanta “” (DJAN Constanta, dosar nr41/1899;
Păuleanu, 2006). We think that these aspects of the
seasonality are specific for Mamaia also (it being
considered, in that period, a beach of Constanta).
The seasonality, as a way of evolution of the
activity, is the result of the combined activity of the
action of several factors. In the specialty literature,
there are several perspectives, regarding the
classifications of these factors. For our study, that
aims to analyze the touristic activity of the Mamaia
station according to seasonality, we focus on the
classification of factors after their actions over the
components of the touristic market in: factors of
demand and factors of touristic offer. There is the
tendency of some specialists, when they define
seasonality, to refer only to the tourists offer. For
instance, Biedermann thinks that seasonality has as
a permanent trait the brusque variation of the
demand according to a certain period of the year, and
Allcock emphasizes the fact that the fluxes of

SEA - Practical Application of Science Volume V, Issue 13 (1 / 2017)
75
tourists (representing the touristic demand) have the
tendency to focus on a shorter period of the year
(Biedermann, 2008; Allcock,1989). The touristic
demand (analyzed in the present study through the
indicators: number of arrivals, number of overnights
and the medium duration of the stay) is determined,
obviously by: economic factors (among which we
mention: the general level of economic
development, the degree of occupation of work
force, the level of income, the level and the structure
of consumption, the power of buying of the national
currency and the amount of leisure time) and the
sociologic factors (that refer to people, life style,
belonging to social groups, habits, traditions,
culture, influencing the buying and consumption
behavious) (Grigorescu.2003; Juganru, 1998).
Regarding the touristic offer, we think that the
natural factors (represented by the climate,
temperature, relief, position, natural resources) are
the most important. Also, for the analysis of the
seasonality, it is important to consider other specific
aspects as: the rigidity offer and the un-stock of the
touristic services. (Minciu, 2004; Jugănaru, 2007).
Practically, we have to consider that these three big
groups of factors do not act separately, but interact
and can influence at the same time the demand as
well as the touristic offer.
During the 110 years of existence of Mamaia station,
we can say that touristic offer, under the aspect of
the natural factors, has remained unchanged (even if
the consequences of the global warming are being
felt, as well as air and water pollution, and the
beaches were extended and improved), but has also
met big changes regarding the anthropogenic
element, in the sense that the number, capacity and
comfort degree of the units where the touristic
activity is manifested have grown. The development
and diversification of the material base of the station
of Mamaia, recorded in the periods after WWII and
until the 80s, correlated with the modifications
emerged regarding the economic and sociologic
factors, have contributed to the modification of the
seasonality, in the sense of the growth of the period
of touristic activity in Mamaia. Also, to the growth
of the duration of the touristic seasonality (from
May until September), a special contribution also
had the marketing strategy applied until the
beginning of the 90s. Mainly, this strategy wanted to
assure the correlation between the level of the
income, leisure time, and position on the work
market (hired or retired), tourists’ preferences and
the degree of comfort of touristic units, the level of
prices/tariffs and the practiced tourism forms.
(Jugănaru, 2000)
After the 90s, as a consequence of the modifications
from the economic life (changing the form of
property over the material base, of the legal
framework of manifestation of the activity, the
growth of inflation and unemployment, the decrease
of income etc), from the social life (changing social
structures, life style etc.) and the political life in our
country, but also from other countries of Europe, the
touristic activity of Mamaia station knew important
changes under several aspects. The impact of these
modifications was manifested also through the
decrease of the period of the touristic seasonality.
THE METHODOLOGY OF THE
QUANTITATIVE RESEARCH OF
SEASONALITY
The gnoseological approach of the analysis of the
series of time according to seasonality implies the
next steps: identification of the components of the
series of the aggregation scheme of the components;
measuring the variations according to seasonality
especially as seasonality co-efficient; verifications
of the hypothesis formulated over the components of
the series; prevision of the level of the seasonality
phenomena for a certain horizon of time (Baltagi,
B.H., 2002)
The decomposition methods of the series of time are
based on a series of hypotheses, more or less
restrictive, and these are:
a. The components of a series of time are the
result of a group of factors, which act differently:
either with a certain intra-annual regularity,
constantly, on a long term, either randomly. It is
considered that separating the components of the
series is possible, because the factors that make up
the components are isolated. But practically, most of
the times, the factors are not isolated, but
interdependent and act simultaneously over the
components of the series. Therefore, the separation
of the components of a series of time requires the
identification of the determinant factors and the
separation of their action on short term (intra-
annual), where the variations according to
seasonality are shaped and, on long term, the
tendency of the evolution of the phenomena is
shaped. (Gujati, D., 2001)
b. Another hypothesis is concerned with the
number of the terms of the series of time, supposing
that the series of time has a sufficient number of
terms that should allow the observation of the
general tendency of evolution. The most restrictive
hypotheses are formulated over the variations
according to seasonality. It is considered that, for
seasonality, the variations according to them are
compensated. If the variations according to
seasonality are monthly or quarterly, it is considered
that the influence of the variations according to
seasonality is neuter, at the level of the year, which
is the period of these seasonality components. If the
seasonality variations are scheduled they are
compensated at the level of 24 hours day. The
analysis of the seasonality component has as a main
aim the elimination of the variations according to
seasonality and obtaining the tendency of evolution

SEA - Practical Application of Science Volume V, Issue 13 (1 / 2017)
76
of the phenomena. The aim is achieved if the annual
level of the studied phenomena is preserved, which
is the annual average of the brute series equals the
annual average of the corrected series of the
variations according to seasonality. This condition
defines the hypothesis of conservation of areas. The
variations according to seasonality are estimated,
according to the aggregation scheme of the
components of the series of time. In the case of
additive scheme, they are estimated under the form
of seasonality deviations, and in the case of the
multiplicative scheme, as seasonality indicators. The
seasonality deviations, respectively, the seasonality
indicators, incorporate the random variations of the
series of time and represent waste. Hypothetically,
the random variations are in average 0, therefore
their presence does not affect the observation of the
hypothesis of the conservation of areas.
(Bourbonnais, R.; Terraza, M., 2004).
c. Another hypothesis, used in some methods
of seasonality adjustment refers to the periodicity of
seasonality variations. According to it, the
seasonality variations are repeated identically from
one seasonality sub-period to another. This
hypothesis is very restrictive, considering that the
variations according to seasonality can be random,
in amplitude and period. In order to respect this
hypothesis, the variations according to seasonality
are estimated through seasonality coefficients. In the
case of an additive model of aggregation of the
components of a series of time, the coefficient of the
seasonality according to a sub-period is calculated
as an arithmetic average of the seasonality-waste,
deviations related to that period, over the analyzed
years. In the case of the multiplicative aggregation
model, the seasonality coefficient if calculated as the
arithmetic average of the season-waste indicators
according to a sub-period, over the analyzed years.
The method of the mobile average is the classic
method of decomposition and analysis of the series
of time according to seasonality. In the present
study, we used this method, because the analyzed
series present seasonality well marked and
rigorously repetitive. Through the methods of
mobile mediums, we obtain the corrected series of
variations according to seasonality and seasonality
component. For the series of time of sufficiently big
dimension, the mobile medium has the property to
preserve the tendency, by filtering the random and
seasonality variations. The tendency presented as a
medium mobile is eliminated from the initial series.
From the resulted series, the random variations are
filtered, obtaining, in the end, the seasonality
component, presenting seasonality coefficients. The
calculation of seasonality coefficients is made
according to the principle of compensation of the
seasonality variations at the level of the year (the
principle of conservation of areas).
DATA, RESULTS AND DISCUSSIONS
In the analysis of seasonality at the level of Mamaia
station we used a data base made up of the monthly
values of three indicators of touristic circulation,
from 2010-2016. In order to measure the internal
and international touristic circulation, we consider
the mostly used indicators are the number of
tourists/arrivals, number of overnights and the
average duration of the stay, registered at a total
level and on two different sub-populations: “resident
tourists” and “not-resident tourists”. The
chronological series used in the statistics processing
were provided by the County Direction of Statistics
Constanta.
In order to know the amplitude of the seasonality
variations we calculate the indicators of seasonality,
valid for an entire series of annual periods. The idea
that is the base of the calculation of seasonality
variations consists of the possibility and using the
determination of that part from the annual total
which is owe to each of the 12 months of the year.
The coincidence factor that can emerge in a certain
year is considered as independent of what might
come up in the next year. For instance, if in a certain
year, the month of July is very rainy, this
coincidence factor is considered as independent
towards any other factor that might happen in the
month of July in the next year or in any other month
of July. If they are summed up for the month of July
from a series of year, the perturbations caused by
coincidence factors will be compensated
reciprocally. If the trend is also eliminated, what will
remain will be the seasonality variation that can be
expressed through an indicator or coefficient of
seasonality.
In order to calculate the indicators (coefficients) of
seasonality there are more methods. One of these,
the method of “mobile mediums”, used in the
present study as well, is the mostly used method for
measuring the seasonality variations. Due to the fact
that the variations have, by definition, a periodicity
of 12 months, we used the mobile mediums for 12
months. The method of the mobile mediums means
calculating the seasonality components of the
chronological series through dividing the trend at the
total of successive values of the series, the factor
coincidental conjuncture factor being afterwards
eliminated.
In order to model the tendency we used the method
of regression with the time variable. Because the
method of the mobile mediums is built on the
principles of classic conceptions, the seasonality
variations are considered identically repetitive from
one seasonality period to another, and the forecasted
values of the seasonality coefficients are equal to
determined values for the observed period.
(Vogelvang, B., 2005).
The calculation of the seasonality coefficients,
application of the method of mobile medium and

SEA - Practical Application of Science Volume V, Issue 13 (1 / 2017)
77
modeling of tendency was made with the specialized
program E-views.
Analysis of seasonality using the indicator
“Number of arrivals”
The monthly values of the seasonality coefficients
for the indicator “number of arrivals” are presented
in table 1.
The closer the value of these indicators gets to
1(100), the more the seasonality gets diminished,
and backwards; when it gets further away from 1
(100), the seasonality character of the number of
overnights is more obvious. As we can see, the
months July and August indicate very big values of
this indicator, especially for the resident category,
which implies a bigger value of the indicator at a
total level. Also, the months of January, February,
March, October, November and December record
very small values.
In the majority of studies, the indicator “number of
tourists” is considered the most representative
indicator and the most important in measuring the
touristic circulation. (Minciu, 2004). This is a
physical, quantitative indicator, that reflects the
dimension of the real demand recorded in the
hosting units. Another expression, used in
recordings/statistics, for this indicator, may be “the
number of departures/tourists’ departures”, for the
internal tourism, as well for the international one.
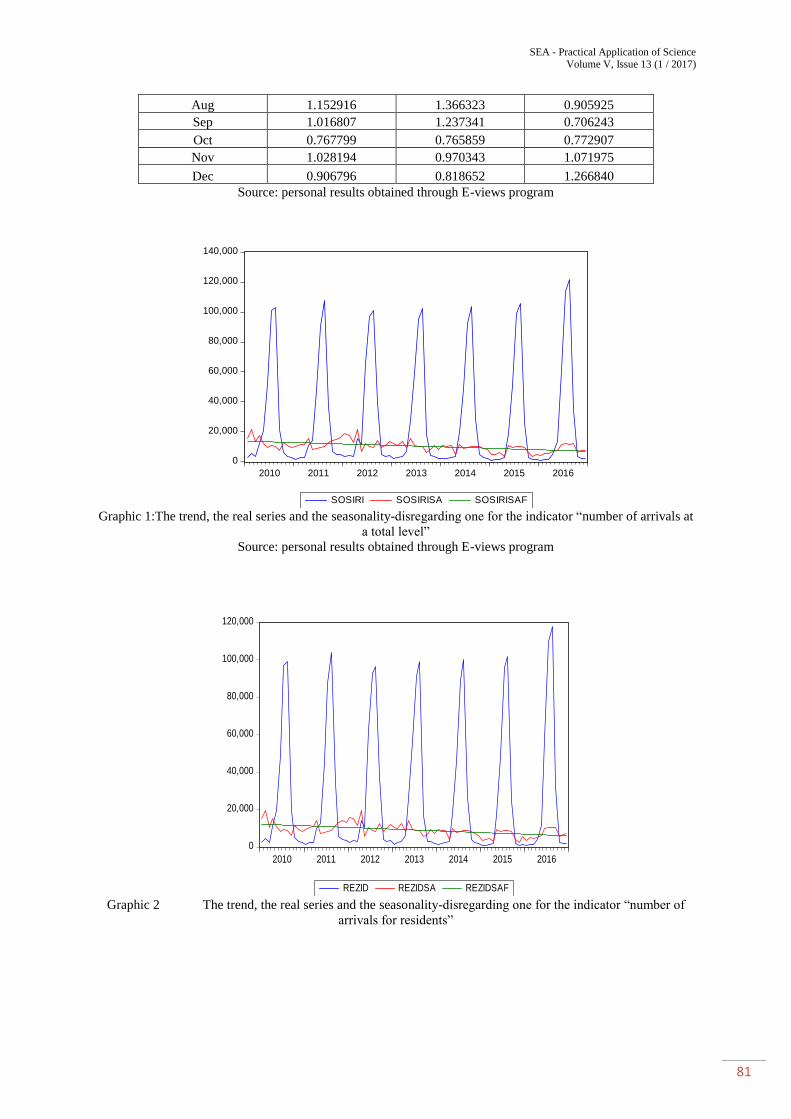
From the analysis of the values of the seasonality
coefficients for the indicator “number of arrivals”,
from 2010-2016 (see Table 1), we consider the next
aspects:
-the values of the seasonality coefficients for the
indicator “total number of arrivals” present big
differences between the levels recorded in the
months of May-September and the one recorded in
the other months of the year (Graphic 1). The high
values of the seasonality coefficients show an
overall intensification of the number of tourists, in
the period May-September in comparison with the
other months of the year.
-the values of the seasonality coefficients for the
indicator “number of arrival for resident tourists”,
in the period May-September, are bigger than the
values of seasonality coefficients for the indicator
“total number of arrivals”, which show that the
resident tourists come to Mamaia mostly during this
period. (graphic 2). At the same time, we can see that
the values of seasonality coefficients for the
indicator “number of arrivals for resident tourists”
record the smallest values (comparatively with the
other values of the indicator: total and not-resident
tourists), during the period January-March and
October-December. In other words, the resident
tourists do not prefer to come to Mamaia in the first
and last quarter of the year.
-the values of the coefficients of seasonality for the
indicator “number of arrivals” for “not-resident
tourists” and bigger than the ones registered by the
resident tourists, as well as the total tourists, in the
period January-March and October-December
(graphic 3). In this situation, we can say that more
not resident tourists arrive at Mamaia than resident
tourists, but also that the values of seasonality
coefficients for the indicator “total number of
arrivals” are influenced (in the same periods) by the
arrivals of not resident tourists. In the months June,
July and August, even if the values of the
coefficients grow significantly, comparatively with
the levels from the other months, they remain with
much lower values that the values of the coefficients
recorded by the resident tourists and total residents.
The analysis of seasonality using the indicator
“Number of overnights”
The monthly values of the seasonality coefficients
for the indicator “number of overnights” are
presented in table 2.
The indicator “number of overnights” or “number of
days-tourist” is a quantitative indicator, calculated
as the sum of the products between the number of
tourists and duration of the touristic activity,
expressed in days. (Minciu, 2004)
From the analysis of the values of the seasonality
coefficients for the indicator “number of
overnights”, from 2010-2016 (see Table 2), we
consider the next aspects:
-the values of the seasonality coefficients for the
indicator “total number of overnights” present big
differences between the levels recorded in the
months of May-September and the ones recorded in
the other months of the year (Graphic 4). The high
values show an intense touristic activity in the
period May-September (this being seen as the best
period of the year, and the very big values from July
and August form the peak period.
-the values of the seasonality coefficients for the
indicator “number of overnights for resident
tourists”, present bigger differences among the
levels registered in the months May-September and
the ones registered in the other months of the year,
in comparison with the values of the coefficients of
seasonality for the indicator “number of total
overnights” (graphic 5). This means that the resident
tourists come in bigger numbers and spend more
vacation days in Mamaia in the period May-
September, but particularly in the months July and
August.
-the values of the coefficients of seasonality for the
indicator “number of overnights” for “not-resident
tourists” are, on one side, much smaller than the
ones registered by the resident tourists, and on the
other side, they register smaller differences between
the values from the period May-September, in
comparison with the values from the other months
of the year (graphic 6). In this situation, we can say
that the flux of not resident tourists and/or duration
of their vacation at Mamaia are smaller, in
comparison with the resident tourists. At the same

SEA - Practical Application of Science Volume V, Issue 13 (1 / 2017)
78
time, the flux of not resident tourists in the period
January-May and October-December is bigger than
the one of resident tourists.
The analysis of seasonality using the indicator
“Average duration of the stay”
The monthly values of the seasonality coefficients
for the indicator “the average duration of the stay”
are presented in table 3.
The indicator “the average duration of the stay” is
calculated as the division between the number of
overnights (or day-tourists) and the number of
tourists.
From the analysis of the values of the seasonality
coefficients for the indicator “the average duration
of the stay”, from 2010-2016 (see Table 3), we
consider the next aspects:
-the values of the seasonality coefficients for the
indicator “the average duration of the stay” present
a special evolution, comparatively with the other
analyzed indicators. On one side, we can see that the
differences between the monthly values of the
seasonality coefficients are not as big as the ones
from the two first indicators. On one side, the
highest values of the seasonality coefficients are
registered in the months of January, February,
March and not in the period of summer months (as
we could see at the first two indicators). These
values (from the period January-March) are even
bigger than the values from July and August. Also,
the values of seasonality coefficient for November
is bigger comparatively with the values registered in
April, May, June and September. From the analysis
of the values of seasonality coefficients for the
indicators “total average duration of the stay” we
can say that the seasonality is not as emphasized as
in the case of the analysis “total number of arrivals”
and “total number of overnights”. The conclusion is
that the average duration of the stay varies not much,
in the 12 months of the year (graphic 7)
-the values of the seasonality coefficients for the
indicator “average duration of the stay for resident
tourists”, from May-September, are bigger than the
values of coefficients of seasonality for the indicator
“total average duration of the stay”, which shows
that the resident tourists spend at Mamaia, in this
period, a bigger period of time. Also, the values of
seasonality coefficients in May and September are
much bigger, comparatively with the values
registered by “not resident” tourists, which shows
that the promotion programs (based on smaller
tariffs/prices for resident tourists) contribute to the
reduction of seasonality (graphic 8);
-the values of the coefficients of seasonality for the
indicator “total number of overnights” for “not-
resident tourists” are bigger than the ones registered
by resident tourists, but also by the total tourists,
during January-March and October-December.
Totally different than the evolution of all the
presented indicators, in the period May-September,
the smallest values of the indicator “average
duration of the stay for not resident tourists” are
registered. This situation shows that the not resident
tourists spend a smaller duration of the stay during
summer and a bigger duration of the stay in the other
months of the year (graphic 9).
CONCLUSIONS
The touristic offer of Mamaia station is based on
elements of natural factors (especially the beach, the
sea, the sun, weather and temperature) and
anthropological factors (represented by building of
all types: hosting units, alimentation, recreation,
treatment, for developing touristic activities). From
the beginnings of the touristic activity, the offer was
determined, especially by natural factors, aspect that
determined and maintained the seasonality.
From the analysis of the values of seasonality
coefficients (see tables 1,2 and 3) of the three
indicators analyzed in our study, we can conclude
the following:
-the resident tourists choose to spend the vacation at
Mamaia in a bigger number, in the period May-
September, being attracted especially by natural
factors. The main forms of tourism practiced during
summer are: resting, relaxing, having fun, sports,
events, and to a smaller degree, the ones of cultural
tourism and business. In the other periods, Mamaia
offers resident tourists conditions for practicing
business, professional, cultural-academic tourism
etc.
-not-resident tourists spend the stay at Mamaia in all
the months of the year, but we can see an increase in
the period of extra-seasonality (see table 3), because
most of them have other motivations than the loisir
ones, as business and professional reasons.
During the last 10 years, the material base has grown
and diversified, a very important component of the
touristic offer of Mamaia station, but we can also
notice a strong intensification between 15th of June-
15th of September of every year. There are concerns
of tourism operators, in order to stimulate the
demand in the beginning and ending periods of
seasonality (the so-called “seasonality borders”,
respectively the pre-seasonality and post touristic
seasonality), in order to prolong the duration of the
seasonality, as it used to be in the 70s-90s. It is
important to take measures at a macroeconomic
level (regulations regarding the structure of the
schooling year, the number of national holidays,
duration of work time and free time), that should
sustain the efforts made at a micro-economic level
(the growth of the level of quality and satisfaction of
touristic performance, the increase of degree of
tourists’ loyalty, giving stimulations, discounts of
prices and tariffs, measures able to increase the
demand on a short term). On the other side, we
consider that it is necessary to organize more events

SEA - Practical Application of Science Volume V, Issue 13 (1 / 2017)
79
on the shore, in the periods before and after the
touristic seasonality, in order to attract tourists,
having other motivations that enjoying the sun,
beach or taking baths in the water of the sea.
REFERENCES
[1] Allcock, J.B. (1989). Seasonalityality. In S.F.
Witt & L. Moutinho (Eds.), Tourism marketing
and management handbook, Prentice Hall,
London
[2] Baltagi, B.H., Econometrics, Third Edition,
Springer, 2002
[3] Biederman, P.S. (2008). Travel and tourism: an
industry example, Pearson Education, Upper
Saddle River
[4] Bourbonnais, R., Terraza, M., Analyse des series
temporelles. Aplication a l’economie et a la
gestion, Dunod, Paris, 2004.
[5] Direcţia Judeţeană a Arhivelor Naţionale
Constanta, dosar nr4/1887, f.9-13, în Păuleanu,
2006, p144
[6] Direcţia Judeţeană a Arhivelor Naţionale
Constanta, dosar nr.19/1892,f.2-6, în
Păuleanu.2006 p.188
[7] Direcţia Judeţeană a Arhivelor Naţionale
Constanta, dosar nr41/1899, f.3-5, în Păuleanu.
2006 145
[8] Grigorescu,M. 2003. Sezonalitate în Marketing.
Dictionar explicativ. Bucuresti:Editura
Economica (coord. Malcomete, P., Florescu,
C.,Pop, Al.N.)
[9] Gujati, D., Econometrics by Example, Palgrave
Macmillan, 2001
[10] Jugănaru, I. D., 2007. Politici şi strategii în
turismul mondial. Bucureşti: Editura Expert.
[11] Jugănaru,M.1998.Teorie şi practica în
cercetarea de marketing.Bucureşti: Editura
Expert
[12] Jugănaru, M. 2000. Marketing. Bucureşti:
Editura Expert
[13] Koenig-Lewis, N., Bischoff, E., 2005.
Seasonalityality research: the state of the art,
International Journal of Tourism Research 7 (4-
5)
[14] Minciu,R. 2004, Economia turismului,
Bucureşti: Editura URANUS
[15] Păuleanu,D. 2006-Constanţa 1878-
1928.Spectacolul modernităţii târzii, Vol I,
Bucureşti: Editura ARCADE
[16] Vogelvang, B. Econometrics. Theory and
Applications with Eviews, Prentice Hall, 2005
[17] http://constanta-imagini-
vechi.blogspot.ro/2012/07/mamaia-numele-
unei-legende- partea I - 1906 - 1920.html

SEA - Practical Application of Science Volume V, Issue 13 (1 / 2017)
80
ANNEXES
Tabel.1 Coefficients of seasonality for the indicator total“number of arrivals”and for the two subpopulations
(residents and not-residents), from 2010-2016
Number of arrivals Total Residents Not-residents
Jan 0.176125 0.154069 0.383781
Feb 0.240378 0.229922 0.367856
Mar 0.261553 0.251215 0.396399
Apr 0.703518 0.722948 0.693554
May 1.748458 1.812673 1.591563
Jun 5.415487 5.894835 2.652918
Jul 9.552377 10.56099 3.374301
Aug 10.38197 11.48618 3.598088
Sep 2.849856 3.028851 1.975969
Oct 0.500468 0.453472 0.981344
Nov 0.329750 0.306257 0.579742
Dec 0.290658 0.285078 0.447081
Source: personal results obtained through E-views program
Tabel 2 Coefficients of seasonality for the indicator total“number of overnights” for the two subpopulations
(residents and not-residents), from 2010-2016
Number of
overnights
Total Residents Not residents
Jan 0.234831 0.160085 0.630573
Feb 0.277854 0.213156 0.661096
Mar 0.295581 0.256553 0.602520
Apr 0.551132 0.593166 0.652308
May 1.298837 1.533008 1.069994
Jun 5.311711 6.904481 1.805585
Jul 10.58614 14.04434 2.540156
Aug 11.90130 15.79880 2.846991
Sep 2.967266 3.780914 1.340464
Oct 0.402715 0.347149 0.816406
Nov 0.316890 0.261898 0.675612
Dec 0.285833 0.238535 0.590841
Source: personal results obtained through E-views program
Tabel nr. 3 Coefficients of seasonality for the indicator total“average duration of the stay” for the two
subpopulations (residents and not-residents), from 2010-2016
Average duration of
the stay
Total Resident Not-resident
Jan 1.456476 1.024390 1.645887
Feb 1.170477 0.915668 1.707489
Mar 1.121840 1.045134 1.335822
Apr 0.832324 0.787281 0.947470
May 0.704206 0.830730 0.689291
Jun 0.942699 1.151991 0.693256
Jul 1.127638 1.316346 0.876095
SEA - Practical Application of Science Volume V, Issue 13 (1 / 2017)
81
Aug 1.152916 1.366323 0.905925
Sep 1.016807 1.237341 0.706243
Oct 0.767799 0.765859 0.772907
Nov 1.028194 0.970343 1.071975
Dec 0.906796 0.818652 1.266840
Source: personal results obtained through E-views program
Graphic 1:The trend, the real series and the seasonality-disregarding one for the indicator “number of arrivals at
a total level”
Source: personal results obtained through E-views program
Graphic 2 The trend, the real series and the seasonality-disregarding one for the indicator “number of
arrivals for residents”
0
20,000
40,000
60,000
80,000
100,000
120,000
140,000
2010 2011 2012 2013 2014 2015 2016
SOSIRI SOSIRISA SOSIRISAF
0
20,000
40,000
60,000
80,000
100,000
120,000
2010 2011 2012 2013 2014 2015 2016
REZID REZIDSA REZIDSAF

SEA - Practical Application of Science Volume V, Issue 13 (1 / 2017)
82
Graphic 3 The trend, the real series and the seasonality-disregarding one for the indicator “number of
arrivals for not residents”
Graphic.4 The trend, the real series and the seasonality-disregarding one for the indicator “number of overnight
staying at a total level”
Source: personal results obtained through E-views program
Graphic 5 The trend, the real series and the seasonality-disregarding one for the indicator “number of overnights
for residents
0
1,000
2,000
3,000
4,000
5,000
6,000
2010 2011 2012 2013 2014 2015 2016
NEREZ NEREZSA NEREZSAF
0
100,000
200,000
300,000
400,000
500,000
2010 2011 2012 2013 2014 2015 2016
INNOPTARI
INNOPTASA
INNOPTASAF
0
100,000
200,000
300,000
400,000
500,000
2010 2011 2012 2013 2014 2015 2016
REZIDENSA
REZIDENSAF
REZIDENTI

SEA - Practical Application of Science Volume V, Issue 13 (1 / 2017)
83
Graphic.6 The trend, the real series and the seasonality-disregarding one for the indicator “number of overnights
for not residents
Graphic 7 The trend, the real series and the seasonality-disregarding one for the indicator “average duration of
the stay at a total level”
Graphic 8 The trend, the real series and the seasonality-disregarding one for the indicator “average duration of
the stay for residents”
0
4,000
8,000
12,000
16,000
20,000
2010 2011 2012 2013 2014 2015 2016
NEREZIDSA
NEREZIDSAF
NEREZIDENTI
0
2
4
6
8
10
12
14
16
2010 2011 2012 2013 2014 2015 2016
DURATA_MEDIE_SEJUR
DURATA_SA
DURATA_SAF
1
2
3
4
5
6
7
2010 2011 2012 2013 2014 2015 2016
REZID REZIDSA REZIDSAF

SEA - Practical Application of Science Volume V, Issue 13 (1 / 2017)
84
Graphic 9. The trend, the real series and the seasonality-disregarding one for the indicator “average duration of
the stay for not residents”
0
10
20
30
40
50
60
2010 2011 2012 2013 2014 2015 2016
NEREZ NEREZSA NEREZSAF