aspects of microbially induced corrosion · 2/1/2015 · x. campaignolle, d. festy and j.-l. crolet...
TRANSCRIPT

European Federation of Corrosion Publications
NUMBER 22
Aspects of
MICROBIALLY INDUCED CORROSION
papers from EUROCORR '96
and The EFC Working Party on Microbial Corrosion
Edited by D. Thierry
Published for the European Federation of Corrosion by The Institute ofMateriaIs
THE INSTITUTE OF MATERIALS 1997

Book number 686 Published 1997 by
The Institute of Materials 1 Carlton House Terrace
London SWlY 5DB
0 The Institute of Materials 1997 All rights reserved
ISBN 1 86125 050 9
British Library Cataloguing in Publication Data Available on application
Neither the EFC nor The Institute of Materials is responsible for any views expressed
in this publication
Typeset by Fakenham Photosetting Ltd
Fakenham, UK
Printed and bound at The University Press
Cambridge, UK

European Federation of Corrosion Publications Series Introduction
The EFC, incorporated in Belgium, was founded in 1955 with the purpose of promoting European co-operation in the fields of research into corrosion and corrosion prevention.
Membership is based upon participation by corrosion societies and com- mittees in technical Working Parties. Member societies appoint delegates to Working Parties, whose membership is expanded by personal corresponding membership.
The activities of the Working Parties cover corrosion topics associated with inhibition, education, reinforcement in concrete, microbial effects, hot gases and combustion products, environment sensitive fracture, marine environ- ments, surface science, physico-chemical methods of measurement, the nuclear industry, computer based information systems, corrosion in the oil and gas industry, and coatings. Working Parties on other topics are estab- lished as required.
The Working Parties function in various ways, e.g. by preparing reports, organising symposia, conducting intensive courses and producing instruc- tional material, including films. The activities of the Working Parties are co- ordinated, through a Science and Technology Advisory Committee, by the Scientific Secretary.
The administration of the EFC is handled by three Secretariats: DECHEMA e. V. in Germany, the Soci6t6 de Chimie Industrielle in France, and The Institute of Materials in the United Kingdom. These three Secretariats meet at the Board of Administrators of the EFC. There is an annual General Assembly at which delegates from all member societies meet to determine and approve EFC policy. News of EFC activities, forthcoming conferences, courses etc. is published in a range of accredited corrosion and certain other journals throughout Europe. More detailed descriptions of activities are given in a Newsletter prepared by the Scientific Secretary.
The output of the EFC takes various forms. Papers on particular topics, for example, reviews or results of experimental work, may be published in scien- tific or technical journals in one or more countries in Europe. Conference pro- ceedings are often published by the organisation responsible for the conference.
In 1987 the, then, Institute of Metals was appointed as the official EFC pub- lisher. Although the arrangement is not exclusive and other routes for publi- cation are still available, it is expected that the Working Parties of the EFC will use The Institute of Materials for publication of reports, proceedings etc. wherever possible.
A. D. Mercer Series Editor The Institute of Materials, London, UK

viii Series Introduction
EFC Secretariats are located at:
Dr B. A. Rickinson European Federation of Corrosion, The Institute of Materials 1 Carlton House Terrace, London, SWlY 5DB, UK
Mr P. Berge Fbdbration Europkene de la Corrosion, Sociktb de Chimie Industrielle, 28 rue Saint-Dominique, F-75007 Paris, FRANCE
Professor Dr G. Kreysa Europaische Foderation Korrosion, DECHEMA e. V., Theodor-Heuss-Allee 25, D-60486, Frankfurt, GERMANY

Contents
Series Introduction
Preface
vii
ix
Sulfidogenic Bacteria and Microbial Corrosion
An Updated Portrait of the Sulfidogenic Bacteria Potentially Involved in the Microbial Corrosion of Steel M . MAGOT, c. TARDY-JACQUENOD AND ].-L. CROLET
3
Microbial Corrosion of Carbon Steel by Sulfate-Reducing Bacteria:
L.V. NIELSEN AND L.R. HILBERT Electrochemical and Mechanistic Approach 11
A Search for the Risk Factors Involved in the Carbon Steel Corrosion Induced by Sulfidogenic Bacteria X. CAMPAIGNOLLE, D. FESTY AND J.-L. CROLET
Biofilms and Corrosion
Correlation Between Marine Biofilm Structure and Corrosion Behaviour of Stainless Steels in Sea Water V. SCOTTO AND M.E. LAI
On Oxygen Reduction Depolarisation Induced by Biofilm Growth on Stainless Steels in Seawater A. MOLLICA, E. TRAVERSO AND D. THIERRY
Characterisation of Biofilm Formed in Sea Water by Mass Transport Analysis E. L’HOSTIS, B. TRIBOLLET AND D. FESTY
Biofilms Analysis of Different Steels Immersed in Ground Water F. FEUGEAS, G. EHRET A N D A. CORNET
Evaluation of Electrochemical Noise Analysis as an On-Line Monitoring Tool to Distinguish Between Biofilm-Associated Localised Corrosion and Oxygen Corrosion T. WHITHAM A N D s. HUIZINGA
25
41
51
65
77
89
vi Contents
Influence of Micro-Organisms on the Free Corrosion Potentials of Stainless Steels in Natural Sea Water D. FERON, 1. DUPONT AND G. NOVEL
Laboratory Simulation with Natural Bacteria Populations L. CARPEN, L. RAASKA, K. MATTILA, M . SALKINOJA-SALONEN AND T. HAKKARAINEN
Influence of Surface Condition on MIC
Influence of Metal Surface Condition on Microbiologically Influenced Corrosion of Stainless Steels Z.G. CHEN, P. GUMPEL, M . KABER AND X. KREIKENBOHM
Experience of Microbial Corrosion Prevention
Microbial Corrosion Prevention in ENEL Power Plants p. CRISTlANl AND G. BIANCHI
103
113
125
137

Sulfidogenic Bacteria and
Microbial Corrosion

An Updated Portrait of the Sulfidogenic Bacteria Potentially Involved in the Microbial Corrosion
of Steel
M. MAGOT, C. TARDY-JACQUENOD* and J.-L. CROLET*‘
Sanofi Recherche, Unite de Microhiologie, F-31676 Lahege, France. *Lahoratoire d’Oct5anologie Biologique, Universitk de Bordeaux, F-33120 Arcachon, France.
**Elf Aquitaine Production, F-64018 Pau, France
ABSTRACT The involvement of sulfate-reducing bacteria (SRB) in corrosion processes has been recognised and studied for a long time. Nevertheless, a lot of new species have been described during the past 10 years. Many of these previously unknown bacteria were isolated from oil industry production waters.
Recently, a new group of very diverse anaerobic, thiosulfate-reducing bacteria (TRB) was also suspected to act as corrosive agents. New metabolisms of already known bacteria, new species of already known genera, as well as bacteria representing new branches of the phylogenetic tree of the domain Bacteria, were discovered. These new strains were shown to be able to produce, when reducing thiosulfate, the same metabolic end produtcs as SRBs, mainly hydrogen sulfide and organic acids, but they do not use the same carbon and energy sources and do not reduce sulfate. The hy- pothesis of their involvement in some specific cases of bacterial corrosion of steel was strengthened when tested in corrosion experiments.
Sulfate-Reducing Bacteria
The first sulfate-reducing bacterium (SRB), Desulfovibrio desulfuvicans, was dis- covered by Beijerinck in 1895, and this is probably still the most common SRB species which can be isolated from industrial waters. It is worth noting that in 1980, i.e. 85 years later, only 3 genera including 13 species were known. At that time, our knowledge of the diversity and metabolism of the sulfate- reducing bacteria (SRB) was quite clear and simple: they were described as strict anaerobes reducing sulfate to hydrogen sulfide, and gaining energy from the oxidation of a limited number of nutrients (e.g. lactate, pyruvate).
This perception dramatically changed between 1977 and 1982, when Pfennig and Widdel described several new SRB species, including 6 new gen- era, and showed that these bacteria can use a much wider range of substrates: the SRB represent a much wider and heterogeneous group of micro- organisms than had been previously suspected.[l] At the end of 1995,67 dif- ferent species representing 20 genera had already been described, to which
4 Aspects of Microbially Induced Corrosion
one must add tens of partially described strains. It is obvious that the SRB story is far from over, since more and more new species are described each year!
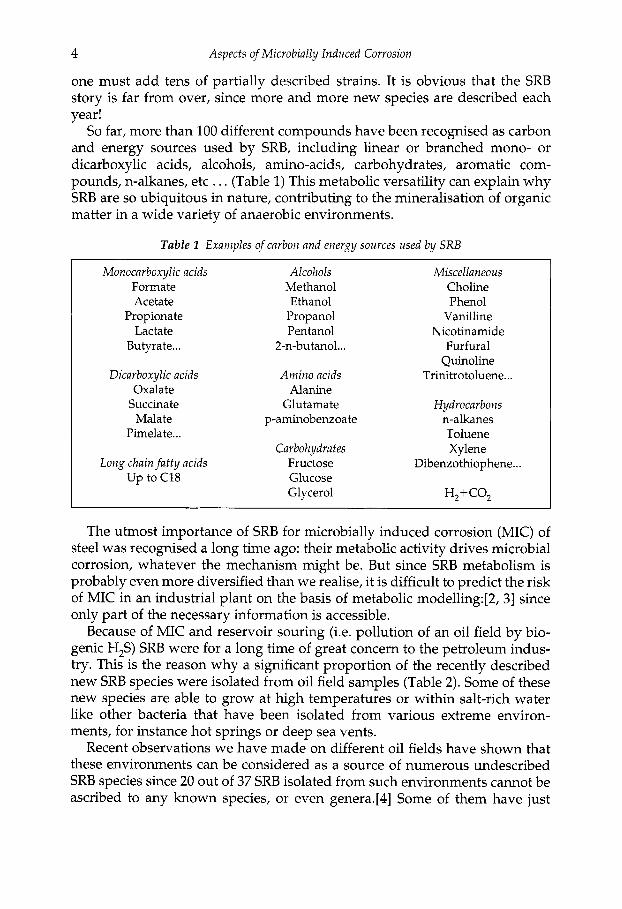
So far, more than 100 different compounds have been recognised as carbon and energy sources used by SRB, including linear or branched mono- or dicarboxylic acids, alcohols, amino-acids, carbohydrates, aromatic com- pounds, n-alkanes, etc . . . (Table 1) This metabolic versatility can explain why SRB are so ubiquitous in nature, contributing to the mineralisation of organic matter in a wide variety of anaerobic environments.
Table 1 Examples of carbon and energy sources used by SRB
Monocarboxylic acids Alcohols Miscellaneous Formate Methanol Choline Acetate Ethanol Phenol
Propionate Propanol Vanilline Lactate Pentanol Nicotinamide
Butyrate ... 2-n-butanol.. . Furfural
Dicarboxylic acids Amino acids Trinitrotoluene.. . 0 x a 1 at e Alanine
Succinate Glutamate Hydrocarbons Malate p-aminobenzoate n-alkanes
Pimelate.. . Toluene Carbohydrates Xylene
Long chain fa t t y acids Fructose Dibenzothiophene.. .
Quinoline
Up to C18 Glucose Glycerol H, + CO,
The utmost importance of SRB for microbially induced corrosion (MIC) of steel was recognised a long time ago: their metabolic activity drives microbial corrosion, whatever the mechanism might be. But since SRB metabolism is probably even more diversified than we realise, it is difficult to predict the risk of MIC in an industrial plant on the basis of metabolic modelling:[2, 31 since only part of the necessary information is accessible.
Because of MIC and reservoir souring (i.e. pollution of an oil field by bio- genic H,S) SRB were for a long time of great concern to the petroleum indus- try. This is the reason why a significant proportion of the recently described new SRB species were isolated from oil field samples (Table 2). Some of these new species are able to grow at high temperatures or within salt-rich water like other bacteria that have been isolated from various extreme environ- ments, for instance hot springs or deep sea vents.
Recent observations we have made on different oil fields have shown that these environments can be considered as a source of numerous undescribed SRB species since 20 out of 37 SRB isolated from such environments cannot be ascribed to any known species, or even genera.[4] Some of them have just

Sulfidogenic Bacteria Potentially Involved in the Microbial Corrosion of Steel 5
Year
Table 2 Recently described SRB species isolated porn oil field waters.
Name
1988 1988 1992 1995 1995 1996 1996 1996 1996 1996
(1997)
Desulfomicrobium aspheronum Desulfotomaculum kuznetsovii Desulfovibrio longus Desulfacinum infernum Thermodesulforhabdus norvegicus Desulfovibrio gabonensis Desulfovibrio gracilis Desulfovibrio bastinii Desulfovibrio tubi Desulfovibrio caledoniensis Desulfotomaculum halophilum
Refs.
5 6 7 8 9
10 11 11 11 11 12
been characterised (Table 2), but many new strains isolated from this single type of ecosystem remain to be described.
What we know of their metabolism shows that it is generally not very orig- inal. But we must keep in mind that metabolic studies usually deal with a tra- ditional set of compounds, even if 50 to 100 substrates are sometimes tested for a single strain. The molecular pattern of crude oil, within which the bac- teria thriving in these environments can probably find their nutrients, is so huge that we will perhaps never know what the compounds are that are actually used by these bacteria in situ.
Thiosulf ate-Reducing Bacteria
Today SRB and sulfate-reduction no longer represent the only sulfidogenic metabolism involved in microbial corrosion, whereas it is precisely sulfide production which is mainly driving MIC processes. Most SRB, including all the strains we have isolated from oil fields, can also use thiosulfate as an elec- tron acceptor,[4] but other non sulfate-reducing bacteria are also able to pro- duce H,S from thiosulfate-reduction.
In 1991, Elf Congo suffered the breakthrough of a 23 km undersea oil pipeline which was shown to be due to bacterial corrosion. This case was very unusual since it occurred in less than one year, that is to say, the penetration rate of this pitting corrosion was one centimeter per year! Besides several SRB species, we discovered the unexpected presence of anaerobic non sulfate- thiosulfate-reducing bacteria (TRB) in a water sample taken from the corroded pipeline.[l3,14] All the 14 halophilic TRB isolates from this oil field represent new, previously undescribed genera or species. Three of them have just been completely characterised
Dethiosulfivibvio peptidovorans [15] (Fig. 1) is an anaerobic vibrio with mor- phology very similar to that of most Desulfovibrio. It can grow optimally at

6 Aspects of Microbially Induced Corrosion
Desulfovibrio longus (SRB)
Desulfotomaculum halophilum (SRB)
Desulfovibrio gabonensis (SRB)
Thermotoga elfii (TRB)
Thermoanaerobacter brockii subsp. Iactietkylicus (TRB)
Dethiosulfovibrio peptidovorans (TRB)
Fig. 1 New SRB and TRB species
42°C and in 3% NaCl concentration, but can support up to 11% NaC1. It can- not use carbohydrates or organic acids as carbon and energy sources, but can grow using peptides or amino-acids. The presence of thiosulfate, which is re- duced into hydrogen sulfide, sharply increases its growth. This bacterium was the first TRB experimentally shown to be able to corrode iron with very high penetration rates.[2]
Haloanaerobiurn congolense [16] (Fig. 1) is an obligate halophilic strict anaer-
Sulfdogenic Bacteria Potentially lnvolved in the Microbial Corrosion of Steel 7
obe, which is able to grow in NaCl concentrations ranging from 4 to 24% (op- timum 10%) at 42°C. As well as peptides, but not amino acids, this bacterium can use several carbohydrates as nutrients. Thiosulfate improves carbohy- drate utilisation and cell growth. Hydrogen inhibits growth, but this inhi- bition is reversed by the addition of thiosulfate.
Spirochaeta smaragdinae [17] is a long and very thin spirochaete with corkscrew-like motility. This is the first bacterium of this group that has been isolated from oil field water. The optimum temperature for growth is 37"C, and optimum salinity 5% NaC1. Growth is possible between 1.5 and 10% NaC1. Growth occurs in the presence of several carbohydrates, and thiosulfate is reduced to hydrogen sulfide.
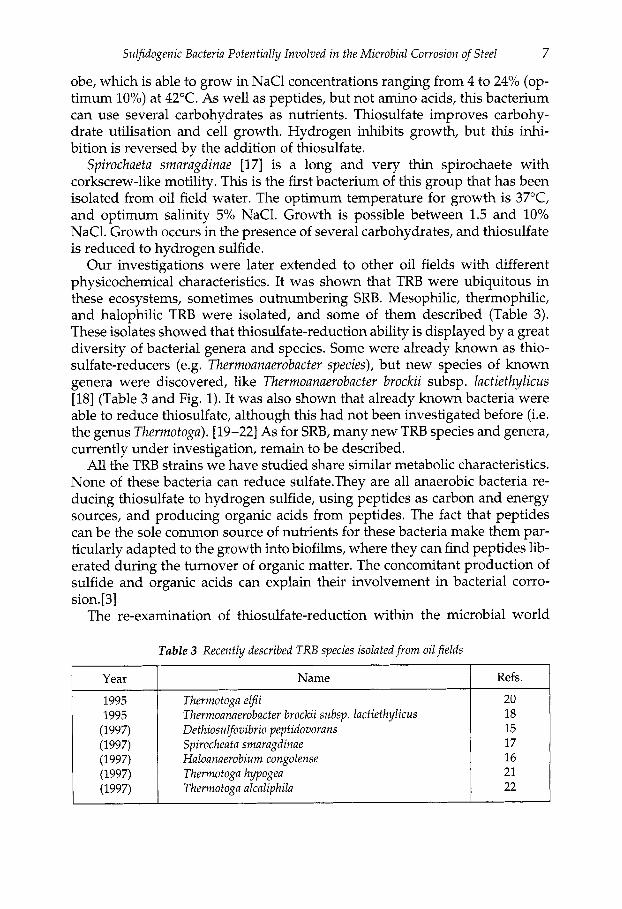
Our investigations were later extended to other oil fields with different physicochemical characteristics. It was shown that TRB were ubiquitous in these ecosystems, sometimes outnumbering SRB. Mesophilic, thermophilic, and halophilic TRB were isolated, and some of them described (Table 3). These isolates showed that thiosulfate-reduction ability is displayed by a great diversity of bacterial genera and species. Some were already known as thio- sulfate-reducers (e.g. Thermoanaerobacter species), but new species of known genera were discovered, like Thermoanaerobacter brockii subsp. lacfiethylicus [18] (Table 3 and Fig. 1). It was also shown that already known bacteria were able to reduce thiosulfate, although this had not been investigated before (i.e. the genus Therrnotoga). [19-221 As for SRB, many new TRB species and genera, currently under investigation, remain to be described.
All the TRB strains we have studied share similar metabolic characteristics. None of these bacteria can reduce sulfate.They are all anaerobic bacteria re- ducing thiosulfate to hydrogen sulfide, using peptides as carbon and energy sources, and producing organic acids from peptides. The fact that peptides can be the sole common source of nutrients for these bacteria make them par- ticularly adapted to the growth into biofilms, where they can find peptides lib- erated during the turnover of organic matter. The concomitant production of sulfide and organic acids can explain their involvement in bacterial corro- sion. [ 31
The re-examination of thiosulfate-reduction within the microbial world
Year Name Refs.
1995 1995
(1997) (1997) (1997) (1997) (1997)
Thermotoga elfii 20 Thermoanaerobactev brockii subsp. lactietkylicus 18 DethiosuIfovibrio peptidovorans 15 Spirocheata smaragdinae 17 Haloanaerobium congolense 16 Thermotoga hypogea 21 Thermotoga alcaliphila 22
8 Aspects of Microbially Induced Corrosion
opens up a new exciting challenge for microbiologists. Besides its importance for MIC and the discovery of numerous new bacterial species, new metabolic properties could also be discovered. [23] Moreover, the most ancestral micro- bial branches of both the Bacteria and Archaea domains share thiosulfate- reduction and other uncommon metabolic abilities. These characteristics have been suspected to be reminiscent of an ancestral metabolism, giving us the opportunity of a new insight into the origins of life.[24]
1.
2.
3.
4.
5.
6.
7.
8.
9. 10.
11.
12.
13.
14.
15.
References
Bergq's Manual of Systematic Bacteriology Vol. 1, Williams and Wilkins, Baltimore/London, 1984. X. Campaignolle, P. Caumette, F. Dabosi and J.L. Crolet: Corrosion 96, Paper 96273, NACE, Houston Tx, 1996. J.L. Crolet, S. Daumas and M. Magot: Corrosion 93, Paper 93303, NACE, Houston Tx, 1993. C. Tardy-Jacquenod, P. Caumette, R. Matheron, C. Lanau, 0. Arnauld et al., Can. J. of Microbiol., 1996,42, 259-266. E.P. Rozanova, T.N. Nazina and A.S. Galushko: Mikrobiologiya, 1988, 57,
T.N. Nazina, A.E. Ivanova, L.P. Kanchaveli and E.P. Rozanova: Mikrobiologiya, 1988, 57, 823-827. M. Magot, P. Caumette, J.M. Desperrier, R. Matheron, C. Dauga et al.: Int. J . Syst. Bacteriol., 1992, 42, 398-403. G.N. Rees, G.S. Grassia, A.J. Sheehy, P.P. Dwivedi and B.K.C. Patel: Int. 1, Syst. Bacteriol., 1995, 45, 85-89. J. Beeder, T. Torsvik and T. Lien: Arch. Microbiol., 1995, 164, 331-336. C. Jacquenod-Tardy, M. Magot, F. Laigret, M. Kaghad, B.K.C. Patel et al.: Int. J. Syst. Bacteriol., 1996,46, 710-715. C. Jacquenod-Tardy: 'Biodiversite, taxonomie et phylogenie des bac- teries sulfato-reductrices isolees de champs pbtroliers: exemples de gise- ments sales et chauds', Th2se de Doctorat, Universite de Bordeaux I, 1996. C. Tardy-Jacquenod, M. Magot, B.K.C. Patel, R. Matheron and P. Caumette: Int. J. Systematic Bacteriology, in press. M. Magot, L. Carreau, J.L. Cayol, B. Ollivier and J.L. Crolet: Microbial Corrosion - Proceedings of the 3rd European Federation of Corrosion Workshop, European Federation of Corrosion Publication no 15, The Institute of Materials, London, 1995, 293-300. J.L. Crolet and M. Magot: Corrosion 95, paper 95188, NACE, Houston Tx, 1995. M. Magot, G. Ravot, B. Ollivier, B.K.C. Patel and J.L. Garcia: Int. J. Systematic Bacteriology, 1997,47, 818-824.
634-641.
16.
17.
18.
19.
20.
21.
22.
23.
24.
Sulfidogenic Bacteria Potentially Involved in the Microbial Corrosion of Steel 9
G. Ravot, M. Magot, B. Ollivier, B.K.C. Patel, E. Ageron et al.: FEMS Microbiology Letters, 1997,147, 81-88. M. Magot, M.L. Fardeau, 0. Arnauld, C. Lanau, B. Ollivier et al.: Int. J . Systematic Bacteriology, in press. J.L. Cayol, B. Ollivier, B.K.C. Patel, G. Ravot, M. Magot et al.: Int. J. Syst. Bacteriol., 1995,45, 783-789. G. Ravot, B. Ollivier, M. Magot, B.K.C. Patel, J.L. Crolet et al.: Appl. Environ. Microbiol., 1995, 61,2053-2055. G. Ravot, M. Magot, M.L. Fardeau, B.K.C. Patel, G. Prensier et al.: Int. J. Syst. Bacteriol., 1995,45,308-314. M.L. Fardeau, B. Ollivier, M. Magot, P. Thomas and B.K.C. Patel: Int. 1. Systematic Bacteriology, in press. G. Ravot, Y. Combet-Blanc, M. Magot, B.K.C. Patel and B. Ollivier: Abstracts of the 97th General Meeting, General Meeting of the American Society for Microbiology, Miami Beach, 1997. C. Faudon, M.L. Fardeau, J. Heim, B.K.C. Patel, M. Magot et al.: Current Microbiology, 1995, 31, 152-157. G. Ravot, B. Ollivier, M.L. Fardeau, B.K.C. Patel, K.T. Andrews et al.: Appl. Environ. Microbiol., 1996, 62,2657-2659.
Microbial Corrosion of Carbon Steel by Sulfate- Reducing Bacteria: Electrochemical and
Mechanistic Approach
L.V. NIELSEN and L.R. HILBERT
The Institute of Manufacturing Engineering, Corrosion and Surface Technology, Building 204, The Technical University of Denmark, DK-2800 Lyngby, Denmark.
ABSTRACT Electrochemical measurements (polarisation curves and ax. impedance) have been conducted on carbon steel coupons exposed to SRB-active environments. Results from ax. impedance measurements show that very large interfacial capacities are found in such systems, and consequently high capacitive currents are to be expected when con- ducting d.c. polarisation scans. Further, it is indicated that the interfacial capacitance correlates with the concentration of dissolved sulfide, which in turn, to some degree, correlates with hydrogenase activity. It is suggested that the large and increasing inter- facial capacitance is reponsible for the large potential hysteresis generally found in d.c. polarisation curves obtained in these environments. By comparing polarisation curves obtained using different scan rates in an inorganic control environment, it is suggested that an ever increasing interfacial capacitance may be responsible for a misleading con- clusion that increased corrosion rates are caused by cathodic depolarisation in SRB- active environments.
1. Introduction
Several mechanisms have been suggested in the literature to account for the increased corrosion rate on carbon steel in the presence of sulfate-reducing bacteria (SRB). The classical theories include the idea of enhanced kinetics of the hydrogen evolution reaction (cathodic depolarisation) due to either hy- drogenase enzyme activity,[l] ferrous sulfide films formed as corrosion prod- ucts on the steel surface,[2] or dissociation of dissolved hydrogen sulfide.[3]
In general, the current flowing to an electrode system in a potentiodynamic scan may be described as the sum of a Faradaic- and a capacitive current, where the Faradaic current represents the rate at which electrochemical reac- tions occur and the capacitive current represents the current needed to satisfy the interfacial capacitance associated with the electrochemical double layer at a given scan rate:
i = i, + i, For charge transfer controlled kinetics across a simple electrochemical
12 Aspects of Microbially Induced Corrosion
double layer, this sum can be described by the following relationship, which is generally observed between current and potential in electrochemical polar- isation experiments: [4]
i = i,,,, (exp(2.3(E-E,,,,)1Pu) - exp(-2.3(E-E,,,,)/P,)) + C(6E/W (2)
where
p,, p, = the anodic and cathodic Tafel slopes respectively, C = the interfacial capacitance, 6 E / 6 t = applied voltage scan rate.
It should be noted that the capacitive current depends on the applied scan rate, while this is not the case for the Faradaic contribution. For this reason, it is necessary to keep the scan rate fairly slow if capacitive currents are to be neglected. In the majority of systems, a 'fairly slow' scan rate may be in the range 10-30 mV/minute, however, it should be chosen in respect to the elec- trode time constant.
In this paper, it is demonstrated that electrochemical polarisation experi- ments conducted at scan rates of 10-30 mV/minute on carbon steel coupons exposed in SRB active environments may lead to the wrong conclusion i.e., that continuous cathodic depolarisation occurs.
2. Experimental
The experimental work summarised in this paper includes electrochemical measurements on carbon steel exposed to biological (SRB-active) environ- ments, studies on SRB activity (sulfate-turnover) by radioactive tracer analy- sis, and simple electrochemical control experiments performed in an inorganic environment. These control experiments were conducted for the purpose of verifying the effect of using scan rates that are much too high in view of the electrode time constant.
2.1 Electrochemical Measurements in SRB-Active Environments
A biological reactor based on the totally mixed rotating drum type was used for the studies on the electrochemical behaviour of carbon steel exposed to SRB-active environments. Steel coupons (composition given in Table 1) were flush mounted in the reactor wall and used for electrochemical measurements throughout the experimental period (typically 70-80 days). Polarisation scans and a.c. impedance measurements were conducted throughout the period on coupons that had not already been used for electrochemical measurements. Saturated calomel electrodes were used as reference and platinum plates as counter electrodes. The reactor design has been described in more detail else- where.[5]

Microbial Corrosion of Carbon Steel by Sulfate-Reducing Bacteria
Table 1 Chemical composition of the carbon steel coupons used in the electrochemical studies (% by weight, balance Fe)
13
C 0.085
Cr 0.08
Si Mn P S 0.159 0.480 0.013 0.009
Mo Ni c u N 0.024 0.090 0.290 0.005
Artificial sea water (according to ASTM standard D 1141-80) enriched with nutritional components favouring the growth of SRBs (Table 2) served as elec- trolyte. A mixed bacterial culture isolated from a crude oil terminal was used as inoculum. Several experiments were carried out in the reactor, using both the batch-, and the semi continuous culturing technique. In the latter case, a fresh amount of nutrients was added at frequent time intervals.
Na-lactate 0.25
Table 2 Nutritional components added to the artificial seawater (g L-I)
Na,HPO, Yeast extract ascorbic acid 0.01 0.20 0.02
KNo, 0.05
Electrochemical polarisation scans and a.c. impedance measurements were carried out using the SI 1280 CM unit from Schlumberger controlled with OMEGA Pro software from CML. The polarisation scans were made from the open circuit corrosion potential (OCP) in the cathodic direction (600-700 mV), then reversed and taken via the initial OCP to potentials approximately 500 mV more anodic than the OCP, then back to the initial OCP. Scan rates were 10 mV/minute, unless otherwise stated.
The a.c. impedance measurements were performed in the frequency range 1 mHz-10 kHz. In this paper, the impedance measurements served only to assess the electrode time constants given as the product of the interfacial capacitance and the polarisation resistance derived from the single semicircle obtained in the Nyquist plot.
Environmental parameters were monitored throughout the experiment, in- cluding the amount of total acid-volatile sulfide analysed spectrophotometri- cally by the methylene blue method. Carbon profiles (lactate and acetate) were established by HPLC. Bacterial hydrogenase activity was assessed using a commercial test kit from Caproco. Using this kit, a ranking of the hydrogenase activity can be obtained on a 0-3 scale, however, in these studies it was used only on an 'on/off' basis (activity - no activity).
2.2 Studies on Sulfate-Turnover by Radioactive Tracer Analysis
Specific simple experiments were carried out with the purpose of studying the effect of energy source on sulfate-turnover (sulfide production). The experi-
14 Aspects of Microbially Induced Corrosion
ments were made using the same electrolyte and nutritional composition as described in section 2.1 with the exception that radioactive sulfate (35S) was added in a 100 mg L-l concentration instead of the sulfate present in the arti- ficial sea water. Three different experiments are reported here; one in which 250 mg L-l Na-lactate was added as energy source, another in which 100 mg L-l was added, and a third in which the lactate was substituted by hydrogen (solution saturated prior to the experiment). The radioactivity was measured prior to inoculating the mixed SRB-culture and over a period of 8 days there- after. Resulting radioactivity was compared with a blank kept under sterile conditions throughout the period, thereby allowing calculation of the concen- tration of radioactive sulfate throughout the time of the test.
2.3 Electrochemical Measurements in the Inorganic Control Environment
A 1M sodium acetate solution adjusted with acetic acid to pH = 6 served as the inorganic control environment. A plain carbon steel coupon was used as the working electrode in a traditional 3-electrode electrochemical arrange- ment with saturated calomel (SCE) as reference- and a platinum wire as counter electrode. The measurements were taken under nitrogen purging con- ditions and at ambient temperature.
Potentiodynamic scans were obtained with scan rates of 24000,6000,1200, 240, and 30 mV/minute (in this order) using the same electrode. Prior to these scans, the electrode time constant was assessed using a.c.-impedance as described in section 2.1.
3. Results and Discussion
In general, the attempt was made to correlate the electrochemical measure- ments made in the biological environments with characteristics of the environmental development. In this context it has been observed that a certain correlation exists between bacterial hydrogenase activity, sulfide production (resulting sulfide concentration), and the interfacial capacitance of the elec- trode. The outcome of the electrochemical measurements should be seen in this light.
3.1 Observations on Carbon Access, Hydrogenase Activity, and Sulfide Production
A typical sulfide profile (sulfide versus time) obtained in the biological reac- tor experiments is illustrated in Fig. 1. The final amount of sulfide depended on the actual growth conditions (batch/semi-continuous reactor, nutrient con- centration etc.). It is seen that after an initial period of time, a local maximum in sulfide occurs, after which the sulfide slightly decreases or becomes sta-
Microbial Corrosion of Carbon Steel by Sulfate-Reducing Bacteria
Acid Volatile Sulfide Profile
h
i z J
Hydrogenase activity 1 rri
I / 4 b
Time (arbitmy)
15
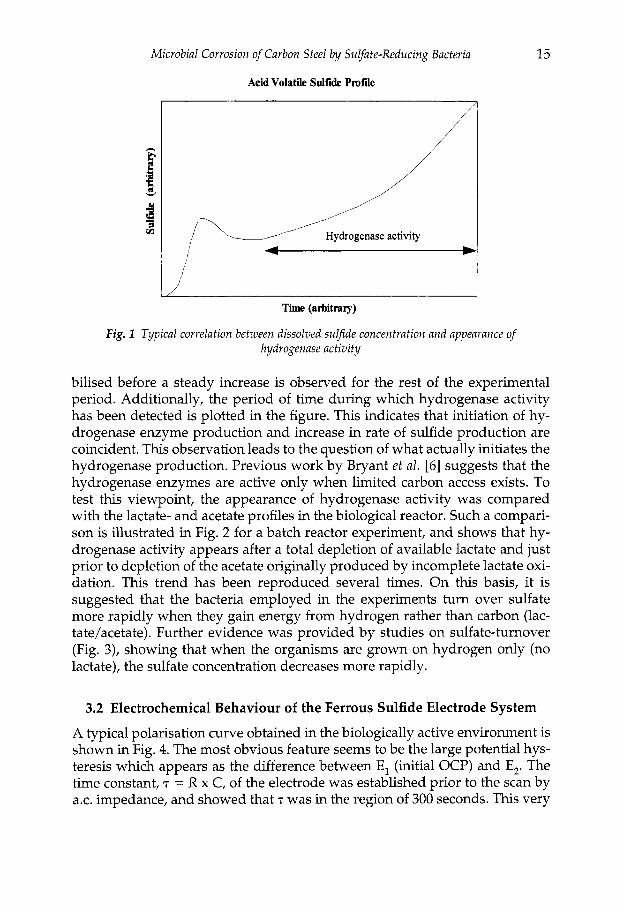
Fig. 1 Typical correlation between dissolved sulfide concentration and appearance of hydrogenase activity
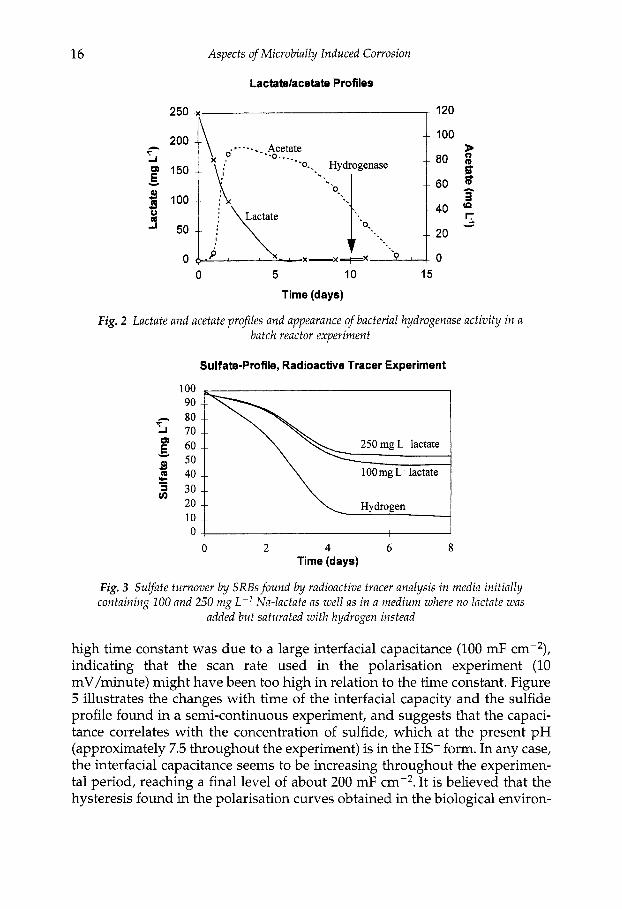
bilised before a steady increase is observed for the rest of the experimental period. Additionally, the period of time during which hydrogenase activity has been detected is plotted in the figure. This indicates that initiation of hy- drogenase enzyme production and increase in rate of sulfide production are coincident. This observation leads to the question of what actually initiates the hydrogenase production. Previous work by Bryant et al. [6] suggests that the hydrogenase enzymes are active only when limited carbon access exists. To test this viewpoint, the appearance of hydrogenase activity was compared with the lactate- and acetate profiles in the biological reactor. Such a compari- son is illustrated in Fig. 2 for a batch reactor experiment, and shows that hy- drogenase activity appears after a total depletion of available lactate and just prior to depletion of the acetate originally produced by incomplete lactate oxi- dation. This trend has been reproduced several times. On this basis, it is suggested that the bacteria employed in the experiments turn over sulfate more rapidly when they gain energy from hydrogen rather than carbon (lac- tate/acetate). Further evidence was provided by studies on sulfate-turnover (Fig. 3), showing that when the organisms are grown on hydrogen only (no lactate), the sulfate concentration decreases more rapidly.
3.2 Electrochemical Behaviour of the Ferrous Sulfide Electrode System
A typical polarisation curve obtained in the biologically active environment is shown in Fig. 4. The most obvious feature seems to be the large potential hys- teresis which appears as the difference between E, (initial OCP) and E,. The time constant, 7 = R x C, of the electrode was established prior to the scan by ax. impedance, and showed that 7 was in the region of 300 seconds. This very
16 Aspects of Microbially Induced Corrosion
Lactatelacetate Profiles
250 x , 120
200
150
c. r
2 - s 100 3
50
0 0 5 10 15
Time (days)
Fig. 2 Lactate and acetate profiles and appearance of bacterial hydrogenase activity i n a batch reactor experiment
Sulfate-Profile, Radioactive Tracer Experiment
100 90 80
60 50 40
5 30 20
cn 10
i 70
- 250 mg L ' lactate 250 mg L ' lactate
L Hydrogen
0 2 4 6 8 Time (days)
Fig. 3 SuIfate turnover by SRBs found by radioactive tracer analysis i n media initially containing 100 and 250 mg L-I Na-lactate as well as in a medium where no lactate was
added but saturated with hydrogen instead
high time constant was due to a large interfacial capacitance (100 mF cm-2), indicating that the scan rate used in the polarisation experiment (10 mV/minute) might have been too high in relation to the time constant. Figure 5 illustrates the changes with time of the interfacial capacity and the sulfide profile found in a semi-continuous experiment, and suggests that the capaci- tance correlates with the concentration of sulfide, which at the present pH (approximately 7.5 throughout the experiment) is in the HS- form. In any case, the interfacial capacitance seems to be increasing throughout the experimen- tal period, reaching a final level of about 200 mF cmP2. It is believed that the hysteresis found in the polarisation curves obtained in the biological environ-

Microbial Corrosion of Carbon Steel by Sulfate-Reducing Bacteria 17
Typical Polarisation Curve, SRB Environment
-100 , -200 -300 -400
E -500 $ -600 f -700
g -800 w - -900 Q
Q)
.- E -1000 b -1100
-1200 -1300
f scan rate 10 mV/minute /
hysteresis
E2
Scan rate 10 mV/minute
Scan direction
hysteresis
E2
-1400 1 1.OE-06 1.OE-05 1.0504 1.OE-03 1.OE-02 1.OE-01
Current Density (A cm-')
Fig. 4 Typical polarisation curve obtained in SRB-active sulfide environment
240
N.+ 200
E
g 120
LL 160 E w
.- 3 2 80
0" n
40
0
Sulfide and Capacitance Profile
Sulfide / .a*- Capacitance
. **
70
60
50
40 3 30
P (D
tn 20 5 10
0 0 10 20 30 40 50 60 70 80
Time (days)
Fig. 5 Sulfide profile found in a semi-continuous biological reactor experiment along with the interfacial capacitance of the electrode found by a.c. impedance measurements
ment is caused by the contribution from the capacitive currents, i, = C(6E/6t) . At a fixed scan rate, the capacitive contribution increases with increasing interfacial capacitance.
In contrast, the interfacial capacitance found for the electrode used in the
18 Aspects of Microbially Induced Corrosion
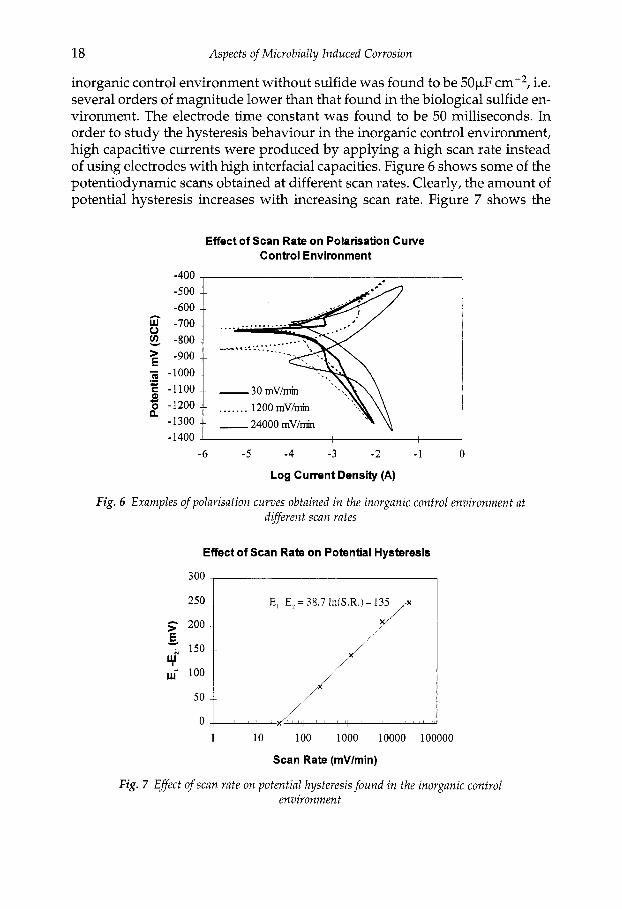
inorganic control environment without sulfide was found to be 50pF cm-2, i.e. several orders of magnitude lower than that found in the biological sulfide en- vironment. The electrode time constant was found to be 50 milliseconds. In order to study the hysteresis behaviour in the inorganic control environment, high capacitive currents were produced by applying a high scan rate instead of using electrodes with high interfacial capacities. Figure 6 shows some of the potentiodynamic scans obtained at different scan rates. Clearly, the amount of potential hysteresis increases with increasing scan rate. Figure 7 shows the
Effect of Scan Rate on Polarisation Curve Control Environment
-400 ,
-500 -600
W -700 h
@. -800 -900 = -1000
E -1100 5 -1200 n - 1300
.- a - 30 mV/min
. .. . . _. 1200 mV/min - 24000 mV/min
-1400 ! -6 -5 -4 -3 -2 -1 0
Log Current Density (A)
Fig. 6 Examples of polarisation curves obtained in the inorganic control environment at different scan rates
Effect of Scan Rate on Potential Hysteresis
300
250 E,-E,= 38.7 In(S.R.1- 135 ix /
1 10 100 1000 10000 100000
Scan Rate (mVlmin)
Fig. 7 Effect of scan rate on potential hysteresis found in the inorganic control environment
Microbial Corrosion of Carbon Steel by Sulfate-Reducing Bacteria 19
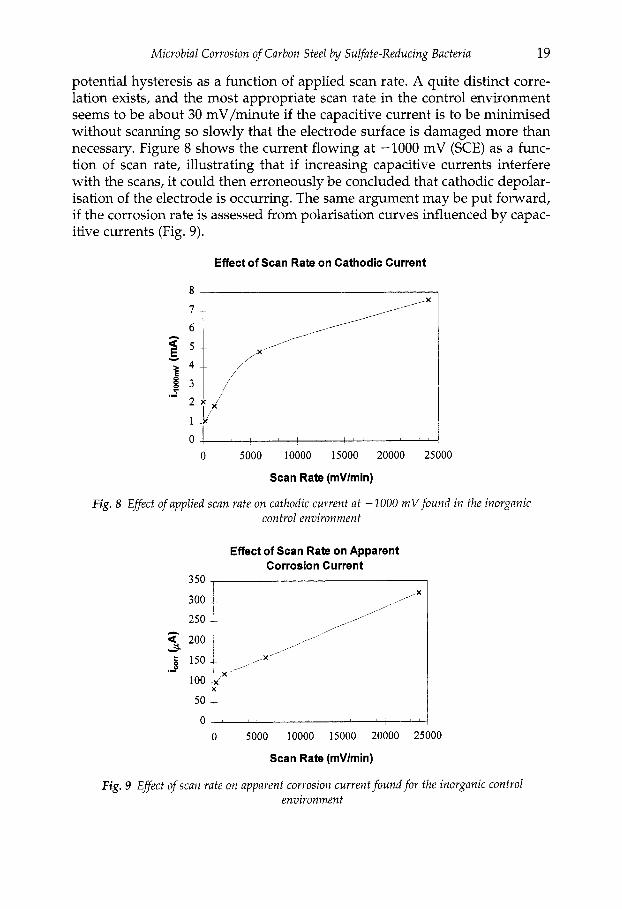
potential hysteresis as a function of applied scan rate. A quite distinct corre- lation exists, and the most appropriate scan rate in the control environment seems to be about 30 mV/minute if the capacitive current is to be minimised without scanning so slowly that the electrode surface is damaged more than necessary. Figure 8 shows the current flowing at -1000 mV (SCE) as a func- tion of scan rate, illustrating that if increasing capacitive currents interfere with the scans, it could then erroneously be concluded that cathodic depolar- isation of the electrode is occurring. The same argument may be put forward, if the corrosion rate is assessed from polarisation curves influenced by capac- itive currents (Fig. 9).
Effect of Scan Rate on Cathodic Current
8 ,
0 5000 10000 15000 20000 25000
Scan Rate (mVlmin)
Fig. 8 Eflecf of applied scan rate on cathodic current at -1000 mV found in the inorganic control environment
Effect of Scan Rate on Apparent Corrosion Current
250
a 200 / 150
.9
50 0 5 0 5000 10000 15000 20000 25000
Scan Rate (mVlmin)
Fig. 9 Effect of scan rate on apparent corrosion current found for the inorganic control enuironmen t
20 Aspects of Microbially Induced Corrosion
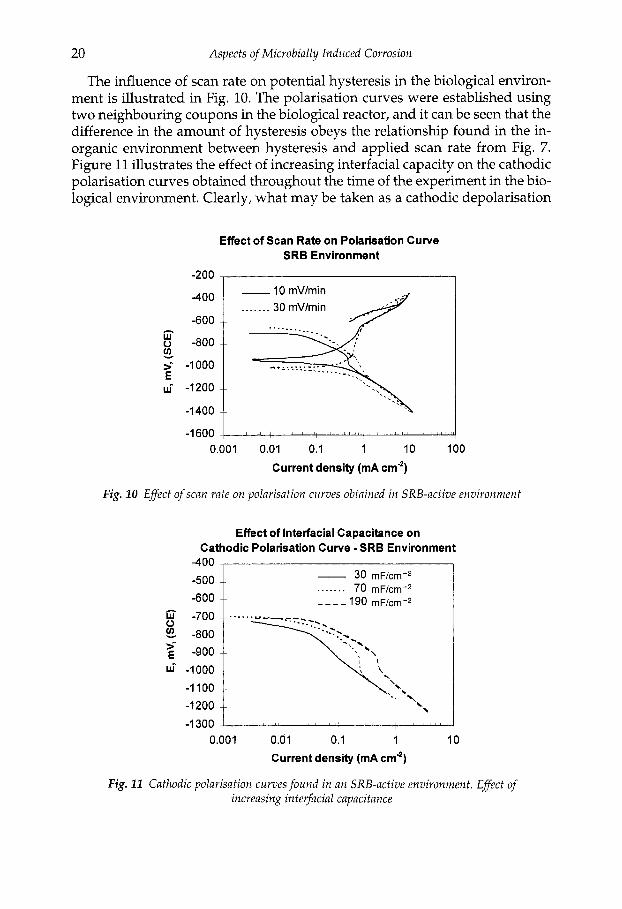
The influence of scan rate on potential hysteresis in the biological environ- ment is illustrated in Fig. 10. The polarisation curves were established using two neighbouring coupons in the biological reactor, and it can be seen that the difference in the amount of hysteresis obeys the relationship found in the in- organic environment between hysteresis and applied scan rate from Fig. 7. Figure 11 illustrates the effect of increasing interfacial capacity on the cathodic polarisation curves obtained throughout the time of the experiment in the bio- logical environment. Clearly, what may be taken as a cathodic depolarisation
-500
Effect of Scan Rate on Polarisation Curve SRB Environment
- 30 mF/cm-2 ....... 70 mF/cm-'
--
-200 , -400
-600 c 0 -800 s T -1000 E w- -1200
-1400
__ 10 mVlmin ...._.. 30 mV/rnin
0.001 0.01 0.1 1 10 100
Current density (mA cmS)
Fig. 10 Eflect of scan rate on polarisation curves obtained in SRB-active environment
Effect of Interfacial Capacitance on Cathodic Polarisation Curve - SRB Environment
3
T E W"
8 -700 -800 -900
-1 000 -1100
-1 200 -1 300
t
0.001 0.01 0.1 1 10 Current density (mA cm")
Fig. 11 Cathodic polarisation curves found in an SRB-active environment. Eflect of increasing interfacial capacitance
Microbial Corrosion of Carbon Steel by Sulfate-Reducing Bacteria 21
effect could just as well be ascribed to the continuing increasing interfacial capacitance.
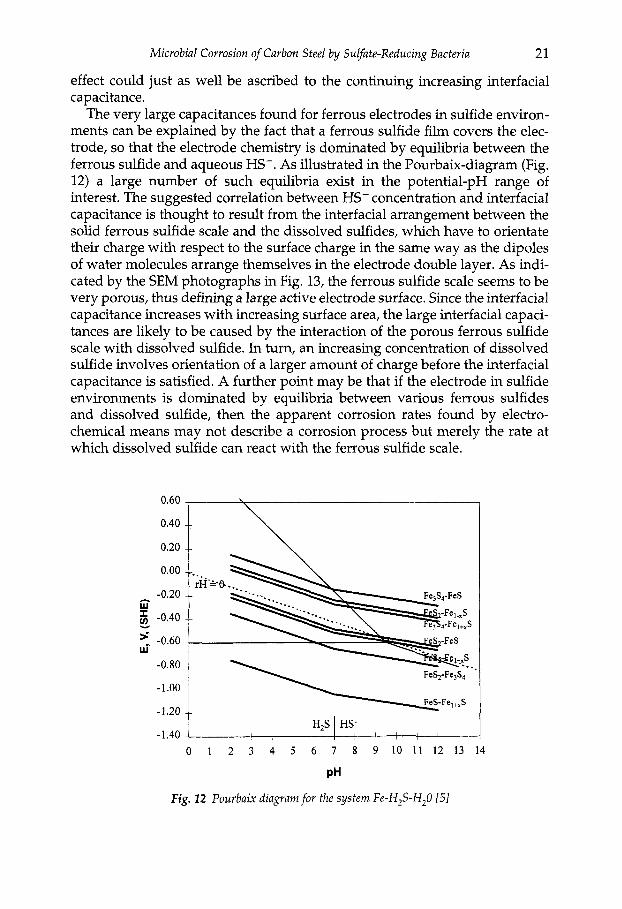
The very large capacitances found for ferrous electrodes in sulfide environ- ments can be explained by the fact that a ferrous sulfide film covers the elec- trode, so that the electrode chemistry is dominated by equilibria between the ferrous sulfide and aqueous HS-. As illustrated in the Pourbaix-diagram (Fig. 12) a large number of such equilibria exist in the potential-pH range of interest. The suggested correlation between HS- concentration and interfacial capacitance is thought to result from the interfacial arrangement between the solid ferrous sulfide scale and the dissolved sulfides, which have to orientate their charge with respect to the surface charge in the same way as the dipoles of water molecules arrange themselves in the electrode double layer. As indi- cated by the SEM photographs in Fig. 13, the ferrous sulfide scale seems to be very porous, thus defining a large active electrode surface. Since the interfacial capacitance increases with increasing surface area, the large interfacial capaci- tances are likely to be caused by the interaction of the porous ferrous sulfide scale with dissolved sulfide. In turn, an increasing concentration of dissolved sulfide involves orientation of a larger amount of charge before the interfacial capacitance is satisfied. A further point may be that if the electrode in sulfide environments is dominated by equilibria between various ferrous sulfides and dissolved sulfide, then the apparent corrosion rates found by electro- chemical means may not describe a corrosion process but merely the rate at which dissolved sulfide can react with the ferrous sulfide scale.
H,S HS-
0.60 \
0.40
0.20
0.00
-0.20 c $ -0.40 v
-0.60 ILi.
-0.80
-1.00
-1.20

22 Aspects of Microbially Induced Corrosion
Fig. 13 SEM photographs of the electrode surface after exposure in SRB-active environment. The upper includes biofilm clusters and the lower represents the surface after
partial removal of the clusters, revealing a porous sulfide scale
Microbial Corrosion of Carbon Steel by Suljate-Reducing Bacteria 23
4. Conclusions
Based on the results obtained by electrochemical measurements in SRB- infected environments, by radioactive tracer analysis, and by electrochemical measurements conducted in inorganic control environment, the following observations can be put forward for the SRB-system used in these studies:
Bacterial hydrogenase enzyme activity seems to correlate with limited carbon access. Bacterial hydrogenase enzyme activity seems to correlate with increased sulfide production (concentration). Increased sulfide concentration seems to correlate with increased inter- facial capacitance of the electrode. Increasing capacitance correlates with increasing hysteresis at potential scan rates that are too high compared with the electrode time constant. In turn, this increases the significance of the capacitive currents in the polarisation curves. The 'cathodic depolarisation' observed in SRB-infected sulfide environ- ments may simply relate to the ever increasing interfacial electrode capacitance, due to which the applied scan rate is increasingly too fast.
Acknowledgment
The studies were conducted under the Danish Energy Research Programme (EFP-95) supported by the Danish Ministry of Environment and Energy. The National Oil & Gas Company of Denmark (C. Juhl), Greater Copenhagen Natural Gas (B. Baumgarten), and The Force Institute (N.K. Bruun) are thanked for support and participation in the project.
The useful assistance in HPLC and radioactive tracer studies by Dr. A. Rathmann Pedersen, The Institute of Environmental Science and Engineering, The Technical University of Denmark, is acknowledged.
Professor E. Maahn, The Institute of Manufacturing Engineering, and Dr. M.J.L. IZlstergikd, F.L. Smidth & Co A/S, are thanked for useful discussions.
References
1. 2.
3. 4.
V.W. Kiihr and Van der Vlugt: Water, 1934,18,147. G.H. Booth, L. Elford and D.S. Wakerley: Br. Corros. I., 1968, 3 (11)/
P.W. Bolmer: Corrosion, 1965, 21 (3) , 69-75. J.R. Scully: 'Electrochemical Tests', Corrosion Tests and Standards, R. Baboian, ed., ASTM, West Conshohocken, Pa., 1995,77.
242-245.

24
5. L.V. Nielsen: The Effect of Cathodic Protection and Microbiological Activity on Hydrogen-Related Cracking in Steel, Thesis for The Industrial Ph.D, The National Oil and Gas Company of Denmark & The Technical University of Denmark, 1995.
6. R.D. Bryant, W. Jahnsen, J. Boivin, E. J. Laishley and J.W. Costerton: Appl. Environ. Microbiol., 1991, 57 (19), 2804-2809.
Aspects of Microbially Induced Corrosion
A Search for the Risk Factors Involved in the Carbon Steel Corrosion Induced by Sulfidogenic
Bacteria
X. CAMPAIGNOLLEl, D. FESTY2 and J.-L. CROLET3
lLaboratoire dOc6anographie Biologique 2, rue Jolyet, F-33120 ARCACHON
21FREMER, Centre de Brest, BP 70, F-29280 PLOUZANE 3corresp. author: Elf Aquitaine, F-64018 PAU
ABSTRACT In the oil and gas industry, microbial corrosion is, fortunately, usually a case of a more or less uniform corrosion, with a reasonable corrosion rate (e.g. a fraction of mm/y.) and so relatively simple biocide treatments can be used. However, it may also appear as sudden pitting corrosion with penetration rates of cm/y. Therefore, a practical risk assessment is essentially the prediction of such a rapid corrosion occurrence.
Localised corrosion is basically the stabilisation of a galvanic coupling between a small area which dissolves (i.e. the anode) and large surrounding areas which are more or less protected (Le. the cathode). The couple current flowing between these two electrodes is the main component of the actual corrosion rate inside the pit. The mea- surement of this current could thus be a quantification of the risk factor associated with bacterial contamination. Consequently, we have designed a technique which con- sists in artificially initiating a pit with two separated concentric electrodes. Then, the current freely flowing between these electrodes is monitored. The steady current level is an actual evaluation of the risk factor associated with the bacterial presence in specifically controlled and chosen conditions. This technique is used to investigate various risk factors, microbiological or physical, which are discussed. The presence of thiosulfate and its use by the bacterial metabolism (rather than sulfate) drastically in- creases the corrosivity of sulfidogenic bacteria biofilms. Moreover, bacteria using thiosulfate rather than sulfate as an electron acceptor (Le. the most corrosive bacteria) seem to be more resistant to a conventional glutaraldehyde treatment.
Introduction
The purpose of this work was firstly to explain the breakthrough of an off- shore pipeline which occurred within less than a year, and which was most probably caused by microbial pitting corrosion.[l, 21, and secondly, to attempt to analyse the specific risk factors linking a bacterial contamination to the oc- currence of such rapid failures. Two investigations were started simul- taneously: on one hand, it was necessary to identify and describe the bacteria present in the pipeline,[3, 41 or other production equipment;[5] on the other
26 Aspects of Microbially Induced Corrosion
hand, the link between those bacteria and rapid pitting corrosion had to be found.[6] Therefore, the first studies were rather microbiological and the sec- ond rather corrosion-orientated. This paper deals with the second, while the first was addressed by Magot.[5] Because MIC has as much to do with microbiology as with corrosion, the corrosion studies were conducted in a microbiology laboratory with the help of corrosion specialists.
The chemical analysis of the failed pipeline water revealed the presence of a non-negligible thiosulfate content. [7] Most probably, this supposedly exo- genic compound was due to traces of oxygen ingress which reacted with the ambient H,S to form S20:-.[8, 91 The H,S itself came from the reservoir and was not necessarily due to the sulfide producing bacteria, i.e. sulfidogenic bac- teria, that were present. Magot and coworkers identified many strains of such bacteria in the production water.[5] Some of them were the 'usual' sulfate- reducing bacteria (SRB), [ 101 whereas others reduce thiosulfate but not sulfate. They were called thiosulfate-reducing bacteria (TRB).[ 111 Moreover, it ap- peared that all isolated strains of SRB could grow on thiosulfate rather faster than on sulfate [Unpublished results].
A theoretical model based on a differential pH cell between the anode and the cathode induced by the bacterial sulfide production was proposed.[l2,13] This model shows that the acidity on the anode depends on the interaction be- tween bacterial metabolites and corrosion products, those remaining unlikely on the cathode. The resulting pH difference between two electrically con- nected metallic areas is known to be one of the most powerful driving forces for localised corrosion.
Thus, we decided to study two possible metabolisms for sulfidogenic bac- teria biofilms: sulfate and/or thiosulfate reduction and its effect on the current flowing between an anode and a cathode previously preconditioned (see later). Then, the effect of a strong biocide (glutaraldehyde) on the corrosivity of such biofilms was investigated.
Experimental Procedure
More details on the experimental procedure can be found in earlier publi- cations.[6, 14, 151
Electrodes
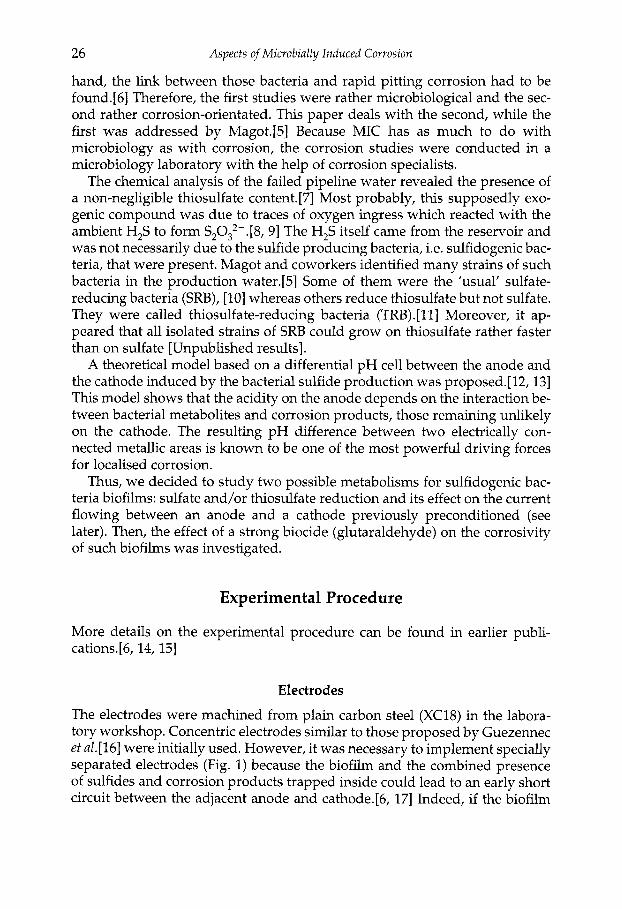
The electrodes were machined from plain carbon steel (XC18) in the labora- tory workshop. Concentric electrodes similar to those proposed by Guezennec et al.[16] were initially used. However, it was necessary to implement specially separated electrodes (Fig. 1) because the biofilm and the combined presence of sulfides and corrosion products trapped inside could lead to an early short circuit between the adjacent anode and cathode.[6, 171 Indeed, if the biofilm
Risk Factors Involved in the Carbon Steel Corrosion Induced by Sulfdogenic Bacteria 27
Fig. 2 Schematic representation of the separated concentric electrodes
becomes very conductive due to the precipitation of ferrous sulfides, the pit- ting current between the anode and the cathode would go through it rather than through the measuring instrument.
The anode was a 2 mm, the cathode a 25 mm and the auxiliary anode a 10 mm diameter cylinder. The electric cables soldered on the back of the elec- trodes were insulated from the solution by a glass tube fixed with a silicone gel seal. All three electrodes were embedded in an epoxy resin. Prior to start- ing an experiment, the electrodes were wet polished in sequence from 120 to 600 grit abrasive paper, then degreased with a 50/50 acetone/ethanol mixture, cleaned with 18% hydrochloric acid, rinsed with distilled water and dried.
Electrochemical Cells
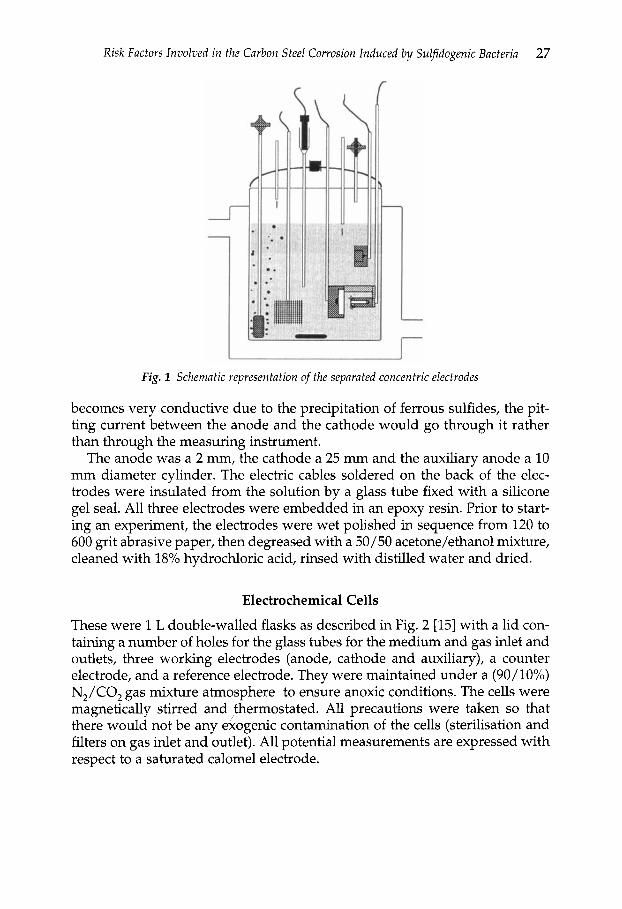
These were 1 L double-walled flasks as described in Fig. 2 [ 151 with a lid con- taining a number of holes for the glass tubes for the medium and gas inlet and outlets, three working electrodes (anode, cathode and auxiliary), a counter electrode, and a reference electrode. They were maintained under a (90/10%) N,/CO, gas mixture atmosphere to ensure anoxic conditions. The cells were magnetically stirred and thermostated. All precautions were taken so that there would not be any &ogenic contamination of the cells (sterilisation and filters on gas inlet and outlet). All potential measurements are expressed with respect to a saturated calomel electrode.

28 Aspects of Microbially Induced Corrosion
Fig. 2 Schematic representation of the electrochemical cell
Microbiology
The bacteria used in this study were isolated from oilfields and described by Magot and coworkers.[5] The first strain used in this study (internal reference 3139) was a sporulated sulfate-reducing bacterium (SRB) belonging to the genus Desulfotomaculum.[l8] It was grown on lactate which is oxidised to acetate. The electron acceptor was either sulfate or thiosulfate. The second one, (internal reference 4207) Dethiosulfovibrio peptidovorans, is a thiosulfate, but not sulfate, -reducing bacterium (TRB).[19] This bacterium uses peptides as the carbon source; in our experiments, for example, bactopeptone. All cultures were maintained in the laboratory with the usual microbiological techniques. The electrochemical cells were aseptically inoculated with mature cultures of the selected bacteria 24 hours after the beginning of the experiment.
All the materials used for the experiments were sterilised with the appro- priate procedures.[l4] During the course of the experiment the sterility of the control and the purity of the cultures were checked by examining slide samples with a phase contrast microscope.
The Medium
The tests were conducted in a synthetic produced water (Table 1) which sim- ulated that found in the failed pipeline, including in-situ pH (calculated by CORMED[20]). The NaCl content was adjusted depending on the bacteria requirement. The pH was situated between 6.5 and 6.9 and the redox was around - 150 mV in sterile conditions and close to -250 mV when inoculated (due to metabolic sulfides). The renewal rate was set at 5%/hour with the aid of peristaltic pumps after a few days of batch conditions (the time for a biofilm to form). The cells and the source medium were maintained under a 90/10% N,/CO, atmosphere to ensure anoxic conditions.

Risk Factors Involved in the Carbon Steel Corrosion Induced by Sulfidogenic Bacteria
Table 1 Composition of the reconstituted water
29
Na+
K+ Mg2+
Ca2+ NH,’
600.0 13800 c1- 47.5 571 so;- /s,o;- 20.0 782 HC0,- 20.0 400 CH,COO-
1.0 18
651.0 100.0 15.0 5.0
Preconditioning of Electrodes
As already pointed out in previous publications,[b, 151 it was necessary to pre- condition the anode and the cathode to make sure that they would act in the prescribed respective manner. A 100 FA galvanostatic current was applied be- tween the anode and the auxiliary anode connected together (to avoid an ex- cessive current on the anode) and the cathode. The mean current densities were 122 FA cm-* on the anodes and 20 FA cmP2 on the cathode. This current was maintained until a biofilm had formed on the electrode surfaces (between a few days and a couple of weeks). Then, the preconditioning was stopped and the current freely flowing between the anode and the cathode was mea- sured with a zero resistance ammeter.
23100 4800 915 295
Electrochemical Measurements and Data Acquisition
The preconditioning, the localised corrosion rate of the coupled electrodes, and the electrode potentials were measured using a computer controlled multi- task instrument. The galvanic current measurement were automatically con- verted into mm/y using Faraday’s law, Stern and Geary’s relation and as- suming a conversion factor of 20 mV.
Results
SRB Growing Either on Sulfate or Thiosulfate and Lactate
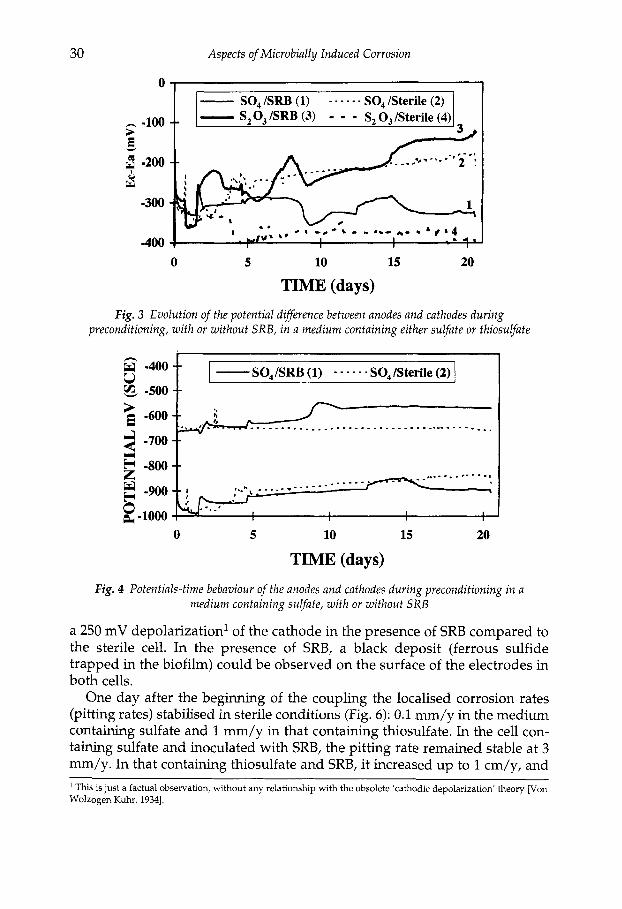
Following the application of the preconditioning current, the value of the dif- ference between the cathode E, and the anode E, potential I E,-E, I increased up to 300 mV in the four cells (Fig. 3). It then stabilised at 200 mV in the ster- ile cell containing sulfate, 400 mV in the sterile cell containing thiosulfate, and 300 mV in that containing sulfate and SRB. In the cell containing thiosulfate and SRB, 1 E,-E, I steadily decreased. In the sulfate medium, the changes in the electrode potentials (Fig. 4) during preconditioning were similar whether the cell was inoculated or kept sterile (-600 mV(SCE) for the anodes and -900 mV(SCE) for the cathodes). In the thiosulfate medium (Fig. 5), there was
30
E -800
E -!MI--;
g.1000
Aspects of Microbially Induced Corrosion
--
- -, .' I I I 1 I I I I
0 - - SO,/SRB(l) - - - - - - SO, /Sterile (2) - S,O,/SRB (3) - - -
h -100 +- E
-- v
0 5 10 15 20
TIME (days) Fig. 3 Evolution of the potential difference between anodes and cathodes during
preconditioning, with or without SRB, in a medium containing either sulfate or thiosulfate
0 5 10 15 20
TIME (days) Fig. 4 Potentials-time bebaviour of the anodes and cathodes during preconditioning in a
medium containing sulfate, with or without SRB
a 250 mV depolarization1 of the cathode in the presence of SRB compared to the sterile cell. In the presence of SRB, a black deposit (ferrous sulfide trapped in the biofilm) could be observed on the surface of the electrodes in both cells.
One day after the beginning of the coupling the localised corrosion rates (pitting rates) stabilised in sterile conditions (Fig. 6): 0.1 mm/y in the medium containing sulfate and 1 mm/y in that containing thiosulfate. In the cell con- taining sulfate and inoculated with SRB, the pitting rate remained stable at 3 mm/y. In that containing thiosulfate and SRB, it increased up to 1 cm/y, and
This is just a factual observation, without any relationship with the obsolete 'cathodic depolarization' theory [Von Wolzogen Kuhr, 19341.

Risk Factors Involved in the Carbon Steel Corrosion Induced by Sulfidogenic Bacteria 31
S,03/3139 (3) - - - S,O, /Sterile (4)
0 5 10 15 20
TIME (days)
Fig. 5 Potential-time behaviour of the anodes and cathodes during preconditioning in a
n
5 E W
14 12 10 8 6 4 2 0
-2 .4
medium containing thiosulfate, with or without SRB
+ Glutaraldehyde
- SO, /SRB (1) ...... SOdSterile (2) S203 /Sterile (4) - S2 O,/SRB (3) I - -
I I I I I I I I 7
0 5 10 15 20 25
TIME (days) Fig. 6 Development with time of the localised corrosion rates during coupling, with or
without SRB, in a medium containing either sulfate or thiosulfate
then oscillated between 5 and 10 mm/y. However, about 11 days after the be- ginning of the coupling, the pitting rate in the sterile cell containing thiosul- fate increased from 0.5 mm/y to 2 mm/y. In the mean time, the formation of a black deposit, similar to that in the inoculated cells (biofilm), was observed on the electrodes. Subsequent microscope observations revealed that this cell had been accidentally contaminated by SRB.
On the 17th day, 500 ppm glutaradehyde was added to each cell. The sol- ution renewal was stopped for 24 hours. Consequently, there was a sharp decrease in the pitting rates in the SRB containing cells. In the inoculated thio- sulfate containing cell, the corrosion rate decreased from 10 mm/y to 5 mm/y

32 Aspects of Microbially Induced Corrosion
and stabilised later around 3 mm/y. In the contaminated thiosulfate contain- ing and inoculated containing sulfate cells, the corrosion rates vanished and became similar to those in the sulfate sterile cell. Obviously, the addition of the biocide affects substantially the corrosivity of the biofilms. Nevertheless, later examination of the electrode biofilms revealed that SRB were still present in both inoculated cells, but not in the contaminated one. This could imply that it is only when sulfate is the electron acceptor or when the biofilm is poorly formed that the biocide succeeds in stopping the biofilm corrosivity. In the presence of a well developed thiosulfate-reducing bacteria biofilm, the ef- fect of a single biocide treatment seems doubtful or at least insufficient.
TRB Growing on Thiosulfate and Bactopeptone
The application of the preconditioning current induced a 350 mV potential difference between the anodes and the cathodes (Fig. 7). In sterile conditions, I E,-E, I remained stable, but in the presence of TRB, there was a 150 mV in- crease followed by fluctuations.
Indeed, in sterile conditions, the anode and cathode potentials were steady at respectively -600 and -950 mV (Fig. 8). In the presence of TRB (Figs 8 and 9), there were simultaneously a depolarisation of the cathodes (from -1000 to -750 mV(SCE)), and a polarisation of the anodes (from -650 to -300 mV(SCE)). Then, E, was steady and E, fluctuated. Most likely, the anode potential increase could have been caused by the precipitation of the meta- bolic sulfides as protective ferrous sulfides [21] and/or by its sulfidation.[22] The fluctuations would have been due to the successive formation and rup- ture of such films. In all inoculated cells, the electrodes were covered by a black greasy and gelatinous film i.e., a biofilm with corrosion products trapped inside (ferrous sulfide).
0
-100
$ -200 E
G w -500
v -300 e W -400
-600
-700 0 1 2 3 4 5 6 7 8 9 1 0 1 1 1 2 1 3 1 4 1 5
TIME (days) Fig. 7 Development with time of the potential difference between anodes and cathodes
during preconditioning, with or without TRB, in a medium containing thiosulfate

Risk Factors Involved in the Carbon Steel Corrosion lnduced by Sulfdogenic Bacteria 33
-100
-300 * -400
2 -600 E -700
-800 0 -900
-1000
8 -200
€ c;l -500
0 1 2 3 4 5 6 7 8 9 1 0 1 1 1 2 1 3 1 4 1 5
TIME (days) Fig. 8 Development with time of the potentials of the anodes and cathodes during
preconditioning in a thiosulfate medium, with or without TRB
-100
-300 - * -400 - -500-
2 -600-
8 -200 --
.' .- ' . a *.e
* ,
4207 (3) 4207 (4) ...._. _........_ .-y
€
-700
I I 1 I I I
0 1 2 3 4 5 6 7 8 9 1 0 1 1 1 2 1 3 1 4 1 5
TIME (days) Fig. 9 Development with time of the potentials of the anodes and cathodes during
preconditioning in a medium containing thiosulfate, with TRB
After the preconditioning period, the recorded localised corrosion rates steadily decreased during the first six days (Fig. 10). They were between 3 and 4 mm/y in the presence of the TRB and just a fraction of mm/y in sterile con- ditions. On day 7 and 10,500 ppm glutaradehyde was added to cells 1 and 2. Each time, the injection was followed by a 24 hour batch period. None of those treatments affected the measured pitting rates. Indeed, subsequent evalu- ations of the bacterial population on the electrodes did not reveal any difference between treated and untreated cells. Obviously, the single glu- taraldehyde treatment did not have any effect on the TRB nor consequently on the biofilm corrosivity.

34 Aspects of Microbially Induced Corrosion
10 + Glutarald6hyde # 1 and # 2
..... .. .-. .. .
0 1 2 3 4 5 6 7 8 9 1011121314151617181920
TIME (days) Fig. 10 Development with time of the localised corrosion rates during coupling, with or
without TRB, in a medium containing thiosulfate
Discussion
Under sterile conditions it is possible to initiate artificially a galvanic coupling between an anode and a cathode that might simulate localised corrosion. However, this coupling is not naturally stable and it vanishes or becomes very small after a few hours. The corrosivity of the medium (anoxic produced water on mild steel) cannot sustain any galvanic coupling. The higher localised corrosion rates measured with thiosulfate compared to those mea- sured with sulfate show that the former is slightly more corrosive than the later. This had already been observed for stainless steels [23,24] and predicted for carbon steel.[8,9,25] However, one would not expect pitting corrosion to become dangerous in these conditions.
In the presence of sulfidogenic bacteria, there is a depolarisation of the cathode and a polarisation of the anode during the preconditioning. Consequently, the potential difference between the anode and the cathode fluctuates whereas it is stable in sterile conditions. Simultaneously, the bulk solution blackens due to the formation of ferrous sulfides and the redox potential decreases sharply. There is also a slight increase in the planktonic population, most bacteria remaining in the biofilm. However, it has been ob- vious since the beginning of this research that planktonic growth and biofilm formation were incompatible.[b] The depolarisation of the cell thus reveals the onset of biofilm formation, which is a prerequisite for MIC to occur.[26-281
When the electrodes are short-circuited through the zero resistance am- meter, a stable galvanic current can be measured. The value of this current de- pends on the terminal electron acceptor used by the bacteria. For instance, in the case of SRB, the recorded corrosion rate is about 3 mm/y with sulfate and 1 cm/y, with thiosulfate. This confirms the predictions of the model of pH
Risk Factors Involved in the Carbon Steel Corrosion Induced by SuIfidogenic Bacteria 35
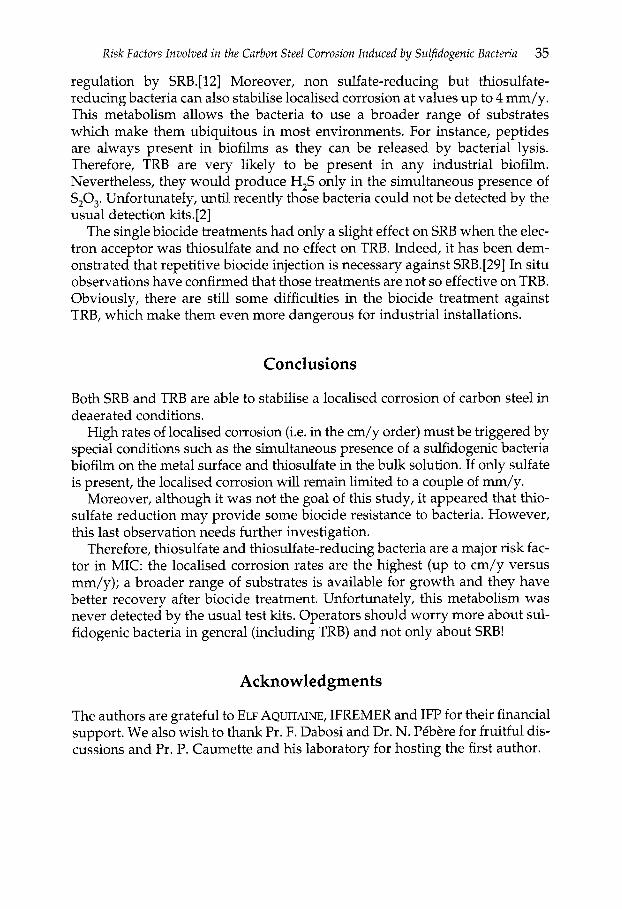
regulation by SRB.[ 121 Moreover, non sulfate-reducing but thiosulfate- reducing bacteria can also stabilise localised corrosion at values up to 4 mm/y. This metabolism allows the bacteria to use a broader range of substrates which make them ubiquitous in most environments. For instance, peptides are always present in biofilms as they can be released by bacterial lysis. Therefore, TRB are very likely to be present in any industrial biofilm. Nevertheless, they would produce H,S only in the simultaneous presence of S,O,. Unfortunately, until recently those bacteria could not be detected by the usual detection kits.[2]
The single biocide treatments had only a slight effect on SRB when the elec- tron acceptor was thiosulfate and no effect on TRB. Indeed, it has been dem- onstrated that repetitive biocide injection is necessary against SRB.[29] In situ observations have confirmed that those treatments are not so effective on TRB. Obviously, there are still some difficulties in the biocide treatment against TRB, which make them even more dangerous for industrial installations.
Conclusions
Both SRB and TRB are able to stabilise a localised corrosion of carbon steel in deaerated conditions.
High rates of localised corrosion (i.e. in the cm/y order) must be triggered by special conditions such as the simultaneous presence of a sulfidogenic bacteria biofilm on the metal surface and thiosulfate in the bulk solution. If only sulfate is present, the localised corrosion will remain limited to a couple of mm/y.
Moreover, although it was not the goal of this study, it appeared that thio- sulfate reduction may provide some biocide resistance to bacteria. However, this last observation needs further investigation.
Therefore, thiosulfate and thiosulfate-reducing bacteria are a major risk fac- tor in MIC: the localised corrosion rates are the highest (up to cm/y versus mm/y); a broader range of substrates is available for growth and they have better recovery after biocide treatment. Unfortunately, this metabolism was never detected by the usual test kits. Operators should worry more about sul- fidogenic bacteria in general (including TRB) and not only about SRB!
Acknowledgments
The authors are grateful to ELF AQUITAINE, IFREMER and IFP for their financial support. We also wish to thank Pr. F. Dabosi and Dr. N. P6bbPre for fruitful dis- cussions and Pr. P. Caumette and his laboratory for hosting the first author.
36 Aspects of Microbially Induced Corrosion
References
1.
2.
3.
4.
5.
6.
7.
8.
9.
10.
11.
12.
13.
J.-L. Crolet and M. Magot: ’Observation of non-SRB sulfidogenic Bac- teria from Oilfield Production Facilities’, Mater. Perform., 1996,35 (3), 60- 64. J.-L. Crolet, M. Magot and J.-L. Brazy: Test-kits for thiosulfate-reducing bacteria’, Corrosion 97, paper 218, NACE, Houston TX, 1997. C. Tardy-Jacquenod: ’Biodiversity, taxonomy and phylogenity of sulfate- reducing bacteria isolated from oilfields: examples of warm and saline fields’, in French, Ph. D. dissertation No. 2468, Universite Bordeaux I, France. G. Ravot, B. Ollivier, M. Magot, B.K.C. Patel, J.-L. Crolet, M.L. Fardeau and J.-L. Garcia: ’Thiosulfate reduction : an important physiological fea- ture shared by members of the Thermofogales’, Applied and Environmental
M. Magot, C. Tardy-Jacquenod and J.-L. Crolet: ’An updated portrait of the sulfidogenic bacteria potentially involved in the microbial corrosion of steel’, this publication pp. 3-9. X. Campaignolle: ’Study of the risk factors involved in the microbial cor- roison of carbon steel by anaerobic sulfogenic bacteria’, in French, Ph.D. dissertation No. 2232, Institut National Polytechnique de Toulouse, France. J.-L. Crolet and T.E. Pou: ’Identification of a critical pitting potential for film-forming inhibitors, through classical and new electrochemical tech- niques’, Corrosion 95, paper 39, NACE, Houston TX, 1995. J.-L. Crolet, M. Pourbaix and A. Pourbaix: ‘The role of trace amounts of oxygen on the corrosivity of H,S media’, Corrosion 92, paper 22, NACE, Houston TX, 1991 A. Pourbaix, L.E. Aguiar and A.-M. Clarinval: ’Local Corrosion Processes in the Presence of Sulphate-Reducing Bacteria: Measurement under Biofilms’, Corros. Sci., 1993, 35 (l), 693-698. C. Tardy-Jacquenod, P. Caumette, R. Matheron, C. Lanau, 0. Arnauld and M. Magot: ’Characterisation of sulfate-reducing bacteria isolated from oil field waters’, Canad. J. Microbiol., 1996’42,259-266, M. Magot, L. Carreau, J.-L. Cayol, B. Ollivier and J.-L. Crolet: ’Sulphide- Producing, not Sulphate-Reducing Anaerobic Bacteria Presumptively Involved in Bacterial Corrosion’ Microbial Corrosion, EFC Publication N”15, The Institute of Materials, London, 1994,293-300. J.-L. Crolet, S. Daumas and M. Magot: ’pH regulation by sulfate- reducing bacteria’, Corrosion 93, paper 303, NACE, Houston TX, 1993. S. Daumas, M. Magot and J.-L. Crolet: ’Measurement of the net produc- tion of acidity by a sulfate-reducing bacterium: experiment checking of theoretical models of microbially influenced corrosion’, Research in Microbiology, 1993,144, 327-332.
Microbiology, 1995, 61 (5), 2053-2055.
Risk Factors Involved in the Carbon Steel Corrosion Induced by Sulfdogenic Bacteria 37
X. Campaignolle et al.: ‘Stabilisation of localised corrosion of carbon steel by SRB’, Corrosion 93, paper 302, NACE, Houston TX, 1993. X. Campaignolle, P. Caumette, F. Dabosi and J.-L. Crolet: ’The role of thiosulfate on the microbially induced pitting of carbon steel’, Corrosion 96, paper 273, NACE, Houston TX, 1996. J. Guezennec, M.W. Mittelman, J. Bullen, D.C. White and J.-L. Crolet: ’Stabilisation of localised corrosion by SRB’, Proceedings of LTK Corrosion 92, Institute of Corrosion, Leighton Buzzard, UK, 1992. X. Campaignolle and J.-L. Crolet: Corrosion, 1997, 53 (6), 1137. X. Campaignolle and J.-L. Crolet: ’Method for studying stabilisation of localised corrosion on carbonsteel by sulfate-reducing bacteria’,
M. Magot, G. Ravot, X. Campaignolle, B. Ollivier, B.K.C. Patel, M.-L. Fardeau, P. Thomas, J.-L. Crolet and J.-L. Garcia: ‘Dethiosulfovibrio pepti- dovorans gen.nov., sp.nov., a New Anaerobic, Slightly Holophilic Thiosulfate-reducing Bacterium from Corroding Offshore Oil Wells’, Int. 1. Systematic Bacteriology, 1997,47 (3), 818-824 J.-L. Crolet and M. Bonis: ’An Optimised Procedure for Corrosion Testing Under CO, and H,S Gas Pressure’, Corrosion, 1990,46 (7), 81-86. A.K. Tiller: ’Electrochemical aspects of microbial corrosion: an over- view’, Microbial Corrosion, The Metals Society, London, 1983,54-65. P. Sury: ’Similarities in the corrosion behaviour of iron, cobalt, and nickel in acid solutions. A review with special reference to the sulphide adsorption’, Corros. Science, 1976,16, 879-901. R.C. Newman, W.P. Wong, H. Ezuber and A. Garner: ’Pitting of Stainless Steels by Thiosulfate Ions’, Corrosion, 1989,45 (4), 282-287. B.J. Webster, R.C. Newman and R.G. Kelly: ‘SRB-induced localized cor- rosion of stainless steels’, Corrosion 91, paper 106, NACE, Houston TX, 1991. H.A. Videla: ’Metals: Electrochemical Interpretation of the Role of Microorganisms in Corrosion’, Biodeterioration 7, D.R. Houghton, R.N. Smith, H.O.W. Eggins eds, Elsevier Applied Science, London, 359-371. S. Daumas, J. Crousier and J.P. Crousier: ’Influence de batteries sulfato- rkdctrices actives sur le potentiel de corrosion d’un acier’, Me‘taux- Corrosa-lnd., 1988, 749, 1. J. Smart, T. Pickthall and T.G. Wright: ’Field experiences in on-line bac- teria monitoring’, Corrosion 96, paper 279, NACE, Houston, TX, 1996. W. Lee and W.G. Characklis: ’Corrosion of Mild Steel Under Anaerobic Biofilm’, Corrosion, 1993,49 (3), 186-198. C. Hurtevent, M. Magot and J.-L. Crolet: ’Selection of biocides on sessile sulfate-reducing bacteria’, Proceedings UK Corrosion 92, Vol. 3, The Institute of Corrosion, Leighton Buzzard, UK, 1992.
COYYOS~OM, 1997, 53 (6) , 440-447.
14.
15.
16.
17. 18.
19.
20.
21.
22.
23.
24.
25.
26.
27.
28.
29.

Biofilms and
Corrosion
Correlation Between Marine Biofilm Structure and Corrosion Behaviour of Stainless Steels in
Sea Water
V. SCOTT0 and M.E. LA1
Istituto per la Corrosione Marina dei Metalli, ICMM Consiglio Nazionale delle Ricerche
Via De Marini 6, IT-16149 GENOVA
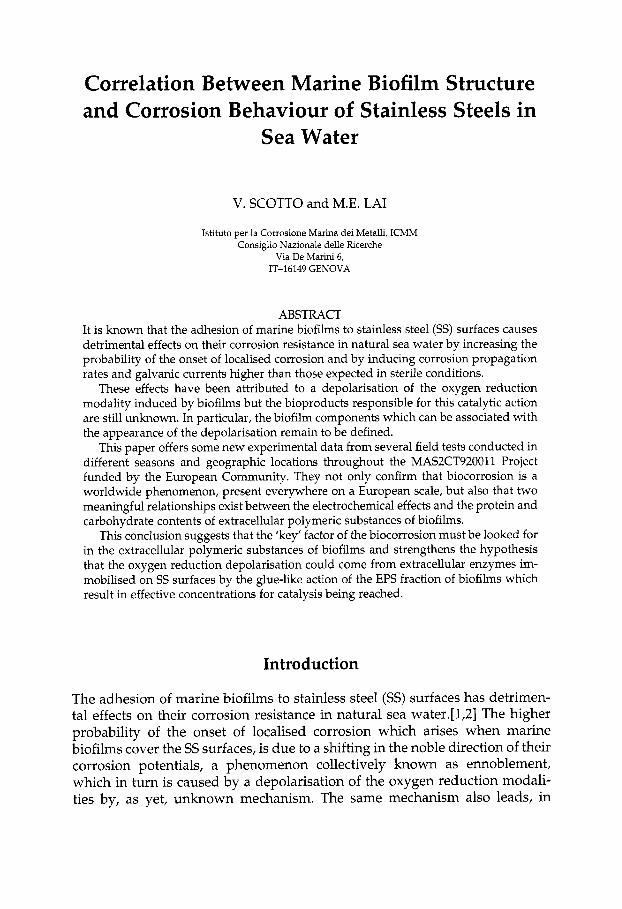
ABSTRACT It is known that the adhesion of marine biofilms to stainless steel (SS) surfaces causes detrimental effects on their corrosion resistance in natural sea water by increasing the probability of the onset of localised corrosion and by inducing corrosion propagation rates and galvanic currents higher than those expected in sterile conditions.
These effects have been attributed to a depolarisation of the oxygen reduction modality induced by biofilms but the bioproducts responsible for this catalytic action are still unknown. In particular, the biofilm components which can be associated with the appearance of the depolarisation remain to be defined.
This paper offers some new experimental data from several field tests conducted in different seasons and geographic locations throughout the MASZCT920011 Project funded by the European Community. They not only confirm that biocorrosion is a worldwide phenomenon, present everywhere on a European scale, but also that two meaningful relationships exist between the electrochemical effects and the protein and carbohydrate contents of extracellular polymeric substances of biofilms.
This conclusion suggests that the 'key' factor of the biocorrosion must be looked for in the extracellular polymeric substances of biofilms and strengthens the hypothesis that the oxygen reduction depolarisation could come from extracellular enzymes im- mobilised on SS surfaces by the glue-like action of the EPS fraction of biofilms which result in effective concentrations for catalysis being reached.
Introduction
The adhesion of marine biofilms to stainless steel (SS) surfaces has detrimen- tal effects on their corrosion resistance in natural sea water.[l,2] The higher probability of the onset of localised corrosion which arises when marine biofilms cover the SS surfaces, is due to a shifting in the noble direction of their corrosion potentials, a phenomenon collectively known as ennoblement, which in turn is caused by a depolarisation of the oxygen reduction modali- ties by, as yet, unknown mechanism. The same mechanism also leads, in

42 Aspects of Microbially Induced Corrosion
natural marine conditions to corrosion propagation rates and galvanic cur- rents higher than those expected in sterile sea waters.
Whereas the 'new' electrochemistry induced by the biofilm adhesion on SS surfaces has been widely investigated, the biofilm components, both in terms of organisms and extracellular polymeric substances (EPS), which can be associated with the appearance of the depolarisation effects are less known.
Whatever the action mechanism may be, the importance of biofilms in de- termining the onset and the progress of corrosion has been proven by several comparative corrosion tests executed in natural sea water with and without biofilm control obtained both through a preliminary sea water sterilisation [3] and by addition of chemicals in sea water.[4]
In spite of this, some discussion has arisen concerning the general validity of the effects of biofilms on stainless steels and similar alloys [5,6] and it is only recently that a conclusive answer to the question has been found in the MAST I1 Contract (Ref. MAS2 CT92 0011) partially funded by the European Community.[7] In this programme several field tests were conducted in different European marine stations to ascertain whether biofilm adhesion always, and everywhere, caused potential ennoblement of SS in the passive state and if this bioeffect could be associated with some structural feature of biofilms.
TradeName
Materials and Methods
I Cr Ni I Mo I c u I W I N
Highly corrosion resistant SS grades, were exposed in the form of tubes or plates to natural sea water in five marine stations located respectively in the Mediterranean Sea (Genoa - Italy) in the Atlantic Ocean (Brest and Cherbourg - France) and in the North Sea (Goteborg - Sweden and Trondheim - Norway).
The exposure tests, which lasted about one month, were repeated once for each season and were carried out on three high quality SS grades which com- positions is reported in Table 1.
The specimens were exposed in tanks or in test-loops filled with calm or flowing sea water stored in dark conditions and with the waters renewed sev- eral times a day. Twenty samples of each SS grade were assembled and their
Trade Name
654 SMO URSB8 SAF2507
Cr Ni Mo c u W N
24.5 21.8 7.3 0.43 0.5 0.48 24.9 25 4.72 1.4 - 0.21
- 0.28 24.9 6.9 3.8 -
654 SMO URSB8 SAF2507
24.5 21.8 7.3 0.43 0.5 0.48 24.9 25 4.72 1.4 - 0.21
- 0.28 24.9 6.9 3.8 -

Marine Bio f lm Structure and Corrosion Bekaviour of Stainless Steels in Sea Water 43
free corrosion potentials measured every 4 hours until1 the completion of the ennoblement process. [8]
Throughout the test, from 2 to 5 specimens, showing similar potential values, were periodically recovered and their biofilms collected together and analysed in order to single out eventual changes of biofilm structures as a function of the potential values reached by the metal substrata.
The detachment of biofilms from surfaces was carried out by agitating about 1 g of glass balls on the specimen immersed in 10-20 mL of a buffer sol- ution containing 20mM of EDTA and more specimens with similar potential values were treated in the same buffer aliquot in order to have fairly concen- trated solutions for analyses.
The cellular (pellet) and extracellular (supernatant) biofilm fractions were then separated by centrifugation and analysed by ICMM using the procedures summarised in Fig. 1.
The two fractions were treated, according to the scheme of Fig. 1 and their carbohydrate and protein contents analysed with the antrone [9] and comassie blue [lo] methods respectively.
The analytical characterisation was carried out on almost 120 samples collected on a European scale by all the partners in the Project.
The low protein contents which everywhere characterise the EPS fraction of biofilms required the preliminary dyalisation of samples and their freeze- drying before the protein analyses as explained in the scheme of Fig. 1.
biofilm mechanical detachment in a buffer solution with EDTA (20 mMJ
4 centrifugation at 30004000 rpm
I cellular and intracellular I fraction (pellet)
carbohydrate and protein content measurements
extracellular fraction
carbohydrates analysis I (Extra-Carb)
dialysis with a molecular
freeze-dried and protein
Fig. 2 Scheme of the bioflm treatments before the analyses
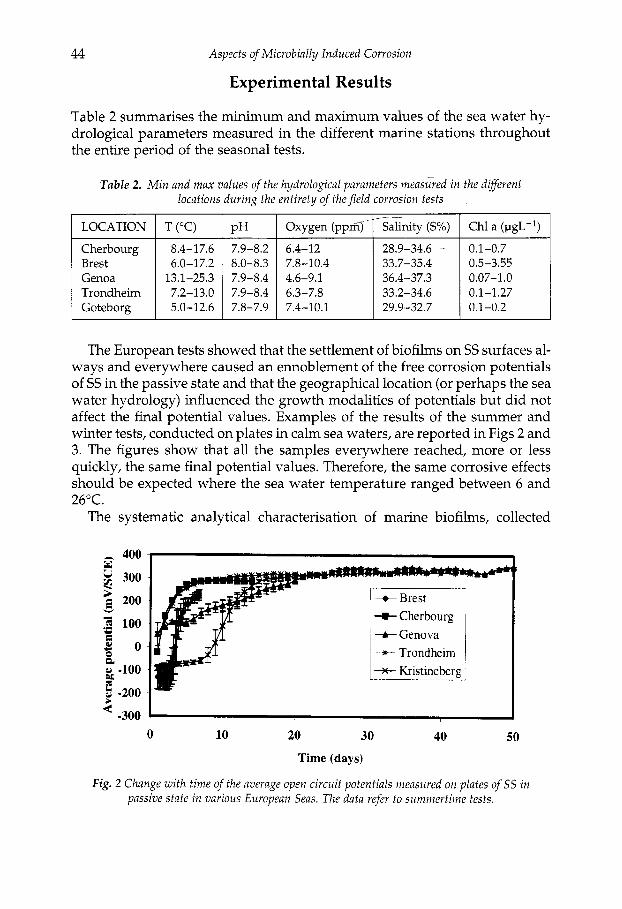
44
LOCATION
Aspects of Microbially Induced Corrosion
Experimental Results
T("C) pH I Oxygen ( p p m q a k i y (S%) I Chl a (pgL-l)
Table 2 summarises the minimum and maximum values of the sea water hy- drological parameters measured in the different marine stations throughout the entire period of the seasonal tests.
Cherbourg Brest Genoa Trondheim Goteborg
Table 2. Min and max values ofthe hydrological parameters measuved in the dlferent locations during the entirety of the field corrosion tests
8.4-17.6 7.9-8.2 6.4-12 6.0-17.2 8.0-8.3 7.8-10.4
13.1-25.3 7.9-8.4 4.6-9.1 7.2-13.0 7.9-8.4 6.3-7.8 5.0-12.6 7.8-7.9 7.4-10.1
28.9-34.6 ~
33.7-35.4 36.4-37.3 33.2-34.6 29.9-32.7
0.1-0.7 0.5-3.55 0.07-1.0 0.1-1.27 0.1-0.2
The European tests showed that the settlement of biofilms on SS surfaces al- ways and everywhere caused an ennoblement of the free corrosion potentials of SS in the passive state and that the geographical location (or perhaps the sea water hydrology) influenced the growth modalities of potentials but did not affect the final potential values. Examples of the results of the summer and winter tests, conducted on plates in calm sea waters, are reported in Figs 2 and 3. The figures show that all the samples everywhere reached, more or less quickly, the same final potential values. Therefore, the same corrosive effects should be expected where the sea water temperature ranged between 6 and 26°C.
The systematic analytical characterisation of marine biofilms, collected
- 400 W $ 300
200 v
1 100
& -100
U
i o 3 a Lo
r b -200
' -300
1 -----
If I
Trondheim 1 * Kristineberg
0 10 20 30 40 50
Time (days)
Fig. 2 Change with time of the average open circuit potentials measured on plates of S S in passive state in various European Seas. The data refer to summertime tests.

Marine Biofilm Structure and Corrosion Behaviour of Stainless Steels i n Sea Water 45
-300 4 1
+- Brest
-a- Cherbourg
t- Genova
* Kristineberg
+- Trondheim
0 10 20 30 40
Time (days)
50
Fig. 3 Change with time of the average open circuit potentials of plates of SS in the passive state in various European Seas. The data refer to wintertime tests.
throughout the MAST project in five European stations and in different seasonal conditions, has shown the existence of a meaningful relationship between E,,,, and EPS carbohydrate contents [7] and this in spite of the wide differences observed in the E,,,, time behaviour (see Fig. 4).
Figure 4 shows, in particular, that the two biological and electrochemical parameters appear to be linked by a non linear relationship with two linear arms:
A W 0 E > E E
W"
0 200 m 600 800 loo0 Extra-Carb (ng cm-2)
Fig. 4 Correlation between the corrosion potentials and the EPS carbohydrate contents of biofilms formed on S S surfnces at all marine stations. The dashed area covers 80% of all
experimental data .
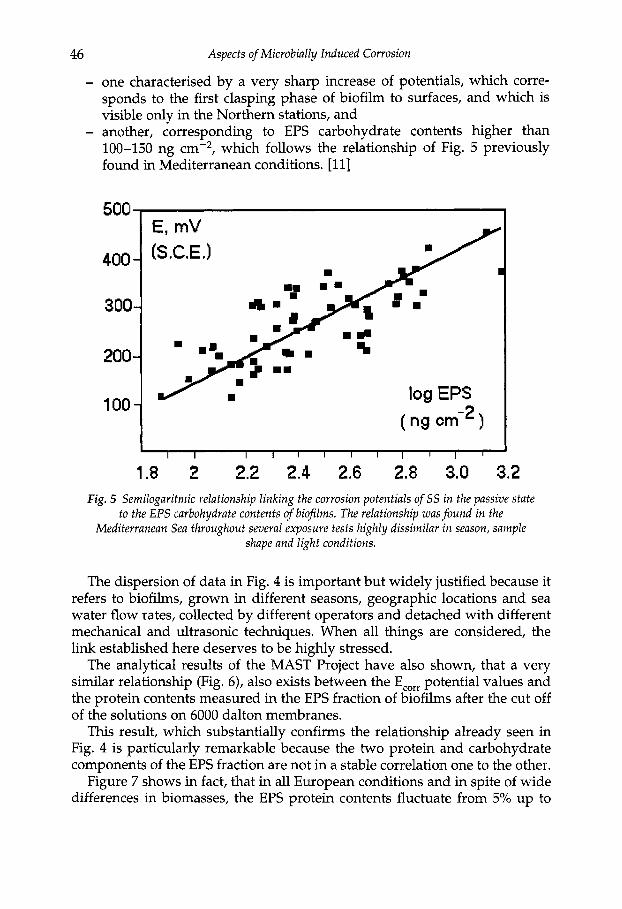
Aspects of Microbially Induced Corrosion
one characterised by a very sharp increase of potentials, which corre- sponds to the first clasping phase of biofilm to surfaces, and which is visible only in the Northern stations, and another, corresponding to EPS carbohydrate contents higher than 100-150 ng cm-2, which follows the relationship of Fig. 5 previously found in Mediterranean conditions. [ll]
500
400 -
300-
200-
100-
E, mV (S.C.E.)
log EPS [ ng ,ni2
I I I I 1 I I I I I I I
Fig. 5 Semilogaritmic relationship linking the corrosion potentials of S S in the passive state to the EPS carbohydrate contents of bioflms. The relationship was found in the
Mediterranean Sea throughout several exposure tests highly dissimilar in season, sample shape and light conditions.
The dispersion of data in Fig. 4 is important but widely justified because it refers to biofilms, grown in different seasons, geographic locations and sea water flow rates, collected by different operators and detached with different mechanical and ultrasonic techniques. When all things are considered, the link established here deserves to be highly stressed.
The analytical results of the MAST Project have also shown, that a very similar relationship (Fig. 6), also exists between the E,,,, potential values and the protein contents measured in the EPS fraction of biofilms after the cut off of the solutions on 6000 dalton membranes.
This result, which substantially confirms the relationship already seen in Fig. 4 is particularly remarkable because the two protein and carbohydrate components of the EPS fraction are not in a stable correlation one to the other.
Figure 7 shows in fact, that in all European conditions and in spite of wide differences in biomasses, the EPS protein contents fluctuate from 5% up to

Marine Bio f lm Structure and Corrosion Behaviour of Stainless Steels in Sea Water 47
400
300
200
100
0
1""
0 50 100 150 200
Extra-Prot (ng cm-2)
Fig. 6 Correlation between the corrosion potentials and the protein contents of the EPS fraction of biofilms collected at all European marine stations
200
180
160
140
I
C
f I 2 O E 100 B
80
k 60
40
20
Q VI
0 200 400 600 800 1000 1200 1400
EPS carb. contents ng ern-2
Fig. 7 Incidence o f the proteins on the carbohydrate contents i n the EPSfraction of European bioflms. The data refer to: W Northern Europe stations and to the + Mediterranean station
30% of the EPS carbohydrate amounts and perhaps follow the seasons and the sea water temperatures.
In conclusion, the MAST results have offered an experimental confirmation that the potential ennoblement of SS in passive state could be attributed to 'something' which is entrapped in the EPS fraction of biofilms. Consequently, future studies should be focused on the extracellular substances of biofilms.

48 Aspects of Microbially Induced Corrosion
In any case, the link established in Fig. 6 should strenghten the hypothesis already proposed in 1985 [3] that extracellular enzymes entrapped in the EPS matrixes of biofilms could be responsible for the SS ennoblement through cat- alytic effects on the oxygen reduction kinetics.
The link between E,,,, and the EPS polysaccharide contents already estab- lished in Fig. 4 could provide evidence for these biopolymers, acting as a glue, to be essential for the immobilisation and the achievement of effective con- centrations of the enzymes at the metal surfaces.
The disappearance of the potential ennoblement when a very powerful enzyme inhibitor such as sodium azide is added to these solutions,[3] vali- dates this view.
Furthermore, a preliminary screening of the molecular weights of proteins trapped in the EPS fraction of biofilms has shown the presence of some com- pounds with molecular weights between 15000 and 70000 dalton, values which are reasonably consistent with those expected for extracellular en- zymes.
Conclusion
An analytical approach conducted on a European scale has confirmed that the biocorrosive effects on SS, caused by the settlement of marine biofilms on their surfaces, and that they are typical of a worldwide phenomenon that is always present in European conditions - at least for sea water temperatures between 6 and 26°C - and where the 'key' factor for their appearance must be looked for in the extracellular matrixes of biofilms.
This conclusion rises from the singling out of meaningful relationships be- tween the free corrosion potentials of SS measured on a European scale and the protein and carbohydrate contents of the extracellular polymeric sub- stances of biofilms.
Considering that the two analytical parameters are not in a stable corre- lation to each other, these results seem to strenghten the hypothesis of a catalytic action coming from enzymes immobilised on SS surfaces, where they reach effective concentrations as a result of the glue-like action of the poly- meric EPS fraction.
The low molecular weights ( from 15 000 to 70 000 dalton) characterising the proteins trapped in the EPS matrixes are consistent with those expected for ex- tracellular enzymes.
Acknowledgement
The Authors warmly thank the Researchers of CEA (France), IFREMER (France), SCI (Sweden) and SINTEF (Norway), Partner Institutions of

Marine Bioflm Structure and Corrosion Behaviour of Stainless Steels in Sea Water 49
MAS2CT920011 Project partially funded by the European Community, for the collection of biofilm samples and Mr.Giuseppe Marcenaro of ICMM for his technical assistance.
References
1. 2. 3. 4. 5. 6.
7.
8.
9.
10. 11.
A. Mollica: Int. Biodeterioration b Biodegradation, 1992,29,213-229. E. Bardal, M. Drugli and P.O. Gartland: Corros. Sci., 1993, 35,257-267. V. Scotto, R. Di Cintio and G. Marcenaro: Corros. Sci., 1985,25, 185-194. G. Ventura, E. Traverso and A. Mollica: Corrosion, 1989,45,319-325. B. Little, P. Wagner and D. Duquette: Corrosion, 1988,44, 270-274. F. Mansfeld, R. Tsai, S. Hong, B. Little, R. Ray and P. Wagner: Corros. Sci.,
V. Scotto, A. Mollica, J.P. Audouard et al: Proc. Second M A S T days and Euromar market, European Commission, 1995, Vol. 2,1060-1073. J.P. Audouard, C. Compere, N.J.E. Dowling, D. Feron et al.: Proc. Int. Congress on MIC, New Orleans, NACE, Houston TX, 1995. J.D.H. Streackland and P.R. Parsons: A practical handbook of sea water analysis, Fisheries Research Board of Canada, Bulletin 167, Ottawa, 1972. M. Bradford: Anal. Biochem., 1976,72,248-254. V. Scotto, M. Beggiato, G. Marcenaro and R. Dellepiane: Marine Corrosion of Stainless Steels: Chlorination and Microbial Efects, C.A.C. Sequeira and A.K. Tiller eds, EFC Publication No. 10, The Institute of Materials, London, 1992,5-20.
1992,33,445-456.

On Oxygen Reduction Depolarisation Induced by Biofilm Growth on Stainless Steels in
Sea Water
A. MOLLICA*, E. TRAVERSO" and D. THIERRY**
*ICMM-CNR, Via De Marini 6,16149 Genova, Italy. **Sci, Roslagsvagen 101, Hus 25,10405 Stockholm, Sweden
ABSTRACT The cathodic efficiency increase with time of stainless steel during its exposure to natural sea water was studied by means of potentiostatic polarisation, impedance measurement and current distribution mapping.
The results can be explained by assuming that two oxygen reduction kinetics, a slow and a fast, concurrently run on complementary stainless steel surface area frac- tions. Also, the extent of active sites on which oxygen is quickly reduced is a function of biofilm development as well as potential.
Based on this model, an analytical expression, able to predict quantitatively the de- velopment of oxygen reduction as a function of exposure time and potential, is provided.
Additional tests confirmed the validity of the proposed model and suggested that active site formation is due to adsorption on stainless steel surfaces of some extra- cellular bacterial enzyme, acting as a catalyst for electron transfer to oxygen.
Introduction
As recently confirmed by extensive cooperative work,[l] it is now widely ac- cepted that aerobic bacteria colonisation of stainless steel (SS) surfaces has various effects on microbially induced corrosion (MIC).
Indeed, as a result of SS surface colonisation:
- free corrosion potential of SS in the passive state moves in the n.oble
- a higher corrosion propagation rate is observed once localised corrosion
- higher galvanic currents between SSs and less noble materials are mea-
direction so making the onset of localised corrosion more likely;
starts and, finally,
sured.
There is now general agreement that these effects are due to a cathodic ef- ficiency increase induced by bacterial settlement on SS surfaces. However, al- though a number of different hypotheses have been proposed (effect of H202 combined with low pH,[2] H,02 produced by glucose-oxydase,[3] MnO,

52 Aspects of Microbially Induced Corrosion
biofilm,[4] electrocatalysis of oxygen reduction reaction,[5] etc. . . .), so far, the mechanism by which SS cathodic efficiency is modified by settlement of bac- teria has not, or has only poorly, been explained.
This paper aims to contribute to the study of the MIC mechanism on SS. For this purpose our work was organised in order to:
- collect field data quantifying the cathodic current increase with time on SS samples exposed to natural sea water and potentiostatically polarised at different potentials;
- suggest a mechanism, based on field data analysis, by which the devel- opment of SS cathodic efficiency is explained as a function of biofilm growth as well as imposed potential;
- translate the model into an analytical expression able to anticipate the real development quantitatively;
- validate the proposed model with additional tests in which techniques such as electrode impedance spectroscopy and Scanning Vibrating Electrode are used to show that some of the effects forecast by the model can really be observed.
Methods and Materials
Potentiostatic Cathodic Polarisation
Five SS (20 Cr, 18 Ni, 6 Mo) specimens were simultaneously immersed in a tank containing continuously renewed natural sea water, and immediately polarised at -450, -300, -150, 0 and +150 mV(SCE), respectively. During polarisation, the reduction current on each specimen was recorded every 6 hours.
Impedance Measurements
During cathodic potentiostatic polarisation, impedance measurements were carried out by superimposing on the imposed potential a sinusoidal pertu- bation of 10 mV amplitude at frequencies ranging from lo3 to lo-* Hz with 5 measurements at each frequency decade.
Cathodic Current Density Mapping
Cathodic current density maps were obtained on small SS samples, normally left in free corrosion in periodically renewed natural sea water, and tem- porarily polarised at -800 mV(SCE) for a few minutes sufficient for mapping the cathodic current distribution by the Scanning Vibrating Electrode Techniques (SVET).
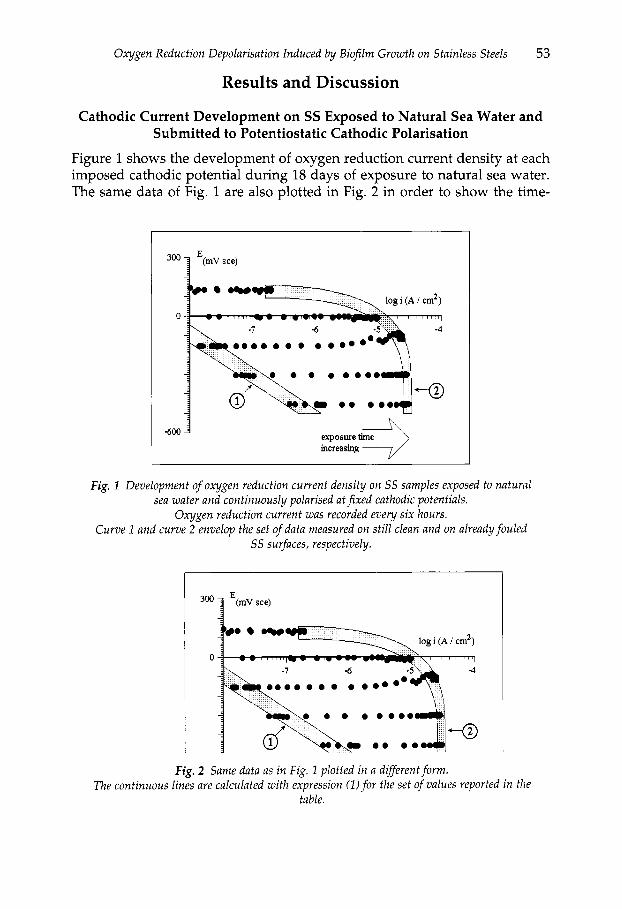
Oxygen Reduction Depolarisation lnduced by Biofilm Growth on Stainless Steels 53
Results and Discussion
Cathodic Current Development on SS Exposed to Natural Sea Water and Submitted to Potentiostatic Cathodic Polarisation
Figure 1 shows the development of oxygen reduction current density at each imposed cathodic potential during 18 days of exposure to natural sea water. The same data of Fig. 1 are also plotted in Fig. 2 in order to show the time-
0
-4 ............ ...... I -600 1
exposure t h e increasing
Fig. 1 Development of oxygen reduction current density on S S samples exposed to natural sea water and continuously polarised at fixed cathodic potentials.
Oxygen reduction current was recorded every six hours. Curve 1 and curve 2 envelop the set of data measured on still clean and on already fouled
S S surfaces, respectively.
0 .......... .......
4
-6
Fig. 2 Same data as in Fig. 2 plotted in a different form. The continuous lines are calculated with expression (1) for the set of values reported in the
table.

54 Aspects of Microbially Induced Corrosion
dependence of the cathodic current more clearly. During the exposure, the biofilm grew on initially clean SS surfaces.
The data plotted in Fig. 1 can be summarised as follows:
- the envelope of the data measured on still clean SS surfaces (curve 1) in- dicates oxygen reduction kinetics i, (E) decribed by the Tafel line:
10-E/P1 A cm-, where PI = 0.23 V/decade i,(E) =
- during exposure to sea water, and hence during biofilm growth on SS surfaces, the reduction current increases rapidly up to a maximum value depending on the imposed potential and then remains stable;
- the envelope of maximum current values (curve 2) indicates reduction kinetics i, (E) characterised by a limiting current i, close to 30 FA cmP2 at potentials lower than about -150 mV(SCE) and fitted by a line with a very low apparent P, value (< 0.07 V/decade) at more noble potentials.
Cathodic current is, therefore, a function of imposed potential and
As stated above, the following discussion aims to: exposure time, [i(E,t)].
- suggest a model able to explain the observed cathodic current evolution [i(E,t)] as a function of biofilm development on SS surfaces and of imposed potential,
- formulate an analytical expression based on the model and, finally, - verify that the proposed expression is able to predict accurately the
experimental current development.
Model
The simplest model suggests that oxygen reduction is catalysed on the frac- tion of the SS surface covered by biofilm and that, consequently, the cathodic current increase with time from i,(E) to i,(E), during SS exposure to sea water, is merely the result of an increasing surface coverage by biofilm.
Analytical Expression Based on the Model
Based on this model, an analytical expression able to predict the oxygen re- duction current as a function of the imposed potential as well as exposure time [i(E,t)] can be formulated by assuming that:
the metal surface area fraction covered by biofilm, eb(t), increases from 0 to 1 during exposure; two distinct oxygen reduction kinetics, slow i,(E) and fast i2(E), take place on clean [l - eb(t)] and fouled [eb(t)] surface fractions, respectively.

Oxygen Reduction Depolarisation Induced by Biofilm Growth on Stainless Steels
From the above, the total reduction current at a given time will be:
55
i(E,t) = i,(E) [I - e b ( t ) ] + i2(E) eb(t) = i,(E) + [iZ(E) - i,(E)] e b ( t ) .
e,(t) evolution is described by a logistic expression such as:
e,(t) = 0.1.10 ( t - t0 )7 / 10.9 + 0.1.10 (f-to)71,
similar to that often used to describe biofilm developed with time.161 In previous work [7] this expression was shown to describe well the devel- opment of bacteria population on SSs in sea water.
In conclusion, we obtain:
i(E,t) = i,(E) + [i2(E) - i , (E)] O . l * l O ( f - f J T / [0.9 + 0.1-10 (t-fJ7] (1)
Verification of the Proposed Model
Equation (1) was applied to fit the experimental development with time of the cathodic current at each tested potential. The continuous lines in Fig. 2 are the best fits obtained with eqn (1) calculated for the set of values reported in the same figure.
It can be seen that:
- at each imposed potential a logistic expression can be applied to predict the development of the observed current evolution;
- at all imposed potentials equal or lower than -150 mV(SCE), to is about 4-5 days and T is close to 1 day. These values are close to the to and T values obtained when the logistic expression was applied to fit the re- sults of settled bacteria counts in a previous test performed under simi- lar experimental conditions.[7] A direct correlation between cathodic current and biofilm growth is then proved for potentials equal or lower than - 150 mV(SCE).
- although the specimens were exposed under the same conditions to sea water, and hence a single biofilm development law would be expected on all the samples, the calculated to and T values appear to be regularly increasing when the imposed potential is raised to more than -150 mV(SCE). As a consequence, eqn (1) must be modified to extend its applicability to the field of relatively noble potentials.
Modified Model
To extend the applicability of eqn (1) to the field of relatively noble potentials, O,(t) was simply replaced by 8 (E,t) in the following expression:
e ( ~ , t ) = e,(t).k IO-~/*/[I + k (2)

56 Aspects of Microbially Induced Corrosion
in which a correction for the potential was applied to O,(t).
reasons: This kind of correction was chosen for the following formal and substantive
- first, the new expression maintains the time-dependence of the cathodic current as a logistic law at all imposed potentials;
- in addition, the correction factor k 10-E/a/[l + k 10-E’a] tends to 1 for low potentials and, as a consequence, the direct correlation observed above between cathodic current and biofilm growth at low imposed potentials is also maintained;
- finally, expression (2) could be read in the following way:
‘active sites’for the fast oxygen reduction i2(E), whose overall extent 0 (E,t) de- pends on the actual biofilm coverage 6Jt) us well as on the imposed potential, are created on S S surfaces: the overall extent of active sites decreases by increasing the imposed potential, the biofilm coverage being equal.
Such a reading of eqn (2) allows us to overcome an apparent discrepancy observed among some of the data collected during field tests.
As a matter of fact, on clean SS surfaces, Fig.1 shows that oxygen reduction kinetics i,(E) appears to be described by a Tafel line whose slope p, is close to 0.23 V/decade. Impedance measurements carried out on clean SS surfaces cathodically polarised to deliver a cathodic current i, > 0.1 FA cm-2 agree with this indication. Indeed, impedance data can be well fitted by a Randles circuit, in agreement with activation control for oxygen reduction as suggested by the Tafel line. Also, the values calculated through p1 = 2.3 i, R,, where R, is the diameter of the semicircle described by the impedance data in a Nyquist plot, were very close to the Tafel line slope.
On fully fouled SS surfaces, the new cathodic curve &(E) is described by a line with a very low slope (p, < 0.07 V/decade) for potentials higher than about 0 mV(SCE). This value is not confirmed by impedance measurements. Impedance data, like those shown as an example in Fig. 3, obtained on fouled SS surfaces cathodically polarised to deliver cathodic currents ic between 0.1 and 1 FA cm-2showed that :
- the impedance data, in this case also, are well fitted by a Randles circuit,
- the pz values calculated from impedance data fall, always, in between but
0.18 and 0.25 V/decade.
The discrepancy between the apparent low slope of the line enveloping the final values of the cathodic current measured in the potential range above 0 mV(SCE) (Fig. 1) and the high slope calculated by impedance measurements can be overcome assuming that:

Oxygen Reduction Depolarisation lnduced b y Biofilm Growth on Stainless Steels 57
1 -Im
‘dl I R t (pF.cm’2) (ohm.cm2)
i c p,= 2.3 R t i c 2
(A.cm’ ) (V /dec )
/ A I 17 I 3.5 1 o 6 I 0.2 Kf6I 0.16 I 0
c 25 1.5 I O 5 0.75 Id6 o.26
17 0.65 I O 5 1.2 I C 6 O . I 8
Fig. 3 Examples ofimpedance data measured on S S surfaces already covered b y biofilm and cathodically polarised to deliver a cathodic current i , f rom 0.1 to 1 FA c w 2 .
Cont inuous lines represent the calculated values assuming f o r the Rundles circuit i n this f igure the values of the passive elements listed i n the table (Rs << 100 o h m in all cases).
In the table the calculated values of p2 are also reported. Full circles i n the graphs correspond to the impedance data measured or calculated at
0.1 Hz.
- in each point of curve 2 in Fig. 1 above 0 mV(SCE), the real Tafel slope is that provided by impedance measurements but,
- in agreement with the proposed reading ofeqn (2), the surface area fraction available for fast oxygen reduction decreases on increasing the imposed potential.
Analytical Expression Based on the Modified Model
From the above, it follows that cathodic current development should be pre- dicted by the following system of equations:
where:
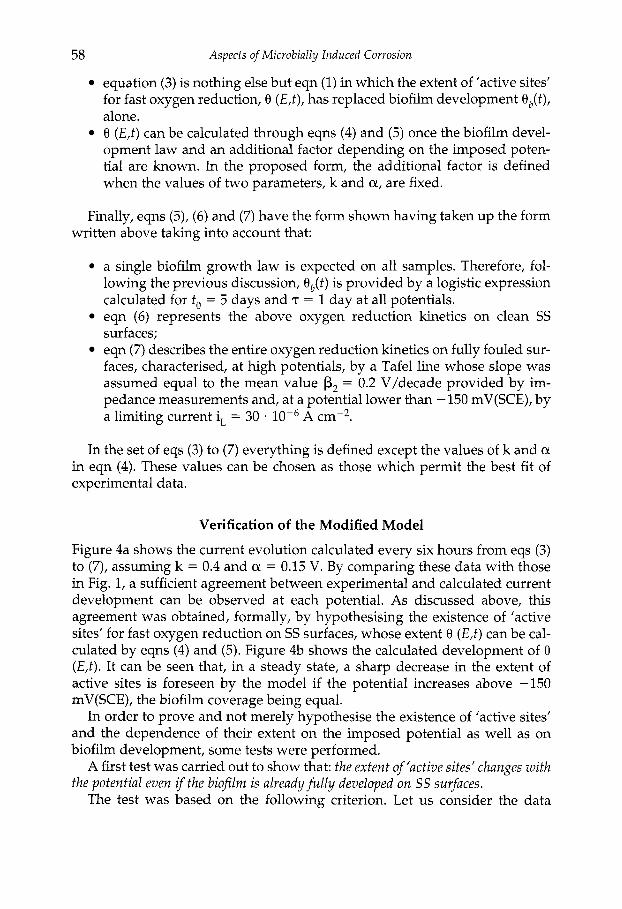
58 Aspects of Microbially Induced Corrosion
equation (3) is nothing else but eqn (1) in which the extent of ’active sites’ for fast oxygen reduction, 8 (E, t ) , has replaced biofilm development 8,(t), alone. 8 (E , t ) can be calculated through eqns (4) and (5) once the biofilm devel- opment law and an additional factor depending on the imposed poten- tial are known. In the proposed form, the additional factor is defined when the values of two parameters, k and CY, are fixed.
Finally, eqns (5), (6) and (7) have the form shown having taken up the form written above taking into account that:
a single biofilm growth law is expected on all samples. Therefore, fol- lowing the previous discussion, 8&t) is provided by a logistic expression calculated for to = 5 days and T = 1 day at all potentials. eqn (6) represents the above oxygen reduction kinetics on clean SS surfaces; eqn (7) describes the entire oxygen reduction kinetics on fully fouled sur- faces, characterised, at high potentials, by a Tafel line whose slope was assumed equal to the mean value p2 = 0.2 V/decade provided by im- pedance measurements and, at a potential lower than -150 mV(SCE), by a limiting current i, = 30 A cm-*.
In the set of eqs (3) to (7) everything is defined except the values of k and CY
in eqn (4). These values can be chosen as those which permit the best fit of experimental data.
Verification of the Modified Model
Figure 4a shows the current evolution calculated every six hours from eqs (3) to (7), assuming k = 0.4 and CY = 0.15 V. By comparing these data with those in Fig. 1, a sufficient agreement between experimental and calculated current development can be observed at each potential. As discussed above, this agreement was obtained, formally, by hypothesising the existence of ’active sites’ for fast oxygen reduction on SS surfaces, whose extent 8 (E, t ) can be cal- culated by eqns (4) and (5). Figure 4b shows the calculated development of 8 (E,+ It can be seen that, in a steady state, a sharp decrease in the extent of active sites is foreseen by the model if the potential increases above -150 mV(SCE), the biofilm coverage being equal.
In order to prove and not merely hypothesise the existence of ’active sites’ and the dependence of their extent on the imposed potential as well as on biofilm development, some tests were performed.
A first test was carried out to show that: the extent of’active sites’ changes with the potential even if the biofilm is already fu l l y developed on S S surfaces.
The test was based on the following criterion. Let us consider the data

Oxygen Reduction Depolarisation Induced by Bioflm Growth on Stainless Steels 59
E (Vsce) 0.3 3
Fig. 4 Change with time at different imposed potentials of: a - oxygen reduction current density,
b - active site extent 0 (E,t), calculated, every six hours, using eqns (3 ) to (7) assuming a = 0.25 V, k = 0.4.
plotted in Fig. 2 and, in particular, the trends of cathodic current at imposed potentials equal or lower than -150 mV(SCE). Following the model, the trends of cathodic current in this potential range are justified by the gener- ation, due to the biofilm growth on SS surfaces, of active sites for fast oxygen reduction whose extent with time tends to 1 (Fig. 4b). Now, let us imagine that the cathodic polarisation is stopped when the biofilm is fully developed on SS surfaces and then that the SS samples are left to corrode freely under open cir- cuit conditions; the SS potential will take up a value close to +300+ +350 mV(SCE), which is the normal free corrosion potential of passive SS when covered by a biofilm.
The model (Fig. 4b) anticipates that at this new potential, once the equilib- rium is reached, a strong reduction by about two orders of magnitude in the extent of active sites is expected, the biofilm coverage remaining, at least., the same. If this is true, when the polarisation is applied again and then perma- nently sustained, a small cathodic current, due to fast oxygen reduction on the strongly decreased active area, should be initially observed, which later in- creases by about two orders of magnitude, until the previous equilibrium i.e. before interruption of polarisation is again restored.
Figure 5 shows data in full accordance with those predicted by the model, thus confirming that on SS already covered with biofilm, the extent of 'active sites' 0 (E,t) changes with the potential. Furthermore, the data plotted in Fig. 5 indicate that, when the potential is changed, several days can be required before equilibrium is reached at the new potential.
A second test was carried out to show that: active si tesforfast oxygen reduc- tion are really generated during b io f lm development.

60 Aspects of Microbially Induced Corrosion
. . , I
I
I I l l / ~ l l I l l l I / l ) I l I I l l I l
10 20 I ~ I I I
30
Fig. 5 Phase 1 - Oxygen reduction current density evolution on S S continuously cathodically
polarisedfvom the beginning of the exposure to natural sea water. The data and the symbols are the same as in Fig. 2. Phase 2 - Polarisation interruption for 4 days. S S samples are left i n p e e corrosion. Phase 3 - Oxygen reduction current density evolution after restored cathodic polarisation.
Figure 6 shows the free corrosion potential change of an SS sample ex- posed, in the laboratory, to natural sea water renewed twice a week. As a con- sequence of biofilm growth, the free corrosion potential reached a steady value close to + 300 mV(SCE) after about 40 days. Cathodic current maps were obtained after 1 and 50 days of exposure (Fig. 7).
It can be seen that:
- after 1 day exposure, the oxygen reduction current on SS surfaces that are still clean is uniformly distributed over the whole surface. This means that, when no biofilm is present, a single oxygen reduction kinetics applies to the entire metal surface;
300
200
100
0
-1 00
10 20 30 40 50 Time [days]
Fig. 6 Evolution offree corrosion potential of an S S sample exposed, in the laboratory, to natural sea water renewed tzuice a week.
Oxygen Reduction Depolarisation Induced by Bioflm Growth on Stainless Steels 61
after 1 day
80 60
20 0
40 a i
after 50 days
30
0
_Iu
0
Fig. 7 Cathodic current distribution on stainless steel after 1 and 50 days of exposure to renewed sea water.
- after 50 days exposure, preferential sitesfor a fast oxygen reduction clearly appear on S S fouled surface; on the remaining area, the oxygen reduc- tion rate is unchanged. This confirms that, in agreement with the model, two different kinetics, a slow and a fast, coexist on fouled SS surfaces;
- the area available for fast oxygen reduction amounted to about 2% of the total investigated surface, i.e. the same order of magnitude of active site extent predicted by the model when, as a consequence of biofilm growth, the free corrosion potential reaches a value close to +300 mV(SCE) (Fig. 4b).
A third test was conducted in order to collect more information about the nature of 'active sites' and in particular to show that: active sites can be deacti- vated by adding sodium azide, an enzymatic inhibitor, to sea water.
Recently, as a result of comparative tests carried out in European seas, a correlation was found between SS free corrosion potential ennoblement and accumulation of extracellular bacterial products on their surfaces.[8] Since potential ennoblement disappears when an enzymatic inhibitor like sodium azide is added to sea water,[5] extracellular enzymes, which occur among bac- terial products, are, in particular, suspected to play an important role in MIC mechanism of SS in sea water. The aim of the following test was to see whether sodium azide acts on the active sites by depressing their oxygen re- duction efficiency. If this effect is proved, it would follow that:
- the observed decrease in free corrosion potential with time after sod.ium

62 Aspects of Microbially Induced Corrosion
azide addition can be explained as due to preexisting active site inhi- bition, and
- the generation of active sites can be assumed to be due to local adsorp- tion of extracellular enzymes on SS surfaces.
Therefore, one of the active sites identified during cathodic current map- ping performed after 50 days exposure was selected and the change with time in its cathodic efficiency was repeatedly measured after sodium azide ad- dition to sea water.
Figure 8 shows that active site cathodic efficiency sharply decreased in a few minutes after NaN, addition, i.e. in a time just sufficient for inhibitor dif- fusion from the solution bulk to the SS surface. Later, the active site totally dis- appeared.
80
40
0
80
40
0
Fig. 8 Cafhodic ejficiency inhibition of an acfive site induced by 1% NUN3 addition in sea wafer:
A) before NaN, addition B ) 5 min. and C ) 565 min. later.
In conclusion, the results of the few tests discussed above are encouraging
- validate the proposed model, showing that, preferential sites, on which oxygen reduction is fast, are generated during biofilm development on SS surfaces and that their overall extent also depends on the potential;
- suggest that active sites are generated by the adsorption of some extra- cellular bacterial enzyme, acting as a catalyst for electron transfer from SS to oxygen.
because, at present, they seem to:
Other work is planned on this subject.

Oxygen Reduction Dqolarisation Induced by Bioflm Growth on Stainless Steels 63
Conclusions
A model has been developed to explain the changes with time of cathodic cur- rent on SSs potentiostatically polarised during exposure to natural sea water. The model anticipates that:
two oxygen reduction kinetics, a slow and a fast, run concurrently on complementary SS surface area fractions; active sites for fast oxygen reduction are generated during biofilm growth on SS surface; the extent of the active sites depends on biofilm development as well on potential; the extent of the active sites rapidly decreases by increasing the potential above -150 mV(SCE), the biofilm coverage being equal; active sites are, probably, generated by the adsorption on SS surfaces of some extracellular bacterial enzyme, acting as a catalyst for electron transfer from SS to oxygen.
Grants
This work is a part of MAS2 CT92-0011 contract 'Marine Biofilm on Stainless Steels: Effect, Monitoring, Prevention' supported by Commission of the European Communities, Directorate General for Science, Research and Development.
References
1.
2.
3. 4.
5.
6.
7.
8.
D. FQon, I. Dupont and G. Novel: EUROCORR '96, Nice, France, l996. (This vol. pp 103-112). P. Chandrasekarian and S.C. Dexter: Corrosion 93, Paper 493, NACE, Houston TX, 1993. H. Amaya and H. Miyuki: Corros. Eng., 1995,44,123-133. W.H. Dickinson, F. Caccavo and Z. Lewandowski: Corros. Sci., 1996, 38
V. Scotto, R. DiCintio and G. Marcenaro: Corros. Sci., 1985, 25 (3),
W.G. Characklis: 'Kinetics of microbial transformation', Bioflms, chapter no. 8, W.G. Characklis and K.C. Marshall eds, J.Wiley & Sons, New York, USA, 1990. A. Mollica and G. Ventura: Proc 8th Int. Congr. on Marine Corrosion and Fouling, Taranto, Italy, 1992, Oebalia, 1993,19 suppl., 313-322. V. Scotto and M.L. Lai: EUROCORR '96, Nice, France' 1996. (This vol. pp
(8), 1407-1422.
185-194.
41-49).
Characterisation of Biofilm Formed in Sea Water by Mass Transport Analysis
E. L’HOSTIS1t2, B. TRIBOLLET3 and D. FESTYl
’Laboratoire Matkriaux Marins, IFREMER, Centre de Brest, BP 70,29280 Plouzane, France *CIRSEE/Lyonnaise des Eaux, 38 rue du President Wilson, 78230 Le Pecq, France
3Laboratoire Physique des Liquides et Electrochimie, UPR15 du CNRS, Universite P. & M. Curie, 4 Place Jussieu, 75252 Paris CEDEX 05, France
Introduction
A biofilm is usually composed of microbial cells and their products (e.g. extra cellular polymers). The structure is generally very porous with respect to water content (>95%). Among other methods, a biofilm can be characterised by studying mass transport through it. In this work biofilm will be considered as an homogeneous porous layer on the macroscopic scale for mass transport.
A good tool for sensing mass transport properties in such a porous layer is the analysis of the flux of a redox solute which gives a fast electrochemical re- action at a metal surface coated with such a film. The tracer redox reaction provides a mass transport limiting current when using a rotating disk elec- trode (RDE). Two techniques are used here, namely electrohydrodynamical impedance (EHD) and the steady flow technique. These yield respectively the diffusion time 8:/Df and the diffusion speed D,/6,. Thus, the separate deter- minations of layer thickness 6, and diffusion coefficient D, are possible thus allowing the determination of the film porosity.
The aim of this work is the development of a method to follow the in-situ biofilm development with immersion time. The first step is the working out and validation of a porous layer model to reproduce the biofilm behaviour. The second step is the adaptation of the experimental protocol to the biofilm study.
Thickness and diffusion coefficients in biofilms have been determined. This characterisation is independent of the tracer used, and the results have been confirmed by microscopic observations. Development of a sensor for rnoni- toring biofilm evolution will be the first application of this technique.
Analysis of the Mass Transport through a Porous Layer
When ionic species are oxidised or reduced in a fast reaction at a metallic elec- trode coated with a porous layer, their concentration gradient is distributed

66 Aspects of Microbially Induced Corrosion
Tracer Concentration Coordinate
Tracer Concentration value
Electrode
Axial coordinate
Porous layer Molecular Diffision
Fig. 1 Variation of tracer concentration versus the axial coordinate where ijj is the porous layer thickness, 6, is the difusion layer thickness, c, is the concentration of the electroactive
species in the bulk solution and c, the concentration of the electroactive species at the electrodelporous layer interface
between the porous layer where mass transport is controlled by molecular diffusion and the electrolyte solution where mass transport is controlled by convective diffusion (Fig. 1).
Steady Flow Technique
The steady state current can be analytically calculated as follows:
with
where io is a non diffusional current, c, is the electroactive species concen- tration in the bulk solution, tifis the layer thickness, Df is the diffusion coeffi-

Characterisation of Biofilm Formed in Sea Water by Mass Transport Analysis 67
cient in the layer, D is the diffusion coefficient in the electrolyte, F :is the Faraday constant, n is the number of electrons, S is the active electrode area, v is the kinematic viscosity and SZ is the disk rotation speed.
The parameters io, iL1and K can be obtained by fitting eqn (1) to the experi- mental results. Then the diffusion rate Df/6f in the porous layer is deduced from the i-$ value.
Electrohydrodynamical Impedance (EHD)
The electrohydrodynamical impedance Z,,, is obtained from the frequency response analysis of an electrochemical system to a sinusoidal speed modu- lation at a rotating disk electrode.[l-31 In the case of a porous non-reacting layer covering the electrode:
Y withs = 'o f I D, (5) J
Where 6, is the diffusion layer thickness, o is the modulation frequency, - l / O ' ( O ) is the dimensionless convective Warburg impedance, r is the Gamma function with r(4/3) = 0.89298, Z, is the EHD impedance for uni- form accessible bare electrode and is a function of the dimensionless fre- quency ~ S c l ' ~ where p = o/SZ is a dimensionless frequency and Sc = v / D is the Schmidt number. Sc is characteristic of the diffusing species in solution and allows one to determine the diffusion coefficient D.
Three parameters are obtained from the expressions (4) and (5 ) : Sc, D /6 f f and 8 / / D . Hence this technique enables one to calculate the diffusion time through t I: e porous non-reacting layer and the diffusion rate. In contrast to the simple behaviour on bare electrodes, the data do not depend only on the single dimensionless frequency p and an increase of SZ produces a shift of the Bode diagrams towards smaller p values. Moreover, the phase shift does not tend towards a limiting value when the frequency tends towards infinity, but increases monotonically.
Model Porous Layer: Gel Layer
Experimental Techniques
The model porous layer consists of gel coated on a gold inert electrode (!5 mm diameter).[4] The gel is a food gelatine. It was deposited by a spin coating technique directly on the RDE in air. Before deposition, the electrodes were
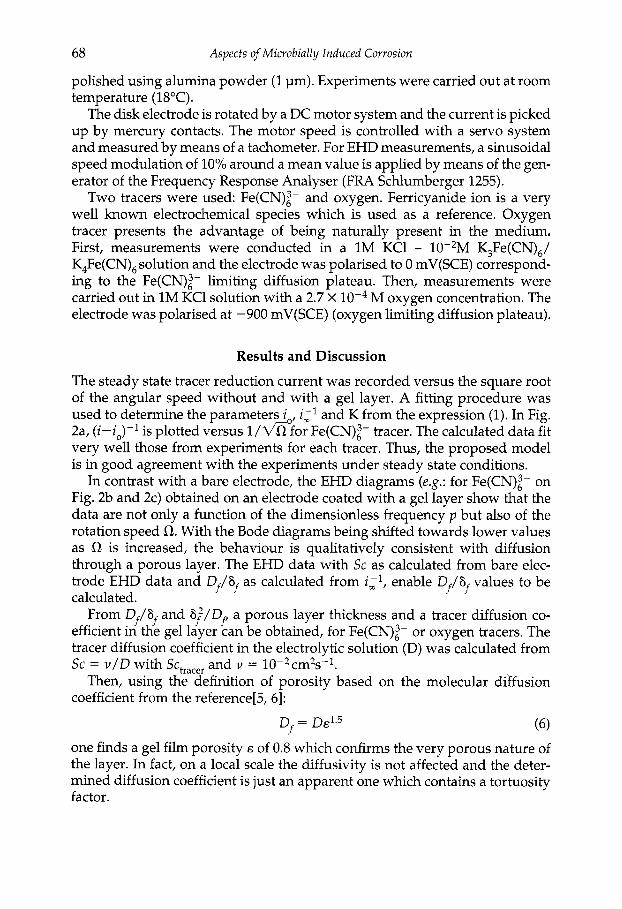
68 Aspects of Microbially Induced Corrosion
polished using alumina powder (1 pm). Experiments were carried out at room temperature (18°C).
The disk electrode is rotated by a DC motor system and the current is picked up by mercury contacts. The motor speed is controlled with a servo system and measured by means of a tachometer. For EHD measurements, a sinusoidal speed modulation of 10% around a mean value is applied by means of the gen- erator of the Frequency Response Analyser (FRA Schlumberger 1255).
Two tracers were used: Fe(CN):- and oxygen. Ferricyanide ion is a very well known electrochemical species which is used as a reference. Oxygen tracer presents the advantage of being naturally present in the medium. First, measurements were conducted in a 1M KC1 - 10-2M K,Fe(CN),/ K,Fe(CN), solution and the electrode was polarised to 0 mV(SCE) correspond- ing to the Fe(CN):- limiting diffusion plateau. Then, measurements were carried out in 1M KC1 solution with a 2.7 X lop4 M oxygen concentration. The electrode was polarised at -900 mV(SCE) (oxygen limiting diffusion plateau).
Results and Discussion
The steady state tracer reduction current was recorded versus the square root of the angular speed without and with a gel layer. A fitting procedure was used to determine the parameters io, i i l and K from the expression (1). In Fig. 2a, (i-i0)-I is plotted versus l/V% for Fe(CN):- tracer. The calculated data fit very well those from experiments for each tracer. Thus, the proposed model is in good agreement with the experiments under steady state conditions.
In contrast with a bare electrode, the EHD diagrams (eg . : for Fe(CN);- on Fig. 2b and 2c) obtained on an electrode coated with a gel layer show that the data are not only a function of the dimensionless frequency p but also of the rotation speed SZ. With the Bode diagrams being shifted towards lower values as SZ is increased, the behaviour is qualitatively consistent with diffusion through a porous layer. The EHD data with Sc as calculated from bare elec- trode EHD data and Df/Sf as calculated from i;', enable Df/Sf values to be calculated.
From Df/Sf and S j /Dy a porous layer thickness and a tracer diffusion co- efficient in the gel layer can be obtained, for Fe(CN):- or oxygen tracers. The tracer diffusion coefficient in the electrolytic solution (D) was calculated from Sc = u / D with Schacer and v = 10-2cm2s-1.
Then, using the definition of porosity based on the molecular dilfusion coefficient from the reference[5, 61:
(6) one finds a gel film porosity E of 0.8 which confirms the very porous nature of the layer. In fact, on a local scale the diffusivity is not affected and the deter- mined diffusion coefficient is just an apparent one which contains a tortuosity factor.
D = DE1.5 f
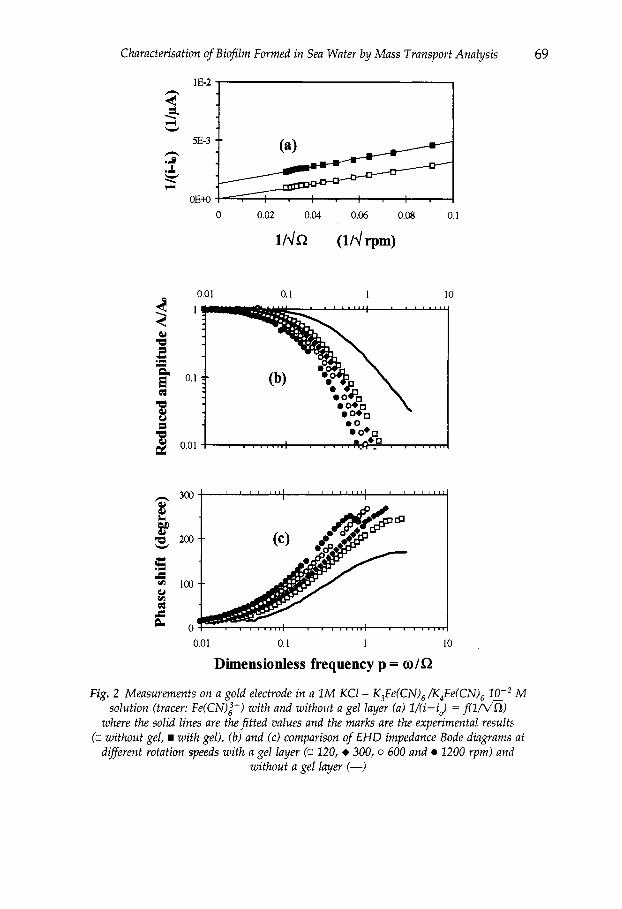
Characterisation of Biofilm Formed in Sea Water by Mass Transport Analysis 69
3 - 4
0 0.02 0.04 0.06 0.08 0.1
0.01 0.1 1 IO 1
0. I
0.01
0.01 0. I 1 10
Dimensionless frequency p = w/S2
Fig. 2 Measurements on a gold electrode in a 1M KCI - K,Fe(CN), /K,Fe(CN), M solution (tracer: Fe(CN)z-) with and without a gel layer (a) l/(i-io) = f(1m)
where the solid lines are the fitted values and the marks are the experimental results (0 without gel, with gel), (b) and (c) comparison of EHD impedance Bode diagrams at
diflerent rotation speeds with a gel layer (0 120, + 300, o 600 and 1200 rpm) and without a gel layer (-)

70 Aspects of Microbially Induced Corrosion
The porous layer characteristics obtained with oxygen tracer are identical to those obtained with the ferricyanide tracer (Table 1). In the porous layer, the oxygen diffusion coefficient (9.3 X lop6 cm2s-l) is higher than the Fe(CN);- diffusion coefficient (3.8 X cm2 s-l) and lower than the coeffi- cient calculated for the electrolytic solution, even if the scatter for oxygen is greater than for ferricyanide. From expression (6), the gel film porosity value found from oxygen and with ferricyanide are similar and confirm that such a film is highly hydrated.
Tracers
Fe(CN):- Oxygen
Table 1 Results obtained for the same gel layer with two diflerent tracers (oxygen and ferricyanide)
sc D (cm2 s-l) Sf (pm) Df (cm2 S-I) E
1500 6.7 9 3.8 0.8 800 1.3 10-5 9 9.3 10-6 0.8
Experiments with Biofilm
Experimental Conditions
The same procedure was applied to characterise on-line and in-situ the growth of biofilms developed on immersed RDE in sea water. Different experiments were performed to follow the biofilm development under different experi- mental conditions (Table 2).
The measurements were carried out in sea water. Ferricyanide ion and oxy- gen tracers were used (only oxygen tracer in sterilised sea water). The elec- trodes were polarised at a potential corresponding to the limiting diffusion plateau: 0 mV(SCE) for the ferricyanide tracer M) and -900 mV(SCE) for the oxygen tracer (2.7 lop4 M). A previous study showed K,Fe(CN),/K,Fe(CN),
Table 2 Exposure conditions for biofilm experiments
Water
PH Salinity (%.)
With yeast extract added (3.5 mg L-I)
Atlantic Ocean (Brest)
18 -0.3
8.2 35
Without yeast extract added
Atlantic Ocean (Brest)
20 -0.3
8.2 35
Sterile without yeast extract added
Atlantic Ocean (Arcachon)
Sterilised water
Quasi stagnant but renewed
8.2-8.3 35
24-25

Characterisation of Biofilm Formed i n Sea W a f e r by Mass Transport Analysis 71
to be innocuous towards the biofilm. In addition, the oxygen tracer has the advantage of having no particular toxicity for the biofilm.
Results and Discussion
The measurements made in sterilised sea water allowed the detection limit of porous layer thickness to be determined as 2 pm when using oxygen as trac- er. In living medium, a determination which will be equal to or less than 2 pm will be assumed to correspond to the absence of biofilm. This detection thresh- old can be considered as a maximum value when the ferricyanide is used as a tracer. During the exposure (3 weeks), different controls (culture and epia- fluorescence observations) showed that no bacteria were developed in the exposure medium nor on the electrode surface.
For a 12 days old biofilm developed in sea water with yeast extract addition (Fig. 3 with Fe(CN>:- tracer), the EHD data show a Bode diagram shift with increasing electrode rotation speed towards lower p values. The behaviour was qualitatively consistent with diffusion through a porous layer.
The measured diffusion coefficient in the biofilm is identical with the mea- sured electrolytic solution diffusion coefficient. This similarity between dif- fusion coefficients in the layer and in the electrolytic solution is consistent with a high porosity. This is in agreement with the fact that the biofilm con- tains around 95% of water. After that, it was possible to monitor the biofilm thickness development as a function of time. This was done by steady state measurements and by analysis of the Df/ tjf development.
Biofilm thickness evolution in sea water with added yeast extract (Fig. 4) and in natural sea water (Fig. 5) was monitored with oxygen and ferricyanide tracers. Taking into account the accuracy of measurement, the results can be said to be identical. The scatter can also be attributed to variations in biofilm development on different electrodes. The biofilm average thickness for a 15 days exposure in sea water with yeast extract and in natural sea water is 15 pm and 6 pm respectively.
SEM observations showed a significant bacteria population on the electrode surfaces with varying morphological types. However, SEM observations do not give the comparable indications as were obtained with the electrochemi- cal technique. Thus, SEM allows the distribution of bacteria clusters to be ob- served but modifies the biofilm morphology during the sample preparation.
In Fig. 7, the mean biofilm developments with and without yeast extract are compared. The difference in thickness is consistent with the experimental con- ditions of the biofilm development. The more the biological activity is promoted, the more important the porous layer thickness. The biofilm devel- opment time constants differ according to the exposure conditions, for example, biofilm formation is faster with yeast extract addition. This pattern is compatible with established knowledge on biofilm development.[7]
Confocal Laser Scanning Microscopic (CLSM) observations (Fig. 6) were
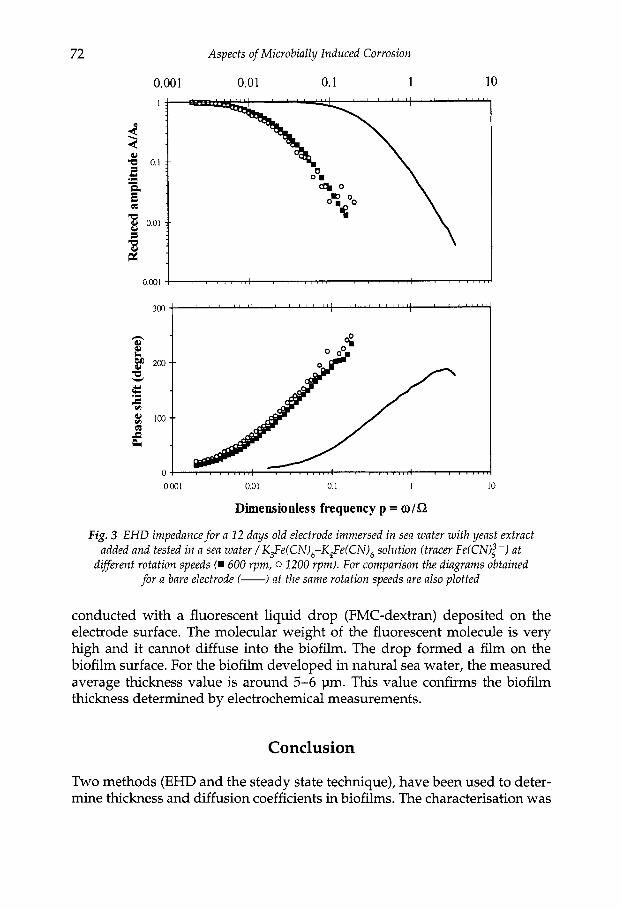
72 Aspects of Microbially Induced Corrosion
0.001 0.01 0.1 1 10
0.001 0.01 0.1 I 10
Dimensionless frequency p = o/Q
Fig. 3 EHD impedance for a 12 days old electrode immersed i n sea water wi th yeast extract added and tested in a sea water / K,Fe(CN),-K,Fe(CN)6 solution (tracer Fe(CN); -) at
different rotation speeds (m 600 rpm, 0 1200 rpm). For comparison the diagrams obtained for a bare electrode (-) at the same rotation speeds are also plotted
conducted with a fluorescent liquid drop (FMC-dextran) deposited on the electrode surface. The molecular weight of the fluorescent molecule is very high and it cannot diffuse into the biofilm. The drop formed a film on the biofilm surface. For the biofilm developed in natural sea water, the measured average thickness value is around 5-6 pm. This value confirms the biofilm thickness determined by electrochemical measurements.
Conclusion
Two methods (EHD and the steady state technique), have been used to deter- mine thickness and diffusion coefficients in biofilms. The characterisation was
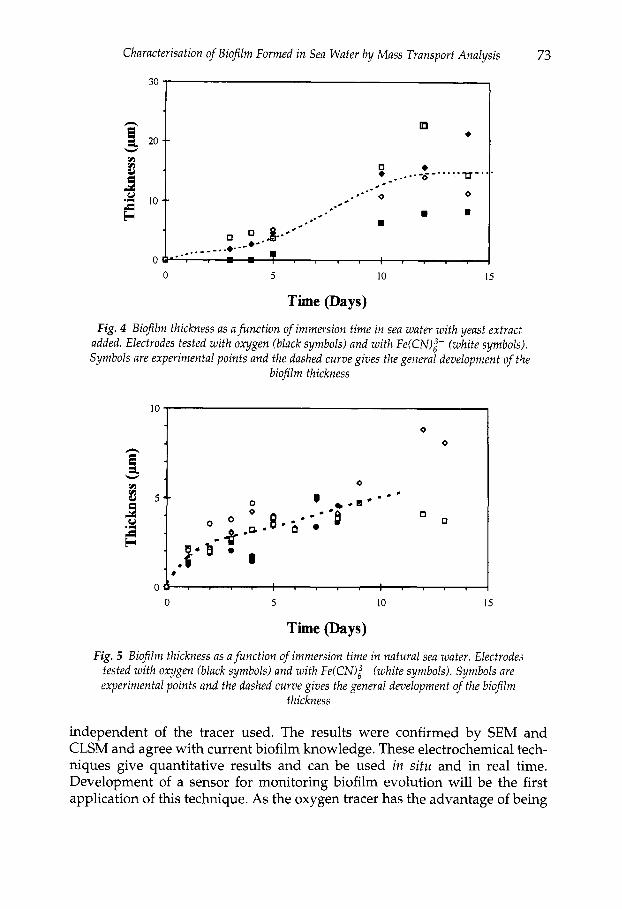
Characterisation of Biofilm Formed in Sea Water by Mass Transport Analysis 73
* I
0 5 I O 15
Time (Days)
Fig. 4 Biofilm thickness as afunction of immersion time in sea water with yeast extract added. Electrodes tested with oxygen (black symbols) and with Fe(CN)z- (white symbols). Symbols are experimental points and the dashed curve gives the general development of the
biofilm thickness
I O
0
0
0
0 5 IO 15
Time (Days)
Fig. 5 Biofilm thickness as a function of immersion time in natural sea water. Electrodes tested with oxygen (black symbols) and with Fe(CN);- (white symbols). Symbols are experimental points and the dashed curve gives the general development of the biofilm
thickness
independent of the tracer used. The results were confirmed by SEM and CLSM and agree with current biofilm knowledge. These electrochemical tech- niques give quantitative results and can be used in situ and in real time. Development of a sensor for monitoring biofilm evolution will be the first application of this technique. As the oxygen tracer has the advantage of being
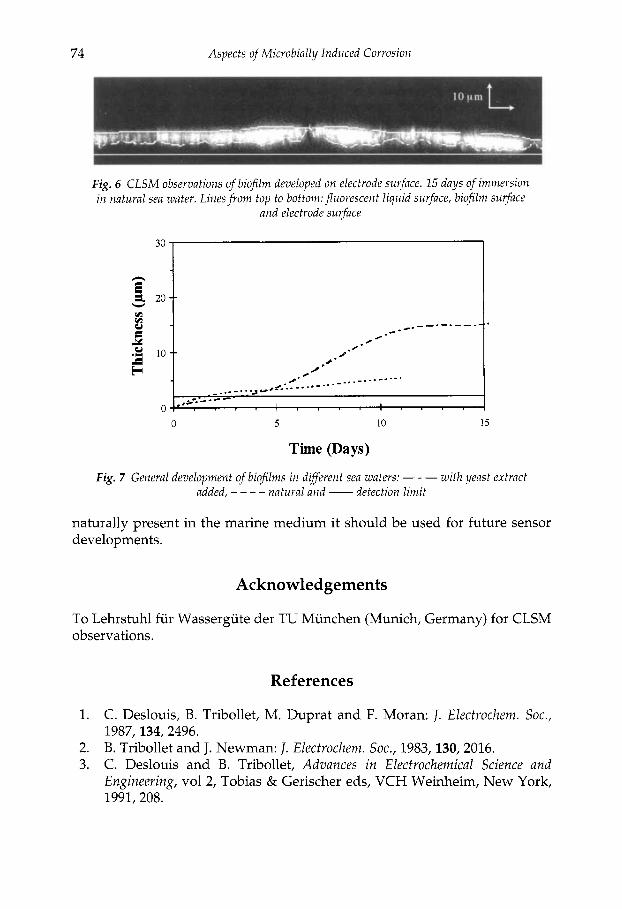
74 Aspects of Microbially Induced Corrosion
Fig. 6 CLSM observations of biofilm developed on electrode surface. 15 days of immersion in natural sea water. Lines f rom fop to bottom:,fluorescent liquid surface, biofilm surface
and electrode surface
30
n
5. 20 8 W
.Y 10
5 0
0 5 10 15
Time (Days)
Fig. 7 General development of biofilms in diflerent sea waters: - - - with yeast extract added, - - - - natural and - detection limit
naturally present in the marine medium it should be used for future sensor developments.
Acknowledgements
To Lehrstuhl fur Wassergute der TU Munchen (Munich, Germany) for CLSM observations.
References
1.
2. 3.
C. Deslouis, B. Tribollet, M. Duprat and F. Moran: J. Electrochem. Soc., 1987,134,2496. B. Tribollet and J. Newman: J. Electrochem. Soc., 1983,130,2016. C. Deslouis and B. Tribollet, Advances in Electrochemical Science and Engineering, vol 2, Tobias & Gerischer eds, VCH Weinheim, New York, 1991,208.

Charactevisation of Biofilm Formed in Sea Water by Mass Transport Analysis 75
4. E. L’Hostis, C. Deslouis, B. Tribollet and D. Festy: geme Forum sur les Impdances Electrochimiques, 21 nov. 1994, Paris, France.
5. A.C. West: J . Electrochem. SOC., 1993,140,403. 6. J.S. Newman: Electrochemical Systems, 2d ed., New Jersey, Prentice Hall
Inc., Englewood Cliffs, 1991. 7. W.G. Characklis: Bioflms, W. Characklis and K.C. Marshall eds, New
York, J. Wiley & Sons, 1990, 796.
Biofilms Analysis of Different Steels Immersed in Ground Water
F. FEUGEAS, G. EHRET" and A. CORNET
Laboratoire de Metallurgie, Corrosion et des Materiaux (LMCM) Ecole Nationale Superieure des Arts et Industries de Strasbourg (ENSAIS)
24, Bld de la victoire, F-67048 Strasbourg Cedex, France 'IPCMS, 23, rue du Loess, F-67037 Strasbourg Cedex, France
ABSTRACT The damage caused by microbiologically influenced corrosion (MIC) to metals such as cast iron, carbon steels, copper alloys, aluminium and stainless steels is evident in many aqueous environments. MIC occurs in the presence of biofilms which are able to modify chemical conditions on the metal surface and to create local changes in the type and rate of electrochemical reactions involved in the corrosion process. These biofilms are complex and have a very heterogeneous structure. The aim of this study is to examine biofilms formed on diverse steel samples immersed in natural ground water. The use of electron microscopy with energy dispersive X-ray analysis (EDXA) empha- sises the biofilm heterogeneity. The presence of bacterial colonies associated with con- centrations of elements like chlorine and corrosion products containing phosphorus allows MIC to be recognised.
Introduction
The damage caused by microbiologically influenced corrosion (MIC) to m.etals like cast iron, carbon steels, copper alloys, aluminium and stainless steels is evident in many aqueous environments. Many industrial areas such as the oil and gas, paper, food industries, water treatment and purification plants, nu- clear power plants, and the aeronautical industry suffer from MIC[1] which is responsible for losses of millions of dollars per year in the world.[2] MIC occurs in the presence of biofilms which are able to modify chemical con- ditions on the metal surface and to create local changes in the type and rate of electrochemical reactions involved in the corrosion process. But not all biofilms induce biocorrosion, and there is no correlation between corrosion and biomass, corrosion and bacterial type or bacterial consortia or corrosion and number of bacteria.[3-61 Biofilms present a very heterogeneous structure consisting mainly of adsorbed proteins, micro-organisms (bacteria, fungi, diatoms), extracellular polymeric substances (EPS), embedded particles of calcareous deposits, corrosion products and other dissolved substances.[7] They constitute a distinct growth phase of bacteria that is profoundly differ-

78 Aspects of Microbially Induced Corrosion
ent from the planktonic growth phase.[8] In order to diagnose and take countermeasures against MIC, a deeper knowledge of development and com- position of biofilms is necessary. The aim of this study is to examine biofilms formed on diverse steel samples immersed in natural ground water. The vari- ous elements of the biofilms were located relative to the metal surface using transmission electron microscopy (TEM) observations. The association of TEM observations with energy dispersive X-ray analysis (EDXA) confirmed the biofilm heterogeneity. The presence of bacterial colonies associated with concentrations of elements like chlorine and with corrosion products contain- ing phosphorus then indicates the occurrence of MIC.
Sulfur Phosphorus Chromium Silica Dissolved Oxygen
Temperature PH
Materials and Methods
7 PPm 0.5 ppm 0.10 ppm 10.9 ppm 1.6 pprn 7.45 10 to 18°C
Samples
Mild steel (alloy 1038) and stainless steel (304L, 316L) coupons 1 X 1 cm X 2 mm were polished with 600-grit Sic paper. A 2 mm hole was punched next to one edge for attaching the samples with plastic threads to a plastic holder. Samples were immersed at 6 m depth in a well. Table 1 gives an analysis of ground water at this depth. After 27, 50, 157 and 321 days, samples were removed and immediately fixed in a buffer before embedding in resin.
Table 1 Ground water analysis
r Cation I PPm Na K A1 Ca
Zn c u Si Fe Ti
Ma
9.6 1.2 4.4
77.2 13.4 0.02 0.11 3.2
, 2.08 0.39
36.6
226.9 <0.1
8 <0.01 21
0.14
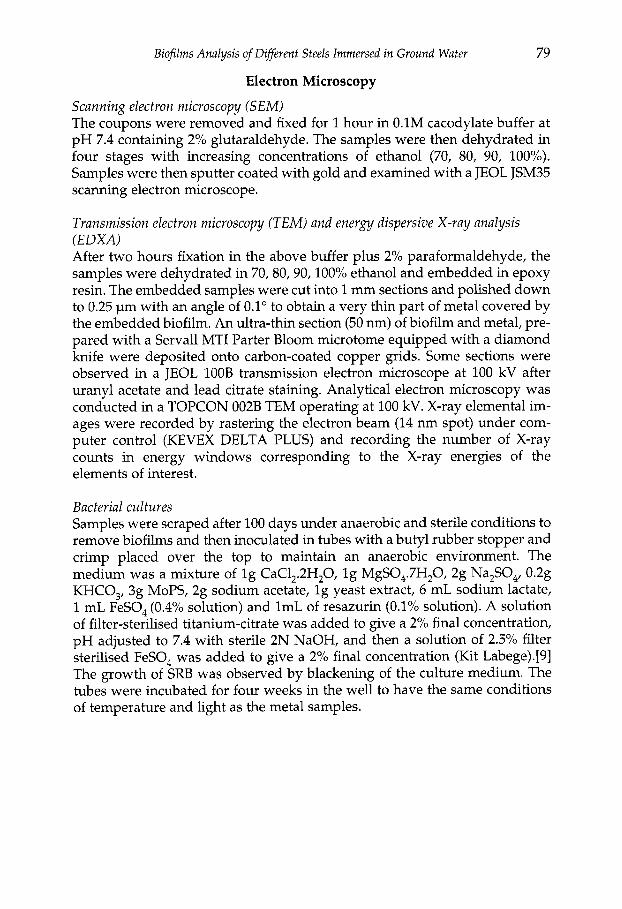
Biofilms Analysis of Different Steels Immersed in Ground Water
Electron Microscopy
79
Scanning electron microscopy (SEM) The coupons were removed and fixed for 1 hour in 0.1M cacodylate buffer at pH 7.4 containing 2% glutaraldehyde. The samples were then dehydrated in four stages with increasing concentrations of ethanol (70, 80, 90, 100%). Samples were then sputter coated with gold and examined with a JEOL JSM35 scanning electron microscope.
Transmission electron microscopy (TEM) and energy dispersive X-ray analysis fEDXA) After two hours fixation in the above buffer plus 2% paraformaldehyde, the samples were dehydrated in 70,80,90,100% ethanol and embedded in epoxy resin. The embedded samples were cut into 1 mm sections and polished down to 0.25 pm with an angle of 0.1" to obtain a very thin part of metal covered by the embedded biofilm. An ultra-thin section (50 nm) of biofilm and metal, pre- pared with a Serval1 MTI Parter Bloom microtome equipped with a diamond knife were deposited onto carbon-coated copper grids. Some sections were observed in a JEOL 100B transmission electron microscope at 100 kV after uranyl acetate and lead citrate staining. Analytical electron microscopy was conducted in a TOPCON 002B TEM operating at 100 kV. X-ray elemental im- ages were recorded by rastering the electron beam (14 nm spot) under com- puter control (KEVEX DELTA PLUS) and recording the number of X-ray counts in energy windows corresponding to the X-ray energies of the elements of interest.
Bacterial cultures Samples were scraped after 100 days under anaerobic and sterile conditions to remove biofilms and then inoculated in tubes with a butyl rubber stopper and crimp placed over the top to maintain an anaerobic environment. The medium was a mixture of lg CaC1,.2H20, l g MgS0,.7H20, 2g Na,SO,, 0.2g KHCO,, 3g MOPS, 2g sodium acetate, l g yeast extract, 6 mL sodium lactate, 1 mL FeSO, (0.4% solution) and 1mL of resazurin (0.1% solution). A solution of filter-sterilised titanium-citrate was added to give a 2% final concentration, pH adjusted to 7.4 with sterile 2N NaOH, and then a solution of 2.5% filter sterilised FeSO, was added to give a 2% final concentration (Kit Labege).[9] The growth of SRB was observed by blackening of the culture medium. The tubes were incubated for four weeks in the well to have the same conditions of temperature and light as the metal samples.

80 Aspects of Microbially Induced Corrosion
Results
SEM Observations
Colonisation on mild steel and stainless steel surfaces was observed by SEM. Figure 1 shows the biofilm formed on a mild steel surface after 27 days in natural ground water. The sample is completely covered by long rod shaped and rounded elements. Figures 2 and 3 show the colonisation on stainless steel
Fig. 1 Bioflm formed on alloy 1038 after 27 days ( S E M )
Fig. 2 Biof lm formed on alloy 304 L after 50 days (SEM) , scale bars are 1 p n

Bioflms Analysis of Different Steels Immersed in Ground Water 81
Fig, 3 Bioflm formed on alloy 316 L after 157 days (SEM)
after 50 and 157 days: only a few rod shaped bacteria can be seen after 50 days, the metal surface is not entirely covered after 157 days, but small amounts of rounded elements are present. A great difference between mild steel and stainless steel can be observed after 4 weeks: stainless steel surfaces are bare whereas mild steel surfaces are completely covered by a biofilm. Furthermore, the composition of biofilms appears to be different for mild steel and for stain- less steel immersed in the same natural water for the same period; thus, long rod shaped elements are not observed on stainless steel surfaces even after 157 days.
TEM Observations
For mild steel, the thickness of biofilm is approximately 50 pm after 321 days. Figure 4 is a parallel section from the alloy 1038 surface (5 pm) after 27 days. Three elements can be visually identified: (a) bacteria; (b) electron-dense prod- ucts with geometrical forms and (c) finely crystallised elements. Figure 5 shows a bacterium embedded in a 27 days mature biofilm.
EDXA
The EDX spectrum (Fig. 6) corresponds to the beam focused on the metallic substrate. The Fe signal has 3 peaks. The first, corresponding to La (0.704 keV) will be compared to the peaks of other elements. The two other Fe peaks, cor- responding to K a and KP (6.40 and 7.06 keV) were too intense to be compared to the other signals. The Cu signal with peaks at 8.04 keV (Ka) and 8.90 keV (KP), is from the electron microscopy grid. The EDXA of rust is shown in
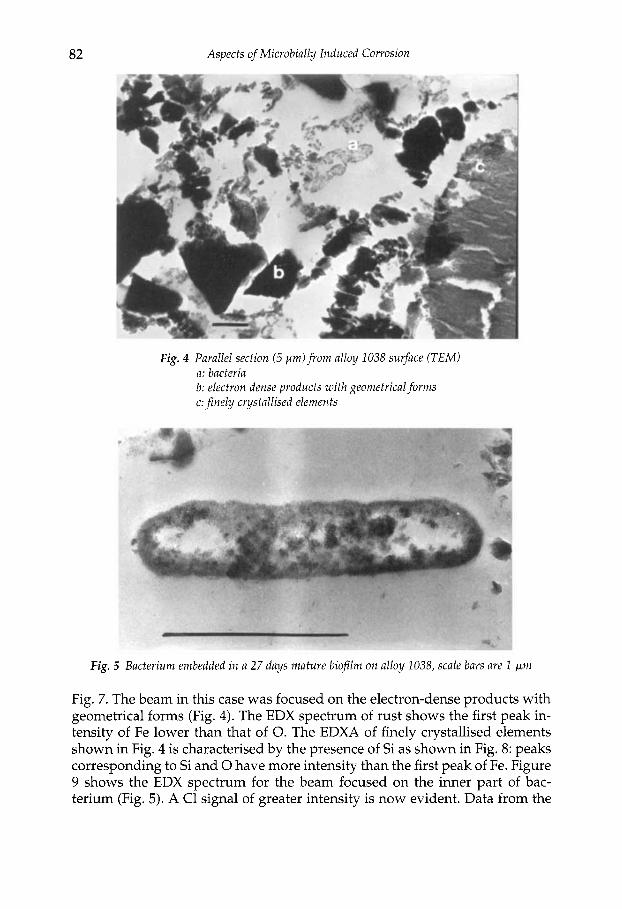
82 Aspects of Microbially Induced Corrosion
Fig. 4 Parallel section (5 pm)from alloy 1038 surface (TEM) a: bacteria b: electron dense products wi th geometrical forms c: f inely crystallised elements
Fig. 5 Bacterium embedded i n a 27 days mature biofilm on alloy 1038, scale bars are 1 Fm
Fig. 7. The beam in this case was focused on the electron-dense products with geometrical forms (Fig. 4). The EDX spectrum of rust shows the first peak in- tensity of Fe lower than that of 0. The EDXA of finely crystallised elements shown in Fig. 4 is characterised by the presence of Si as shown in Fig. 8: peaks corresponding to Si and 0 have more intensity than the first peak of Fe. Figure 9 shows the EDX spectrum for the beam focused on the inner part of bac- terium (Fig. 5 ) . A C1 signal of greater intensity is now evident. Data from the

Biofilms Analysis of Different Steels Immersed in Ground Water 83
Fig. 6 EDX spectrum corresponding to alloy 1038

84 Aspects of Microbially Induced Corrosion
Fig. 8 EDXA of fnely crystallized elements (area c of Fig. 4)
Fig. 9 EDXA of the inner part of a bacterium (Fig. 5)
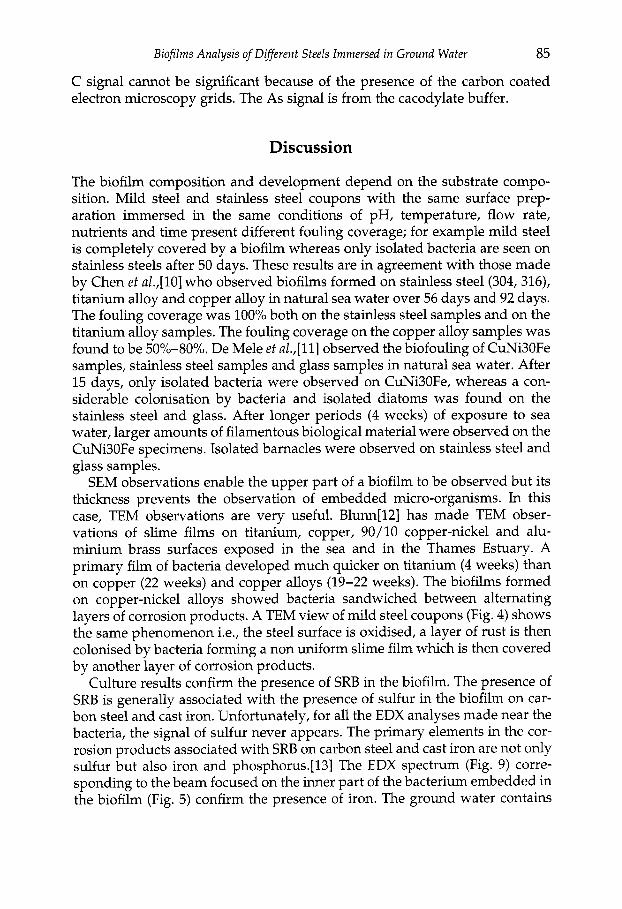
Bioflms Analysis of Different Steels Immersed in Ground Wafer 85
C signal cannot be significant because of the presence of the carbon coated electron microscopy grids. The As signal is from the cacodylate buffer.
Discussion
The biofilm composition and development depend on the substrate compo- sition. Mild steel and stainless steel coupons with the same surface prep- aration immersed in the same conditions of pH, temperature, flow rate, nutrients and time present different fouling coverage; for example mild steel is completely covered by a biofilm whereas only isolated bacteria are seen on stainless steels after 50 days. These results are in agreement with those made by Chen ef a1.,[10] who observed biofilms formed on stainless steel (304,316), titanium alloy and copper alloy in natural sea water over 56 days and 92 days. The fouling coverage was 100% both on the stainless steel samples and on the titanium alloy samples. The fouling coverage on the copper alloy samples was found to be 50%-80%. De Mele ef al.,[ll] observed the biofouling of CuNi30Fe samples, stainless steel samples and glass samples in natural sea water. After 15 days, only isolated bacteria were observed on CuNi30Fe, whereas a con- siderable colonisation by bacteria and isolated diatoms was found on the stainless steel and glass. After longer periods (4 weeks) of exposure to sea water, larger amounts of filamentous biological material were observed on the CuNi30Fe specimens. Isolated barnacles were observed on stainless steel and glass samples.
SEM observations enable the upper part of a biofilm to be observed but its thickness prevents the observation of embedded micro-organisms. In this case, TEM observations are very useful. Blunn[l2] has made TEM obser- vations of slime films on titanium, copper, 90/10 copper-nickel and alu- minium brass surfaces exposed in the sea and in the Thames Estuary. A primary film of bacteria developed much quicker on titanium (4 weeks) than on copper (22 weeks) and copper alloys (19-22 weeks). The biofilms formed on copper-nickel alloys showed bacteria sandwiched between alternating layers of corrosion products. A TEM view of mild steel coupons (Fig. 4) shows the same phenomenon i.e., the steel surface is oxidised, a layer of rust is then colonised by bacteria forming a non uniform slime film which is then covered by another layer of corrosion products.
Culture results confirm the presence of SRB in the biofilm. The presence of SRB is generally associated with the presence of sulfur in the biofilm on car- bon steel and cast iron. Unfortunately, for all the EDX analyses made near the bacteria, the signal of sulfur never appears. The primary elements in the cor- rosion products associated with SRB on carbon steel and cast iron are not only sulfur but also iron and phosphorus.[l3] The EDX spectrum (Fig. 9) corre- sponding to the beam focused on the inner part of the bacterium embedded in the biofilm (Fig. 5) confirm the presence of iron. The ground water contains

86 Aspects of Microbially lnduced Corrosion
7 mgL-l sulfur and 0.5 mgL-' phosphorus (Table 1). For all EDX analyses made near bacteria the signal of phosphorus is low compared with that of iron but is visible and so it can be considered that there is a concentration of phos- phorus near the bacteria. Tatnall et a1.,[13] cited the example of genus Desulfovibrio which is usually associated with the reduction of sulfate to sul- fide, accompanying the oxidation of organic nutrients. If deprived of sulfate, they can become fermenters and produce hydrogen and carbon dioxide in- stead. Those SRB might be active in a system showing no evidence of sulfide production. So the bacterium shown in Fig. 5 could be SRB. On the other hand, on the EDX spectrum shown in Fig. 9, a C1 signal with more intensity is seen; soluble chlorides are among the reaction products of corrosion involving iron oxidising bacteria. Even if mechanisms in which micro-organisms might con- centrate chlorides have not been put forward by microbiologists, it can be as- sumed that these highly mobile ions will diffuse into deposits and pits in which an electron deficiency exists[l3] and are therefore indicators of corro- sion. Therefore, if TEM observations coupled with EDX analysis do not per- mit actual bacterial identification, they nevertheless emphasise the corrosive action linked to bacterial presence and allow MIC to be diagnosed.
Surveying and control of industrial facilities is particularly difficult in deal- ing with MIC problems. Our SEM observations have emphasised the role of the substrate composition since mild steel and stainless steel coupons im- mersed in the same conditions present different fouling coverages. The influ- ence of parameters such as pH, temperature, flow rate and nutrients has been studied and recognised in fouling phenomena.[l4-181 These are some of the reasons why the use of coupons identical to the metal of the installation and immersed in the same environmental conditions appears to be a reliable way to obtain biofilm observations that can be correlated with the in situ behav- iour. Such coupons can be removed after different times and immediately pre- pared for further analysis. Aldrich et a1.,[19] have embedded corroded test coupons in plastics and made plastics replicas separated from corroded steel coupon. They applied several different microscopy techniques to time studies of model systems in the laboratory and observations of corrosion nodules from pipelines in the field. The technique of embedding corroded test coupons in plastics prevents any loss of information regarding the biological composition of the biofilm. After preservation, a number of laboratory studies can be made on the coupons without any time limitation.
To prevent MIC failures, many industries use biocides. [20-221 Un- fortunately, sessile bacteria embedded in biofilms are fundamentally different from their planktonic counterparts and are hard to kill. A direct examination of biofilms using our method after biocide treatments appears very useful in evaluating the efficiency of killing planktonic bacteria. Finally, after a failure, removal and preservation of corroded elements is possible.

Bioflms Analysis of Diferent Steels Immersed in Ground Water
Conclusion
87
EDX analysis coupled with TEM observations emphasise the biofilm hetero- geneity. The different elements observed by TEM have specific compositions as determined by EDX analysis and it appears that bacterial colonies are sand- wiched between non uniform layers of corrosion products combined with other elements like Si. The presence of bacterial colonies in the biofilm associ- ated with concentrations of elements like chlorine and corrosion products containing phosphorus makes a strong case for MIC. This technique appears to be a useful tool for diagnosis, control and survey of MIC risks of industrial facilities. It permits laboratory studies of biofilms formed in situ without any loss of information regarding the biological composition of the biofilm.
References
1.
2.
3.
4.
5.
6.
7.
8.
9.
F. Feugeas, G. Ehret and A. Cornet: Journal de Physique 111, 1997, 7,
H.C. Flemming: Economical and Technical Overview, in Microbially Influenced Corrosion of Materials, Heitz et al. eds, Springer-Verlag Berlin Heidelberg, Germany, 1996,5-14. R.J. Soracco, D.H. Pope, J.M. Eggers and T.N. Effinger: Corrosion '88, paper 83, NACE, Houston Tx, 1988. A. Moosavi, R. Pirrie and W. Hamilton: 'Effect of Sulfate Reducing Bacteria activity on Performance of Sacrificial Anodes', chapter 5, Microbially Influenced Corrosion and Biodeterioration, N.J. Dowling, M.W. Mittleman and J.C. Danko eds, Duke Power Inco Alloys International, Knoxville Te, USA, 1990. D. White, R. Jack and N. Dowling: 'The Microbiology of MIC', Microbially Influenced Corrosion and Biodeterioration, chapter 1, N.J. Dowling, M.W. Mittleman and J.C. Danko eds, Duke Power Inco Alloys International, Knoxville Te, USA, 1990. H.A. Videla, M.F.L. de Mele, R.A. Silva, F Bianchi and C. Gonzales Cananles: Corrosiovl '90, paper 124, NACE, Houston Tx, 1990. H.C. Flemming: 'Biofouling and Biocorrosion', Biofouling and Biocorrosion iM Industrial Water Systems, H.C. Flemming and G.G. Geesey eds, Springer-Verlag Berlin Heidelberg, Germany, 1991, 1-6. J.W. Costerton, Z . Lewandowski, D.E. Caldwell, D.R. Korber and H.M. Lappin-Scott: Annu. Rev. Microbiol., 1995, 49, 711-745. M. Magot, L. Mondeil, J. Ausseur and J. Seureau: 'Detection of Sulfate Reducing Bacteria', Biocorrosion, Proc. of a joint meeting between the Biodeterioration Society and the French Microbial Corrosion Group, C.C. Gaylarde and L.H.D. Morton eds, Biodeterioration Society, 1988, 37.
631 -663.

88
10.
11.
12.
13.
14. 15. 16. 17.
18.
19.
20.
21.
22.
Aspects of Microbially Induced Corrosion
J.R. Chen, S.D. Chyou, S.I. Lew, C.J. Huang, C.S. Fang and W.S. Tse: Appl. Surf. Sci., 1988,33134,219. M.F.L. de Mele, D.A. Moreno, J.R. Ibars and H.A. Videla: BY. Corros. I., 1989,24, 211. J.G. Blunn: 'Biological Fouling of Copper and Copper Alloys', Biodeterioration, Proc. 6th Int. Biodeterioration Symp., CAB Int., Slough,
R.E. Tatnall and D.H. Pope: 'Identification of MIC', A Practical Manual on Microbiologically Influenced Corrosion, G. Kobrin ed., NACE, Houston Tx,
S.C. Dexter and G.Y. Gao: Corrosion, 1988,44, 717-723. J.G. Stoecker and D.H. Pope: Mater. Perfor., 1986,25,51. B. Little and J. De Palma: Treatise Mater. Sci. Tecknol., 1988,28,89. W.A. Hamilton: 'Biofilms: Microbial Interactions and Metabolic Activities', Ecology ofMicrobial Communities, Cambridge University Press, UK, 1987,361. R.A. Agostini and R.D. Young: Corrosion '90, paper 119, NACE, Houston Tx, 1990. H.C. Aldrich, A. Choate, L. McDowell, P. Bono, D. Chynoweth et al.: 'Microscopy of Microbial Corrosion of Pipeline Steel in a Model System', Microbially Influenced Corrosion and Biodeterioration, N.J. Dowling, M.W. Mittleman and J.C. Danko eds, Duke Power Inco Alloys International, Knoxville Te, USA, 1990,5-57. G.L. Horacek, E.S. Littmann and R.E. Tatnall: 'MIC in the Oil Field', A Practical Manual on Microbiologically Influenced Corrosion, G. Kobrin ed., NACE, Houston Tx, USA, 1993,41-45. R.W. Lutey: 'MIC in the Pulp and Paper Industry', A Practical Manual on Microbiologically Influenced Corrosion, G. Kobrin ed., NACE, Houston Tx,
H.W. Rossmoore and L.A. Rossmoore: 'MIC in Metalworking Processes and Hydraulic Systems', A Practical Manual on Microbiologically Influenced Corrosion, G. Kobrin ed., NACE, Houston Tx, USA, 1993,31-40.
UK, 1986,567-575.
USA, 1993,65-77.
USA, 1993,25-30.
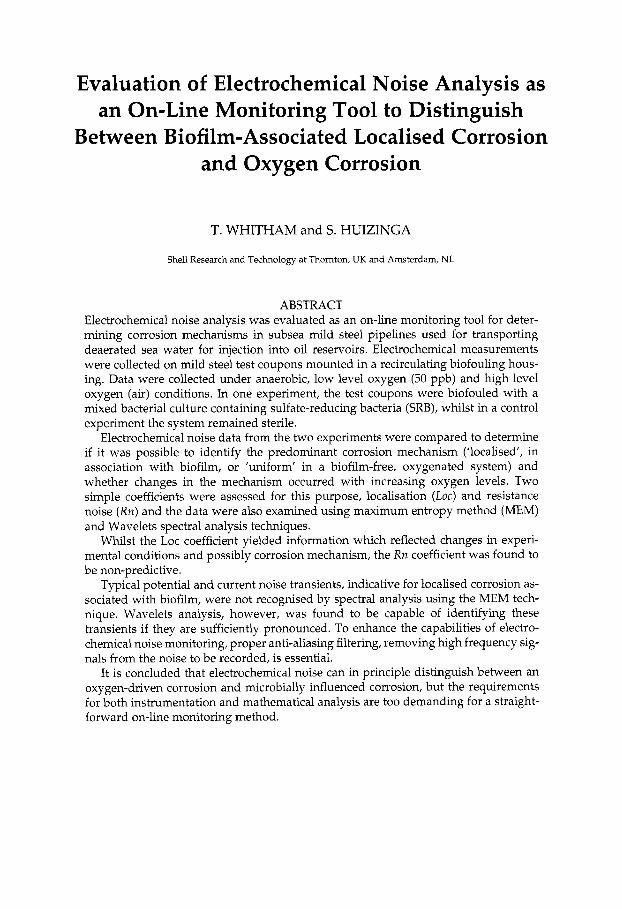
Evaluation of Electrochemical Noise Analysis as an On-Line Monitoring Tool to Distinguish
Between Biofilm-Associated Localised Corrosion and Oxygen Corrosion
T. WHITHAM and S. HUIZINGA
Shell Research and Technology at Thomton, UK and Amsterdam, NL
ABSTRACT Electrochemical noise analysis was evaluated as an on-line monitoring tool for deter- mining corrosion mechanisms in subsea mild steel pipelines used for transporting deaerated sea water for injection into oil reservoirs. Electrochemical measurements were collected on mild steel test coupons mounted in a recirculating biofouling hous- ing. Data were collected under anaerobic, low level oxygen (50 ppb) and high level oxygen (air) conditions. In one experiment, the test coupons were biofouled with a mixed bacterial culture containing sulfate-reducing bacteria (SRB), whilst in a control experiment the system remained sterile.
Electrochemical noise data from the two experiments were compared to determine if it was possible to identify the predominant corrosion mechanism (’localised’, in association with biofilm, or ‘uniform’ in a biofilm-free, oxygenated system) and whether changes in the mechanism occurred with increasing oxygen levels. Two simple coefficients were assessed for this purpose, localisation (Loc) and resistance noise (Xn) and the data were also examined using maximum entropy method (MEM) and Wavelets spectral analysis techniques.
Whilst the LOC coefficient yielded information which reflected changes in experi- mental conditions and possibly corrosion mechanism, the Xn coefficient was found to be non-predictive.
Typical potential and current noise transients, indicative for localised corrosion as- sociated with biofilm, were not recognised by spectral analysis using the MEM tech- nique. Wavelets analysis, however, was found to be capable of identifying these transients if they are sufficiently pronounced. To enhance the capabilities of electro- chemical noise monitoring, proper anti-aliasing filtering, removing high frequency sig- nals from the noise to be recorded, is essential.
It is concluded that electrochemical noise can in principle distinguish between an oxygen-driven corrosion and microbially influenced corrosion, but the requirements for both instrumentation and mathematical analysis are too demanding for a straight- forward on-line monitoring method.

90 Aspects of Microbially Induced Corrosion
Introduction
Sea water injection into oil reservoirs in the North Sea is used as a means of maintaining reservoir pressure to ensure continued production of oil. In order to prevent oxygen-driven corrosion of mild steel downhole tubulars, the sea water to be injected is coarse-filtered and then deaerated to remove oxygen from the water. Not all production platforms have their own injection water treatment facilities in which case pre-treated water is transported to them along mild steel subsea pipelines from the platform where treatment took place. The prevention of oxygen-driven corrosion of the subsea transport lines should also be assured by efficient deaeration of the water.
Unfortunately, water injection facilities may suffer poor oxygen control from time to time, with oxygen excursions of up to 50 ppb, and more in some cases. When oxygen is present in the water, the mechanism of corrosion is considered to be uniform (at least at ambient temperature and in the absence of oxide scale formation) since metal is lost at a similar rate over a large exposed surface.
Water injection systems may also suffer from the development of microbial biofilms on their internal surfaces. Enhanced corrosion of mild steel in associ- ation with biofilm is a well documented phenomenon.[l-41 In such cases, the corrosion is considered to be localised since certain sites on the steel surface are attacked in preference to others. Localised corrosion begins with the for- mation of pits in the steel surface. It has been shown [5] that if oxygen enters the biofouled system it may enhance the rate of localised corrosion associated with biofilm since oxygen concentration cells become established across the heterogeneously-distributed biofilm. Oxidation of sulfides may also occur, leading to the formation of a certain amount of elemental sulfur.
It is possible that both biofilm development and periodic oxygen excur- sions could occur in water injection systems and transport pipelines. In estab- lishing appropriate corrosion control strategies (either better oxygen control or treatment - probably chemical - of biofilm) an on-line monitoring tech- nique which would permit the timely detection of the onset and type of cor- rosion (uniform or localised) would greatly improve the chances of limiting internal pipeline damage. Electrochemical monitoring techniques such as lin- ear polarisation resistance (LPR) (or sometimes a.c.-impedance) are routinely used to follow corrosion processes in pipelines and other facilities. However, these techniques are only capable of estimating surface-integrated corrosion rates. If corrosion is uniform, over the whole surface, then a good assessment of corrosion rate can be obtained. If corrosion is confined to localised sites however, the corrosion rate obtained could severely underestimate the lo- calised wall penetration rates.
Electrochemical noise (EN) is a generic term used to describe the low am- plitude, low frequency random fluctuations of current and potential observed between nominally identical electrodes when coupled together in the same

Evaluation of Electrochemical Noise Analysis as an On-Line Monitoring Tool 91
electrolyte. Analysis of potential and/or current noise data has been shown to be suitable for the detection of localised corrosion.[b] Data collection is passive, measurements being taken from freely corroding electrodes, with no applied current or potential required.
Electrochemical noise appears to be the most likely measuring technique capable of distinguishing corrosion due to oxygen excursions and that due to microbial biofilm. A series of controlled laboratory experiments was under- taken to assess the feasibility of using this technique for on-line corrosion monitoring.
Methods
Source and Maintenance of the Test Culture
A mixed culture containing predominantly sulfate-reducing bacteria (SRB) was isolated from the North Sea and designated T670. It was maintained in the laboratory as a stock culture in marine Postgate’s growth medium G [7] at 30°C. Larger volumes of culture (100 mL) were prepared as inoculum for the experimental apparatus.
Preparation of Test Coupons
Mild steel (EN3b) stud-coupons (exposed surface area of 0.5 cm2) were ground (by machine) to a uniformly smooth finish, which was not highly pol- ished. The coupon surfaces were degreased by wiping with acetone and the coupons were then weighed to four decimal places. Coupons were mounted in Nylon holders for insertion into the biofouling housing.
Biofouling Housing Experiments
Test coupons were inserted into a Perspex bench-top biofouling housing so that the surfaces of the coupons were flush-mounted with the internal surface of the housing. The housing also contained an agar-bridge linked to a stan- dard calomel reference electrode (SCE) and two platinum secondary elec- trodes. The apparatus is shown in Fig. 1. The chemostat and reservoir vessels were filled with the bacterial growth medium which was then deaerated by sparging with oxygen-free nitrogen for 2 hours. The medium was recircul.ated via a pump through the housing and the nitrogen-sparging continued for a further 2 hours. The chemostat vessel was then inoculated with 2 X 100 mL of 3 day old bacterial culture (in Postgate’s medium G) and the gas sparging stopped. Subsequently, the growth medium was batch-replaced once each week by removing 100 mL of spent medium from the chemostat and replac- ing with the same volume of deaerated fresh medium.

92 Aspects of Microbially Induced Corrosion
n n rn I U
Chemostat
Computer Pump Reservoir Zero Resistance I I I Ammeter -1
Fig. 1 Apparatus for the Collection of Electrochemical Noise Data
Initially, biofilm was allowed to develop on the surfaces of the test coupons in the biofouling housing over a period of 111 days. Sulfide generated by SRB in the system precipitated as iron sulfide in the medium, turning it black. Monitoring of the redox potential of the medium confirmed that the system was anaerobic. Subsequently, the contents of the chemostat vessel were purged with a mixture of 0.1% oxygen in argon, which when dissolved in the growth medium gave a dissolved oxygen concentration of 50 ppb, as con- firmed by CHEMets dissolved oxygen ampoules (CHEMetrics; Galco UK Ltd., St. Albans, UK) with uninoculated medium. This level of oxygen was main- tained for a period of 11 days. Finally, the chemostat was purged with air for 5 days in order to achieve a high level of dissolved oxygen, which also resulted in the loss of blackness of the medium.
In a control experiment, the housings were operated without inoculation with the microbial culture. The system was rendered anaerobic by continuous sparging of the chemostat vessel with oxygen-free nitrogen for 5 days. Subsequently, 50 ppb of oxygen were introduced for a further 5 days and finally, air introduced for another 4 days.
Electrochemical Measurements
Electrochemical noise data were collected at regular intervals throughout the exposure period of the coupons in each experiment. Three pairs of mild steel coupons (designated A-B, C-D and X-Y) were electrically coupled from the beginning of the exposure period so that they held the same potential relative to the recirculating medium. The potential noise, i.e. the fluctuation of the potential of each couple relative to a SCE reference, and the current noise, i.e. the fluctuation of the current between individual coupons of each couple, were measured using an ACM Auto Zero Resistance Ammeter (ZRA; ACM
Evaluation of Electrochemical Noise Analysis as a n On-Line Monitoring Tool 93
Instruments, Faraday House, Cark, Grange-over-Sands, Cumbria, UK), con- trolled by a Windows-based software package (from ACM) running on a NEC 386/25S personal computer. When measurements were taken (at intervals of a few days) data were collected every second for six successive periods of 256 seconds. The raw data constituted time (s), current (mA) and potential (mV) information. From each group of six 256-point data sets, a single representa- tive set was selected for further analysis.
In addition, some linear polarisation resistance (LPR) measurements were taken on separate coupons. The purpose of this was to determine a surface- integrated charge transfer resistance (or polarisation resistance; Rpo$ for the exposed coupons. Using a Stern-Geary B-factor of 30 mV, corrosion rates (V,,,J were calculated according to:
V,,,, = B/R,,, . MkdnF), with M = atomic mass of iron, d = density of iron, n = number of electrons transferred in the dissolution of one metal atom and F = Faraday’s number. In the case of general corrosion, the corrosion rate calculated from the surface- integrated Rpol values could be compared with weight loss measurements to derive an accurate value for the B-factor. However, since the present investi- gation aimed at distinguishing types of corrosion, no efforts were made to make such a comparison and the corrosion rates quoted in this work should not be viewed as accurate in an absolute sense.
Analysis of Electrochemical Noise Data
The raw current and potential data were median-corrected (every 28 points) to reduce the effects of non-corrosion related trends in the noise signals. The data collected for each exposure condition (Le., deaerated, 50 ppb oxygen, high level oxygen, clean surface, biofouled surface) were compared to deter- mine if they could be clearly distinguished. A number of coefficients were used in this comparison, namely, the standard deviations of current and potential signals and of the median-corrected values, the resistance noise (Rn) and localisation (LOC). The latter are defined as follows:
sd6V Rn = sdsI
sd: standard deviation; 6 V median-corrected potential; 61: median-corrected current.
Rn is used to estimate charge transfer resistance and when corrosion is rela- tively uniform Rn values should compare favourably with Rpol values (surface integrated) determined by LPR. When corrosion is localised, Rn values should become lower than Rpol values since sd 61 increases due to the stochastic nature of the corrosion process.

94 Aspects of Microbially Induced Corrosion
where R M S ( I ) : root mean square of current. Values of localisation range from 1.0 for localised corrosion to < 0.01 for
uniform corrosion. This is because the magnitude of the current ( R M S ) in uni- form corrosion is high compared to the variation in the current signal (sd SI), so the value for LOC is low. In localised corrosion, the mean current is much lower in comparison to the magnitude of current noise and so values of LOC approach unity.
If current and potential fluctuations would follow Gaussian distributions, a description in terms of standard deviation and RMS values would provide a complete picture of the signals. This, however, is rarely the case, and a spec- tral analysis of the signals could provide useful additional information. To this end both the standard Fast Fourier Transform (FFT) and the more in- volved Maximum Entropy Method (MEM) were applied. The latter is par- ticularly useful in those cases where a ’model’ spectral density is to be obtained from noisy data.
Since attack of a localised nature could induce characteristic transients in potential and current noise, the Wavelet analysis technique, capable of ident- ifying these signals, was also applied to the data. The method consists of defining a ‘model’ transient and subsequently scanning the data for the occurrence of such signals. Software routines were written to produce a graphical representation of the fit of the model transient with the actual recorded signal.
Surface Examination of Test Coupons
In the biofouling experiment, a pair of coupons (XY) which until then had been used for electrochemical measurements were removed from the housing after 94 days of exposure. The surface film/deposits were gently removed as much as possible with a tissue and then the coupons were immersed into Clarke’s solution for 25 minutes.[B] The coupons were then rinsed and soni- cated in distilled water for 5 minutes, and dried overnight in an oven. The sur- faces of cleaned coupons were examined using an optical microscope to observe the morphology of attack. The same procedure was followed for the remainder of the coupons at the end of the biofouling and sterile experiments.
Results and Discussion
Visual Examination of Coupons
Following the removal and cleaning of biofouled coupons X and Y from the housing after a period of 94 days, it was observed that the surfaces of these

Evaluation of Electrochemical Noise Analysis as an On-Line Monitoring Tool 95
coupons were covered with small pits, increasing in number and diameter to- wards the edges of the coupons. This proved that conditions leading to biofilm-associated pitting had been prevalent during the anaerobic period of operation of the housing. Electrochemical noise data were therefore available for pitted coupons and for the period over which the pitting took place. This gave confidence that the noise data collected during this period were repre- sentative of a pitting corrosion mechanism and may, therefore, be distin- guishable from data collected when no pitting was occurring.
At the end of the experiment, it was observed that the remaining coupons on which electrochemical noise data had been collected were also pitted, but more extensively so than on coupons X and Y, reflecting the longer exposure period and an exposure to oxygen (both 50 ppb and aerated) not seen by coupons X and Y. It is known that oxygen may enhance biofilm-associated localised corrosion when the latter is already established.[9]
Coupons examined from the uninoculated control experiment showed that there was no surface pitting of the coupons on which electrochemical noise data had been collected. In fact, there was no visible surface damage at all, which may reflect the relatively short total exposure period (14 days).
Statistical Analysis of Noise Data
To obtain an indication of the utility of the Xn and Loc coefficients in distin- guishing between the different phases of the experiments, the mean values of these and related coefficients were determined for data collected during each of these phases. This is a crude approach to data analysis since it is possible that during each phase the corrosion process may be changing and so mean values cannot truly represent all the diagnostic information in the data. The mean values are summarised in Table 1.
When biofilm was present on the coupon surfaces the addition of 50 ppb of oxygen led to a slight increase in the mean potential of coupled coupons but a much larger increase occurred when the medium was purged with air, con- sistent with the increased cathodic activity due to the additional oxygen. The corrosion current was not seen to change significantly with the introduction of a low level of oxygen, but at high level oxygen (air) a large increase in current was recorded.
In the absence of biofilm, the potential also changed with the introduction of 50 ppb of oxygen, becoming slightly more negative. At high oxygen levels, the potential change reversed to become more positive relative to the de- aerated condition. Overall, the potentials were more negative than when biofilm was present, a phenomenon of biofouling that is well known. Corrosion currents were generally smaller in the absence of biofilm and al- though increases occurred when oxygen was added to the system, these were significantly less than those observed when biofilm was present.
These differences in the two experiments, highlighted by the electrochemi-
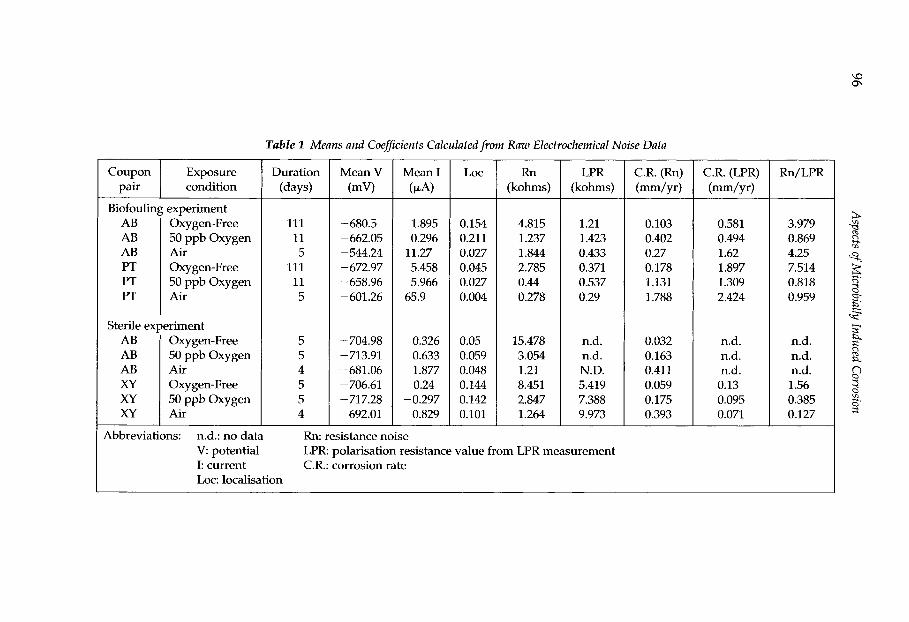
Table 1 Means and Coefficients Calculatedfrom Raw Electrochemical Noise Data
AB AB AB PT PT PT
I I
Oxygen-Free 50 ppb Oxygen Air Oxygen-Free 50 ppb Oxygen Air
Coupon Exposure pair condition
111 11 5
111 11 5
5 5 4 5 5 4
Mean V (mV)
Sterile experiment
Oxygen-Free 50 ppb Oxygen Air
Abbreviations: n.d.: no data Rn: resistance noise
-680.5 -662.05 -544.24 -672.97 -658.96 -601.26
-704.98 -713.91 -681.06 -706.61 -717.28 -692.01
Mean I (PA)
1.895 0.296
5.458 5.966
11.27
65.9
0.326 0.633 1.877 0.24
0.829 -0.297
LOC
0.154 0.211 0.027 0.045 0.027 0.004
0.05 0.059 0.048 0.144 0.142 0.101
Rn
4.815 1.237 1.844 2.785 0.44 0.278
15.478 3.054 1.21 8.451 2.847 1.264
LPR (kohms)
1.21 1.423 0.433 0.371 0.537 0.29
n.d. n.d. N.D. 5.419 7.388 9.973
0.103 0.402 0.27 0.178 1.131 1.788
0.032 0.163 0.411 0.059 0.175 0.393
0.581 0.494 1.62 1.897 1.309 2.424
n.d. n.d. n.d. 0.13 0.095 0.071
Rn/LPR
3.979 0.869 4.25 7.514 0.818 0.959
n.d. n.d. n.d. 1.56 0.385 0.127
V: potential I current C.R.: corrosion rate LOC: localisation
LPR polarisation resistance value from LPR measurement
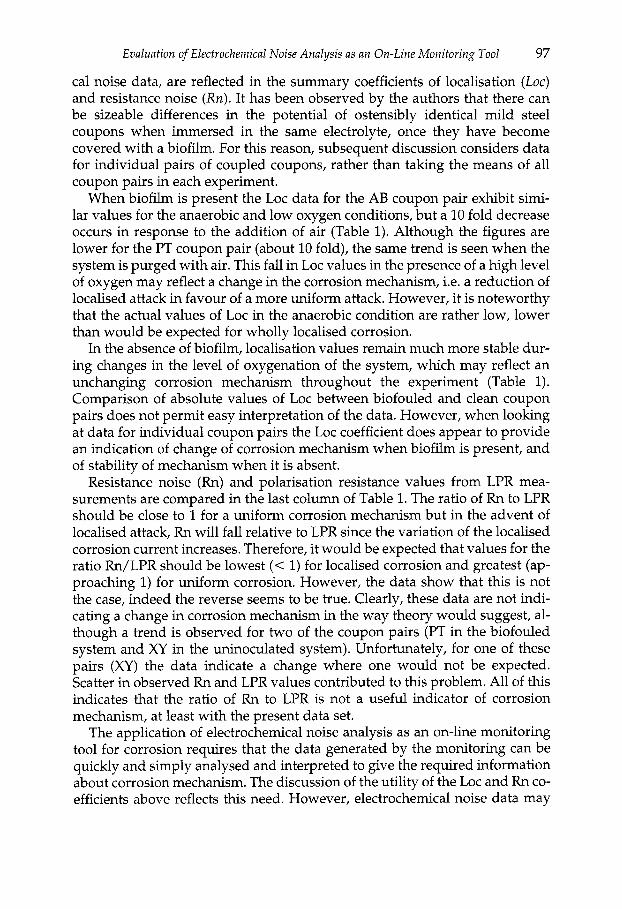
Evaluation of Electrochemical Noise Analysis as an On-Line Monitoring Tool 97
cal noise data, are reflected in the summary coefficients of localisation (Loc) and resistance noise (Rn). It has been observed by the authors that there can be sizeable differences in the potential of ostensibly identical mild steel coupons when immersed in the same electrolyte, once they have become covered with a biofilm. For this reason, subsequent discussion considers data for individual pairs of coupled coupons, rather than taking the means of all coupon pairs in each experiment.
When biofilm is present the LOC data for the AB coupon pair exhibit simi- lar values for the anaerobic and low oxygen conditions, but a 10 fold decrease occurs in response to the addition of air (Table 1). Although the figures are lower for the PT coupon pair (about 10 fold), the same trend is seen when the system is purged with air. This fall in LOC values in the presence of a high level of oxygen may reflect a change in the corrosion mechanism, i.e. a reduction of localised attack in favour of a more uniform attack. However, it is noteworthy that the actual values of LOC in the anaerobic condition are rather low, lower than would be expected for wholly localised corrosion.
In the absence of biofilm, localisation values remain much more stable dur- ing changes in the level of oxygenation of the system, which may reflect an unchanging corrosion mechanism throughout the experiment (Table 1). Comparison of absolute values of LOC between biofouled and clean coupon pairs does not permit easy interpretation of the data. However, when looking at data for individual coupon pairs the LOC coefficient does appear to provide an indication of change of corrosion mechanism when biofilm is present, and of stability of mechanism when it is absent.
Resistance noise (Rn) and polarisation resistance values from LPR mea- surements are compared in the last column of Table l. The ratio of Rn to LPR should be close to 1 for a uniform corrosion mechanism but in the advent of localised attack, Rn will fall relative to LPR since the variation of the localised corrosion current increases. Therefore, it would be expected that values for the ratio Rn/LPR should be lowest (< 1) for localised corrosion and greatest (ap- proaching 1) for uniform corrosion. However, the data show that this is not the case, indeed the reverse seems to be true. Clearly, these data are not indi- cating a change in corrosion mechanism in the way theory would suggest, al- though a trend is observed for two of the coupon pairs (PT in the biofouled system and XY in the uninoculated system). Unfortunately, for one of these pairs (XY) the data indicate a change where one would not be expected. Scatter in observed Rn and LPR values contributed to this problem. All of this indicates that the ratio of Rn to LPR is not a useful indicator of corrosion mechanism, at least with the present data set.
The application of electrochemical noise analysis as an on-line monitoring tool for corrosion requires that the data generated by the monitoring can be quickly and simply analysed and interpreted to give the required information about corrosion mechanism. The discussion of the utility of the LOC and Iin co- efficients above reflects this need. However, electrochemical noise data may

98 Aspec t s of Microbially Induced Corrosion
be more fully analysed using spectral analysis methods, and whilst the analy- sis is not simple, the application of appropriate software makes it very rapid.
Spectral Analysis of Noise Data
The standard Fast Fourier Transform (FFT) method is normally not applicable to noisy signals because the resulting spectral density also turns out to be very noisy. Indeed, applying FFT to several sets of noise data, both from the bio- fouled and the sterile experiment, did not provide an interpretable spectral density. To circumvent this problem, the noise data may be analysed as if aris- ing from ‘white noise’ which is filtered through an electronic circuit. When a suitable filter is defined, the parameters describing it can be found by fitting the filter to the noise data with the Maximum Entropy Method (MEM). A clear advantage of the technique is that when a limited number of coefficients is used to describe the filter, the resulting spectral densities for potential and current noise traces are smooth curves. A disadvantage, however, is that the type of filter chosen more or less dictates the shape of the resulting curve and care should be taken that the filter suitably represents the actual noise data. For analysis of both the potential and current noise data a software package, purchased from CML (Corrosion Management Ltd, Manchester) was used, which is based on the technique as described by Burg.[lO] Before applying the routine, a linear background was removed from the signals. Fifteen coeffi- cients were used to describe the filter. Representative sets of potential and cur- rent traces from the biofouled experiment and from the sterile experiment (each without 0,, with 50 ppb 0,, and aerated) were analysed in detail. No significant differences were detected. The roll off slope of the power spectral density of the potential signal in all cases amounted to 20 dB per decade, which would be consistent with general corrosion but cannot be taken as proof (Fig. 2). The densities calculated for the current showed inconsistent curves, due to the fact that when no clear spectral distribution is present in the signal, the MEM approach may fail to yield an appropriate fit. It was thus found that the MEM approach was not an appropriate tool to distinguish the different phases of corrosion in the experiments.
Wavelet Analysis of Noise Transients
Whereas MEM analyses the spectral density in the frequency domain, another approach would be to directly examine the data in the time domain. The trivial example of this is a visual inspection of the recorded time series of potential and current. In most traces of potential and current as recorded in the two experiments, no typical transients can be discerned. However, in the biofouled experiment (in the absence of oxygen) occasionally negative peaks in the potential trace show up, which are sometimes correlated with an ob- served peak in the current. In the study of stainless steels it is known that

Evaluation of Electrochemical Noise Analysis as an On-Line Monitoring Tool 99
potentla1 Id81 Potential Mise Spectrum MM
Fig. 2 Power Density Spectrum from a M E M analysis for a Typical Potential Noise Data Set Collected under Anaerobic Conditions on Biofouled Mild Steel Coupons
metastable pitting leads to a rapid decrease in potential when the pit becomes active, with a more or less exponential recovery when the pit repassivates. When current is also monitored, a short transient may be observed at the peak position of the potential transient.
It appears that a similar phenomenon is observed in the present biofouled experiment, which would indicate that bursts of corrosion may occur associ- ated with the presence of a biofilm. An example of a potential trace showing some transients is shown in Fig. 3. The typical duration of the events appears to be some 20 to 30 s. Because inspection by eye is rather time consuming and, in particular in the presence of a noisy background, only qualitative, a math- ematical technique, called Wavelet analysis, was applied to the signals. The method consists of defining a ‘model’ transient and subsequently scanning the data for the occurrence of such signals. The result is shown in Fig. 4, where the trace of Fig. 3 has been subjected to the analysis.
The bottom set of traces of Fig. 4 shows the fit of the actual recorded noise signal with an exponential model transient with recovery times from 8 to 1 second (top to bottom). The trace with the most symmetrical peaks represents the best fit. Clearly the ill defined shape of the transients prohibits the deriva- tion of a single value for the recovery time of a localised corrosion event. Distinct features within an overall event can be assigned recovery times from 2 to more than 8 seconds. Unfortunately, the occurrence of transients of the size seen in Fig. 3 was rare and Wavelet analysis revealed only a few more similar potential transients. Since they only occurred in the biofouled system in the absence of oxygen, they may be taken as typical for biofilm-associated localised corrosion.
On this basis the transients might be expected to be discernible more often than revealed in the current measurements. The fact that they do not is maybe
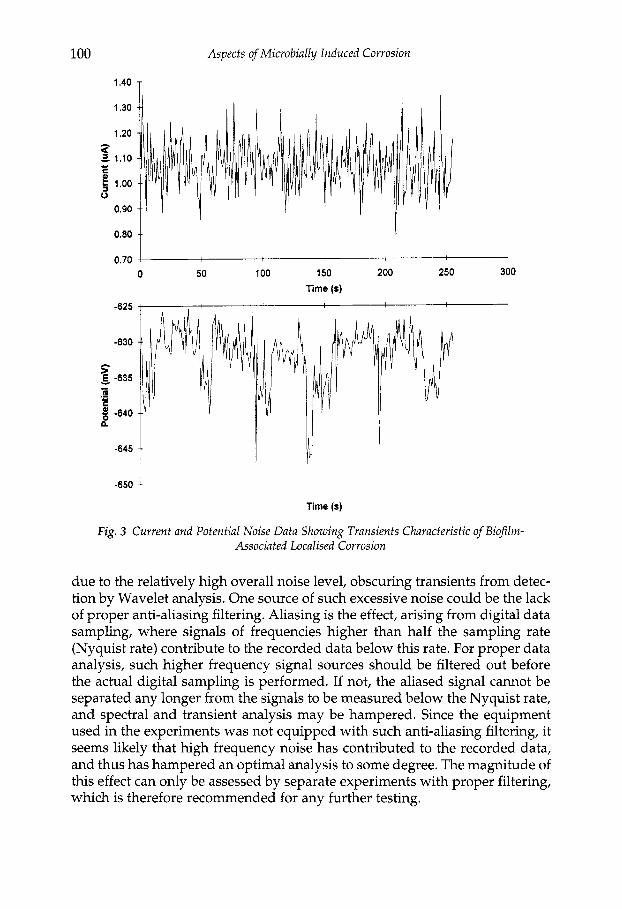
100
1.40 T
Aspects of Microbially Induced Corrosion
I o.80 t 0.70 4 I
0 50 100 150 200 250 300
Time (s) -625
-630
s E -635 c - (0 ,- -
-640 n
-645
-650
Time (s)
Fig. 3 Current and Potential Noise Data Showing Transients Characteristic of Biofilm- Associated Localised Corrosion
due to the relatively high overall noise level, obscuring transients from detec- tion by Wavelet analysis. One source of such excessive noise could be the lack of proper anti-aliasing filtering. Aliasing is the effect, arising from digital data sampling, where signals of frequencies higher than half the sampling rate (Nyquist rate) contribute to the recorded data below this rate. For proper data analysis, such higher frequency signal sources should be filtered out before the actual digital sampling is performed. If not, the aliased signal cannot be separated any longer from the signals to be measured below the Nyquist rate, and spectral and transient analysis may be hampered. Since the equipment used in the experiments was not equipped with such anti-aliasing filtering, it seems likely that high frequency noise has contributed to the recorded data, and thus has hampered an optimal analysis to some degree. The magnitude of this effect can only be assessed by separate experiments with proper filtering, which is therefore recommended for any further testing.
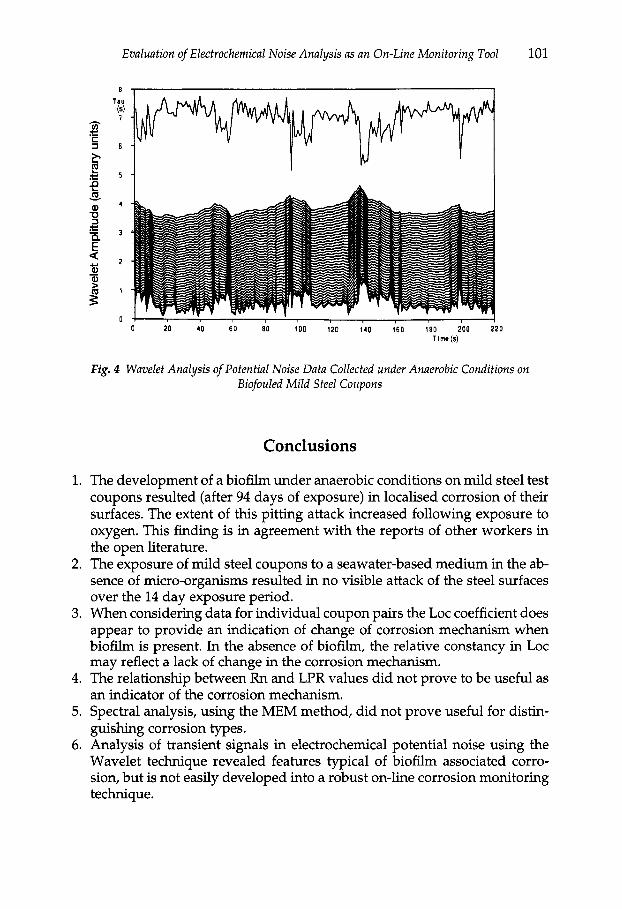
Evaluation of Electrochemical Noise Analysis as an On-Line Monitoring Tool 101
I -- I
0 20 4 0 60 80 100 120 140 160 180 200 2 2 0 Tlme(s)
Fig. 4 Wavelet Analysis of Potential Noise Data Collected under Anaerobic Conditions on Biofouled Mild Steel Coupons
Conclusions
1. The development of a biofilm under anaerobic conditions on mild steel test coupons resulted (after 94 days of exposure) in localised corrosion of their surfaces. The extent of this pitting attack increased following exposure to oxygen. This finding is in agreement with the reports of other workers in the open literature.
2. The exposure of mild steel coupons to a seawater-based medium in the ab- sence of micro-organisms resulted in no visible attack of the steel surfaces over the 14 day exposure period.
3. When considering data for individual coupon pairs the LOC coefficient does appear to provide an indication of change of corrosion mechanism when biofilm is present. In the absence of biofilm, the relative constancy in LOC may reflect a lack of change in the corrosion mechanism.
4. The relationship between Rn and LPR values did not prove to be useful as an indicator of the corrosion mechanism.
5. Spectral analysis, using the MEM method, did not prove useful for distin- guishing corrosion types.
6. Analysis of transient signals in electrochemical potential noise using the Wavelet technique revealed features typical of biofilm associated corro- sion, but is not easily developed into a robust on-line corrosion monitoring technique.

102 Aspects of Microbially Induced Corrosion
7. For optimal noise analysis, due attention should be paid to anti-aliasing fil- tration during data collection.
References
1. 2. 3.
4. 5. 6.
7.
8.
9.
10.
W.A. Hamilton: Ann. Rev. Microbiol. 1985, 39, 195-217. J.L.Lynch, and R.G.J. Edyvean: Biofouling, 1988,1,147-162. J.W. Costerton and J. Boivin: Biofouling and Biocorrosion in Industrial Water Systems, H.C. Flemming and G.G. Geesey eds, Springer-Verlag, Berlin,
W. Lee and W.G. Characklis: Mater. Perform., 1993,49 (3), 186-199. J.A. Hardy and J.L. Bown: Corrosion (NACE), 1984,40 (12), 650-654. J.L. Dawson, K. Hladky and D.A. Eden: Proceedings LSK COYYOS~OM, Inst. Corrosion, Leighton Buzzard, 1983,99-108. J.R. Postgate: The Sulphate-Reducing Bacteria, Second Edition, Cambridge University Press, Cambridge, 1984,32-33. Standard Practice G1-81 - for preparing, cleaning and evaluating corro- sion test specimens. Annual Book of ASTM Standard Methods (1986), Section 3: Metals test methods and analytical procedures, Vol. 3.02 - Wear and Erosion; Metal corrosion. ASTM West Conshohocken, Pa. W. Lee and W.G. Characklis: Biodeterioration Research 4. G.C. Llewellyn, ed. Plenum Press, New York, 1994,519-526. J.P. Burg: Modern Spectrum Analysis, D.G. Childers ed., IEEE Press, New York, 1978,42-48.
1991,195-204.

Influence of Micro-Organisms on the Free Corrosion Potentials of Stainless Steels in
Natural Sea Water
D. FERON", I. DUPONT* and G. NOVEL**
*CEA/CEREM, Bl'6,92265 Fontenay-aux-Roses, France **Universitb de CAEN, 14 032 Caen Cedex, France
ABSTRACT This paper summarises several studies which have been conducted to look at the in- fluence of micro-organisms and biofilm settlement on the ennoblement of stainless steels in natural sea waters. The reported investigations include natural sea water ex- posures (20°C to 40"C, up to 3000 hours) coupled with microbiological analyses and tests, which were followed by enzymatic experiments.
The increase of the free corrosion potential of stainless steels in natural sea water amounts at 20°C and 30°C to some +300 mV(SCE), but at 40°C these free corrosion potentials of stainless steels are constant (at about -100 mV(SCE)) while biofilm formation and bacterial settlement on stainless steel surfaces occur at all three test tem- peratures.
The main differences between biofilms developed at 20°C and at 40°C concern the metabolic or enzymatic activities of the bacteria. Some investigations have been con- ducted with a 'model system' based on the catalysis of glucose oxidation by glucose oxidase and have shown that the behaviour the corrosion potentials of stainless steels between such a model and natural sea water are in agreement.
The reported tests show that hydrogen peroxide together with organic acids, both generated by a metabolic reaction of bacteria (enzymatic reaction with sugars) may be an explanation of the electrochemical behaviour of stainless steels in natural sea water.
Introduction
Stainless steels are widely used in sea water environment. Numerous studies have been conducted to understand the behaviour of these materials in natural sea water.[l-51 In particular, the increase of the free corrosion poten- tials (E,,,,) of stainless steels (SS) in sea water has been extensively reported in European seas at ambient temperature.[b-81 Even if growth of the passive layer occurs during the sea water exposure, the SS ennoblement is readily ac- counted for by an increase in the rate of the cathodic reaction(s). All these ex- periments have shown that the formation of a biofilm is necessary to obtain the increase in SS potentials and that no increase is obtained in sterile sea water. Several hypotheses have been advanced which include the develop-
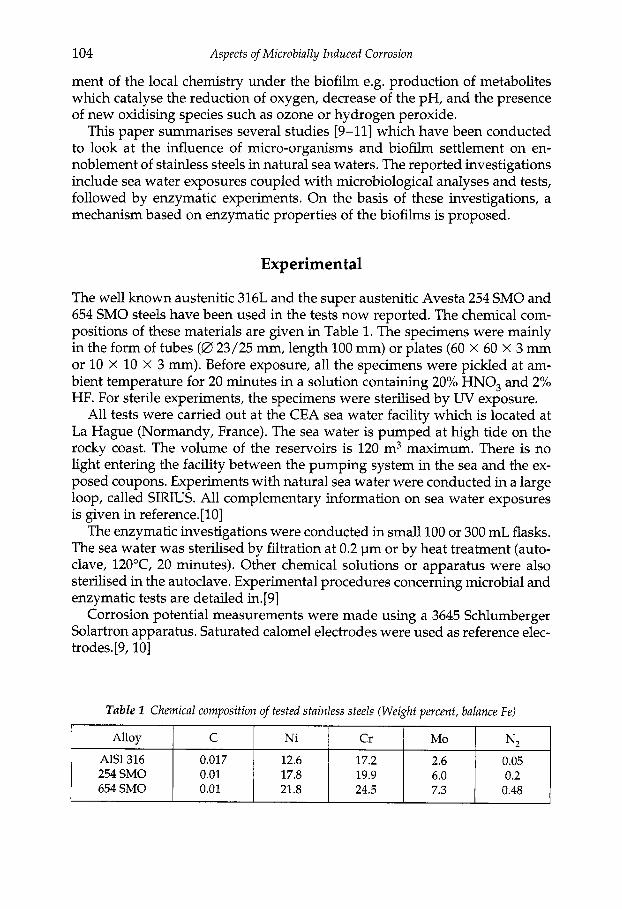
104 Aspects of Microbially Induced Corrosion
ment of the local chemistry under the biofilm e.g. production of metabolites which catalyse the reduction of oxygen, decrease of the pH, and the presence of new oxidising species such as ozone or hydrogen peroxide.
This paper summarises several studies [9-111 which have been conducted to look at the influence of micro-organisms and biofilm settlement on en- noblement of stainless steels in natural sea waters. The reported investigations include sea water exposures coupled with microbiological analyses and tests, followed by enzymatic experiments. On the basis of these investigations, a mechanism based on enzymatic properties of the biofilms is proposed.
Alloy
AIS1 316 254 SMO 654 SMO
Experimental
Ni Cr Mo N2 C
0.017 12.6 17.2 2.6 0.05 0.01 17.8 19.9 6.0 0.2 0.01 21.8 24.5 7.3 0.48
The well known austenitic 316L and the super austenitic Avesta 254 SMO and 654 SMO steels have been used in the tests now reported. The chemical com- positions of these materials are given in Table 1. The specimens were mainly in the form of tubes (0 23/25 mm, length 100 mm) or plates (60 X 60 X 3 mm or 10 X 10 X 3 mm). Before exposure, all the specimens were pickled at am- bient temperature for 20 minutes in a solution containing 20% HNO, and 2% HF. For sterile experiments, the specimens were sterilised by UV exposure.
All tests were carried out at the CEA sea water facility which is located at La Hague (Normandy, France). The sea water is pumped at high tide on the rocky coast. The volume of the reservoirs is 120 m3 maximum. There is no light entering the facility between the pumping system in the sea and the ex- posed coupons. Experiments with natural sea water were conducted in a large loop, called SIRIUS. All complementary information on sea water exposures is given in reference. [ 101
The enzymatic investigations were conducted in small 100 or 300 mL flasks. The sea water was sterilised by filtration at 0.2 pm or by heat treatment (auto- clave, 120"C, 20 minutes). Other chemical solutions or apparatus were also sterilised in the autoclave. Experimental procedures concerning microbial and enzymatic tests are detailed in.[9]
Corrosion potential measurements were made using a 3645 Schlumberger Solartron apparatus. Saturated calomel electrodes were used as reference elec- trodes.[9, 101
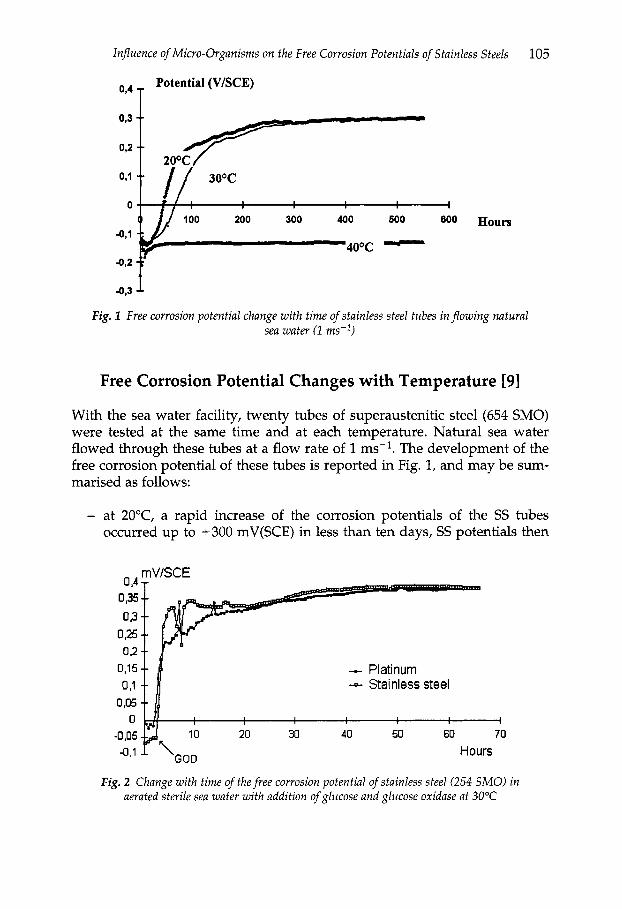
lnfluence of Micro-Organisms on the Free Corrosion Potentials of Stainless Steels 105
Potential (V/SCE) OP4 T
Fig. 1 Free corrosion potential change with time of stainless steel tubes inflowing natural sea water (I ms-l)
Free Corrosion Potential Changes with Temperature [91
With the sea water facility, twenty tubes of superaustenitic steel (654 SMO) were tested at the same time and at each temperature. Natural sea water flowed through these tubes at a flow rate of 1 ms-l. The development of the free corrosion potential of these tubes is reported in Fig. 1, and may be sum- marised as follows:
- at 20°C, a rapid increase of the corrosion potentials of the SS tubes occurred up to +300 mV(SCE) in less than ten days, SS potentials then
- . mVlSCE
- Platinum -9- Stainless steel
0
Hours GOD
Fig. 2 Change with time of thefree corrosion potential of stainless steel (254 SMO) in aerated sterile sea water with addition of glucose and glucose oxidase at 30°C
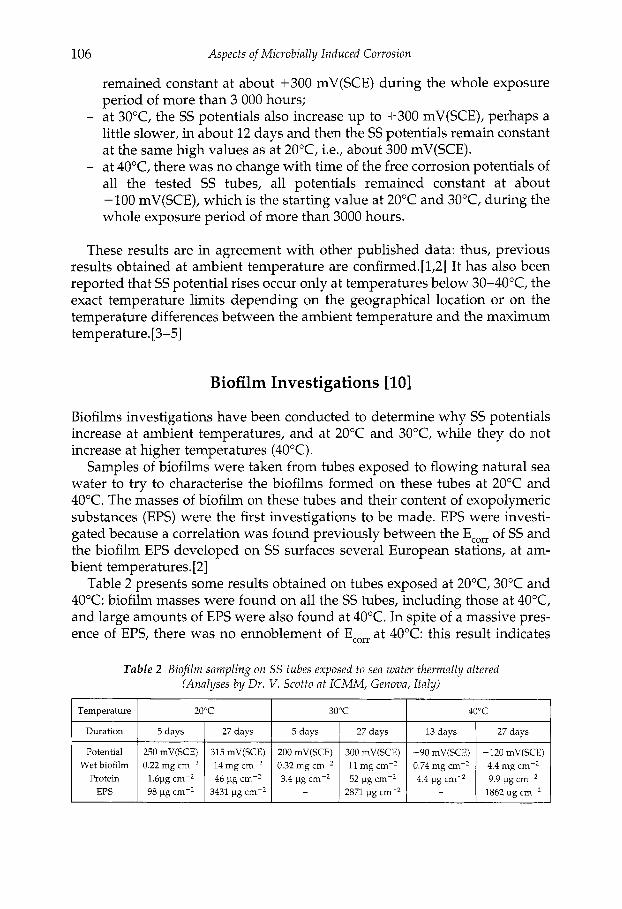
106 Aspects of Microbially Induced Corrosion
remained constant at about +300 mV(SCE) during the whole exposure period of more than 3 000 hours;
- at 30"C, the SS potentials also increase up to +300 mV(SCE), perhaps a little slower, in about 12 days and then the SS potentials remain constant at the same high values as at 20"C, i.e., about 300 mV(SCE).
- at 40°C, there was no change with time of the free corrosion potentials of all the tested SS tubes, all potentials remained constant at about -100 mV(SCE), which is the starting value at 20°C and 30"C, during the whole exposure period of more than 3000 hours.
Temperature
Duration
Potential Wet biofilm
Protein EPS
These results are in agreement with other published data: thus, previous results obtained at ambient temperature are confirmed.[l,2] It has also been reported that SS potential rises occur only at temperatures below 3O-4O0C, the exact temperature limits depending on the geographical location or on the temperature differences between the ambient temperature and the maximum temperature. [3-51
20°C 30°C 40°C
5 days 27 days 5 days 27 days 13 days 27 days
250 mV(SCE) 315 mV(SCE) 200 mV(SCE) 300 mV(SCE) -90 mV(SCE) -120 mV(SCE) 0.22 mg cm-* 14 mg 0.32 mg 11 mg cm-2 0.74 mg cm-2 4.4 mg cm-2
1.6pg cm-2 46 pg cm-2 3.4 pg cm-2 52 pg 4.4 pg cm-z 9.9 pg cm-2 98 pg cm-* 3431 pg cm-' - 2871 pg cm-* - 1862 pg cm-2
Biofilm Investigations [lo]
Biofilms investigations have been conducted to determine why SS potentials increase at ambient temperatures, and at 20°C and 30"C, while they do not increase at higher temperatures (40°C).
Samples of biofilms were taken from tubes exposed to flowing natural sea water to try to characterise the biofilms formed on these tubes at 20°C and 40°C. The masses of biofilm on these tubes and their content of exopolymeric substances (EPS) were the first investigations to be made. EPS were investi- gated because a correlation was found previously between the Ecorr of SS and the biofilm EPS developed on SS surfaces several European stations, at am- bient temperatures. [2]
Table 2 presents some results obtained on tubes exposed at 20"C, 30°C and 40°C: biofilm masses were found on all the SS tubes, including those at 40"C, and large amounts of EPS were also found at 40°C. In spite of a massive pres- ence of EPS, there was no ennoblement of Ecorr at 40°C: this result indicates
Table 2 Biofilm sampling on S S tubes exposed to sea water thermally altered (Analyses by Dr. V . Scotto at ICMM, Genova, I taly)

lnfluence of Micro-Organisms on the Free Corrosion Potentials of Stainless Steels 107
that the exopolymeric substances alone are not sufficient to account for the electrochemical effects of the biofilms.
Other information on the biofilm settlement was needed and was obtained by direct epifluorescence on exposed SS surfaces. To quantify the settlement, the percentage of the surface covered by micro-organisms (dead or alive, and eventually by substances which also react with the fluorescent substance, DAPI) was evaluated with direct epifluorescence. These observations were carried out on tubes, at various exposure times and at different E,,,, values. The main results obtained are summarised in Table 3 and concern the coupons exposed at 20°C and at 40°C. They show clearly that the percentage of the SS surfaces covered by micro-organisms is the same or even more significant at 40°C than at 20°C [6] although the SS free corrosion potential remained con- stant at 40°C and increased at 20°C. This result shows clearly that the presence of a biofilm on SS surfaces is not by itself the cause of potential ennoblement.
Investigations were then conducted on the number of bacteria present in
Exposure Total number temperature of bacteria(l)
20°C 4.4 107 40°C 3.3 107
Marine Heterotroph bacteria(2)
Aerobic Facultative Anaerobic
6.0 104 2.3 lo1 <0.75 1.9 105 0.9 2.3
bacteria cm-*
(1) by epifluorescence (number of bacteria cm-2), (2) by MPN method
the biofilm to determine if there is a major difference between the bacterial colonisation at 20°C and at 40°C which may explain the electrochemical be- haviour. Aerobic, facultative anaerobic and strictly anaerobic bacteria isolated and counted.[lO] As shown in Table 3, there was no major difference between the numbers of bacterial populations.
The important differences between bacterial colonisations at 20°C and at 40°C were obtained by numerical taxonomy: all isolated bacteria were gram negative, but bacteria found on stainless steel surfaces at 40°C did not grow on sugars (including glucose, fructose and maltose), neither on some alcohols (like glycerol and mannitol) and amino acids as illustrated in Table 4 which reports the number of 'phenons' (isolated bacterial genus or species) which are able to grow on specific substrates. For the reported substrates, bacteria found at 40°C are unable to grow while some phenons isolated at 20°C (2 to 11) grow on these substrates.
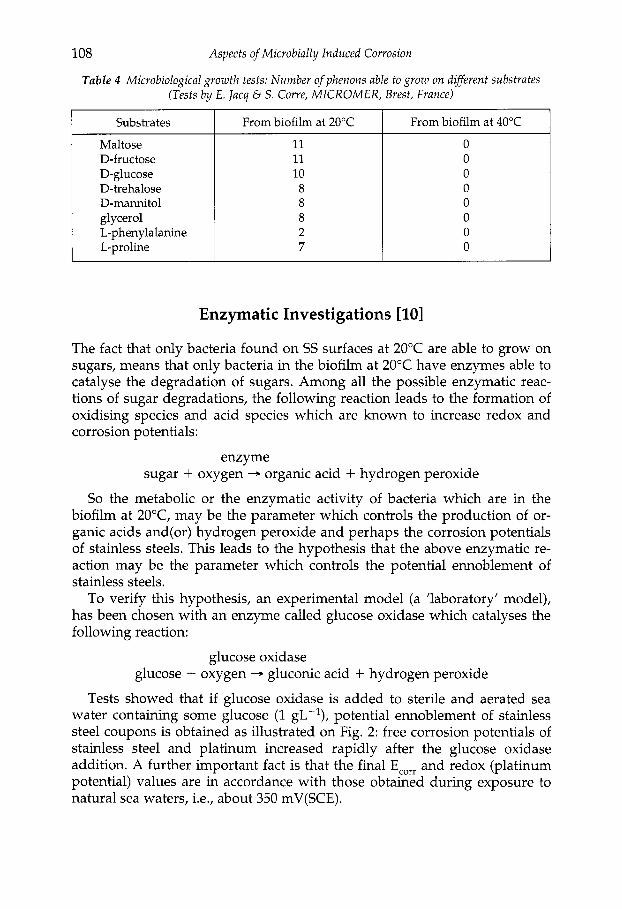
108 Aspects of Microbially Induced Corrosion
Table 4 Microbiological growth tests: Number of pkenons able to grow on different substrates (Tests by E . Jacq 8 S. Corre, MICROMER, Brest, France)
Substrates
Maltose D-fructose D-glucose D-trehalose D-mannitol glycerol L-phenylalanine L-proline
From biofilm at 20°C
11 11 10 8 8 8 2 7
From biofilm at 40°C
Enzymatic Investigations [lo] The fact that only bacteria found on SS surfaces at 20°C are able to grow on sugars, means that only bacteria in the biofilm at 20°C have enzymes able to catalyse the degradation of sugars. Among all the possible enzymatic reac- tions of sugar degradations, the following reaction leads to the formation of oxidising species and acid species which are known to increase redox and corrosion potentials:
enzyme sugar + oxygen + organic acid + hydrogen peroxide
So the metabolic or the enzymatic activity of bacteria which are in the biofilm at 20"C, may be the parameter which controls the production of or- ganic acids and(or) hydrogen peroxide and perhaps the corrosion potentials of stainless steels. This leads to the hypothesis that the above enzymatic re- action may be the parameter which controls the potential ennoblement of stainless steels.
To verify this hypothesis, an experimental model (a 'laboratory' model), has been chosen with an enzyme called glucose oxidase which catalyses the following reaction:
glucose oxidase glucose + oxygen -, gluconic acid + hydrogen peroxide
Tests showed that if glucose oxidase is added to sterile and aerated sea water containing some glucose (1 gL-l), potential ennoblement of stainless steel coupons is obtained as illustrated on Fig. 2: free corrosion potentials of stainless steel and platinum increased rapidly after the glucose oxidase addition. A further important fact is that the final E,,,, and redox (platinum potential) values are in accordance with those obtained during exposure to natural sea waters, i.e., about 350 mV(SCE).

lnfuence of Micro-Organisms on the Free Corrosion Potentials of Stainless Steels 109
Complementary investigations have shown that hydrogen peroxide is well produced and that the pH decreases as expected by the above reactions. The complementary tests that were conducted may be summarised as follows:
Addition of pure hydrogen peroxide (between 0.01 and 0.4 mmolL-l) in sterile sea water leads to SS corrosion potentials which reach about 250 mV(SCE) (Fig. 3). It should be noted that these values are quite low and do not correspond to those that are needed to sterilise a solution. It has also been verified that SS ennoblement in sterile sea water with addition of glucose alone or glucose oxidase alone does not occur. If an enzyme which catalyses the consumption of hydrogen peroxide is added (catalase), then the SS corrosion potential decreases as shown in Fig. 4 where the free corrosion potential increases when hydrogen per- oxide is added to the sterile sea water (at 10 hours) and decreases when the enzyme which catalyses the degradation of hydrogen peroxide (cata- lase) is introduced into the solution (75 hours).
Potential (V(SCE)) 0 , 2 5 +
0.4 mmoE' 0 , 1 5
0.2 mmolL-'
Hours -I
2 0
0.01 mm0E'
Fig. 3 ln fuence of H 2 0 2 on thefree corrosion potential of stainless steel (254 SMO, sterile sea water, 30°C)
1
I C 2 0 4 0 6 0 8 0 H o u r * 1 0 0
C a t a l a s e -0,3 - Fig. 4 lnfluence of a catalase addition on thefree corrosion potential of stainless steels
(sterile sea water, H 2 0 2 addition at 10 h, catalase addition at Oh or 75h, 254 SMO, 30°C)

110 Aspects of Microbially Induced Corrosion
Mechanism of Stainless Steel Ennoblement
The tests conducted with sterile aerated sea water with addition of glucose and glucose oxidase reproduce the development with time of the free corro- sion potential of stainless steels found in natural sea waters. The mechanism of the ennoblement of stainless steel taking place during these tests is depicted in Fig. 5 and may be summarised as follows: the glucose oxidase catalyses the reaction between oxygen and glucose which leads to the formation of hydro- gen peroxide and gluconic acid. These two chemicals are needed together to explain the potential increases of stainless steels up to 300/350 mV(SCE). It has been shown also that if some enzyme are added which catalyses the degradation of hydrogen peroxide, then the SS potentials decrease. So this lab- oratory model with glucose and glucose oxidase puts forward a sort of enzy- matic competition between the formation and the degradation of hydrogen peroxide, and between the glucose oxidase and the catalase.
Fig. 5 Mechanism of the ennoblement ofstainless steel during the simulation tests (laboratory model)
In natural sea water, several enzymes are probably produced by bacteria in the biofilms, and several organic sugars (not only glucose) are available. The proposed mechanism of ennoblement of stainless steels in natural sea water is summarised in Fig. 6. This mechanism is based on the enzymatic properties of the biofilms, thus, when oxidases are present, they degrade organic substrates and produce hydrogen peroxide and acids which increase the free corrosion potential of stainless steels. Of course, other enzymes may produce acids from organic substrates or hydrogen peroxide with oxygen. The chemicals which are produced (H,O, and acids) may be also degraded by other enzymes like catalase and peroxidase. Such a model involves enzymatic kinetics which are in competition between the production and the degradation of hydrogen per- oxide and perhaps also with acids. It could explain why some biofilms do not
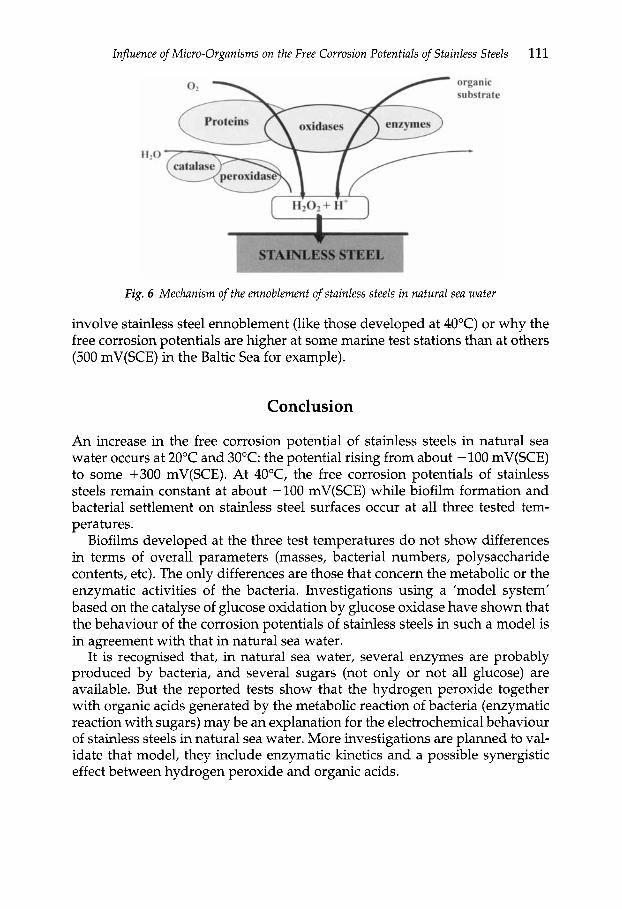
Influence of Micro-Organisms on the Free Corrosion Potentials of Stainless Steels 111
Fig. 6 Mechanism of the ennoblement of stainless steels in natural sea water
involve stainless steel ennoblement (like those developed at 40°C) or why the free corrosion potentials are higher at some marine test stations than at others (500 mV(SCE) in the Baltic Sea for example).
Conclusion
An increase in the free corrosion potential of stainless steels in natural sea water occurs at 20°C and 30°C: the potential rising from about - 100 mV(SCE) to some +300 mV(SCE). At 40"C, the free corrosion potentials of stainless steels remain constant at about -100 mV(SCE) while biofilm formation and bacterial settlement on stainless steel surfaces occur at all three tested tem- peratures.
Biofilms developed at the three test temperatures do not show differences in terms of overall parameters (masses, bacterial numbers, polysaccharide contents, etc). The only differences are those that concern the metabolic or the enzymatic activities of the bacteria. Investigations using a 'model system' based on the catalyse of glucose oxidation by glucose oxidase have shown that the behaviour of the corrosion potentials of stainless steels in such a model is in agreement with that in natural sea water.
It is recognised that, in natural sea water, several enzymes are probably produced by bacteria, and several sugars (not only or not all glucose) are available. But the reported tests show that the hydrogen peroxide together with organic acids generated by the metabolic reaction of bacteria (enzymatic reaction with sugars) may be an explanation for the electrochemical behaviour of stainless steels in natural sea water. More investigations are planned to Val- idate that model, they include enzymatic kinetics and a possible synergistic effect between hydrogen peroxide and organic acids.

112 Aspects of Microbially Induced Corrosion
References
1. J.-P. Audouard, C. Compere, N.J.E. Dowling, D. Fkron, D. Festy, A. Mollica, T. Rogue, V. Scotto, U. Steinsmo, K. Taxen and D. Thierry: Microbial Corrosion, Proceedings of the Third EFC Workshop, Estoril, Portugal, EFC Publication 15, The Institute of Materials, London, 1995, 198.
2. J.-P. Audouard et al.: Proceedings of the International Congress on Microbial Induced Corrosion, New Orleans, Louisiana, USA, 1995.
3. A. Mollica and A. Trevis: 4th Int. Congress on Marine Corrosion and Fouling, Juan-les-Pins, France, 1976.
4. E. Bardal, J.M. Drugli and P.O. Gartland: Corros. Sci., 1993, 35 (1-4),
5. P. Chandrasekaran and S.C. Dexter: 'Paper 493', Corrosion '93, NACE, Houston, TX, USA, 1993.
6. S.C. Dexter: Biofouling, 1993, 7, 97-127 7. Hisashi Amaya and Hideaki Miyuki: Corros. Eng., 1995,44,123-133. 8. D. Fkron: Sea Water Corrosion of Stainless Steel - Mechanisms and
Experience, EFC Publication 19, The Institute of Materials, 1996, 75. 9. I. Dupont: 'Influence de bact6ries et de leur activit6 sur l'kvolution du po-
tentiel des aciers inoxydables en eau de mer naturelle', Thesis, 25 October 1996, University of Caen, France. V. Scotto: Marine bioflm on stainless steels: effects, monitoring and preven- tion, Mast I1 Program, Final report, Contract No. MAS2 CT92 001.1, UE DGXII, Bruxelles, Belgium.
257-267.
10.
Laboratory Simulation with Natural Bacteria Populations
LEENA CARPEN,l LAURA RAASKA,2 KATRI MATTILA? MIRJA SALKINOJA-SALONEN? TERO HAKKARAINENI
'VTI Manufacturing Technology, 2VTT Biotechnology and Food Research, 3Helsinki University, Department of Applied Chemistry and Microbiology, Finland
ABSTRACT A model ecosystem (mesocosm) was used to generate biofilms on stainless steels in the laboratory. Different types of austenitic stainless steels (UNS S30400, S31600, NO8904 and S31254) were studied. The growth of the biofilm with time was modelled by stabilising the organic and inorganic carbon status and the speciation of nutrients by the sequence and intensity of light with dark. Natural sea water (brackish water) was used. The open circuit potentials were recorded for 42 to 70 days. The biofilms formed were analysed by microbial cultivation, measurement of ATP, epifluorescence microscopy and scanning electron microscopy. Laboratory studies showed that the flow rate in the ecosystem was decisive for the biofilm structure and for the electro- chemical behaviour.
Introduction
The potential ennoblement of stainless steels in natural sea water seen in the field is difficult to simulate in a laboratory model system. In this study the sea water (Baltic sea water) was transferred to the laboratory in a container and a sea water mesocosmic ecosystem was established to simulate the marine ecosystem. The performance of the stainless steels studied was also verified by field tests. Baltic sea water differs from the ocean waters in that it has lower salinity, higher levels of oxygen and periodically lower temperatures. The microbial community differs slightly from that in ocean waters. The risk of localised corrosion of stainless steels is believed to be enhanced after the open circuit potential has increased several hundred millivolts simul- taneously with the attachment and growth of a biofilm on the surface of the metal. A model ecosystem was developed to be able to study the variables that may promote localised corrosion and affect the biofilm in natural sea water.

114 Aspects of Microbially lnduced Corrosion
Materials and Methods
Sample Preparation
The austenitic stainless steels studied were UNS S30400, S31600, NO8904 and 531254. Most test specimens used were in the form of discs with a diameter from 11 to 15 mm and in the 600 grit surface finished condition. The test coupons, the devices for generating biofilms and the hoses were rinsed with alcohol and ster- ilised in an autoclave for 30 minutes prior to the experimental period.
Laboratory Ecosystem
A model ecosystem was used to produce biofilms of natural origin on the surface of the stainless steel in the laboratory. The laboratory ecosystem con- sisted of an illuminated chamber (100 L) for growth of algae and fixation of carbon dioxide, a dark chamber (25 L) for heterotrophic growth and several modified Robbins devices [l] (volumes varying from 90 to 150 mL) to observe the formation of the biofilm on the steel surface, Fig. 1. The growth of the biofilm with time was modelled to maintain the concentrations of oxygen and dissolved organic carbon as close as possible to those measured in the sea (5
1
PHE(112D
1 Container for sea-water 2 Illuminated chamber, growth of algae 3 Dark chamber, growth of bacteria 4 Formation of the biofilm 5 Plant lamp
0 0 0 : z o o 0 0 0
Fig. 1 The principle of the laboratory ecosystem (mesocosnz)
Laborato y Simulation with Natural Bacteria Populations 115
to 8 mgL-l of dissolved oxygen and 4 to 8 mgL-l of organic carbon), the speciation of nutrients at a steady state by the sequence and intensity of light (1850 lx, 12 hours) with dark periods (12 h). The container (800 L) for feed sea water was aerated once a day for 30 minutes. Feed sea water was transferred in a container to the laboratory every two or three weeks. The flow rates in the Robbins devices were: 0.1, 1 or 5 mms-l. The hydraulic retention time in the illuminated chamber was either 8.4 d (with flow rate 0.1 mms-l only) or 2 d, in the dark chamber respectively 1.6 d or 0.4 d. Positioning the coupons in the Robbins devices varied from the bottom position (facing up) to side position (facing vertical). The test periods varied from 42 to 70 days.
In one test the addition of nutrients and carbon source was studied. The sup- plement of nutrients was started after 15 days of immersion. Ammonium chlor- ide (1 mgL-' NH,), and potassium hydrogen phosphate (0.1 mgL-l P) were added to the feed water after 15 days of exposure, four times altogether (days 15,29,43 and 57). Glucose was added to the illuminated chamber four times (10 mgL-l C each time) and 12 times with the amount of 2.5 mgL-* C. The tests in the laboratory were performed at ambient temperature which was 23 ? 1°C.
Corrosion Studies
Electrochemical measurements were performed in a modified Robbins device which allows electrochemical measurements to be made under controlled conditions during biofilm growth. To avoid corrosion attack of the equipment, devices made of titanium were used. The redox-potentials of the water, the open circuit potentials of the stainless steel coupons, the platinum counter electrodes and the titanium shell were recorded daily during the first week and later three times a week using a potentiostat (Wenking LB81M). Cyclic polarisation curves in the vicinity of the open circuit potentials (+- 50 mV) were performed several times during the immersion time using a potentiostat (Wenking LB81M), a function generator (HP3325A) and a HP85 computer, or a Gamry CMSlOO Corrosion Measurement System with PC3 Potentiostat (Gamry Instruments, Inc.). A scan rate of 30,18 or 6 mV/min was applied. A saturated calomel electrode (SCE) was used as a reference electrode in all these experiments. Before and after the tests the reference electrodes were measured against a standard calomel electrode and were rejected if their read- ings deviated more than 5 mV from those of the standard electrode. After the test periods the corrosion coupons were inspected visually, by optical mi- croscopy and by scanning electron microscopy (SEM) and energy dispersive X-ray analysis (EDS).
Water Analysis
The conductivity, oxygen level, redox-potential and pH were determined three times a week from the water in the feed sea water container, in the
116 Aspects of Microbially lnduced Corrosion
illuminated chamber and the dark chamber. The procedure for these mea- surements is described in detail elsewhere.[2] The chemical composition of the sea water was analysed on a regular basis. Nitrate, nitrite, total nitrogen, total phosphorus and ammonium were measured with an AKEA-analyser using standard methods. Chloride and sulfate were determined with ion chro- matography (Dionex, USA) according to the standard ISO/DIS 10304-2. Calcium, aluminum, iron and manganese were determined according to the standards SFS 5074 and SFS 5502. Total organic carbon (TOC) was determined according to IS0 standard 8245.
Biofilm Characterisation
The biofilms were examined with epifluorescence microscopy, microbial cul- tivation, luminometric analysis (ATP-measurements) and dry weight mea- surements to gain knowledge about the total amount of the bacteria, the biofilm formation and the metabolic activity of the bacterial cells. Viable counts of aerobic bacteria were performed on Plate Count agar (Difco) for 5 d at 25°C from the biofilm scraped from the test surface with alginate swab. The swab was transferred into a sterile test tube containing 5 mL peptone saline. The test tube containing the swab was stirred for 2 min to release the cells into the saline. The procedure for epifluorescence microscopy is described in detail elsewhere.[2,3] Biomass from stainless steel coupons was quantitated by ATP measurements using Bio-Orbit 1253 luminometer system as described else- where.[2] The structure and the morphology of the biofilm were studied by scanning electron microscopy (SEM). For SEM the coupons were fixed with a buffer solution (pH 7.2) 3% glutaric aldehyde (w/v) for 2 to 3 h, dehydrated in of 40% to 100% ethanol (5 steps of 15 min), critical point dried and gilded.
Results and Discussion
Ennoblement of Test Coupons
Field conditions could be simulated successfully and reproducibly in the lab- oratory model ecosystem (Fig. 1). The results for the field experiments have been reported elsewhere. [2, 31 From the open circuit potential measurements it could clearly be seen that the flow rate in the Robbins devices had a re- markable effect on the electrochemical behaviour. With flow rates of 0.1 and 1 mms-l, no ennoblement occurred. Variation between the parallel samples (3 ... 6) was significant. Adding nutrients had no positive influence on the en- noblement. When the flow rate was increased to 5 mms-l, an ennoblement of the stainless steels occurred (Fig. 2). For the stainless steel S30400 the rise of potentials was even more pronounced than in the field in the Baltic Sea.[2] The open circuit potentials of the platinum electrodes and the titanium shell

Laborato y Simulation with Natural Bacteria Populations 117
400
300
A g 200 a > E -- 100
G f o
\ flow rate 0.1 mm s-’
-200 r....... 0 10 20 30 40 50 60 70 80
Immersion time, days
Fig. 2 The influence offlow rate to the open circuit potentials of S30400 in Baltic sea water
seemed not to depend on the flow rate. The potentials of platinum settled to 350 to 400 mV(SCE) during all experiments. Table 1 summarises the quantita- tive data on the observed ennoblement (or none) in the laboratory. The data shown in Table 1 shows that the natural seasonal fluctuations in the compo- sition of Baltic sea water did not effect the ennoblement behaviour.
Biofilm Formation
The viable bacterial counts in mesocosm coupons (S31600, N08904) was from lo4 to lo7 cfut cm-2 depending on the nutrient supplementation during the immersion time and the water circulation velocity through the Robbins de- vice. Table 2 summarises the characteristic features of the biofilms grown in the field and in the laboratory with two different flow rates. The biofilms gen- erated in the mesocosm equipment remained thinner than those in the Baltic Sea. The thickness and structure of the biofilm depended on water circulation velocity, nutrient supplementation of water as well as the surface state of the stainless steel. This was clearly seen in 3 separate experiments where stainless steel coupons were exposed to these different conditions. The amount of biofilm increased with time, Fig. 3. With the flow rate of 5 rnms-l more than 80% of the total coupon area was covered by biofilm after 6 weeks of ex- posure. Small amounts of sulfate reducing bacteria were also detected as well as a lot of algae especially in the coupons of 3 and 6 weeks. Biofilm formation started with the attachment of individual cells. With the flow rate of <1
t cfu = colony forming u n i t s

118 Aspects of Microbially Induced Corrosion
Table 1 The conditions in which the ennoblement occurred or did not occur in the laboratory
Laboratory (March- May)
Flow rate I < lmms-1 I 1 mms-l+ nutrients I 5 mms-1
21 - 11.2 4.8 1.8 5.0 43 0.62 7.6 4.9 55 0.53 21.3 4.8 7.5
max open circuit potential, mV (SCE) ennoblement day TOC, mgL-l tot P, pgL-1 tot N, pgL-' PH Cl-, mgL-l Ca, mgL-' Al, pgL-' Fe, pgL-' SO:- mgL-l Mn, pgL-'
- 39.. . + 216
ND (>67) 1-8 10-70 300-900 7.3 - 7.9 1700-3500 46-88 30-130 60-230 320-480 20-80
+86... + 167
ND(>70) 2-7 30-160 300-1500 7.0-7.9 2100-3900 36-94 30-100 50-160 460-490 20-30
+ 361 .. .398
19 ... 21 2-9 20-40 300-900 7.6-7.9 2600-2800 70-76 100-280 100-150 360-410 20-30
Table 2 Comparison between the bioflms grown in thefield and in the model ecosystem in the laboratory
experiment
Field (May-Dec)
exposure time, days
28 84 210
0.93
viable count log cfu cm-2
2.1 5.5 4.1
chlorophyll -a pg L- 1
7 21 67
5.2
4.8 I
mms-l the formed biofilm contained mainly bacteria with the remains of algae, Fig. 4. After 3 weeks of exposure with a flow rate of 5 mms-' a thin, more dense and tightly bound biofilm was formed (Fig. 5) and the ennoble- ment was detected. The addition of nutrients into the mesocosm enhanced the formation of a thick and more easily detachable biofilm (Fig. 6).
Corrosion Studies of the Coupons
The stainless steels showed passive behaviour and thus the corrosion current (Icorr) remained very low in all cyclic polarisation tests performed in the vicin- ity of the open circuit potential (Eoc ? 50 mV). After a longer immersion, a
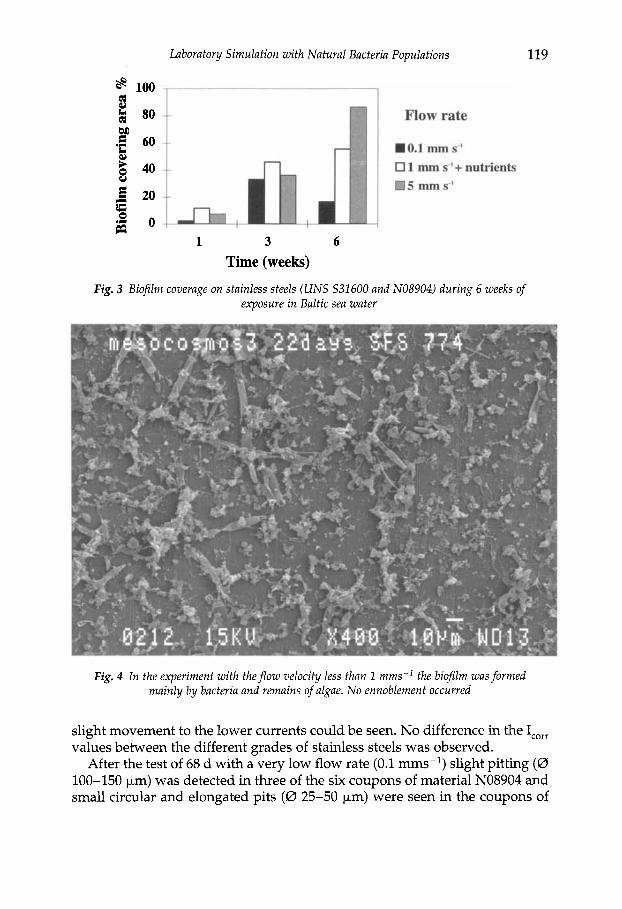
Laborato y Simulation with Natural Bacteria Populations 119
1 3 6 Time (weeks)
Fig. 3 Bioflm coverage on stainless steels (UNS S31600 and N08904) during 6 weeks of exposure in Baltic sea water
Fig. 4 In the experiment with theflow velocity less than 1 mms-l the bioflm was formed mainly by bacteria and remains of algae. No ennoblement occurred
slight movement to the lower currents could be seen. No difference in the I,,,, values between the different grades of stainless steels was observed.
After the test of 68 d with a very low flow rate (0.1 mms-l) slight pitting (0 100-150 pm) was detected in three of the six coupons of material NO8904 and small circular and elongated pits (0 25-50 pm) were seen in the coupons of
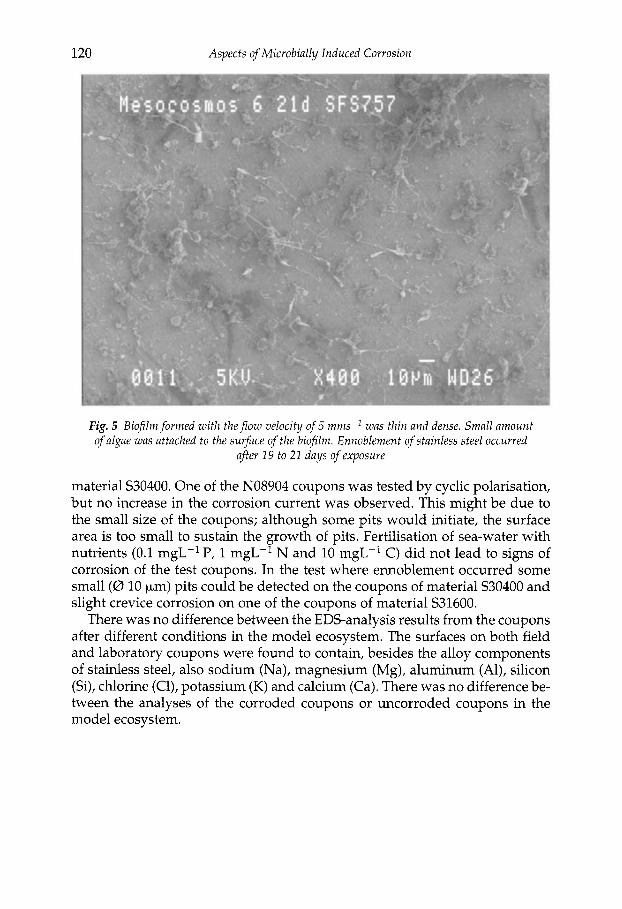
120 Aspects of Microbially Induced Corrosion
Fig. 5 Biofilm formed with theflow velocity of 5 mms-' was thin and dense. Small amount of algae was attached to the surface of the biofilm. Ennoblement of stainless steel occurred
after 19 to 21 days of exposure
material S30400. One of the NO8904 coupons was tested by cyclic polarisation, but no increase in the corrosion current was observed. This might be due to the small size of the coupons; although some pits would initiate, the surface area is too small to sustain the growth of pits. Fertilisation of sea-water with nutrients (0.1 mgL-l P, 1 mgL-l N and 10 mgL-' C) did not lead to signs of corrosion of the test coupons. In the test where ennoblement occurred some small (0 10 pm) pits could be detected on the coupons of material S30400 and slight crevice corrosion on one of the coupons of material S31600.
There was no difference between the EDS-analysis results from the coupons after different conditions in the model ecosystem. The surfaces on both field and laboratory coupons were found to contain, besides the alloy components of stainless steel, also sodium (Na), magnesium (Mg), aluminum (Al), silicon (Si), chlorine (Cl), potassium (K) and calcium (Ca). There was no difference be- tween the analyses of the corroded coupons or uncorroded coupons in the model ecosystem.
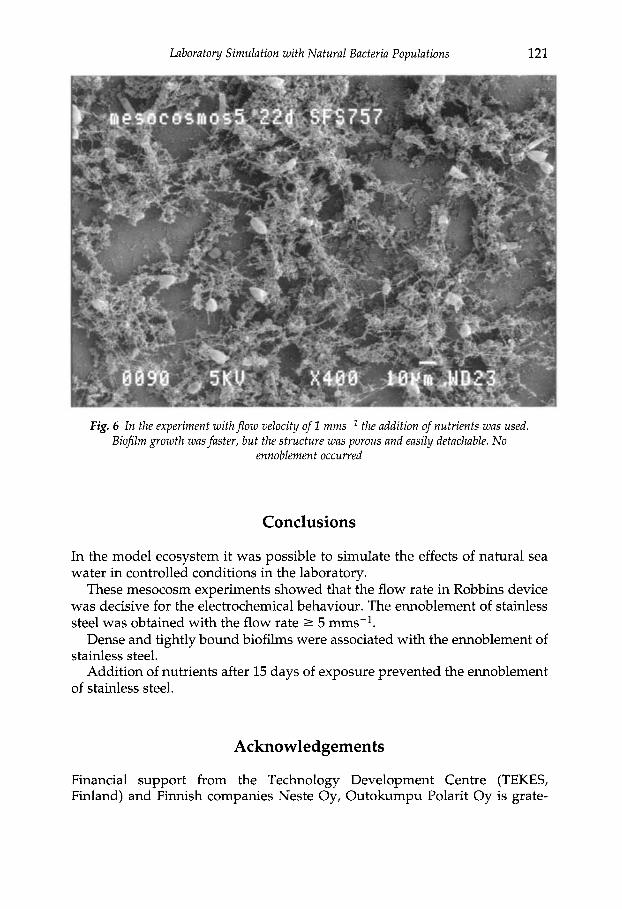
Laborato y Simulation with Natural Bacteria Populations 121
Fig. 6 In the experiment withflow velocity of 1 mms-l the addition of nutrients was used. Biofilm growth was faster, but the structure was porous and easily detachable. No
ennoblement occurred
Conclusions
In the model ecosystem it was possible to simulate the effects of natural sea water in controlled conditions in the laboratory.
These mesocosm experiments showed that the flow rate in Robbins device was decisive for the electrochemical behaviour. The ennoblement of stainless steel was obtained with the flow rate 2 5 mms-l.
Dense and tightly bound biofilms were associated with the ennoblement of stainless steel.
Addition of nutrients after 15 days of exposure prevented the ennoblement of stainless steel.
Acknowledgements
Financial support from the Technology Development Centre (TEKES, Finland) and Finnish companies Neste Oy, Outokumpu Polarit Oy is grate-
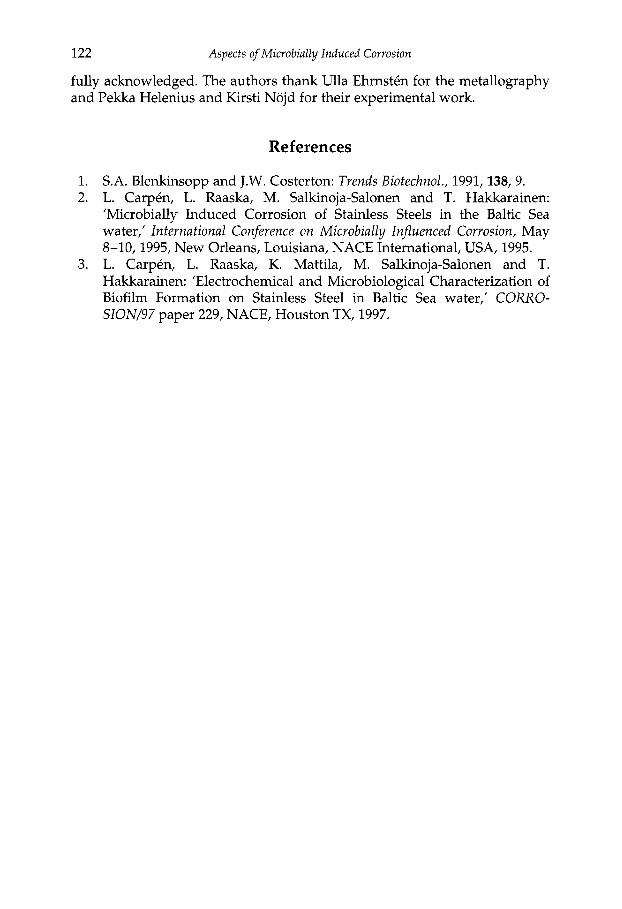
122 Aspects of Microbially Induced Corrosion
fully acknowledged. The authors thank Ulla Ehrnsten for the metallography and Pekka Helenius and Kirsti Nojd for their experimental work.
References
1. S.A. Blenkinsopp and J.W. Costerton: Trends Biotechnol., 1991,138, 9. 2. L. Carpen, L. Raaska, M. Salkinoja-Salonen and T. Hakkarainen:
’Microbially Induced Corrosion of Stainless Steels in the Baltic Sea water,’ International Conference on Microbially Influenced Corrosion, May 8-10,1995, New Orleans, Louisiana, NACE International, USA, 1995.
3. L. Carpen, L. Raaska, K. Mattila, M. Salkinoja-Salonen and T. Hakkarainen: ‘Electrochemical and Microbiological Characterization of Biofilm Formation on Stainless Steel in Baltic Sea water,’ CORXO- SION/97 paper 229, NACE, Houston TX, 1997.

Influence of Surf ace Condition
on MIC

Influence of Metal Surface Condition on Microbiologically Influenced Corrosion of
Stainless Steels
Z.G. CHEN*, P. GUMPEL, M. KAISER and R. KREIKENBOHM
*Jiangsu University of Science and Technology, China Fachhochschule Konstanz (Germany)
ABSTRACT The effect of surface conditions produced by different surface cleaning processes and the effect of alloying elements in stainless steels on the pitting potential was studied. MIC-tests for stainless steel type AIS1 316 in the water of ’Lake Constance’ and SS 304 in Rhine water were conducted. The influence of surface condition on the open circuit potential and on MIC was examined and discussed.
1. Introduction
Costly pitting failures of stainless steel components resulting from MIC (microbiologically influenced corrosion) have been observed in a number of situations including power generation, chemical processing plants, water cooling systems and so on. MIC is such an important phenomenon that scien- tists pay more and more attention to it.
For stainless steels, typical MIC may include pitting at or adjacent to weld- ments.[l] The formation of a passive layer is of critical importance to the cor- rosion resistance,[2] but the unimpeded formation of this chromium oxide/chromium hydroxide layer, which is only a few atoms thick, is only possible on clean metal surfaces. Scale, heat tint, welding slag residues and surface contamination disturb the formation of this passive layer, thus reduc- ing corrosion resistance.[3,4] Therefore, cleaning the surface must be the last step of the manufacturing process to minimise these disturbing effects.
Many mechanisms for MIC have been put forward. Despite the consider- able effort which has been directed towards microorganisms, their biofoul- ing processes and biofilms, a reasonable account relating MIC to the surface conditions of materials and to alloy composition is lacking. The purpose of this study is to investigate the effect of surface conditions associated with different -cleaning processes and also the effects of alloy compositions on MIC .

126
18.14 16.74 16.64 22.27 20.65 24.32 22.25
Aspects of Microbially Induced Corrosion
2. Test Procedure
- 2.10 2.09 3.19 4.84 4.60 9.14
2.1 Materials and Surface Treatment
The materials studied here are listed in Table 1. To ascertain more precisely the effects of surface treatment the samples were prepared in various ways. The samples were first heated in a furnace at 600°C to obtain an oxide layer covering the whole surface. This was to simulate the oxide layer formed dur- ing the welding process while avoiding the segregation accompanying the weldment. Thus, the results obtained would depend only on the materials and the respective surface treatments applied. In the second step, the samples were treated by one of the following three methods:
- 0.01 0.148 0.079 0.472 -
1. Pickled with a commercial pickling paste (hydrofluoric acid >45%, nitric
2. Ground with grinding paper of either grain 60 or grain 120. 3. Blasted with glass beads at an angle of either 45" or 60" to the surface.
acid 20%). Then washed in water and air-dried.
- 0.44 Ti
1.37 Cu 5.94 Mn 3.43 N?J
-
2.2 Potential - Current Density Measurement
Current-density potential curves were obtained at room temperature in 3% NaCl using a polarisation speed of 100 m V k l and a starting value of -200 mV,. The potential corresponding to a limiting value of current density of 1 Amp2 is considered as the critical pitting potential.
2.3 Microbiologically Influenced Corrosion (MIC) Test
The test for MIC was conducted in a test loop containg 'Lake Constance' water inoculated with fresh bacterial sludge. The bacterial sludge was taken from a water cooling circuit damaged by MIC. This cooling circuit is situated in a big chemical plant located on the 'River Rhine'. Failure analysis showed that the pitting attack was caused by MIC. The test was carried out at a temperature
Table 1 Chemical compositions of the materials
Composition (wt YO) Alloy
Type 304 Type 316 Type 316Ti 1.4462 1.4539 1.4565 2.4856
C
0.026 0.035 0.040 0.020 0.016 0.021 0.012
Ni
8.71 10.56 10.50 5.74
24.04 17.72 61.40
N I Others
- I -
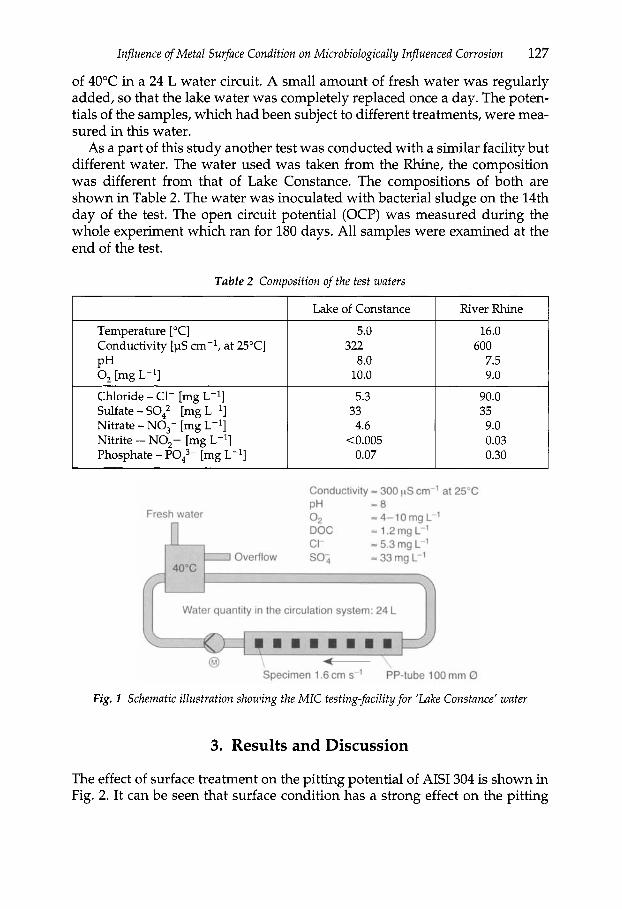
lnfluence of Metal Surface Condition on Microbiologically Influenced Corrosion 127
of 40°C in a 24 L water circuit. A small amount of fresh water was regularly added, so that the lake water was completely replaced once a day. The poten- tials of the samples, which had been subject to different treatments, were mea- sured in this water.
As a part of this study another test was conducted with a similar facility but different water. The water used was taken from the Rhine, the composition was different from that of Lake Constance. The compositions of both are shown in Table 2. The water was inoculated with bacterial sludge on the 14th day of the test. The open circuit potential (OCP) was measured during the whole experiment which ran for 180 days. All samples were examined at the end of the test.
I 10.0 I 9.0
Table 2 Composition of the test waters
Temperature ["C] Conductivity [pS cm-', at 25"CI
Lake of Constance
5.0
8.0 322
River Rhine
16.0
7.5 600
Chloride - C1- [mg L-l] Sulfate - SO:- [mg L-lI Nitrate - NO,- [mg L-'1 Nitrite - NO,- [mg L-'] Phosphate - PO:- [mg L-l]
5.3 33 4.6
<0.005 0.07
90.0 35 9.0 0.03 0.30
Fig. 1 Schematic illustration showing the MlC testing-facility for 'Lake Constance' water
3. Results and Discussion
The effect of surface treatment on the pitting potential of AIS1 304 is shown in Fig. 2. It can be seen that surface condition has a strong effect on the pitting

128
Ground Ground 60 grain 120 grain
- Blasted at an angle of 60"
Blasted at an angle of 45"
Pickled
-
-
-
-
-
3.0
2.5
cu 2.0
a E
5 1.5 .- v) c al -0 c + 1.0 2 5 0.5 L
0
Aspects of Microbially Induced Corrosion
TIG fused without filler-material
-0.5 ' ' I I I I -0.2 0 0.2 0.4 0.6 0.8
Applied potential, V
Fig. 2 Effect of the surface treatment on the current density potential curve of S S 304 in aerated 3% NaCl solution at 25°C
potential. Usually the pitting potential is mainly affected by environmental and material factors. Among the latter the passive layer plays an important role. However, the structure of the passive layer depends not only on the al- loying elements, but also on the kind of surface treatment process since this can influence its formation. The oxide layer formed by scaling or welding can most efficiently be removed by pickling. After pickling, a thin quite uniform and dense passive layer is formed on the surface. This contributes to the high pitting potential of the stainless steels (Fig. 3). However, grinding and blast- ing can also remove the thick oxide layer efficiently, but the passive layer
1.4
1.2
> 1.0 - 2 0.8
ij 0.6
0.4
0.2
C al
a
0 I I I I I I I 0 Ground 4 I I
0 5 10 15 20 25 30 35 40 45 50 55 PRE = % Cr+3.3% Mo+30%N
Fig. 3 Effect of the pitting resistance equivalent (PREI on the critical pitting potential in a 3% NaCl solution at 25°C

Influence of Metal Surface Condition on Microbiologically Influenced Corrosion 129
formed by HNO, in the pickling treatment is more stable than that formed in air after these mechanical treatments. The difference in the pitting potentials of ground and blasted samples is small compared to that for the pickled sur- face. The similar pitting resistance is possibly due to the similar nature of the mechanical processes.
In Fig. 3 it can easily be seen that the pitting potential increases with the amount of alloying elements. This amount is usually referred to as the pitting resistance equivalent (PRE = YO Cr + 3.3% Mo + 30% N). In this investigation the pitting resistance was measured in a 3% NaCl solution. Stainless steels usually are susceptible to solutions with high chloride contents.[5] The PRE value causes a big difference in the pitting potentials among the seven stain- less steels used in this work. A similar behaviour, but at a different level, can be shown for water having a lower chloride content. This well known effect emphasises that chloride is harmful to the passive layer.
The consequence of the above discussion confirms that an increase in cor- rosion resistance can be achieved by selecting a stainless steel with a high PRE value but, additionally, it can be improved by a surface cleaning process that will lead to a more stable passive layer.
Figure 4 shows the OCP measurement during a MIC test for a 316Ti stain- less steel with different surface conditions. The OCP of the different samples was almost the same (about 200 mV,) before the water was inoculated with bacterial sludge after 14 days. The OCP of all specimens then shifted to almost 500 mV, but at quite different rates. The earliest rise was observed for the specimen with a scaled surface. The latest increase of OCP was observed on the specimen with a blasted surface. The pickled and ground specimens fell in-between. All of the materials had their potential shift in this order. This dif- ference implies that surface condition can influence the bacteria colonisation and biofilm formation. However, the fact that almost the same OCP values were measured for the different surface treatments shows that this influence is only temporary.
The potential of a metal depends significantly on the medium that is closely
0.6
0.5
>. - 0.4
E 0.3
0.2
0.1
m
a .- -
- - -
Scaled surface Scaled +pickled Scaled +ground Scaled + blasted
_ - - - - - ---- - - - _ _ _ _ _ _ ..___..__...__..._._....----------- .-.- - - - - - -
01 I I I I I I I I I I I I I I 10 12 14 16 18 20 22 24 26 28 30 32 34 36 38 40
Exposure period, days
Fig. 4 Influence of the surface condition on the potential shift of S S 316Ti in Lake Constance water inoculated with bacterial sludge

130 Aspects of Microbially Induced Corrosion
adjacent to the surface. So the formation of a biofilm on the metal causes a potential shift, because the biofilm presents a new environment and medium to the surface. Therefore, the rate of potential shift depends on the rate of ad- hesion of bacteria to the metallic surface and the rate of their subsequent growth. It has been repeatedly proved in the author’s laboratory that the po- tential usually starts to increase several days after bacteria are inoculated into the water although bacterial colonisation starts within hours.[6] Thus, the po- tential changes only when the surface becomes covered with a sufficiently thick biofilm of densely packed cells, which establish an environment on the surface with a biological activity different from that in the bulk environment.
The adsorption of bacteria to a substrate can be illustrated schematically in Fig. 5. The change of surface free energy can be calculated as follows:
= ybs - ybl - ysl, (1) where y,, is the bacteria-substratum interfacial free energy, ybl is the bacteria- liquid interfacial free energy, and ySl is the substrate-liquid interfacial free energy. Because of the large number of bacteria in a polymer, even very weak interactions between polymer segments and the substrate may lead to signifi- cant adsorption. [7] A negative value for AF,,, denotes thermodynamically favourable conditions for bacterial adhesion to the substrate. At the present time, accurate surface free energy values of the surfaces under consideration are not available but it is not difficult to make an estimate of the order of sur- face free energy for the four specimens in Fig. 4, because the differences be- tween them are very considerable. It can be assumed that the scaled surface has the lowest surface energy, with that of the pickled surface higher than this. The grinding process brings some mechanical energy to the surface, so the surface free energy is even higher than the pickled. The highest surface energy was produced by the blasting process, as a result of the serious mechanical de- formation of the surface layer. Stainless steel surfaces with higher surface free energy are more hydrophilic, otherwise they are generally hydrophobic. [ 71
.- b VI
a,
El ER E2 EL
Fig. 5 Schematic illustration showing the shifting of the potential caused by microbial influence
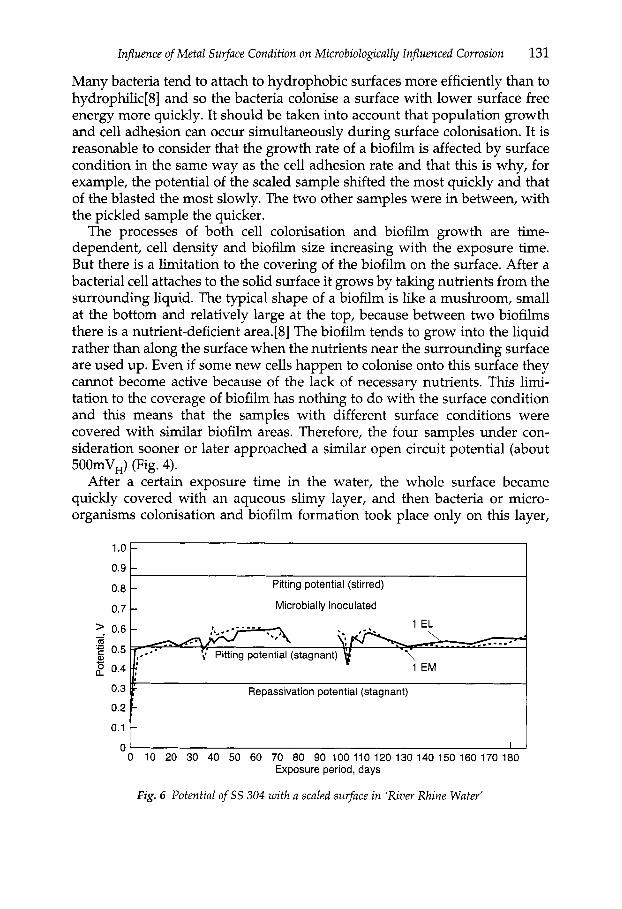
Influence of Metal Surface Condition on Microbiologically Influenced Corrosion 131
Many bacteria tend to attach to hydrophobic surfaces more efficiently than to hydrophilic[8] and so the bacteria colonise a surface with lower surface free energy more quickly. It should be taken into account that population growth and cell adhesion can occur simultaneously during surface colonisation. It is reasonable to consider that the growth rate of a biofilm is affected by surface condition in the same way as the cell adhesion rate and that this is why, for example, the potential of the scaled sample shifted the most quickly and that of the blasted the most slowly. The two other samples were in between, with the pickled sample the quicker.
The processes of both cell colonisation and biofilm growth are time- dependent, cell density and biofilm size increasing with the exposure time. But there is a limitation to the covering of the biofilm on the surface. After a bacterial cell attaches to the solid surface it grows by taking nutrients from the surrounding liquid. The typical shape of a biofilm is like a mushroom, small at the bottom and relatively large at the top, because between two biofilms there is a nutrient-deficient area.[8] The biofilm tends to grow into the liquid rather than along the surface when the nutrients near the surrounding surface are used up. Even if some new cells happen to colonise onto this surface they cannot become active because of the lack of necessary nutrients. This limi- tation to the coverage of biofilm has nothing to do with the surface condition and this means that the samples with different surface conditions were covered with similar biofilm areas. Therefore, the four samples under con- sideration sooner or later approached a similar open circuit potential (about 500mV,) (Fig. 4).
After a certain exposure time in the water, the whole surface became quickly covered with an aqueous slimy layer, and then bacteria or micro- organisms colonisation and biofilm formation took place only on this layer,
Microbially inoculated
., 0 10 20 30 40 50 60 70 80 90 100110120130140150160170180
Exposure period, days
Fig. 6 Potential of S S 304 with a scaled surface in ‘River Rhine Water’

132 Aspects of Microbially Induced Corrosion
and no longer on the bare metal surface directly. Therefore, the surface treat- ment had almost no influence on the OCP value this time.
The OCP shift resulting from a microbiological influence is an important phenomenon for stainless steels. As shown in Fig. 5 stainless steels are resis- tant to corrosion within a certain range of potential (El). This range is lower than the repassivation potential of the material. If the open circuit potential is shifted up to the range between the repassivation potential and the pitting potential (E2), the material has no longer a stable resistance to pitting corro- sion. However, if the potential is microbiologically shifted up to the pitting potential, the probability of a corrosion attack becomes very high. In sum- mary, the above discussion indicates that surface treatment has an influence on the pitting potential (EL) of stainless steel in chloride solutions, that micro- organisms can shift the OCP to higher values, and that, consequently pitting corrosion can occur if the pitting potential is exceeded.
Figures 6-9 are examples showing how the surface treatment and presence of microorganisms affect the corrosion resistance of SS 304 in ’Rhine Water’. It can be seen that all the OCPs exceeded the repassivation potential measured in stagnant water. This means that all the investigated surface conditions were in an unstable state. The potential of the sample with a scaled surface was even shifted up to the measured pitting potential and pitting corrosion attack was, in fact, found on this sample.
For the pickled samples the pitting potential was much higher than the OCP although no visible pitting was found on these samples. Both ground (Fig. 8) and blasted (Fig. 9) samples showed a similar behaviour to the pickled sample. The test lasted for six months altogether but no pits were found.
Water composition is also an important factor affecting the corrosion be- haviour. By comparing the pitting potential measured in 3% NaCl solution
1 .o
A I 0.9 1
0.5
0.4 a,
Microbially inoculated c
0.3 Repassivation potential (stagnant)
0 10 20 30 40 50 60 70 80 90 100110120130140150160170180 Exposure period, days
Fig. 7 Potential of SS 304 with a pickled surface in ‘River Rhine Water’

lnfluence of Metal Surface Condition on Microbiologically Influenced Corrosion
0.7
'. 0.6
133
1 CB - Pitting potential (stirred) -
1 .o
1.0
0.9
0.8
0.7
0.8 0.9 i:
-
? ? - - ._______________________________________----------------------------------
1 DD - Pitting potential (stagnant)
? ?
0.3 Repassivation potential (stagnant)
I 0 10 20 30 40 50 60 70 80 90 100110120130140150160170180
Exposure period, days
Fig. 9 Potential of S S 304 with a blasted surface in 'River Rhine Water'
(Fig. 2) with those measured in 'Rhine Water' for SS 304 (Figs 6-9) it can be seen that chloride ions decrease the pitting potential significantly. The pitting potential is thus sensitive to the surface condition and to the chloride concen- tration.
Conclusions
1. The pitting potential of 304 and 316 stainless steel can be strongly affected by surface treatment and alloy composition.
134 Aspects of Microbially Induced Corrosion
2. Bacteria inoculation causes a shift of the open circuit potential (OCP) to higher values which sometimes exceed the pitting potential. This can result in an attack of stainless steels with poor surface condition and low alloy content.
3. Surface treatment has only a temporary effect on the OCP shift. But this effect depends on the colonisation process. No effect of surface treatment was found on the OCP after the potential became stable at higher values.
References
1. 2.
3. 4. 5.
6.
7.
8.
R.E. Tatnall: Mater. Perform., 1981, 20 (8), 41. N. Arlt, H-J. Fleischer, W. Gebel, R. Grundmann and P. Gumpel: Thyssen Edelstahl Technische Berichte, 1989,15,1. A.S.M. Diab and W. Schwenk: Werks. Korros., 1993,44,367. H. Giepl: Praktiker, 1987, 7, 314. S. Watkins Borenstein: Microbially influenced corrosion handbook, Industrial Press Inc., 1994,151. K.C. Marshall: Microbial Adhesion and Aggregation, Dahlem Conference 1984, Springer-Verlag, Berlin, Hiedelberg, New York, 1984,125-136. B.E. Christensen and W.G. Characklis: ’Physical and chemical properties of biofilms’, Biofilm, John Wiley & Sons, New York, 1990, Chapter 4,
K.L. Mittal: ’ContactAngle’, Wettability and Adhesion, VSP, 1993,839-848. 93-130.

Experience of Microbial Corrosion Prevention
Microbial Corrosion Prevention in ENEL* Power Plants
I?. CRISTIANI and G. BIANCHIt
ENEL S.p.A. Environmental and Materials Research Center, Via Rubattino, 20134 Milan, Italy 'ENEL S.p.A. Thermal Power Plants -Process Branch, Via A. Pismo 120,56122 Pisa, Italy
ABSTRACT Microbial corrosion is a phenomenon closely related to biofouling growth on the sur- face of wetted metallic structures. As regards ENEL's power stations, these problems particularly affect heat-exchange equipment, pipes and other components operating with sea water and wet cooling towers.
In this work, an approximate valuation of the damages caused by biofouling has been made. An estimate of costs for prevention and control of fouling and microbial corrosion gives a figure, for ENEL, close to tens of millions of US dollars per year.
In ENEL plants, our estimate shows that, at a first approximation, 50% of the cases of corrosion of condenser tubes might be prevented by better cleaning during the plant operation. In some cases, corrosion problems have been solved by adopting the use of more noble materials such as titanium and superferritic stainless steels. However, the prevention of microbial corrosion is usually based on the use of biocide treatments of the cooling water (oxidising agents such as sodium hypochlorite) that can inhibit bio- fouling growth throughout the equipment and pipework.
Recently, to improve the management and the efficiency of the biocide systems that have been adopted, ENEL has been testing its innovative electrochemical probes for the on-line monitoring of biofouling growth and, contemporaneously, the Total Residual Oxidant (TRO) in the water. The adoption of this new device is expected to allow the optimisation of biocide treatments in widely differing conditions and there- by obtain a cost reduction.
Introduction
As regards fossil-fired power stations, microbial corrosion affects mainly the integrity and functionality of the metallic materials employed in steam con- densers cooled with sea water as well as in wet cooling towers and cooling systems generally.[l, 21 Other problems, such as those related to buried struc- tures and concrete reinforcements, are not considered in this work.
As is known, the phenomenon of microbial corrosion is associated with the presence of a film of organic and inorganic substances and micro-organisms, both in aerobic and/or anaerobic environments - the so-called 'biofilm' or
* ENEL - Ente Nazionale per l'Energia Elettrica
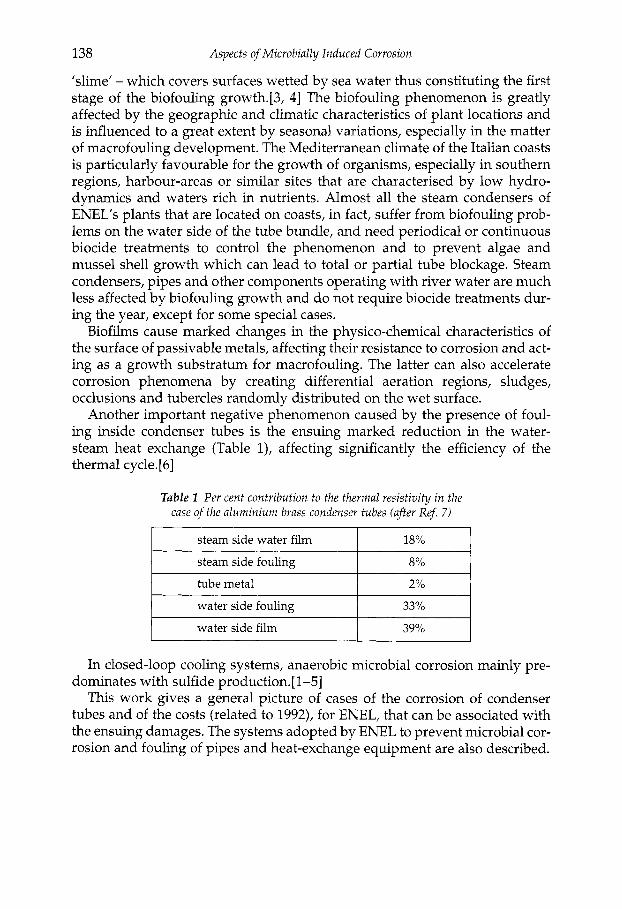
138 Aspects of Microbially Induced Corrosion
’slime’ - which covers surfaces wetted by sea water thus constituting the first stage of the biofouling growth.[3, 41 The biofouling phenomenon is greatly affected by the geographic and climatic characteristics of plant locations and is influenced to a great extent by seasonal variations, especially in the matter of macrofouling development. The Mediterranean climate of the Italian coasts is particularly favourable for the growth of organisms, especially in southern regions, harbour-areas or similar sites that are characterised by low hydro- dynamics and waters rich in nutrients. Almost all the steam condensers of ENEL’s plants that are located on coasts, in fact, suffer from biofouling prob- lems on the water side of the tube bundle, and need periodical or continuous biocide treatments to control the phenomenon and to prevent algae and mussel shell growth which can lead to total or partial tube blockage. Steam condensers, pipes and other components operating with river water are much less affected by biofouling growth and do not require biocide treatments dur- ing the year, except for some special cases.
Biofilms cause marked changes in the physico-chemical characteristics of the surface of passivable metals, affecting their resistance to corrosion and act- ing as a growth substratum for macrofouling. The latter can also accelerate corrosion phenomena by creating differential aeration regions, sludges, occlusions and tubercles randomly distributed on the wet surface.
Another important negative phenomenon caused by the presence of foul- ing inside condenser tubes is the ensuing marked reduction in the water- steam heat exchange (Table l), affecting significantly the efficiency of the thermal cycle. [ 61
steam side water film 18%
steam side fouling
tube metal
I water side fouling I 33% I
8 %
2%
I I 39% water side film I In closed-loop cooling systems, anaerobic microbial corrosion mainly pre-
dominates with sulfide production. [ 1-51 This work gives a general picture of cases of the corrosion of condenser
tubes and of the costs (related to 1992), for ENEL, that can be associated with the ensuing damages. The systems adopted by ENEL to prevent microbial cor- rosion and fouling of pipes and heat-exchange equipment are also described.
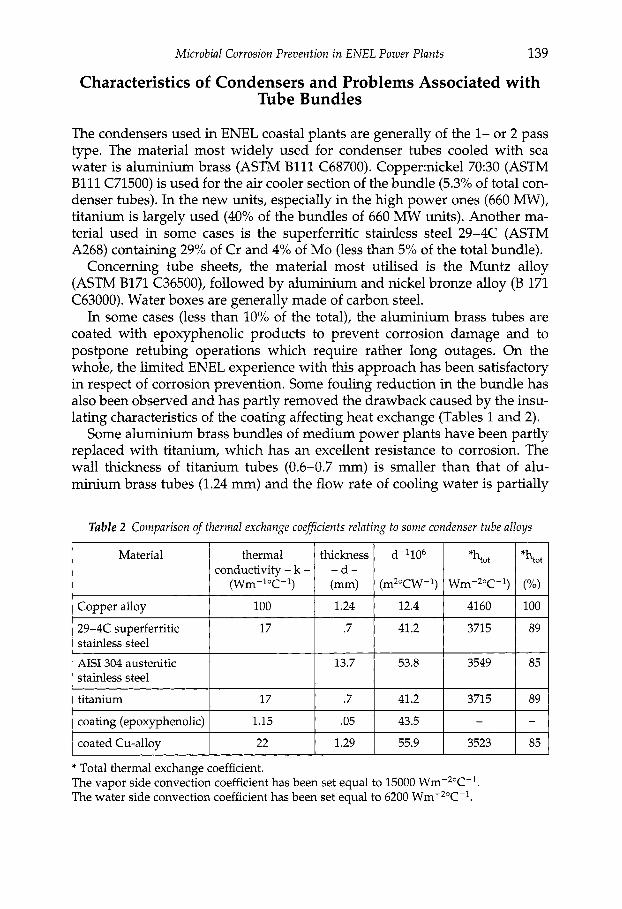
Microbial Corrosion Prevention in ENEL Power Plants 139
Characteristics of Condensers and Problems Associated with Tube Bundles
The condensers used in ENEL coastal plants are generally of the 1- or 2 pass type. The material most widely used for condenser tubes cooled with sea water is aluminium brass (ASTM B l l l C68700). Copper:nickel 70:30 (ASTM B l l l C71500) is used for the air cooler section of the bundle (5.3% of total con- denser tubes). In the new units, especially in the high power ones (660 MW), titanium is largely used (40% of the bundles of 660 MW units). Another ma- terial used in some cases is the superferritic stainless steel 29-4C (ASTM A268) containing 29% of Cr and 4% of Mo (less than 5% of the total bundle).
Concerning tube sheets, the material most utilised is the Muntz alloy (ASTM B171 C36500), followed by aluminium and nickel bronze alloy (B 171 C63000). Water boxes are generally made of carbon steel.
In some cases (less than 10% of the total), the aluminium brass tubes are coated with epoxyphenolic products to prevent corrosion damage and to postpone retubing operations which require rather long outages. On the whole, the limited ENEL experience with this approach has been satisfactory in respect of corrosion prevention. Some fouling reduction in the bundle has also been observed and has partly removed the drawback caused by the insu- lating characteristics of the coating affecting heat exchange (Tables 1 and 2).
Some aluminium brass bundles of medium power plants have been partly replaced with titanium, which has an excellent resistance to corrosion. The wall thickness of titanium tubes (0.6-0.7 mm) is smaller than that of alu- minium brass tubes (1.24 mm) and the flow rate of cooling water is partially
Table 2 Comparison of thermal exchange coefficients relating to some condenser tube alloys
* Total thermal exchange coefficient. The vapor side convection coefficient has been set equal to 15000 Wm-20C-1. The water side convection coefficient has been set equal to 6200 Wm-20C-1.

140 Aspects of Microbially Induced Corrosion
increased. This condition partially compensates for the reduction in heat ex- change due to the exchange coefficient of titanium, which is markedly smaller than that of copper alloys, as shown in Table 2.
Some problems associated with the use of titanium have been observed on the occasion of important retubings. Such problems include dealloying of tube sheets around the expanded zone and vibration on the edges of the bundle, where the steam velocity is higher. To make up for these drawbacks, proper measures, such as coating of the tube sheets or suitable cathodic protection systems and fastening and damping systems for the more stressed zones, have to be adopted.
Table 3 shows rough figures for the costs of some condenser tubes alloys and coatings. Recently, the interest in titanium has markedly increased be- cause of its improved availability and reduction in price.
Material of tube
aluminium brass
Table 3 Approximate costs (without assembly) of some condenser tubes and coating
$ per m
4
superferritic steel 29-4C
austenitic steel AIS1 304
I Cu-Ni70:30
5.6
4.3
I ~~
6.3
coating
High thickness coating of tube sheets
37 (per tube)
60,000 (per 320 MW unit condenser)
I titanium I 7.5 I
Superferritic stainless steel 20-4C presents the same advantages and draw- backs as titanium, but has a better behaviour against vibrations.
To solve corrosion problems due to galvanic coupling with materials of dif- ferent nobility, many tube sheets are coated with polymeric material and/or submitted to cathodic protection by impressed current or sacrificial anodes.
Corrosion Cases of Tube Bundles During Plant Operation
The problems observed during service mainly concern copper alloys used for condenser tubes cooled with fresh or sea water, despite the fact that these al- loys should display, from a thermodynamic point of view, a good resistance to corrosion in both environments and the fact that they are by far the most used materials in sea water cooled ENEL condensers.
The main results concerning 74 ENEL units built on sea coasts (Fig. 1) with a mean operating life of about 130,000 hours, have shown that the frequency of corrosion troubles is as follows:
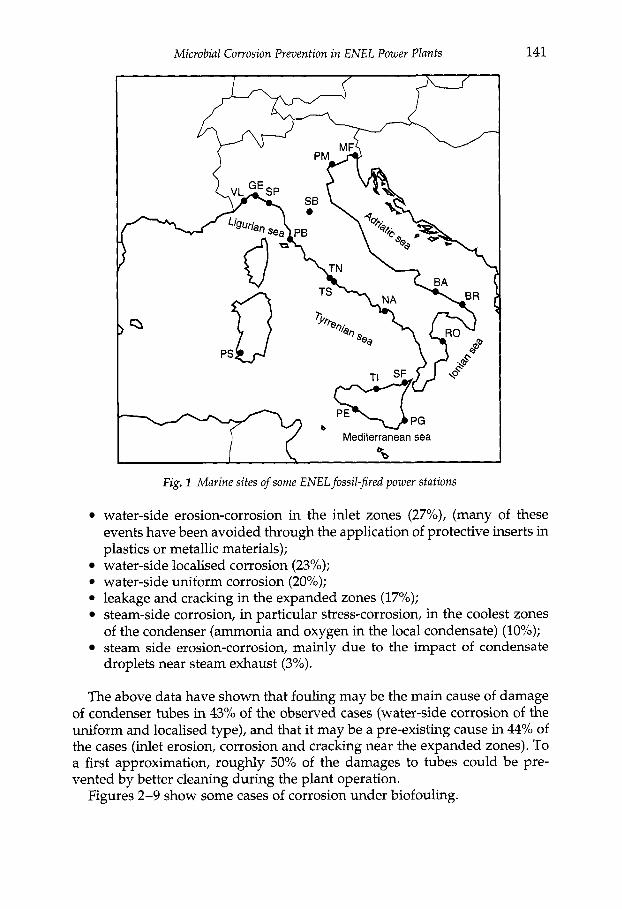
Microbial Corrosion Prevention in ENEL Power Plants 141
Fig. 1 Marine sites of some ENEL fossi1;fired power stations
water-side erosion-corrosion in the inlet zones (27%), (many of these events have been avoided through the application of protective inserts in plastics or metallic materials); water-side localised corrosion (23%); water-side uniform corrosion (20%); leakage and cracking in the expanded zones (17%); steam-side corrosion, in particular stress-corrosion, in the coolest zones of the condenser (ammonia and oxygen in the local condensate) (10%); steam side erosion-corrosion, mainly due to the impact of condensate droplets near steam exhaust (3%).
The above data have shown that fouling may be the main cause of damage of condenser tubes in 43% of the observed cases (water-side corrosion of the uniform and localised type), and that it may be a pre-existing cause in 44% of the cases (inlet erosion, corrosion and cracking near the expanded zones). To a first approximation, roughly 50% of the damages to tubes could be pre- vented by better cleaning during the plant operation.
Figures 2-9 show some cases of corrosion under biofouling.

142 Aspects of Microbially Induced Corrosion
Fig. 2 Photograph of an aluminium brass speciment cutfrom a condenser tube showing corrosion attack under marine biofouling
Fig. 3 Magnification of a zone of the specimen of Fig. 2

Microbial Corrosion Prevention in ENEL Power Plants 143
Fig. 4 Photograph of an aluminium brass specimen cutfrom a condenser tube showing d y marine mud fouling
Fig. 5 SEM micrograph of a section of the specimen of Fig. 4. Corrosion attack, under the mud, bored the tube

144 Aspects of Microbially Induced Corrosion
Fig. 6 Deposits on aluminium brass specimen cutfrom a condenser tube of a circulating cooling-water system
Fig. 7 Transversal section of the aluminium brass specimen of Fig. 6 showing the corrosion crater under deposit. Baumann print analyses pointed out that sulfides are present in the
dark layer on the bottom of the crater. 35X

Microbial Corrosion Prevention in ENEL Power Plants 145
Fig. 8 Corrosion nodules on the aluminium brass specimen cutfrom a condenser tube cooled with sea water. 1OOX
Fig. 9 Transversal section of the specimens of Fig. 8 showing the deposits consisting of layers of diflerent compositions. On the external surfdce, under biofilm (brown), there are a non-regular white film of calcium carbonate and a red film of iron compounds. In the crater
bottom, the white corrosion products are zinc and aluminium compounds; the light pink ones are copper crystals re-precipitated. 35x

146 Aspects of Microbially Induced Corrosion
Corrosion Prevention of Condenser Tubes
Cooling water treatment by adding ferrous salts, to prevent corrosion of alu- minium brass condenser tubes, is adopted on about half of total units on marine sites (and more for the 320 MW units). The treatment is usually done by dosing the ferrous salt (chloride or sulfate) at a concentration correspond- ing to 1mgL-l of iron, for 1 hour per day, close to the water boxes. After a planned outage (of which there is usually about 1 per year) the treatment in- volves a continuous dosage of the ferrous salt for few days. The protective oxyhydrate of iron, y-FeOOH film-grown on the internal tubes surface is compact and regular and persists in the cases where ‘in service’ mechanical cleaning (Taprogge-type systems) is operating. In fact, the spongy balls used in this procedure push-down the film onto the tube walls. The spongy balls by their mechanical action also reduce the biofilm growth. The result is that it can be quite difficult to separate the efficiency of the ferrous salt treatment on microbial corrosion prevention from the other concomitant events.
Damage Caused by the Imperfect Working of the Condenser
In fossil fuel plants, the worst damage caused by microbial corrosion is the failure of condenser tubes which can result in the pollution of condensate with sea water - which is particularly deleterious because of the introduction of chlorides. The EPRI guidelines [8] suggest maintaining the concentration of chlorides in the condensate below 3mgL-’. The chlorides may cause severe forms of corrosion (localised and uniform, hydrogen embrittlement, pitting) on the boiler tubes and, on passing into the vapour phase, they can precipitate on the turbine blades causing corrosion fatigue, stress-corrosion cracking and pitting. Also, the pollution of condensate with sulfates and other sea-water components contributes to the worsening corrosion phenomena in various other parts of the plant.
Some old or small size plants can be significantly affected by these prob- lems, since they are not provided with condensate treatment systems. On the other hand, in power plant provided with condensate treatment system, sea- water pollution of the condensate causes a premature exhaustion of the ion exchange resins of the mixed bed. In the case of medium and high size power plant working in AVT conditions (i.e. all volatile treatment: about 100 pgLP1 of hydrazine, 500 of NH,), only 20% of the condensate is purified dur- ing the normal service. In the case of excess of chloride, the condensate must be 100% treated through mixed beds. This involves a very quick exhaustion of exchanging resins (especially the cationic) and the need to increase the regen- eration frequency by 4-5 times (normally this is carried out about every 25 days). A regeneration operation costs about $1000 in chemical products, in- cluding that for waste-water treatment, takes about 12 hours and requires skilled personnel.

Microbial Corrosion Prevention in ENEL Power Plants 147
The damage caused by the corrosion of condenser tubes cannot be deter- mined easily, even if it results in high economical losses brought about by the long forced outage of the units, particularly if the boiler tubes or the turbine blades are also involved. Generally, the damage is limited to a few tubes only, which can be identified and plugged during the planned outage. The cost of these operations is quite low. On the contrary, if the phenomenon should be so widespread as to require the retubing of some parts of the condensers, the operations become expensive, because of manpower and, mainly, for the forced outage of the plant. An indicative figure of the costs for the retubing of a whole condenser of a 320 MW unit (-14 000 tubes), is roughly $500 000 and needs about 6-7 weeks of outage.
From the economic point of view, in addition to the above corrosion phenomena, it is important to stress that one of the more substantial troubles caused by fouling in the condenser tubes is the reduction of the thermal cycle efficiency. For example, in the case of a 320 MW fossil-fired unit, with steam condensers cooled by sea water and operating at full power load for 5000 hours per year, the yearly additional cost of fuel due to fouling is about $100000 i.e., assuming an increase of 10 kcal/kWh of the heat rate with roughly about half of this being attributable to tube fouling and the other half to ingress of air into the condenser.
Anti-Fouling Methods Adopted in Power Stations: Treatment During a Plant Outage
The cleaning operations of condensers are usually carried out on the occasion of planned outages. Usually, an annual mechanical or hydrodynamic cleaning of each unit is conducted.
Mechanical Cleaning
This operation requires the forced introduction of a brush into each condenser tube, followed by cleaning with pressurised industrial water to remove the broken deposits. In the past instead of brushes, rubber balls have also been used; these are coated with abrasive materials selected on the basis of the mechanical characteristics of the tubes. Scraping heads with increasing dia- meters (CONCO system), introduced in each tube and driven by pressurised water have also been used. ENEL has considerable experience of these tech- niques, which are effective for the removal of biofouling, but not always for calcareous deposits. The type and number of passes of the abrasive or scraping body depends on the type of fouling and the tube material. For in- stance, a carborundum coating (used in the case of fresh water cooling), is con- sidered as suitable for stainless steel tubes and removes particularly hard incipient deposits.

148 Aspects of Microbially Induced Corrosion
The approximate cost of the cleaning of the condenser of a 320 MW unit is $20 000.
Hydrodynamic Cleaning
In this case each condenser tube is cleaned using pressurised industrial water. This is the most widespread system in ENEL. Experience suggests its use also for particularly adhering and diffuse deposits. The operating parameters and the type of hose to be used depend on the type of deposit. Usually, a distinc- tion is made between three types of hydrodynamic cleaning as follows: 'low pressure', 'medium pressure' and 'high pressure'. Low pressure cleaning, used only for removing salt and slime, is carried out with an operating pres- sure less than 60 bar, water flow rate about 1 Ls-l, and a nozzle on the hose mouth. Medium pressure cleaning, suitable for well anchored scales and dis- continuous calcareous deposits, is carried out at pressures ranging from 200 to 400 bar and water flow rate of 1.8 Ls-l per tube.
High pressure cleaning is necessary for very consistent and diffuse cal- careous deposits, this operation must be carried out with an operating pres- sure greater than 600 bar, water flow rate equal to or greater than 2.8 Ls-l, rotatory or fixed head hose with automatic feed in both directions, and blow- ing of each tube with compressed air simultaneously with the hydrowashing phase at a speed which must not exceed 0.3 ms-l, and with a safety device to prevent tube perforation in case of blockage. On completion of the cleaning, each tube is dried.
The cost of a medium pressure hydrowashing of a condenser made up of about 14000 tubes (320 MW unit) is about $12000, while the cost of a high pressure hydrowashing is about twice as much.
Acid Cleaning
Acid cleaning, carried out using a circulating loop, is suitable when the tubes are scaled with predominantly thick calcareous deposits, which are very adherent and associated with organic substances and mud.
The following is a representative example of cleaning: industrial water at room temperature, acidified with 5 wt YO hydrochloric acid containing a cor- rosion inhibitor and reducing agent is circulated in the condenser, at a velocity in the tubes higher than 0.05 ms-l, up to the complete dissolution of the de- posits. Acid cleaning should not be used with coated tubes where the coating is partly damaged, because of the possible seepage of acids under the coating.
Acid cleaning of ENEL condensers is not a common practice, and is carried out only when the heat exchange shows an important reduction. The cost of an acid cleaning operation is about $25 000.

Microbial Corrosion Prevention in ENEL Power Plants 149
Drying of Surface Deposits
This operation uses the forced passage of air through the tubes until the de- posits are completely dry. The removal of the deposits is partly obtained by the air during drying and partly by the subsequent passage of cooling water. It is recommended for small thicknesses of slime deposits and biofilms.
Antifouling Methods Adopted in the Power Stations: Treatment in Service
Chemical Treatments
Almost all the coastal thermoelectric stations carry out biocide treatments to limit the growth of biofouling.
Sodium hypochlorite is the most used biocide in ENEL plants. It is pur- chased in concentrated solutions or it is produced, on site, by electrolysis of sea water.
Sodium hypochlorite, which is easy to use, has noticeable advantages as a biocide:
it is cheap, especially in the case of on-site production; it has a low environmental impact at the concentrations and modality employed (Table 4), which guarantee a chlorine concentration < 0.2 mgL-l at the discharge.
Table 4 provides some information on the methods of sodium hypochlorite dosage adopted by the various power stations; the lack of uniformity of the dosage parameters is due, on the one hand, to the variability of the character- istics of the cooling water in the different locations (temperature, pollution degree, prevailing biological species), and, on the other hand, to the experi- ence and practice acquired during the years.
In some cases, sodium hypochlorite has been substituted by chlorine dioxide. The main advantages of the use of chlorine dioxide are its high oxidising
power and bactericidal capacity, which are higher than those of sodium hypochlorite in sea water. These characteristics allow smaller amounts of chlorine dioxide to be used compared with hypochlorite, thus contributing to the very high safety margins required in respect of the maximum concen- tration allowed at the discharge. The main drawback of chlorine dioxide is its cost, which is higher than that of hypochlorite.
Table 5, for example, shows a comparison of two continuous antifouling treatments, with a 0.2 mgL-l concentration of C10, or HClO corresponding to a 0.8 mgL-l concentration of active chlorine, for a 320 M W unit, with a sea water flow rate of to 36 000 m3/h and a service of 7000 hours per year.
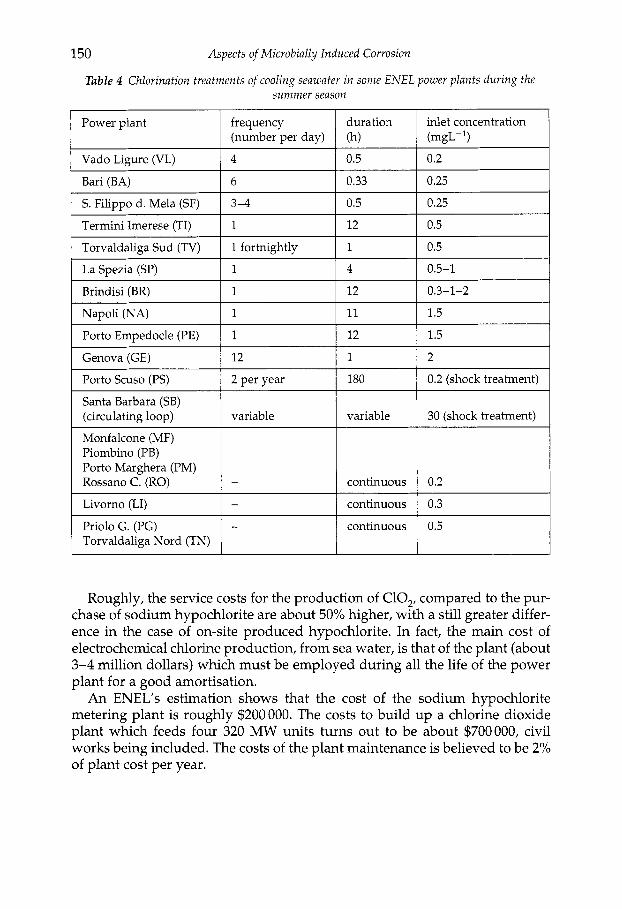
150 Aspects of Microbially Induced Corrosion
Table 4 Chlorination treatments of cooling seawater in some ENEL power plants during the summer season
frequency (number per day)
Power plant duration inlet concentration (h)
Vado Ligure (VL)
Bari (BA)
S. Filippo d. Mela (SF)
4 0.5 0.2
6 0.33 0.25
3-4 0.5 0.25
Termini Imerese (TI) 1 12 0.5
Torvaldaliga Sud (TV)
La Spezia (SP)
1 fortnightly 1 0.5
1 4 0.5-1
Santa Barbara (SB) (circulating loop)
Monfalcone (MF) Piombino (PB) Porto Marghera (PM) Rossano C. (RO)
Brindisi (BR)
Napoli (NA)
variable
1 12 0.3-1-2
1 11 1.5
variable
Porto Empedocle (PE)
Genova (GE)
Porto Scuso (PS)
- I continuous
1 12 1.5
12 1 2
2 per year 180 0.2 (shock treatment)
30 (shock treatment)
0.2
I Livorno (LI) l - I continuous 1 0.3 I Priolo G. (PG) Torvaldaliga Nord (TN)
continuous 0.5
Roughly, the service costs for the production of ClO,, compared to the pur- chase of sodium hypochlorite are about 50% higher, with a still greater differ- ence in the case of on-site produced hypochlorite. In fact, the main cost of electrochemical chlorine production, from sea water, is that of the plant (about 3-4 million dollars) which must be employed during all the life of the power plant for a good amortisation.
An ENEL’s estimation shows that the cost of the sodium hypochlorite metering plant is roughly $200000. The costs to build up a chlorine dioxide plant which feeds four 320 MW units turns out to be about $700000, civil works being included. The costs of the plant maintenance is believed to be 2% of plant cost per year.
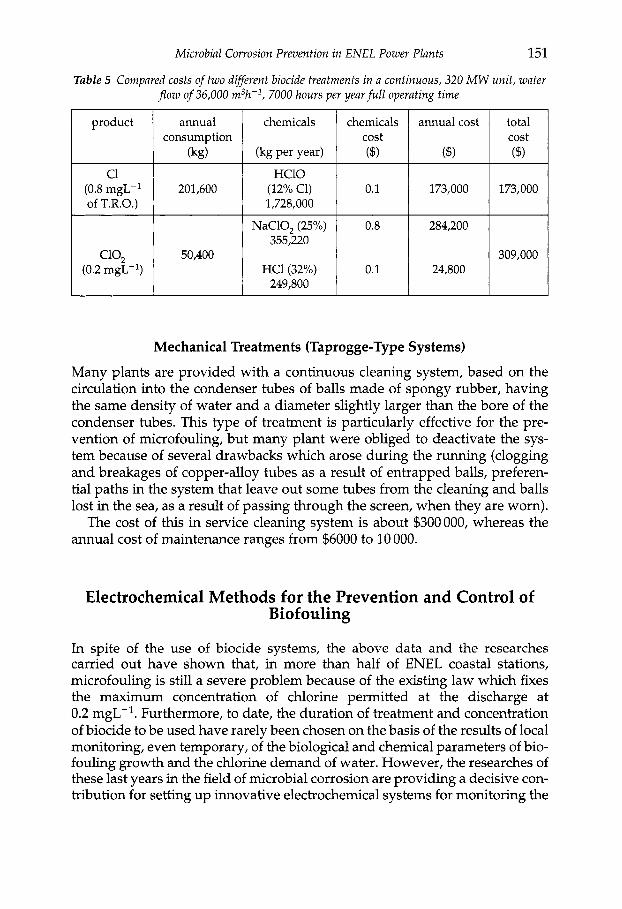
Microbial Corrosion Prevention in ENEL Power Plants 151
Table 5 Compared costs of two different biocide treatments in a continuous, 320 MW unit, water flow of 36,000 m3k-1, 7000 hours per yearfull operating time
product annual chemicals consumption
(kg) (kg per year) c1 HClO
(0.8 mgL-' 201,600 (12% C1) of T.R.O.) 1,728,000
NaC10, (25%) 355,220
c10, 50,400 (0.2 mgL-l) HC1 (32%)
249,800
chemicals annual cost total cost cost ($) ($) ($)
0.1 173,000 173,000
0.8 284,200
309,000 0.1 24,800
Mechanical Treatments (Taprogge-Type Systems)
Many plants are provided with a continuous cleaning system, based on the circulation into the condenser tubes of balls made of spongy rubber, having the same density of water and a diameter slightly larger than the bore of the condenser tubes. This type of treatment is particularly effective for the pre- vention of microfouling, but many plant were obliged to deactivate the sys- tem because of several drawbacks which arose during the running (clogging and breakages of copper-alloy tubes as a result of entrapped balls, preferen- tial paths in the system that leave out some tubes from the cleaning and balls lost in the sea, as a result of passing through the screen, when they are worn).
The cost of this in service cleaning system is about $300000, whereas the annual cost of maintenance ranges from $6000 to 10 000.
Electrochemical Methods for the Prevention and Control of Biof ouling
In spite of the use of biocide systems, the above data and the researches carried out have shown that, in more than half of ENEL coastal stations, microfouling is still a severe problem because of the existing law which fixes the maximum concentration of chlorine permitted at the discharge at 0.2 mgL-l. Furthermore, to date, the duration of treatment and concentration of biocide to be used have rarely been chosen on the basis of the results of local monitoring, even temporary, of the biological and chemical parameters of bio- fouling growth and the chlorine demand of water. However, the researches of these last years in the field of microbial corrosion are providing a decisive con- tribution for setting up innovative electrochemical systems for monitoring the

152 Aspects of Microbially Induced Corrosion
microbiofouling growth on the surface of metal tubes.[9,10] The main advan- tage of these devices, some of which are already available on the market, is that they are easy to manage, so that their use does not require personnel skilled in the biological or chemical field. These systems use probes inserted in a suitable way in the cooling circuits and permit the evaluation of the corrosion processes sustained by the bacterial growth at the metal-biofilm interface, through the continuous measurement of some electrochemical par- ameters (current density, potential difference, impedance, potential noise, polarisation resistance). It has been recently proved that the variation of these parameters is directly associated with the growth of the biofilm at the metal- sea water interface.
Besides the degree of fouling of tubes, for an effective monitoring of treat- ments based on oxidising agents, it is important to evaluate also their concen- tration, which changes, for example, according to the chlorine demand of water and contact time.
Thus, ENEL has recently set up innovative electrochemical probes [ll, 121 which through the monitoring of the biofilm growth also allow the changes in water TRO (total residual oxidant) during biocide treatments to be evaluat- ed - as shown in Fig. 10. The working electrode of the probe is polarised in order to obtain electrode potential values correlated to TRO and/or biofilm growth.
The advantages that are expected to arise from the introduction of such devices in all the plants that suffer from biofouling problems may be sum- marised as follows:
1. Possibility of estimating in real time the biofouling growth on the con-
2. Possibility of defining in real time the amount of sodium hypochlorite denser tubes.
-El - T.R.0
2 Fig. 10 Schematic view of ENEL electrochemical monitoring system described in Rq. 11

Microbial Corrosion Prevention in ENEL Power Plants 153
(or other oxidising agents) to be used to obtain an effective concentration of TRO in the cooling water, without the need of carrying out continuous laboratory analyses for determining the chlorine demand and its con- centration, and avoiding the use of other instruments which require care- ful and frequent maintenance.
3. Optimisation of the consumption of sodium hypochlorite (or other oxi- dising agents), with respect to the concentration and duration of the treatments necessary for the completion of the cleaning.
At present, the system is being tested at the Vado Ligure power station, according to the installation shown in Fig. 10. Figure 11 shows the behaviour of a test application of microbiofouling growth monitoring. The tests carried out, for instance, pointed out the existence of a wide margin in the optimis- ation of biocide treatments. In winter, the monitoring has shown the possi- bility of saving biocide, while in summer the concentration as well as the treatment frequency should be increased, within the limits allowed by the law.
Fig. 11 Behaviour of the ENEL electrochemical probe signal during the chlorination treatments at Vado Ligure power plant
Conclusions
An approximate estimate of the damages and costs concerning steam con- densers cooled with sea water of ENEL’s power plants shows that microbial corrosion and fouling phenomena cost tens of millions dollars per year. The overall cost can be subdivided into the following items:

154 Aspects of Microbially Induced Corrosion
Costs Associated with the Condenser Performance
reduction in the efficiency of the thermal cycle; unplanned outages of the units (occasional); corrosion of the condenser tubes; corrosions and damages of other plant components as consequence of the condensate pollution with chlorides and other chemical species (this observation applies mainly to power plants without condensate polish-
need of regenerating more frequently the mixed beds when the conden- ing);
sate is polluted by sea water;
Cost of Biofouling Growth Prevention and Cleaning
biocide products; cleaning of the condenser bundles during the planned outages of the
purchase of the production and/or dosage plants of the biocide; purchase of the in-service cleaning plants; management and maintenance of the plants and control systems.
units;
On-line monitoring probes of biocide treatments implemented by ENEL, based on the evaluation of the microbial corrosion processes occurring at the metal-biofilm interphase, are a valid tool to control and optimise the con- sumption of biocide with respect to the treatment period and concentration strictly necessary to prevent the development of biofouling.
Acknowledgements
The authors are very grateful to Dr Jos6 Scarano and Mr Sandro Doria for their useful contributions on the general and metallographic aspects of corrosion of steam-condenser tubes cooled with sea water.
References
1. ’EPRI CS-5495’, Final report of Microbial Corrosion in Fossil-Fired Power Plants, New York, November 1987.
2. ‘EPRI ER-6345’, proceedings of Microbial Corrosion: 1988 Workshop, San Jose (CA), April 1989.
3. Biologically Induced Corrosion, S.C. Dexter ed., NACE-8, Houston, 1986. 4. G. Characklis and K.C. Marshall: Biofilm, John Wiley & Sons, New York,
1990.
Microbial Corrosion Prevention in ENEL Power Plants 155
5.
6.
7.
8.
9. 10.
11. 12.
A.K. Tiller: Microbial corrosion-1, C.A.A. Sequeira and A.K. Tiller eds, Elsevier Applied Science, London, 1988,3-9. Kingo Chu and Fujiaki Mokhizuki: ‘EPRI CS-4339’, Proceedings of Condenser Biofouling Control: The State of The Ar t , Menlo Park, CA, April 1985. R. Maurer: ’Development and Application of New High Technology Stainless Alloys for Marine Exposure’, Proceedings of Advanced Stainless Steel for Sea Water Application, University of Piacenza, 1980. ’EPRI CS-4629’, Final report of Interim Consensus Guidelines on fossil Plant Cycle Chemistry, Chicago, June 1986. F. Mansfeld and B. Little: Corros. Sci., 1991, 32,247. A. Mollica, E. Traverso and G. Ventura: ’Marine corrosion of stainless steels: Chlorination and microbial effects’, European Federation of Corrosion Publications No. IO, The Institute of Materials, London, 1992,
P. Cristiani: ENEL report in progress. A. Mollica, G. Ventura, E. Andrei, P. Cristiani and G. Rocchini: ’Simple electrochemical devices for biofilm monitoring on stainless steels in sea water’, Session V, Extended abstracts, Eurocorr’96, 24-26 September, Nice, France, 1996.
149 -160.

ASTM ATP AVT CLSM EDXA ENEL EHD EIS EN HPLC ICMM LPR MIC OCP PRE RDE SCE SEM SRB SVET TRB TRO
Abbreviations used in the text
American Society for Testing and Materials Adenosine triphosphate All Volatile Treatment Confocal Laser Scanning Microscope Energy Dispersive X-ray Analysis Ente Nazionale per l'Energia Elettrica Electrohydrodynamical Impedance Electrochemical Impedance Spectroscopy Electrochemical Noise High Pressure Liquid Chromatography Istituto per la Corrosione Marina dei Metalli Linear Polarisation Resistance Microbially Influenced Corrosion Open Circuit Potential Pitting Resistance Equivalent Rolating Disc Electrode Saturated Calomel Electrode Scanning Election Microscope Sulfate Reducing Bacteria Scanning Vibrating Electrode Technique Thiosulfate Reducing Bacteria Total Residual Oxidant

This page has been reformatted by Knovel to provide easier navigation.
INDEX
Index Terms Links
A adsorption
of bacteria to substrate 130
a.c. impedance
see Electrochemical Impedance
Spectroscopy
aluminium brass condenser tubes
coated with epoxyphenolic 139
and MIC 139
corrosion prevented by ferrous salts 146
anti fouling in power stations
during outage 147
in service 149
mechanical treatment for
by Taprogge system 151
ATP measurements
see luminometric analysis
B bacteria
see also phenons, sulfate reducing, thiosulfate reducing etc
types:
Desulfacinum infernum 5
Desulfotomaculum genus 28
Desulfotomaculum halophilum 5
Desulfotomaculum kuznetsovii 5
Desulfomicrobium aspheronum 5

This page has been reformatted by Knovel to provide easier navigation.
Index Terms Links
bacteria (cont.)
see also phenons, sulfate reducing, thiosulfate reducing etc
types: (cont.)
Desulfovibrio bastinii 5
Desulfovibrio caledoniensis 5
Desulfovibrio desulfuricans 3
Desulfovibrio gabonesis 5
Desulfovibrio gracilis 5
Desulfovibrio longus 5
Desulfovibrio tubi 5
Dethiosulfovibrio peptidovarans 5 7 28
Haloanaerobium congolense 6
Spirochaeta smaragdinae 7
Thermoanaerobacter brockii subsp. lactiethylicus 7
Thermodesulforhabdus norvegicus 5
Thermotoga alcaliphila 7
Thermotoga elfii 7
Thermotoga hypogea 7
bacterial count
on mesocosm specimens 117
bactopeptone
as C source for bacteria 28
Baltic sea water
nature of 114
used in mesocosm ecosystem 113
biocide treatment 26 31 149
see also chlorination
biofilms
see also biofouling
adhesion on SS 41
characterisation of, by mass transport analysis 65
determination of thickness of 71
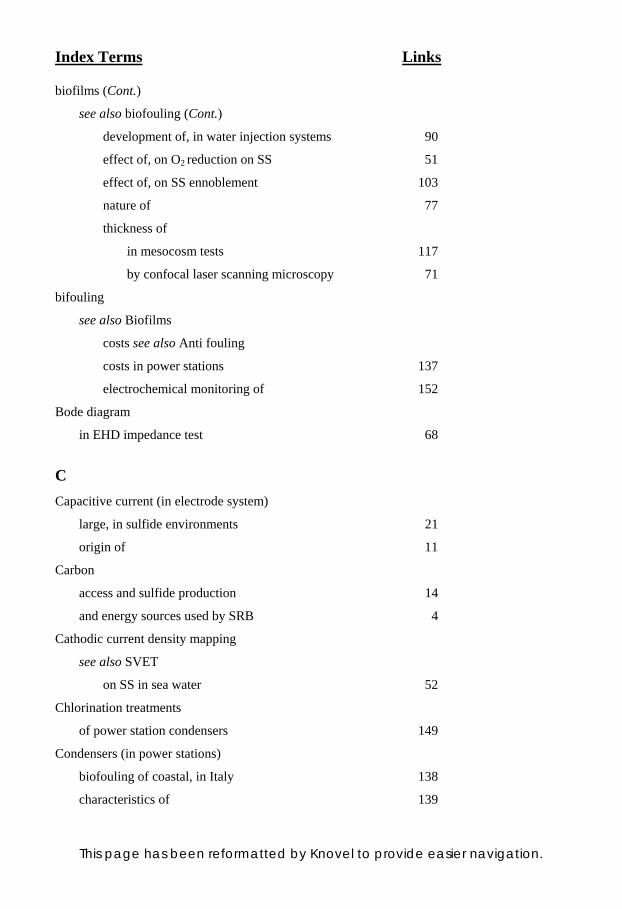
This page has been reformatted by Knovel to provide easier navigation.
Index Terms Links
biofilms (Cont.)
see also biofouling (Cont.)
development of, in water injection systems 90
effect of, on O2 reduction on SS 51
effect of, on SS ennoblement 103
nature of 77
thickness of
in mesocosm tests 117
by confocal laser scanning microscopy 71
bifouling
see also Biofilms
costs see also Anti fouling
costs in power stations 137
electrochemical monitoring of 152
Bode diagram
in EHD impedance test 68
C Capacitive current (in electrode system)
large, in sulfide environments 21
origin of 11
Carbon
access and sulfide production 14
and energy sources used by SRB 4
Cathodic current density mapping
see also SVET
on SS in sea water 52
Chlorination treatments
of power station condensers 149
Condensers (in power stations)
biofouling of coastal, in Italy 138
characteristics of 139
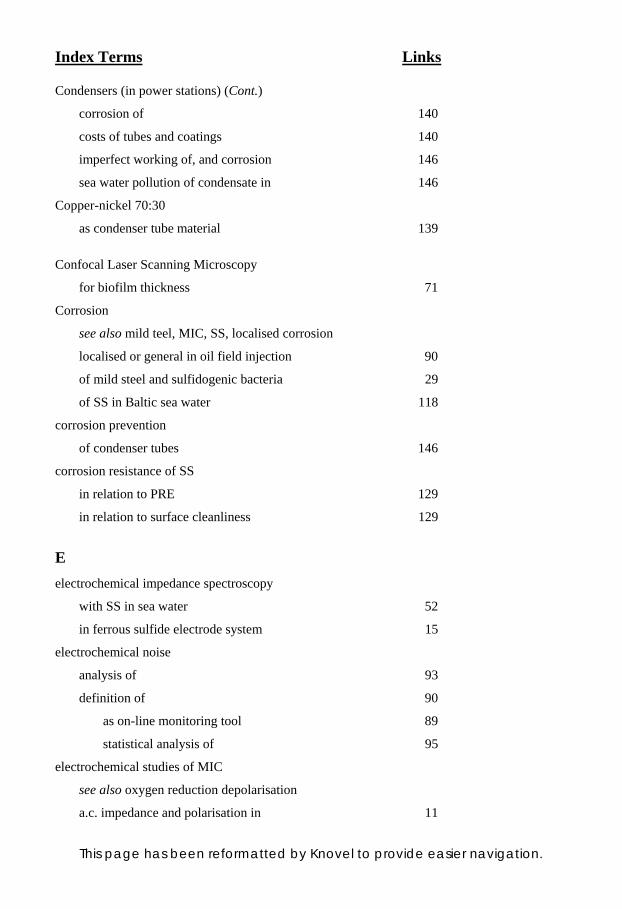
This page has been reformatted by Knovel to provide easier navigation.
Index Terms Links
Condensers (in power stations) (Cont.)
corrosion of 140
costs of tubes and coatings 140
imperfect working of, and corrosion 146
sea water pollution of condensate in 146
Copper-nickel 70:30
as condenser tube material 139
Confocal Laser Scanning Microscopy
for biofilm thickness 71
Corrosion
see also mild teel, MIC, SS, localised corrosion
localised or general in oil field injection 90
of mild steel and sulfidogenic bacteria 29
of SS in Baltic sea water 118
corrosion prevention
of condenser tubes 146
corrosion resistance of SS
in relation to PRE 129
in relation to surface cleanliness 129
E electrochemical impedance spectroscopy
with SS in sea water 52
in ferrous sulfide electrode system 15
electrochemical noise
analysis of 93
definition of 90
as on-line monitoring tool 89
statistical analysis of 95
electrochemical studies of MIC
see also oxygen reduction depolarisation
a.c. impedance and polarisation in 11
This page has been reformatted by Knovel to provide easier navigation.
Index Terms Links
electrochemical studies of MIC (Cont.)
cell for 27
ferrous sulfide electrode 15
electrohydrodynamical impedance 67
energy dispersive X-ray analysis
of rust 81
of SS surface after sea water test 115
of SS surface from mesocosm test 120
ennoblement of SS
effect of flow on 116
effect of temperature on 103
and marine biofilm 41
mechanism of 110
in Robbins device 116
enzymatic studies
of bacteria on SS at 20°C 108
epifluorescence
microscopy of biofilm 116
of SS for biofilm settlement 107
exopolymeric substances
in biofilms on SS 106
extracellular polymeric substances
and corrosion potentials 45
enzymes, on SS 62
as key factor in biocorrosion 41
protein contents of 47
F ferrous salts
to prevent corrosion of condenser tubes 146
ferrous sulfide
electrochemical behaviour of 15
This page has been reformatted by Knovel to provide easier navigation.
Index Terms Links
flow rate
effect of, on electrochemical behaviour of SS 116
fouling
see also biofouling
and damage of condenser tubes 141
G galvanic current
and localised corrosion 25
glucose oxidase
and ennoblement of SS 108
glutaraldehyde
as biocide 26 31
ground water
biofilms on mild steel and SS in 78
H heat exchange
affected by fouling 147
hydrogen peroxide
and ennoblement of SS 109
hydrogenase enzymes
and sulfide production 14
L laboratory ecosystem
to produce biofilms on SS 114
lactate, as energy source for SRB 14 29
light
effect of, in corrosion test 115
linear polarisation resistance
mild steel in sea water injection 93
This page has been reformatted by Knovel to provide easier navigation.
Index Terms Links
localisation coefficient
definition of 94
luminometric analysis
of biofilms 116
M marine biofilm
and corrosion of SS 41
mass transport analysis
for biofilm characterisation 65
MAST II contract
and biofilms on S.S. 42 46
maximum entropy method
for assessing corrosion type 89
for spectral analysis of noise data 98
mesocosm
see model ecosystem
microbially influenced corrosion
see also mild steel, SS
bacteria and corrosion product indication of 78
of carbon steel by SRB 11
of carbon steel, risk factor in 25
in power station condensers 137
and reservoir souring 4
of undersea oil pipeline 5
mild steel
biofilm on, in ground water 78
biofilm on, in sea water injection 91
localised corrosion of, and bacteria 29
potential of, in presence of SRB 29
potential of, in presence of TRB 32
This page has been reformatted by Knovel to provide easier navigation.
Index Terms Links
model ecosystem 113
N noise
see Electrochemical noise analysis
numerical taxonomy
and bacteria on SS 107
nutrients
effect of, on biofilms 117
effect of, on corrosion rates 120
O open circuit potential
see potential-time behaviour
oxygen reduction depolarisation
and biofilms on SS 41 51
effect of Na azide on active sites for 61
kinetics, fast and slow on SS 54
model for 54
preferential sites for 56
P peptides
as nutrient sources 7
phenons (isolated bacterial genus or species)
growth on specific substrates 107
polarisation curves
of SS in 3% NaCl 126
cathodic, of SS in sea water 52
polarisation, oxygen reduction and EPS on SS 41
potential hysteresis
effect of scan rate on 18
in polarisation curves 15

This page has been reformatted by Knovel to provide easier navigation.
Index Terms Links
potential-time curves
effect of glucose on, in sea water 105
of SS in lake water, river water 127
of SS in sea water 44 108 116
potentiostatic cathodic polarisation
of SS in sea water 52
power stations and MIC 137
R radioactive tracer analysis and SRB turnover 13
reactor, biological
use of rotating drum 12
reservoir souring (oilfield) and SRB 4
resistance noise coefficient
compared with LPR measurement 97
definition of 93
Robbins device
for electrochemical measurement 115
S scanning vibrating electrode technique and SS in sea water 52
sea water
see also Baltic sea water
analysis of in tests 115
biofilm on SS in 41 51
corrosion of SS in 44
hydrological parameters of European 44
injection into oilfield reservoirs 90
SRB and sulfide production in artificial 13
scanning electron microscope studies
of biofilm in EHD tests 71
of biofilm on mild steel and SS 80
This page has been reformatted by Knovel to provide easier navigation.
Index Terms Links
scanning electron microscope studies (Cont.)
of iron after exposure to SRB 22
of SS after exposure to sea water 115
SIRIUS test loop 104
slime
see biofilm
stainless steels
alloying constituents in, effect on MIC 129
biofilms on, in ground water 78
biofilms on, in sea water 41 51 103
ennoblement, mechanism of 110
potential changes with temperature 105
types (as referred to in text)
NO8904 biofilms on, in mecocosm 113
SAF2507 biofilm on, and ennoblement of 104
S30400 biofilm on, in mecosocm 113
S31600 biofilm on, in mecososm 113
S31254 biofilm on, in mecocosm 113
URSB8 biofilm on, and ennoblement of 44
29–4C as condenser tube material 139
254SMO biofilm on, and ennoblement of 104
304 MIC of in lake water 127
MIC of in river water 127
316 MIC of in lake water 127
MIC of in river water 127
biofilm on, and ennoblement of 104
316Ti MIC of, in lake water 127
MIC of, in river water 127
304L MIC of, in ground water 78
316L MIC of, in ground water 78
654SMO biofilm on, and ennoblement of 104
1.4462 chemical composition of 126

This page has been reformatted by Knovel to provide easier navigation.
Index Terms Links
stainless steels (Cont.)
types (as referred to in text) (Cont.)
MIC of, in lake and river water 127
1.4539 chemical composition of 126
MIC of, in lake and river water 127
2.4856 chemical composition of 126
MIC of, in lake and river water 127
sulfate turnover (SRB activity)
by radiotracer analysis 12
sulfidogenic bacteria
and MIC, reviewed 1
surface condition, of metal
effect on MIC of SS 125
T Taprogge system
for cleaning condensers 151
thiosulfate reducing bacteria
effects on potentials of mild steel 32
in oilfields 7
reviewed 5
tracers
see also Radioactive tracer analysis
for biofilm thickness on RDE, ferricyamide and oxygen as 70
water used in MIC tests
see also sea water
Baltic sea 114
Lake Constance 127
River Rhine 127

This page has been reformatted by Knovel to provide easier navigation.
Index Terms Links
W wavelets spectral analysis
description of 94
of noise transients 98