aspects of magnetosphere–ionosphere coupling in … · · 2018-01-23in this study we document...
TRANSCRIPT
Ann. Geophys., 32, 1277–1291, 2014www.ann-geophys.net/32/1277/2014/doi:10.5194/angeo-32-1277-2014© Author(s) 2014. CC Attribution 3.0 License.
Aspects of magnetosphere–ionosphere coupling in sawtoothsubstorms: a case study
P. E. Sandholt1 and C. J. Farrugia2
1Department of Physics, University of Oslo, Oslo, Norway2Space Science Center, University of New Hampshire, Durham, USA
Correspondence to:P. E. Sandholt ([email protected])
Received: 26 November 2013 – Revised: 10 September 2014 – Accepted: 15 September 2014 – Published: 20 October 2014
Abstract. In a case study we report on repetitive substormactivity during storm time which was excited during Earthpassage of an interplanetary coronal mass ejection (ICME)on 18 August 2003. Applying a combination of magneto-sphere and ground observations during a favourable multi-spacecraft configuration in the plasma sheet (GOES-10 atgeostationary altitude) and in the tail lobes (Geotail andCluster-1), we monitor the temporal–spatial evolution of ba-sic elements of the substorm current system. Emphasis isplaced on activations of the large-scale substorm currentwedge (SCW), spanning the 21:00–03:00 MLT sector of thenear-Earth plasma sheet (GOES-10 data during the inter-val 06:00–12:00 UT), and magnetic perturbations in the taillobes in relation to ground observations of auroral electro-jets and convection in the polar cap ionosphere. The jointground–satellite observations are interpreted in terms of se-quential intensifications and expansions of the outer and in-ner current loops of the SCW and their respective associ-ations with the westward electrojet centred near midnight(24:00 MLT) and the eastward electrojet observed at 14:00–15:00 MLT. Combined magnetic field observations across thetail lobe from Cluster and Geotail allow us to make estimatesof enhancements of the cross-polar-cap potential (CPCP)amounting to≈ 30–60 kV (lower limits), corresponding tomonotonic increases of the PCN index by 1.5 to 3 mV m−1
from inductive electric field coupling in the magnetosphere–ionosphere (M–I) system during the initial transient phase ofthe substorm expansion.
Keywords. Magnetospheric physics (magnetosphere–ionosphere interactions)
1 Introduction
Depending on solar wind conditions, magnetospheric sub-storms may appear in different variants. Such are the “clas-sical” isolated substorms (with fully developed growth–expansion–recovery phases; seeAkasofu, 1964); double (ormultiple)-onset substorms (major, full-scale onset precededby pseudo-breakup; see e.g.Koskinen et al., 1993; Pulkkinenet al., 1998, andKullen et al., 2009); and repetitive, largesubstorms during storm times, sometimes referred to as saw-tooth events (Henderson et al., 2006). A standard definitionof “classical” substorms includes typical signatures such as(i) a plasma injection at geostationary altitude (6.6RE), (ii) adipolarization of the inner-magnetotail magnetic field, and(iii) a rapid enhancement and poleward expansion (Friedrichet al., 2001) of the westward electrojet (WEJ) in the auroralionosphere (Pulkkinen et al., 2007). Pseudo-breakups consistof a brief brightening event with small spatial extent. In suchcases, the magnetospheric source, i.e. the current disruption(CD) process in the near-Earth plasma sheet (PS), does notexpand into a global, “classical” substorm (Nakamura et al.,1992; Kozelova et al., 1992). Thus this variant has been de-scribed as the smallest type of a substorm (e.g.Nakamuraet al., 1994; Aikio et al., 1999). According toLui (2000) “asubstorm follows when the global condition is favourable, sothat a local activity may trigger a system-wide activity whichwe call a substorm.” This scenario is consistent with the de-scription ofCowley (1992), who concluded that substormsare basically a two-step process, consisting of dipolarizationnear the inner edge of the plasma sheet (∼ 5–15RE) followedby near-Earth (25–30RE) tail reconnection.
In this study we document the detailed temporal structureof the magnetic field events (magnetic field dipolarizations)
Published by Copernicus Publications on behalf of the European Geosciences Union.

1278 P. E. Sandholt and C. J. Farrugia: Aspects of M–I coupling in sawtooth substorms
appearing in the near-Earth PS, at geosynchronous altitude,and in the tail lobes, as well as central features of the associ-ated magnetosphere–ionosphere (M–I) coupling during saw-tooth substorms (whose characteristic phenomena are givenbelow). The observations will be discussed in the contextof a model of M–I coupling consisting of three basic ele-ments: (i) activation of the substorm current wedge (SCW;seeMcPherron et al., 1973) with re-routing of part of thecross-tail current (CTC) via Birkeland currents to the WEJin the ionosphere (auroral oval around midnight); (ii) a sys-tem of Bostrøm type II current sheets (Bostrøm, 1964) con-necting the partial ring current (PRC)–PS inner boundary andthe auroral oval south, maximizing at dusk and dawn; and(iii) coupling of an enhanced electric field from the tail lobes(ETL enhancement as a result of magnetotail reconnection;see e.g.Sauvaud et al., 2012) to the polar cap (PC) iono-sphere, giving rise to PC convection enhancements.
Current system (i) (SCW) may be activated by a cur-rent disruption (CD) in the near-Earth (7–10RE) plasmasheet (Lui, 1991). Current system (ii), i.e., Bostrøm type II,can be activated by plasma inflow from the CD region (Luiand Murphree, 1998), resulting in a plasma injection dynamo(E · J < 0) associated with plasma flow braking at the inneredge of the PS (Birn and Hesse, 2013). M–I coupling chan-nel (iii) from the tail lobe to the polar cap is activated by theETL enhancement associated with reconnection of tail lobeflux at the near-Earth neutral line (NENL), as recently doc-umented bySauvaud et al.(2012). At present there are stillunresolved questions on the temporal evolution of these M–Icoupling processes taking place during substorms (see e.g.Sergeev et al., 2012; Sauvaud et al., 2012; Akasofu, 2013).
In this paper we combine ground–satellite data to shedlight on this issue. The data we selected for this study wereobtained during a 7 h long interval of continuously high solarwind forcing (interplanetary coronal mass ejection (ICME)passage at Earth on 18 August 2003) which gave rise tothree consecutive sawtooth substorms recurring at 2 h and15 min intervals. Process (i) was monitored by GOES-10observations of magnetic field dipolarizations in the 20:00–03:00 MLT (magnetic local time) sector in combination withWEJ activity inferred from Alaska chain magnetometer datain the 19:00–01:00 MLT sector. Activation of coupling chan-nel (ii) is monitored by the associated eastward electrojet(EEJ) current in the postnoon-to-dusk sector by IMAGEchain (Scandinavia–Finland) magnetograms. Coupling chan-nel (iii) is followed by the PCN index (Troshichev et al.,2000). Thus, an important aspect of this study is the exci-tation and temporal evolution of PC convection during themulti-phase evolution of the three consecutive sawtooth sub-storms appearing in our selected interval. The roles of in-ductive and potential fields in these M–I coupling events isa topic of current investigation (see e.g.Katus et al., 2013)which we will address in the present case study.
Sawtooth substorms, which may occur primarily dur-ing geomagnetic storms (seeNoah and Burke, 2014), are
characterized by (i) magnetic field stretching accompaniedby a gradual decrease of the energetic particle flux at geosyn-chronous altitude, followed by (ii) magnetic field dipolar/-ization and rapid increase of the energetic particle flux (par-ticle injection in the dusk-to-midnight sector), (iii) a local-ized auroral onset in the pre-midnight sector which occurs onthe equatorward branch of a thinned double-oval configura-tion, (iv) auroral zone negativeH bays and middle- and low-latitude positiveH bays, (v) Pi2 pulsations, and (vi) widesubstorm-like current wedges (seeHenderson et al., 2006,and references therein).
There has been some discussion on the peculiarities ofsawtooth substorms (e.g. the repetition period between 2 and4 h; the abnormally large spatial extent; and only partial re-covery of WEJ activity between events, as measured by theAL (WEJ index)), i.e. whether they represent a distinct classof magnetospheric activity or not. According toPulkkinenet al.(2007), sawtooth events have auroral and inner magne-tosphere characteristics that are quite similar to those foundgenerally during storm-time activity. Hence they concludethat sawtooth events do not represent a specific class of activ-ity. In this view, sawtooth events constitute rather a subset oflarge, recurrent substorms driven by long-lasting high solarwind forcing. According toTroshichev and Janzhura(2009),“the classical development of the substorm, put forward byAkasofu(1964) for isolated substorms, is not workable in thecases of sawtooth disturbances, when powerful solar windenergy pumping into the magnetosphere provides a perma-nent powerful aurora particle precipitation into the auroralzone.” They find that the close relationship between particleinjection at geostationary orbit and auroral onset documentedin “classical substorms” is broken in the powerful sawtoothsubstorms. They note, however, that this “inconsistency” canbe affected by the local time differences between the auroralbrightening location (or the ground station that contributes tothe “AL onset”) and the location of the spacecraft that seesthe injection. Related to this we note that, when we studyM–I coupling during sawtooth substorms, we combine obser-vations from geostationary altitude (GEOS-10 satellite) andground magnetic data (WEJ activity) from stations in Alaska.In our case the observations relating to the magnetosphericand ionospheric levels are separated by only 2 h in MLT. (Inthe interval we study, GOES and Alaska are moving withthe Earth through the MLT sectors 21:00–03:00 and 19:00–01:00, respectively, i.e. both cover 6 h of nightside MLTs.)
In a recent study we documented the activation ofmagnetospheric current systems (Bostrøm types I and II;seeBostrøm, 1964, 1967) with associated auroral electro-jet events on both sides of the Harang reversal boundary atdusk during the ICME passage at Earth on 18 August 2003substorms (Sandholt et al., 2014) (hereafter referred to as Pa-per 1). The WEJ was observed to expand repeatedly into the17:00–18:00 MLT sector during substorm activations. Theseobservations of dusk signatures are consistent with previ-ous reports on the abnormally large MLT extent of sawtooth
Ann. Geophys., 32, 1277–1291, 2014 www.ann-geophys.net/32/1277/2014/
P. E. Sandholt and C. J. Farrugia: Aspects of M–I coupling in sawtooth substorms 1279
substorms (Henderson et al., 2006; Troshichev and Janzhura,2009).
In the present study we find that three consecutive saw-tooth events on this same day are double-onset substormswith a corresponding two-step M–I coupling sequence con-sisting of (i) an initial dipolarization with correspondingpseudo-breakup of the WEJ and weak PC convection (PCN,polar cap north index) response (see alsoKullen et al., 2010),followed by (ii) a subsequent major onset of the WEJ anda major PC convection response. Each of these three two-step onsets are preceded by an interval of field stretching andgradual energetic particle decrease in the near-Earth PS, asexpected for sawtooth events. The further implications thatfollow from these observations on the detailed evolution ofM–I coupling processes across the auroral oval and the polarcap during these sawtooth substorms will be discussed.
From the available data we obtain information on thechronology of the M–I coupling processes such as (i) the PSCD (dipolarization) events and activations of the substormcurrent wedge (SCW) from GOES-10 data and Alaska chainmagnetometer data, (ii) plasma injections to the PRC (SYM-H dips; see Paper 1), and (iii) the evolution of the tail lobe topolar cap coupling from the combination of Cluster-1 mag-netic field perturbations and the PCN index. With this ap-proach we want to investigate the possible role of inductiveelectric fields in M–I coupling during sawtooth substormsconsidering the spatial–temporal evolution of substorm cur-rent loops with auroral electrojet manifestations at midnight(Alaska chain) and near 15:00 MLT (IMAGE chain in theSvalbard–Scandinavia–Finland region).
2 Conceptual model of M–I coupling
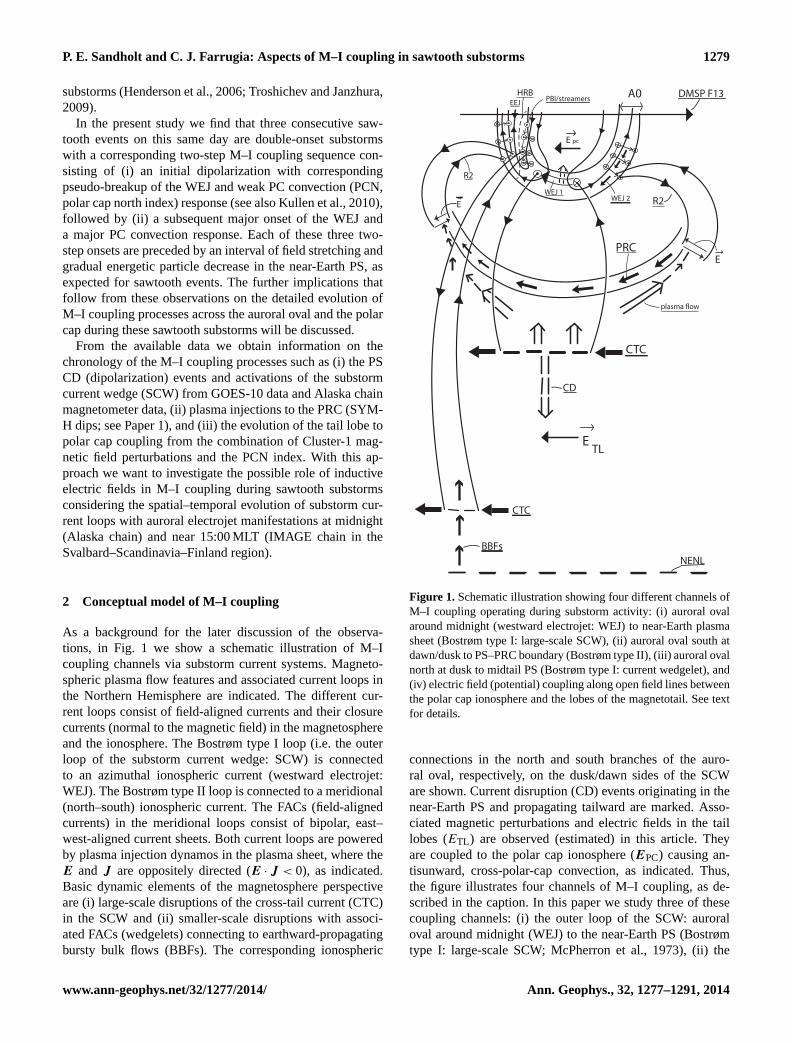
As a background for the later discussion of the observa-tions, in Fig. 1 we show a schematic illustration of M–Icoupling channels via substorm current systems. Magneto-spheric plasma flow features and associated current loops inthe Northern Hemisphere are indicated. The different cur-rent loops consist of field-aligned currents and their closurecurrents (normal to the magnetic field) in the magnetosphereand the ionosphere. The Bostrøm type I loop (i.e. the outerloop of the substorm current wedge: SCW) is connectedto an azimuthal ionospheric current (westward electrojet:WEJ). The Bostrøm type II loop is connected to a meridional(north–south) ionospheric current. The FACs (field-alignedcurrents) in the meridional loops consist of bipolar, east–west-aligned current sheets. Both current loops are poweredby plasma injection dynamos in the plasma sheet, where theE and J are oppositely directed (E · J < 0), as indicated.Basic dynamic elements of the magnetosphere perspectiveare (i) large-scale disruptions of the cross-tail current (CTC)in the SCW and (ii) smaller-scale disruptions with associ-ated FACs (wedgelets) connecting to earthward-propagatingbursty bulk flows (BBFs). The corresponding ionospheric
CTC
PRC
A0HRB
E pc
R2
E
E TL
WEJ 1
BBFs
E
R2
PBI/streamers
plasma �ow
CD
CTC
EEJ
NENL
DMSP F13
WEJ 2
Figure 1. Schematic illustration showing four different channels ofM–I coupling operating during substorm activity: (i) auroral ovalaround midnight (westward electrojet: WEJ) to near-Earth plasmasheet (Bostrøm type I: large-scale SCW), (ii) auroral oval south atdawn/dusk to PS–PRC boundary (Bostrøm type II), (iii) auroral ovalnorth at dusk to midtail PS (Bostrøm type I: current wedgelet), and(iv) electric field (potential) coupling along open field lines betweenthe polar cap ionosphere and the lobes of the magnetotail. See textfor details.
connections in the north and south branches of the auro-ral oval, respectively, on the dusk/dawn sides of the SCWare shown. Current disruption (CD) events originating in thenear-Earth PS and propagating tailward are marked. Asso-ciated magnetic perturbations and electric fields in the taillobes (ETL) are observed (estimated) in this article. Theyare coupled to the polar cap ionosphere (EPC) causing an-tisunward, cross-polar-cap convection, as indicated. Thus,the figure illustrates four channels of M–I coupling, as de-scribed in the caption. In this paper we study three of thesecoupling channels: (i) the outer loop of the SCW: auroraloval around midnight (WEJ) to the near-Earth PS (Bostrømtype I: large-scale SCW;McPherron et al., 1973), (ii) the
www.ann-geophys.net/32/1277/2014/ Ann. Geophys., 32, 1277–1291, 2014

1280 P. E. Sandholt and C. J. Farrugia: Aspects of M–I coupling in sawtooth substorms
inner loop of the SCW: auroral oval in the postnoon-to-dusksector (EEJ) to the near-Earth plasma-sheet–partial-ring cur-rent (PRC: Bostrøm type II), and (iii) electric field (poten-tial) coupling along open field lines between the tail lobesand the polar cap. With our M–I data sets we are monitor-ing the temporal–spatial evolution of this system during therepetitive sawtooth substorm events.
The figure also marks the observation geometry at duskwhere we combine ground magnetic observations by the IM-AGE chain in the Svalbard–Scandinavia–Finland region andDMSP F13 data. A central feature of this sector is the bound-ary between the EEJ and WEJ in the evening to premidnightsector – also delimiting the southern and northern branchesof the aurora, marked by a dashed curved line – is the Harangreversal boundary (HRB). The northern auroral branch inthis sector (HR-N) is characterized by equatorward-movingauroral forms (streamers) which are coupled to earthward-moving plasma-depleted flux tubes (Chen and Wolf, 1993)and associated bursty bulk flows (BBFs) in the PS (Sergeevet al., 2004, 2012; Sandholt et al., 2014). During “classical”substorms the HR is typically found in the 19:00–24:00 MLTsector (Nielsen and Greenwald, 1979). However, during thetype of persistent strong solar wind forcing conditions westudy (18 August 2003), the WEJ and the Harang reversal re-peatedly expanded into the 17:00–18:00 MLT sector, as doc-umented in a recent ground–satellite DMSP F13 conjunctionstudy (Paper 1). The dusk–dawn polar passes of the DMSPF13 satellite used to identify the HRB in that study have beenindicated in the figure.
In the conceptual model indicated in Fig. 1, we extend thestandard two-loop model of the SCW (Sergeev et al., 2014)when we specify the inner loop connecting the partial ringcurrent (PRC) and the ionosphere (EEJ in auroral oval southregime) via the Bostrøm type II current system. This is essen-tial for a proper description of M–I coupling during substormactivity.
As we shall see below, Geotail and Cluster data from thetail lobes and the combination of these observations with theGOES-10 monitoring of the substorm current wedge (SCW)at geostationary altitude allow us to discuss the substorm dy-namics in a broad M–I context, i.e. M–I coupling involvingthe outer and inner loops of the SCW and inductive electricfield coupling from the tail lobes to the polar cap ionosphere.
3 Data description
3.1 Interplanetary data: ACE
Figure2 shows IP (interplanetary) magnetic field and plasmadata from the ACE satellite on 18 August 2003. The pan-els show, from top to bottom, the proton density, bulk speed,temperature (in red: expected proton temperature afterLopezand Freeman, 1986), the dynamic pressure, the GSM compo-nents of the magnetic field and the total field, the Kan–Lee
Figure 2. Interplanetary data from the ACE satellite during theinterval 04:00–11:00 UT. Panels from top to bottom show protondensity (Np; cm−3); bulk speed (Vp; km s−1); proton temperatureTp (K; in red the expected temperature afterLopez and Freeman,1986); dynamic pressurePdyn (nPa), magnetic field componentsBx , By , andBz in GSM coordinates; the field strengthB (nT); theKan–Lee merging electric field,EKL (mV m−1); the Alfvén Machnumber,MA ; and the clock angle of the magnetic field (◦). The threemost geoeffective (seeEKL ) magnetic field directional discontinu-ities (DDs) are marked by vertical dashed guidelines.
merging electric fieldEKL (Kan and Lee, 1979), and theclock angle, i.e. the polar angle in the GSMY–Z plane.EKL = V BT sin2(θ/2), whereV is the solar wind bulk speed,BT = (B2
y + B2z )1/2, andθ is the clock angle. ACE was lo-
cated at (228,−34, 13)RE.The data were acquired during the passage at Earth of a
long-duration ICME lasting from 01:00 UT on 18 Augustuntil 15:00 UT on 19 August (Richardson and Cane, 2010).Three outstanding magnetic field direction discontinuities,and associated dynamic pressure changes, are marked by ver-tical guidelines. The transients at 06:00 and 09:55 UT are ex-pected to be geoeffective events (see abruptEKL increases),i.e. giving rise to PC convection enhancements. Noteworthy
Ann. Geophys., 32, 1277–1291, 2014 www.ann-geophys.net/32/1277/2014/
P. E. Sandholt and C. J. Farrugia: Aspects of M–I coupling in sawtooth substorms 1281
are also (i) the wide range of variation in the dynamic pres-sure (Pdyn); (ii) the magnetic field vector, with its clock an-gle spanning the range 180–130◦ (By < 0 after 06:10 UT;Bz = −10 to −17 nT); and, most importantly, (iii) the highvalues of the merging electric field (EKL = 7–10 mV m−1)and the low Alfvén Mach number (2–5) compared to typicalsolar wind values (∼ 8–10). The bulk speed was 500 km s−1
until 07:30 UT before it decreased to 470 km s−1 later in theinterval.
The clock angle increase (from 140 to 170◦) andEKL en-hancement (from 7.2 to 8.2 mV m−1) at 09:55–10:00 UT ledto a convection increase at the dayside polar cap boundaryat ∼ 11:00 UT, as inferred from ground magnetometer data(Sandholt et al., 2014). This is consistent with a propaga-tion delay from ACE of 65 min. The same effect on daysidePC convection occurred at∼ 07:00 UT, corresponding to thesouthward turning recorded by ACE at 06:00 UT (see Dis-cussion). The latter event was accompanied by an abruptEKLincrease from 8.5 to 10 mV m−1. The contributions fromthese magnetopause events (dayside source) to PC convec-tion enhancements and associated PCN-index increases canbe estimated from the relation1PCN/ PCN= 1EKL/EKL .We find that these1PCN/day events are minor in compari-son to the1PCN/night enhancements which are emphasizedin this article.
3.2 Magnetospheric data: GOES–Geotail–Cluster
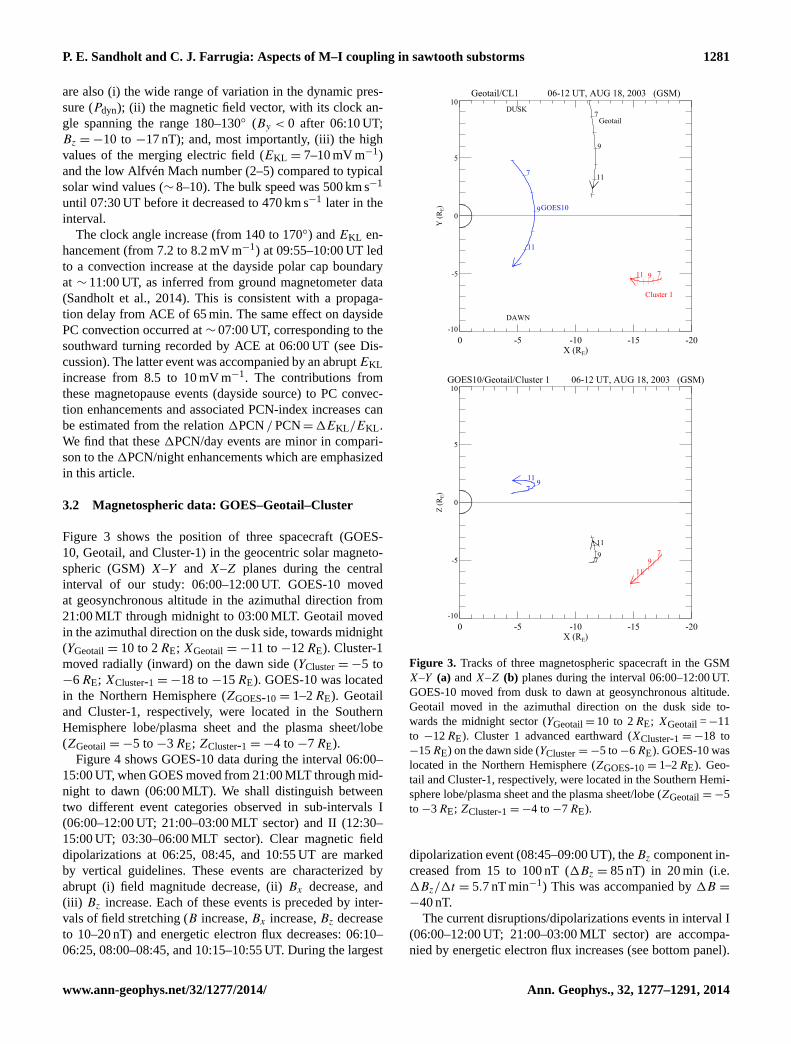
Figure 3 shows the position of three spacecraft (GOES-10, Geotail, and Cluster-1) in the geocentric solar magneto-spheric (GSM)X–Y and X–Z planes during the centralinterval of our study: 06:00–12:00 UT. GOES-10 movedat geosynchronous altitude in the azimuthal direction from21:00 MLT through midnight to 03:00 MLT. Geotail movedin the azimuthal direction on the dusk side, towards midnight(YGeotail= 10 to 2RE; XGeotail= −11 to−12RE). Cluster-1moved radially (inward) on the dawn side (YCluster= −5 to−6RE; XCluster-1 = −18 to−15RE). GOES-10 was locatedin the Northern Hemisphere (ZGOES-10 = 1–2RE). Geotailand Cluster-1, respectively, were located in the SouthernHemisphere lobe/plasma sheet and the plasma sheet/lobe(ZGeotail= −5 to−3RE; ZCluster-1 = −4 to−7RE).
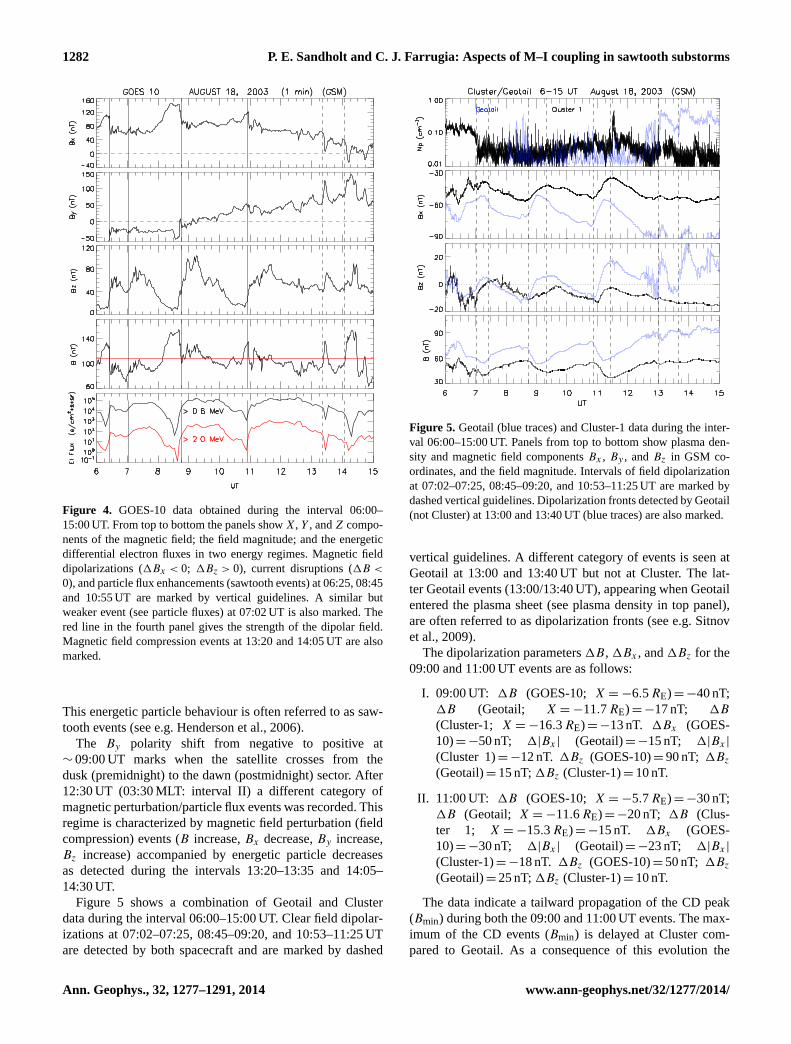
Figure4 shows GOES-10 data during the interval 06:00–15:00 UT, when GOES moved from 21:00 MLT through mid-night to dawn (06:00 MLT). We shall distinguish betweentwo different event categories observed in sub-intervals I(06:00–12:00 UT; 21:00–03:00 MLT sector) and II (12:30–15:00 UT; 03:30–06:00 MLT sector). Clear magnetic fielddipolarizations at 06:25, 08:45, and 10:55 UT are markedby vertical guidelines. These events are characterized byabrupt (i) field magnitude decrease, (ii)Bx decrease, and(iii) Bz increase. Each of these events is preceded by inter-vals of field stretching (B increase,Bx increase,Bz decreaseto 10–20 nT) and energetic electron flux decreases: 06:10–06:25, 08:00–08:45, and 10:15–10:55 UT. During the largest
Geotail/CL1 06-12 UT, AUG 18, 2003 (GSM)
-20-15-10-50X (RE)
-10
-5
0
5
10
Y (R
E)
DUSK
DAWN
Geotail
Cluster 1
GOES10
7
9
11
7911
7
9
11
GOES10/Geotail/Cluster 1 06-12 UT, AUG 18, 2003 (GSM)
-20-15-10-50X (RE)
-10
-5
0
5
10
Z (R
E)
7911
79
11
7911
Figure 3. Tracks of three magnetospheric spacecraft in the GSMX–Y (a) andX–Z (b) planes during the interval 06:00–12:00 UT.GOES-10 moved from dusk to dawn at geosynchronous altitude.Geotail moved in the azimuthal direction on the dusk side to-wards the midnight sector (YGeotail= 10 to 2RE; XGeotail=−11to −12RE). Cluster 1 advanced earthward (XCluster-1 = −18 to−15RE) on the dawn side (YCluster= −5 to−6RE). GOES-10 waslocated in the Northern Hemisphere (ZGOES-10 = 1–2RE). Geo-tail and Cluster-1, respectively, were located in the Southern Hemi-sphere lobe/plasma sheet and the plasma sheet/lobe (ZGeotail= −5to −3RE; ZCluster-1 = −4 to−7RE).
dipolarization event (08:45–09:00 UT), theBz component in-creased from 15 to 100 nT (1Bz = 85 nT) in 20 min (i.e.1Bz/1t = 5.7 nT min−1) This was accompanied by1B =
−40 nT.The current disruptions/dipolarizations events in interval I
(06:00–12:00 UT; 21:00–03:00 MLT sector) are accompa-nied by energetic electron flux increases (see bottom panel).
www.ann-geophys.net/32/1277/2014/ Ann. Geophys., 32, 1277–1291, 2014
1282 P. E. Sandholt and C. J. Farrugia: Aspects of M–I coupling in sawtooth substorms
Figure 4. GOES-10 data obtained during the interval 06:00–15:00 UT. From top to bottom the panels showX, Y , andZ compo-nents of the magnetic field; the field magnitude; and the energeticdifferential electron fluxes in two energy regimes. Magnetic fielddipolarizations (1Bx < 0; 1Bz > 0), current disruptions (1B <
0), and particle flux enhancements (sawtooth events) at 06:25, 08:45and 10:55 UT are marked by vertical guidelines. A similar butweaker event (see particle fluxes) at 07:02 UT is also marked. Thered line in the fourth panel gives the strength of the dipolar field.Magnetic field compression events at 13:20 and 14:05 UT are alsomarked.
This energetic particle behaviour is often referred to as saw-tooth events (see e.g.Henderson et al., 2006).
The By polarity shift from negative to positive at∼ 09:00 UT marks when the satellite crosses from thedusk (premidnight) to the dawn (postmidnight) sector. After12:30 UT (03:30 MLT: interval II) a different category ofmagnetic perturbation/particle flux events was recorded. Thisregime is characterized by magnetic field perturbation (fieldcompression) events (B increase,Bx decrease,By increase,Bz increase) accompanied by energetic particle decreasesas detected during the intervals 13:20–13:35 and 14:05–14:30 UT.
Figure 5 shows a combination of Geotail and Clusterdata during the interval 06:00–15:00 UT. Clear field dipolar-izations at 07:02–07:25, 08:45–09:20, and 10:53–11:25 UTare detected by both spacecraft and are marked by dashed
Figure 5. Geotail (blue traces) and Cluster-1 data during the inter-val 06:00–15:00 UT. Panels from top to bottom show plasma den-sity and magnetic field componentsBx , By , andBz in GSM co-ordinates, and the field magnitude. Intervals of field dipolarizationat 07:02–07:25, 08:45–09:20, and 10:53–11:25 UT are marked bydashed vertical guidelines. Dipolarization fronts detected by Geotail(not Cluster) at 13:00 and 13:40 UT (blue traces) are also marked.
vertical guidelines. A different category of events is seen atGeotail at 13:00 and 13:40 UT but not at Cluster. The lat-ter Geotail events (13:00/13:40 UT), appearing when Geotailentered the plasma sheet (see plasma density in top panel),are often referred to as dipolarization fronts (see e.g.Sitnovet al., 2009).
The dipolarization parameters1B, 1Bx , and1Bz for the09:00 and 11:00 UT events are as follows:
I. 09:00 UT: 1B (GOES-10; X = −6.5RE) = −40 nT;1B (Geotail; X = −11.7RE) = −17 nT; 1B
(Cluster-1; X = −16.3RE) = −13 nT. 1Bx (GOES-10)= −50 nT; 1|Bx | (Geotail)= −15 nT; 1|Bx |
(Cluster 1)= −12 nT. 1Bz (GOES-10)= 90 nT; 1Bz
(Geotail)= 15 nT;1Bz (Cluster-1)= 10 nT.
II. 11:00 UT: 1B (GOES-10; X = −5.7RE) = −30 nT;1B (Geotail; X = −11.6RE) = −20 nT; 1B (Clus-ter 1; X = −15.3RE) = −15 nT. 1Bx (GOES-10)= −30 nT; 1|Bx | (Geotail)= −23 nT; 1|Bx |
(Cluster-1)= −18 nT. 1Bz (GOES-10)= 50 nT; 1Bz
(Geotail)= 25 nT;1Bz (Cluster-1)= 10 nT.
The data indicate a tailward propagation of the CD peak(Bmin) during both the 09:00 and 11:00 UT events. The max-imum of the CD events (Bmin) is delayed at Cluster com-pared to Geotail. As a consequence of this evolution the
Ann. Geophys., 32, 1277–1291, 2014 www.ann-geophys.net/32/1277/2014/
P. E. Sandholt and C. J. Farrugia: Aspects of M–I coupling in sawtooth substorms 1283
GOES-10 August 18, 2003
6 7 8 9 10 11 12UT0
20
40
60
80
100
Bz
(nT
)
MLT= 21-03
Poker Flat
6 7 8 9 10 11 12UT1.05•104
1.10•104
1.15•104
1.20•104
1.25•104
H (
nT)
MLT = 19--01
PCN
6 7 8 9 10 11 12UT
1
2
3
4
5
6
7
PCN
(m
V/m
)
Figure 6. Panels from top to bottom show the GOES-10Bz com-ponent (nT), Poker FlatH -component deflection (nT), and thePCN index (mV m−1). Vertical dashed guidelines corresponding topseudo-breakups (black) and major local onsets (blue) for each ofthe three sawtooth substorm are shown.
duration of the CD events maximizes at spacecraft Cluster-1. At the Cluster location the negativeB gradient (CDevent, marked by vertical guidelines in the figure) lasts ap-proximately 30 min during the 09:00 and 11:00 UT events.From the perspective of estimating the spatial scale of themagnetic deflection events in theX dimension, we find itto be of interest that the 09:00 and 11:00 UT perturbationevents (the1B = −18.5 nT vs.−14 nT) are only marginallylarger in the Geotail (X = −11.6RE) versus the Cluster (X =
−15.3RE) data.
3.3 Combined magnetosphere–ground data
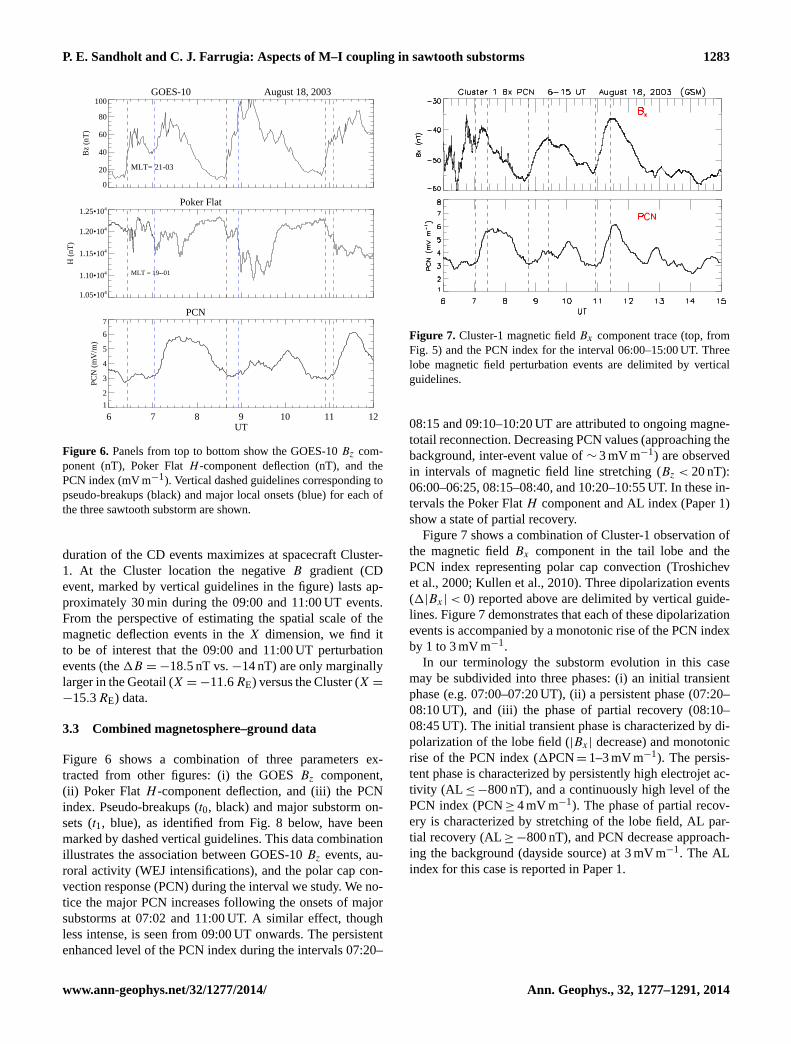
Figure 6 shows a combination of three parameters ex-tracted from other figures: (i) the GOESBz component,(ii) Poker FlatH -component deflection, and (iii) the PCNindex. Pseudo-breakups (t0, black) and major substorm on-sets (t1, blue), as identified from Fig. 8 below, have beenmarked by dashed vertical guidelines. This data combinationillustrates the association between GOES-10Bz events, au-roral activity (WEJ intensifications), and the polar cap con-vection response (PCN) during the interval we study. We no-tice the major PCN increases following the onsets of majorsubstorms at 07:02 and 11:00 UT. A similar effect, thoughless intense, is seen from 09:00 UT onwards. The persistentenhanced level of the PCN index during the intervals 07:20–
Figure 7. Cluster-1 magnetic fieldBx component trace (top, fromFig. 5) and the PCN index for the interval 06:00–15:00 UT. Threelobe magnetic field perturbation events are delimited by verticalguidelines.
08:15 and 09:10–10:20 UT are attributed to ongoing magne-totail reconnection. Decreasing PCN values (approaching thebackground, inter-event value of∼ 3 mV m−1) are observedin intervals of magnetic field line stretching (Bz < 20 nT):06:00–06:25, 08:15–08:40, and 10:20–10:55 UT. In these in-tervals the Poker FlatH component and AL index (Paper 1)show a state of partial recovery.
Figure7 shows a combination of Cluster-1 observation ofthe magnetic fieldBx component in the tail lobe and thePCN index representing polar cap convection (Troshichevet al., 2000; Kullen et al., 2010). Three dipolarization events(1|Bx | < 0) reported above are delimited by vertical guide-lines. Figure7 demonstrates that each of these dipolarizationevents is accompanied by a monotonic rise of the PCN indexby 1 to 3 mV m−1.
In our terminology the substorm evolution in this casemay be subdivided into three phases: (i) an initial transientphase (e.g. 07:00–07:20 UT), (ii) a persistent phase (07:20–08:10 UT), and (iii) the phase of partial recovery (08:10–08:45 UT). The initial transient phase is characterized by di-polarization of the lobe field (|Bx | decrease) and monotonicrise of the PCN index (1PCN= 1–3 mV m−1). The persis-tent phase is characterized by persistently high electrojet ac-tivity (AL ≤ −800 nT), and a continuously high level of thePCN index (PCN≥ 4 mV m−1). The phase of partial recov-ery is characterized by stretching of the lobe field, AL par-tial recovery (AL≥ −800 nT), and PCN decrease approach-ing the background (dayside source) at 3 mV m−1. The ALindex for this case is reported in Paper 1.
www.ann-geophys.net/32/1277/2014/ Ann. Geophys., 32, 1277–1291, 2014
1284 P. E. Sandholt and C. J. Farrugia: Aspects of M–I coupling in sawtooth substorms
Arctic-Ft Yukon-Poker Fl-CIGO H-component August 18, 2003
6 7 8 9 10 11 12UT
9.0•103
1.0•104
1.1•104
1.2•104
1.3•104
H (
nT)
Arctic Ft Yukon Poker Ft CIGO Gakona
63.6o
65.4o
65.7o
67.4o
68.7o
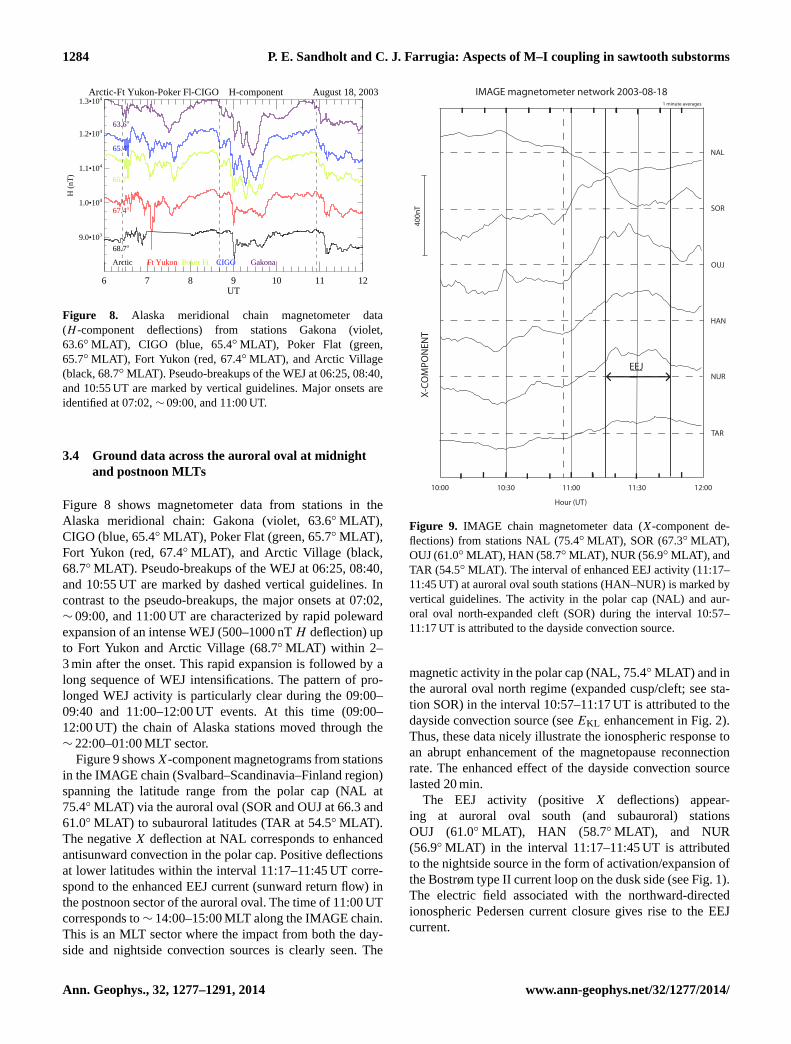
Figure 8. Alaska meridional chain magnetometer data(H -component deflections) from stations Gakona (violet,63.6◦ MLAT), CIGO (blue, 65.4◦ MLAT), Poker Flat (green,65.7◦ MLAT), Fort Yukon (red, 67.4◦ MLAT), and Arctic Village(black, 68.7◦ MLAT). Pseudo-breakups of the WEJ at 06:25, 08:40,and 10:55 UT are marked by vertical guidelines. Major onsets areidentified at 07:02,∼ 09:00, and 11:00 UT.
3.4 Ground data across the auroral oval at midnightand postnoon MLTs
Figure 8 shows magnetometer data from stations in theAlaska meridional chain: Gakona (violet, 63.6◦ MLAT),CIGO (blue, 65.4◦ MLAT), Poker Flat (green, 65.7◦ MLAT),Fort Yukon (red, 67.4◦ MLAT), and Arctic Village (black,68.7◦ MLAT). Pseudo-breakups of the WEJ at 06:25, 08:40,and 10:55 UT are marked by dashed vertical guidelines. Incontrast to the pseudo-breakups, the major onsets at 07:02,∼ 09:00, and 11:00 UT are characterized by rapid polewardexpansion of an intense WEJ (500–1000 nTH deflection) upto Fort Yukon and Arctic Village (68.7◦ MLAT) within 2–3 min after the onset. This rapid expansion is followed by along sequence of WEJ intensifications. The pattern of pro-longed WEJ activity is particularly clear during the 09:00–09:40 and 11:00–12:00 UT events. At this time (09:00–12:00 UT) the chain of Alaska stations moved through the∼ 22:00–01:00 MLT sector.
Figure9showsX-component magnetograms from stationsin the IMAGE chain (Svalbard–Scandinavia–Finland region)spanning the latitude range from the polar cap (NAL at75.4◦ MLAT) via the auroral oval (SOR and OUJ at 66.3 and61.0◦ MLAT) to subauroral latitudes (TAR at 54.5◦ MLAT).The negativeX deflection at NAL corresponds to enhancedantisunward convection in the polar cap. Positive deflectionsat lower latitudes within the interval 11:17–11:45 UT corre-spond to the enhanced EEJ current (sunward return flow) inthe postnoon sector of the auroral oval. The time of 11:00 UTcorresponds to∼ 14:00–15:00 MLT along the IMAGE chain.This is an MLT sector where the impact from both the day-side and nightside convection sources is clearly seen. The
IMAGE magnetometer network 2003-08-18
X-CO
MPO
NEN
T
NAL
SOR
OUJ
HAN
NUR
TAR
1 minute averages
400n
T
10:00 10:30 11:00 11:30 12:00
Hour (UT)
EEJ
Figure 9. IMAGE chain magnetometer data (X-component de-flections) from stations NAL (75.4◦ MLAT), SOR (67.3◦ MLAT),OUJ (61.0◦ MLAT), HAN (58.7◦ MLAT), NUR (56.9◦ MLAT), andTAR (54.5◦ MLAT). The interval of enhanced EEJ activity (11:17–11:45 UT) at auroral oval south stations (HAN–NUR) is marked byvertical guidelines. The activity in the polar cap (NAL) and aur-oral oval north-expanded cleft (SOR) during the interval 10:57–11:17 UT is attributed to the dayside convection source.
magnetic activity in the polar cap (NAL, 75.4◦ MLAT) and inthe auroral oval north regime (expanded cusp/cleft; see sta-tion SOR) in the interval 10:57–11:17 UT is attributed to thedayside convection source (seeEKL enhancement in Fig.2).Thus, these data nicely illustrate the ionospheric response toan abrupt enhancement of the magnetopause reconnectionrate. The enhanced effect of the dayside convection sourcelasted 20 min.
The EEJ activity (positive X deflections) appear-ing at auroral oval south (and subauroral) stationsOUJ (61.0◦ MLAT), HAN (58.7◦ MLAT), and NUR(56.9◦ MLAT) in the interval 11:17–11:45 UT is attributedto the nightside source in the form of activation/expansion ofthe Bostrøm type II current loop on the dusk side (see Fig. 1).The electric field associated with the northward-directedionospheric Pedersen current closure gives rise to the EEJcurrent.
Ann. Geophys., 32, 1277–1291, 2014 www.ann-geophys.net/32/1277/2014/
P. E. Sandholt and C. J. Farrugia: Aspects of M–I coupling in sawtooth substorms 1285
The combined data sets from Alaska and IMAGE(Svalbard–Scandinavia–Finland region) indicate the wideMLT–MLAT ranges of the impact of the present substormactivity, including enhanced WEJ near midnight, increasedEEJ activity expanding into the postnoon sector, and polarcap convection enhancement monitored by the PCN index.
4 Discussion
4.1 Substorms: the combinedmagnetosphere–ionosphere perspectives
The ultimate goal of this type of study is to obtain an inte-grated view of the temporal evolution of the different chan-nels of M–I coupling operating during substorm activity (seeFig. 1). The central issue is the spatial–temporal evolution ofPS–magnetotail dynamics involving such features as (i) near-Earth CD (dipolarization), (ii) reconnection of tail lobe mag-netic flux, and (iii) excitation of PC convection. In particu-lar, the role played by nightside reconnection in driving po-lar cap convection has been uncertain. Thus, according toGordeev et al.(2011), “a direct quantitative evaluation of theefficiency of the nightside reconnection in contributing to thepolar cap potential still awaits to be done”. We addressed thisproblem through our specific method of combining groundand satellite observations. Thus, our approach consists of acombination of the magnetospheric and ionospheric perspec-tives on the substorm activity. The main focus here is on M–Icoupling during the variant of substorm activity appearingduring interval I (06:00–12:30 UT) on 18 August 2003. Thisis a repetitive substorm activity driven by an ICME. In Pa-per 1 we documented central aspects of M–I coupling, withemphasis placed on a later interval II (13:00–17:00 UT) onthis day.
The magnetospheric perspective consists of magnetic fieldand plasma data obtained from the magnetospheric space-craft GOES-10, Geotail, and Cluster-1 during consecu-tive current disruption and magnetic field dipolarizationsin the near-Earth PS and tail lobe system. This is a caseof sawtooth substorms, i.e. strong substorms recurring at2–3 h intervals (see e.g.Henderson et al., 2006). In thisinterval GOES-10 moved azimuthally from dusk to pre-dawn (21:00–03:30 MLT) MLTs at geostationary altitude(XGOES-10 within −5 to −6RE; YGOES-10 = 5 to −4RE).Geotail moved azimuthally from dusk to midnight (YGT = 10to 2RE) at XGT = −11 to −12 RE. Cluster moved inward(XCluster= −18 to −14RE) on the dawn side (YCluster∼
−6RE).Using this observation geometry we were able to address
the question of temporal–spatial evolution of the magneto-spheric magnetic perturbations initiated by near-Earth cur-rent disruption and magnetic field dipolarizations spanningthe 21:00 to 03:00 MLT azimuthal sector. Thus, by combin-ing the observations from GOES, Geotail, and Cluster we
document the detailed evolution of these events in the near-Earth PS (X = −5 to−6RE; Z = 1–2RE) and the tail lobes(X = −11 to −17RE; Z = −4 to −6RE). We shall thenmake estimates of the scale sizesLx andLy of the field di-polarization process.
These observations are discussed in the context of M–I coupling. The ionospheric perspective consists of auroralelectrojet activations obtained from magnetometer chains inAlaska and Scandinavia–Finland (IMAGE chain), the AL in-dex, and polar cap convection enhancements derived fromthe PCN index.
We address the long-standing question of the roles of in-ductive versus potential electric fields in M–I coupling dur-ing substorms. Concerning the inductive electric fields weinfer from the magnetic field dipolarizations, we distinguishbetween the near-Earth PS events (EPS derived from GOESdata: δBz/δt) and the tail lobe events (ETL derived fromGeotail–Cluster data). The former (EPSoriginating in currentdisruption in the near-Earth PS) drives the westward electro-jet centred at midnight (SCW), while the latter (ETL originat-ing in magnetotail reconnection) drives polar cap convection(PCN index). In our sawtooth substorms, both phenomena(near-Earth current disruption and magnetotail reconnection)are strongly related in the meaning that one leads to the other.Thus we suggest the following scenario of magnetosphericprocesses: (i) near-Earth current disruption leading to activa-tion of the SCW with its “inner and outer loops” (seeSergeevet al., 2014), which is followed by (ii) activation of magneticreconnection at the NENL (reconnection of lobe flux) withassociated plasma injection. On the ionospheric level, thistwo-stage process is manifested as enhancements of (i) theauroral electrojets (via the Bostrøm type I and II systems)and (ii) the PCN index (see Fig. 1).
We distinguish between three stages of the evolution ofthe sawtooth substorms: (i) an initial transient phase charac-terized by a plasma sheet current disruption, an initial ALexcursion followed by a monotonic PCN rise, (ii) a phase ofpersistent AL–PCN activity, and (iii) a phase of partial re-covery which is initiated by a switch-off of magnetotail re-connection. The latter stage is characterized by stretching ofthe tail magnetic field, partial recovery of AL excursion, andPCN decrease towards a background level provided by thedayside convection source (magnetopause reconnection).
We point out the importance of combining the magneto-spheric and ionospheric perspectives on the substorm ex-pansion in order to obtain an integrated view of the evolu-tion of the different M–I coupling channels. In our case thiscan be exemplified by the third sawtooth substorm, wherewe identified the following essential phenomena: (i) near-Earth PS current disruption (SCW) at GOES-10 (10:55–11:05 UT), (ii) WEJ major onset at 11:00 UT (Alaska chainat 24:00 MLT, Fig. 8), (iii) tail lobe magnetic perturba-tions (Geotail–Cluster) and polar cap convection enhance-ment (PCN rise) from 11:05 to 11:25 UT, (iv) EEJ enhance-ment (activation and expansion of the dusk-side branch of the
www.ann-geophys.net/32/1277/2014/ Ann. Geophys., 32, 1277–1291, 2014
1286 P. E. Sandholt and C. J. Farrugia: Aspects of M–I coupling in sawtooth substorms
Bostrøm type II system; see Fig. 1) reaching∼ 15:00 MLT at11:17 UT (IMAGE chain; Fig.9), and (v) auroral electrojet-and PCN decreases to the background level (cessation of re-connection of lobe flux) from 11:45 UT.
Figures8 and9 document the wide MLT range on the duskside (15:00–24:00 MLT) of the impact of the substorm ac-tivity (eastward and westward electrojets), in addition to thepolar cap convection enhancement, during the events we dis-cuss here.
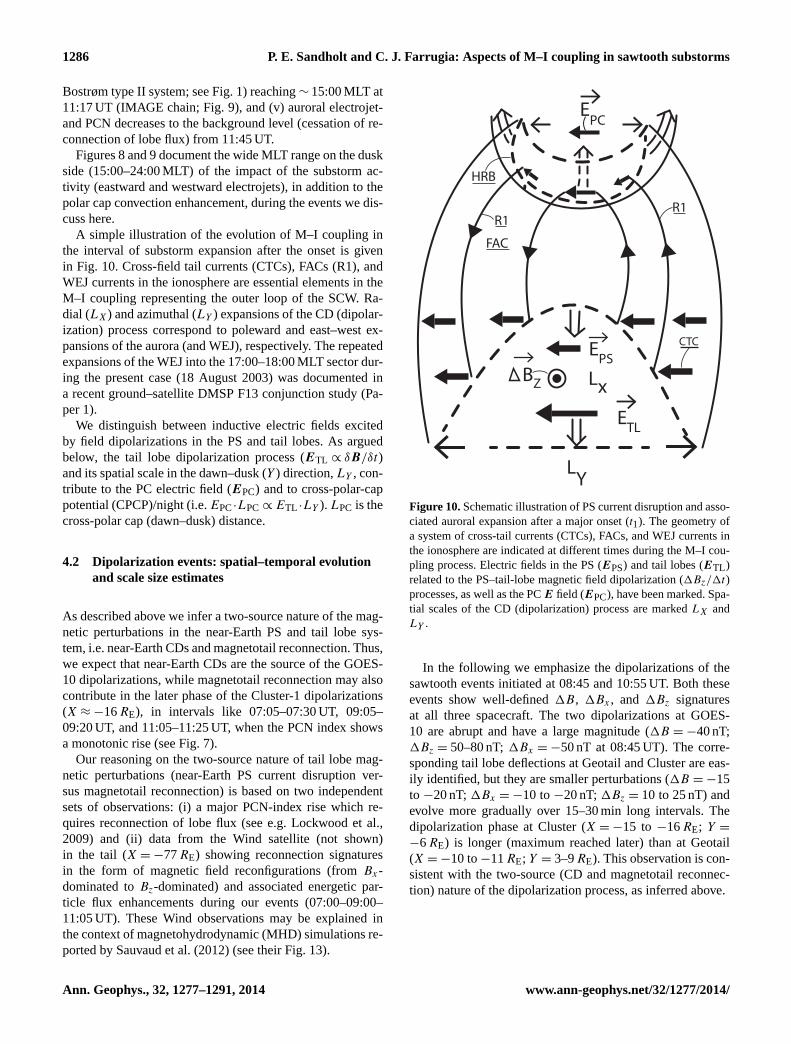
A simple illustration of the evolution of M–I coupling inthe interval of substorm expansion after the onset is givenin Fig. 10. Cross-field tail currents (CTCs), FACs (R1), andWEJ currents in the ionosphere are essential elements in theM–I coupling representing the outer loop of the SCW. Ra-dial (LX) and azimuthal (LY ) expansions of the CD (dipolar-ization) process correspond to poleward and east–west ex-pansions of the aurora (and WEJ), respectively. The repeatedexpansions of the WEJ into the 17:00–18:00 MLT sector dur-ing the present case (18 August 2003) was documented ina recent ground–satellite DMSP F13 conjunction study (Pa-per 1).
We distinguish between inductive electric fields excitedby field dipolarizations in the PS and tail lobes. As arguedbelow, the tail lobe dipolarization process (ETL ∝ δB/δt)and its spatial scale in the dawn–dusk (Y ) direction,LY , con-tribute to the PC electric field (EPC) and to cross-polar-cappotential (CPCP)/night (i.e.EPC·LPC ∝ ETL ·LY ). LPC is thecross-polar cap (dawn–dusk) distance.
4.2 Dipolarization events: spatial–temporal evolutionand scale size estimates
As described above we infer a two-source nature of the mag-netic perturbations in the near-Earth PS and tail lobe sys-tem, i.e. near-Earth CDs and magnetotail reconnection. Thus,we expect that near-Earth CDs are the source of the GOES-10 dipolarizations, while magnetotail reconnection may alsocontribute in the later phase of the Cluster-1 dipolarizations(X ≈ −16RE), in intervals like 07:05–07:30 UT, 09:05–09:20 UT, and 11:05–11:25 UT, when the PCN index showsa monotonic rise (see Fig.7).
Our reasoning on the two-source nature of tail lobe mag-netic perturbations (near-Earth PS current disruption ver-sus magnetotail reconnection) is based on two independentsets of observations: (i) a major PCN-index rise which re-quires reconnection of lobe flux (see e.g.Lockwood et al.,2009) and (ii) data from the Wind satellite (not shown)in the tail (X = −77RE) showing reconnection signaturesin the form of magnetic field reconfigurations (fromBx-dominated toBz-dominated) and associated energetic par-ticle flux enhancements during our events (07:00–09:00–11:05 UT). These Wind observations may be explained inthe context of magnetohydrodynamic (MHD) simulations re-ported bySauvaud et al.(2012) (see their Fig. 13).
CTC
LY
ETL
BZ Lx
EPS
HRB
R1
FAC
R1
EPC
Figure 10.Schematic illustration of PS current disruption and asso-ciated auroral expansion after a major onset (t1). The geometry ofa system of cross-tail currents (CTCs), FACs, and WEJ currents inthe ionosphere are indicated at different times during the M–I cou-pling process. Electric fields in the PS (EPS) and tail lobes (ETL )related to the PS–tail-lobe magnetic field dipolarization (1Bz/1t)processes, as well as the PCE field (EPC), have been marked. Spa-tial scales of the CD (dipolarization) process are markedLX andLY .
In the following we emphasize the dipolarizations of thesawtooth events initiated at 08:45 and 10:55 UT. Both theseevents show well-defined1B, 1Bx , and 1Bz signaturesat all three spacecraft. The two dipolarizations at GOES-10 are abrupt and have a large magnitude (1B = −40 nT;1Bz = 50–80 nT;1Bx = −50 nT at 08:45 UT). The corre-sponding tail lobe deflections at Geotail and Cluster are eas-ily identified, but they are smaller perturbations (1B = −15to −20 nT;1Bx = −10 to−20 nT;1Bz = 10 to 25 nT) andevolve more gradually over 15–30 min long intervals. Thedipolarization phase at Cluster (X = −15 to −16RE; Y =
−6RE) is longer (maximum reached later) than at Geotail(X = −10 to−11RE; Y = 3–9RE). This observation is con-sistent with the two-source (CD and magnetotail reconnec-tion) nature of the dipolarization process, as inferred above.
Ann. Geophys., 32, 1277–1291, 2014 www.ann-geophys.net/32/1277/2014/
P. E. Sandholt and C. J. Farrugia: Aspects of M–I coupling in sawtooth substorms 1287
Both the dipolarization and the preceding field line stretch-ing are widely extended phenomena in the dawn–dusk direc-tion. The events were observed by GOES-10 when it movedfrom evening (21:00 MLT) through midnight to pre-dawn(03:00 MLT). According toLavraud and Borovsky(2008),a wide (cross-tail) regime of field stretching is expected dur-ing conditions of low Alfvén-Mach number in ICMEs. Thisis the condition of our case:MA = 3–4.
Then we add that the 07:00 UT dipolarization event wasalso observed by Cluster (X = −17RE). From these obser-vations we conclude that the scale sizes of the magnetic per-turbation events in theX andY dimensions areLx ≈ 15REandLy ≥ 15RE. Our azimuthal coverage on the dawn side islimited (YCluster-1 ≥ −6RE). The dusk-side observations ofdipolarizations by Geotail extend toY = 10RE. Thus, fromsymmetry considerations we shall useLy = 20RE for theazimuthal extent of the lobe magnetic perturbation.
Lx is estimated to be∼ 15RE, i.e. dipolarization cover-ing the radial extent from the inside of GOES-10 to the out-side of Cluster-1:∼ −5 to −20RE. As support for the lat-ter inference we note the similar, large1B and 1Bx am-plitudes recorded by Geotail (X = −11.7RE) and Cluster(X = −15.3RE) at 11:00 UT (see Fig.5).
Related to this we note thatSergeev et al.(2014) re-cently presented a model of the SCW system, responsiblefor the field dipolarization, consisting of a two-loop sys-tem (one loop with R2 sense FAC connected to the par-tial ring current and the other with R1 sense FAC coupledto the near-Earth plasma sheet) located at radial distancesbetweenX = −6 and−14RE. Sergeev et al.(2014) com-pared their model current system with a statistical study ofdipolarization amplitudes (1Bz) observed atX = −6.6 and−11RE. Our observations by GOES-10 and Geotail are com-parable with their results. Specifically we note their∼ 30 minlong events of1Bz ≈ 15 nT atX = −11RE, as detected byTHEMIS probes. In our case Geotail (X = −11RE; Y =
3RE; Z = −4RE) observed 15 and 30 min long events with1Bz amplitudes of≈ 15 and 25 nT at 09:00 and 11:00 UT, re-spectively. Our Cluster-1 (X = −15.3RE; Y = −5RE; Z =
−7RE) event at 11:00 UT shows a 30 min longBz increaseof 10 nT.
Our reported observations of field dipolarizations fromthe GOES-10–Geotail–Cluster-1 constellation in the near-Earth PS and tail lobes will then be discussed in relation tothe results of the previous studies bySergeev et al.(2011)andSauvaud et al.(2012). In their multi-spacecraft studies,both Sauvaud et al.(2012) and Sergeev et al.(2011) doc-umented the large-scale nature of magnetospheric magneticperturbations during substorms.Sergeev et al.(2011) stud-ied small (AE≤ 500 nT), isolated substorms using a similarsatellite constellation (GOES–Geotail–Cluster) to what weare using. Geotail was moving azimuthally atX = −12RE.Cluster moved radially (X within −6 to −18RE) and spentmost of the time in the lobes. They point out that the lackof coverage in the azimuthal direction did not allow them
to determine the longitudinal extent of the disturbance fromthe space data. They note that some of the substorm dipo-larizations were not detected at GOES-17 and Geotail whenthe Y coordinates of these spacecraft were 5 to 6RE. Thisindicates a limit on the longitudinal scales of these mag-netic perturbation events:LY ≤ 8RE. TheBz perturbationsof their events at geostationary altitude and in the tail lobe atX = −12RE (Geotail) are given by1Bz/1t (geostationary)∼ 15 nT/10 min and1Bz/1t (lobe)∼ (5–10) nT/15 min, re-spectively. These values are significantly lower than valuesfor our repetitive, strong substorms (AL≤ −1000 nT).
Sauvaud et al.(2012) found that dipolarization is a com-mon feature of the geomagnetic tail, observed at 10–18REfrom the Earth, in the nightside plasma sheet and lobe dur-ing conditions similar to ours, i.e. repetitive substorms duringstorm time. These events are related to substorm onsets andpropagate tailward from the 10–12RE regime at velocitiesof 100–600 km s−1. They measured magnetic perturbationsin the tail lobe (Cluster data atX = −18RE). In these casesthey observed dipolarization parameters1Bz/1t (lobe) ∼
10 nT/10 min and1|Bx |/1t (lobe) ∼ −10 nT/10 min. Thelatter values are similar to our observations in the tail lobes.But our events are initiated by current disruptions closer toEarth, near geostationary heights. This is inferred from thesteep, strong B gradients measured by GOES-10 (Fig. 4). Inthe tail lobes atX = −11 (Geotail) to−18RE (Cluster-1),our events, initiated by abrupt dipolarizations at geostation-ary altitude (GOES-10), evolve into 15–25 min long dipolar-ization events before the new field-stretching phase sets in.
Sauvaud et al.(2012) found that the lobe magnetic fieldperturbations coincided with increases of the lobe electricfield of ∼ 2.5 mV m−1. The measured electric field valueswere found to be consistent with an inductive electric fieldsource (Eind ∝ δB/dt). According toSauvaud et al.(2012)“the lobe magnetic field changes appear to be the signature ofa tailward retreating neutral line, with its associated currentdisruption/reduction.” This interpretation is consistent withour observations.
4.3 Inductive electric fields and polar cap convection
The estimated large value of the inductive electric field inthe plasma sheet in the early (∼ 5–10 min) stage of the majorsawtooth expansion (EPS= (1Bz/1t) · LX ≈ 5 mV m−1) isattributed to the rapid tailward (LX) and longitudinal (LY )expansions of the field dipolarization process (1Bz/1t ≈
50 nT/10 min≈ 10−10 V m−2). These are reflected in the au-roral electrojet (see Fig.8 and AL index in Paper 1). Relevantto us here is also the dawn–dusk electric potential in the taillobes which can be transferred along open field lines to thepolar cap and give rise to polar cap convection and corre-sponding PCN increases.
Based on our estimates of the spatial (LX ∼ 15RE; LY ∼
20RE) and temporal (15–30 min) scales of the tail lobemagnetic perturbations, we can then make estimates of the
www.ann-geophys.net/32/1277/2014/ Ann. Geophys., 32, 1277–1291, 2014

1288 P. E. Sandholt and C. J. Farrugia: Aspects of M–I coupling in sawtooth substorms
cross-tail potential generated during the evolution of dipolar-ization process in the tail lobes. This parameter is particu-larly important since it can be a source of polar cap potentialenhancements during the initial transient phase of substormexpansions (marked by vertical guidelines in Fig.7).
An estimate of the cross-tail potential (CTP) can be de-rived as follows: CTP= ECT ·LY ≈ ETL ·LY , whereETL =
(1Bx/1t) · Lz.This expression forETL is based on Faraday’s law for
the case of anEY -dominated electric field component andsmall gradients in they direction (δ/δy ≈ 0) in the systemof plasma sheet tail lobes:δEY /δx = −δBz/δt ; δEY /δz =
δBx/δt . Then we obtain the relations we shall apply in thisstudy:1EY ≈ −(1Bz/1t)·LX and1EY ≈ (1BX/1t)·LZ,whereLX andLZ are characteristic scale lengths of the mag-netic perturbations in theX andZ dimensions (1Bz/1x =
Bz/Lx ; 1Bx/1z = Bx/Lz).In our case1Bz/1t (TL) ∼ 15 nT/15 min (see Geotail
data). Then we apply the derived estimates of the spatialscales of the magnetic perturbations in the tail lobes duringthe documented dipolarization events:LX = 15RE; Ly =
20RE; Lz = 25RE. The latter value (Lz = 25RE) is takenfrom Sauvaud et al.(2012). This givesETL ∼ 2.5 mV m−1.1CTP= 2.5 mV m−1
× 20RE = 320 kV.An estimate of the polar cap potential can be obtained
when we use the M–I potential transmission factor derivedby Gordeev et al.(2011): 1CPCP= (0.1–0.2)· 1CTP. Thenwe have1CPCP= (0.1–0.2)· 1CTP≈ 30–60 kV. Due to thelack of spacecraft coverage beyondYGSM = 10RE, the in-ferred CPCP values are lower limits. Thus, for the first time,we establish lower limits on the contribution to the CPCPfrom inductive electric field coupling between the tail lobesand the polar cap ionosphere.
At this stage we take advantage of the following expres-sion for the empirical relation between CPCP enhancementsand PCN increases during the category of events westudy (Sandholt et al., 2012): 1CPCP (V)≈ 51PCN(mV m−1) · LPC (km). LPC is the cross-polar cap distance.In our caseLPC ∼ 4500 km (see Paper 1). This gives1PCN= (30–60) kV/(5× 4500 km)= (1.3–2.6) mV m−1.This estimate fits well with the ground observations of polarcap convection enhancement (PCN rises of 1.5–3 mV m−1)in the initial transient phase of M–I coupling in thesesubstorm cases (see PCN index in Fig.7).
5 Summary and conclusions
The repetitive storm-time substorm activity excited duringthe Earth passage of an ICME on 18 August 2003 may bedivided in two different variants occurring in two subinter-vals: I (04:00–12:30 UT) and II (12:30–18:00 UT). As doc-umented in Paper 1, the AL–PCN activity in interval I re-curs at 2–2.5 h intervals, while the interval II activity consistsof shorter AL-PCN events recurring at 20–50 min intervals.
The interval I substorm activity is accompanied by parti-cle injections to geostationary altitude, which are often re-ferred to as sawtooth events (Henderson et al., 2006). As dis-cussed inNoah and Burke(2014), the two types of storm-time substorm activity may correspond to different condi-tions of magnetotail reconnection in the presence of strongring current developments, i.e. sustained near-Earth neutralline (NENL) activity versus a state of more chaotic (sporadic)magnetotail merging. As described in more detail below, inthis paper we extend the initial study (Paper 1) in differentways by addition of data sets referring to the magnetosphericand ionospheric levels which are relevant for shedding lighton basic elements of M–I coupling prevailing during the saw-tooth substorms observed in interval I, when the ring currentindex SYM-H lies within−80 to−100 nT.
Based on data from a fortuitous configuration of magneto-spheric satellites, we have documented the spatial–temporalevolution of magnetic perturbations (dipolarizations) in thenear-Earth plasma sheet (GOES-10) and in the tail lobes(Geotail and Cluster-1) during sawtooth substorms. TheGeotail–Cluster configuration in the present case gives in-formation about the large-scale nature of the tail lobe per-turbations appearing during sawtooth substorms. In the in-terval, we study Geotail–Cluster-detected magnetic pertur-bations in a large sector of the tail lobes:XGSM = −11 to−17RE; YGSM = −6 to 10RE. This represents an extensionwith respect to similar type of data published in previouswork (see e.g.Sergeev et al., 2011; Sauvaud et al., 2012). Theextended spacecraft coverage was applied to make reason-able estimates of CPCP enhancements from inductive elec-tric field coupling between the tail lobes and the polar capionosphere.
Ground signatures of activations of the substorm currentloops (see Fig. 1), as they appear in the westward elec-trojet around midnight and in the eastward electrojet at14:00–15:00 MLT (see the 11:17–11:45 UT event), are doc-umented by magnetograms from Alaska and the Svalbard–Scandinavia–Finland region, respectively. These ground datareflect the wide MLT–MLAT ranges of the impact of thepresent substorm activity (eastward and westward electrojetsand polar cap convection). By combining the observations onthe magnetosphere and ionosphere levels of the substorm ac-tivity, we can infer a scenario of M–I coupling events involv-ing near-Earth current disruption and magnetotail reconnec-tion, associated activations of substorm current loops (SCW),and their manifestations in auroral electrojets and electricfield coupling to the polar cap ionosphere.
This paper serves as an extension of Paper 1, as indi-cated below. We place the activations of the SCW duringthe documented “sawtooth variant” (GOES-10 data at geo-stationary altitude) of substorm activity in the larger con-text of ionospheric and magnetotail dynamics, most notablytail lobe magnetic field perturbations obtained by Geotail(X ∼ −11RE) and Cluster-1 (X = −18 to−15RE). Obser-vations of the latter perturbations are essential for estimating
Ann. Geophys., 32, 1277–1291, 2014 www.ann-geophys.net/32/1277/2014/
P. E. Sandholt and C. J. Farrugia: Aspects of M–I coupling in sawtooth substorms 1289
the role that the induction electric field plays in the excita-tion of polar cap convection, as monitored by the PCN index.On this point we refer to the good correlation we found be-tween theBx deflections of the tail lobe (Cluster-1) and themonotonic rise of the PCN index marked by vertical dashedguidelines in Fig.7. Estimates of the dawn–dusk-directed taillobe induction electric field (ETL ∼ (1Bx/1t) · Lz), as wellas its scale size in theY dimension (LY ≥ 20RE), which arederived on the basis of the favourable configuration of Geo-tail and Cluster-1, were used to calculate the polar cap con-vection response during the initial substorm expansion phase.The contribution to the CPCP is estimated from the followingrelation: CPCP= (0.1–0.2)· ETL · LY ≈ 30–60 kV. This cor-responds to the observed 1.5 to 3 mV m−1 increases of thePCN index. Due to the lack of spacecraft coverage (Geotail–Cluster) beyondYGSM = ±10RE the inferred CPCP valuesare lower limits.
The broader ionospheric context of the SCW documentedin this paper is based on readings from the IMAGE chainmagnetometer data in the postnoon sector (EEJ activity near14:00–15:00 MLT) combined with Alaska chain data fromthe midnight sector (WEJ activity near 24:00 MLT). In thisway we can monitor ionospheric signatures of the “inner”and “outer” loops of the SCW–PRC system. The “inner loop”consists of the PRC–EEJ (on the dusk side) connection via aBostrøm type II system. The outer loop consists of the con-nection between the CTC (disruption of the cross-tail cur-rent) and the WEJ via a Bostrøm type I system (see Fig. 1).Thus, in our extended two loop model of the SCW we specifythe connection between the standard “inner loop” (Sergeevet al., 2014) and the EEJ (dusk side) via a Bostrøm type IIcurrent system (our Fig. 1). This extension of the standardtwo-loop model of the SCW is essential in order to obtaina relevant description of M–I coupling and the timescalesof the system. By combining ground observations relatingto ionospheric manifestations of both current loops (WEJat 24:00 MLT and EEJ at 14:00–15:00 MLT) we are ableto determine the characteristic time of activation/expansionof the complex substorm current system. In the case of the11:00 UT event we note a 17 min delay between the majorintensification of the WEJ (Alaska chain) at 11:00 UT (WEJat 24:00 MLT, representing activation of the “outer loop”)and the full expansion of the EEJ activation (IMAGE data)to 14:00–15:00 MLT (representing the “inner loop”). This17 min interval corresponds to the injection of plasma (PS)from the “outer” to the “inner loop” and the associated brak-ing and azimuthal deflection of the plasma at the PS–PRCboundary which constitutes a dynamo (E · J < 0) for theBostrøm type II system, as indicated schematically in Fig. 1.
The sawtooth substorm events are furthermore discussedin relation to magnetotail reconnection on the basis of Windobservations of reconnection signatures atX = −77RE (ionflux variations in relation to magnetic field configurations)and the polar cap index (PCN). This effort lead us to distin-guish between the following three substorm stages:
i. an initial transient phase dominated by
a. large-scale magnetic field dipolarization in the az-imuthal (21:00–03:00 MLT) and radial dimensionsof the PS (activation of inner and outer loops ofSCW-EEJ/WEJ activity) and
b. tail lobe magnetic perturbations with associated in-ductive electric field coupling to the polar cap iono-sphere (PCN monotonic rise);
ii. a persistent phase of PS field dipolarization(s) and cor-responding electrojet (EEJ/WEJ)–PCN activity;
iii. a phase of PS and tail lobe magnetic field stretching,partial recovery of electrojet activity, and PCN decreasetowards the background level (dayside source) after thecessation of magnetotail reconnection.
In summary, we emphasize two elements of our study: (i) acombination of M–I data sets is discussed within the frame-work of a two-loop model of the SCW/PRC–ionosphere con-nection applicable to the prevailing substorm activity wherewe identify “outer” and “inner loop” manifestations in thenear-Earth plasma sheet (GOES data)–auroral oval/midnight(Alaska chain data) and in the oval south regime at 14:00–15:00 MLT (IMAGE chain data), respectively, and (ii) obser-vations of inductive electric field coupling between the mag-netotail lobes (Geotail–Cluster data) and the polar cap iono-sphere (PCN index), i.e. excitation of PC convection, lead-ing us to make a qualified estimate of its contribution to thecross-polar cap potential.
Acknowledgements.We thank the Geophysical Institute, Universityof Alaska, Fairbanks, for access to geomagnetic data obtained fromthe Alaska meridian chain of magnetometers. We thank the insti-tutions who maintain the IMAGE array of magnetometers (FMI,Finland, and Geophysical Observatory, Tromsø, Norway). IMAGEdata used in this study were obtained fromwww.geo.fmi.fi/image.Work supported in part by NASA grants NNX10AQ29G andNNX13AP39G.
Topical Editor L. Blomberg thanks A. Kullen and the twoanonymous referees for their help in evaluating this paper.
References
Aikio, A. T., Sergeev, V. A., Shukhtina, M. A., Vagina, L. I.,Angelopoulos, V., and Rees, G. D.: Characteristics of pseudo-breakups and substorms observed in the ionosphere, at geosyn-chronous orbit, and in the midtail, J. Geophys. Res., 104, 12263–12287, doi:10.1029/1999JA900118, 1999.
Akasofu, S.-I.: The development of the auroral substorm, Planet.Space Sci., 12, 273–282, 1964.
Akasofu, S.-I.: The relationship between the magnetosphere andmagnetospheric/auroral substorms, Ann. Geophys., 31, 387–394,doi:10.5194/angeo-31-387-2013, 2013.
www.ann-geophys.net/32/1277/2014/ Ann. Geophys., 32, 1277–1291, 2014

1290 P. E. Sandholt and C. J. Farrugia: Aspects of M–I coupling in sawtooth substorms
Birn, J. and Hesse, M.: The substorm current wedge inMHD simulations, J. Geophys. Res., 118, 3364–3376,doi:10.1002/jgra.50187, 2013.
Bostrøm, R.: A model of the auroral electrojets, J. Geophys. Res.,69, 4983–4999, 1964.
Bostrøm, R.: Currents in the ionosphere and magnetosphere, in: TheBirkeland Symposium on Aurora and Magnetic Storms, editedby: Egeland, A. and Holtet, J., 445–458, C.N.R.S., Sandefjord,1967.
Chen, C. X. and Wolf, R. A.: Interpretation of high-speed flows inthe plasma sheet, J. Geophys. Res., 98, 21409–21419, 1993.
Cowley, S. W. H.: The role and location of magnetic reconnectionin the geomagnetic tail during substorms, in: SUBSTORMS 1,ESA SP-335, 401–404, 1992.
Friedrich, E., Samson, J. C., Voronkov, I., and Rostoker, G.: Dy-namics of the substorm expansive phase, J. Geophys. Res., 106,13145–13163, 2001.
Gordeev, E. I., Sergeev, V., Pulkkinen, T. I., and Palmroth, M.:Contribution of magnetotail reconnection to the cross-polarcap electric potential drop, J. Geophys. Res., 116, A08219,doi:10.1029/2011JA016609, 2011.
Henderson, M. G., Skoug, R., Donovan, E., Thomsen, M. F.,Reeves, G. D., Denton, M. H., Singer, H. J., McPherron, R. L.,Mende, S., Immel, T. J., Sigwarth, J. B., and Frank, L. A.: Sub-storms during the 10–11 August 2000 sawtooth event, J. Geo-phys. Res., 111, A06206, doi:10.1029/2005JA011366, 2006.
Kan, J. R. and Lee, L. C.: Energy coupling function and solar wind-magnetosphere dynamo, Geophys. Res. Lett., 6, 577–580, 1979.
Katus, R. M., Liemohn, M. W., Gallagher, D. L., Ridley, A.,and Zou, S.: Evidence for potential and inductive convec-tion during intense geomagnetic events using normalized su-perposed epoch analysis, J. Geophys. Res., 118, 181–191,doi:10.1029/2012JA017915, 2013.
Koskinen, H. E. J., Lopez, R. E., Pellinen, R., Pulkkinen, T. I.,Baker, D. N., and Bøsinger, T.: Pseudobreakup and substormgrowth phase in the ionosphere and magnetosphere, J. Geophys.Res., 98, 5801–5813, 1993.
Kozelova, T. V., Pudovkin, M. I., and Treilhou, J. P.: Developmentof the auroral bulge and dipolarization at 6.6rE, in: SUBSTORM1, ESA SP-335, 1992.
Kullen, A., Ohtani, S., and Karlsson, T.: Geomagnetic signaturesof auroral substorms preceded by pseudobreakups, J. Geophys.Res., 114, A04201, doi:10.1029/2008JA013712, 2009.
Kullen, A., Karlsson, T., Cumnock, J. A., and Sundberg,T.: Occurrence and properties of substorms associatedwith pseudobreakups, J. Geophys. Res., 115, A12310,doi:10.1029/2010JA015866, 2010.
Lavraud, B. and Borovsky, J. E.: Altered solar wind-magnetosphereinteraction at low Mach numbers: Coronal mass ejections,J. Geophys. Res., 113, A00B08, doi:10.1029/2008JA013192,2008.
Lockwood, M., Hairston, M., Finch, I., and Roillard, A.: Transpolarvoltage and polar cap flux during the substorm cycle, J. Geophys.Res., 114, A0120, doi:10.1029/2008JA013697, 2009.
Lopez, R. E. and Freeman, J. W.: Solar wind proton temperature-velocity relationship, J. Geophys. Res., 91, 1701–1705, 1986.
Lui, A. T. Y.: A synthesis of magnetospheric substorm models, J.Geophys. Res., 96, 1849–1856, doi:10.1029/90JA02430, 1991.
Lui, A. T. Y.: Auroral activity associated with fast plasma flows inthe magnetotail, Geophys. Res. Lett., 27, 3245–3248, 2000.
Lui, A. T. Y. and Murphree, J. S.: A substorm with onsettied to an auroral arc, Geophys. Res. Lett., 25, 1269–1272,doi:10.1029/98GL00758, 1998.
McPherron, R. L., Russell, C. T., and Aubry, M. A.: Satellite stud-ies of magnetospheric substorms on August 15, 1968, 9, phe-nomenological model for substorms, J. Geophys. Res., 78, 3131–3149, 1973.
Nakamura, R., Baker, D. N., Belian, R. D., and Yamamoto, T.: Spa-tial scale of the substorm onset region determined from multi-point satellite and ground-based observations, in: SUBSTORMS1, ESA SP-335, 353–357, 1992.
Nakamura, R., Baker, D. N., Yamamoto, T., Belian, R. D.,Bering III, E. A., Benbrook, J. R., and Theall, J. R.: Particleand field signatures during pseudobreakup and major expansiononset, J. Geophys. Res., 99, 207–221, doi:10.1029/93JA02207,1994.
Nielsen, E. and Greenwald, R. A.: Electron flow and visual auroraat the Harang discontinuity, J. Geophys. Res., 84, 4189–4200,1979.
Noah, M. A. and Burke, W. J.: Magnetospheric conditions for saw-tooth event development, J. Geophys. Res., 119, 2494–2511,doi:10.1002/2013JA019573, 2014.
Pulkkinen, T. I., Baker, D. N., Wiltberger, M., Goodrich, C., Lopez,R. E., and Lyon, J. G.: Pseudobreakup and substorm onset: Ob-servations and MHD simulations compared, J. Geophys. Res.,103, 14847–14854, 1998.
Pulkkinen, T. I., Partamies, N., McPherron, R. L., Henderson, M.,Reeves, G. D., Thomsen, M. F., and Singer, H. J.: Comparativestatistical analysis of storm time activations sawtooth events, J.Geophys. Res., 112, A01205, doi:10.1029/2006JA012024, 2007.
Richardson, I. G. and Cane, H. V.: Near-Earth interplanetary coro-nal mass ejections during solar cycle 23 (1996–2009): Catalogand summary of properties, Sol. Phys., 264, 189–237, 2010.
Sandholt, P. E., Andalsvik, Y. L., and Farrugia, C. J.: The pulsednature of the nightside contribution to polar cap convection:repetitive substorm activity under steady interplanetary driving,Ann. Geophys., 30, 1539–1553, doi:10.5194/angeo-30-1539-2012, 2012.
Sandholt, P. E., Farrugia, C. J., and Denig, W. F.: M–I couplingacross the auroral oval at dusk and midnight: repetitive substormactivity driven by interplanetary coronal mass ejections (CMEs),Ann. Geophys., 32, 333–351, doi:10.5194/angeo-32-333-2014,2014.
Sauvaud, J.-A., Jacquey, C., Oka, M., Palin, L., Fruit, G., Kistler, L.M., Balough, A., Cao, J. B., Reeves, G., Mukai, T., Shinohara, I.,and Grigorenko, E.: A study of the near-Earth plasma sheet andlobe driven by multiple substorms: Comparisons with a full par-ticle simulation of reconnection, J. Geophys. Res., 117, AO1221,doi:10.1029/2011JA017033, 2012.
Sergeev, V. A., Liou, K., Newell, P. T., Ohtani, S.-I., Hairston, M. R.,and Rich, F.: Auroral streamers: characteristics of associated pre-cipitation,convection and field-aligned currents, Ann. Geophys.,22, 537–548, doi:10.5194/angeo-22-537-2004, 2004.
Sergeev, V. A., Tsyganenko, N. A., Smirnov, M. V., Nikolaev, A. V.,Singer, H. J., and Baumjohann, W.: Magnetic effects of the sub-storm current wedge in a “spread-out-wire” model and their com-
Ann. Geophys., 32, 1277–1291, 2014 www.ann-geophys.net/32/1277/2014/
P. E. Sandholt and C. J. Farrugia: Aspects of M–I coupling in sawtooth substorms 1291
parison with ground, geosynchronous, and tail lobe data, J. Geo-phys. Res., 116, A07218, doi:10.1029/2011JA016471, 2011.
Sergeev, V. A., Angelopoulos, V., and Nakamura, R.: Recent ad-vances in understanding substorm dynamics, Geophys. Res.Lett., 39, L0511, doi:10.1029/2012GL050859, 2012.
Sergeev, V. A., Nikolaev, A. V., Tsyganenko, N. A., Angelopoulos,V., Runov, A. V., Singer, H. J., and Yang, J.: Testing a two-looppattern of the substorm current wedge, J. Geophys. Res., 119,947–963, doi:10.1002/2013JA019629, 2014.
Sitnov, M. I., Swisdak, M., and Divin, A. V.: Dipolarization fronts asa signature of transient reconnection in the magnetotail, J. Geo-phys. Res., 114, A04202, doi:10.1029/2008JA013980, 2009.
Troshichev, O. and Janzhura, A.: Relationship between the PC andAL indices during repetitive bay-like magnetic disturbances inthe auroral zone, J. Atmos. Sol.-Terr. Phy., 71, 1340–1352, 2009.
Troshichev, O. A., Lukianova, R. Y., Papitashvili, V. O., Rich, F. J.,and Rasmussen, O.: Polar cap index (PC) as a proxy for iono-spheric electric field in the near-pole region, Geophys. Res. Lett.,27, 3809–3812, doi:10.1029/2000GL003756, 2000.
www.ann-geophys.net/32/1277/2014/ Ann. Geophys., 32, 1277–1291, 2014