asia/world energy outlook 2015eneken.ieej.or.jp/data/6379.pdf · executive summary 2 asia/world...
TRANSCRIPT

Executive summary
ASIA / WORLD ENERGY OUTLOOK 2015
- Analyses of oil pricing and climate change measures under new circumstances -
IEEJ:October 2015, All Rights Reserved.

The Institute of Energy Economics, Japan © 2015
IEEJ:October 2015, All Rights Reserved.

Executive summary
Asia/World Energy Outlook 2015 1
Executive summary Greatly changed surroundings for international oil market Why are oil prices attracting attention now?
▌ Oil prices’ plunge since the second half of 2014 has led us to recognise their importance for global political, economic and energy situations. They not only represent the prices of the world’s largest energy source but also serve as a benchmark for natural gas prices mainly in Asia, exerting great influences over the global energy supply-demand balance and options. Price fluctuations of the world’s largest traded commodity can bring about income and wealth relocations in line with its massive trading volume, and can greatly shake the balance of power in the world economy and international politics. Oil prices plunged after remaining above $100 per barrel since 2012, attracting interests throughout the world again.
Figure 1 Real oil price and OECD economic growth
▌ There are many uncertainties about the future course of oil prices. In the past, this
Outlook projected specific oil price levels under the assumption that oil prices will follow an upward trend over a medium to long term. This is because global oil demand was expected to continue to grow in the future and higher-cost oilfield development would have to be implemented to make up for a decline in production from currently operating oilfields and secure new oil supply sources to satisfy the increasing demand. Specifically, if global oil demand increases at an annual average pace of 1 million barrels per day (Mb/d) in the future, the cumulative demand expansion through 2020 will be 5 Mb/d. At present, the international oil market has a supply surplus of a little more than 1 Mb/d. Given the abovementioned demand growth, however, some higher-cost oil production will be required partly due to a drop in production at currently operating oilfields,
-4%
-2%
0%
2%
4%
6%
8%
10%
12%
0
20
40
60
80
100
120
1970 1980 1990 2000 2010
GD
P growth
Real
oil
pric
e ($
2014
/bbl
)
OECDGDP growth
Real oil price
1st
oil crisis
2nd
oil crisis
OPEC shareslips below 30%
Gulf War
Asian currencycrisis
Lehman
Shock
Rise of unconventionalcrude oil
IEEJ:October 2015, All Rights Reserved.
Executive summary
Asia/World Energy Outlook 2015 2
despite an expected increase in production in major Middle Eastern oil producing countries. Therefore, oil prices are expected to rise to $75/bbl, or higher, in 2020. In and after 2020, a continued expansion in demand and relevant investment (including investment in higher-cost oil production) could exert upward pressure on oil prices, leading oil prices to exceed $100/bbl in 2030.
▌ However, current oil prices, from which the future prices are projected, have fallen to extremely low levels due to the plunge since the second half of 2014. Given progress in the shale revolution, potential growth in production in Iraq, Iran and other members of the Organization of the Petroleum Exporting Countries (OPEC) and energy conservation affecting oil demand growth, as well as the recent weakness of oil prices, we cannot necessarily conclude that oil prices could follow an upward trend as earlier expected. Therefore, we have analysed a Lower Price Scenario in which an oil price hike will be very limited. As indicated on Page 9 more specifically, the benchmark oil price will be limited to $70/bbl (or even lower) in 2020 due to a slack demand increase and a substantial expansion in unconventional crude oil production, and to $75/bbl in 2030 with a price hike remaining restricted. As the factors behind the oil price plunge have raised the global interest into a future scenario that differs far from the traditional one, we must conduct an analysis responding to such growing interests.
Crude oil market history and latest price plunge, and oil pricing factors
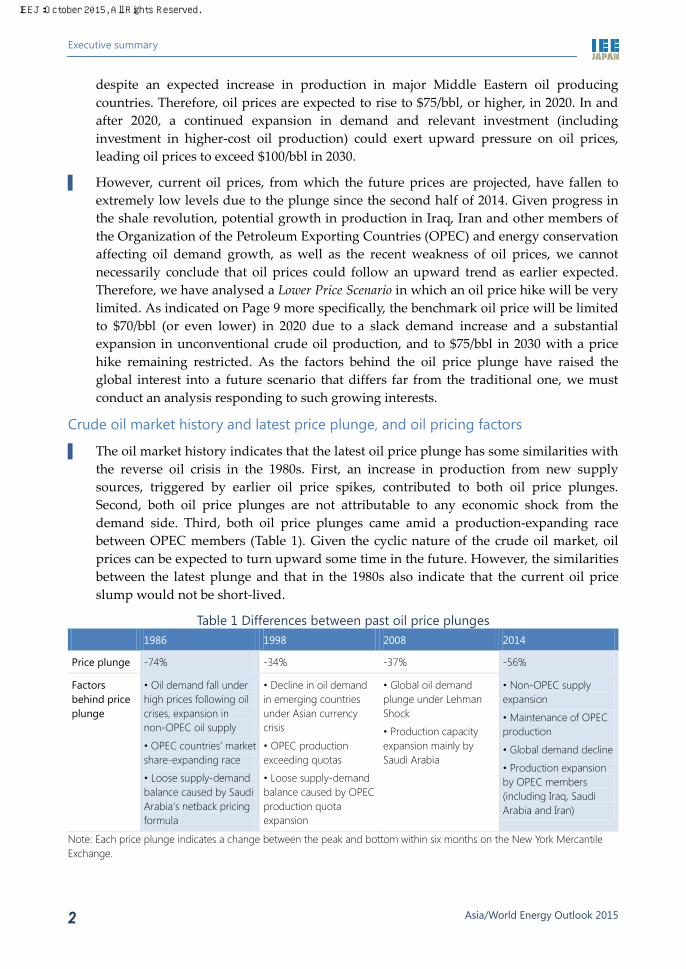
▌ The oil market history indicates that the latest oil price plunge has some similarities with the reverse oil crisis in the 1980s. First, an increase in production from new supply sources, triggered by earlier oil price spikes, contributed to both oil price plunges. Second, both oil price plunges are not attributable to any economic shock from the demand side. Third, both oil price plunges came amid a production-expanding race between OPEC members (Table 1). Given the cyclic nature of the crude oil market, oil prices can be expected to turn upward some time in the future. However, the similarities between the latest plunge and that in the 1980s also indicate that the current oil price slump would not be short-lived.
Table 1 Differences between past oil price plunges 1986 1998 2008 2014
Price plunge -74% -34% -37% -56%
Factors behind price plunge
• Oil demand fall under high prices following oil crises, expansion in non-OPEC oil supply
• OPEC countries’ market share-expanding race
• Loose supply-demand balance caused by Saudi Arabia’s netback pricing formula
• Decline in oil demand in emerging countries under Asian currency crisis
• OPEC production exceeding quotas
• Loose supply-demand balance caused by OPEC production quota expansion
• Global oil demand plunge under Lehman Shock
• Production capacity expansion mainly by Saudi Arabia
• Non-OPEC supply expansion
• Maintenance of OPEC production
• Global demand decline
• Production expansion by OPEC members (including Iraq, Saudi Arabia and Iran)
Note: Each price plunge indicates a change between the peak and bottom within six months on the New York Mercantile Exchange.
IEEJ:October 2015, All Rights Reserved.
Executive summary
Asia/World Energy Outlook 2015 3
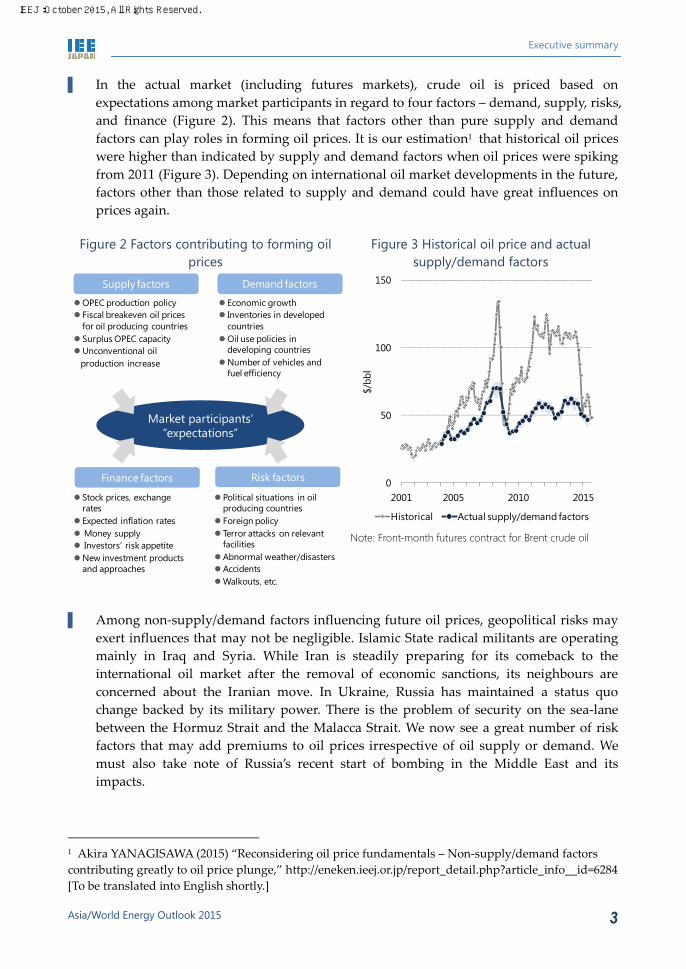
▌ In the actual market (including futures markets), crude oil is priced based on expectations among market participants in regard to four factors – demand, supply, risks, and finance (Figure 2). This means that factors other than pure supply and demand factors can play roles in forming oil prices. It is our estimation1 that historical oil prices were higher than indicated by supply and demand factors when oil prices were spiking from 2011 (Figure 3). Depending on international oil market developments in the future, factors other than those related to supply and demand could have great influences on prices again.
Figure 2 Factors contributing to forming oil prices
Figure 3 Historical oil price and actual supply/demand factors
Note: Front-month futures contract for Brent crude oil
▌ Among non-supply/demand factors influencing future oil prices, geopolitical risks may
exert influences that may not be negligible. Islamic State radical militants are operating mainly in Iraq and Syria. While Iran is steadily preparing for its comeback to the international oil market after the removal of economic sanctions, its neighbours are concerned about the Iranian move. In Ukraine, Russia has maintained a status quo change backed by its military power. There is the problem of security on the sea-lane between the Hormuz Strait and the Malacca Strait. We now see a great number of risk factors that may add premiums to oil prices irrespective of oil supply or demand. We must also take note of Russia’s recent start of bombing in the Middle East and its impacts.
1 Akira YANAGISAWA (2015) “Reconsidering oil price fundamentals – Non-supply/demand factors contributing greatly to oil price plunge,” http://eneken.ieej.or.jp/report_detail.php?article_info__id=6284 [To be translated into English shortly.]
Market participants’ “expectations”
Supply factors
OPEC production policy Fiscal breakeven oil prices
for oil producing countries Surplus OPEC capacityUnconventional oil
production increase
Finance factors
Stock prices, exchange rates
Expected inflation rates Money supply Investors’ risk appetiteNew investment products
and approaches
Risk factors
Political situations in oil producing countries
Foreign policy Terror attacks on relevant
facilitiesAbnormal weather/disastersAccidentsWalkouts, etc.
Economic growth Inventories in developed
countriesOil use policies in
developing countriesNumber of vehicles and
fuel efficiency
Demand factors
0
50
100
150
2001 2005 2010 2015
$/bb
l
Historical Actual supply/demand factors
IEEJ:October 2015, All Rights Reserved.

Executive summary
Asia/World Energy Outlook 2015 4
Asia/world energy supply and demand outlook Energy consumption will expand 1.4-fold in 27 years. Fossil fuels will continue to account for most of energy consumption.
▌ The growth in primary energy consumption in the world is decelerating. In the Reference Scenario in which the current trends of social, economic, policy and technology changes regarding energy supply and demand are assumed to continue, however, global energy consumption will increase by 5,408 million tonnes of oil equivalent (Mtoe) from 13,555 Mtoe in 2013 to 18,963 Mtoe in 2040. The increase exceeds a combination of current consumption in China, the world’s largest energy consumer, and the United States in the second position.
▌ Energy consumption will increase primarily in countries outside the Organisation for Economic Cooperation and Development (OECD). Non-OECD countries will expand energy consumption by 4,871 Mtoe by 2040, accounting for 90% of the global increase. Among them, China, India and the Association of Southeast Asian Nations (ASEAN) members will capture 55%. In contrast, OECD countries will command only 5% of the global energy consumption increase.
▌ At present, fossil fuels (oil, coal and natural gas) account for 81% of primary energy consumption. The situation will not change greatly as they cover 70% of new future energy demand. While hopes are placed on non-fossil fuels, even their combination is likely to fall short of rivalling any of the three fossil fuels.
Figure 4 Global primary energy consumption
▌ Oil consumption, which stood at 87.1 Mb/d in 2013, will increase to more than 100 Mb/d
in the mid-2020s and reach 113.7 Mb/d in 2040, driven by demand growth in the transport sector including automobiles. The increase of 26.6 Mb/d from 2013 to 2040 exceeds the present crude oil production in Middle Eastern and North African OPEC members at 25.2 Mb/d. Even in 2040, oil remains the largest energy source.
8,768
10,057
13,555
15,207
17,211
18,963
0
5,000
10,000
15,000
20,000
1990 2000 2013 2020 2030 2040
Mto
e
Natural gas
Oil
Coal
Biomass and wastes
Nuclear
Other renewables
Hydro
+5,408
IEEJ:October 2015, All Rights Reserved.

Executive summary
Asia/World Energy Outlook 2015 5
▌ The oil supply-demand balance is loose due to growing unconventional oil production in the United States, OPEC’s strategy of giving priority to market shares and emerging economies’ slow down. After a substantial United States` production expansion lasting until around 2020, however, the world will grow more dependent on a production increase from traditional oil-producing countries, including those in the Middle East. Given considerable time and investment required for oil resources development and many oil-producing countries’ restrictions on foreign investment, it is not easy to expand new supply capacity. How the present low oil prices would affect supply expansion investment would have to be assessed prudently, with strategic responses being considered.
Figure 5 Oil consumption changes Figure 6 Crude oil supply changes
▌ Natural gas will post a faster consumption increase than any other energy source,
replacing coal as the second largest energy source after oil by 2040. Although the final consumption sector (covering buildings, industry, non-energy use and transport) accounted for more than half of natural gas consumption until 2006, the power generation sector and the final consumption sector each will capture a little more than 40% of an increase of 2.23 trillion cubic metres (TCM) in natural gas consumption to 5.75 Tcm in 2040.
▌ Liquefied natural gas (LNG) demand will more than double from 239 million tonnes (Mt: 0.33 Tcm) in 2014 to 547 Mt (0.74 Tcm), accounting for 46% (compared with 33% in 2014) of natural gas trade between major regions. Natural gas trade will be further diversified as production and consumption areas increase against the backdrop of growing consumption of unconventional gas resources. LNG will play a key role in supporting the diversification.
▌ Coal consumption will decelerate its growth in the future, after expanding to cover 45% of global energy consumption growth since the beginning of this century. While coal consumption is expected to increase by 17% to 6,539 million tonnes of coal equivalent
4.2
4.2
3.6
3.4
3.0
3.0
-3.2
1.5
2.4
1.0
1.0
1.5
1.5
-0.5
-4 -2 0 2 4
India
China
Other non-OECD
ASEAN
Internationalbunkers
Middle East/North Africa
OECD
Mb/d
2013-2020 2020-2040
10.6
2.5
2.3
2.0
1.2
0.2
0.1
0.6
0.2
1.5
0.6
0.3
0.8
2.7
0 2 4 6 8 10 12
Middle East OPEC
Europe/Eurasia
Latin America
Other OPEC
Others
Africa
North America
Mb/d
2013-2020 2020-2040
IEEJ:October 2015, All Rights Reserved.

Executive summary
Asia/World Energy Outlook 2015 6
(Mtce)2 in 2040, the growth rate is the lowest among energy sources. The great change is attributable to Chinese developments, including slowing economic growth and an emerging shift to a cleaner energy mix, and their effects. In the second half of the Outlook period, India’s influence on global coal consumption will remarkably grow stronger. Steam coal for power generation will account for most of global coal consumption growth. While Europe and the United States with relatively easier access to cheap natural gas are switching from coal to natural gas, cleaner use of coal has great significance in Asia.
▌ Coal trade will increase, centering on steam coal trade for the Asian market where coal demand will increase. In place of China that has rapidly expanded its coal imports, India and ASEAN will increase their coal imports. Among coal-exporting countries, Indonesia will reduce exports due to growing domestic demand and its coal resources protection policy, after its past fast increase in steam coal exports. Coal importers will thus grow more dependent on Australia.
Figure 7 Natural gas consumption Figure 8 Coal consumption changes
Note: Annual average change in each period
▌ Final electricity consumption has continuously been increasing in the past, excluding
2009 when consumption fell on the global financial crisis, and will continue to expand in each region, irrespective of economic development stages or geographical conditions. Particularly, non-OECD will post remarkable growth in electricity consumption after surpassing OECD in 2012. By 2040, electricity consumption growth in China will be equivalent to four times Japan’s present consumption; Indian growth will be equivalent to 2.5 times.
▌ Power generation will remain heavily dependent on fossil fuels (accounting for nearly 70% of total generation). However, coal-fired power generation will reduce its share by 7 percentage points to 35% due to a drop in Europe and the United States. Instead,
2 1 Mtce = 0.7 Mtoe.
China
Other non-OECD Asia
Middle East/North Africa
Othernon-OECD
Internationalbunkers
OECD
Power generation
Final consumption
Others
3.52
5.75 5.75
0
2
4
6
2013 2040 2040
Tcm
23
149
235 -4
8
21
1822 32
-50
0
50
100
150
200
1990-2000
2000-2013
2013-2020
2020-2030
2030-2040
Mtc
e Others
India
China
IEEJ:October 2015, All Rights Reserved.

Executive summary
Asia/World Energy Outlook 2015 7
natural gas-fired power generation will increase its share by 7% points to 28%. Nuclear and renewable energy will retain their respective present shares of power generation.
Figure 9 Increases in final electricity consumption in selected regions
Figure 10 Global power generation mix
Note: The vertical line indicates Japan’s consumption at 950 TWh in 2013.
▌ Renewable energy’s share of power generation will stand at 23% in 2040, changing little
from 22% at present. However, wind and solar photovoltaics power generation will expand fast from 789 terawatt hours (TWh) in 2013 to 2,778 TWh in 2040 due to policy support and technological development, accounting for 7% of total power generation. Power generation capacity will grow 3.1-fold to 998 gigawatts (GW) for wind power and 5.5-fold to 749 GW for solar PV. Hydropower generation will increase slowly, while its share will decline with large-scale development decelerating.
▌ Nuclear power generation will increase from 2,478 TWh in 2013 to 4,321 TWh in 2040, though with its share of total power generation remaining almost unchanged from 11% at present, as is the case with renewable energy. Nuclear power generation capacity will decline in seven countries and regions, including Germany that plans to terminate nuclear power generation in the 2020s and Japan that is expected to cut capacity by 23 GW by 2040. In contrast, 32 countries will expand nuclear power generation capacity, including 13 planning to introduce nuclear power generation. Global nuclear power generation capacity will expand from 389 GW in 2013 to 610 GW in 2040.
Towards energy conservation and decarbonisation There is no Royal Road to energy conservation, but there are basic principles.
▌ Five energy conservation principles: (1) understanding the significance of energy conservation, (2) checking energy consumption, (3) taking action for energy conservation, (4) improving equipment efficiency, and (5) promoting innovation with latest
Japan (2013)
3,823
2,393
1,619
1,249
827
671
0 1,000 2,000 3,000 4,000
China
India
ASEAN
Middle East/North Africa
United States
European Union
TWh2013-2020 2020-2040
9.6 10.4 12.1 13.7
5.16.3
8.8
11.2
2.53.2
3.8
4.3
3.8
4.3
4.7
5.0
0.9
1.5
2.3
3.0
23.3
27.4
33.5
39.5
0
10
20
30
40
2013 2020 2030 2040
PWh
Biomass and wastes
Other renewables
Hydro
Nuclear
Natural gas
Coal
Oil
IEEJ:October 2015, All Rights Reserved.

Executive summary
Asia/World Energy Outlook 2015 8
technologies such as Internet of Things. Appropriate use or operation of equipment (reducing wasteful use) and maintenance for keeping performance play a key role in energy conservation.
▌ Although energy conservation usually incurs certain costs, in most cases it generates benefits . For example, the introduction of highly efficient lighting may generate cumulative benefits worth $1.4 trillion due mainly to a decline in fuel consumption for power generation and result in an additional cost of $400 billion through 2040, bringing about net benefits worth $1 trillion.
Figure 11 Five energy conservation principles Figure 12 Costs and benefits of highly efficient lighting and energy conservation
▌ In the Advanced Technologies Scenario that assumes maximum carbon dioxide emission
reduction measures based on their application opportunities and acceptability in society, energy consumption in 2040 will be 2,567 Mtoe less than in the Reference Scenario, with the increase from the present level limited to 53% of the growth in the Reference Scenario. Asia including China and India will account for 45% of the energy savings, playing a key role in energy conservation. Particularly, Asia will capture as much as 74% of coal consumption savings. Asia will also command 56% of an increase in consumption of nuclear and non-hydro renewables including solar PV and wind.
▌ Among energy sources, coal mainly for power generation will post the largest consumption decline from the Reference Scenario due to an electricity demand fall, power generation efficiency improvement and switching to other energy sources. Total fossil fuel will be 3,387 Mtoe less than in the Reference Scenario, while nuclear will be 471 Mtoe more and renewables 350 Mtoe more. As a result, fossil fuels’ share of power generation will drop from 81% in 2013 to 70% in 2040.
Realising energy conservation
UnderstandingSignificance/utility/secondary effects
Innovation Integration/
systemisation/automation
•HEMS/BEMS/CEMS• IoT
ImprovementProducts/
technology
•Energy conservation standards
•Development subsidies•Operation and maintenance
•Education: From children to adults
•PR activities: Energy conservation month/events
• International cooperation: Information/policy/technology
• (Experiences: oil crisis/blackout)
CheckingConsumption/energy saving performance
ActionImplementation/
introduction/purchasing
• Legal obligations• Setting targets• Labelling •Subsidies forintroducing equipment
•Correcting energy prices
•Taxation (tax exemption/reduction/levy)
•Energy conservation diagnosis
•Energy conservation monitoring
•Specifying consumption on power/gas bills
•Developing statistics•Energy management•ESCO
0
20
40
60
80
-0.4
-0.2
0.0
0.2
0.4
0.6
0.8
OECD Non-OECD Asia
Energy conservation in 2040 (Mtoe)
Cum
ulat
ive
cost
s and
ben
efits
thro
ugh
2040
($
2014
trill
ion)
Cumulative costs Cumulative benefits
Energy conservation
IEEJ:October 2015, All Rights Reserved.

Executive summary
Asia/World Energy Outlook 2015 9
Figure 13 Primary energy consumption Figure 14 Energy consumption changes [2013-2040]
Results from lower energy prices Lower prices resulting from consumption reduction and resources development will change the world.
▌ In the Lower Price Scenario, we assumed that fossil fuel demand will be held down through policies for energy security, climate change mitigation and other purposes and that the energy supply-demand balance will ease as energy supply capacity expands substantially due to global progress in the development of unconventional oil and natural gas resources through technology advancement. The oil price in 2030 is assumed at $75/bbl in the Lower Price Scenario against $100/bbl in the Reference Scenario.
▌ In the Lower Price Scenario, the effects of strongly promoting energy conservation measures will by far exceed those of global economic expansion (described later) and the rebound caused by lower energy prices. Required energy supply in 2030 will total 16,048 Mtoe, as much as 1,163 Mtoe less than in the Reference Scenario. Oil supply in 2030 will total 96.5 Mb/d with the increase from the present level limited to 7.7 Mb/d due to switching from oil to other energy sources. As unconventional oil production expands substantially mainly in North America, the increase in Middle Eastern oil production will be limited to 1.0 Mb/d, with Russia forced to reduce oil production by 0.8 Mb/d.
▌ Natural gas production will be affected by energy conservation, while switching to natural gas from other energy sources will make progress. This will not be the case with oil. Natural gas production in 2030 in the Lower Price Scenario will increase by 825 Bcm from the present level to 4,355 Bcm, slipping below 4,971 Bcm in the Reference Scenario. Production will decline substantially in North America, the former Soviet Union, the Middle East and other net exporters affected by demand restrictions in other regions.
Advanced Technologies
16,39613,555
Reference18,963
Advanced Technologies
7,5345,409
Reference8,691
0
5,000
10,000
15,000
20,000
2000 2010 2020 2030 2040
Mto
e
World
Asia
650
1,287
1,839
480
1,1471,393
-822
448
763951
1,497
891
-1,000
0
1,000
2,000
Coal Oil
Nat
ural
gas
Nuc
lear
Rene
wab
les
Elec
tric
ityge
nera
ted
Primary consumption
Mto
eReference Advanced Technologies
IEEJ:October 2015, All Rights Reserved.
Executive summary
Asia/World Energy Outlook 2015 10
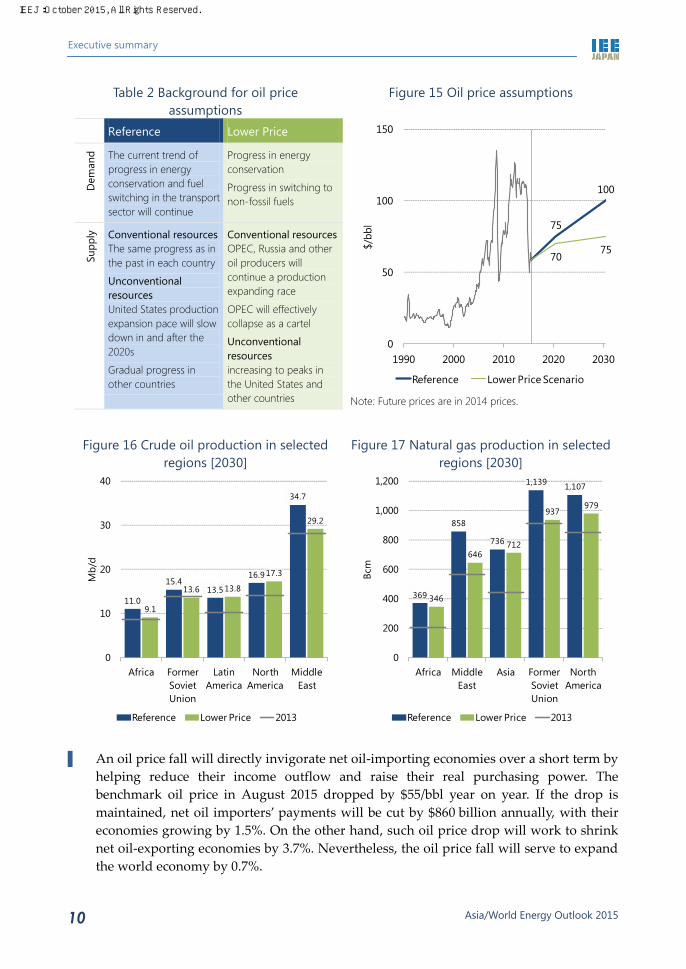
Table 2 Background for oil price assumptions
Figure 15 Oil price assumptions
Reference Lower Price
Dem
and The current trend of
progress in energy conservation and fuel switching in the transport sector will continue
Progress in energy conservation
Progress in switching to non-fossil fuels
Supp
ly
Conventional resources The same progress as in the past in each country
Unconventional resources United States production expansion pace will slow down in and after the 2020s
Gradual progress in other countries
Conventional resources OPEC, Russia and other oil producers will continue a production expanding race
OPEC will effectively collapse as a cartel
Unconventional resources increasing to peaks in the United States and other countries
Note: Future prices are in 2014 prices.
Figure 16 Crude oil production in selected regions [2030]
Figure 17 Natural gas production in selected regions [2030]
▌ An oil price fall will directly invigorate net oil-importing economies over a short term by
helping reduce their income outflow and raise their real purchasing power. The benchmark oil price in August 2015 dropped by $55/bbl year on year. If the drop is maintained, net oil importers’ payments will be cut by $860 billion annually, with their economies growing by 1.5%. On the other hand, such oil price drop will work to shrink net oil-exporting economies by 3.7%. Nevertheless, the oil price fall will serve to expand the world economy by 0.7%.
75
100
7075
0
50
100
150
1990 2000 2010 2020 2030$/
bbl
Reference Lower Price Scenario
11.0
15.413.5
16.9
34.7
9.1
13.6 13.8
17.3
29.2
0
10
20
30
40
Africa Former Soviet Union
Latin America
North America
Middle East
Mb/
d
Reference Lower Price 2013
369
858
736
1,139 1,107
346
646712
937979
0
200
400
600
800
1,000
1,200
Africa Middle East
Asia Former Soviet Union
North America
Bcm
Reference Lower Price 2013
IEEJ:October 2015, All Rights Reserved.

Executive summary
Asia/World Energy Outlook 2015 11
▌ In the Lower Price Scenario in which oil demand will be restricted with oil prices falling, net value3 of crude oil imports and exports will shrink substantially (Figure 18). Net imports of other fossil fuels will also be restricted, benefiting energy-importing economies; the entire world economy will expand by 1.9%. In Middle Eastern and other countries that depend heavily on revenues from energy exports, however, the energy exports decline will exert downward pressures on their economies.
Figure 18 Impacts of loose energy supply-demand balance and low prices [2030]
Net crude oil import/export value in selected regions
Real GDP
Note: Combined effects of energy price drops, fossil fuel savings and use of unconventional oil and natural gas resources ▌ Excessively volatile energy prices could affect appropriate investment on both the
supply and demand sides, destabilising the future supply-demand balance. Promoting constructive discussions between energy producing and consuming countries to share market outlooks and other information and understanding for sound market development for various energy sources like oil, natural gas and LNG will be significant for stabilising energy markets and triggering their sustainable development. To this end, the International Energy Agency (IEA) and OPEC should promote their talks through the International Energy Forum and other forums. To secure communications between energy consuming countries, the IEA should enhance cooperation with China and India that will expand oil imports in the future.
Realistic approach required on climate change issue INDC implementation alone may fail to reduce GHG emissions substantially.
▌ Global energy-related CO2 emissions will increase by 39% from 2013 to 45.9 Gt in 2050 in the Reference Scenario. In the Advanced Technologies Scenario accompanied by carbon
3 Nominal value
99
151
238
336
145
195
795
149
302
340
553
343
1,252
260
0 500 1,000
Japan
United States
Western Europe
China
Africa
Former Soviet Union
Middle East
Net
impo
rts
Net
exp
orts
$ billion
Lower Price Volume contributionPrice contribution Refernece
European Union
ASEAN
United States India
JapanChinaOceania
Russia
Middle East
OthersGlobal
average
-4%
-2%
0%
2%
0 20 40 60 80 100
Low
er P
rice
(com
pare
d w
ith R
eren
ce)
Reference ($2010 trillion)
IEEJ:October 2015, All Rights Reserved.

Executive summary
Asia/World Energy Outlook 2015 12
capture and storage (CCS), CO2 emissions will be reduced by 29% from the present level
to 23.3 Gt. However, the emissions will still fall short of being halved.
▌ Based on intended nationally determined contributions (INDCs) commitments by seven
major countries and the European Union4, global GHG emissions in 2030 are estimated
to be at a level closer to the Reference Scenario than to the Advanced Technologies Scenario.
The United States and Japanese GHG estimates are close to those in the Advanced
Technologies Scenario and the European Union estimate is midway between the estimates
in the Advanced Technologies and Reference Scenarios. The Chinese estimate is close to the
Reference Scenario level, while the Indian estimate exceeds the Reference Scenario level. All
parties will be required to make efforts in line with the Advanced Technologies Scenario.
Particularly, developing countries will have to effectively enhance their GHG emission
reduction efforts.
Figure 19 Global CO2 emissions and each
measure’s contribution to emission
reductions
Figure 20 GHG emissions
Note: GHG emissions for the Reference Scenario and the
Advanced Technologies Scenario plus CCS are assumed
proportional to the energy-related CO2 emissions.
Take advantage of the time left for making balanced efforts with future technologies
and adaptation taken into account.
▌ In the extension of the Reference Scenario, the atmospheric concentration of CO2
-equivalent5 in 2100 will come to 760-860 ppm (parts-per-million CO2-equivalent) with
the average temperature change from the 1850-1900 period reaching 2.8-4.0°C by 2100.
In the extension of the Advanced Technologies Scenario accompanied by CCS, the CO2
4 The seven major countries and the European Union accounted for 65% of global GHG emissions in
2010. 5 As in IPCC 5th assessment report, the “CO2-equivalent concentration” includes the forcing of all GHGs,
as well as aerosols and albedo change.
21.2
32.9
39.5
45.9
32.6
23.3
10
20
30
40
50
1990 2010 2030 2050
GtC
O2
Efficiency
Biofuel
Wind, solar, etc.
Nuclear
Fuel switching
CCS
Reference
Advanced
Technologies +
CCS30
40
50
60
70
2000 2010 2020 2030
GtC
O2-e
q
Reference
INDC
Advanced
Technologies +
CCS
Halving
emissions by
2050
IEEJ:October 2015, All Rights Reserved.

Executive summary
Asia/World Energy Outlook 2015 13
-equivalent concentration in 2100 will total 540-600 ppm, with the temperature change
reaching 1.7-2.4°C the same year. The temperature will thus slip below 2.5°C and could
fall below 2°C, indicating that the scenario could be combined with adaptation
measures6 into an option close to the one that would halve CO2 emissions in 2050 from
2013 and eliminate them in 2100.
▌ If CO2 emission reduction and other climate change mitigation measures 7 are
implemented in the Reference Scenario, mitigation costs will increase with “adaptation
and damage” costs decreasing. Adaptation and damage costs will be less than mitigation
costs over a short to medium term. Over a long term beyond 2050, however, they will
grow larger. While uncertainties are still great regarding these cost estimates, there may
be some point at which a total of mitigation, adaptation and damage costs could be
minimised between the Reference Scenario and the scenario for halving GHG emissions
by 2050. Mitigation, adaptation and damage costs trade off with each other, meaning
that it is impossible to reduce the three simultaneously. A realistic option may be to
balance the three with minimisation of the comprehensive costs kept in mind.
Figure 21 Temperature rise from 1850-1900 Figure 22 Mitigation and adaptation costs
and damage [2100]
Note: Mitigation costs were estimated by the IEEJ. Damage and adaptation costs are based on the formula under the
DICE2013R model8. The climatic sensitivity is assumed at 3°C.
▌ Given climate change effects, it goes without saying that very ambitious GHG
reductions will be required over a long term. For the immediate future, the world should
6 Adaptation measures are designed to prevent adverse effects of climate change, including damage
from sea level rise, farm drought and new disease epidemics. These measures include river and coastal
banks, storage reservoirs, agricultural research, and disease prevention and treatment. 7 Mitigation measures are designed to artificially reduce GHG sources or expand GHG sinks to hold
down greenhouse effects. 8 W. Nordhaus and P. Sztorc (2013), “DICE 2013R: Introduction and User’s Manual”.
http://www.econ.yale.edu/~nordhaus/homepage/documents/DICE_Manual_103113r2.pdf
0
1
2
3
4
2010 2050 2100
°C
Reference Scenario range
Advanced Technologies Scenario range
Halving emissions range
-2
0
2
4
6
8
10
12
14
16
0% 20% 40% 60% 80%
$2014 tri
llio
n/y
ear
Reduction from Reference Scenario
Mitigation costs (A)
Total costs
and damage
(A+B)
Damage and
adaptation costs (B)
IEEJ:October 2015, All Rights Reserved.

Executive summary
Asia/World Energy Outlook 2015 14
seek to lower the CO2-equivalent concentration by adopting the target of the
500-550 ppm category close to the Advanced Technologies Scenario and developing
low-cost technologies for such purposes as energy conservation, CO2 reduction and
absorption. Over a medium to long term, the world should proactively develop
innovative technologies, including carbon capture and use (CCU) – particularly, artificial
photosynthesis –, next-generation nuclear power, space-based solar power and nuclear
fusion, and should adopt a cooperative approach to build worldwide networks linking
national technology development efforts.
IEEJ:October 2015, All Rights Reserved.
Contact :[email protected]