asiapac 2015: 10 questions for equity investors · asiapac 2015: 10 questions for equity investors...
TRANSCRIPT

January 8, 2015
Asia Pacific
AsiaPac 2015: 10 questions
for equity investors
Portfolio Strategy Research
Moderate returns overall; high dispersion offers alpha opportunities
What is AsiaPac’s return prospect and suggested allocation?
We expect 11% price upside and 14% total US$ return. Overweight China,
India, Indonesia, Taiwan. Underweight Australia, Malaysia, Singapore.
Favor sectors with solid/improving EPS growth and/or beneficiaries of
reform. MXAPJ end-15 target 515 (1% lower than previous 520). Key macro
drivers: growth, rates, FX and oil, plus an active political/policy calendar.
China: A or H? India: rally over? Korea: positive surprise?
We raise our targets on China and shift our tactical preference to H shares.
India’s investment case remains strong; use the current consolidation as an
entry opportunity. Korea has the potential to surprise positively, but we
would wait for clearer signs of improvement in the earnings cycle.
Best implementation ideas and areas of opportunity?
We favor stable growth (GSSZSTGW); US vs EU-exposed stocks
(GSSZAPUS vs. GSSZAPEU); reform beneficiaries in China, India, Indonesia;
and secure high yields (GSSZDIV2). Attractive country/sectors include TW
tech, IN software, IN banks, CH internet, CH insurance and CH utilities. Watch
Macau gaming and Korea megacaps for possible entry later in 2015.
What is the impact of the oil price collapse on earnings?
We lower 2015 MXAPJ index EPS growth 2ppt to 6% and raise 2016 EPS
growth 1ppt to 11%. The collapse in oil prices will hurt the energy and
materials sectors, which contribute about 15% to index earnings. We stay
underweight these sectors. Lower oil will help other sectors, but with a lag.
MXAPJ to reach 515 at end 2015; favor areas with better risk/reward
Source: FactSet, MSCI, Goldman Sachs Global Investment Research
Timothy Moe, CFA +852-2978-1328 [email protected] Goldman Sachs (Asia) L.L.C.
Kinger Lau, CFA +852-2978-1224 [email protected] Goldman Sachs (Asia) L.L.C.
Richard Tang, CFA +852-2978-0722 [email protected] Goldman Sachs (Asia) L.L.C.
Sunil Koul +852-2978-0924 [email protected] Goldman Sachs (Asia) L.L.C.
Charles Fang, Ph.D +852-2978-1585 [email protected] Goldman Sachs (Asia) L.L.C.
Nitin Chanduka, CFA (212) 934-5334 [email protected] Goldman Sachs India SPL
Ki Cheong Wong, Ph.D +65-6654-5393 [email protected] Goldman Sachs (Singapore) Pte
Goldman Sachs does and seeks to do business with companies covered in its research reports. As a result, investorsshould be aware that the firm may have a conflict of interest that could affect the objectivity of this report. Investorsshould consider this report as only a single factor in making their investment decision. For Reg AC certification and otherimportant disclosures, see the Disclosure Appendix, or go to www.gs.com/research/hedge.html. Analysts employed bynon-US affiliates are not registered/qualified as research analysts with FINRA in the U.S. This report is intended fordistribution to GS institutional clients only.
The Goldman Sachs Group, Inc. Global Investment Research
AU Banks
TW Tech H/w &
Semis
CN Banks
KR Tech H/w
& Semis
HK Real Estate
AU Metals &
Mining
CN Insu & Other
Fins
HK Insu & Other
Fins
CN Energy
CN Telcos
CN Internet
KR Autos
IN Software Svcs
AU Health Care
Macau Gaming
KR Banks
AU EnergyTW Banks
CN Real Estate
IN Banks
ID Banks
TW Chemicals
-8%
-4%
0%
4%
8%
12%
16%
20%
24%
28%
32%
-2.0X -1.5X -1.0X -0.5X 0.0X 0.5X 1.0X 1.5X 2.0X
12-month fwd. P/E (5-year z-score)
Low valuations &
high growth
High valuations &
low growth
EP
S G
row
th C
AG
R (
201
5-1
6E
)
Low valuations
& low growth
High valuations &
high growth
EP
S G
row
th C
AG
R (
201
5-1
6E
)
Low valuations
& low growth
IN Energy
Low valuations &
high growth
High valuations &
low growth
EP
S G
row
th C
AG
R (
201
5-1
6E
)
Low valuations
& low growth
High valuations &
high growth
EP
S G
row
th C
AG
R (
201
5-1
6E
)
Low valuations
& low growth
IN Energy
470
485
515
450
460
470
480
490
500
510
520
Ju
n-1
4
Se
p-1
4
De
c-1
4
Ma
r-1
5
Ju
n-1
5
Se
p-1
5
De
c-1
5
MXAPJ Price
(3-mo)
(6-mo)
(2015)
GS Forecasts
January 8, 2015
Goldman Sachs Global Investment Research 2
AsiaPac 2015: 10 questions for equity investors
At the start of a new year, we address 10 questions that investors are frequently asking
about Asia Pacific equity markets. We aim at clear and concise responses; further analysis
can be found in our 2015 Outlook report entitled All about alpha (Nov 24, 2014).
1. What are the region’s return prospects and how should investors allocate?
We expect 11% price upside and 14% total US$ return. Overweight China, India,
Indonesia, Taiwan. Underweight Australia, Malaysia, Singapore. Favor sectors with
solid/improving EPS growth and/or beneficiaries of reform.
2. What are the key macro drivers?
Growth, rates (notably US rates), FX (USD strength) and oil (-50% from mid-14).
3. What are the key regional themes and current implementation ideas?
The four main macro factors, plus an active political/policy calendar, drive the themes
of earnings stability and reform. Our implementation ideas are stable growth
(GSSZSTGW); US vs EU-exposed stocks (GSSZAPUS vs. GSSZAPEU); reform
beneficiaries in China, India and Indonesia; and secure high yields (GSSZDIV2).
4. Which country/sectors are appealing?
Comparing 2015/16 EPS growth with the relative valuation of the top 30
country/sectors, we favor Taiwan tech, India software and China internet, and also find
China insurance, China utilities and India banks attractive (albeit with somewhat higher
valuations or lower growth). Monitor Macau gaming and Korea megacaps for
potential entry points later in the year. Emerging themes: India internet, Taiwan IoT.
5. Which of 2014’s winners and laggards are appealing at the start of 2015?
We highlight TSMC, SBI, HKEx, CMS, CCCC & Haitong Sec. among last year’s winners
that may extend their momentum into 2015; and GLP, China Cinda, and GCL-Poly of
last year’s laggards that might reverse their poor performance.
6. China: A or H shares?
We stay overweight China and raise our end-15 MXCN index target to 77 (10X PE) from
74 and CSI300 to 3,800 (12X target PE) from 3,000 to reflect the benefits of pro-growth
monetary policy and reform. A has outperformed H by 19pp since 4Q, and the past 3m
return (49%) ranks in the 93th percentile since 1991. We shift our tactical preference to H
shares given the onshore market’s concentrated gains and 40% valuation premium.
7. India: is the party over?
No. We would use the current consolidation as an entry opportunity. Leading
economic indicators are picking up, the rate cycle will turn down, EPS growth for
2015/16 should be the highest in the region and valuations are back to mid-range.
Increasing supply from divestments may be a near-term hurdle but global funds and
domestic investors are a likely source of incremental demand as the recovery broadens.
8. Korea: potential to surprise positively?
Yes, but we would still wait for signs of improvement in the earnings cycle.
9. What is the impact of collapsing oil prices on corporate earnings?
We lower 2015 MXAPJ earnings growth by 2ppt to 6% and raise 2016 EPS growth by
1ppt to 11%. Asia is a net oil importer, but the energy and materials sectors account for
about 15% of earnings and these will suffer from lower oil prices. For other sectors, the
positive effect of higher revenues and lower oil input costs will be felt with a lag, hence
the upgrade to 2016 forecasts. We stay underweight energy and materials.
10. Will 2015 be another year of sharp downward revisions to consensus earnings?
We think not. In contrast to previous years when starting EPS growth numbers were
high, consensus currently expects 7%, just 1ppt above our updated 6% forecast. Capex
discipline and lower input costs suggest margin stability/improvement.
January 8, 2015
Goldman Sachs Global Investment Research 3
What are the region’s return prospects and suggested allocations?
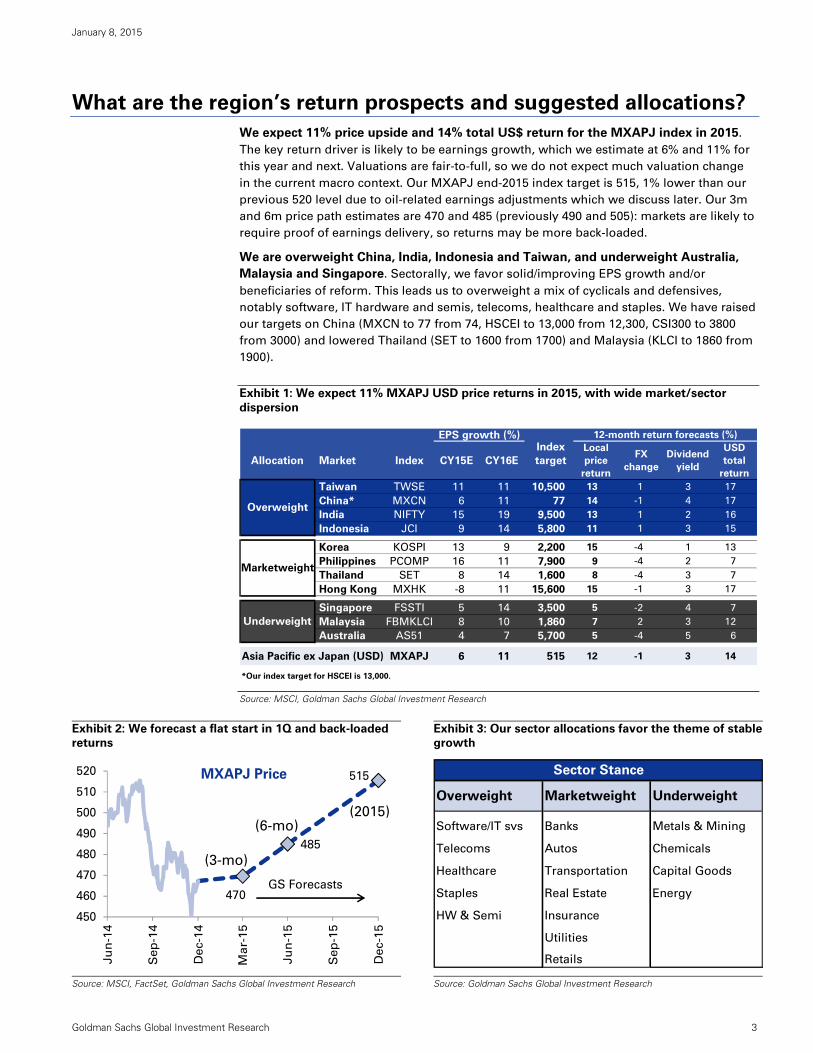
We expect 11% price upside and 14% total US$ return for the MXAPJ index in 2015.
The key return driver is likely to be earnings growth, which we estimate at 6% and 11% for
this year and next. Valuations are fair-to-full, so we do not expect much valuation change
in the current macro context. Our MXAPJ end-2015 index target is 515, 1% lower than our
previous 520 level due to oil-related earnings adjustments which we discuss later. Our 3m
and 6m price path estimates are 470 and 485 (previously 490 and 505): markets are likely to
require proof of earnings delivery, so returns may be more back-loaded.
We are overweight China, India, Indonesia and Taiwan, and underweight Australia,
Malaysia and Singapore. Sectorally, we favor solid/improving EPS growth and/or
beneficiaries of reform. This leads us to overweight a mix of cyclicals and defensives,
notably software, IT hardware and semis, telecoms, healthcare and staples. We have raised
our targets on China (MXCN to 77 from 74, HSCEI to 13,000 from 12,300, CSI300 to 3800
from 3000) and lowered Thailand (SET to 1600 from 1700) and Malaysia (KLCI to 1860 from
1900).
Exhibit 1: We expect 11% MXAPJ USD price returns in 2015, with wide market/sector
dispersion
Source: MSCI, Goldman Sachs Global Investment Research
Exhibit 2: We forecast a flat start in 1Q and back-loaded
returns
Exhibit 3: Our sector allocations favor the theme of stable
growth
Source: MSCI, FactSet, Goldman Sachs Global Investment Research
Source: Goldman Sachs Global Investment Research
EPS growth (%) 12-month return forecasts (%)
Allocation Market Index CY15E CY16E
Local
price
return
FX
change
Dividend
yield
USD
total
return
Taiwan TWSE 11 11 10,500 13 1 3 17
China* MXCN 6 11 77 14 -1 4 17
India NIFTY 15 19 9,500 13 1 2 16
Indonesia JCI 9 14 5,800 11 1 3 15
Korea KOSPI 13 9 2,200 15 -4 1 13
Philippines PCOMP 16 11 7,900 9 -4 2 7
Thailand SET 8 14 1,600 8 -4 3 7
Hong Kong MXHK -8 11 15,600 15 -1 3 17
Singapore FSSTI 5 14 3,500 5 -2 4 7
Malaysia FBMKLCI 8 10 1,860 7 2 3 12
Australia AS51 4 7 5,700 5 -4 5 6
Asia Pacific ex Japan (USD) MXAPJ 6 11 515 12 -1 3 14
*Our index target for HSCEI is 13,000.
Underweight
Index
target
Marketweight
Overweight
470
485
515
450
460
470
480
490
500
510
520
Ju
n-1
4
Sep
-14
De
c-1
4
Ma
r-1
5
Ju
n-1
5
Sep
-15
De
c-1
5
MXAPJ Price
(3-mo)
(6-mo)(2015)
GS Forecasts
Software/IT svs Banks Metals & Mining
Telecoms Autos Chemicals
Healthcare Transportation Capital Goods
Staples Real Estate Energy
HW & Semi Insurance
Utilities
Retails
Sector Stance
Overweight Marketweight Underweight
January 8, 2015
Goldman Sachs Global Investment Research 4
What are the key macro drivers?
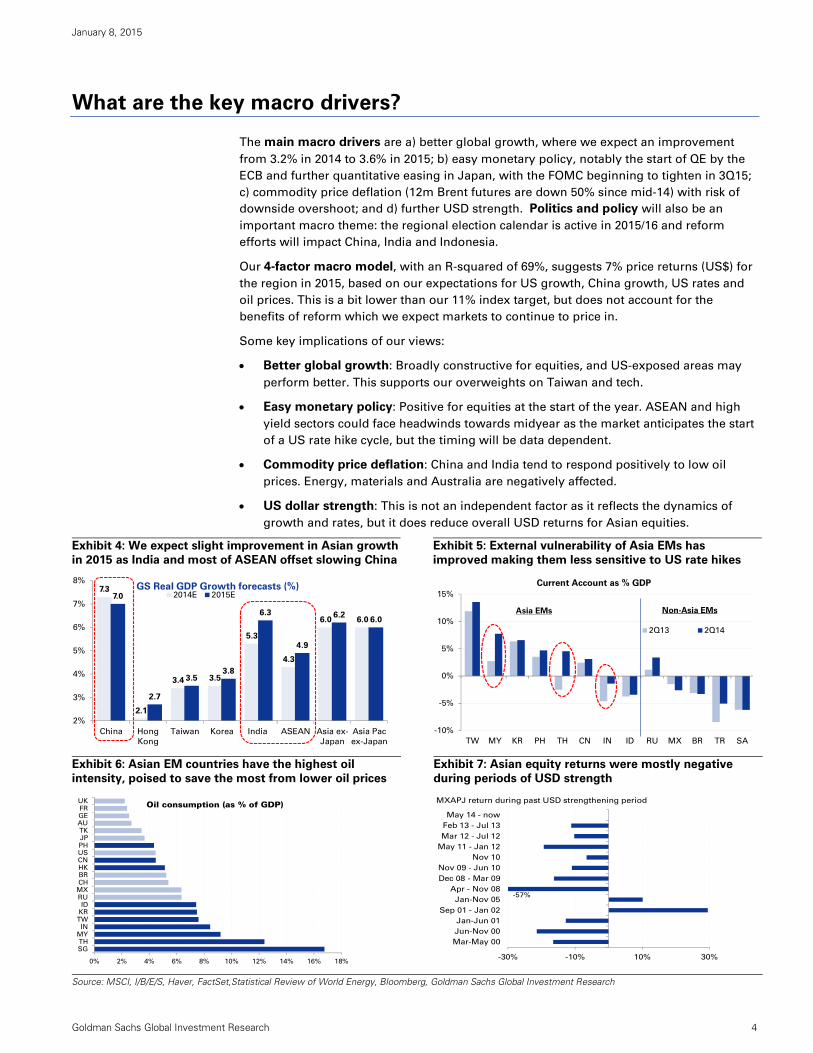
The main macro drivers are a) better global growth, where we expect an improvement
from 3.2% in 2014 to 3.6% in 2015; b) easy monetary policy, notably the start of QE by the
ECB and further quantitative easing in Japan, with the FOMC beginning to tighten in 3Q15;
c) commodity price deflation (12m Brent futures are down 50% since mid-14) with risk of
downside overshoot; and d) further USD strength. Politics and policy will also be an
important macro theme: the regional election calendar is active in 2015/16 and reform
efforts will impact China, India and Indonesia.
Our 4-factor macro model, with an R-squared of 69%, suggests 7% price returns (US$) for
the region in 2015, based on our expectations for US growth, China growth, US rates and
oil prices. This is a bit lower than our 11% index target, but does not account for the
benefits of reform which we expect markets to continue to price in.
Some key implications of our views:
Better global growth: Broadly constructive for equities, and US-exposed areas may
perform better. This supports our overweights on Taiwan and tech.
Easy monetary policy: Positive for equities at the start of the year. ASEAN and high
yield sectors could face headwinds towards midyear as the market anticipates the start
of a US rate hike cycle, but the timing will be data dependent.
Commodity price deflation: China and India tend to respond positively to low oil
prices. Energy, materials and Australia are negatively affected.
US dollar strength: This is not an independent factor as it reflects the dynamics of
growth and rates, but it does reduce overall USD returns for Asian equities.
Exhibit 4: We expect slight improvement in Asian growth
in 2015 as India and most of ASEAN offset slowing China
Exhibit 5: External vulnerability of Asia EMs has
improved making them less sensitive to US rate hikes
Exhibit 6: Asian EM countries have the highest oil
intensity, poised to save the most from lower oil prices
Exhibit 7: Asian equity returns were mostly negative
during periods of USD strength
Source: MSCI, I/B/E/S, Haver, FactSet,Statistical Review of World Energy, Bloomberg, Goldman Sachs Global Investment Research
7.3
2.1
3.4 3.5
5.3
4.3
6.0 6.0
7.0
2.7
3.53.8
6.3
4.9
6.26.0
2%
3%
4%
5%
6%
7%
8%
China Hong
Kong
Taiwan Korea India ASEAN Asia ex-
Japan
Asia Pac
ex-Japan
2014E 2015EGS Real GDP Growth forecasts (%)
-10%
-5%
0%
5%
10%
15%
TW MY KR PH TH CN IN ID RU MX BR TR SA
2Q13 2Q14
Current Account as % GDP
Asia EMs Non-Asia EMs
0% 2% 4% 6% 8% 10% 12% 14% 16% 18%
SGTHMYIN
TWKRID
RUMXCHBRHKCNUSPHJPTKAUGEFRUK Oil consumption (as % of GDP)
-30% -10% 10% 30%
Mar-May 00
Jun-Nov 00
Jan-Jun 01
Sep 01 - Jan 02
Jan-Nov 05
Apr - Nov 08
Dec 08 - Mar 09
Nov 09 - Jun 10
Nov 10
May 11 - Jan 12
Mar 12 - Jul 12
Feb 13 - Jul 13
May 14 - now
MXAPJ return during past USD strengthening period
-57%

January 8, 2015
Goldman Sachs Global Investment Research 5
What are the key themes and current implementation ideas?
The four main macro factors (growth, rates, oil, dollar), plus an active political/policy
calendar, inform the broad themes of earnings stability and reform that will be key market
drivers in 2015. Our implementation ideas target various aspects of these themes.
Stable growth (GSSZSTGW). We believe stocks with secular and stable growth are
likely to do well in moderate growth momentum environments. The basket is up nearly
6% vs. MXAPJ since inception on Sep 30, 2014, and we continue to recommend the
trade given our global outlook and attractive valuation. The 20-stock basket offers the
characteristics of a) consistent historical outperformance; b) steady earnings and
revenue growth, and high ROE; c) moderate valuation; and d) sector diversification.
Secure high dividend yield (GSSZDIV2). This is a direct play on the theme of
continuing low interest rates: 10-year rates in the US, EU and Japan are currently 2.0%,
0.5% and 0.3%. This basket yields 6.6% and trades on 9.0x forward earnings with 5%
EPS CAGR for 2015/16. The constituents all have a positive past 5-year dividend CAGR
and have a lower risk of dividend cuts (based on <50% largest realized dividend cut in
the past 8 years, which includes the GFC).
Asian stocks with high sales exposure to US (GSSZAPUS) vs. stocks with high
sales exposure to Europe (GSSZAPEU). This is a way to trade a US recovery, dollar
strength and a weaker euro in Asia. Since initiation on Sep 19, 2014, the spread is up
8.9% while the MXAPJ index is down 6.8%. The valuation differential of our long/short
baskets still looks attractive (relative 12-mo fwd. P/E at the mean since 2006).
Reforms have been in focus in many parts of the region given the policy/political
events this year. We expect the reform momentum to gather pace this year in various
parts of Asia, notably in China, India and Indonesia. The key areas of focus for reform
are likely to be SOEs, fiscal and financial market reforms, and anti-pollution (in China);
PSU, power and banking reforms (in India); and infrastructure spending (in Indonesia).
Exhibit 8: We expect the theme of stable earnings growth
to continue to perform well
Exhibit 9: Our US-exposed stocks have outperformed EU-
exposed stocks
Exhibit 10: Attractive entry point for secure high dividend
yield theme
Exhibit 11: SH-HK Northbound connect ideas have
performed well; Southbound plays may catch up
Source: MSCI, Bloomberg, Goldman Sachs Global Investment Research
70
80
90
100
110
120
130
140
De
c-1
0
Ma
r-1
1
Ju
n-1
1
Sep
-11
De
c-1
1
Ma
r-1
2
Ju
n-1
2
Sep
-12
De
c-1
2
Ma
r-1
3
Ju
n-1
3
Sep
-13
De
c-1
3
Ma
r-1
4
Ju
n-1
4
Sep
-14
De
c-1
4
Price performance
(rebased to 100)
Stable Earnings Growth (GSSZSTGW)
MXAPJ
85
90
95
100
105
110
115
120
125
130
De
c-1
2
Ma
r-1
3
Ju
n-1
3
Sep
-13
De
c-1
3
Ma
r-1
4
Ju
n-1
4
Sep
-14
De
c-1
4
US-exposed <GSSZAPUS> vs. Europe-exposed
<GSSZAPEU>
(Relative price performance)
1.6
1.8
2.0
2.2
2.4
2.6
2.8
3.0
3.292
96
100
104
108
112
Jan
-13
Ap
r-1
3
Ju
l-1
3
Oct-
13
Jan
-14
Ap
r-1
4
Ju
l-1
4
Oct-
14
Jan
-15
APJ Secure High
Dividend Yield (LHS)
<GSSZDIV2>
Indexed
US 10 year yield
(Inverted, RHS)
US 10yr(%)
90
100
110
120
130
140
150
160
170
Ju
n-1
4
Ju
l-1
4
Au
g-1
4
Se
p-1
4
Oct-
14
No
v-1
4
De
c-1
4
GS SH-HK connect ideasRebased performance
Southbound Ideas
<GSEHCNSB>
Northbound Ideas
<GSEHCNNB>

January 8, 2015
Goldman Sachs Global Investment Research 6
Which country/sectors are appealing?
Intra-regional differentiation has been a theme for the past two years with flat regional
indices (MXAPJ) but substantial market and sector disparity beneath the headline. In fact,
the dispersion in returns (as measured by coefficient of variation) during 2013-14 has been
the greatest in the last decade. We think intra-regional differentiation may continue in 2015,
given potentially divergent growth paths between the US and other parts of the world
and the differing impact of lower oil prices and higher US rates on Asian markets/sectors.
Wide dispersion creates alpha opportunities and focusing on specific parts of the region
may generate better returns than a simple beta strategy of owning the MXAPJ index. We
have reviewed the 30 largest country-sectors and highlight several ideas, not all of which
we recommend pursuing currently, but which we think are worth monitoring for potential
entry points. Areas we like now include reform beneficiaries in China and India, India
software and internet, Taiwan tech and IOT plays. We may reenter Macau gaming and
Korean mega caps towards mid-2015 if we see clearer signs of a turn in the earnings cycle.
Exhibit 12: MXAPJ headline returns over the past 2 years
were flat, but with significant market and sector disparity
Exhibit 13: Stock correlations remain low giving rise to
stock picking opportunities
Exhibit 14: Pockets of opportunity: TW Tech, IN Software, CH utilities offer attractive risk-reward, while IN banks, CN
internet and insurance offer higher growth but at a slightly higher price. Monitor Macau gaming for entry in 2Q15.
Source: FactSet, MSCI, Goldman Sachs Global Investment Research
-30
-20
-10
0
10
20
30
40
50
-6
-4
-2
0
2
4
6
8
10
2001
2002
2003
2004
2005
2006
2007
2008
2009
2010
2011
2012
2013
2014
Market dispersion
Sector dispersion
Coeff. of variation
(absolute)
MXAPJ headline return
17
MXAPJ
returns
Dispersion of
MXAPJ returns
20%
30%
40%
50%
60%
70%
80%
Jan
-10
Ju
l-10
Jan
-11
Ju
l-11
Jan
-12
Ju
l-12
Jan
-13
Ju
l-13
Jan
-14
Ju
l-14
Jan
-15
Avg Stock Correlation
(3-mo correlation with MXAPJ)
"Macro"
Trading
"Micro"
Trading

January 8, 2015
Goldman Sachs Global Investment Research 7
Which of 2014’s winners/laggards are appealing at the start of ‘15?
We introduced a conditional-probability-based framework to identify potential ‘Streak
winners’ and ‘Turnaround laggards’ in the region (Asia Pacific Strategy: 2014 Kickoff (Part
2): Buying winners or laggards?, Jan 17, 2014). The strong momentum of Winners (top 20th
percentile in universe) has tended to carry through to the 2nd and 3rd year of their winning
streak and Laggards (bottom 20th percentile in universe) usually turned around after
underperforming for 1 to 2 consecutive years.
Applying our analysts’ views and valuations to our framework, we think TSMC, SBI, HKEx,
CCCC, China Medical System, and Haitong Securities (H) in the 2014 winners bucket still
offer favorable risk/reward; while laggards such as GLP, China Cinda, and GCL-Poly may
trade better this year (Exhibit 15).
Exhibit 15: 10 select 2014 ‘Winners’ and ‘Laggards’ that we like in the region
Selection criteria: (1) Buy rated; (2) Not a 3-year plus streak for winners (i.e. top 20th percentile performers for 2 years)
Note: Dark blue/grey highlights represent top-/bottom-10th percentile returns in the stock’s respective local market. *denote stock is on the Conviction List.
Source: MSCI, FactSet, I/B/E/S, Goldman Sachs Global Investment Research
Exhibit 16: We screen and categorize last-year Winners and Laggards into 4 buckets
Source: Goldman Sachs Global Investment Research
Ticker Company name Country Sector
Listed
market
cap
(US$bn)
6M
ADVT
(US$mn)
Quoted
Price
15E
EPSg
(%)
15E
P/E (X)
15E
P/B (X)
14E
D/Y
(%)
GS
Rating
Potential
+/- (%)
2012
return
%ile
2013
return
%ile
2014
return
%ile
Streak Winners
2330 TT TSMC Taiwan Info Tech 108.3 137.6 133.5 11% 12.0 2.8 3% B* 13% 72% 50% 87%
SBIN IS State Bank of India India Financials 35.2 96.6 300.0 20% 10.9 1.3 1% B* 20% 63% 3% 89%
388 HK HKEx Hong Kong Financials 26.8 176.6 177.6 34% 31.1 9.5 3% B 11% 16% 53% 92%
1800 HK China Comm. Constr. Hong Kong Industrials 5.4 30.0 9.5 8% 8.2 1.1 3% B 37% 53% 11% 91%
867 HK China Medical System China Healthcare 3.8 9.1 12.2 25% 22.6 5.3 2% B 24% 89% 75% 93%
6837 HK Haitong Securities China Financials 3.7 54.7 19.4 17% 19.8 2.1 2% B* 20% - 46% 87%
Turnaround laggards
GLP SP Global Logistic Properties Singapore Financials 8.8 24.3 2.4 28% 29.1 1.0 2% B 36% 89% 64% 18%
1359 HK China Cinda Asset Mgmt China Financials 6.1 32.7 4.0 22% 8.0 1.2 3% B* 14% - - 13%
3800 HK GCL-Poly Energy China Info Tech 3.6 38.7 1.8 53% 9.1 1.3 2% B 77% 2% 81% 10%
Streak Winners Fallen Angels Turnaround Laggards Underperformers
2014 top 20th percentitle performers 2014 top 20th percentitle performers 2014 bottom 20th percentitle performers 2014 bottom 20th percentitle performers
Buy-rated Sell-rated Buy-rated Sell-rated
Upside to GS target price > 0 Upside to GS target price <0 Upside to GS target price > 0 Upside to GS target price <0
TSMC (2330 TT) Hotai Motor (2207 TT) Galaxy Entertainment (27 HK) Coca-Cola Amatil (CCL AT)
HKEx (388 HK) Asian Paints (APNT IS) Santos (STO AT) China Oilfield Services (2883 HK)
Sun Hung Kai Properties (16 HK) Suntec REIT (SUN SP) Global Logistic Prop. (GLP SP) Far Eastern New Century (1402 TT)
Advanced Semiconductor (2311 TT) Jardine Cycle & Carriage (JCNC SP) PTT Explor. & Prod. (PTTEP TB) PT United Tractors (UNTR IJ)
State Bank of India (SBIN IS) China Taiping Insurance (966 HK) Tingyi (Cayman Islands) (322 HK) IRPC Public (IRPC TB)
Amorepacific (090430 KP) NWS Holdings (659 HK) China Cinda Asset Mgmt (1359 HK) PT Astra Agro Lestari (AALI IJ)
China Comm. Constr. (1800 HK) Hyundai Development (012630 KP) Hyundai Engin. & Constr. (000720 KP)
Haitong Securities (6837 HK) Bangkok Dusit Medical (BGH TB) GCL-Poly Energy (3800 HK)
CapitaCommercial Trust (CCT SP) Eva Airways (2618 TT) Sun Art Retail Group (6808 HK)
Leighton Holdings (LEI AT) Lafarge Malaysia (LMC MK) MGM China (2282 HK)
Bharat Petroleum (BPCL IS) Country Garden (2007 HK)
ANTA Sports Products (2020 HK) GOME Elec. Appliances (493 HK)
China Medical System (867 HK) Daelim Industrial (000210 KP)
Huadian Power Intl. (1071 HK) SINOPEC Engineering (2386 HK)
Hyundai Mipo Dockyard (010620 KP)
Winners Laggards
January 8, 2015
Goldman Sachs Global Investment Research 8
China: A or H?
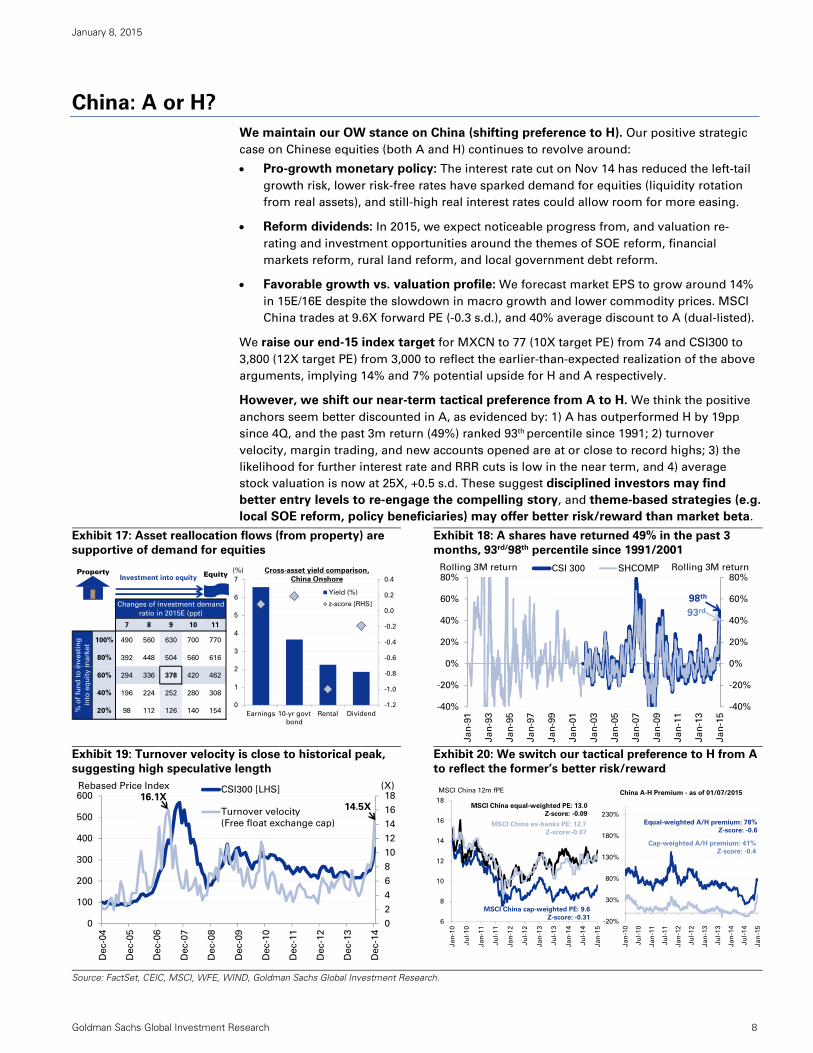
We maintain our OW stance on China (shifting preference to H). Our positive strategic
case on Chinese equities (both A and H) continues to revolve around:
Pro-growth monetary policy: The interest rate cut on Nov 14 has reduced the left-tail
growth risk, lower risk-free rates have sparked demand for equities (liquidity rotation
from real assets), and still-high real interest rates could allow room for more easing.
Reform dividends: In 2015, we expect noticeable progress from, and valuation re-
rating and investment opportunities around the themes of SOE reform, financial
markets reform, rural land reform, and local government debt reform.
Favorable growth vs. valuation profile: We forecast market EPS to grow around 14%
in 15E/16E despite the slowdown in macro growth and lower commodity prices. MSCI
China trades at 9.6X forward PE (-0.3 s.d.), and 40% average discount to A (dual-listed).
We raise our end-15 index target for MXCN to 77 (10X target PE) from 74 and CSI300 to
3,800 (12X target PE) from 3,000 to reflect the earlier-than-expected realization of the above
arguments, implying 14% and 7% potential upside for H and A respectively.
However, we shift our near-term tactical preference from A to H. We think the positive
anchors seem better discounted in A, as evidenced by: 1) A has outperformed H by 19pp
since 4Q, and the past 3m return (49%) ranked 93th percentile since 1991; 2) turnover
velocity, margin trading, and new accounts opened are at or close to record highs; 3) the
likelihood for further interest rate and RRR cuts is low in the near term, and 4) average
stock valuation is now at 25X, +0.5 s.d. These suggest disciplined investors may find
better entry levels to re-engage the compelling story, and theme-based strategies (e.g.
local SOE reform, policy beneficiaries) may offer better risk/reward than market beta.
Exhibit 17: Asset reallocation flows (from property) are
supportive of demand for equities
Exhibit 18: A shares have returned 49% in the past 3
months, 93rd/98th percentile since 1991/2001
Exhibit 19: Turnover velocity is close to historical peak,
suggesting high speculative length
Exhibit 20: We switch our tactical preference to H from A
to reflect the former’s better risk/reward
Source: FactSet, CEIC, MSCI, WFE, WIND, Goldman Sachs Global Investment Research.
7 8 9 10 11
100% 490 560 630 700 770
80% 392 448 504 560 616
60% 294 336 378 420 462
40% 196 224 252 280 308
20% 98 112 126 140 154
Changes of investment demand
ratio in 2015E (ppt)
% o
f fu
nd
to
in
ve
sti
ng
into
eq
uit
y m
ark
et
-1.2
-1.0
-0.8
-0.6
-0.4
-0.2
0.0
0.2
0.4
0
1
2
3
4
5
6
7
Earnings 10-yr govt
bond
Rental Dividend
Yield (%)
z-score [RHS]
Cross-asset yield comparison,
China Onshore
(%)Investment into equity
Property Equity
-40%
-20%
0%
20%
40%
60%
80%
-40%
-20%
0%
20%
40%
60%
80%
Ja
n-9
1
Ja
n-9
3
Ja
n-9
5
Ja
n-9
7
Ja
n-9
9
Ja
n-0
1
Ja
n-0
3
Ja
n-0
5
Ja
n-0
7
Ja
n-0
9
Ja
n-1
1
Ja
n-1
3
Ja
n-1
5
CSI 300 SHCOMPRolling 3M return
93rd
98th
Rolling 3M return
0
2
4
6
8
10
12
14
16
18
0
100
200
300
400
500
600
Dec-0
4
Dec-0
5
Dec-0
6
Dec-0
7
Dec-0
8
Dec-0
9
Dec-1
0
Dec-1
1
Dec-1
2
Dec-1
3
Dec-1
4
CSI300 [LHS]
Turnover velocity
(Free float exchange cap)
Rebased Price Index (X)
16.1X14.5X
6
8
10
12
14
16
18
Ja
n-1
0
Ju
l-1
0
Ja
n-1
1
Ju
l-1
1
Ja
n-1
2
Ju
l-1
2
Ja
n-1
3
Ju
l-1
3
Ja
n-1
4
Ju
l-1
4
Ja
n-1
5
MSCI China 12m fPE
MSCI China cap-weighted PE: 9.6
Z-score: -0.31
MSCI China equal-weighted PE: 13.0
Z-score: -0.09
MSCI China ex-banks PE: 12.7
Z-score:-0.07
-20%
30%
80%
130%
180%
230%
Ja
n-1
0
Ju
l-1
0
Ja
n-1
1
Ju
l-1
1
Ja
n-1
2
Ju
l-1
2
Ja
n-1
3
Ju
l-1
3
Ja
n-1
4
Ju
l-1
4
Ja
n-1
5
China A-H Premium - as of 01/07/2015
Equal-weighted A/H premium: 78%
Z-score: -0.6
Cap-weighted A/H premium: 41%
Z-score: -0.4

January 8, 2015
Goldman Sachs Global Investment Research 9
India: is the party over?
While Indian equities had a 30%+ rally last year on a change in leadership, the recent
correction on global growth concerns and Parliament logjam, coupled with relatively heavy
positioning have caused some investors to worry if it’s time to sell. We maintain our
strategically overweight stance on India and view the current consolidation as an
opportunity to re-engage. Our positive strategic case continues to revolve around:
Macro recovery gaining traction, rate cycle to ease: We expect GDP growth to rise
to 6.3% in CY15, driven largely by an improving investment cycle. New capex activity
has continued to pick up in 4Q ‘14 and we expect the uptick to reflect in the order
inflows of corporates over the next few quarters. We expect CPI to fall to 5.8% in 2015
driven by lower oil prices which offers room for the RBI to cut rates by 50 bps in 1H15.
High/improving EPS growth, valuations back to mid-range: We expect earnings to
grow at a 17% CAGR over the next two years in India, which is the highest in Asia.
Valuations have come off with the market trading at 15.8x mid-range P/E (vs. 17x in
late Nov ’14) with banks, tech & a few cyclical sectors trading at reasonable valuations.
Domestic investors, global funds likely to be source of incremental demand: While
AEJ/EM funds OW allocations and increasing supply from divestments remain a near-
term risk, we believe global funds and domestic investors, which have very low equity
exposure, are likely to be incremental buyers as the recovery gathers more steam. Our
end-15 target for NIFTY remains 9500. We remain OW banks, tech and industrials, and
like reform-beneficiaries, rate-sensitives and internet plays.
Exhibit 21: Leading signs of investment recovery as new
capex activity in both govt. & private sector picks up
Exhibit 22: We expect high-teens earnings growth in
2015/16 in India, highest amongst its Asian peers
Source: CMIE Capex
Source: Goldman Sachs Global Investment Research
Exhibit 23: Headline PE back to mid-range now;
Valuations still reasonable for banks, Tech and a few
cyclical sectors
Exhibit 24: While EM/AEJ funds are OW, global funds and
domestic investors likely source of incremental demand
Source: MSCI, FactSet, Goldman Sachs Global Investment Research
Source: MSCI, EPFR, FactSet, Goldman Sachs Global Investment Research
-
500
1,000
1,500
2,000
2,500
3,000
3,500
Dec-0
4
Ju
n-0
5
Dec-0
5
Ju
n-0
6
Dec-0
6
Ju
n-0
7
Dec-0
7
Ju
n-0
8
Dec-0
8
Ju
n-0
9
Dec-0
9
Ju
n-1
0
Dec-1
0
Ju
n-1
1
Dec-1
1
Ju
n-1
2
Dec-1
2
Ju
n-1
3
Dec-1
3
Ju
n-1
4
Dec-1
4
New project starts - Government
New project starts - Private
Rs bn India- Average quarterly new project starts(Industrial and Infrastructure)
0%
2%
4%
6%
8%
10%
12%
14%
16%
18%
Ind
ia
Ph
ilip
pin
es
Ind
on
esia
Th
ail
an
d
Ko
rea
Ta
iwa
n
Sin
ga
po
re
Mala
ysia
MX
AP
J
Ch
ina
Au
str
ali
a
Ho
ng
Ko
ng
CY2015-16 EPS growth CAGR forecasts(local currency)
31.6
23.3 23.2 22.4
18.7 16.8
15.8
11.7 11.6 10.7 9.6
0
5
10
15
20
25
30
35
40
Sta
ple
s
He
alt
h c
are
Ind
ustr
ials
Pro
pert
y
Ban
ks, D
iv. Fin
s.
Info
Tech
Ind
ia
Au
tos
Mate
ria
ls
Uti
liti
es
En
erg
y
12-month forward P/E (X) +/- 1 S.D. Current High / Low(since 2004)
(+0.2 S.D.)
-15
-10
-5
0
5
De
c-0
9
Ju
n-1
0
De
c-1
0
Ju
n-1
1
De
c-1
1
Ju
n-1
2
De
c-1
2
Ju
n-1
3
De
c-1
3
Ju
n-1
4
De
c-1
4
Cumulative domestic
mutual fund flows
into Indian equities
US$
(80)
(60)
(40)
(20)
-
20
40
60
80
-600
-400
-200
0
200
400
600
800
No
v-0
3
No
v-0
4
No
v-0
5
No
v-0
6
No
v-0
7
No
v-0
8
No
v-0
9
No
v-1
0
No
v-1
1
No
v-1
2
No
v-1
3
No
v-1
4
EM funds (AUM: US$ 250 bn)
AEJ funds (AUM: US$ 105 bn)
India's allocation in mutual
funds globally (UW/OW)
Global funds (RHS)
(AUM: US$ 640 bn)
bp bp

January 8, 2015
Goldman Sachs Global Investment Research 10
Korea: potential to surprise positively?
We see an opportunity for Korea to trade better at some point this year, after its significant
underperformance in 2014. Our current recommendation remains Marketweight, as we
await clearer signs of a turnaround in earnings revision sentiment.
The major delta which may catalyze a turn in relative performance is earnings
revisions. Based on our AEGiS, the percentage of Korea companies guiding
positive profit outlook has increased meaningfully to 91%. Recent earnings
downgrades have indeed slowed, although it remains unclear whether they reflect
an improving profit outlook, or the typical slowdown in revisions between results
seasons. The 4Q reporting season which has started with the preliminary results
announcement of Samsung Electronics will therefore be particularly important, as
it will provide more evidence whether the earnings trend will sustainably improve.
Korean megacaps seem to be increasing their focus on shareholder returns.
During their upcoming shareholder meetings, Samsung Electronics and Hyundai
Motor will give more clarity on shareholder return policies. The former previously
guided a potential 30-50% increase in dividends and the latter highlighted the
possibility of an interim dividend. Such a move by the top 2 conglomerates could
have a positive influence on others in the broader market.
Lower oil prices may be of benefit to Korea. Korea is one of the largest net oil
importers in Asia, so lower oil prices should benefit the economy, even though the
recent KRW depreciation against the dollar may temper the positive impact.
Valuations are at fair levels in our view, and positioning is light. Our previous
analysis suggests that mutual funds have meaningfully reduced their positions on
Korean megacaps, and are meaningfully underweight the market.
Exhibit 25: Korea’s earnings downgrades have slowed
Exhibit 26: Dedicated EM funds have taken down their
allocations to Korean megacaps
Source: MSCI, FactSet, I/B/E/S, Goldman Sachs Global Investment Research
Source: FactSet, LionShare, Goldman Sachs Global Investment Research
72
76
80
84
88
92
96
100
104
108
112
De
c-1
3
Jan
-14
Feb
-14
Ma
r-1
4
Ap
r-1
4
Ma
y-1
4
Ju
n-1
4
Ju
l-14
Au
g-1
4
Sep
-14
Oct-
14
No
v-1
4
De
c-1
4
2015 Country EPS revision
KR
TW
APJ
TH
CN
MY
AUIN
ID
SGHK
PH
63%
61%
55%
46%
47%46%
54%53%
48%
41%
30%
35%
40%
45%
50%
55%
60%
65%
70%
Dec '13 Apr '14 Jul '14 Oct '14 Dec'14
Samsung Electronics
Hyundai Motor
% funds OW (vs. MSCI EM)(sample = Top 200 EM funds)
%
January 8, 2015
Goldman Sachs Global Investment Research 11
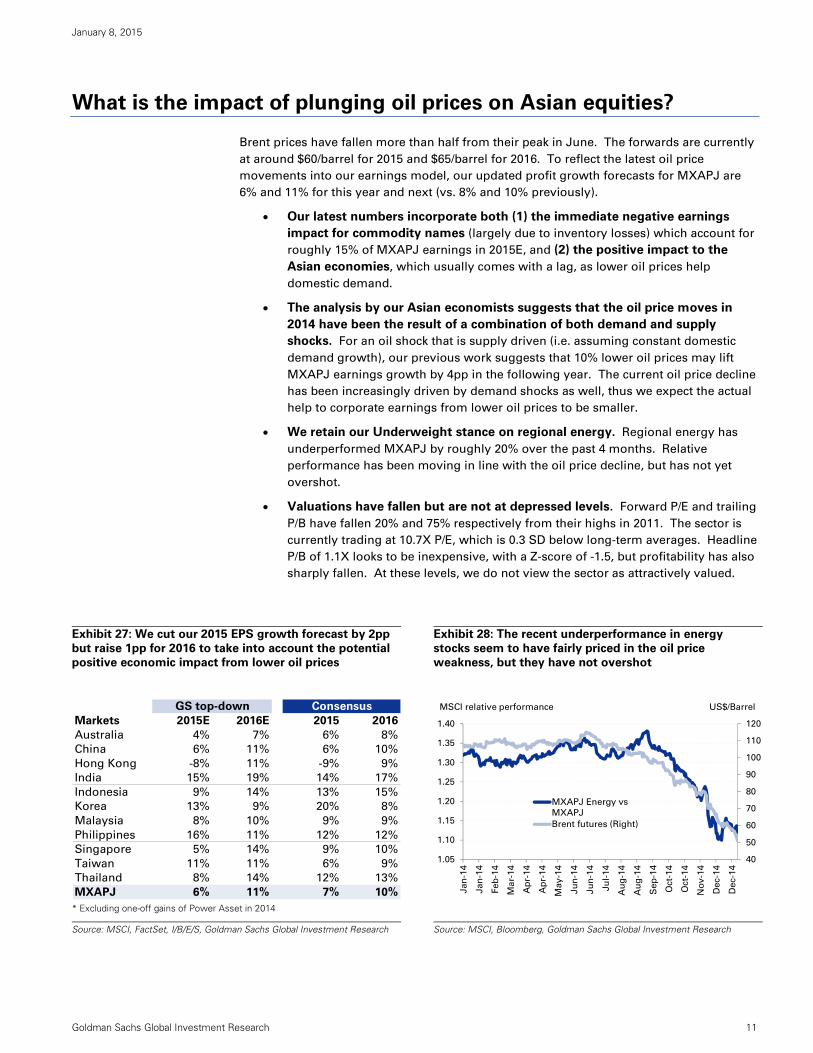
What is the impact of plunging oil prices on Asian equities?
Brent prices have fallen more than half from their peak in June. The forwards are currently
at around $60/barrel for 2015 and $65/barrel for 2016. To reflect the latest oil price
movements into our earnings model, our updated profit growth forecasts for MXAPJ are
6% and 11% for this year and next (vs. 8% and 10% previously).
Our latest numbers incorporate both (1) the immediate negative earnings
impact for commodity names (largely due to inventory losses) which account for
roughly 15% of MXAPJ earnings in 2015E, and (2) the positive impact to the
Asian economies, which usually comes with a lag, as lower oil prices help
domestic demand.
The analysis by our Asian economists suggests that the oil price moves in
2014 have been the result of a combination of both demand and supply
shocks. For an oil shock that is supply driven (i.e. assuming constant domestic
demand growth), our previous work suggests that 10% lower oil prices may lift
MXAPJ earnings growth by 4pp in the following year. The current oil price decline
has been increasingly driven by demand shocks as well, thus we expect the actual
help to corporate earnings from lower oil prices to be smaller.
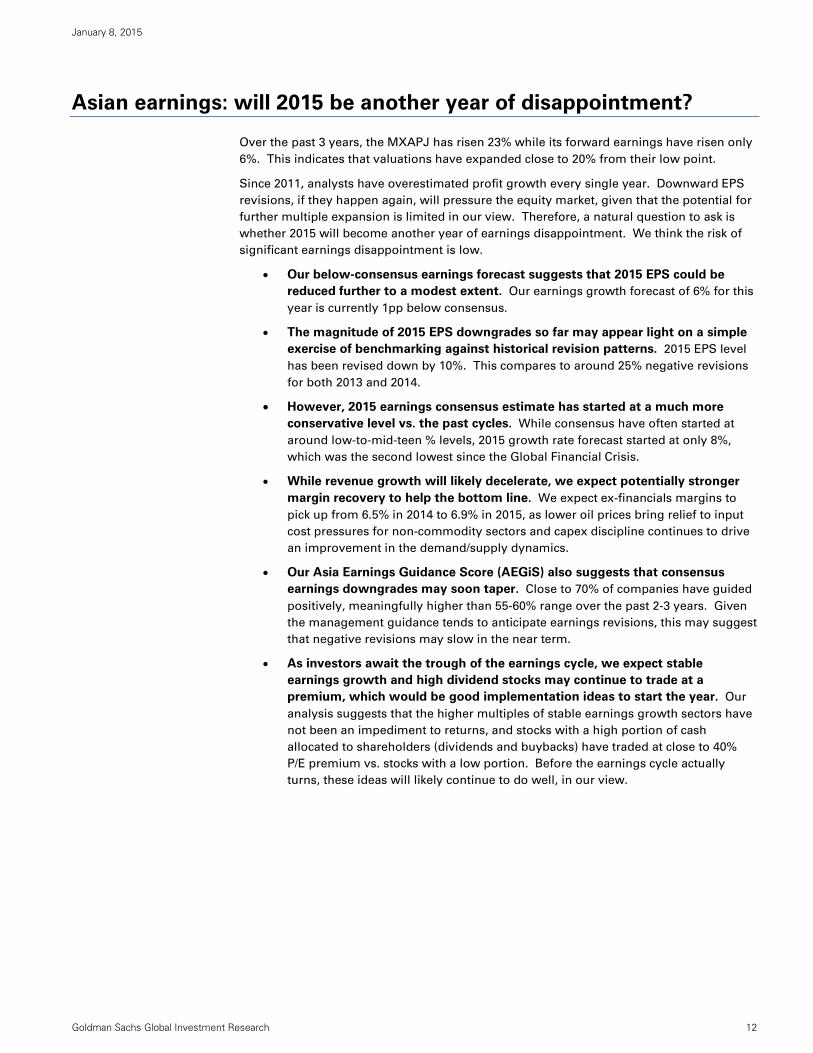
We retain our Underweight stance on regional energy. Regional energy has
underperformed MXAPJ by roughly 20% over the past 4 months. Relative
performance has been moving in line with the oil price decline, but has not yet
overshot.
Valuations have fallen but are not at depressed levels. Forward P/E and trailing
P/B have fallen 20% and 75% respectively from their highs in 2011. The sector is
currently trading at 10.7X P/E, which is 0.3 SD below long-term averages. Headline
P/B of 1.1X looks to be inexpensive, with a Z-score of -1.5, but profitability has also
sharply fallen. At these levels, we do not view the sector as attractively valued.
Exhibit 27: We cut our 2015 EPS growth forecast by 2pp
but raise 1pp for 2016 to take into account the potential
positive economic impact from lower oil prices
Exhibit 28: The recent underperformance in energy
stocks seem to have fairly priced in the oil price
weakness, but they have not overshot
* Excluding one-off gains of Power Asset in 2014
Source: MSCI, FactSet, I/B/E/S, Goldman Sachs Global Investment Research
Source: MSCI, Bloomberg, Goldman Sachs Global Investment Research
GS top-down Consensus
Markets 2015E 2016E 2015 2016
Australia 4% 7% 6% 8%
China 6% 11% 6% 10%
Hong Kong -8% 11% -9% 9%
India 15% 19% 14% 17%
Indonesia 9% 14% 13% 15%
Korea 13% 9% 20% 8%
Malaysia 8% 10% 9% 9%
Philippines 16% 11% 12% 12%
Singapore 5% 14% 9% 10%
Taiwan 11% 11% 6% 9%
Thailand 8% 14% 12% 13%
MXAPJ 6% 11% 7% 10%
40
50
60
70
80
90
100
110
120
1.05
1.10
1.15
1.20
1.25
1.30
1.35
1.40
Jan
-14
Jan
-14
Feb
-14
Ma
r-14
Ap
r-14
Ap
r-14
May-1
4
Ju
n-1
4
Ju
n-1
4
Ju
l-14
Au
g-1
4
Au
g-1
4
Sep
-14
Oct-
14
Oct-
14
No
v-1
4
Dec-1
4
Dec-1
4
MXAPJ Energy vs
MXAPJ
Brent futures (Right)
MSCI relative performance US$/Barrel
January 8, 2015
Goldman Sachs Global Investment Research 12
Asian earnings: will 2015 be another year of disappointment?
Over the past 3 years, the MXAPJ has risen 23% while its forward earnings have risen only
6%. This indicates that valuations have expanded close to 20% from their low point.
Since 2011, analysts have overestimated profit growth every single year. Downward EPS
revisions, if they happen again, will pressure the equity market, given that the potential for
further multiple expansion is limited in our view. Therefore, a natural question to ask is
whether 2015 will become another year of earnings disappointment. We think the risk of
significant earnings disappointment is low.
Our below-consensus earnings forecast suggests that 2015 EPS could be
reduced further to a modest extent. Our earnings growth forecast of 6% for this
year is currently 1pp below consensus.
The magnitude of 2015 EPS downgrades so far may appear light on a simple
exercise of benchmarking against historical revision patterns. 2015 EPS level
has been revised down by 10%. This compares to around 25% negative revisions
for both 2013 and 2014.
However, 2015 earnings consensus estimate has started at a much more
conservative level vs. the past cycles. While consensus have often started at
around low-to-mid-teen % levels, 2015 growth rate forecast started at only 8%,
which was the second lowest since the Global Financial Crisis.
While revenue growth will likely decelerate, we expect potentially stronger
margin recovery to help the bottom line. We expect ex-financials margins to
pick up from 6.5% in 2014 to 6.9% in 2015, as lower oil prices bring relief to input
cost pressures for non-commodity sectors and capex discipline continues to drive
an improvement in the demand/supply dynamics.
Our Asia Earnings Guidance Score (AEGiS) also suggests that consensus
earnings downgrades may soon taper. Close to 70% of companies have guided
positively, meaningfully higher than 55-60% range over the past 2-3 years. Given
the management guidance tends to anticipate earnings revisions, this may suggest
that negative revisions may slow in the near term.
As investors await the trough of the earnings cycle, we expect stable
earnings growth and high dividend stocks may continue to trade at a
premium, which would be good implementation ideas to start the year. Our
analysis suggests that the higher multiples of stable earnings growth sectors have
not been an impediment to returns, and stocks with a high portion of cash
allocated to shareholders (dividends and buybacks) have traded at close to 40%
P/E premium vs. stocks with a low portion. Before the earnings cycle actually
turns, these ideas will likely continue to do well, in our view.

January 8, 2015
Goldman Sachs Global Investment Research 13
Exhibit 29: 2015 EPS estimate has been reduced by 10%
so far, which may look light compared to previous
years...
Exhibit 30: … but it has started with a much more
conservative growth assumption
Exhibit 31: We see limited room for further valuation
expansion, so earnings will be primary in driving returns
Exhibit 32: We forecast meaningful margin recovery
despite further deceleration in revenue growth
Exhibit 33: Our AEGiS (Asia Earnings Guidance Score)
points to a potential bottoming of the current earnings
downgrade cycle
Exhibit 34: Stable earnings growth sectors should
continue to trade at a valuation premium before the
earnings cycle actually turns
Source: MSCI, FactSet, I/B/E/S, Goldman Sachs Global Investment Research
-40%
-30%
-20%
-10%
0%
10%
20%
30%
40%
50%
2004
2005
2006
2007
2008
2009
2010
2011
2012
2013
2014
2015
MXAPJ earnings revision
-10
-5
0
5
10
15
20
25
30
Fe
b
Ap
r
Ju
n
Au
g
Oct
De
c
Fe
b
Ap
r
Ju
n
Au
g
Oct
De
c
Fe
b
Ap
r
Ju
n
Au
g
Oct
De
c
MXAPJ growth estimate
2010
2011
20132012
2009
2014
2015
T-2 T-1 T=0 current
16.0
Z-score: 0.8
12.4
Z-score: -0.1
6x
8x
10x
12x
14x
16x
18x
20x
22x
24x
De
c-0
1
De
c-0
2
De
c-0
3
De
c-0
4
De
c-0
5
De
c-0
6
De
c-0
7
De
c-0
8
De
c-0
9
De
c-1
0
De
c-1
1
De
c-1
2
De
c-1
3
De
c-1
4
Market Cap-
MXAPJ 12-month forward P/E (X)
Equal-weighted
92
94
96
98
100
102D
ec-1
3
Ja
n-1
4
Fe
b-1
4
Ma
r-1
4
Ap
r-1
4
Ma
y-1
4
Ju
n-1
4
Ju
l-1
4
Au
g-1
4
Se
p-1
4
Oct-
14
No
v-1
4
De
c-1
4
Consensus 2015 revision
Sales
Margin
Autos
Cons. Retail & Svcs.
Cons. Staples
Energy
BanksReal Estate
InsuranceHealth Care
Capital Goods
Transportation
Software
Tech Hw & SemisChemicals
Metals & Mining
Telcos
Utilities
0.30
0.35
0.40
0.45
0.50
0.55
0.60
0.65
0.70
0.75
0.0 0.2 0.4 0.6 0.8 1.0 1.2Earnings "Reliability"
(Average/Stdev EPS growth, 2003-2013)
"C
on
sis
ten
cy
" o
f re
turn
s(%
tim
es o
utp
erf
orm
an
ce, q
trly
sin
ce '03)
Note: Size of bubble indicates avg. PE prem./discount vs. MXAPJ since '03(Blue shade denotes premium, white shade denotes discount)
Average

January 8, 2015
Goldman Sachs Global Investment Research 14
Basket Disclosure
The ability to trade the basket(s) discussed in this research will depend upon market
conditions, including liquidity and borrow constraints at the time of trade.
The Securities Division of the firm may have been consulted as to the various components
of the baskets of securities discussed in this report prior to their launch; however, none of
this research, the conclusions expressed herein, nor the timing of this report was shared
with the Securities Division.
Other Disclosures
All MSCI data used in this report is the exclusive property of MSCI, Inc. (MSCI). Without
prior written permission of MSCI, this information and any other MSCI intellectual property
may not be reproduced or re-disseminated in any form and may not be used to create any
financial instruments or products or any indices. This information is provided on an “as is”
basis, and the user of this information assumes the entire risk of any use made of this
information. Neither MSCI, any of its affiliates nor any third party involved in, or related to,
computing or compiling the data makes any express or implied warranties or
representations with respect to this information (or the results to be obtained by the use
thereof), and MSCI, its affiliates and any such third party hereby expressly disclaim all
warranties of originality, accuracy, completeness, merchantability or fitness for a particular
purpose with respect to any of this information. Without limiting any of the foregoing, in
no event shall MSCI, any of its affiliates or any third party involved in, or related to,
computing or compiling the data have any liability for any direct, indirect, special, punitive,
consequential or any other damages (including lost profits) even if notified of the
possibility of such damages. MSCI and the MSCI indexes are service marks of MSCI and its
affiliates. The Global Industry Classification Standard (GICS) were developed by and is the
exclusive property of MSCI and Standard & Poor’s. GICS is a service mark of MSCI and
S&P and has been licensed for use by The Goldman Sachs Group, Inc.

January 8, 2015
Goldman Sachs Global Investment Research 15
Disclosure Appendix
Reg AC
We, Timothy Moe, CFA, Kinger Lau, CFA, Richard Tang, CFA, Sunil Koul and Charles Fang, Ph.D, hereby certify that all of the views expressed in this
report accurately reflect our personal views about the subject company or companies and its or their securities. We also certify that no part of our
compensation was, is or will be, directly or indirectly, related to the specific recommendations or views expressed in this report.
Unless otherwise stated, the individuals listed on the cover page of this report are analysts in Goldman Sachs' Global Investment Research division.
Disclosures
Option Specific Disclosures
Price target methodology: Please refer to the analyst’s previously published research for methodology and risks associated with equity price
targets.
Pricing Disclosure: Option prices and volatility levels in this note are indicative only, and are based on our estimates of recent mid-market
levels(unless otherwise noted). All prices and levels exclude transaction costs unless otherwise stated.
General Options Risks – The risks below and any other options risks mentioned in this research report pertain both to specific derivative trade
recommendations mentioned and to discussion of general opportunities and advantages of derivative strategies. Unless otherwise noted, options
strategies mentioned in this report may be a combination of the strategies below and therefore carry with them the risks of those strategies.
Buying Options - Investors who buy call (put) options risk loss of the entire premium paid if the underlying security finishes below (above) the
strike price at expiration. Investors who buy call or put spreads also risk a maximum loss of the premium paid. The maximum gain on a long call or
put spread is the difference between the strike prices, less the premium paid.
Selling Options - Investors who sell calls on securities they do not own risk unlimited loss of the security price less the strike price. Investors who
sell covered calls (sell calls while owning the underlying security) risk having to deliver the underlying security or pay the difference between the
security price and the strike price, depending on whether the option is settled by physical delivery or cash-settled. Investors who sell puts risk loss of
the strike price less the premium received for selling the put. Investors who sell put or call spreads risk a maximum loss of the difference between the
strikes less the premium received, while their maximum gain is the premium received.
For options settled by physical delivery, the above risks assume the options buyer or seller, buys or sells the resulting securities at the
settlement price on expiry.
Distribution of ratings/investment banking relationships
Goldman Sachs Investment Research global coverage universe
Rating Distribution Investment Banking Relationships
Buy Hold Sell Buy Hold Sell
Global 32% 54% 14% 42% 36% 30%
As of October 1, 2014, Goldman Sachs Global Investment Research had investment ratings on 3,649 equity securities. Goldman Sachs assigns stocks
as Buys and Sells on various regional Investment Lists; stocks not so assigned are deemed Neutral. Such assignments equate to Buy, Hold and Sell
for the purposes of the above disclosure required by NASD/NYSE rules. See 'Ratings, Coverage groups and views and related definitions' below.
Disclosures required by United States laws and regulations
See company-specific regulatory disclosures above for any of the following disclosures required as to companies referred to in this report: manager
or co-manager in a pending transaction; 1% or other ownership; compensation for certain services; types of client relationships; managed/co-
managed public offerings in prior periods; directorships; for equity securities, market making and/or specialist role. Goldman Sachs usually makes a
market in fixed income securities of issuers discussed in this report and usually deals as a principal in these securities.
The following are additional required disclosures: Ownership and material conflicts of interest: Goldman Sachs policy prohibits its analysts,
professionals reporting to analysts and members of their households from owning securities of any company in the analyst's area of
coverage. Analyst compensation: Analysts are paid in part based on the profitability of Goldman Sachs, which includes investment banking
revenues. Analyst as officer or director: Goldman Sachs policy prohibits its analysts, persons reporting to analysts or members of their
households from serving as an officer, director, advisory board member or employee of any company in the analyst's area of coverage. Non-U.S. Analysts: Non-U.S. analysts may not be associated persons of Goldman, Sachs & Co. and therefore may not be subject to NASD Rule 2711/NYSE
Rules 472 restrictions on communications with subject company, public appearances and trading securities held by the analysts.
Additional disclosures required under the laws and regulations of jurisdictions other than the United States
The following disclosures are those required by the jurisdiction indicated, except to the extent already made above pursuant to United States laws
and regulations. Australia: Goldman Sachs Australia Pty Ltd and its affiliates are not authorised deposit-taking institutions (as that term is defined in
the Banking Act 1959 (Cth)) in Australia and do not provide banking services, nor carry on a banking business, in Australia. This research, and any
access to it, is intended only for "wholesale clients" within the meaning of the Australian Corporations Act, unless otherwise agreed by Goldman
Sachs. In producing research reports, members of the Global Investment Research Division of Goldman Sachs Australia may attend site visits and
other meetings hosted by the issuers the subject of its research reports. In some instances the costs of such site visits or meetings may be met in part
or in whole by the issuers concerned if Goldman Sachs Australia considers it is appropriate and reasonable in the specific circumstances relating to
the site visit or meeting. Brazil: Disclosure information in relation to CVM Instruction 483 is available at
http://www.gs.com/worldwide/brazil/area/gir/index.html. Where applicable, the Brazil-registered analyst primarily responsible for the content of this
research report, as defined in Article 16 of CVM Instruction 483, is the first author named at the beginning of this report, unless indicated otherwise at
the end of the text. Canada: Goldman Sachs Canada Inc. is an affiliate of The Goldman Sachs Group Inc. and therefore is included in the company
specific disclosures relating to Goldman Sachs (as defined above). Goldman Sachs Canada Inc. has approved of, and agreed to take responsibility for,
this research report in Canada if and to the extent that Goldman Sachs Canada Inc. disseminates this research report to its clients. Hong Kong: Further information on the securities of covered companies referred to in this research may be obtained on request from Goldman Sachs
(Asia) L.L.C. India: Further information on the subject company or companies referred to in this research may be obtained from Goldman Sachs
(India) Securities Private Limited. Japan: See below. Korea: Further information on the subject company or companies referred to in this research

January 8, 2015
Goldman Sachs Global Investment Research 16
may be obtained from Goldman Sachs (Asia) L.L.C., Seoul Branch. New Zealand: Goldman Sachs New Zealand Limited and its affiliates are neither
"registered banks" nor "deposit takers" (as defined in the Reserve Bank of New Zealand Act 1989) in New Zealand. This research, and any access to it,
is intended for "wholesale clients" (as defined in the Financial Advisers Act 2008) unless otherwise agreed by Goldman Sachs. Russia: Research
reports distributed in the Russian Federation are not advertising as defined in the Russian legislation, but are information and analysis not having
product promotion as their main purpose and do not provide appraisal within the meaning of the Russian legislation on appraisal
activity. Singapore: Further information on the covered companies referred to in this research may be obtained from Goldman Sachs (Singapore)
Pte. (Company Number: 198602165W). Taiwan: This material is for reference only and must not be reprinted without permission. Investors should
carefully consider their own investment risk. Investment results are the responsibility of the individual investor. United Kingdom: Persons who
would be categorized as retail clients in the United Kingdom, as such term is defined in the rules of the Financial Conduct Authority, should read this
research in conjunction with prior Goldman Sachs research on the covered companies referred to herein and should refer to the risk warnings that
have been sent to them by Goldman Sachs International. A copy of these risks warnings, and a glossary of certain financial terms used in this report,
are available from Goldman Sachs International on request.
European Union: Disclosure information in relation to Article 4 (1) (d) and Article 6 (2) of the European Commission Directive 2003/126/EC is available
at http://www.gs.com/disclosures/europeanpolicy.html which states the European Policy for Managing Conflicts of Interest in Connection with
Investment Research.
Japan: Goldman Sachs Japan Co., Ltd. is a Financial Instrument Dealer registered with the Kanto Financial Bureau under registration number Kinsho
69, and a member of Japan Securities Dealers Association, Financial Futures Association of Japan and Type II Financial Instruments Firms
Association. Sales and purchase of equities are subject to commission pre-determined with clients plus consumption tax. See company-specific
disclosures as to any applicable disclosures required by Japanese stock exchanges, the Japanese Securities Dealers Association or the Japanese
Securities Finance Company.
Ratings, coverage groups and views and related definitions
Buy (B), Neutral (N), Sell (S) -Analysts recommend stocks as Buys or Sells for inclusion on various regional Investment Lists. Being assigned a Buy
or Sell on an Investment List is determined by a stock's return potential relative to its coverage group as described below. Any stock not assigned as
a Buy or a Sell on an Investment List is deemed Neutral. Each regional Investment Review Committee manages various regional Investment Lists to a
global guideline of 25%-35% of stocks as Buy and 10%-15% of stocks as Sell; however, the distribution of Buys and Sells in any particular coverage
group may vary as determined by the regional Investment Review Committee. Regional Conviction Buy and Sell lists represent investment
recommendations focused on either the size of the potential return or the likelihood of the realization of the return.
Return potential represents the price differential between the current share price and the price target expected during the time horizon associated
with the price target. Price targets are required for all covered stocks. The return potential, price target and associated time horizon are stated in each
report adding or reiterating an Investment List membership.
Coverage groups and views: A list of all stocks in each coverage group is available by primary analyst, stock and coverage group at
http://www.gs.com/research/hedge.html. The analyst assigns one of the following coverage views which represents the analyst's investment outlook
on the coverage group relative to the group's historical fundamentals and/or valuation. Attractive (A). The investment outlook over the following 12
months is favorable relative to the coverage group's historical fundamentals and/or valuation. Neutral (N). The investment outlook over the
following 12 months is neutral relative to the coverage group's historical fundamentals and/or valuation. Cautious (C). The investment outlook over
the following 12 months is unfavorable relative to the coverage group's historical fundamentals and/or valuation.
Not Rated (NR). The investment rating and target price have been removed pursuant to Goldman Sachs policy when Goldman Sachs is acting in an
advisory capacity in a merger or strategic transaction involving this company and in certain other circumstances. Rating Suspended (RS). Goldman
Sachs Research has suspended the investment rating and price target for this stock, because there is not a sufficient fundamental basis for
determining, or there are legal, regulatory or policy constraints around publishing, an investment rating or target. The previous investment rating and
price target, if any, are no longer in effect for this stock and should not be relied upon. Coverage Suspended (CS). Goldman Sachs has suspended
coverage of this company. Not Covered (NC). Goldman Sachs does not cover this company. Not Available or Not Applicable (NA). The
information is not available for display or is not applicable. Not Meaningful (NM). The information is not meaningful and is therefore excluded.
Global product; distributing entities
The Global Investment Research Division of Goldman Sachs produces and distributes research products for clients of Goldman Sachs on a global
basis. Analysts based in Goldman Sachs offices around the world produce equity research on industries and companies, and research on
macroeconomics, currencies, commodities and portfolio strategy. This research is disseminated in Australia by Goldman Sachs Australia Pty Ltd
(ABN 21 006 797 897); in Brazil by Goldman Sachs do Brasil Corretora de Títulos e Valores Mobiliários S.A.; in Canada by either Goldman Sachs
Canada Inc. or Goldman, Sachs & Co.; in Hong Kong by Goldman Sachs (Asia) L.L.C.; in India by Goldman Sachs (India) Securities Private Ltd.; in
Japan by Goldman Sachs Japan Co., Ltd.; in the Republic of Korea by Goldman Sachs (Asia) L.L.C., Seoul Branch; in New Zealand by Goldman Sachs
New Zealand Limited; in Russia by OOO Goldman Sachs; in Singapore by Goldman Sachs (Singapore) Pte. (Company Number: 198602165W); and in
the United States of America by Goldman, Sachs & Co. Goldman Sachs International has approved this research in connection with its distribution in
the United Kingdom and European Union.
European Union: Goldman Sachs International authorised by the Prudential Regulation Authority and regulated by the Financial Conduct Authority
and the Prudential Regulation Authority, has approved this research in connection with its distribution in the European Union and United Kingdom;
Goldman Sachs AG and Goldman Sachs International Zweigniederlassung Frankfurt, regulated by the Bundesanstalt für
Finanzdienstleistungsaufsicht, may also distribute research in Germany.
General disclosures
This research is for our clients only. Other than disclosures relating to Goldman Sachs, this research is based on current public information that we
consider reliable, but we do not represent it is accurate or complete, and it should not be relied on as such. We seek to update our research as
appropriate, but various regulations may prevent us from doing so. Other than certain industry reports published on a periodic basis, the large
majority of reports are published at irregular intervals as appropriate in the analyst's judgment.
Goldman Sachs conducts a global full-service, integrated investment banking, investment management, and brokerage business. We have
investment banking and other business relationships with a substantial percentage of the companies covered by our Global Investment Research
Division. Goldman, Sachs & Co., the United States broker dealer, is a member of SIPC (http://www.sipc.org).
Our salespeople, traders, and other professionals may provide oral or written market commentary or trading strategies to our clients and our
proprietary trading desks that reflect opinions that are contrary to the opinions expressed in this research. Our asset management area, our
proprietary trading desks and investing businesses may make investment decisions that are inconsistent with the recommendations or views
expressed in this research.
January 8, 2015
Goldman Sachs Global Investment Research 17
The analysts named in this report may have from time to time discussed with our clients, including Goldman Sachs salespersons and traders, or may
discuss in this report, trading strategies that reference catalysts or events that may have a near-term impact on the market price of the equity
securities discussed in this report, which impact may be directionally counter to the analyst's published price target expectations for such stocks. Any
such trading strategies are distinct from and do not affect the analyst's fundamental equity rating for such stocks, which rating reflects a stock's
return potential relative to its coverage group as described herein.
We and our affiliates, officers, directors, and employees, excluding equity and credit analysts, will from time to time have long or short positions in,
act as principal in, and buy or sell, the securities or derivatives, if any, referred to in this research.
The views attributed to third party presenters at Goldman Sachs arranged conferences, including individuals from other parts of Goldman Sachs, do
not necessarily reflect those of Global Investment Research and are not an official view of Goldman Sachs.
Any third party referenced herein, including any salespeople, traders and other professionals or members of their household, may have positions in
the products mentioned that are inconsistent with the views expressed by analysts named in this report.
This research is not an offer to sell or the solicitation of an offer to buy any security in any jurisdiction where such an offer or solicitation would be
illegal. It does not constitute a personal recommendation or take into account the particular investment objectives, financial situations, or needs of
individual clients. Clients should consider whether any advice or recommendation in this research is suitable for their particular circumstances and, if
appropriate, seek professional advice, including tax advice. The price and value of investments referred to in this research and the income from them
may fluctuate. Past performance is not a guide to future performance, future returns are not guaranteed, and a loss of original capital may occur.
Fluctuations in exchange rates could have adverse effects on the value or price of, or income derived from, certain investments.
Certain transactions, including those involving futures, options, and other derivatives, give rise to substantial risk and are not suitable for all investors.
Investors should review current options disclosure documents which are available from Goldman Sachs sales representatives or at
http://www.theocc.com/about/publications/character-risks.jsp. Transaction costs may be significant in option strategies calling for multiple purchase
and sales of options such as spreads. Supporting documentation will be supplied upon request.
All research reports are disseminated and available to all clients simultaneously through electronic publication to our internal client websites. Not all
research content is redistributed to our clients or available to third-party aggregators, nor is Goldman Sachs responsible for the redistribution of our
research by third party aggregators. For research, models or other data available on a particular security, please contact your sales representative or
go to http://360.gs.com.
Disclosure information is also available at http://www.gs.com/research/hedge.html or from Research Compliance, 200 West Street, New York, NY
10282.
© 2015 Goldman Sachs.
No part of this material may be (i) copied, photocopied or duplicated in any form by any means or (ii) redistributed without the prior written consent of The Goldman Sachs Group, Inc.