asian macro & market outlook
TRANSCRIPT

Asian Macro & Market Outlook
SMAM monthly comments & views November 2016
Chinese and Asian Economies Chinese economy appears to enter a stable phase as Jul-Sep GDP (+6.7% YoY as projected) was same as the previous two quarters. We see the government would continue the current pro-growth policy stance in 2017, however if Prime Minister was newly elected next autumn, the stance for 2018 may change. In September, the Fixed Asset Investment (FAI) accelerated on a recovery in private investment. Through infrastructure investment, Producer Price Index (PPI) has shown an uptick on growing demands of materials such as steel since February 2012.
Considering rooms for additional easing, we stay with our view that the economic growth for India and ASEAN would boost, but that for NIEs can deteriorate moderately. As for Thailand, we take a cautious stance for bearish consumer sentiment as downside risk even after a year-long mourning period for Thai King Bhumibol Adulyadej. In Australia, the economy is deemed as stable even slowly supported by non-resource sector growth.
Asia-Pacific Stock Markets
We have slightly changed our outlook for Asian equity markets to mild upside in coming 3 to 6 months supported by a recovery of corporate earnings and relatively attractive valuation level against developed markets.
Macro economy in most of Asian countries will show some recovery in 2016/17, but the momentum is not so strong. China economy has been stabilized by strong policy support but it will continue to slow gradually in the medium term.
Property market in China remains a key risk.
The recovery of corporate earnings will be moderate towards 2017 as overall global economy stabilizes.
Liquidity condition has been supporting emerging markets thanks to the delay of US rate hike.
Overall market environment has been stabilized, and we expect Asian equity markets will follow the move of global equity markets.
Executive summary
1
Note: Economy and Stock markets comments are as of October 21st and 27th 2016 respectively.
2
Outlook for Chinese Economy
3
SMAM Economic Outlook for China
Note: Arrows illustrate the direction of the change from last time prediction Source: CEIC, compiled by SMAM Economic Research Department, Previous= Last month meeting's projection As of 21 October 2016
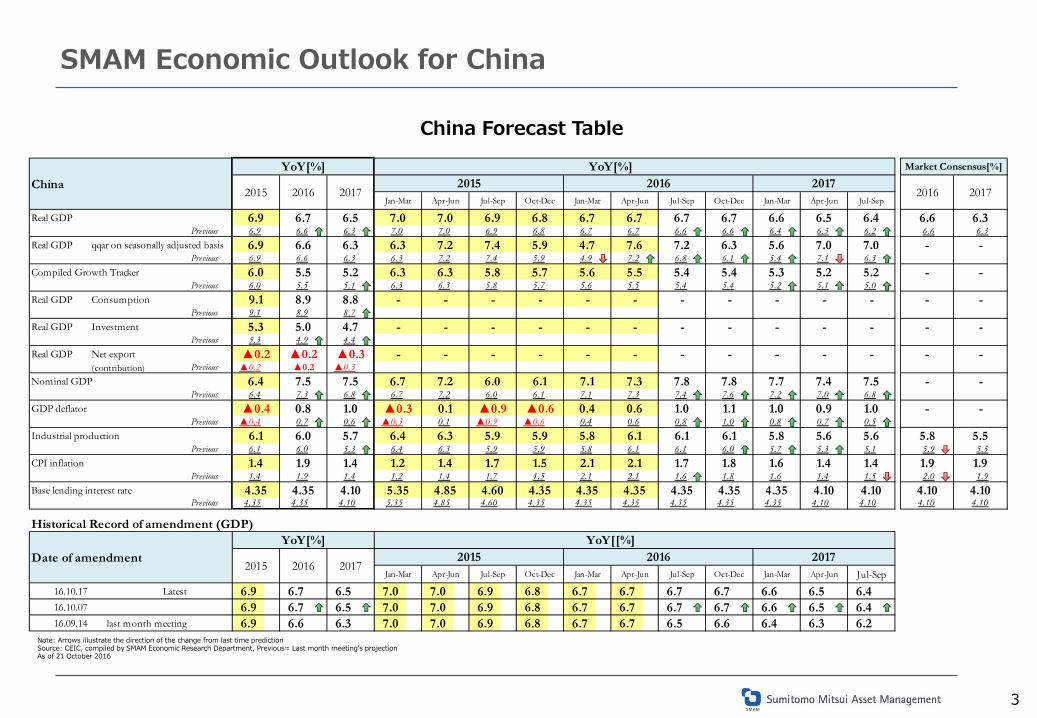
China Forecast Table
Real GDPPrevious 6.9 6.6 6.3 7.0 7.0 6.9 6.8 6.7 6.7 6.6 6.6 6.4 6.3 6.2 6.6 6.3
Real GDP qqar on seasonally adjusted basisPrevious 6.9 6.6 6.3 6.3 7.2 7.4 5.9 4.9 7.2 6.8 6.1 5.4 7.1 6.3
Compiled Growth TrackerPrevious 6.0 5.5 5.1 6.3 6.3 5.8 5.7 5.6 5.5 5.4 5.4 5.2 5.1 5.0
Real GDP ConsumptionPrevious 9.1 8.9 8.7
Real GDP InvestmentPrevious 5.3 4.9 4.4
Real GDP Net export(contribution) Previous ▲0.2 ▲0.3
Nominal GDPPrevious 6.4 7.3 6.8 6.7 7.2 6.0 6.1 7.1 7.3 7.4 7.6 7.2 7.0 6.8
GDP deflatorPrevious ▲0.4 0.7 0.6 ▲0.3 0.1 ▲0.9 ▲0.6 0.4 0.6 0.8 1.0 0.8 0.7 0.5
Industrial productionPrevious 6.1 6.0 5.3 6.4 6.3 5.9 5.9 5.8 6.1 6.1 6.0 5.7 5.3 5.1 5.9 5.5
CPI inflationPrevious 1.4 1.9 1.4 1.2 1.4 1.7 1.5 2.1 2.1 1.6 1.8 1.6 1.4 1.5 2.0 1.9
Base lending interest ratePrevious 4.35 4.35 4.10 5.35 4.85 4.60 4.35 4.35 4.35 4.35 4.35 4.35 4.10 4.10 4.10 4.10
Historical Record of amendment (GDP)
16.10.17 Latest 6.9 6.7 6.5 7.0 7.0 6.9 6.8 6.7 6.7 6.7 6.7 6.6 6.5 6.416.10.07 6.9 6.7 6.5 7.0 7.0 6.9 6.8 6.7 6.7 6.7 6.7 6.6 6.5 6.416.09.14 last month meeting 6.9 6.6 6.3 7.0 7.0 6.9 6.8 6.7 6.7 6.5 6.6 6.4 6.3 6.2
4.10
-
-
5.5
1.9
4.10
2017
6.3
-
-
-
-
-
-
-
-
-
-
-
-
5.8
1.9
Jan-Mar Apr-Jun Jul-Sep Oct-Dec
2016
Market Consensus[%]
Jan-Mar Apr-Jun Jul-Sep
2017
2017
4.10 4.10
1.0
- -
5.2
6.6 6.6
Date of amendmentYoY[%] YoY[[%]
2015 2016 20172015
4.35 4.35 4.35 4.35 4.35 4.354.35 4.35 4.10 5.35 4.85 4.60
2016Jan-Mar Apr-Jun Jul-Sep Oct-Dec
1.7 1.8 1.6 1.4 1.41.4 1.9 1.4 1.2 1.4 1.7 1.5 2.1 2.1
6.1 6.1 6.1 5.8 5.6 5.66.1 6.0 5.7 6.4 6.3 5.9 5.9 5.8
0.4 0.6 1.0 1.1 1.0 0.9
7.4 7.5
▲0.4 0.8 1.0 ▲0.3 0.1 ▲0.9 ▲0.6
6.1 7.1 7.3 7.8 7.8 7.7▲0.2
6.4 7.5 7.5 6.7 7.2 6.0
- - - - - -▲0.2 ▲0.2 ▲0.3 - - -
- - - - -5.3 5.0 4.7 - - - - - -
- - - - - -9.1 8.9 8.8 - - - - -
5.6 5.5 5.4 5.4 5.3 5.2
7.0 7.0
6.0 5.5 5.2 6.3 6.3 5.8 5.7
5.9 4.7 7.6 7.2 6.3 5.66.9 6.6 6.3 6.3 7.2 7.4
6.9 6.8 6.7 6.7 6.7 6.7Oct-Dec Jan-Mar Jul-Sep
6.9 6.7 6.5 7.0 7.0Apr-Jun Jul-Sep Oct-Dec Jan-Mar Apr-Jun Jul-Sep
6.5 6.4Apr-Jun
ChinaYoY[%] YoY[%]
2015 2016 20172015 2016
Jan-Mar

4
SMAM Economic Outlook for China
Note: Italic letters present numbers for January and February compared with the corresponding period of the previous year. Source: CEIC, compiled by SMAM As of 21 October 2016
China September economic performance
(%, YoY)
consensus actual Aug Jul Jun May Apr May Feb Janreal GDP 6.7 6.7 6.7 6.7mfg PMI 49.8 50.4 50.4 49.9 50.0 50.1 50.1 50.2 49.0 49.4Caixin mfg PMI 50.1 50.1 50 50.6 48.6 49.2 49.4 49.7 48.0 48.4steel PMI NA 49.5 50.1 50.2 45.1 50.9 57.3 49.7 49.0 46.7industrial production 6.4 6.1 6.3 6.0 6.2 6.0 6.0 6.8 5.4 5.4fixed asset investment (ytd) 8.2 8.2 8.1 8.1 9.0 9.6 10.5 10.7 10.2 10.2fixed asset investment NA 9.0 8.2 3.9 7.3 7.4 10.1 11.2 10.2 10.2property investment NA 7.8 6.2 1.4 3.3 6.6 9.7 9.7 3.0 3.0floor space sold NA 35.3 19.1 16.7 14.2 22.0 45.9 40.3 30.4 30.4100 cities housing price (mmar) NA 39.8 29.4 21.5 17.0 22.4 18.9 25.4 7.4 5.1retail sales 10.7 10.7 10.6 10.2 10.6 10.0 10.1 10.5 10.2 10.2retail sales (real basis) NA 9.6 10.2 9.8 10.3 9.7 9.3 9.7 9.6 9.6auto sales units(th) NA 2,564 2,071 1,852 2,071 2,092 2,122 2,440 1,581 2,501auto sales units (%) NA 26.6 24.4 23.2 14.6 9.9 6.4 8.9 -0.8 7.8exports(RMB) 2.9 -5.6 5.9 2.9 1.3 1.2 4.1 18.7 -20.6 -6.6imports(RMB) 0.7 2.2 10.8 -5.7 -2.3 5.1 -5.7 -1.7 -8.0 -14.4international reserves (USDbn) 3,190.0 3,166.4 3,185.2 3,201.1 3,205.2 3,191.7 3,219.7 3,212.6 3,202.3 3,230.9CPI 1.7 1.9 1.3 1.8 1.9 2.0 2.3 2.3 2.3 1.8PPI -0.9 0.1 -0.8 -1.7 -2.6 -2.8 -3.4 -4.3 -4.9 -5.3M2 11.6 11.5 11.4 10.2 11.8 11.8 12.8 13.4 13.3 14.0new loans(RMB bn) 850.0 1,220.0 948.7 463.6 1,380.0 985.5 555.6 1,370.0 726.6 2,510.0social aggregate financing(RMB bn) 1,000.0 1,720.0 1469.7 487.9 1,629.3 659.9 751.0 2,336.0 824.5 3,425.3
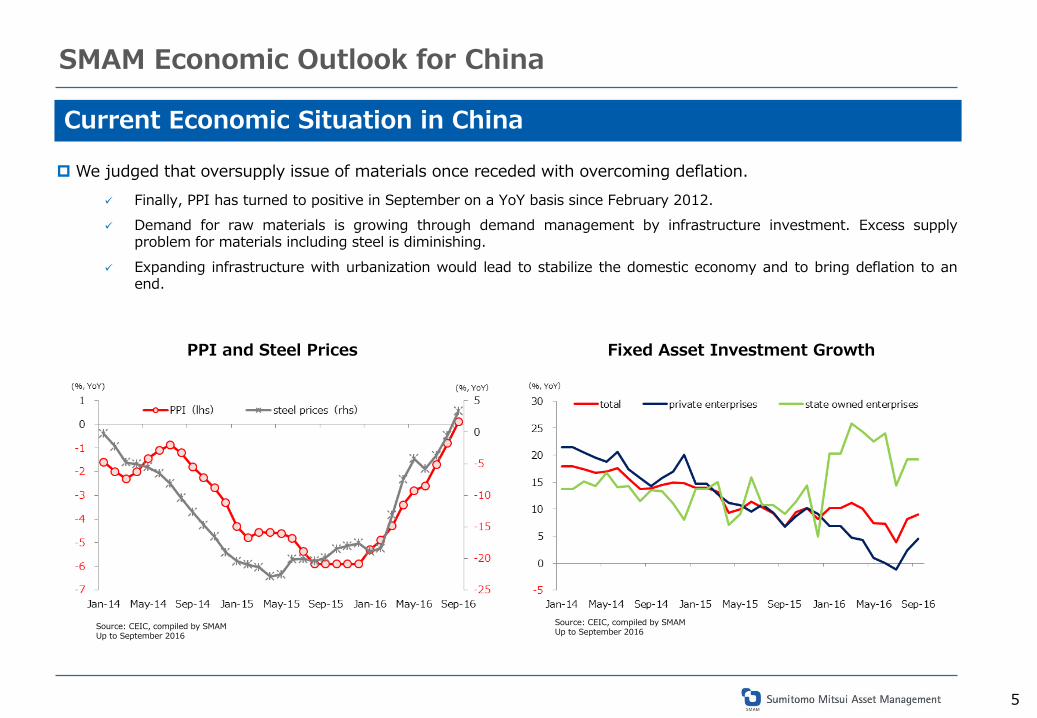
We judged that oversupply issue of materials once receded with overcoming deflation. Finally, PPI has turned to positive in September on a YoY basis since February 2012. Demand for raw materials is growing through demand management by infrastructure investment. Excess supply
problem for materials including steel is diminishing. Expanding infrastructure with urbanization would lead to stabilize the domestic economy and to bring deflation to an
end.
SMAM Economic Outlook for China
5
Source: CEIC, compiled by SMAM Up to September 2016
PPI and Steel Prices Fixed Asset Investment Growth
Current Economic Situation in China
Source: CEIC, compiled by SMAM Up to September 2016

More details for the current situation: China’s economy is stabilizing on improvement in oversupply conditions In September customs statistics, downturns in exports and imports are noticeable, but we need to consider that a number
of working days in September was smaller than in the previous month. Steel production is now on a stable trend. Exports in steel material dropped as consumption for that material expanded in
China. Demand for raw materials seems to be recovering led by infrastructure investment. PPI turned to inflation from deflation. The Premier Li Keqiang made a remark about the strong economy for Jul-Sep and hope for the 2017 economy to stabilize. After the last G20 meeting in this year, China’s currency renminbi (RMB) depreciated against US dollar due to UK’s pound
fall. Yet, RMB moves stably within the currency basket. The Ministry of Finance indicated its intention to consider a budget deficit.
As for Money Supply, M2 growth slowed down, whereas M1 growth accelerated. This means that more household purchase, cash-rich company, and municipal bond issue appear.
PPI deflation is easing led by growing demands for material with the need for infrastructure. The Ministry of Finance indicated its intention to review a budget deficit after G20 meeting.
Outlook for 2016 & 2017: We see the stable economy in 2017 led by the fiscal policy We revised up the real GDP growth for Jul-Sep to +6.7% YoY from +6.6% YoY. For 2017, we raised the real GDP growth to +6.5% YoY from +6.3% YoY. In the wake of slowing deflationary pressure in the PPI, we raised GDP deflator projection on expectation for its positive
growth in 2017 In the plenum of the Communist Party of China in fall 2017, Wang Qishan is seen to become a new Premier, where sudden
policy change may happen.
SMAM Economic Outlook for China
6
Note: Economy outlook is as of 17 October 2016

7
Note: new lending excludes interbank transactions. Source: CEIC, compiled by SMAM Up to September 2016
Domestic Demand for Steel GDP Deflator by Industries
Source: CEIC, compiled by SMAM Up to August 2016
Source: CEIC, compiled by SMAM Up to September 2016
Money Supply Total Social Finance
SMAM Economic Outlook for China
(RMB bn)
Total Newlending
Entrustedloan Trust loan Bankers'
acceptanceCorporatebonds Others
2012 15,763 8,204 1,284 1,285 1,050 2,255 1,6862013 17,317 8,892 2,547 1,840 776 1,811 1,4512014 16,413 9,781 2,507 518 -128 2,382 1,3542015 15,406 11,269 1,591 43 -1,057 2,939 620
Jan 3,425 2,537 217 55 133 458 25Feb 824 811 165 31 -370 132 57Mar 2,404 1,318 166 73 17 719 111Apr 787 564 169 27 -278 243 62May 684 937 157 12 -507 -18 103Jun 1,684 1,314 172 81 -272 236 152Jul 488 455 177 21 -512 219 128
Aug 1,470 797 143 74 -38 331 163Sep 1,720 1,267 143 106 -224 291 137
Note: The data series=steel production - steel export Source: CEIC, compiled by SMAM Up to September 2016

8
Note: The data series=steel production - steel export Source: CEIC, compiled by SMAM Up to September 2016
CPI Inflation RMB against USD
Source: CEIC, compiled by SMAM Up to 19 October 2016
New Lending
SMAM Economic Outlook for China
Source: CEIC, compiled by SMAM Up to September 2016

Outlook for Asia-Pacific Economy
9

10
SMAM Economic Outlook for Asia and Oceania
Source: CEIC, compiled by SMAM Note: Economic Research Department, Previous= Last month meeting's projection. Arrows illustrate the direction of the change from last time prediction. As of 21 October 2016
Forecast Table
IndiaPrevious 7.6 7.7 8.0 6.7 7.5 7.6 7.2 7.9 7.1 7.7 8.2 7.8 8.0 7.8 7.6 7.7
NIEs4Previous 2.1 1.9 1.8 2.8 1.9 1.9 2.0 1.8 2.4 1.6 1.9 1.7 1.7 1.8 2.0 2.3
KoreaPrevious 2.6 2.5 2.4 2.4 2.2 2.8 3.1 2.8 3.3 2.0 2.2 2.2 2.2 2.5 2.6 2.6
TaiwanPrevious 0.6 0.9 0.9 4.0 0.6 ▲0.8 ▲0.9 ▲0.7 0.7 1.6 1.8 1.2 1.1 0.8 1.0 1.7
SingaporePrevious 2.0 1.8 1.4 2.7 1.7 1.8 1.8 2.1 2.1 1.2 1.8 1.3 1.5 1.4 1.7 1.8
HongkongPrevious 2.4 0.8 0.6 2.4 2.9 2.2 1.9 0.8 1.7 0.5 0.4 0.8 0.8 0.5 1.2 1.5
ASEAN4Previous 4.6 4.8 4.9 4.6 4.5 4.5 4.7 4.7 4.9 4.8 4.8 4.7 4.8 5.0 4.6 4.9
IndonesiaPrevious 4.8 5.2 5.4 4.7 4.7 4.7 5.0 4.9 5.2 5.2 5.3 5.3 5.3 5.4 5.0 5.3
ThailandPrevious 2.8 3.2 3.3 3.0 2.7 2.9 2.8 3.2 3.5 3.2 3.0 2.9 3.1 3.5 3.1 3.2
MalaysiaPrevious 5.0 4.1 4.4 5.7 4.9 4.7 4.5 4.2 4.0 4.1 4.2 4.2 4.3 4.5 4.1 4.3
PhilippinesPrevious 5.9 6.7 6.3 5.0 5.9 6.2 6.5 6.8 7.0 6.5 6.5 6.1 6.1 6.5 6.4 6.1
AustraliaPrevious 2.5 2.9 2.5 2.3 2.1 2.7 2.9 3.1 3.2 2.7 2.5 2.1 2.4 2.6 2.9 2.8
7.6 7.2 7.9
0.6 0.9 0.9 4.0 0.6
2.2 2.42.5 2.9 2.5 2.3 2.1 2.7 2.9 3.0 3.3
Real GDPYoY[%]
2015 2016 2017 2015 2016Jan-Mar Oct-Dec
2.6 2.5 2.4 2.4 2.2 2.8 3.1
2.02.1 1.9
2.8 2.7
4.9 4.6 4.5 4.5 4.7 4.7
0.8
5.2 5.3
1.7
▲0.7▲0.9
2.8
1.7 2.8 1.9
▲0.8
3.3
Jul-Sep
7.6 7.7 8.0 6.7 7.5Apr-Jun Jul-Sep Oct-Dec Jan-Mar Apr-Jun Jul-Sep
7.8 8.0 7.87.1 7.7 8.2Jan-Mar Apr-Jun
1.9
0.8
2.0 2.2 2.2 2.2
0.7 1.6 1.8 1.2 1.1
1.82.4 1.6 1.8 1.7
2.5
1.7
2.4 0.8 0.6 2.4 2.9 2.2 1.9
2.0 1.5 1.3 2.7 1.7 1.8 1.8 1.82.0 0.6 1.5 1.2 1.22.0
0.51.7 0.5 0.4 0.8 0.8
5.3 5.3 5.44.8 5.2 5.4 4.7 4.7 4.7 5.0 4.9 5.2
4.9 4.8 4.8 4.7 4.8 5.04.6 4.8
3.1 3.5
5.0 4.1 4.4 5.7 4.9 4.7 4.5
2.8 3.2 3.5 3.2 3.0 2.92.8 3.2 3.3 3.0 2.7 2.9
5.9 6.7 6.3 5.0 5.9 6.2 6.5 6.8
4.2
7.0 6.5 6.5 6.1 6.1 6.5
4.54.0 4.1 4.2 4.2 4.3
2.6
2017YoY[%] Market Consensus[%]
2016 2017
7.6 7.7
2.0 2.2
2.6 2.6
1.0 1.7
1.7 1.8
1.3 1.7
4.7 4.8
5.0 5.3
3.2 3.2
4.1 4.3
6.5 6.1
3.0 2.8
11
SMAM Economic Outlook for Asia and Oceania
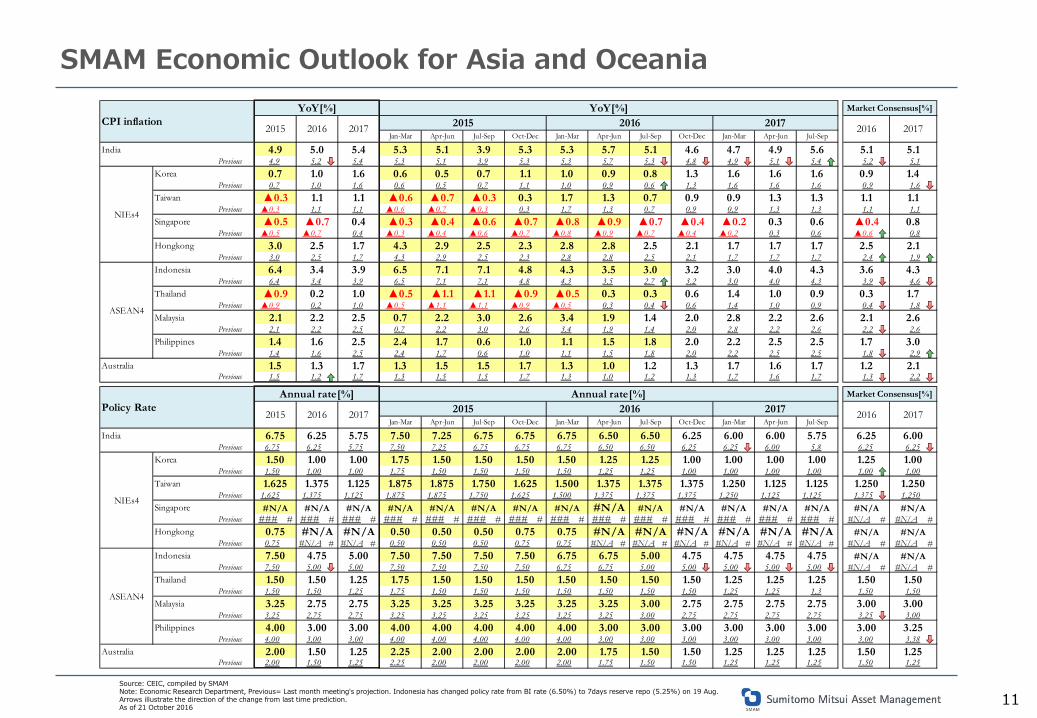
Source: CEIC, compiled by SMAM Note: Economic Research Department, Previous= Last month meeting's projection. Indonesia has changed policy rate from BI rate (6.50%) to 7days reserve repo (5.25%) on 19 Aug. Arrows illustrate the direction of the change from last time prediction. As of 21 October 2016
IndiaPrevious 4.9 5.2 5.4 5.3 5.1 3.9 5.3 5.3 5.7 5.3 4.8 4.9 5.1 5.4 5.2 5.1
KoreaPrevious 0.7 1.0 1.6 0.6 0.5 0.7 1.1 1.0 0.9 0.6 1.3 1.6 1.6 1.6 0.9 1.6
TaiwanPrevious ▲0.3 1.1 1.1 ▲0.6 ▲0.7 ▲0.3 0.3 1.7 1.3 0.7 0.9 0.9 1.3 1.3 1.1 1.1
SingaporePrevious ▲0.5 ▲0.7 0.4 ▲0.3 ▲0.4 ▲0.6 ▲0.7 ▲0.8 ▲0.9 ▲0.7 ▲0.4 ▲0.2 0.3 0.6 ▲0.6 0.8
HongkongPrevious 3.0 2.5 1.7 4.3 2.9 2.5 2.3 2.8 2.8 2.5 2.1 1.7 1.7 1.7 2.4 1.9
IndonesiaPrevious 6.4 3.4 3.9 6.5 7.1 7.1 4.8 4.3 3.5 2.7 3.2 3.0 4.0 4.3 3.9 4.6
ThailandPrevious ▲0.9 0.2 1.0 ▲0.5 ▲1.1 ▲1.1 ▲0.9 ▲0.5 0.3 0.4 0.6 1.4 1.0 0.9 0.4 1.8
MalaysiaPrevious 2.1 2.2 2.5 0.7 2.2 3.0 2.6 3.4 1.9 1.4 2.0 2.8 2.2 2.6 2.2 2.6
PhilippinesPrevious 1.4 1.6 2.5 2.4 1.7 0.6 1.0 1.1 1.5 1.8 2.0 2.2 2.5 2.5 1.8 2.9
AustraliaPrevious 1.5 1.2 1.7 1.3 1.5 1.5 1.7 1.3 1.0 1.2 1.3 1.7 1.6 1.7 1.3 2.2
IndiaPrevious 6.75 6.25 5.75 7.50 7.25 6.75 6.75 6.75 6.50 6.50 6.25 6.25 6.00 5.8 6.25 6.25
KoreaPrevious 1.50 1.00 1.00 1.75 1.50 1.50 1.50 1.50 1.25 1.25 1.00 1.00 1.00 1.00 1.00 1.00
TaiwanPrevious 1.625 1.375 1.125 1.875 1.875 1.750 1.625 1.500 1.375 1.375 1.375 1.250 1.125 1.125 1.375 1.250
SingaporePrevious ### # ### # ### # ### # ### # ### # ### # ### # ### # ### # ### # ### # ### # ### # #N/A # #N/A #
HongkongPrevious 0.75 #N/A # #N/A # 0.50 0.50 0.50 0.75 0.75 #N/A # #N/A # #N/A # #N/A # #N/A # #N/A # #N/A # #N/A #
IndonesiaPrevious 7.50 5.00 5.00 7.50 7.50 7.50 7.50 6.75 6.75 5.00 5.00 5.00 5.00 5.00 #N/A # #N/A #
ThailandPrevious 1.50 1.50 1.25 1.75 1.50 1.50 1.50 1.50 1.50 1.50 1.50 1.25 1.25 1.3 1.50 1.50
MalaysiaPrevious 3.25 2.75 2.75 3.25 3.25 3.25 3.25 3.25 3.25 3.00 2.75 2.75 2.75 2.75 3.25 3.00
PhilippinesPrevious 4.00 3.00 3.00 4.00 4.00 4.00 4.00 4.00 3.00 3.00 3.00 3.00 3.00 3.00 3.00 3.38
AustraliaPrevious 2.00 1.50 1.25 2.25 2.00 2.00 2.00 2.00 1.75 1.50 1.50 1.25 1.25 1.25 1.50 1.25
1.50 1.50 1.25 1.252.00 1.50 1.25 2.25 2.00 2.00 2.00 2.00 1.75
1.5 1.3 1.7 1.3 1.5 1.5 1.7 1.3 1.0 1.2 1.3 1.7 1.6
CPI inflationYoY[%]
2015 2016 2017 2015 2016Jul-Sep Oct-Dec
4.9 5.0 5.4 5.3 5.1 3.9Jul-SepJan-Mar Apr-Jun Jul-Sep Oct-Dec Jan-Mar Apr-Jun
4.9 5.65.7 5.1 4.6 4.7Jan-Mar Apr-Jun
0.9 0.8 1.3 1.6 1.6 1.6
5.3 5.3
▲0.5 ▲0.7 0.4 ▲0.3 ▲0.4 ▲0.6 ▲0.7 ▲0.8
1.3 0.7 0.9 0.9 1.3 1.3
▲0.9 ▲0.7 ▲0.4 ▲0.2 0.3 0.6
▲0.3 1.1
3.0 2.5 1.7 4.3 2.9 2.5 2.3 2.8
NIEs4
1.1 ▲0.6 ▲0.7 ▲0.3 0.3 1.7
0.7 1.0 1.6 0.6 0.5 0.7 1.1 1.0
2.8 2.5 2.1 1.7 1.7 1.7
0.3 0.3 0.6 1.4 1.0
4.33.5 3.0 3.2 3.0
0.9▲0.9
4.8 4.36.4 3.4 3.9 6.5 7.1 7.1
2.2 2.5
▲0.5
4.0
▲0.9 0.2
2.51.4 1.6 2.5 2.4 1.7 0.6 1.0 1.1 1.5
1.9 1.4 2.0 2.8 2.2 2.62.2 3.0
Policy RateAnnual rate[%]
2015 2016 2017 2015 2016Jan-Mar Oct-Dec
ASEAN4
1.8 2.0
2.1 2.2 2.6 3.42.5 0.7
1.0 ▲0.5 ▲1.1 ▲1.1
Jul-Sep
6.75 6.25 5.75 7.50 7.25Apr-Jun Jul-Sep Oct-Dec Jan-Mar Apr-Jun Jul-Sep
6.00 6.00 5.756.50 6.50 6.25Jan-Mar Apr-Jun
1.001.25 1.25 1.00 1.00 1.00
6.75 6.75 6.75
1.375 1.125 1.875 1.875 1.750 1.625
1.501.50 1.00 1.00 1.75 1.50 1.50 1.50
#N/A
1.125
#N/A #N/A #N/A #N/A #N/A #N/A #N/A
1.500 1.375 1.375 1.375 1.250 1.125
#N/A#N/A #N/A #N/A #N/A #N/A
1.625
#N/A0.75 #N/A #N/A #N/A #N/A #N/A0.75 #N/A #N/A 0.50 0.50 0.50 0.75
7.50 4.75 5.00 7.50 7.50 7.50 7.50 6.75 6.75
3.25 2.75 2.75 3.25 3.25 3.25 3.25
1.50 1.501.50 1.50 1.25 1.75 1.50 1.50
NIEs4
ASEAN4
3.00 3.00 3.00 3.00 3.00 3.00
2.753.25 3.00 2.75 2.75 2.75
4.00 3.00 3.00 4.00 4.00 4.00 4.00 4.00
1.7
1.25
2017YoY[%]
2017Annual rate[%]
3.25
1.25 1.251.50 1.50 1.50 1.25
5.00 4.75 4.75 4.75 4.75
Market Consensus[%]
2016 2017
5.1 5.1
0.9 1.4
1.1 1.1
1.250
Market Consensus[%]
2016 2017
▲0.4 0.8
2.5 2.1
3.6 4.3
0.3 1.7
2.1 2.6
1.50 1.25
1.50 1.50
3.00 3.00
3.00 3.25
#N/A #N/A
#N/A #N/A
#N/A #N/A
6.25
1.7 3.0
1.2 2.1
6.00
1.25 1.00
1.250
Source: Citi, Bloomberg, compiled by SMAM Up to 20 October 2016
12
Australia
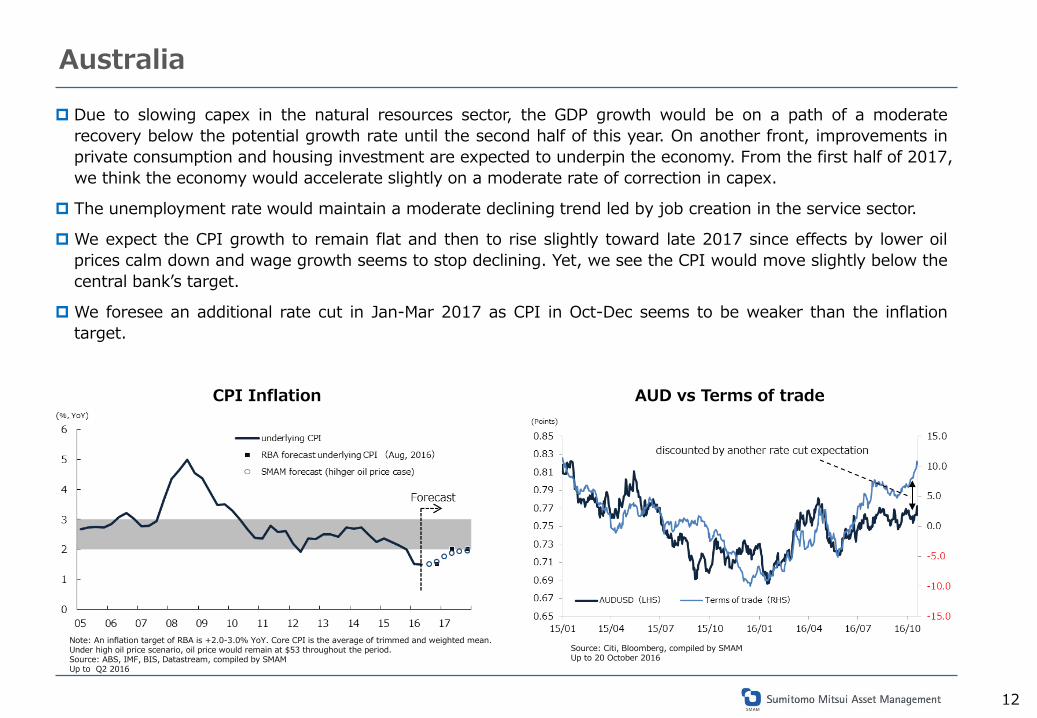
Due to slowing capex in the natural resources sector, the GDP growth would be on a path of a moderate recovery below the potential growth rate until the second half of this year. On another front, improvements in private consumption and housing investment are expected to underpin the economy. From the first half of 2017, we think the economy would accelerate slightly on a moderate rate of correction in capex.
The unemployment rate would maintain a moderate declining trend led by job creation in the service sector.
We expect the CPI growth to remain flat and then to rise slightly toward late 2017 since effects by lower oil prices calm down and wage growth seems to stop declining. Yet, we see the CPI would move slightly below the central bank’s target.
We foresee an additional rate cut in Jan-Mar 2017 as CPI in Oct-Dec seems to be weaker than the inflation target.
CPI Inflation AUD vs Terms of trade
Note: An inflation target of RBA is +2.0-3.0% YoY. Core CPI is the average of trimmed and weighted mean. Under high oil price scenario, oil price would remain at $53 throughout the period. Source: ABS, IMF, BIS, Datastream, compiled by SMAM Up to Q2 2016
13
Taiwan
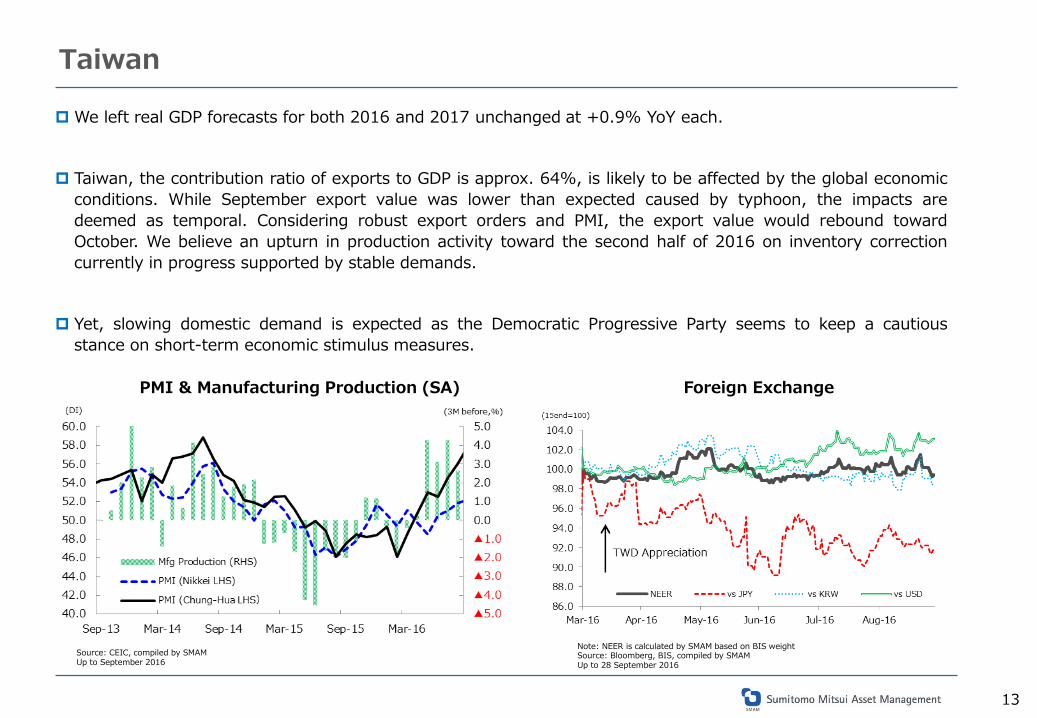
We left real GDP forecasts for both 2016 and 2017 unchanged at +0.9% YoY each.
Taiwan, the contribution ratio of exports to GDP is approx. 64%, is likely to be affected by the global economic conditions. While September export value was lower than expected caused by typhoon, the impacts are deemed as temporal. Considering robust export orders and PMI, the export value would rebound toward October. We believe an upturn in production activity toward the second half of 2016 on inventory correction currently in progress supported by stable demands.
Yet, slowing domestic demand is expected as the Democratic Progressive Party seems to keep a cautious stance on short-term economic stimulus measures.
Note: NEER is calculated by SMAM based on BIS weight Source: Bloomberg, BIS, compiled by SMAM Up to 28 September 2016
PMI & Manufacturing Production (SA) Foreign Exchange
更新版をもらう
Source: CEIC, compiled by SMAM Up to September 2016

14
India
India is less vulnerable to the global economy as the contribution ratio of exports to GDP is low at approx. 13%. Thanks to abundant rainfall in this year’s monsoon season, crop sowing area in 2016 increased from the previous year. We see that inflation would decelerate and economic growth would accelerate driven by the agricultural sector.
India’s inflation, which faced a significant decline toward September, seems to continue this slowing trend due to base effect. In October Monetary Policy Committee (MPC), the authority indicated accommodative stance would continue. Accordingly, we expect an additional rate cut in February.
In our view, the economy would rebound moderately. Currently, infrastructure investment is weak. Yet, the government is planning to expand the investment toward 2020 and as the business condition is expected to improve by enactment of legislation on Goods and Services Tax (GST), and Insolvency and Bankruptcy code.
Source: CEIC, compiled by SMAM Estimate: Assuming the index of food price remains at a same level Up to September 2016
CPI Relationship between Rainfall & Agri Production
Note: Data period is from FY1967 to FY2013. We calculated correlation by using regression analysis (Dependent variable= Agri production on a YoY basis). Explanatory variable: Rainfall (Departure from normal). Source: CEIC, IMD, compiled by SMAM
更新版をもらう

15
Indonesia
The inflation rate has been well controlled as remaining within the target range since November last year. The government’s additional gasoline price cut on April 1 can be a supportive factor for boosting private consumption through curbing inflation.
The President Joko Widodo appointed Sri Mulyani as the country's new finance minister in a cabinet reshuffle. This would show how keen the government is to implement tax amnesty.
GDP & Consumption Gasoline Price & CPI Inflation
Source: CEIC, compiled by SMAM Up to October 2016
Source: CEIC, compiled by SMAM Up to July 2016
Note: The Malaysian government applied new float system for petrol prices on Dec 2014. Annual inflation rates have been pushed up 1.1points by GST from April 2015 calculated by the government. Source: CEIC, compiled by SMAM Up to August 2016
16
Malaysia
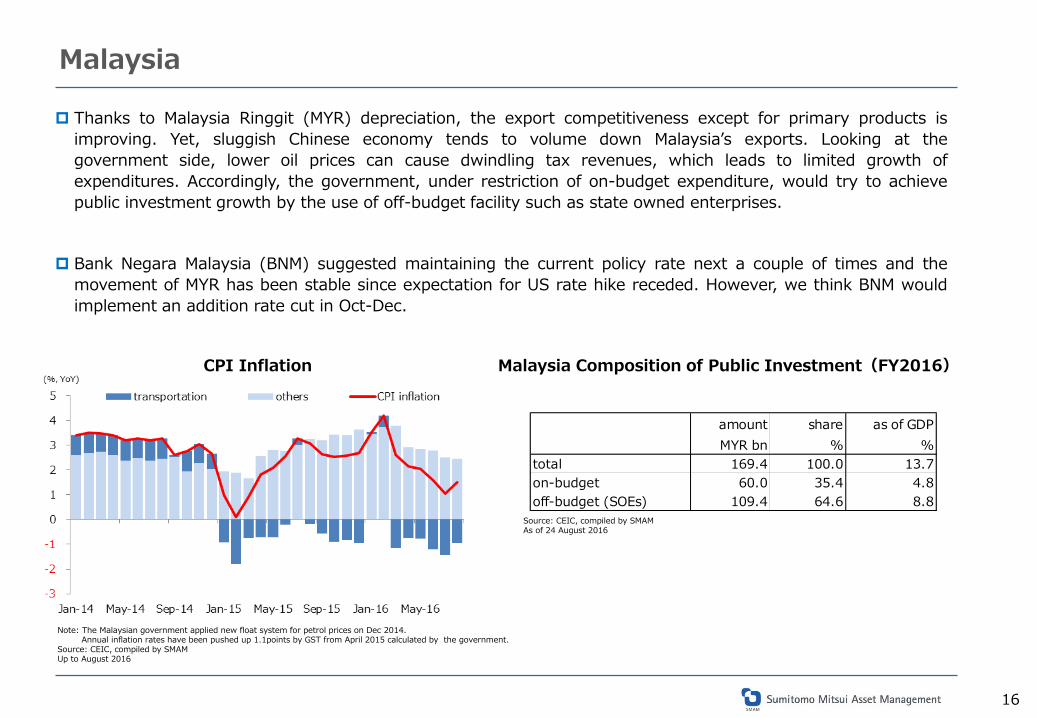
Thanks to Malaysia Ringgit (MYR) depreciation, the export competitiveness except for primary products is improving. Yet, sluggish Chinese economy tends to volume down Malaysia’s exports. Looking at the government side, lower oil prices can cause dwindling tax revenues, which leads to limited growth of expenditures. Accordingly, the government, under restriction of on-budget expenditure, would try to achieve public investment growth by the use of off-budget facility such as state owned enterprises.
Bank Negara Malaysia (BNM) suggested maintaining the current policy rate next a couple of times and the movement of MYR has been stable since expectation for US rate hike receded. However, we think BNM would implement an addition rate cut in Oct-Dec.
CPI Inflation Malaysia Composition of Public Investment(FY2016)
amount share as of GDPMYR bn % %
total 169.4 100.0 13.7on-budget 60.0 35.4 4.8off-budget (SOEs) 109.4 64.6 8.8
Source: CEIC, compiled by SMAM As of 24 August 2016

17
Philippines
The economy is less vulnerable to global economic cycle as the contribution ratio of exports to GDP is only around 20%, lower than in other countries.
The government foresees the economic growth to +7-8% for 2016. In our view, private consumption would be firm thanks to elections in the first half of 2016. Even after the event, the economic recovery seems to continue led by increased middle-class consumption and low inflation environment.
We regard further infrastructure as a result of enhancing cooperation with China or Japan and a reduction in corporate tax as upside risk for 2017. Downside risk would be that bad weather such as typhoons or droughts accelerates inflation.
Real GDP by Expenditures CPI
Source: CEIC, compiled by SMAM Up to September 2016
更新版をもらう
Source: CEIC, compiled by SMAM Up to June 2016

18
Singapore
Singapore has been struggled with deflation. We cut the CPI forecasts for 2016 and 2017 to -0.7% YoY and +0.4% YoY.
This country’s economy is sensitive to other Asian economies, particularly to China, due to heavy export dependence (approx. 130%). In accordance with China’s continuing economic stagnation, Singapore is likely to face a further downward pressure on its economy.
Also, the weak economy in Malaysia, an important trading partner for Singapore, may drag down the exports. Furthermore, biomedical output in Singapore remains volatile. Thus, we take a careful attention to the IP numbers, biomedical manufacturing in particular, as upside and downside risks.
GDP growth in China and Singapore CPI Inflation
Source: CEIC, compiled by SMAM Up to 2015
Source: CEIC, compiled by SMAM Up to August 2016
19
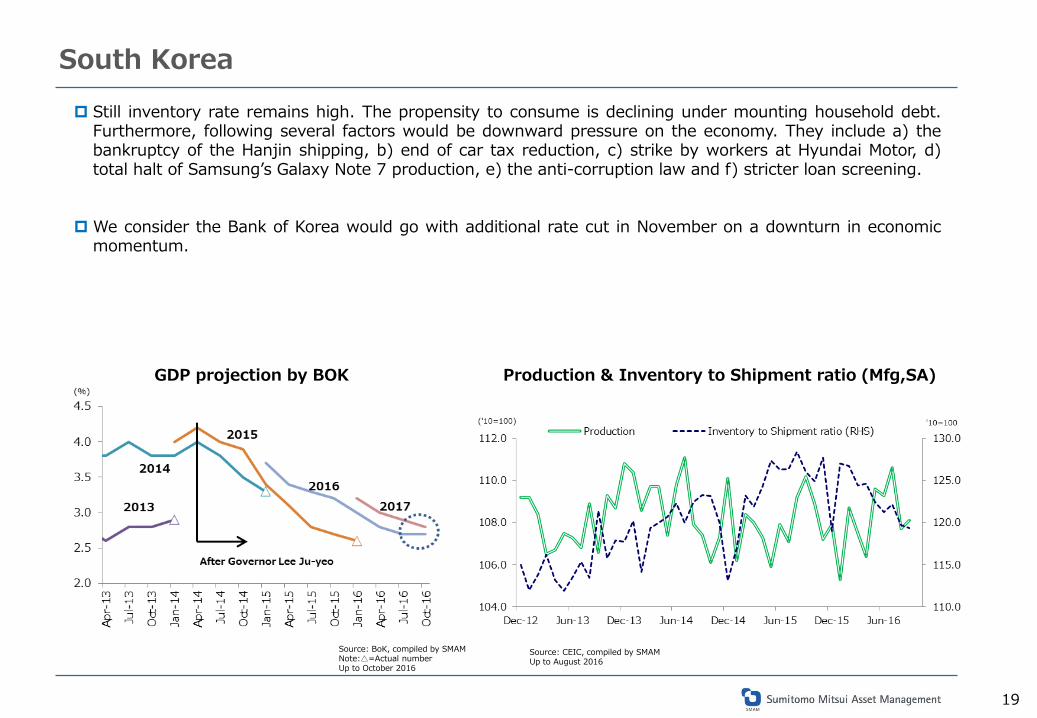
South Korea Still inventory rate remains high. The propensity to consume is declining under mounting household debt.
Furthermore, following several factors would be downward pressure on the economy. They include a) the bankruptcy of the Hanjin shipping, b) end of car tax reduction, c) strike by workers at Hyundai Motor, d) total halt of Samsung’s Galaxy Note 7 production, e) the anti-corruption law and f) stricter loan screening.
We consider the Bank of Korea would go with additional rate cut in November on a downturn in economic momentum.
GDP projection by BOK Production & Inventory to Shipment ratio (Mfg,SA)
Source: BoK, compiled by SMAM Note:△=Actual number Up to October 2016
Source: CEIC, compiled by SMAM Up to August 2016
20
Thailand
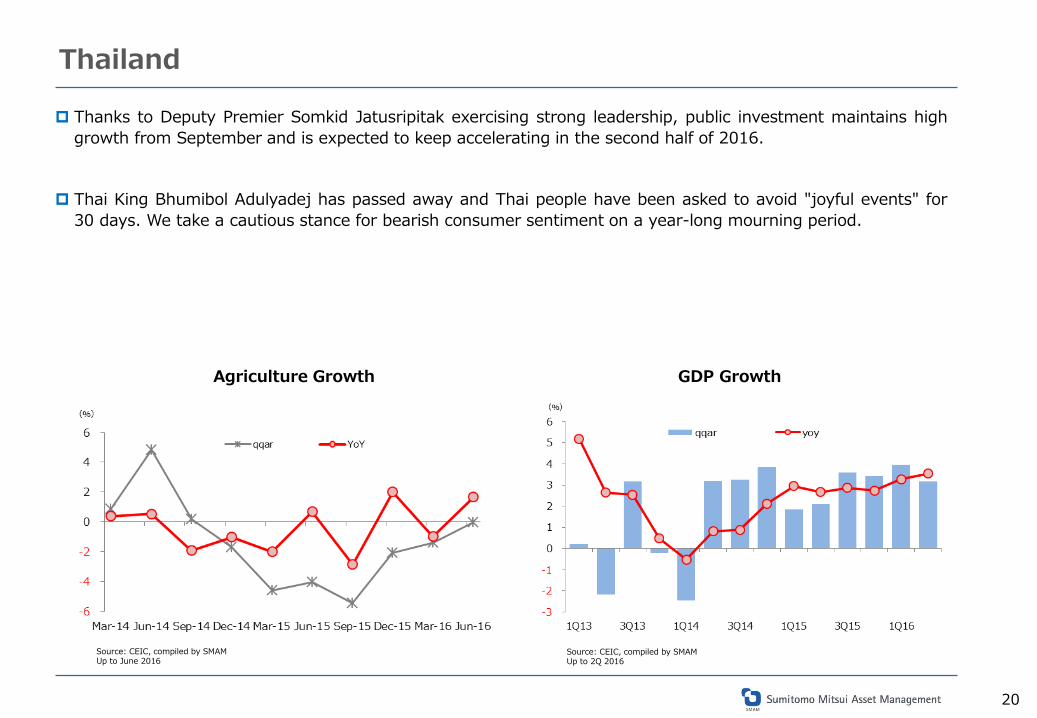
Thanks to Deputy Premier Somkid Jatusripitak exercising strong leadership, public investment maintains high growth from September and is expected to keep accelerating in the second half of 2016.
Thai King Bhumibol Adulyadej has passed away and Thai people have been asked to avoid "joyful events" for 30 days. We take a cautious stance for bearish consumer sentiment on a year-long mourning period.
Agriculture Growth GDP Growth
Source: CEIC, compiled by SMAM Up to June 2016
Source: CEIC, compiled by SMAM Up to 2Q 2016

21
Outlook for Asia-Pacific Stock Markets

22
Stock Market Performance - Global
Note: All data are as of 31st October 2016 Source: Bloomberg, compiled by SMAM
Indices as of 31 Oct 2016 Px Last Mtd Qtd Ytd 3m 1yr 2yr 3yrS&P 500 INDEX 2,126.15 -1.9% -1.9% 4.0% -2.2% 2.3% 5.4% 21.0%DOW JONES INDUS. AVG 18,142.42 -0.9% -0.9% 4.1% -1.6% 2.7% 4.3% 16.7%NASDAQ COMPOSITE INDEX 5,189.14 -2.3% -2.3% 3.6% 0.5% 2.7% 12.1% 32.4%STOXX Europe 50 € Pr 2,813.29 -1.1% -1.1% -9.3% -2.2% -12.5% -6.2% -2.3%NIKKEI 225 17,425.02 5.9% 5.9% -8.5% 5.2% -8.7% 6.2% 21.6%TOPIX 1,393.02 5.3% 5.3% -10.0% 5.3% -10.6% 4.5% 16.6%
BRAZIL BOVESPA INDEX 64,924.52 11.2% 11.2% 49.8% 13.3% 41.5% 18.8% 19.7%RUSSIAN RTS INDEX $ 988.74 -0.2% -0.2% 30.6% 6.6% 16.9% -9.4% -33.2%BSE SENSEX 30 INDEX 27,930.21 0.2% 0.2% 6.9% -0.4% 4.8% 0.2% 32.0%
HANG SENG INDEX 22,934.54 -1.6% -1.6% 4.7% 4.8% 1.3% -4.4% -1.2%HANG SENG CHINA AFF.CRP 3,762.24 -2.6% -2.6% -7.2% 1.3% -9.3% -17.0% -17.3%HANG SENG CHINA ENT INDX 9,559.39 -0.2% -0.2% -1.1% 6.7% -8.1% -11.1% -10.0%CSI 300 INDEX 3,336.28 2.6% 2.6% -10.6% 4.1% -5.6% 33.0% 40.6%
TAIWAN TAIEX INDEX 9,290.12 1.3% 1.3% 11.4% 3.4% 8.6% 3.5% 9.9%KOSPI INDEX 2,008.19 -1.7% -1.7% 2.4% -0.4% -1.0% 2.2% -1.1%STRAITS TIMES INDEX 2,813.87 -1.9% -1.9% -2.4% -1.9% -6.2% -14.1% -12.4%FTSE Bursa Malaysia KLCI 1,672.46 1.2% 1.2% -1.2% 1.2% 0.4% -9.8% -7.4%STOCK EXCH OF THAI INDEX 1,495.72 0.8% 0.8% 16.1% -1.9% 7.2% -5.6% 3.7%JAKARTA COMPOSITE INDEX 5,422.54 1.1% 1.1% 18.1% 4.0% 21.7% 6.5% 20.2%PSEi - PHILIPPINE SE IDX 7,404.80 -2.9% -2.9% 6.5% -7.0% 3.8% 2.6% 12.4%HO CHI MINH STOCK INDEX 675.80 -1.4% -1.4% 16.7% 3.6% 11.3% 12.5% 35.9%
S&P/ASX 200 INDEX 5,317.73 -2.2% -2.2% 0.4% -4.4% 1.5% -3.8% -2.0%NZX 50 INDEX 6,960.68 -5.4% -5.4% 10.1% -5.3% 16.3% 29.2% 41.8%
MSCI World Free Local 422.20 -0.7% -0.7% 1.5% -0.5% -0.3% 3.5% 13.9%MSCI All Country Asia Ex Japan 667.62 -0.6% -0.6% 7.1% 3.4% 3.6% -1.5% 3.2%MSCI EM Latin America Local 76,847.20 7.3% 7.3% 29.7% 7.9% 22.5% 7.7% 6.8%MSCI Emerging Markets Europe M 470.97 -0.5% -0.5% 5.0% -2.1% -1.5% -4.0% -2.8%
23
Note: As of 27 October 2016 Source: SMAM
Outlook for Asian Stock Markets
Investment Outlook: Asia-Pacific Stock Markets
Key Points Macro economy in most of Asian countries will show some recovery in 2016/17, but the momentum is not so strong.
China economy has been stabilized by strong policy support but it will continue to slow gradually in the medium term.
Property market in China remains a key risk.
The recovery of corporate earnings will be moderate towards 2017 as overall global economy stabilizes.
Liquidity condition has been supporting emerging markets thanks to the delay of US rate hike.
Overall market environment has been stabilized, and we expect Asian equity markets will follow the move of global equity markets.
We have slightly changed our outlook for Asian equity markets to mild upside in coming 3 to 6 months supported by a recovery of corporate earnings and relatively attractive valuation level against developed markets.

24 Note: Compiled by SMAM as of 27 October 2016 Positive Negative
Investment Outlook: Asia-Pacific Macro & Stock Markets Politics Macro Interest rate / Inflation / Liquidity External Account Currency Earnings Momentum Valuation
Hong Kong
- China economy seems to be stabilized in the near term.- Pressure for Asset price is eased but underlying economy isweak.- Attractive dividend yield. Room to pick up high quality names.
StableMore focus on Economy side.
X The pace of recovery is slower thanexpected.○Tightening policy for property isbehind us.
Potential pressure for HIBOR iffinancial Mkt become shaky by someexternal events. / Inflation will remain low.
CA surplus continues butit is narrowing.
Stable, pressure for weakerHKD is eased.
×Weak ER, butmomentum is bottomedNo earnings recovery in2017.
Fair on PER, attractive onPBR
China
- Tough challenge towards New Normal.- China economy seems to be stabilized in the near term.- Boom & bust of property Mkt is a potential concern.- SZ-HK Connect can be a positive catalyst, but sustainability isthe key.
Stable, but becomes less cleartowards 19th Party Congress.
Stabilized in the near term. Gradualslowdown is expected.Structural rebalancing is a keychallenge.
X monetary policy should be maintainedbut it may be less effective. / Int. ratewill stay sideways / Low inflation willcontinue.
Surplus- but it isdeclining. The degree ofcapital outflow is easedbut it remains a bigconcern.
Gradual depreciation willcontinue, but it is wellmanaged. The degree ofRMB devaluation is a big issueacross Asia.
Both ER andmomentum areimproving.
○ attractive in the longterm, but it has comeback to above averagesince 2010 Valuationdiscount is narrowed.↓
Taiwan
- Export orders are bottomed out, but the pace of economicrecovery should be slow. Some negative impact by Brexit.- Inventory correction on IT is progressed.- Attractive valuation with high dividend yield.
Cross strait risk is increasingunder DPP president.
The pace of economic recovery is slow,but it has started improving.
First rate cut for last 6 years.○Further rate cut is expected. /Inflation will be stable. / Liquidity isimproving.
Surplus will expand Stable / Likely to beappreciated if Mkt turns Risk-on mode.
○ ER is improving andmomentum is solid.
○ Relatively attractiveamong in Asia / Fair onPER, attractive on PBR
Korea
- Still in the transition. Structural re-rating will not happensoon.- High level of inventories and slow adjustments- Issues from individual names are increasing.
Less stable as President Park'sparty loses majority
X Growth outlook is weakening someparts due to a strained relationship withChina.
○ Easing bias continues / Inflation willbe stable / Liquidity is improving.
Surplus will remain high Downward bias in the nearterm. BOK prefers gradualdepreciation of KRW.
○ ER came back topositive and momentumis solid.
PE has already comeback to above historicalaverage.Attractive on PBR.
Singapore
- Stable Mkt and policy headwind is easing.- Weak economy will continue due to slowdown of Chineseeconomy. Relatively big impact by Brexit.- Attractive valuation.
The landslide victory of PAPshould create political stability.
×Slower economic growth is expecteddue to slowdown of Chinese economy.
○The MAS surprised by easing policy /SIBOR rate is stabilized ; Inflation isstable. / M2 growth rate is weakening.
High level of Trade & CASurplus will continue.
Downward pressure due toeasing policy by MAS / Likelyto be appreciated if Mkt turnsRisk-on mode.
×ER and momentumremain very weak.
Fair on PER, attractive onPBR
Malaysia
- Mounting uncertainty in both Politics and economy.- Investor's sentiment is improving due to recovery ofcrude oil price.
×1MDB continues to be a riskfactor. Political turmoil is stillthere.
×GDP growth is expected to slow in2016. However the government canbrake downward pressure by off-budgetdisbursement.
○Additional rate cut is expected in4Q16 given MYR stabilization. /Inflation will mildly pick up. / M2 growthrate is bottomed out.
Surplus will continue dueto recovery of crude oilprice.
Gradual downward biasconinues under shaky politicalconditions.
×ER and momentumremain very weak.
Fair(expensive on PER,but fair on PBR)
Thailand
- Economy is expected to bottom out.- Market is stable even under uncertainty of consumptionby the king's death.
Military gov should continue atleast until 2017.The king passed away.
Economy is expected to bottom outsupported by fiscal stimulus. Downsiderisk due to worsening consumersentiment.
Rate cut is expected in 4Q16 tosupport economy. / Inflation will bestable. M2 growth rate should remainlow.
Surplus will continue. Stabilizing under littleconcern for US rate hike.
○ ER is positive. / Thestrongest in Asia.
Rich on PER, fair on PBR,
Indonesia
- Solid economic growth supported by public investment.- IDR is stabilizing given diminished concern for US rate hike.- Investor's sentiment is improving supported by taxamnesty law.
Stable under ruling partieswith majority. New FM, SriMulyani will support macrorecovery.
○Economy is expected to recoversupported by lower gasoline price andpublic investment.
Interest rate is expected to maintainbut there is still room to cut interestrate /Lower inflation due to lower gasolineprice
CA deficit will continueto increase but Taxamnesty law could helpfinance of C/A deficit.
Stabilizing under littleconcern for US rate hike.Positive impact by taxamnesty.
×ER and momentumremain weak.
Fair (Expensive on PER,but fair on PBR)
Philippines- Still the bright spot, however headwinds by increasinginflation and weaker currency are increasing.- Political risk is increasing.
President Duterte hasbecome a wild card.
○Steady growth. Less impact by globaleconomy.
X Possible rate hike in 2017 / Int.rate will be stable. / some pressure forinflation.
Trade deficit will shrink.Current a/c surplus willexpand.
Stabilizing under littleconcern for US rate hike.
ER is weakening againbut momentum is stillsolid.
Expensive on PER, fair onPBR
India
- Solid macro economy. Inflation is stabilized.- Relatively immune to the situation of global macro but it is aconsensus OW Mkt. Limited impact by Brexit.- Investor's sentiment is improving supported by GST.
Potential of economic reformcontinuesBJP is gaining momentum.
○ High Growth rate will continue drivenby domestic consumption.
○Wait and see stance for further ratecut / Inflationary pressure peaked out.
X Trade / CA deficit willgradually increase.
Stabilizing under littleconcern for US rate hike.Strong FDI can support INR.
×ER is weakening again,but momentum isimproving.
Fair (Expensive on PER,but fair on PBR)
AustraliaStable Mild recovery Rate cut is expected /Inflation stays
lower than the target range.Deficit, but it isimproving
Downward bias ER is weak but it isimproving.
Expensive on PER, fair onPBR
VietnamSteady upside can be expected supported by solid economicgrowth.
Step Down of PM Dung isnegative for reform
solid recovery Lower interest rate environment /Benign Inflation
Trade / CA surplus willbe narrowed.
Gradual depreciation Improving Within FV range.
Expect mild up-trend market, backed by improving domesticconsumption and corporate earnings.
Outlook, Reason for OW/UW1.Macro Trend 2.Stock Market
25
Market Focus (i): Thailand – Overweight continued
【Summary】
We foresee a stable equity market on accelerated infrastructure investments resulted from enforcing economic policy, expectation for a recovery of the macro economy and gradual improvements in corporate earnings although Thai King’s death is regarded as a downside risk.
A general election got delayed to 2017 as a drafted constitution was rejected by a national reform assembly. There are concerns over international criticism for military junta, however, public investments are expected to expand. Moreover, cabinet reshuffle seems to be positive as resulted in economically-friendly cabinet members.
As high household debt issue still remains, private consumption, showing a recovery phase, would face downward pressure due to the King’s death.
However, the equity market and economy are not bothered by considerable disruptions. When and how US rate hike goes is a risk factor.
Possibility for early rate cut remains in order to support the economy. Further infrastructure investment is also expected.
Revision in earnings tends to improve. In terms of valuation, P/E is overvalued, but P/B stays in historical level.
Note: Compiled by SMAM as of 24 October 2016
26
Market Focus (ⅱ): Singapore – Underweight continued
【Summary】
We deem fundamentals in Singapore as less appealing compared with those in other Asian markets. An upside in the stock market is limited.
We foresee that the stock market is stable on a recovery of the global economy and receded concerns over Chinese economy. Hope for monetary easing in the Asian region would reassure the markets.
Yet, a rebound of the equity market from February was faster than expected. Accordingly the valuation expansion seems to be limited.
We take a stance for selecting stocks building a strong position in the industry or keeping stable earnings. We focus on holdings according to mid-long term attractiveness.
Singapore’s banks are safer and more defensive than other ASEAN Banks, while loan growth is sluggish. The quality of assets, especially for China or commodity, is key concern. We maintain cautious stance on the banking sector.
Note: Compiled by SMAM as of 24 October 2016

27
Disclaimer
Please read this disclaimer carefully. This material is for non-Japanese institutional investors only. The research and analysis included in this report, and those opinions or judgments as outcomes thereof, are intended to introduce or
demonstrate capabilities and expertise of Sumitomo Mitsui Asset Management Company, Ltd. (hereinafter “SMAM”), or to provide information on investment strategies and opportunities. Therefore this material is not intended to offer or solicit investments, provide investment advice or service, or to be considered as disclosure documents under the Financial Instruments and Exchange Law of Japan.
The expected returns or risks in this report are calculated based upon historical data and/or estimated upon the economic outlook at present, and should be construed no warrant of future returns and risks.
Past performance is not necessarily indicative of future results. The simulated data or returns in this report besides the fund historical returns do not include/reflect any investment management fees,
transaction costs, or re-balancing costs, etc. The investment products or strategies do not guarantee future results nor guarantee the principal of investments. The investments may suffer
losses and the results of investments, including such losses, belong to the client. The recipient of this report must make its own independent decisions regarding investments. The opinions, outlooks and estimates in this report do not guarantee future trends or results. They constitute SMAM’s judgment as of the date of
this material and are subject to change without notice. The awards included in this report are based on past achievements and do not guarantee future results. The intellectual property and all rights of the benchmarks/indices belong to the publisher and the authorized entities/individuals. This material has been prepared by obtaining data from sources which are believed to be reliable but SMAM can not and does not guarantee its
completeness or accuracy. All rights, titles and interests in this material and any content contained herein are the exclusive properties of SMAM, except as otherwise stated.
It is strictly prohibited from using this material for investments, reproducing/copying this material without SMAM’s authorization, or from disclosing this material to a third party.
Registered Number: Kanto Local Finance Bureau (KINSHO) No.399 Member of Japan Investment Advisers Association, The Investment Trusts Association, Japan and Type Ⅱ Financial Instruments Firms Association © Sumitomo Mitsui Asset Management Company, Limited