asian equity markets: growth, opportunities, and challenges
TRANSCRIPT

WP/06/266
Asian Equity Markets: Growth, Opportunities, and Challenges
Catriona Purfield, Hiroko Oura,
Charles Kramer, and Andreas Jobst


© 2006 International Monetary Fund WP/06/266 IMF Working Paper Asia and Pacific Department and Monetary and Capital Markets Department
Asian Equity Markets: Growth, Opportunities, and Challenges
Prepared by Catriona Purfield, Hiroko Oura, Charles Kramer, and Andreas Jobst1
Authorized for distribution by Charles Kramer and Ceyla Pazarbasioglu
December 2006
Abstract
This Working Paper should not be reported as representing the views of the IMF. The views expressed in this Working Paper are those of the author(s) and do not necessarily represent those of the IMF or IMF policy. Working Papers describe research in progress by the author(s) and are published to elicit comments and to further debate.
Asian equity markets have grown significantly in size since the early 1990s, driven by strong international investor inflows, growing regional financial integration, capital account liberalization, and structural improvements to markets. The development of equity markets provides a more diversified set of channels for financial intermediation to support growth, thus bolstering medium-term financial stability. At the same time, as highlighted by the May–June 2006 market corrections, the increasing role of stock markets potentially changes the nature of macroeconomic and financial stability risks, as well as the policy requirements for dealing with these risks. JEL Classification Numbers: G11, G12, G15, G23 Keywords: Equity markets, Asian financial markets, financial integration, financial stability,
international capital markets Authors’ E-Mail Addresses: [email protected], [email protected], [email protected], [email protected]
1 This paper is an extended version of a chapter in the September 2006 Asia-Pacific Regional Economic Outlook. The authors thank Jerald Schiff, Swati Ghosh, and many of their IMF colleagues for helpful comments; Jennifer Elliot for useful input on smaller stock markets; Fritz Pierre-Louis and Rabin Hattari for research assistance; and Nong Jotikasthira and Cythia Galang for editorial help.

2
Contents Page
I. The Emergence of Asia Stock Markets ...............................................................................4 A. Overview........................................................................................................................4 B. Factors Driving the Development of Asian Equity Markets .........................................8 II. Performance of Asian Emerging Stock Markets ...............................................................15 A. Price Performance........................................................................................................15 B. Correlation with Global and Regional Markets ...........................................................17 III. Are Asian Markets Overheating?.......................................................................................18 IV. Equity Prices and Economic Activity ................................................................................21 V. Policy Implications ............................................................................................................24 Appendix 1. The Development of Equity Derivatives Markets in Asia.................................................27 References................................................................................................................................36 Box 1. Cross-Listings and Equity Market Integration in Asia ......................................................11 Figures 1. Comparison of Equity Market Size in Asia and Other Emerging Markets, 2005 ...............4 2. Growth in Depth of Equity Market, 1990–2005..................................................................4 3. Financial Assets, 2000 .........................................................................................................5 4. Financial Assets, 2005 .........................................................................................................5 5. Global Exchange-Based Trading and Equity Derivatives in 2005 ......................................5 6. Portfolio Assets Held by Nonresidents in Emerging Markets .............................................8 7. Nonresident Equity Investment, 2004..................................................................................8 8. Dedicated Asia and Global Equity Funds............................................................................8 9. Equity Market Integration....................................................................................................9 10. Insurance Assets in 2004 ...................................................................................................14 11. Change in Insurance Assets, 2000–2004 ...........................................................................14 12. Pension Fund Assets Under Management, 2004 ...............................................................14 13. Change in Pension Funds, 2000–2004...............................................................................14 14. Mutual Funds Asset Under Management in 2004 .............................................................14 15. Growth in Mutual Funds, 2000–2004................................................................................14 16. Equity Prices ......................................................................................................................15 17. Correlation with Developed Equity Markets .....................................................................17

3
18. Emerging Asian Equity Beta vis-á-vis World Equity........................................................18 19. Excess Return.....................................................................................................................19 20. Sharpe Ratio.......................................................................................................................19 Appendix Figures I.1. Global Exchange-Based Trading of Equity Derivatives, 2005..........................................28 I.2. Global Exchange-Based Trading of Equity Derivatives, Year-to-Date, August 2006 ......28 I.3. Global Exchange-Based Trading of Equity Derivatives, 2005..........................................28 I.4. Global Exchange-Based Trading of Equity Derivatives, Year-to-Date, August 2006 ......28 Tables 1. Indicators of Stock Market Activity, 2005 ..........................................................................6 2. The Evolving Role of Equity in the Financial Sector ..........................................................6 3. Issuance by the Private Sector, 1990–2004 .........................................................................7 4. Stock Holdings by Investor Type ........................................................................................9 5. Restrictions on Cross-Border Portfolio Investment in Asia, 2005 ....................................10 6. Cross-Border Equity Security Investment, 2004 ...............................................................10 7. Market Infrastructure Scores..............................................................................................13 8. Equity Price Change Volatility ..........................................................................................16 9. Correlation with Developed Equity Markets .....................................................................17 10. Price Earnings Ratio ..........................................................................................................18 11. Dividend Yields .................................................................................................................18 12. Equity Valuation and Implied Dividend Growth Rate, 2006 ............................................20 13. Nonpublic Sector Investments in Equity Markets .............................................................23 14. Household Balance Sheet Volatility Measures..................................................................24 Appendix Tables I.1. Global Exchange-Based Trading of Equity Derivatives, 2002–06....................................31 I.2. Global Exchange-Based Trading of Equity Derivatives, 2002–06....................................32 I.3. Global Exchange-Based Trading of Equity Derivatives, 2002–06....................................33 I.4. Global Exchange-Based Trading of Equity Derivatives, 2002–06....................................34 I.5. Global Exchange-Based Trading of Equity Derivatives, 2002–06....................................35

4
I. THE EMERGENCE OF ASIAN STOCK MARKETS2
A. Overview
Asian equity markets are sizable and fast growing. Since 1990, Asia’s capitalization has more than doubled in U.S. dollar terms to $13.7 trillion, 30 percent of world capitalization. Excluding Japan and Australia, it has risen almost tenfold. The financial hubs of Hong Kong SAR, Singapore, and Japan dominate the region, accounting for two-thirds of Asian equity assets. Markets in some other countries, such as Malaysia, and Taiwan Province of China, are also sizable. But, for the most part, market capitalization remains well below industrial country levels.
The growth in Asian markets has been accompanied by improved liquidity and breadth. Since 1990 market liquidity (share turnover) has more than doubled in relation to GDP, while turnover velocity (share turnover/market capitalization) has risen almost fourfold. Market breadth (the percentage of market capitalization and turnover accounted for by the ten largest companies—a higher figure implies greater concentration) is now greater in Asia than in other emerging markets, although less than in industrial countries.3 There is, however, considerable diversity within this broad picture. Equity markets in China and Indonesia remain illiquid and small relative to the size of their domestic economies, with growth trailing the rest of the region. Market liquidity is also low. In China, the nascent state of the equity market reflects the dominance of poorly performing state-owned companies, which account for about half of total market capitalization (McKinsey Global Institute, 2006a). The majority of China’s successful companies choose to list overseas, primarily in Hong Kong SAR. In Indonesia, the development of the stock market has been hindered by
2 For the purposes of this paper, “emerging Asia” comprises China, Hong Kong SAR, India, Indonesia, Korea, Malaysia, Philippines, Singapore, and Thailand. 3 The number of listed companies on Asian stock markets is sometimes high by international standards—India, for example, has the largest number of listed firms in the world—but active trading is often only in a few high-value issues.
0 300 600 900 1,200 1,500 1,800
BrazilPhilippines
Russia 2/China 2/
IndiaHong Kong
TurkeyAustralia
South Africa 2/Chile
MexicoThailand
Taiwan POCKorea
SingaporeIndonesia 2/
MalaysiaJapan -3.4
Sources: CEIC Data Company Ltd; S&P, Emerging Market Database; and IMF, APDCORE database; IMF, World Economic Outlook ; and, IMF staff estimates.1/ Change in market capitalization to GDP.2/ Data on Indonesia starts in 1993; data on China, South Africa, and G-7 start on 1992; data for Russia starts in 1996.
G-7
Figure 2. Growth in Depth of Equity Market, 1990–2005 1/(In percent)
Figure 1. Comparison of Equity Market Size in Asia and Other Emerging Markets, 2005
(In percent of GDP)
0100200300400500600700
Hon
gK
ong
SAR
Sin
gapo
reSo
uth
Afri
caJa
pan
Mal
aysi
aTa
iwan
POC
Aust
ralia
Phi
lippi
nes
Chi
le
Kore
a
Indi
a
Rus
sia
Thai
land
Braz
il
Turk
ey
Mex
ico
Indo
nesi
a
Chi
naG-7 countries
Sources: CEIC Data Company Ltd; S&P, Emerging Market Database; and IMF, APDCORE database; IMF, World Economic Outlook (WEO); and IMF staff estimates.

5
weaknesses in transparency, information disclosure policies, and corporate governance. Markets in the Philippines and Hong Kong SAR are dominated by relatively few firms. Markets such as Bhutan, which are outside the emerging-markets universe focused on by international investors, face unique challenges. While Asian finance remains bank-dominated, stock markets are an important source of corporate finance (Table 3). In 2005, companies in emerging Asia tapped equity markets for some $814 billion in new capital through initial and secondary public offerings (Table 1). However, issuance activity is highly concentrated within the region: Hong Kong SAR accounted for almost half of total Asian issuance, with the next largest market (India) raising just over one-fifth of the total. Overall, equities provide around 10 percent of corporate financing in emerging Asia, but this compares favorably with 3.7 percent in emerging markets outside Asia. Equities are also a large share of financial assets in the region, accounting for about half of assets (deposits, stocks, and bonds) (Figures 3 and 4 and Table 2). Nevertheless, as a share of assets, equities generally have yet to recover to pre-Asian-crisis levels.
Equity derivatives have flourished in a few markets in Asia (Appendix I). On Asia’s exchanges, equity derivatives have witnessed the most rapid growth of all traded derivative products. Equity derivative trading in emerging Asia has mushroomed from $16.5 trillion in 2002 to $40.3 trillion in 2005 (or 35.3 percent of global trading). By the end of August 2006, trading claims even 38.6 percent and 43.9 percent of worldwide turnover by notional value and number of trades respectively.4 4 Equity derivatives are mainly traded on organized exchanges rather than over the counter (OTC). Annual OTC equity trading in Asia is only around $100 billion (BIS, 2005).
Figure 4. Financial Assets, 2005 (In percent of GDP)
Bank deposits20%
Bonds 32%
Equity 48%
Sources: Federation of World Exchanges; IMF, IFS database; IMF, WEO database; World Bank, WDI databse; and IMF staff estimates.
Figure 3. Financial Assets, 2000 (In percent of GDP)
Equity 42%
Bank deposits18%
Bonds 40%
Sources: Federation of World Exchanges; IMF, International Financial Statistics database; IMF, WEO database; World Bank, World Development Indicators database; and IMF staff estimates.
Mature MarketAsia 2/ 4.4%
Europe/Africa/Middle East
21.9%Americas
38.4%
Emerging Market Asia 1/35.3%
Figure 5. Global Exchange-Based Trading of Equity Derivatives in 2005(By notional amount)
Source: Respective countries' exchanges.1/ Emerging Asia includes India, Korea, Malaysia, Hong Kong SAR, and Taiwan POC.2/ Mature Market Asia includes Japan, Australia, New Zealand, and Singapore.

6
Market TurnoverSecondary Number of Capitalization Turnover Value
Market Public Listed Market Turnover of Top 10 of Top 10 Capitalization Turnover 1/ IPOs Offerings Shares Capitalization Turnover Velocity 2/ Companies 3/ Companies 4/
Emerging Asia 4,684.8 421.0 34.6 46.8 13,403 91.7 8.2 9.0 42.4 34.3China 563.8 67.3 0.7 3.3 1,377 25.3 3.0 11.9 25.1 16.1India 1,060.8 50.4 3.3 15.8 5,797 136.8 6.5 4.8 35.3 11.4Hong Kong SAR 1,046.5 49.0 21.3 17.0 1,135 588.9 27.5 4.7 51.6 43.8Korea 717.6 159.7 2.2 2.6 1,616 90.5 20.1 22.3 40.2 38.7Singapore 318.3 8.1 3.9 1.6 686 270.0 6.8 2.5 39.2 39.2Taiwan POC 475.9 73.8 0.2 2.1 696 137.5 21.3 15.5 34.9 26.5Indonesia 81.5 2.5 0.4 0.6 336 29.5 0.9 3.0 53.2 54.1Malaysia 183.7 2.9 1.1 0.9 1,019 140.5 2.2 1.6 36.8 26.8Philippines 112.1 0.4 0.5 0.4 237 114.8 0.4 0.3 60.8 57.2Thailand 124.4 7.0 1.1 2.6 504 73.7 4.1 5.6 47.1 28.8
Other emerging market 2,124.0 63.6 4.4 24.2 1,630 69.8 2.1 3.0 51.3 60.4Brazil 482.1 16.4 2.0 8.9 381 60.8 2.1 3.4 52.4 48.8Chile 131.3 3.4 0.5 1.9 246 115.2 3.0 2.6 45.6 49.6Mexico 239.2 4.5 0.1 0.0 326 31.1 0.6 1.9 63.5 70.5Russia 544.6 ... ... ... ... 71.1 ... ... ... ...South Africa 563.9 17.9 0.0 13.0 373 235.8 7.5 3.2 44.1 91.7Turkey 162.8 21.3 1.8 0.4 304 44.9 5.9 13.1 50.8 41.4
Industrial 30,968.3 2,783.2 97.6 188.0 13,654 155.1 13.9 9.0 29.9 26.8United States 5/ 19,554.4 1,989.4 56.3 130.9 5,434 156.6 15.9 10.2 23.7 21.7United Kingdom 3,053.4 106.2 23.3 17.3 3,091 138.7 4.8 3.5 40.9 29.6Japan 7,546.4 640.4 ... 24.6 3,415 165.1 14.0 8.5 18.1 17.3Australia 814.1 47.2 18.1 15.2 1,714 115.0 6.7 5.8 37.1 38.6
Sources: Federation of World Exchanges; IMF, WEO database; and IMF staff estimates.
1/ Average daily trading volume (total value of share trading divided by number of trading days).2/ Defined as the ratio of stock turnover to stock market capitalization.3/ Shows the part represented by the 10 most capitalized domestic companies in domestic market capitalization. 4/ Shows the part represented by the 10 most traded companies in share trading value.5/ U.S. secondary public offering only includes New York Stock Exchange (NYSE).
(In billions of U.S. dollars) (In percent of GDP) (In percent)
Table 1. Indicators of Stock Market Activity, 2005
Bank Equity Bond Total Bank Equity Bond Total Bank Equity Bond Totaldeposits market market 1/ financial deposits market market 1/ financial deposits market market 1/ financial
sector sector sector
Emerging AsiaChina 26.4 14.4 11.8 52.6 38.8 32.2 23.6 94.5 45.6 25.3 27.6 98.5India 36.6 61.2 22.7 120.4 46.3 54.8 25.5 126.7 58.0 136.8 37.7 232.4Hong Kong SAR 164.5 282.7 30.8 477.9 221.3 278.8 43.6 543.6 246.6 588.9 60.1 895.6Korea 36.3 24.9 50.3 111.5 68.3 45.6 62.1 176.0 67.1 90.5 88.9 246.4Singapore 77.9 380.6 29.7 488.2 99.9 287.3 57.3 444.4 105.6 270.0 88.1 463.7Taiwan POC … 94.6 35.9 130.5 … 88.8 40.5 129.3 … 137.5 61.2 198.7Indonesia 43.8 36.0 7.1 86.9 48.2 15.0 39.1 102.4 40.3 29.5 21.8 91.6Malaysia 72.9 315.5 81.8 470.2 88.6 133.0 100.4 322.1 98.9 140.5 111.2 350.5Philippines 48.2 95.6 46.0 189.8 54.1 51.1 51.9 157.1 47.4 114.8 70.5 232.7Thailand 73.9 54.9 16.9 145.7 93.8 36.3 36.3 166.5 83.6 73.7 51.2 208.5
Other emerging marketBrazil 20.7 28.0 47.4 96.2 22.3 22.3 64.1 108.6 26.1 22.6 79.2 127.8Chile 37.2 86.9 45.3 169.3 40.0 40.0 53.1 133.1 34.0 35.0 48.0 116.9Mexico 25.4 32.0 30.3 87.7 23.5 23.5 31.5 78.6 24.5 24.3 39.1 87.9Russia 12.6 9.5 11.2 33.3 15.5 15.5 17.8 48.8 23.9 21.0 11.5 56.4South Africa 48.0 168.0 58.2 274.1 51.5 51.5 48.7 151.7 69.1 61.2 48.0 178.3Turkey 18.0 17.3 21.8 57.2 23.0 23.0 39.0 85.1 29.9 22.0 60.2 112.2
IndustrialUnited States 36.6 132.1 148.6 317.3 21.6 21.6 163.4 206.7 7.8 11.6 186.4 205.8United Kingdom 97.5 145.2 76.8 319.6 98.5 98.5 85.4 282.3 116.9 129.6 114.7 361.2Japan 101.9 118.4 103.7 323.9 113.3 113.3 128.7 355.3 124.5 123.2 194.1 441.9Australia 14.2 75.0 68.9 158.1 16.5 16.5 72.5 105.5 25.2 24.7 90.9 140.9
1/ Only includes domestic issuers.
Table 2. The Evolving Role of Equity in the Financial Sector
(In percent of GDP)
Sources: World Federation of Exchanges; IMF, IFS and WEO databases; World Bank, WDI database; Bank for International Settlements; and IMF staff estimates.
200520001996

7
1990
1991
1992
1993
1994
1995
1996
1997
1998
1999
2000
2001
2002
2003
2004
Em
ergi
ng m
arke
ts 1
/10
3.99
148.
3124
2.22
371.
6618
1.70
297.
6935
0.95
321.
6526
2.92
259.
9638
7.01
253.
5753
3.06
707.
5958
0.90
Dom
estic
100.
0513
7.06
223.
1233
1.02
139.
1625
2.02
281.
8122
4.23
215.
0520
2.76
305.
0120
2.27
490.
9364
6.08
521.
51E
quiti
es11
.92
19.0
915
.61
29.6
045
.22
37.6
432
.78
33.5
845
.14
53.3
533
.26
30.7
721
.94
46.4
926
.24
Bon
ds28
.55
1.32
0.86
4.05
5.14
10.4
810
.18
11.5
410
.08
12.0
771
.92
96.1
691
.07
76.9
848
.42
Ban
k lo
ans
59.5
911
6.65
206.
6529
7.36
88.8
020
3.89
238.
8517
9.11
159.
8313
7.33
199.
8375
.34
377.
9352
2.61
446.
86In
tern
atio
nal
3.94
11.2
419
.10
40.6
442
.53
45.6
869
.14
97.4
147
.86
57.2
182
.00
51.3
042
.13
61.5
059
.39
Equ
ities
0.32
4.28
5.22
9.43
12.7
44.
507.
4615
.41
5.69
11.5
930
.33
8.59
8.90
13.2
320
.83
Bon
ds1.
012.
728.
6619
.42
18.2
218
.39
29.8
436
.01
18.7
217
.02
15.3
016
.55
9.25
19.6
317
.79
Ban
k lo
ans
2.62
4.25
5.22
11.7
811
.58
22.7
831
.84
45.9
923
.46
28.5
936
.37
26.1
623
.99
28.6
420
.76
Asi
a45
.41
65.2
111
6.38
242.
9036
.85
274.
2429
0.88
143.
2317
9.13
269.
3226
5.00
214.
2449
6.66
582.
8346
5.17
Dom
estic
43.1
960
.67
110.
0622
6.84
12.5
724
8.40
253.
3310
5.82
170.
4225
2.95
233.
0619
2.61
480.
1455
4.18
432.
25E
quiti
es11
.07
10.9
311
.07
14.8
324
.89
26.3
816
.96
23.0
326
.12
44.3
624
.48
21.2
819
.12
44.9
024
.15
Bon
ds0.
000.
000.
000.
000.
000.
000.
000.
000.
000.
6019
.05
33.6
244
.19
36.9
728
.52
Ban
k lo
ans
32.1
249
.74
98.9
921
2.01
-12.
3122
2.02
236.
3782
.79
144.
3020
7.99
189.
5313
7.72
416.
8347
2.31
379.
58In
tern
atio
nal
2.22
4.54
6.32
16.0
624
.28
25.8
437
.55
37.4
18.
7116
.37
31.9
421
.63
16.5
228
.65
32.9
3E
quiti
es0.
120.
301.
473.
297.
663.
414.
656.
993.
449.
7022
.07
7.19
5.31
10.5
918
.66
Bon
ds0.
411.
261.
684.
287.
968.
6813
.70
11.0
41.
382.
395.
386.
622.
385.
597.
73B
ank
loan
s1.
692.
983.
178.
488.
6613
.75
19.2
119
.38
3.90
4.28
4.48
7.81
8.83
12.4
76.
54
Cen
tral E
urop
e50
.87
55.3
722
.91
2.50
13.5
752
.56
17.3
842
.49
36.0
930
.84
15.9
7-0
.65
34.7
629
.04
114.
49D
omes
tic50
.53
54.7
922
.24
0.75
12.0
448
.34
10.7
829
.74
26.9
821
.05
0.23
-8.7
722
.13
10.6
010
1.98
Equ
ities
0.33
4.64
1.12
0.80
10.7
06.
413.
212.
709.
614.
455.
222.
181.
841.
311.
49B
onds
0.00
0.00
0.02
0.01
0.15
0.40
0.60
0.46
0.38
0.68
0.98
0.97
1.51
2.37
2.16
Ban
k lo
ans
50.2
050
.15
21.1
0-0
.05
1.19
41.5
26.
9726
.59
16.9
915
.92
-5.9
6-1
1.92
18.7
96.
9220
.87
Inte
rnat
iona
l0.
340.
580.
671.
751.
534.
226.
6012
.75
9.11
9.78
15.7
48.
1212
.63
18.4
412
.51
Equ
ities
0.10
0.08
0.02
0.19
0.63
0.53
1.20
3.08
2.18
1.22
3.19
0.24
1.59
1.81
1.27
Bon
ds0.
000.
000.
050.
000.
170.
350.
774.
213.
032.
331.
362.
393.
395.
713.
68B
ank
loan
s0.
240.
500.
601.
560.
723.
354.
635.
463.
906.
2311
.18
5.49
7.65
10.9
17.
56
Latin
Am
eric
a7.
7127
.73
102.
9312
6.26
131.
27-2
9.11
42.7
013
5.93
47.6
9-4
0.19
106.
0439
.98
1.64
95.7
120
9.13
Dom
estic
6.33
21.6
090
.82
103.
4311
4.55
-44.
7217
.70
88.6
717
.65
-71.
2571
.72
18.4
2-1
1.34
81.3
019
5.18
Equ
ities
0.51
3.52
3.41
13.9
79.
634.
8512
.61
7.86
9.41
4.55
3.56
7.31
0.98
0.28
0.60
Bon
ds28
.55
1.32
0.85
4.05
4.99
10.0
79.
5811
.08
9.70
10.7
951
.89
61.5
745
.37
37.6
417
.73
Ban
k lo
ans
-22.
7316
.76
86.5
685
.41
99.9
3-5
9.65
-4.4
969
.73
-1.4
6-8
6.59
16.2
6-5
0.46
-57.
6943
.39
46.4
2In
tern
atio
nal
1.38
6.13
12.1
122
.84
16.7
315
.61
24.9
947
.26
30.0
431
.06
34.3
321
.56
12.9
814
.41
13.9
5E
quiti
es0.
103.
893.
735.
954.
450.
571.
625.
330.
070.
675.
071.
162.
000.
830.
91B
onds
0.60
1.46
6.92
15.1
410
.08
9.36
15.3
720
.77
14.3
112
.30
8.55
7.54
3.47
8.33
6.38
Ban
k lo
ans
0.69
0.78
1.45
1.74
2.20
5.68
8.01
21.1
615
.66
18.0
820
.70
12.8
67.
515.
266.
67
Sou
rces
: Dea
logi
c; IM
F, IF
S d
atab
ase;
S&
P E
MD
B; a
nd H
ong
Kon
g M
onet
ary
Aut
horit
y.
1/ E
mer
ging
mar
kets
: Chi
na, I
ndia
, Mal
aysi
a, K
orea
, Tha
iland
, Arg
entin
a, B
razi
l, C
hile
, Col
ombi
a, M
exic
o, C
zech
Rep
ublic
, Hun
gary
, Pol
and,
Rus
sia,
and
Tur
key.
(In b
illio
ns o
f U.S
. dol
lars
)Ta
ble
3. Is
suan
ce b
y th
e P
rivat
e Se
ctor
, 199
0–20
04

8
This mainly represents very rapid growth in Korea’s market, which thanks to contract specifications and a trading environment that are friendly to retail investors, hosts the world’s most active derivatives market. In 2005, its daily turnover totaled some $151 billion, or almost 34 percent of worldwide trading (83 percent of trading in all of Asia). By comparison, the average daily turnover in all of the Western Hemisphere, including the U.S. and Brazilian markets, was about $168 billion in 2005. Since 2000, growth in overall derivative trading only in Korea, Hong Kong SAR, and Taiwan POC has outstripped growth of both domestic market capitalization and cash trading in equity markets. India’s equity derivatives market is also significant in size and dominates the global trading in equity futures. Equity derivatives markets are much less well-developed in other Asian countries, even ones where cash market activity is strong. Variations in derivatives markets development relate mainly to differences in the operational and legal infrastructure (Fratzscher, 2006).
B. Factors Driving the Development of Asian Equity Markets
International Investor Diversification Equity flows into emerging Asia have soared (Figures 6 and 7). Inflows have been especially strong in recent years, notwithstanding occasional outflows (for most countries, only a portion of the inflows that occurred in the early part of 2006 were reversed during the May–June selloff.) By end-2004, international investors had invested some $638 billion in emerging Asia equity markets—a twelvefold increase over 1990s levels.
Accordingly, emerging Asian markets now capture three-quarters of global equity investments in emerging markets, up from about half in 1992. One underlying factor is the explosion of flows from dedicated emerging market equity funds, whose assets have grown at rates in excess of 54 percent per year since 2000 (Figure 8). With assets of some $125 billion, such funds are important
0 20 40 60 80 100
Hong Kong SARSingapore
UKTaiwan POC
AustraliaMalaysia
South AfricaKorea
USThailand
JapanBrazil
RussiaIndonesia
MexicoIndia
PhilippinesTurkey
ChileChina
Source: Lane and Milesi-Ferretti (2006)
Figure 7. Nonresident Equity Investment, 2004(In percent of GDP)
0
4
8
12
16
1990 1992 1994 1996 1998 2000 2002 20040
4
8
12
16
Emerging AsiaLatin AmericaTransition EuropeOther
Source: Lane and Milesi-Ferretti (2006)
Figure 6. Portfolio Assets Held by Nonresidents in Emerging Markets (In percent of GDP)
20
50
80
110
140
2000 2001 2002 2003 2004 20050
100
200
300
400Japan Equity Funds (left scale)Dedicated Asia Pacific Regional Funds (left scale)Dedicated Asia Ex Japan Regional and Country Funds (left scale)
Global Funds (right scale)
Global Emerging Market Fund(right scale)
Source: EmergingPortfolio.com.
Figure 8. Dedicated Asia and Global Equity Funds(In billions of U.S. dollars)

9
investors in the region. But this figure understates the presence of global investors, since Asian markets likely capture a significant share of the much larger assets managed by global investment funds. International investors now play a key role in many Asian markets. Such investors are concentrated in markets such as Korea, Hong Kong SAR, Taiwan Province of China, India, and Singapore, with portfolio allocations to ASEAN countries relatively small. However, even in countries in which foreign holdings of stock are relatively small (Table 4), they may still own a large fraction of the free float (the amount available for trading). In India, for example, while foreigners own 20 percent of Morgan Stanley Capital International (MSCI) stocks, and less of the total market, they hold over 80 percent of the MSCI free float. Financial Integration Controls on foreign investor participation in equity markets have been loosened over time. Since the early 1990s, economies such as Taiwan Province of China, Thailand, and Korea have been gradually raising caps on portfolio investment by nonresidents, with Taiwan Province of China completely eliminating these caps in 2003. Australia, Hong Kong SAR, Japan, and Singapore are relatively open to cross-border equity flows by nonresidents. By contrast, access is generally restricted to qualified or foreign institutional investors5 in China and India, and the extent of participation is limited by quantitative caps. As a general matter, however, the share of Asian market capitalization that is investable according to the S&P/IFC (a measure proposed by Edison and Warnock (2003) to measure market openness) has trended upward since the early 1990s, consistent with equity market liberalization. 5 Qualified or foreign institutional investors are those that are registered and permitted by regulatory authorities to invest in a country’s securities markets. They generally are supervised by regulators in home countries, and comprise pension, insurance and mutual funds, banks, and investment trusts.
Domestic Individuals Institutional Foreign
China 6 9 49Hong Kong SAR 30 27 36India 16 8 8Japan 20 27 24Korea 18 11 40Malaysia ... ... 20Singapore 1 29 70Taiwan POC 48 6 16Thailand 62 10 28
Simple average 25.1 15.9 32.3
Source: HSBC analysts, estimates at end-2005.
1/ The numbers do not add to 100 percent because ownership by government, banks and corporates are omitted as they are generally longer-term holders and do not represent part of the free float.
Table 4. Stock Holdings by Investor Type 1/
(In percent)
0
20
40
60
80
100
1990 1992 1994 1996 1998 2000 2002 2004 20060
20
40
60
80
100
Indonesia KoreaPhilippines MalaysiaThailand Taiwan
Sources: Datastream; and IMF staff calculations. 1/ End-period. End June data for 2006. The measure follows Edison and Warnock (2003). S&P/IFC Investable equities are a subset of S&P/IFC Global equities, and exclude shares that are not legally accessible by foreign investors.
Figure 9. Equity Market Integration 1/(Share of S&P/IFC Investable in percent of S&P/IFC Global)

10
More Liberal More Restrictive
Australia Thailand ChinaNo restrictions
Bangladesh Indonesia India
Hong Kong SAR Malaysia Sri Lanka
Japan Vietnam
Korea
SingaporeNo restrictions.
Philippines
Source: Asia Bond Monitor , 2005; and IMF Annual Report on Exchange Arrangements and Exchange Restrictions , 2005.
Nonresidents are free to purchase equity securities.
Nonresidents are free to purchase equity securities.
Foreign individuals and organizations are allowed to hold, in aggregate up to 30 percent of an issuer's listed current shares.
Nonresidents are free to purchase equity securities but investment in banks by nonresidents exceeding 10 percent requires regulatory approval.
Nonresidents are free to purchase equity securities. Investment in banks above set limits requires regulatory approval.
Nonresidents are free to purchase equity securities. Investment in banks by nonresidents is generally limited to 30 percent.
Nonresidents can invest in up to 100 percent of the equity capital of listed and unlisted public companies without prior approval, subject to certain exclusions and limitations.
Table 5. Restrictions on Cross-Border Portfolio Investment in Asia, 2005
Equity investment by foreign participants subject to various restrictions.
QIIs are allowed to invest in A-shares subject to quotas. No QII may hold more than 10 percent of a listed company. In 2005 total aggregate quota was US$10 billion.
Nonresidents are free to purchase equity securities.
Nonresidents are free to purchase equity securities, except for financial companies. Nonresidents may not hold more than 1 percent of any investment fund.
FIIs are allowed to invest in shares subject to sectoral caps of 24 percent (insurance), 49 percent and 74 percent (airlines and banks) in certain sectors. No FII may hold more than 10 percent of a listed company.
Intraregional equity portfolio flows nearly tripled over 2001–04 to $113.6 billion. Today, intraregional flows account for over 15 percent of total inflows to countries in the region, up from just under 10 percent in 2001 (Table 6). However, these flows are derived from a relatively few countries (mainly the financial centers of Hong Kong SAR, Singapore and Japan). Furthermore, intraregional flows by some measures remain small relative to flows from Asia to the rest of the world. For example, Japan, one of the largest sources of portfolio flows in the region, channels about 7 percent of its external portfolio investment to Asia. Also, cross-listings within the region by and large remain modest (Box 1).
United States In percent In percent In percent Rest of In percent In percent and Canada of total EU15 of total Asia of total World of total Total of total
Investment toUnited States and Canada 180.4 6.3 809.0 19.2 284.1 38.0 425.2 48.9 1,698.7 19.5
(In percent of total) 10.6 47.6 16.7 25.0 100.0EU15 1,252.1 43.5 2,340.2 55.5 201.3 26.9 400.5 46.1 4,194.1 48.1
(In percent of total) 29.9 55.8 4.8 9.5 100.0Asia 649.4 22.6 472.9 11.2 113.6 15.2 17.9 2.1 1,253.9 14.4
(In percent of total) 51.8 37.7 9.1 1.4 100.0Rest of world 797.7 27.7 596.8 14.1 148.5 19.9 25.4 2.9 1,568.3 18.0
(In percent of total) 50.9 38.1 9.5 1.6 100.0Total 2,879.6 100.0 4,218.9 100.0 747.5 100.0 869.0 100.0 8,715.0 100.0
(In percent of total) 33.0 48.4 8.6 10.0 100.0
Source: IMF, Coordinated Portfolio Investment Survey .
Investment from
Table 6. Cross-Border Equity Security Investment, 2004
(In billions of U.S. dollars)

11
Box 1. Cross-Listings and Equity Market Integration in Asia Cross-listing1 can be thought of as a channel for individual companies to achieve integration with global capital markets. Investors can hold foreign equities easily via domestic exchanges. Issuers can benefit from an expanded shareholder base and lower risk premiums; access to more developed capital markets and lower cost of capital; increased liquidity; better information disclosure and coverage by analysts; and better corporate governance.2 Companies in several of Asia’s largest countries have significant cross-listings. For example, companies from mainland China issue in the Hong Kong SAR market. Companies from India often list on London and other European exchanges. Economies with major exporters and multinational companies (Korea and Taiwan POC) cross-list actively on U.S. and European bourses. Most of the cross-listing by Asian companies occurs through developed exchanges in the United States and Europe, not within the region, with the key exception of the China-Hong Kong SAR link. This fact might simply reflect the dominance of established bourses, which are recently strengthening owing to mergers and alliances.3 It could also partly reflect restrictions on cross-listings in some Asian countries; for instance, foreign companies (except for those from mainland China) must be locally incorporated to be listed in Hong Kong SAR. ____________________
1/ Including direct listings (as often used by Canadian and Israeli firms in the United States) and depository receipts (DRs). A DR is a certificate issued by a depository bank for a foreign security that is held by the depository’s custodian in the home market. 2/ D. Miller (1999), “The Market Reaction to International Cross Listings: Evidence from Depository Receipts,” Journal of Financial Economics, Vol. 51. 3/ For example, the Paris, Brussels, and Amsterdam exchange merged to form Euronext in 2000, which then announced a merger deal with the New York Stock Exchange in 2006. NASDAQ raised its stake in the London Stock Exchange to 25 percent in 2006.
Hong Kong ASEAN 4China SAR Singapore 2/ India Korea Taiwan POC Total 3/
Total offering in local market 3/1990–1995 0.8 44.8 14.4 37.4 27.4 20.2 53.11996–2000 8.4 126.9 9.3 6.3 50.5 33.1 37.82001–2006 9.8 144.0 9.9 24.9 52.6 3.1 29.2
Listings on foreign exchanges by companies from each economy1990–1995 3.9 0.7 0.6 1.0 1.4 1.0 2.81996–2000 14.9 2.8 2.8 4.9 9.0 6.8 1.32001–2006 67.2 4.3 1.3 7.3 12.6 20.6 1.5
Listings in Hong Kong SAR by companies from each economy1990–1995 2,498.8 ... 0.0 0.0 0.0 0.0 0.01996–2000 9,463.6 ... 310.4 0.0 0.0 0.0 0.02001–2006 58,719.3 ... 48.1 0.0 0.0 683.2 238.2
Listings in Singaporeby companies from each economy1990–1995 0.0 0.0 ... 0.0 0.0 0.0 373.21996–2000 68.0 146.3 ... 0.0 0.0 0.0 500.62001–2006 978.8 161.2 ... 16.3 367.1 0.0 991.0
Listings on foreign exchanges by companies from each economy
1990–1995 481.1 1.5 4.1 2.7 5.3 4.7 5.31996–2000 177.8 2.2 30.2 78.6 17.9 20.4 3.42001–2006 689.2 3.0 12.1 29.2 23.9 669.7 5.0
Sources: Dealogic; EMDB; CEIC; and Fund staff calculations.
1/ Including Depository Receipt issuances. 2006 data includes end June.2/ Local issuance data include up to end 2005. 3/ Excluding July 2005 domestic offering data for Malaysia.
(In percent of local market offering)
Equity Issuances 1/
(In billions of U.S. dollars)
(In billions of U.S. dollars)
(In millions of U.S. dollars)
(In millions of U.S. dollars)

12
Growing Domestic Institutional Investor Base Domestic institutional investors have emerged as a relatively new driving force in Asian equity markets. Between 2000 and 2004, domestic mutual finds, pension funds and insurance companies’ assets doubled to just over 36 percent of emerging Asia GDP.6 In some countries, a large share of such companies’ assets is invested in equities. Nonetheless, the sector still holds major potential for growth, since it remains small relative to developed countries (U.S. institutional investors’ assets comprise 160 percent of GDP; McKinsey Global Institute, 2006a and 2006b). While institutional investors play large roles in some markets, in some cases structural barriers may hinder their participation. In China, Indonesia, the Philippines, India, and Thailand, institutional investors’ assets on average account for under 15 percent of GDP, less than a third of that in better-developed markets. The growth of institutional investors seems to have been constrained by several factors (Ghosh, 2006): • Restrictions on the types of investments that can be made by insurance and pension
companies (China, India, Indonesia, and the Philippines require institutional assets to be invested in government securities or bank deposits);
• Competition from government guaranteed savings schemes (e.g., India’s small savings schemes);
• Crowding out by public defined benefit pension plans (Korea, Philippines, and Thailand);
• Legislative hurdles (e.g., outdated legislation hinders mutual fund development in the Philippines); and
• The dominance of small players (for example, in Indonesia, Malaysia, the Philippines and Thailand, low capital requirements have left the insurance industry fragmented).
Accordingly, in such markets retail investors account for the bulk of exchange trading (about two-thirds in China, about 85 percent in India; McKinsey Global Institute, 2006a, b). However, trends under way may spur growth of institutional investors in Asia. For example, several countries have begun to establish new pension systems. In December 2005, Korea allowed private companies to establish defined benefit or contribution systems, while in July 2005 Taiwan Province of China introduced a new Labor Pension Fund that has already
6 In 2004, this figure excludes assets invested in Hong Kong SAR by overseas mutual funds. In addition, data for mutual fund investments in Hong Kong SAR in 2000 are not available.

13
amassed funds of NT$70 billion ($2.1 billion). Looking forward, Thailand and India also plan to establish new pension systems. Controls on asset allocations of public institutional investors are also being progressively eased, in an effort to boost sagging returns. In 2005, China permitted the National Social Security Fund to begin investing in equities, while India allowed private provident trust funds to invest up to 5 percent of their assets. Since 2004, the National Pension Fund of Korea has been increasing its holdings of local equity with the aim to reaching 10.7 percent of assets by 2009. Allocations to equities are larger in some countries, 45 percent in Hong Kong SAR (Vittas, 2005) and 29 percent in the Philippines. The removal of controls on mutual fund activities has also aided market development. In India, private competition was introduced into the mutual fund market in 1987, and foreign entry was first permitted in 1993. In Japan, Japan Post and private banks have recently been allowed to sell investment trusts to the public, and Korea has announced its long-term vision to become a regional financial hub with special expertise in asset management. Improvements in Market Infrastructure and Governance Efforts over the past decade have resulted in the region having some of the most technically efficient markets in the world (Table 7) and have also improved corporate governance. On the technical side, most countries in the region have developed electronic clearing and settlement systems. Steps have also been under way to enhance corporate transparency and to adopt global accounting and disclosure standards—which is important because corporate governance figures prominently in investment decisions.7 Formally, the rules and regulations governing corporate governance across the region are in general quite strong. That said, while there is little variation across Asian economies in (for example) legal rights of shareholders, there are differences in the requirements on disclosure and transparency and board responsibilities (Cheung and Jang, 2005). For example, Taiwan Province of China does not require disclosing shareholders that hold 5 percent of a company’s shares, but China, Malaysia, the Philippines, Singapore, and
7 Jeppe Ladekarl and Sara Zervos (2004).
China 92.5 A-Indonesia 68.5 A-Korea 97.3 A+Malaysia 93.3 A+Philippines 92.4 AThailand 93.6 AHong Kong SAR ... A+Singapore ... AA-Japan ... A+
Sources: GSCS; and Thomas Murray.
Table 7. Market Infrastructure Scores 1/
1/ GSCS compares the settlement efficiency of markets, incorporating average trade size, local market interest rates, the proportion of trades that fail, and the length of time for which they fail. 100 represents the highest score. Thomas Murray produces ranking of post-trade risk exposures according to various criteria of clearing and settlement, safekeeping, and asset servicing. The ratings follow alpha scale form AAA to C.

14
Thailand require disclosure of the top 10 shareholders in addition to any with stakes of 5 percent of more. Hong Kong SAR, Indonesia, Malaysia, and Singapore do not require disclosure of management shareholdings. In emerging Asia, only China, Malaysia, and the Philippines require continuing training of board directors.
Figure 15. Growth in Mutual Funds, 2000–2004(In percent of GDP)
-3 0 3 6 9 12 15
SingaporeSouthBrazilChile
MalaysiaThailand
KoreaIndonesia
MexicoIndia
PhilippinesRussiaChina
ArgentinaHong Kong
Turkey
Sources: Regional Regulators; IMF, MCM Department; and, HSBC.
153.97
0 10 20 30 40
SingaporeHong Kong
BrazilKorea
South AfricaMalaysia
ChileThailand
TurkeyMexico
IndiaIndonesia
PhilippinesArgentina
ChinaRussia
168.23326.01
Sources: Regional Regulators; IMF, MCM Department; and, HSBC.
Figure 14. Mutual Funds Asset Under Management in 2004(In percent of GDP)
-2 0 2 4 6 8 10 12 14 16 18 20
ChileKorea
Hong Kong SARPhilippinesSingapore
Hong Kong SARPhilippines
ChinaThailandMalaysia
IndonesiaIndia
Sources: CEIC Data Company Ltd; IMF, MCM Department; and, National Regulators.
Figure 13. Change in Pension Funds, 2000–2004(In percent of GDP)
0 10 20 30 40 50 60 70
ChileSingapore
MalaysiaKorea
ArgentinaHong Kong SAR
PhilippinesThailand
MexicoChina 1/
IndiaIndonesia
Sources: CEIC Data Company Ltd; IMF, Monetary and Capital Markets (MCM) Department; and, National Regulators.1/ For China, accumulated balance of social security and pension fund.
Figure 12. Pension Fund Assets Under Management, 2004(In percent of GDP)
0 5 10 15 20 25 30
South AfricaTaiwan
SingaporeChinaIndia Korea
PhilippinesMalaysia
TurkeyHong Kong SAR 2/
BrazilArgentinaThailand
ChileMexico
71.7
Figure 11. Change in Insurance Assets, 2000–2004 1/(In percent of GDP)
Sources: Country regulators. 1/ Philippines change between 2000 and 2002; South Africa between 2000 and 2003.2/ Assets retained in Hong Kong SAR.
Figure 10. Insurance Assets in 2004 1/(In percent of GDP)
0 10 20 30 40 50 60
South AfricaTaiwan
SingaporeKorea
TurkeyMalaysia
ChileIndia China
ThailandHong Kong SAR 2/
ArgentinaPhilippines
BrazilMexico
Source: Country regulators. 1/ Philppines data are for 2002 and for South Africa 2003.2/ Assets mantained in Hong Kong SAR.

15
Surveys of investor perceptions suggest that still significant differences remain within the region in the implementation of corporate governance laws (Cheung and Jang 2005).8 Implementation is seen as weakest in China and the Philippines and strongest in Singapore and Hong Kong SAR. In addition, while accounting standards in most countries have improved, there is some evidence to suggest that enhancements to transparency have been more muted (see IMF, 2006 WEO, Box 2.2; and De Nicolo, Laeven, and Ueda, 2006).
II. PERFORMANCE OF ASIAN EMERGING STOCK MARKETS
This section examines three aspects of Asian emerging-market equity performance over recent years. First, it examines price performance relative to other markets, and considers some possible drivers. Second, it looks at recent trends in volatility and the possible relationship with capital account liberalization. Third, it explores correlations with global and regional markets, to provide a perspective on the integration of Asian markets with other equity markets.
A. Price Performance
Over the past five years, Asian emerging markets9 have outperformed mature markets but lagged other emerging markets. Overall, stock prices generally remain well below pre-Asia-crisis peaks, whereas equity indices in Latin America, emerging Europe, and the Middle East exceed their 1990s highs (perhaps boosted by higher commodity prices or expectation of EU accession). The run-up in Asian stock prices has reflected a period of good economic fundamentals in the region. Economic growth has been strong in a number of countries, in the context of a robust global expansion, notwithstanding periodic spikes in oil prices. Moreover, corporate profits have been solid. Rising Asian stock prices have also coincided with a period of low U.S. interest rates. U.S. interest rates affect Asian equities in part through portfolio choices of global investors; 8 The Asian Corporate Governance Foundation (2005) suggests that measures could include simple steps such as ensuring that board directors have appropriate backgrounds and training to be effective, and giving sufficient advance notice of the dates and topics of shareholder meetings. 9 MSCI Emerging Market Asia index includes China, India, Indonesia, Korea, Malaysia, Pakistan, Philippines, Taiwan Province of China, and Thailand. MSCI Emerging Market Europe and Middle East includes Czech Republic, Hungary, Jordan, Poland, Russia, and Turkey. MSCI Latin America index includes Argentina, Brazil, Chile, Colombia, Mexico and Peru.
0
40
80
120
160
200
1/1/
1990
1/1/
1991
1/1/
1992
1/1/
1993
1/1/
1994
1/1/
1995
1/1/
1996
1/1/
1997
1/1/
1998
1/1/
1999
1/1/
2000
1/1/
2001
1/1/
2002
1/1/
2003
1/1/
2004
1/1/
2005
1/1/
2006
0
2
4
6
8
10Emerging market freeEmerging market AsiaU.S. 3-month rate
Source: Bloomberg LP.
Figure 16. Equity Prices(Jan. 3, 2000 =100 for MSCI U.S. dollar index (left scale),
U.S. rate in percent (right scale))

16
they provide a benchmark safe return for global investors and are used to discount future cash flows from equities.10 In addition, higher U.S. rates sometimes coincide with moves by global investors toward more defensive postures, sending riskier assets such as emerging Asian equities lower. As a third channel, changes in the U.S. monetary stance may signal a turning point in the U.S. economy, with potential implications for growth in its trading partners. Indeed, turning points in Asian equity prices do seem to correspond, albeit rather loosely, to shifts in U.S. short-term rates. Amid the stock market boom, Asian emerging market equity volatility has remained a few percentage points above the levels attained in the first half of the 1990s (although it is below the late 1990s level). Looking at country-specific data, however, the increase seems to be mostly limited to Indonesia and Taiwan Province of China, and to a lesser extent Korea; indeed, volatility is below pre-crisis levels in a few other markets.
Emerging Europe,
Developed Emerging Middle East, Latin Emerging Taiwan Hong KongWorld Market and Africa America Asia India Indonesia Korea Malaysia Philippines POC Thailand SAR Singapore
1990–95 10.5 13.6 21.7 22.6 14.5 20.3 17.5 24.4 18.9 22.5 19.5 33.2 25.3 21.3
1996–2000 12.1 15.9 20.1 24.5 20.5 27.6 52.7 45.6 36.9 29.5 18.3 27.9 42.9 29.3
2001–06 (May) 13.1 14.4 19.1 20.2 18.2 20.4 30.0 29.6 13.0 22.2 28.1 25.6 24.1 17.5
Sources: Bloomberg LP; and IMF staff calculations.
1/ Annualized 3-month rolling standard deviation of daily price changes. Based on MSCI U.S. dollar index.
Table 8. Equity Price Change Volatility 1/
(In percent)
Higher volatility in some countries compared with the early 1990s could reflect the opening up of Asian markets to foreign investment, but evidence on this score is mixed. 11 In principle, the increase in openness means that Asian markets are more exposed to global volatility and shifts in investor sentiment, and thus could be more volatile. However, while openness has increased in the markets where volatility has risen, it has also increased in markets where volatility is basically unchanged, or lower. Moreover, empirical research has not found clear evidence that liberalization increases volatility. Bekaert and Harvey (2000) find a small but generally insignificant increase in stock market volatility after capital market liberalization. Using pre-1996 data, Holmes and Wong (2001) found that liberalization lowered volatility, or did not raise it, in Singapore, Korea, and Taiwan Province of China. Hargis (2002), De Santis and Imrohoroglu (1997), and Claessens (1995) report similar finding for emerging markets in Latin America and Asia.
10 As another channel, U.S. rate fluctuations affect U.S. economic growth, and in turn Asia’s growth and corporate profits. 11 Relatedly, Chapter V in the IMF’s May 2006 Asia and Pacific Regional Economic Outlook discusses the hypothesis that increased uncertainty may have dampened capital investment in emerging Asia.

17
Overall, no systematic trend in volatility related to market opening seems to be evident.12 That said, the changes in volatility in selected Asian markets—as well as the contrast with developments in other emerging markets—remain to be explained.
B. Correlation with Global and Regional Markets
Asian equity markets have become more synchronized with global markets since the early 1990s. The same is true for emerging markets as a group, suggesting that globally rising integration may be at play. Indeed, Asia’s correlation with developed markets has moved closely with the overall emerging markets correlation. Correlations have also risen significantly for individual Asian countries, in some cases quite dramatically.13
Emerging EuropeMarket and Middle Latin Emerging South Taiwan Hong KongFree East America Asia India Indonesia Korea Malaysia Philippines Sri Lanka POC Thailand SAR Singapore
1991–1995 0.34 0.57 0.20 0.38 0.02 0.29 0.17 0.40 0.23 0.09 0.21 0.27 0.34 0.53
1996–2000 0.71 0.65 0.62 0.61 0.38 0.50 0.56 0.48 0.57 0.62 0.55 0.49 0.52 0.51
2001–2006 (May) 0.85 0.83 0.87 0.74 0.69 0.43 0.62 0.38 0.50 0.14 0.60 0.53 0.74 0.71
Sources: Bloomberg; and Fund staff calculation.
1/ Correlation is based upon 3-month MA daily price changes of MSCI U.S. dollar price index.
Table 9. Correlation with Developed Equity Markets 1/
The Asian market “beta” versus world markets has also increased over time. In a standard, single factor capital asset pricing model, the “beta”—essentially the slope in a regression of the local market return on global market returns—is the appropriate measure of risk. In particular, it is the risk—and hence the expected return—associated with exposure to the overall (world) market. Notably, the beta for the S&P/IFC global index has risen by more than that for the investable index. This is consistent with the idea that rising market integration could be lifting return correlations. In particular, as the share of internationally tradable stocks in the global index rises, the share held in global portfolios should rise, and thus its exposure to global market developments should increase.
12 Box 4.1 of the September 2006 Asia and Pacific Regional Economic Outlook finds that capital flows in emerging Asia have become more volatile in absolute terms, although it also finds that this has not necessarily resulted in greater vulnerability. 13 Correlations with global markets are volatile, so caution is needed in imputing trends. Some changes in correlation seem to be related to economic events. Emerging Asia’s correlation declined sharply during Asian crisis when the impact weighed more heavily on Asian than mature markets; and other breaks may coincide with turning points of the global interest rate cycle, for example during the early 1990s. By and large, however, shifts in correlation are hard to identify with specific events.
-0.8
-0.4
0.0
0.4
0.8
1.2
1/1/
1992
1/1/
1993
1/1/
1994
1/1/
1995
1/1/
1996
1/1/
1997
1/1/
1998
1/1/
1999
1/1/
2000
1/1/
2001
1/1/
2002
1/1/
2003
1/1/
2004
1/1/
2005
1/1/
2006
-0.8
-0.4
0.0
0.4
0.8
1.2
EM free
EM asia
Sources: Bloomberg LP; and IMF staff calculations.1/ Based on MSCI U.S. dollar index 3 month MA of daily percent price change.
Figure 17. Correlation with Developed Equity Markets 1/(In 12-month rolling)

18
The uptrend in correlation and beta vis-à-vis global markets could reflect increased liberalization, but, as is the findings on volatility, the literature on this score is mixed. For example, Bekaert, Hodrick, and Zhang (2005) do not find evidence for an uptrend in return correlations, but also note that many studies find different results, in part because correlations are unstable over time (as shown in Longin and Olnik, 1995). In addition, Bekaert and Harvey (1995) suggest that even if greater integration increases the correlation of returns across countries, time variation in the degree of market integration could complicate the empirical relationship of asset prices, market liberalization, and market integration, making it difficult to attribute rising correlation directly to liberalization.
III. ARE ASIAN MARKETS OVERHEATING?
An examination of valuation measures and risk-adjusted performance can shed light on whether Asian markets may have become overheated. Measures such as price-earnings (PE) ratios (here, based on historical earnings) and dividend yields provide some sense of whether prices are broadly in line with the relevant underlying cashflows. Measures of risk-adjusted performance can help in gauging whether recent market performance has been unusual (if, for example, it is very high relative to comparator markets).
2006 2/ 2006 H1 2001–06
India 20.4 21.4 15.9 31.9Sri Lanka 19.6 20.6 12.5 14.0Taiwan POC 15.8 18.9 29.7 33.0Singapore 16.1 16.5 17.9 21.4Philippine 15.5 16.3 18.9 28.0Hong Kong SAR 16.9 15.4 16.9 17.1Malaysia 15.8 15.1 17.7 30.9China 15.4 14.0 15.2 20.2Indonesia 13.9 13.8 12.6 24.7Korea 10.9 12.0 11.9 31.4Thailand 9.6 10.5 23.8 21.9
World 16.2 17.2 20.9 31.7 3/Emerging Latin America 12.5 13.8 13.1 17.9 3/Emerging Europe and Middle East 15.0 15.4 14.9 25.7 3/
Sources: Datastream; and IMF staff calculations.
1/ Based on MSCI country index
3/ Historical high since 1995.
2/ Highest annual average between 1990–97. Each economy can have different data starting point.
Before1997 High 2/
Table 10. Price-Earnings Ratio 1/
(In period average)
2006 2/ 2006 H1 2001–06
India 1.3 1.2 1.7 1.0Sri Lanka 1.9 1.6 3.3 1.0Korea 1.8 1.7 1.9 1.3Philippine 2.2 2.2 1.7 0.7China 2.3 2.3 2.3 2.0Singapore 2.8 2.5 2.2 1.2Malaysia 2.8 2.8 2.3 1.0Indonesia 3.0 2.9 3.4 1.5Hong Kong SAR 2.9 3.1 3.2 2.9Thailand 4.0 3.6 2.8 2.0Taiwan POC 4.0 3.8 2.4 0.9
World 2.2 2.1 2.0 1.4 3/Emerging Latin America 2.7 2.4 3.2 2.2 3/Emerging Europe and Middle East 2.1 2.7 1.9 1.6 3/
Sources: Datastream; and IMF staff calculations.
1/ Based on MSCI country index
3/ Historical low since 1995.
Before1997 Low 2/
2/ Lowest annual average between 1990–97. Each economy can have different data starting point.
Table 11. Dividend Yields 1/
(In period average)
Most Asian markets show historically moderate valuations. Even in cases where PEs exceed averages for earlier in this decade, PEs are generally much lower than pre-Asia-crisis highs. Dividend yields (dividend/price; a higher figure implies a more modest valuation) are
Asia S&P/IFC Global, Average
(1995–99)
Asia S&P/IFC Global, Average
(2000–06)
0.4
0.6
0.8
1.0
1.2
1.4
Mar
-95
Mar
-96
Mar
-97
Mar
-98
Mar
-99
Mar
-00
Mar
-01
Mar
-02
Mar
-03
Mar
-04
Mar
-05
Mar
-06
0.4
0.6
0.8
1.0
1.2
1.4
Asia S&P/IFC InvestableAsia S&P/IFC Global
Sources: Datastream; and IMF staff calculations.
Figure 18. Emerging Asian Equity Beta vis-a-vis World Equity (Five-year rolling estimates)

19
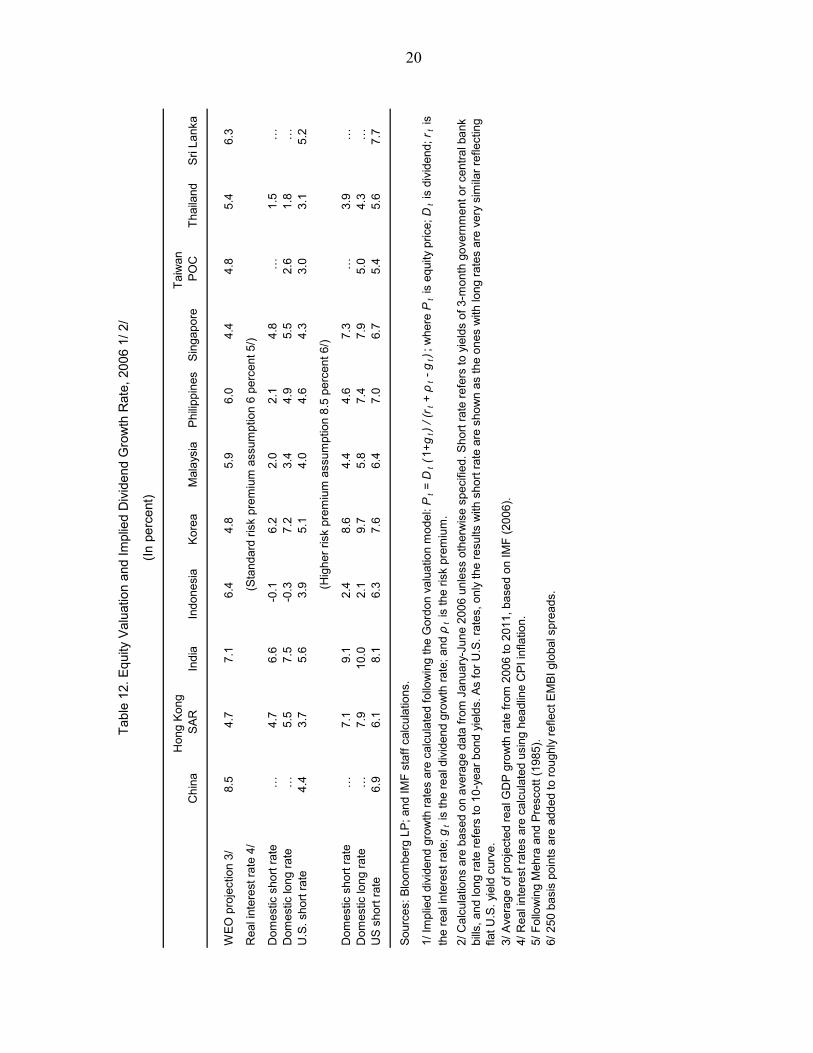
similarly moderate, by and large. That said, a few markets (India, Sri Lanka) have valuations that are somewhat above recent averages. The expected real dividend growth implied by current valuations also appears to be generally in line with medium-term GDP growth forecasts. A deeper look at valuations compares expected real dividend growth extracted from dividend yields with GDP growth as a simple benchmark. Heuristically, dividends should grow basically in line with GDP, if in the long run corporate earnings are stable as a share of GDP and dividends are stable as a share of earnings. Using the Gordon model to extract implied growth in real dividends and comparing it with real GDP forecasts from the WEO (Table 13) under various assumptions,14 in only a few instances (assuming high risk premiums) do equity-market valuations imply levels of dividend growth that are out of line with medium-term WEO projections. Even in these cases, they are not grossly above WEO growth projections. Ex-post risk-adjusted returns in EM equity investments also do not suggest that markets are overheated. Based on the Sharpe ratio, which measures excess returns per unit of risk (volatility, as measured by the standard deviation), Asian risk-adjusted returns have been basically in line with those in emerging markets in other regions, as well as U.S. high-yield bonds. This is consistent with analysis of excess returns (over a risk-free benchmark rate),
14 The analysis closely follows Box 2.2 of IMF (1999). We use various assumptions on risk premiums and real interest rates to approximate the discount factor (the sum of the risk premium and real interest rate). The high risk premium scenario may be more relevant for less developed economies, and the low risk premium more relevant to more developed markets.
-1
0
1
2
Composite 1/ Latin America 1/
Asia 1/ Europe/Middle East 1/
India 1/ U.S. high yield 2/
1996–2000
2001–2005
Figure 20. Sharpe Ratio
Sources: Bloomberg LP; and IMF staff calculations.1/ S&P/IFC investable indices in U.S. dollar, total returns.2/ Merrill Lynch bond index, total returns.
-20
-10
0
10
20
30
Composite 2/ Latin America 2/
Asia 2/ Europe/Middle East 2/
India 2/ U.S. high yield 3/
1996–2000
2001–2005
Figure 19. Excess Return 1/(In percent, period average)
Sources: Bloomberg LP; and IMF staff calculations.1/ Annualized daily excess return over 3 month U.S. treasury yields.2/ S&P/IFC investable indices in U.S. dollar, total returns.3/ Merrill Lynch bond index, total returns.
20
Hon
g Ko
ngTa
iwan
Chi
na S
ARIn
dia
Indo
nesi
aKo
rea
Mal
aysi
aPh
ilippi
nes
Sing
apor
e P
OC
Thai
land
Sri L
anka
WEO
pro
ject
ion
3/8.
54.
77.
16.
44.
85.
96.
04.
44.
85.
46.
3
Rea
l int
eres
t rat
e 4/
Dom
estic
sho
rt ra
te…
4.7
6.6
-0.1
6.2
2.0
2.1
4.8
…1.
5…
Dom
estic
long
rate
…5.
57.
5-0
.37.
23.
44.
95.
52.
61.
8…
U.S
. sho
rt ra
te4.
43.
75.
63.
95.
14.
04.
64.
33.
03.
15.
2
Dom
estic
sho
rt ra
te…
7.1
9.1
2.4
8.6
4.4
4.6
7.3
…3.
9…
Dom
estic
long
rate
…7.
910
.02.
19.
75.
87.
47.
95.
04.
3…
US
shor
t rat
e6.
96.
18.
16.
37.
66.
47.
06.
75.
45.
67.
7
Sour
ces:
Blo
ombe
rg L
P; a
nd IM
F st
aff c
alcu
latio
ns.
3/ A
vera
ge o
f pro
ject
ed re
al G
DP
gro
wth
rate
from
200
6 to
201
1, b
ased
on
IMF
(200
6).
4/ R
eal i
nter
est r
ates
are
cal
cula
ted
usin
g he
adlin
e C
PI in
flatio
n.5/
Fol
low
ing
Meh
ra a
nd P
resc
ott (
1985
). 6/
250
bas
is p
oint
s ar
e ad
ded
to ro
ughl
y re
flect
EM
BI g
loba
l spr
eads
.
2/ C
alcu
latio
ns a
re b
ased
on
aver
age
data
from
Jan
uary
-Jun
e 20
06 u
nles
s ot
herw
ise
spec
ified
. Sho
rt ra
te re
fers
to y
ield
s of
3-m
onth
gov
ernm
ent o
r cen
tral b
ank
bills
, and
long
rate
refe
rs to
10-
year
bon
d yi
elds
. As
for U
.S. r
ates
, onl
y th
e re
sults
with
sho
rt ra
te a
re s
how
n as
the
ones
with
long
rate
s ar
e ve
ry s
imila
r ref
lect
ing
flat U
.S. y
ield
cur
ve.
Tabl
e 12
. Equ
ity V
alua
tion
and
Impl
ied
Div
iden
d G
row
th R
ate,
200
6 1/
2/
(In p
erce
nt)
(Sta
ndar
d ris
k pr
emiu
m a
ssum
ptio
n 6
perc
ent 5
/)
(Hig
her r
isk
prem
ium
ass
umpt
ion
8.5
perc
ent 6
/)
1/ Im
plie
d di
vide
nd g
row
th ra
tes
are
calc
ulat
ed fo
llow
ing
the
Gor
don
valu
atio
n m
odel
: Pt =
Dt (1
+gt)
/ (r
t + ρ
t - g
t); w
here
Pt i
s eq
uity
pric
e; D
t is
divi
dend
; rt i
s th
e re
al in
tere
st ra
te; g
t is
the
real
div
iden
d gr
owth
rate
; and
ρt i
s th
e ris
k pr
emiu
m.

21
which have been broadly similar to those in non-Asian emerging markets. As one important caveat, this does not provide definitive evidence, on its own, that Asian markets are not overheated—it cannot be ruled out that many markets are out of line with fundamentals. But along with the aforementioned valuation measures, it does provide some evidence that recent performance has not been grossly out of line with fundamentals. To sum up, equity markets do not generally show signs of overheating. That said, some exploration of the relationship between equity prices and economic activity can provide some forward-looking perspective on the development of equity markets, and shed light on the attendant possible policy implications. The next section explores this issue.
IV. EQUITY PRICES AND ECONOMIC ACTIVITY
At one end of the spectrum, there is the “passive information theory” whereby asset prices and real activity are naturally correlated because stock prices reflect the present discounted value of expected future dividends (and expected future growth). From this perspective, equity prices are mere leading indicators of future changes in economic activity. Beyond this passive channel, however, there are four main channels whereby equity prices may affect real activity (Morck, Schleifer, and Vishny, 1990). • Wealth effects: Under the life cycle/permanent income hypothesis higher asset prices
raise individuals’ lifetime wealth, leading to higher spending (potentially most significant in countries where stock ownership is prevalent among households).
• The financing or cost of capital hypothesis: Rising stock prices lower the cost of new capital relative to existing capital, spurring investment.
• The financial accelerator or credit channel: When credit markets are imperfect, asset price fluctuations can impact borrowing capacity by affecting borrowers’ wealth and the value of assets pledged as collateral (Kiyotaki and Moore, 1997 and Bernanke, Gertler, and Gilchrist, 1999). These dynamics affect the finance premium on loans, and thus influence investment and consumption. If borrowers are highly leveraged, changes in net worth arising from moves in asset prices can disproportionately impacts real variables, working to propagate and amplify macroeconomic shocks.
• Balance-sheet effects and financial fragility: Asset price swings affect financial institutions’ net worth by affecting the valuation of asset portfolios, as well as the health of borrowers as noted above (thus potentially boosting nonperforming loans). Severe asset price crashes can cause intermediaries to cut back credit, potentially dampening aggregate demand. Large shocks can cause feedback into corporate and household income, further weakening intermediaries and prompting further asset price declines, especially when intermediaries are highly leveraged.

22
• Confidence effects: To the extent that equity prices signal faster growth of future real incomes, they can also influence consumption. Likewise, stock market changes may provide entrepreneurs with information about market expectations of future demand, thus influencing investment decisions.
Empirical research suggests that the financial wealth channel could be significant in Asia. In Japan and Australia—both of which have large stock markets and retail investor bases—the marginal propensity to consume from wealth is estimated at 2–3 percent and 7.4−14.5 percent, respectively (Slacalek, 2006). However, Slacalek’s estimates for Australia appear to be large particularly relative to those derived from other studies. For example, Dvornak and Kohler (2003) finds that the long-run wealth effect, including the housing and stock market effects, is 4 percent. Kuralbayeva and N’Diaye (2006) find that in Malaysia, Hong Kong SAR, Indonesia, and Korea, a 10 percent rise in real stock prices increases private consumption by about 0.2−0.3 percent, similar in magnitude to estimates for industrial countries (see IMF, 2000; and Slacalek, 2006). As one caveat, using stock price indices to proxy household wealth may overstate wealth effects, because stock prices are leading indicators and because retail investment in some markets is low (Slacalek, 2006). The 1997 Asia crisis illustrates how financial accelerator effects can contribute to financial and economic volatility, although most of these effects occurred through real estate. Large capital inflows to Thailand, Korea, and Indonesia allowed financial intuitions to intermediate a large supply of funds to their credit constrained customers. This in turn drove up stock and property prices, raising the net worth of borrowers and easing their borrowing constraints and allowing them to become highly leveraged. In Thailand, for example, borrowers could fund up to 70–80 percent of the value of collateral, making borrowers vulnerable to asset price declines (Edison, Luangaram, and Miller, 2000). This analysis raises the question: how large are equity holdings in Asia? The answer can provide a perspective on the size of potential balance-sheet and accelerator effects in Asia. That said, a few caveats are in order before proceeding: • Data are fragmentary at best, and may not fully or accurately reflect sectoral
exposures in every case.
• Information on derivatives exposures is especially scant, and in particular information on net exposures in OTC markets to increased volatility and sharp market swings (see Appendix I).
• Indirect effects on the real economy through confidence and a worsening of corporate financing conditions can be important, as well as balance-sheet effects. In addition, financial institutions can experience indirect effects if equity price declines worsen

23
borrowers’ net worth and boost nonperforming loans. Moreover, a market downturn usually brings a decline in fee-based investment banking and asset management activities, which are important sources of financial institutions’ profits.
Available data suggest that households’ direct holdings of equities remain small by international standards, but are rising with efforts to promote private institutional saving. Households’ aggregate net worth ranges from lows of 10 percent of GDP in some low-income countries to in excess of 300 percent of GDP in higher-income countries. As a rule, only a small portion of this wealth is directly held in stocks, since households generally prefer relatively safe instruments such as bank deposits and government securities.15 In India, almost three-quarters of household financial wealth is held in a combination of cash, bank deposits, and government securities (available data omit potentially important holdings of nonfinancial wealth, such as gold); in Japan the ratio is about 60 percent and in Korea about one-third. In contrast, households’ direct holdings of shares generally account for less than 10 percent of household wealth. Taking indirect holdings via institutional investors into account, however, raises household exposure to equity to one-fifth to just over one-half of total household net worth, a figure that is sizable in relation to GDP in several countries.
China 1/ India Japan Korea 2/ Singapore 3/ Taiwan POC
Total nonpublic sector investmentsin securities markets 56.3 4.5 84.9 -9.4 135.8 64.6
Households 56.3 3.4 113.3 7.2 130.2 188.3(In percent of total household assets) 18.2 35.5 37.2 55.0 23.6 …
Mutual funds … 0.1 … … … 13.8Shares … 0.1 34.1 7.2 33.5 123.5Derivatives … … 0.0 … … …Insurance … 1.6 46.1 35.2 45.2Pensions … 1.6 31.6 61.6 5.8External portfolio investment … 0.0 1.5 … … 0.0
Financial institutions … 1.1 5.9 9.6 42.4 -17.9Mutual funds … … … …Shares … 1.1 5.9 9.6 13.5 -17.9Derivatives … … … … … …Insurance … … … … 25.5Pensions … … … … …External portfolio investment … … … … 3.5 …
1/ For China, total wealth invested in all types of financial assets in 2002.
4/ 2004 for Singapore and Taiwan POC.
3/ For Singapore, household and corporates holdings reported by the departments includes securities in addition to shares. To remove the securities component, the table assumes that the corporate sector share issue is equally divided between the financial and household sectors.
{ 30
{ 0.5
Sources: CEIC Data Company Ltd; CMIE, Business Beacon; China Human Development Report ; Singapore Department of Statistics; and Monetary Authority Singapore.
2/ In Korea, foreign investors hold some 11.3 percent of GDP in Korean stocks. If these and the holdings of the government sector is included, total stock market assets in the economy is about 6 percent of GDP.
Table 13. Nonpublic Sector Investments in Equity Markets
(Net holdings in percent of GDP, 2005) 4/
15 Households are also exposed to wealth effects from real estate price changes.

24
While still moderate, rising equity holdings are making household wealth more sensitive to market movements. Direct equity holdings are over twice as volatile as holdings of deposits, reflecting swings in market valuation.16 That said, indirect holdings via institutional investors are less volatile than direct stock holdings, perhaps reflecting restrictions on investments by institutional investors such as pension funds. The financial sector’s direct exposure to equity markets also appears relatively limited in Asia. With the exception of Taiwan Province of China, where domestic financial institutions17 are net issuers of shares, direct holding of shares by financial institutions is relatively small, generally less than 10 percent of GDP and under 1 percent of total net assets. As such, financial institutions do not appear to be unduly vulnerable to direct losses arising from downward movements in the value of their stock holdings. In sum, an equity market correction, in and of itself, would seem unlikely to have a major macroeconomic impact in Asia. Outside a few markets, valuations do not seem overly lofty. Moreover, available data suggest that households’ and financial institutions’ direct exposures to equity markets are generally modest. In addition, while equity markets play a growing role in corporate finance, Asian financial systems remain bank-dominated. That said, an equity market correction could be significant if it were triggered by broader macroeconomic or financial stress—say, slowing global growth, or widespread financial fragilities—and in turn would exacerbate the impact of such stress on Asian countries. Also, data on exposures are fragmentary, so overall conclusions should be treated as tentative. In addition, indirect exposures through institutional investors are nonnegligible and growing in some countries, and over time could increase households’ exposure to asset-price cycles.
V. POLICY IMPLICATIONS
The growth and development of well-functioning equity markets conveys long-run economic benefits to Asia. It provides an efficient savings vehicle for retail and institutional investors, helping to diversify their financial holdings. Moreover, the increased diversity of funding sources for corporations can make Asian financial systems more robust to shocks. Davis
16 Because these calculations use aggregate data, volatility faced by individual households could well be higher. 17 Deposit money banks and other financial institutions, excluding pension and insurance funds.
India Japan Korea Singapore
Volatility 1/Household wealth 0.20 0.04 0.07 0.06Deposits 0.31 0.04 0.06 0.03Securities (nonshare) 0.39 0.15 0.05 …Share holdings 0.53 0.23 0.02 0.20Mutual funds 0.47 … … …Insurance 0.29 0.02 0.25Pensions 0.06 0.10 0.09
1/ The standard deviation divided by the mean for the period.
Table 14. Household Balance Sheet Volatility Measures
2000–2005
Sources: CEIC Data Company Ltd; Business Beacon; Singapore Department of Statistics; and IMF staff estimates.
{ 0.04

25
(2001) finds that when active securities markets supplement the banking system, corporate financing is more stable during economic downturns as well as banking and securities market crises. Moreover, empirical studies find that well-developed stock markets can support long-run economic growth. The aim of reaping the maximum benefit from the growth of equity markets, while managing the risks, has both microeconomic and macroeconomic policy implications. On the microeconomic side, the growing role of equity markets puts a premium on well-functioning market trading, clearing, and settlement systems, transparency, and corporate governance. Given that the technical infrastructure seems well-developed, a main challenge going forward may be expanding over time the capacity to handle a high volume of transactions (Ghosh, 2006). Low liquidity in some markets may reflect issues of transparency and corporate governance. These issues generate information asymmetries and the risk of adverse selection (when trading against better-informed investors), and accordingly foster high bid-asked spreads and limited trading activity. While de jure transparency and corporate governance have improved over time, investor perceptions suggest gaps in the application of existing frameworks. The growth of equity markets also has potential implications for prudential regulation and supervision, which exist at the boundary of micro- and macro-financial stability. Appropriate regulation and supervision of institutions active in equity markets is essential for sound functioning of equity markets. Equally important is a firm understanding and strong management of equity exposures among financial institutions, so that equity-market volatility does not engender broader financial spillovers (see Korea’s Financial Stability Report (October 2005). For example, in financial systems where banks are active in stock markets, stress testing of equity market exposures—as done in the Monetary Authority of Singapore’s Financial Stability Review (December 2005)—is important to limit the risk that an equity-market correction could create fragility in the banking system, potentially causing banks to rein in lending and giving rise to a credit crunch. Another, more controversial macroeconomic policy question is whether—and if so, how—monetary policy should respond to asset price fluctuations. For economies in emerging Asia, where the direct macroeconomic impact of stock prices may be limited, this could be largely a question for the future. Nevertheless, it is well agreed that equity prices are an important input to monetary policy decision making, because they reflect the market’s assessment of future economic prospects. It is also relatively uncontroversial that current and past equity price developments may appropriately be factored into monetary policy, because such developments influence consumption and business investment through their effects on household wealth and the cost of capital.

26
Still actively debated is whether monetary policy should respond preemptively to the emergence of imbalances in equity and other financial markets. One school of thought contends that, especially in an environment of low inflationary pressures, accommodative monetary policy settings can feed financial imbalances (White, 2006). The long-run buildup and sudden unwinding of such imbalances can seriously impair financial and macroeconomic stability. In addition, moral hazard could arise if central banks’ mandates for macroeconomic (and sometimes financial) stability oblige them to ease in response to busts (Schinasi, 2006, discusses the role of central banks in promoting financial stability). By this view, central banks have a motive—if not an obligation—to respond to such imbalances. The more conventional school holds that monetary policy is too blunt an instrument to restrain financial imbalances—prudential policy is a better tool (Bernanke, 2002). Even trying to do so could inflict major economic damage. Moreover, financial bubbles are too difficult to identify, even in hindsight. Accordingly, mistakenly tightening in response to a fundamentals-driven asset price boom (reflecting, say, productivity-enhancing technological innovation) could choke off potential growth. These considerations seem particularly relevant for Asian emerging markets countries, where structural changes complicate the relationship between monetary policy and asset prices, as well as between asset prices and economic activity. This would imply a reliance on prudential measures as a first line of defense against the macroeconomic effects of financial imbalances. While these issues will no doubt remain actively debated, the continued growth of financial markets will over time make them of increasing importance to policymakers.

27
APPENDIX I: THE DEVELOPMENT OF EQUITY DERIVATIVES MARKETS IN ASIA Equity derivatives, like derivatives more generally, can convey benefits but also entail risks to be managed. Derivatives are an alternative to trading the underlying security and supplement cash markets by providing hedging tools and low-cost arbitrage opportunities. Equity derivatives on single stocks or indices strengthen the liquidity in cash equity markets, improve price discovery and lower the cost of equity listings for firms. At the same time, small price moves can have an outsized impact on the financial position of participants in these markets, because derivatives often embody substantial leverage. Global exchange-based trading in equity derivatives has almost doubled over the last three years from $54 trillion in 2002 to $114.1 trillion of notional value (on 6.3 billion contracts by end-2005) (Figures I.1 and I.3). The volume of global trading in 2006 had already reached $96.1 trillion as of August 2006 (Figures I.2 and I.4). On Asia’s exchanges, equity derivatives have witnessed the most rapid growth of all traded derivative products (foreign exchange, interest rate, equity, commodities, and credit derivatives). Equity derivative trading in emerging Asia has mushroomed from $16.5 trillion in 2002 to $40.3 trillion in 2005 (and $37.1 trillion by the end of August 2006), and now represents 38.6 percent and 43.9 percent of worldwide equity derivatives turnover by notional value and number of trades respectively (Tables I.1 and I.3).18 19 This mainly represents very rapid growth in Korea, which hosts the world’s most active derivatives market––the Korean Futures Exchange.
18 Equity derivatives are mainly traded on organized exchanges rather than OTC. Annual OTC equity derivatives trading in Asia (excluding Japan) is only around $100 billion (BIS, 2005).
19 For Tables I.1−I.4, the analysis covers data from the following equity derivative markets in Asia-Pacific: the Australian Stock Exchange (ASX), the Sydney Futures Exchange (SFE), the Shanghai Futures Exchange, the Hong Kong Exchange, the National Stock Exchange of India (NSE), the Bombay Stock Exchange (BSE), the Jakarta Futures Exchange (JFX), the Surabaya Stock Exchange, the Tokyo International Financial Futures Exchange (TIFFE), the Tokyo Stock Exchange (TSE), the Osaka Securities Exchange, the Korea Stock Exchange (KSE), the Korea Futures Exchange (KOFEX), the Malaysia Derivatives Exchange, the Singapore Stock Index Futures and Derivative Trading Exchange (SGX-DT), the Thailand Futures Exchange (TFEX) and the Taiwan Futures Exchange (TAIFEX). Other important derivative markets outside Asia in our sample include the American Stock Exchange, Chicago Board Options Exchange (CBOE), Chicago Board of Trade (CBOT), Chicago Mercantile Exchange (CME), International Securities Exchange (ISE), Options Clearing Corp., the Pacific Stock Exchange, the Philadelphia Stock Exchange, Eurex, Euronext/London International Financial Futures and Options Exchange (LIFFE), and OM (Optionsmarknaden) AB.

28
38.4
%
4.4%
21.9
%
35.3
%
Am
eric
as
Em
ergi
ng A
sia
Mat
ure
Mar
ket A
sia
Eur
ope/
Afri
ca/M
iddl
e E
ast
Figu
re I.
1. G
loba
l Exc
hang
e-Ba
sed
Trad
ing
of E
quity
Der
ivativ
es, 2
005
(By
notio
nal a
mou
nt, t
otal
US$
114.
1 tri
llion
)
42.8
%
3.3%
15.3
%
38.6
%
Am
eric
as
Em
ergi
ng A
sia
Mat
ure
Mar
ket A
sia
Eur
ope/
Afri
ca/M
iddl
e E
ast
Figu
re I.
2. G
loba
l Exc
hang
e-B
ased
Tra
ding
of E
quity
Der
ivat
ives,
Ye
ar-to
-Dat
e, A
ugus
t 200
6 (B
y no
tiona
l am
ount
, tot
al U
S$96
.1 tr
illio
n)
35.6
%1.
7%
18.2
%
44.4
%
Am
eric
asE
mer
ging
Asi
aM
atur
e M
arke
t Asi
aE
urop
e/A
frica
/Mid
dle
Eas
t
Figu
re I.
3. G
loba
l Exc
hang
e-Ba
sed
Trad
ing
of E
quity
Der
ivativ
es, 2
005
(By
num
ber o
f tra
des,
6.3
bill
ion
cont
ract
s)
34.1
%
2.0%
20.0
%
43.9
%
Am
eric
as
Em
ergi
ng A
sia
Mat
ure
Mar
ket A
sia
Eur
ope/
Afri
ca/M
iddl
e E
ast
Figu
re I.
4. G
loba
l Exc
hang
e-B
ased
Tra
ding
of E
quity
Der
ivat
ives,
Ye
ar-to
-Dat
e, A
ugus
t 200
6 (B
y nu
mbe
r of t
rade
s, 4
.5 b
illio
n co
ntra
cts)

29
Most equity derivatives are exchange-traded (ETD), as opposed to foreign exchange and interest rate derivatives, which are mostly traded OTC. Formalized and regulated exchanges are leading the growth in Asian derivative markets, which can be divided into three categories: (i) fully demutualized exchanges (Hong Kong SAR and Singapore), which offer a wide range of derivative products; (ii) partially demutualized exchanges (Korea, India, and Malaysia), which have specialized in equity futures and index products; and (iii) derivative markets with no or marginal exchange-based trading and limited OTC derivative trading (China, Indonesia, the Philippines, and Thailand). Equity derivatives markets are much less well-developed in other emerging Asian countries. In general, high levels of ETD tend to be associated with high equity trading in deep and sufficiently wide cash markets, mainly because the development of derivatives necessitates sufficient liquidity of cash markets (including pricing benchmarks) to ensure efficient price discovery. Since 2000, growth in overall derivative trading only in Korea, Hong Kong SAR, and Taiwan POC has outstripped growth of both domestic market capitalization and cash trading in equity markets (Tables I.2 and I.4).20 These countries currently exhibit high turnover ratios of almost 1½ to more than 36 times of outstanding stock, while average global turnover ratios of equity derivatives tend to converge to one (BIS, 2004; and WFE, 2005). Since most of equity derivative contracts are traded in these countries, their high turnover ratio has kept aggregate equity derivative trading in emerging market Asia at more than 10 times GDP, stock market capitalization, and stock trading. Although stock exchanges in countries such as China, Indonesia, Malaysia, Thailand, and the Philippines also have strong trading activity in cash markets, similar to that in emerging market and mature market countries with established derivative markets, trading in equity derivatives remains very limited. The notional amount of equity derivative contracts in Asia tends to be smaller than in the rest of the world, which might explain an even greater share of Asian markets in global turnover in terms of the number of contracts traded (although equity derivative trading in all of Asia has been associated with greater contract volumes over the years (Table I.5)). Contract sizes in emerging Asian countries have more than doubled, from $8,200 in 2003 to $19,000 by August 2006, but they still lag behind global averages. Contract sizes of equity derivatives in countries like India and Malaysia are still less than half of the notional amount per trade in Asia and less than a third of the notional amount per trade in the United States. Besides Hong Kong SAR, only the equity derivative market in Korea offers contract sizes in emerging Asia similar to mature market economies. The strong development of equity derivatives in Korea and India reflects a robust operational and legal infrastructure (Fratzscher, 2006). For example, both countries have well-designed trading platforms, which provide access to both domestic and foreign institutional investors.
20 Indonesia has just established the Jakarta Futures Exchange and introduced equity index futures at the Surabaya Stock Exchange. The Thailand Futures Exchange (TFEX), in operation since 2004, started trading its first stock index future only in April 2006. In the Philippines, equity derivatives have not been traded since the Manila Futures Exchange closed in 1997.

30
By comparison, countries that are lagging have (for example) weak trading infrastructures, shortcomings in relevant laws that create uncertainty about whether derivatives contracts can be enforced (or even whether trading derivatives is permitted), tax provisions that are unfriendly to derivatives, bans on short selling, and restrictions on investment by foreigners. Reaping the full benefits of equity derivatives markets by fostering their wider development also requires careful management of risks to financial stability. In Asian countries without formal derivative exchanges, the rising popularity of OTC derivatives entails greater emphasis on disclosure and transparency, good governance and risk management. Systemic risk is potentially reduced when trading occurs in well-structured and formally regulated exchanges that impose appropriate margin requirements and position limits, administer centralized clearing and settlement, engage in market surveillance, undertake adequate disclosure, and mutualize risks through loss-sharing arrangements, capital deposits of members, and international excess-of-loss insurance.21 It is also reduced when supervisors and regulators can ascertain the exposure of systemically important financial institutions to derivatives markets. Sizable retail trading of derivatives may pose its own challenges and could (in principle) entail significant knock-on effects on real sectors; for example, a market downturn that inflicted widespread losses on households could affect confidence and spending. A good understanding of all these issues is incumbent on country officials charged with safeguarding financial stability.
21 See Steinherr (1998). By contrast, OTC trading—essentially an interbank market—is decentralized, and regulated only through the regulation of its main participants (Schinasi and others, 2000).

31
2002
2003
2004
2005
2006
3/20
0220
0320
0420
0520
063/
2002
2003
2004
2005
2006
3/
(In p
erce
nt o
f dom
estic
sto
ck m
arke
t cap
italiz
atio
n)
Amer
icas
(tot
al)
21,3
5025
,021
31,9
8343
,872
41,0
97--
----
----
----
----
--U
nite
d St
ates
1/
21,1
4424
,647
31,4
1643
,001
40,3
8020
2.0
224.
626
7.7
344.
432
3.4
191.
317
3.3
192.
925
3.5
223.
7Br
azil
116
256
366
506
459
25.2
50.7
60.7
63.9
57.9
95.3
113.
211
0.9
106.
779
.1
Asia
(tot
al)
19,4
4728
,153
34,1
0845
,289
40,2
98--
----
----
----
----
--E
mer
ging
Asi
a (to
tal)
16,5
3024
,432
28,9
1240
,263
37,1
181,
037.
01,
399.
71,
481.
11,
811.
11,
669.
61,
258.
31,
337.
11,
279.
11,
349.
91,
120.
0In
dia
4920
336
257
166
09.
935
.354
.473
.685
.120
.172
.893
.710
3.2
53.2
Kore
a15
,470
22,9
8626
,543
37,6
3634
,371
2,82
8.4
3,77
9.8
3,90
5.2
4,74
5.6
4,33
3.9
11,8
64.2
7,82
1.9
6,81
5.0
5,24
1.7
4,52
9.5
Mal
aysi
a3
512
1311
3.3
4.3
10.2
10.1
8.5
0.7
2.8
6.7
7.3
5.6
Hon
g Ko
ng S
AR42
063
51,
074
1,33
41,
368
256.
440
0.5
647.
875
0.6
769.
519
4.2
88.8
124.
712
6.4
219.
2Ta
iwan
PO
C58
960
392
171
070
819
9.7
201.
228
5.8
205.
020
4.6
225.
415
9.1
208.
614
9.1
143.
7
Euro
pe/A
frica
/Mid
dle
East
(tot
al) 2
/13
,169
14,1
3919
,289
24,9
5914
,665
----
----
----
----
----
Tota
l53
,966
67,3
1385
,379
114,
120
96,0
61--
----
----
----
----
--
3/ Y
ear-
to-d
ate
(Aug
ust 2
006)
.
Tabl
e I.1
. Glo
bal E
xcha
nge-
Base
d Tr
adin
g of
Equ
ity D
eriv
ativ
es, 2
002–
06
Equ
ity D
eriv
ativ
es (n
otio
nal a
mou
nt)
(In b
illion
s of
U.S
. dol
lars
)(In
per
cent
of G
DP)
(Not
iona
l am
ount
of t
rade
d co
ntra
cts
in a
bsol
ute
term
s, a
nd in
per
cent
of G
DP
and
stoc
k m
arke
t cap
italiz
atio
n)
1/ T
he n
otio
nal a
mou
nt o
f tra
ding
in s
tock
inde
x op
tions
in C
hica
go, s
tock
inde
x fu
ture
s in
New
Yor
k an
d st
ock
optio
ns a
t all
deriv
ativ
es e
xcha
nges
in th
e U
nite
d St
ates
for 2
006
have
bee
n es
timat
ed b
ased
on
the
grow
th ra
te fr
om 2
004
to 2
005.
2/ N
ote
that
the
cove
rage
of e
quity
der
ivat
ives
incl
udes
94.
3 pe
rcen
t and
93.
5 pe
rcen
t of g
loba
l tra
ding
by
notio
nal a
mou
nt a
nd n
umbe
rs o
f con
tract
s re
spec
tivel
y in
200
5. O
nly
smal
ler e
quity
der
ivat
ive
exch
ange
s in
Eur
ope/
Afric
a/M
iddl
e Ea
ster
n (A
ustri
a, G
reec
e, It
aly,
Isra
el, N
orw
ay, P
olan
d, a
nd R
ussi
a) h
ave
been
exc
lude
d in
the
regi
onal
sub
tota
l.

32
2002
2003
2004
2005
2006
3/20
0220
0320
0420
0520
063/
2002
2003
2004
2005
2006
3/
Amer
icas
(tot
al)
----
----
--39
.637
.237
.538
.442
.8--
----
----
Uni
ted
Stat
es 1
/11
6.1
142.
314
9.8
173.
317
5.3
30.0
26.9
27.5
27.9
30.3
----
----
--Br
azil
250.
438
5.7
352.
330
6.4
256.
20.
20.
30.
30.
30.
3--
----
----
Asia
(tot
al)
----
----
--36
.041
.839
.939
.742
.015
.013
.215
.211
.17.
9Em
ergi
ng A
sia
(tota
l)99
9.3
1,44
4.7
1,30
0.1
1,44
5.4
1,44
7.4
30.6
36.3
33.9
35.3
38.6
85.0
86.8
84.8
88.9
92.1
Indi
a24
.869
.595
.612
0.5
156.
10.
10.
10.
10.
10.
10.
30.
71.
11.
31.
6Ko
rea
2,59
2.8
5,00
7.6
4,24
5.5
3,10
8.7
3,63
9.5
21.9
29.3
29.3
29.3
29.3
79.5
81.6
77.8
83.1
85.3
Mal
aysi
a9.
78.
619
.625
.624
.50.
00.
00.
00.
00.
00.
00.
00.
00.
00.
0H
ong
Kong
SAR
216.
421
4.3
244.
528
7.3
209.
00.
60.
70.
90.
91.
02.
22.
33.
12.
93.
4Ta
iwan
PO
C92
.910
1.9
128.
112
1.2
142.
31.
12.
13.
14.
15.
13.
02.
12.
71.
61.
8
Euro
pe/A
frica
/Mid
dle
East
(tot
al) 2
/--
----
----
24.4
21.0
22.6
21.9
15.3
----
----
--
Tota
l--
----
----
100.
010
0.0
100.
010
0.0
100.
010
0.0
100.
010
0.0
100.
010
0.0
3/ Y
ear-
to-d
ate
(Aug
ust 2
006)
.4/
Est
imat
e ba
sed
on th
e an
nual
ized
trad
ing
volu
me
for 2
006.
1/ T
he n
otio
nal a
mou
nt o
f tra
ding
in s
tock
inde
x op
tions
in C
hica
go, s
tock
inde
x fu
ture
s in
New
Yor
k an
d st
ock
optio
ns a
t all
deriv
ativ
es e
xcha
nges
in th
e U
nite
d St
ates
for 2
006
have
bee
n es
timat
ed
base
d on
the
grow
th ra
te fr
om 2
004
to 2
005.
2/ N
ote
that
the
cove
rage
of e
quity
der
ivat
ives
incl
udes
94.
3 pe
rcen
t and
93.
5 pe
rcen
t of g
loba
l tra
ding
by
notio
nal a
mou
nt a
nd n
umbe
rs o
f con
tract
s re
spec
tivel
y in
200
5. O
nly
smal
ler e
quity
der
ivat
ive
exch
ange
s in
Eur
ope/
Afric
a/M
iddl
e Ea
ster
n (A
ustri
a, G
reec
e, It
aly,
Isra
el, N
orw
ay, P
olan
d, a
nd R
ussi
a) h
ave
been
exc
lude
d in
the
regi
onal
sub
tota
l.
Equi
ty D
eriv
ativ
es (n
otio
nal a
mou
nt)
Tabl
e I.2
. Glo
bal E
xcha
nge-
Base
d Tr
adin
g of
Equ
ity D
eriv
ativ
es, 2
002–
06
(Not
iona
l am
ount
of t
rade
d co
ntra
cts
in p
erce
nt o
f sto
ck tr
adin
g, g
loba
l tra
ding
of e
quity
der
ivat
ives
, and
regi
onal
trad
ing
of e
quity
der
ivat
ives
in A
sia)
(In p
erce
nt o
f sto
ck tr
adin
g)(In
per
cent
of g
loba
l tra
ding
) 4/
(In p
erce
nt o
f tot
al A
sia)

33
2000
2001
2002
2003
2004
2005
2006
3/
Amer
icas
(tot
al)
834,
236.
997
5,47
2.9
1,11
2,58
2.0
1,45
1,82
6.5
1,84
6,14
4.8
2,22
5,82
4.2
1,51
9,89
6.6
Uni
ted
Stat
es 1
/79
7,43
7.6
893,
265.
01,
001,
662.
11,
202,
588.
01,
498,
709.
01,
846,
473.
41,
293,
724.
7B
razi
l30
,708
.375
,778
.896
,774
.218
5,01
2.6
242,
125.
427
4,69
2.1
186,
053.
6
Asia
(tot
al)
263,
286
920,
241
2,02
0,62
13,
048,
273
2,78
9,01
72,
886,
220
2,04
3,62
1E
mer
ging
Asi
a (to
tal)
224,
710
869,
797
1,96
0,98
02,
974,
369
2,70
3,55
62,
777,
524
1,95
3,39
4In
dia
n.a.
n.a.
8,93
027
,009
46,8
6479
,052
76,3
12Ko
rea
213,
496
855,
258
1,93
3,13
02,
900,
658
2,57
7,16
62,
579,
158
1,76
8,86
7M
alay
sia
367
288
234
331
1,08
81,
112
1,02
9H
ong
Kon
g S
AR
8,92
09,
900
10,7
4114
,496
19,5
6825
,546
26,3
37Ta
iwan
PO
C1,
927
4,35
17,
944
31,8
7558
,869
92,6
5780
,849
Euro
pe/A
frica
/Mid
dle
East
(tot
al) 2
/18
3,82
1.5
742,
800.
995
5,29
5.8
951,
618.
31,
083,
534.
71,
138,
998.
789
0,94
0.1
Tota
l1,
281,
344.
62,
638,
514.
74,
088,
498.
75,
451,
717.
65,
718,
696.
96,
251,
042.
64,
454,
458.
0
3/ Y
ear-
to-d
ate
(Aug
ust 2
006)
.
2/ N
ote
that
the
cove
rage
of e
quity
der
ivat
ives
incl
udes
94.
3 pe
rcen
t and
93.
5 pe
rcen
t of g
loba
l tra
ding
by
notio
nal a
mou
nt a
nd n
umbe
rs o
f con
tract
s re
spec
tivel
y in
20
05. O
nly
smal
ler e
quity
der
ivat
ive
exch
ange
s in
Eur
ope/
Afri
ca/M
iddl
e E
aste
rn (A
ustri
a, G
reec
e, It
aly,
Isra
el, N
orw
ay, P
olan
d, a
nd R
ussi
a) h
ave
been
exc
lude
d in
the
regi
onal
sub
tota
l.
(Num
ber o
f tra
ded
cont
ract
s)
Tabl
e I.3
. Glo
bal E
xcha
nge-
Base
d Tr
adin
g of
Equ
ity D
eriv
ativ
es, 2
002–
06
1/ T
he n
umbe
r of t
rade
d co
ntra
cts
on s
tock
inde
x op
tions
in C
hica
go, s
tock
inde
x fu
ture
s in
New
Yor
k an
d st
ock
optio
ns a
t all
deriv
ativ
es e
xcha
nges
the
Uni
ted
Stat
es
have
bee
n es
timat
ed fo
r 200
6 ba
sed
on th
e gr
owth
rate
from
200
4 to
200
5.
(In th
ousa
nds
of c
ontra
cts)
Equ
ity D
eriv
ativ
es (n
umbe
r of c
ontra
cts)

34
2000
2001
2002
2003
2004
2005
2006
3/20
0020
0120
0220
0320
0420
0520
063/
Amer
icas
(tot
al)
55.4
27.8
18.4
17.2
21.9
24.7
23.7
----
----
----
--U
nite
d St
ates
1/
52.9
25.5
16.6
14.3
17.8
20.5
20.2
----
----
----
--Br
azil
0.4
0.2
0.1
0.1
0.1
0.1
0.2
----
----
----
--
Asia
(tot
al)
17.5
26.2
33.4
36.2
33.1
32.0
31.9
3.8
3.1
2.4
3.0
5.5
14.7
3.1
Emer
ging
Asi
a (to
tal)
14.9
24.8
32.4
35.3
32.1
30.8
30.5
96.2
96.9
97.6
97.0
94.5
85.3
96.9
Indi
an.
a.n.
a.0.
10.
30.
60.
91.
22.
71.
70.
90.
4n.
a.n.
a.1.
7Ko
rea
14.2
24.4
32.0
34.4
30.6
28.6
27.6
89.4
92.4
95.2
95.7
92.9
81.1
92.4
Mal
aysi
a0.
00.
00.
00.
00.
00.
00.
00.
00.
00.
00.
00.
00.
10.
0H
ong
Kong
SAR
0.6
0.3
0.2
0.2
0.2
0.3
0.4
0.9
0.7
0.5
0.5
1.1
3.4
0.7
Taiw
an P
OC
0.1
0.1
0.1
0.4
0.7
1.0
1.3
3.2
2.1
1.0
0.4
0.5
0.7
2.1
Euro
pe/A
frica
/Mid
dle
East
(tot
al) 2
/12
.221
.215
.811
.312
.912
.613
.9--
----
----
----
Tota
l10
0.0
100.
010
0.0
100.
010
0.0
100.
010
0.0
100.
010
0.0
100.
010
0.0
100.
010
0.0
100.
0
3/ Y
ear-
to-d
ate
(Aug
ust 2
006)
.
2/ N
ote
that
the
cove
rage
of e
quity
der
ivat
ives
incl
udes
94.
3 pe
rcen
t and
93.
5 pe
rcen
t of g
loba
l tra
ding
by
notio
nal a
mou
nt a
nd n
umbe
rs o
f con
tract
s re
spec
tivel
y in
200
5. O
nly
smal
ler e
quity
der
ivat
ive
exch
ange
s in
Eur
ope/
Afric
a/M
iddl
e Ea
ster
n (A
ustri
a, G
reec
e, It
aly,
Isra
el, N
orw
ay, P
olan
d, a
nd R
ussi
a)
have
bee
n ex
clud
ed in
the
regi
onal
sub
tota
l.
(In p
erce
nt o
f tot
al)
(In p
erce
nt o
f tot
al A
sia)
Equi
ty D
eriv
ativ
es (n
umbe
r of c
ontra
cts)
(Num
ber o
f tra
ded
cont
ract
s in
per
cent
of s
tock
trad
ing,
glo
bal t
radi
ng o
f equ
ity d
eriv
ativ
es, a
nd re
gion
al tr
adin
g of
equ
ity d
eriv
ativ
es in
Asi
a)
Tabl
e I.4
. Glo
bal E
xcha
nge-
Base
d Tr
adin
g of
Equ
ity D
eriv
ativ
es, 2
002–
06
1/ T
he n
umbe
r of t
rade
d co
ntra
cts
on s
tock
inde
x op
tions
in C
hica
go, s
tock
inde
x fu
ture
s in
New
Yor
k an
d st
ock
optio
ns a
t all
deriv
ativ
es e
xcha
nges
the
Uni
ted
Stat
es h
ave
been
est
imat
ed fo
r 200
6 ba
sed
on th
e gr
owth
rate
from
200
4 to
200
5.
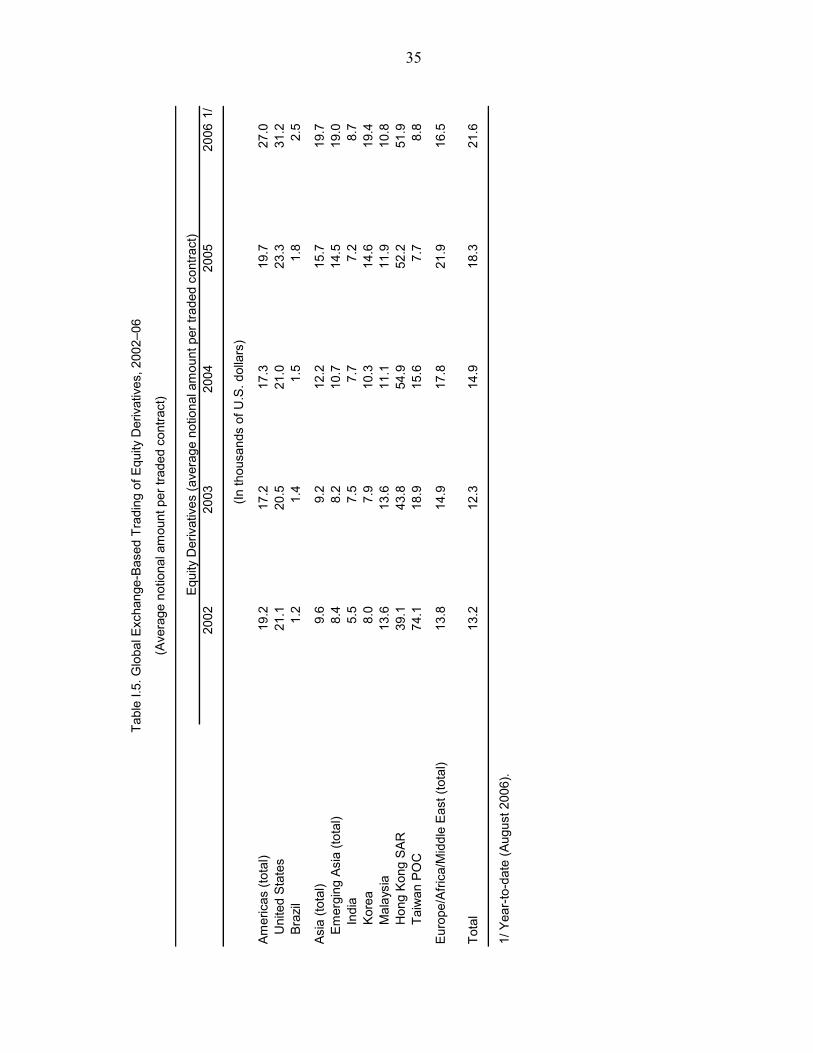
35
2002
2003
2004
2005
2006
1/
Amer
icas
(tot
al)
19.2
17.2
17.3
19.7
27.0
Uni
ted
Stat
es21
.120
.521
.023
.331
.2Br
azil
1.2
1.4
1.5
1.8
2.5
Asia
(tot
al)
9.6
9.2
12.2
15.7
19.7
Emer
ging
Asi
a (to
tal)
8.4
8.2
10.7
14.5
19.0
Indi
a5.
57.
57.
77.
28.
7Ko
rea
8.0
7.9
10.3
14.6
19.4
Mal
aysi
a13
.613
.611
.111
.910
.8H
ong
Kong
SAR
39.1
43.8
54.9
52.2
51.9
Taiw
an P
OC
74.1
18.9
15.6
7.7
8.8
Euro
pe/A
frica
/Mid
dle
East
(tot
al)
13.8
14.9
17.8
21.9
16.5
Tota
l13
.212
.314
.918
.321
.6
1/ Y
ear-
to-d
ate
(Aug
ust 2
006)
.
Tabl
e I.5
. Glo
bal E
xcha
nge-
Base
d Tr
adin
g of
Equ
ity D
eriv
ativ
es, 2
002–
06
(Ave
rage
not
iona
l am
ount
per
trad
ed c
ontra
ct)
(In th
ousa
nds
of U
.S. d
olla
rs)
Equi
ty D
eriv
ativ
es (a
vera
ge n
otio
nal a
mou
nt p
er tr
aded
con
tract
)

36
REFERENCES
Asian Development Bank, 2006, “Asian Bonds Online: Market Data.” Available via the Internet: (http://asianbondsonline.adb.org/regional/regional.php).
Bank for International Settlements, 2004, Triennial Surveys on Positions in Global OTC Derivatives Markets at End-June 2004, Monetary and Economic Department (December).
———, 2005, OTC Derivatives Market Activity in the Second Half of 2004, Monetary and Economic Department (May).
Bekaert , G. and C. Harvey, 1995, “Time-Varying World Market Integration,” Journal of Finance, Vol. 50, No. 2.
———, 2000, “Foreign Speculators and Emerging Equity Markets,” Journal of Finance.
———, 2002, “Research in Emerging Markets Finance: Looking to the Future,” Emerging Markets Review 2.
———, and R. Lumsdaine, 2002, “Dating the Integration of World Equity Markets,” Journal of Financial Economics, Vol. 65.
Bekaert, G., R. Hodrick, and X. Zhang, 2005, “International Stock Return Comovements,” NBER Working Paper No. 11906 (Cambridge, Massachusetts: National Bureau of Economic Research).
Bernanke, Ben, 2002, “Asset Price ‘Bubbles’ and Monetary Policy,” Remarks before the New York Chapter of the National Association for Business Economics (October).
———, Mark Gertler, and Simon Gilchrist, 1999, “The Financial Accelerator in a Quantitative Business Cycle Framework,” Handbook of Macroeconomics, eds. by J.B. Taylor and M. Woodford, Vol. 1, pp. 1341–93.
Cheung, Stephen YL, and Hasung Jan, 2005, PECC Macro Corporate Governance Scorecard Project: Evaluation of Corporate Governance in East Asian Economies (Hong Kong SAR: City University of Hong Kong).
Claessens, S., 1995, “The Emergence of Equity Investment in Developing Countries: Overview,” World Bank Economic Review, Vol. 9, Issue No. 1.
Davis, E. Phillip, 2001, “Multiple Avenues of Intermediation, Corporate Finance and Financial Stability,” IMF Working Paper No. 01/115 (Washington: International Monetary Fund).

37
De Nicolo, Gianni, Luc Laeven, and Kenichi Ueda, 2006, “Corporate Governance Quality in Asia: Comparative Trends and Impact” (forthcoming).
De Santis, G., and S. Imrohoroglu, 1997, “Stock Returns and Volatility in Emerging Financial Markets,” Journal of International Money and Finance, Vol. 16, No. 4.
Dvornak, Nikola, and Marion Kohler, 2003, "Housing Wealth, Stock Market Wealth, and Consumption: A Panel Analysis for Australia, Reserve Bank of Australia Research Discussion Paper (July).
Edison, Hali, Pongsak Luangaram, and Marcus Miller, 2000, “Asset Bubbles, Leverage and ‘Lifeboats’: Elements of the East Asian Crisis,” Economic Journal, Vol. 110, No. 460, pp. 309–34.
Edison, H., and F. Warnock, 2003, “A Simple Measure of the Intensity of Capital Controls,” Journal of Empirical Finance, Vol. 10.
Fratzscher, Oliver, 2006, “Emerging Derivative Markets in Asia,” EAP Flagship on Asian Financial Market Development (Washington: World Bank).
Ghosh, Swati, 2006, East Asia Finance: The Road to Robust Market, Conference edition (Washington: World Bank).
Hargis, K., 2002, “Forms of Foreign Investment Liberalization and Risk in Emerging Stock Markets,” Journal of Financial Research.
Holmes. P., and M. Wa Wong, 2001, “Foreign Investment, Regulation, and Price Volatility in Southeast Asian Stock Markets,” Emerging Markets Review 2.
HSBC Global Research, 2006, “Asia Invests More in Itself: The Growing Role of Local Institutional Investors in Asian Equity Markets,” Macro Pan Equity Research Strategy (Hong Kong SAR).
International Monetary Fund, 2006, Asia and Pacific Regional Economic Outlook (Washington).
———, 1999, International Capital Markets (Washington).
———, 2000, World Economic Outlook, May 2000: Asset Prices and the Business Cycle, World Economic and Financial Surveys (Washington).
———, 2005, Annual Report on Exchange Arrangements and Exchange Restrictions (Washington).

38
———, 2006, World Economic Outlook: Financial Systems and Economic Cycles, World Economic and Financial Surveys (Washington).
Jeppe, Ladekarl, and Sara Zervos, 2004, “Housekeeping and Plumbing: the Investability of Emerging Markets,” Emerging Markets Review, Vol. 5, pp. 267–94.
Jobst, Andreas A., 2006, “Sovereign Securitization in Emerging Markets,” Journal of Structured Finance, Vol. 12, No. 3 (forthcoming).
Kiyotaki, Nobuhiro, and John Moore, 1997 “Credit Cycles,” Journal of Political Economy, Vol. 105 (April), pp. 211–48.
Kuralbayeva, Karlygash, and Papa N’Diaye, 2006, “Determinants of Private Consumption in a Selected Number of Asian Countries,” IMF Working Paper (forthcoming) (Washington: International Monetary Fund).
Lane, Timothy, Atish Ghosh, Javier Hamann, Steven Phillips, Marianne Schulze-Ghattas, and Tsidi Tsikata, 1999, IMF-Supported Programs in Indonesia, Korea, and Thailand: A Preliminary Assessment, IMF Occasional Paper, No. 178 (Washington: International Monetary Fund).
Lane, Philip R., and Gian Maria Milesi-Ferretti, 2006, “The External Wealth of Nations Mark II: Revised and Extended Estimates of Foreign Assets and Liabilities, 1970–2004,” IMF Working Paper No. 06/69 (Washington: International Monetary Fund).
Longin, F., and B. Solnik, 1995, “Is the Correlation in International Equity Returns Constant: 1960–1990?,” Journal of International Money and Finance, No. 14, pp. 3–26.
Mehra, R., and E. Presscott, 1985, “The Equity Premium: A Puzzle,” Journal of Monetary Economics, Vol. 15, pp. 145–161 (London, United Kingdom: Elsevier B.V.).
McKinsey Global Institute, 2006a, Putting China’s Capital to Work: The Value of Financial System Reform, May (San Francisco).
———, 2006b, Accelerating India’s Growth Through Financial System Reform, May (San Francisco).
Micu, Marian, and Upper, Christian, 2006, “Derivative Markets,” BIS Quarterly Review, June, pp. 39–49.
Morck, Randall, Andrei Shleifer, and Robert Vishny, 1990, “The Stock Market and Investment: Is The Stock Market a Sideshow?,” Brookings Paper on Economic Activity, No. 2, pp. 157–202.

39
Prasad, E., K. Rogoff, S. Wei, and M. Kose, 2003, Effects of Financial Globalization on Developing Countries, IMF Occasional Paper No. 220 (Washington: International Monetary Fund).
Schinasi, Garry J., 2006, Safeguarding Financial Stability: Theory and Practice (Washington: International Monetary Fund).
———, R. Sean Craig, Burkhard Drees, and Charles F. Kramer, 2003, Modern Banking and OTC Derivatives Markets, IMF Occasional Paper No. 203 (Washington: International Monetary Fund).
Siliverstovs, Boriss, and Manh Ha Duong, 2006, “On the Role of Stock Market for Real Economic Activity: Evidence for Europe,” DIW Discussion Papers No. 599 (Berlin: German Institute for Economic Research).
Slacalek, Jirka, 2006, “International Wealth Effects,” DIW Discussion Papers No. 596 (Berlin: German Institute for Economic Research).
Steinherr, Alfred, 1998, Derivatives: The Wild Beast of Finance (New York: John Wiley and Sons).
Vittas, Dimitri, 2005, “Pension Reforms: Success and Failures,” World Bank presentation. Available via the Internet: http://info.worldbank.org/etools/library/latestversion.asp?83727
White, William, 2006, “Is Price Stability Enough?,” BIS Working Papers No. 205 (Basel: Bank for International Settlements).
World Federation of Exchanges, 2005, Annual Report, Paris.