asian equities in the year of the monkey - · pdf fileasian equities in the year of the monkey...
TRANSCRIPT
February 2016
Bill Maldonado
Global CIO, Equities & CIO, Asia-Pacific
Asian Equities in the Year of the Monkey
Presentation only intended for professional investors as defined by MIFID.

2
Asia faces headwinds from sluggish global trade
Note: Export data exclude China exports to Hong Kong to reduce the distortion of Chinese export over-invoicing in early 2013Source: CEIC, HSBC Global Asset Management, data as of January 2016. The commentary and analysis presented in this document reflect the opinion of HSBC Global Asset Management on the markets, according to the informationavailable to date. They do not constitute any kind of commitment from HSBC Global Asset Management. Consequently, HSBC Global Asset Management (France) will not be held responsible for any investment or disinvestmentdecision taken on the basis of the commentary and/or analysis in this document.
40
42
44
46
48
50
52
54
56
58
07/12 01/13 07/13 01/14 07/14 01/15 07/15 01/16
IN ID CN KR TW SG MY
-40
-30
-20
-10
0
10
20
30
40
50
60
01/08 01/09 01/10 01/11 01/12 01/13 01/14 01/15
Exports to US Exprots to EU Exports to China To all markets
Asia faces headwinds such as sluggish global trade, excess capacity, capital misallocation, high leverage, anddemographic challenges
This sluggish Asian trade reflects both cyclical weakness in global demand and a structural downshift in thetrade intensity of global growth, though negative price effects exaggerated trade weakness
Exports/foreign trade remained sluggishManufacturing PMIs mostly below 50 despite improvementsfrom recent lows
% yoy; 3mma
Non contractual document

3
Relatively resilient services and consumption
Source: CEIC, HSBC Global Asset Management, data as of November 2015.The commentary and analysis presented in this document reflect the opinion of HSBC Global Asset Management on the markets, according to the information available to date. They do not constitute any kind of commitment fromHSBC Global Asset Management. Consequently, HSBC Global Asset Management (France) will not be held responsible for any investment or disinvestment decision taken on the basis of the commentary and/or analysis in thisdocument.
-6
-4
-2
0
2
4
6
8
10
AU CN IN ID KR MY PH SG TW TH
% yoy
Manufacturing Services
Real GDP growth (1H15)
-60
-40
-20
0
20
40
60
80
100
120
01/08 01/09 01/10 01/11 01/12 01/13 01/14 01/15
CN IN ID MY PH TH KR
The services sector has help up relatively well as compared with manufacturing in most of Asia, barring a fewexceptions
Similarly, consumption has also proved to be more or less resilient with some high frequency data such as autosales recording a pick up in most Asian countries
Services sector growth held up relatively well Car sales also improved modestly in most countries
% yoy; 3mma
Non contractual document
4
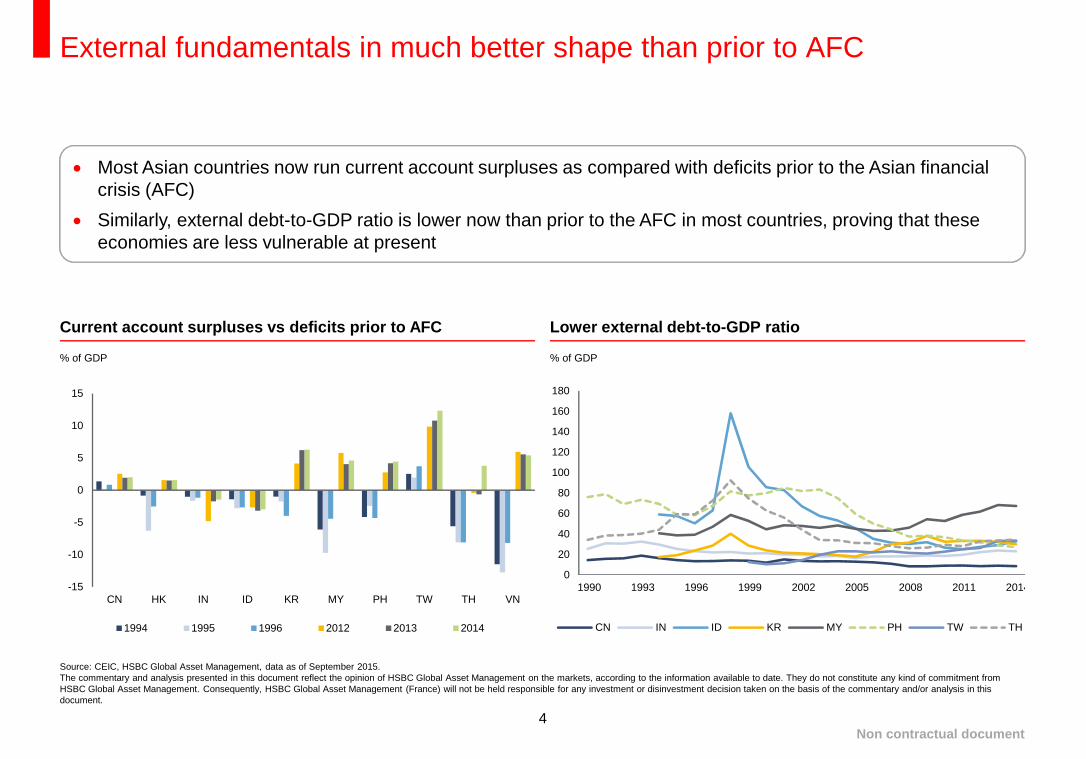
External fundamentals in much better shape than prior to AFC
Source: CEIC, HSBC Global Asset Management, data as of September 2015.The commentary and analysis presented in this document reflect the opinion of HSBC Global Asset Management on the markets, according to the information available to date. They do not constitute any kind of commitment fromHSBC Global Asset Management. Consequently, HSBC Global Asset Management (France) will not be held responsible for any investment or disinvestment decision taken on the basis of the commentary and/or analysis in thisdocument.
0
20
40
60
80
100
120
140
160
180
1990 1993 1996 1999 2002 2005 2008 2011 2014
CN IN ID KR MY PH TW TH
-15
-10
-5
0
5
10
15
CN HK IN ID KR MY PH TW TH VN
1994 1995 1996 2012 2013 2014
Most Asian countries now run current account surpluses as compared with deficits prior to the Asian financialcrisis (AFC)
Similarly, external debt-to-GDP ratio is lower now than prior to the AFC in most countries, proving that theseeconomies are less vulnerable at present
Current account surpluses vs deficits prior to AFC Lower external debt-to-GDP ratio
% of GDP% of GDP
Non contractual document

5
Inflation outlook remains benign
Source: CEIC, Bloomberg, HSBC Global Asset Management, data as of January 2016Any forecast, projection or target contained in this presentation is for information purposes only and is not guaranteed in any way. HSBC accepts no liability for any failure to meet such forecasts, projections or targets. For illustrativepurpose only. The commentary and analysis presented in this document reflect the opinion of HSBC Global Asset Management on the markets, according to the information available to date. They do not constitute any kind of commitmentfrom HSBC Global Asset Management. Consequently, HSBC Global Asset Management (France) will not be held responsible for any investment or disinvestment decision taken on the basis of the commentary and/or analysis in thisdocument.
30
50
70
90
110
130
150
01/10 01/11 01/12 01/13 01/14 01/15 01/16
ID (6M) KR (12M) TH (12M) IN (12M) CN (3M) PH (12M)
Inflation remains low, even after accounting for some pass-through from currency weakness, amid soft globalcommodity prices, excess capacity and tepid domestic demand
Headline reading is likely to rise gradually, as the impact of the sharp decline in oil/commodity prices eases.However, inflation will likely remain benign
Inflation expectations are bottoming out in most countries
2010=100
Non contractual document
6
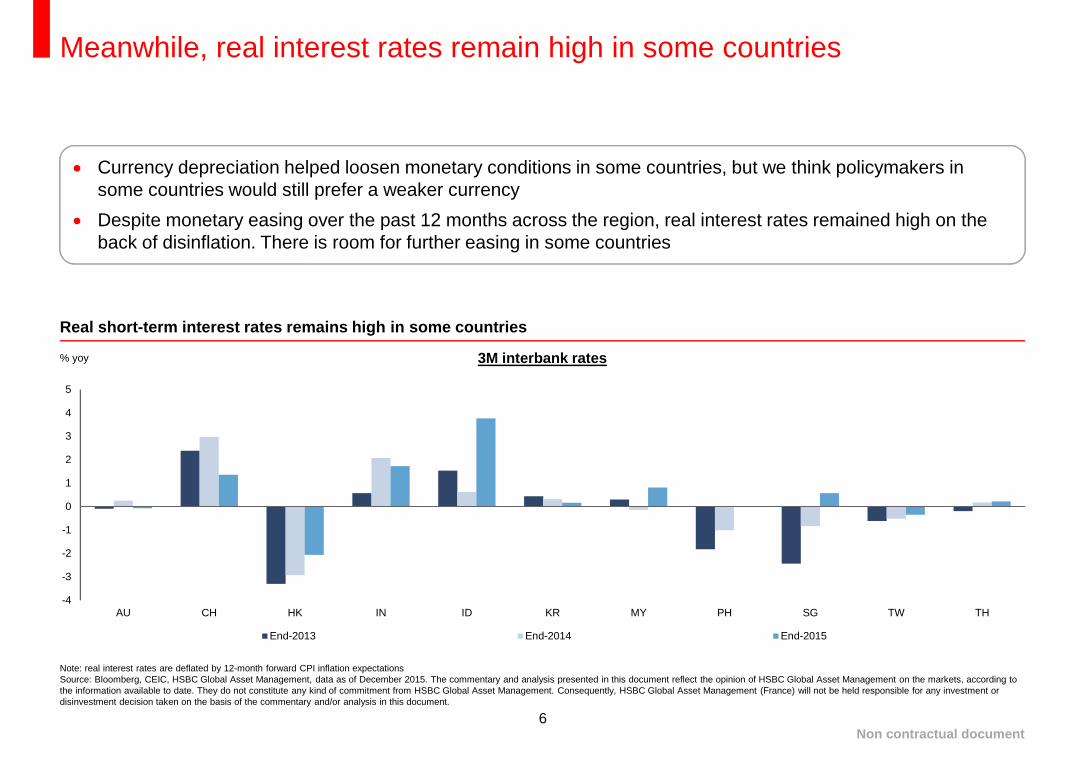
Meanwhile, real interest rates remain high in some countries
Note: real interest rates are deflated by 12-month forward CPI inflation expectationsSource: Bloomberg, CEIC, HSBC Global Asset Management, data as of December 2015. The commentary and analysis presented in this document reflect the opinion of HSBC Global Asset Management on the markets, according tothe information available to date. They do not constitute any kind of commitment from HSBC Global Asset Management. Consequently, HSBC Global Asset Management (France) will not be held responsible for any investment ordisinvestment decision taken on the basis of the commentary and/or analysis in this document.
3M interbank rates
-4
-3
-2
-1
0
1
2
3
4
5
AU CH HK IN ID KR MY PH SG TW TH
End-2013 End-2014 End-2015
Currency depreciation helped loosen monetary conditions in some countries, but we think policymakers insome countries would still prefer a weaker currency
Despite monetary easing over the past 12 months across the region, real interest rates remained high on theback of disinflation. There is room for further easing in some countries
Real short-term interest rates remains high in some countries
% yoy
Non contractual document

What lies ahead?
8
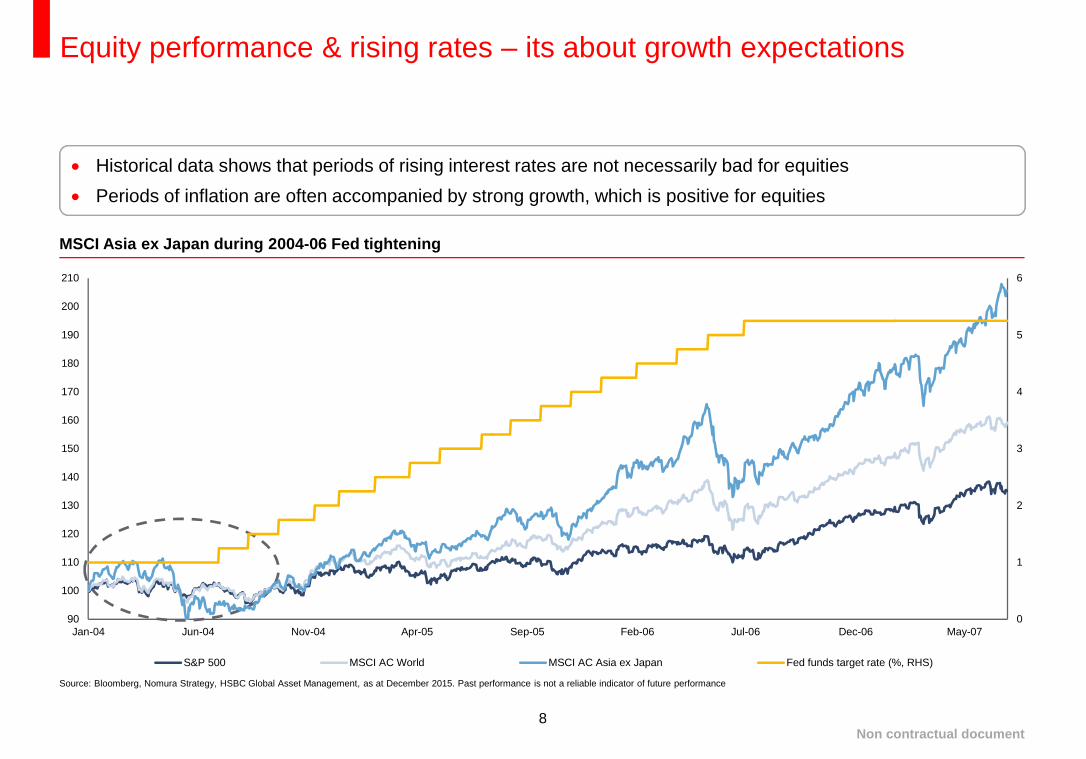
Equity performance & rising rates – its about growth expectations
Source: Bloomberg, Nomura Strategy, HSBC Global Asset Management, as at December 2015. Past performance is not a reliable indicator of future performance
MSCI Asia ex Japan during 2004-06 Fed tightening
0
1
2
3
4
5
6
90
100
110
120
130
140
150
160
170
180
190
200
210
Jan-04 Jun-04 Nov-04 Apr-05 Sep-05 Feb-06 Jul-06 Dec-06 May-07
S&P 500 MSCI AC World MSCI AC Asia ex Japan Fed funds target rate (%, RHS)
Historical data shows that periods of rising interest rates are not necessarily bad for equities
Periods of inflation are often accompanied by strong growth, which is positive for equities
Non contractual document
9
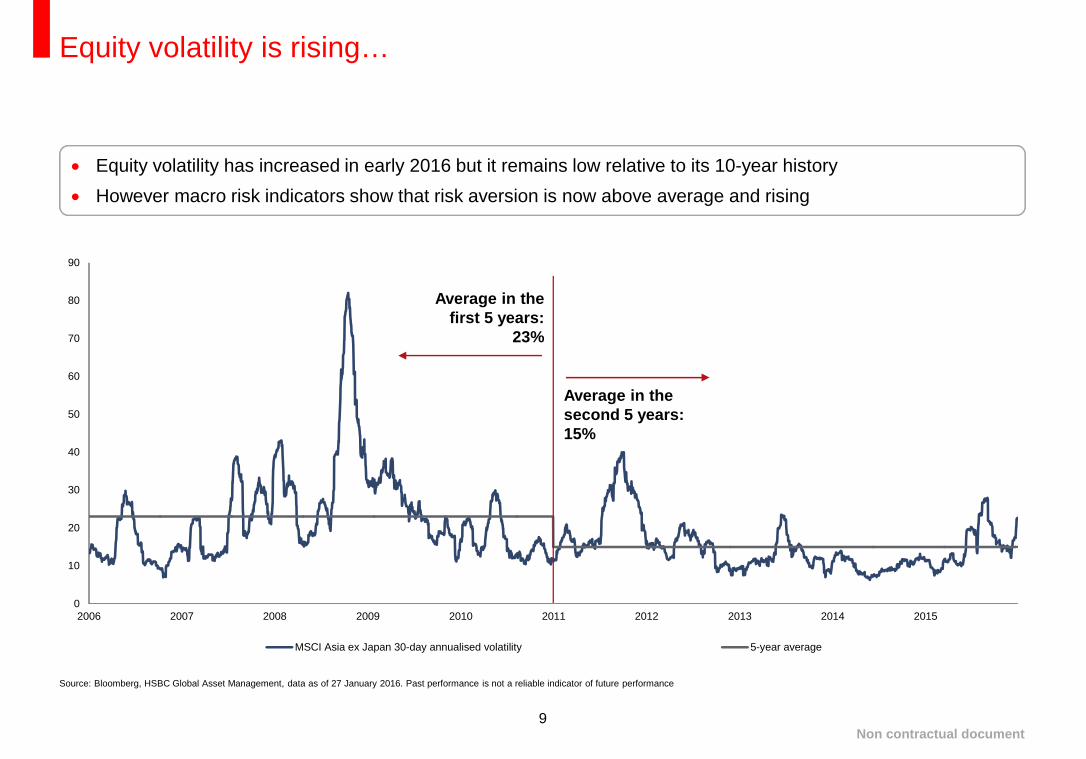
Equity volatility is rising…
Source: Bloomberg, HSBC Global Asset Management, data as of 27 January 2016. Past performance is not a reliable indicator of future performance
0
10
20
30
40
50
60
70
80
90
2006 2007 2008 2009 2010 2011 2012 2013 2014 2015
MSCI Asia ex Japan 30-day annualised volatility 5-year average
Average in thefirst 5 years:
23%
Average in thesecond 5 years:15%
Equity volatility has increased in early 2016 but it remains low relative to its 10-year history
However macro risk indicators show that risk aversion is now above average and rising
Non contractual document
10
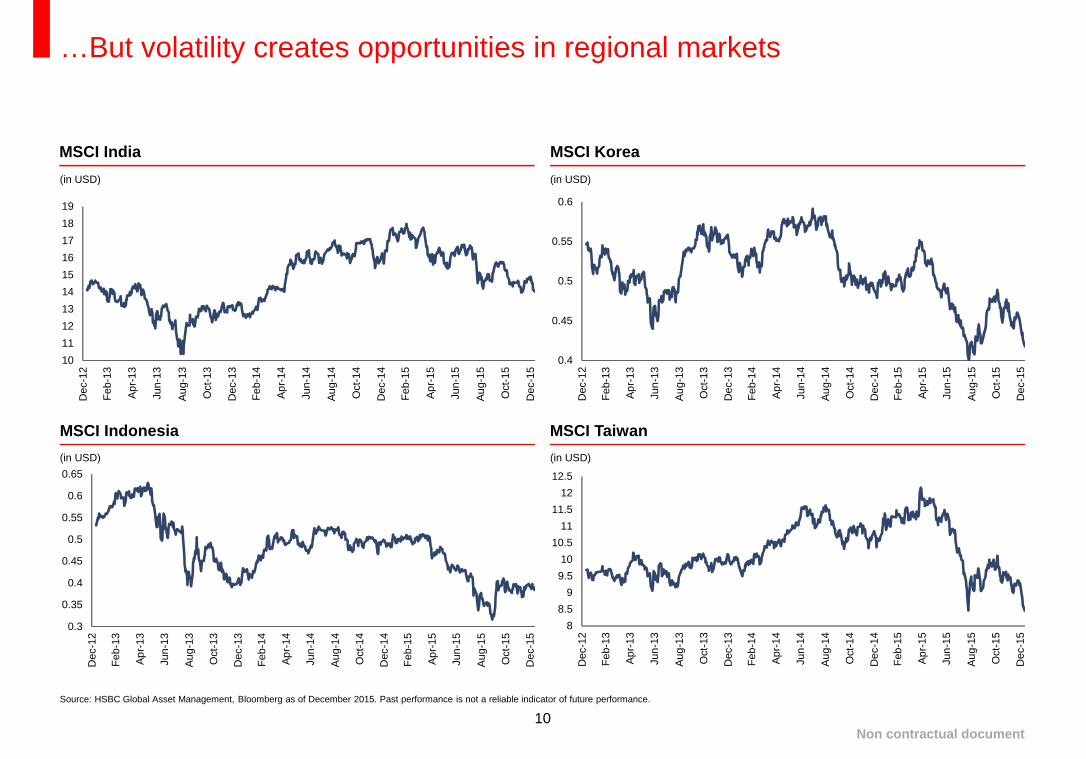
…But volatility creates opportunities in regional markets
Source: HSBC Global Asset Management, Bloomberg as of December 2015. Past performance is not a reliable indicator of future performance.
10
11
12
13
14
15
16
17
18
19
Dec-1
2
Feb-1
3
Ap
r-13
Jun
-13
Au
g-1
3
Oct
-13
Dec-1
3
Feb-1
4
Ap
r-14
Jun
-14
Au
g-1
4
Oct
-14
Dec-1
4
Feb-1
5
Ap
r-15
Jun
-15
Au
g-1
5
Oct
-15
Dec-1
5
0.4
0.45
0.5
0.55
0.6
Dec-1
2
Feb-1
3
Ap
r-13
Jun
-13
Au
g-1
3
Oct
-13
Dec-1
3
Feb-1
4
Ap
r-14
Jun
-14
Au
g-1
4
Oct
-14
Dec-1
4
Feb-1
5
Ap
r-15
Jun
-15
Au
g-1
5
Oct
-15
Dec-1
5
0.3
0.35
0.4
0.45
0.5
0.55
0.6
0.65
Dec-1
2
Feb-1
3
Ap
r-13
Jun
-13
Au
g-1
3
Oct
-13
Dec-1
3
Feb-1
4
Ap
r-14
Jun
-14
Au
g-1
4
Oct
-14
Dec-1
4
Feb-1
5
Ap
r-15
Jun
-15
Au
g-1
5
Oct
-15
Dec-1
5
8
8.5
9
9.5
10
10.5
11
11.5
12
12.5
Dec-1
2
Feb-1
3
Ap
r-13
Jun
-13
Au
g-1
3
Oct
-13
Dec-1
3
Feb-1
4
Ap
r-14
Jun
-14
Au
g-1
4
Oct
-14
Dec-1
4
Feb-1
5
Ap
r-15
Jun
-15
Au
g-1
5
Oct
-15
Dec-1
5
MSCI India MSCI Korea
MSCI Indonesia MSCI Taiwan
(in USD) (in USD)
(in USD) (in USD)
Non contractual document
11
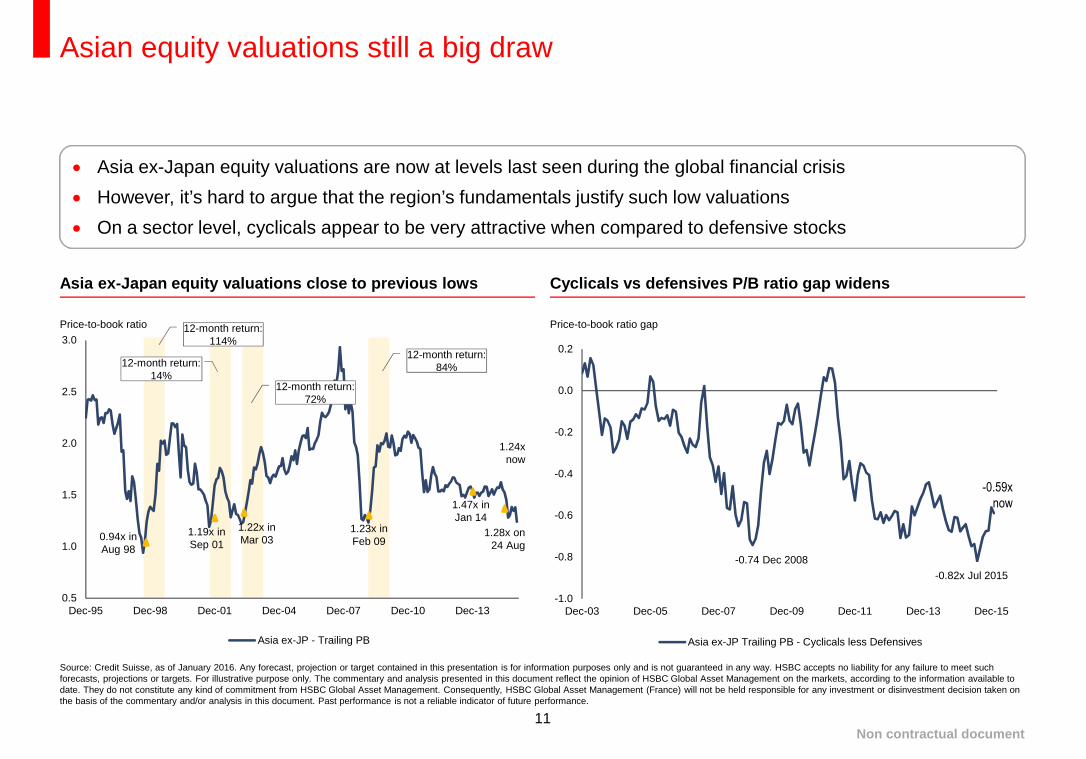
Asian equity valuations still a big draw
Asia ex-Japan equity valuations are now at levels last seen during the global financial crisis
However, it’s hard to argue that the region’s fundamentals justify such low valuations
On a sector level, cyclicals appear to be very attractive when compared to defensive stocks
Asia ex-Japan equity valuations close to previous lows Cyclicals vs defensives P/B ratio gap widens
Price-to-book ratio
0.5
1.0
1.5
2.0
2.5
3.0
Dec-95 Dec-98 Dec-01 Dec-04 Dec-07 Dec-10 Dec-13
Asia ex-JP - Trailing PB
1.24xnow
1.23x inFeb 090.94x in
Aug 98
1.47x inJan 14
1.22x inMar 03
1.28x on24 Aug
1.19x inSep 01
12-month return:114%
12-month return:14%
12-month return:72%
12-month return:84%
Price-to-book ratio gap
-1.0
-0.8
-0.6
-0.4
-0.2
0.0
0.2
Dec-03 Dec-05 Dec-07 Dec-09 Dec-11 Dec-13 Dec-15
Asia ex-JP Trailing PB - Cyclicals less Defensives
-0.74 Dec 2008
-0.59xnow
-0.82x Jul 2015
Non contractual document
Source: Credit Suisse, as of January 2016. Any forecast, projection or target contained in this presentation is for information purposes only and is not guaranteed in any way. HSBC accepts no liability for any failure to meet suchforecasts, projections or targets. For illustrative purpose only. The commentary and analysis presented in this document reflect the opinion of HSBC Global Asset Management on the markets, according to the information available todate. They do not constitute any kind of commitment from HSBC Global Asset Management. Consequently, HSBC Global Asset Management (France) will not be held responsible for any investment or disinvestment decision taken onthe basis of the commentary and/or analysis in this document. Past performance is not a reliable indicator of future performance.
12
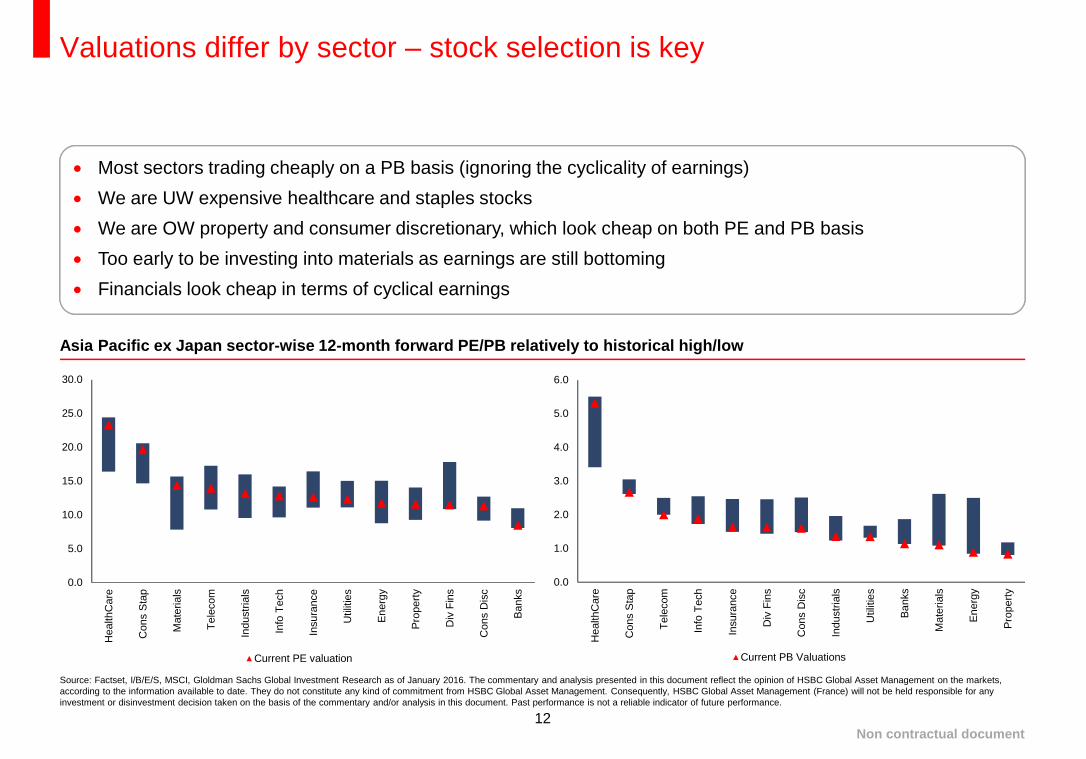
Valuations differ by sector – stock selection is key
Source: Factset, I/B/E/S, MSCI, Gloldman Sachs Global Investment Research as of January 2016. The commentary and analysis presented in this document reflect the opinion of HSBC Global Asset Management on the markets,according to the information available to date. They do not constitute any kind of commitment from HSBC Global Asset Management. Consequently, HSBC Global Asset Management (France) will not be held responsible for anyinvestment or disinvestment decision taken on the basis of the commentary and/or analysis in this document. Past performance is not a reliable indicator of future performance.
0.0
1.0
2.0
3.0
4.0
5.0
6.0
HealthC
are
Cons
Sta
p
Tele
com
Info
Tech
Insu
rance
Div
Fin
s
Cons
Dis
c
Indust
rials
Util
itie
s
Ba
nks
Mate
rials
En
erg
y
Pro
pert
y
Current PB Valuations
0.0
5.0
10.0
15.0
20.0
25.0
30.0
HealthC
are
Cons
Sta
p
Mate
rials
Tele
com
Indust
rials
Info
Tech
Insu
rance
Util
itie
s
En
erg
y
Pro
pert
y
Div
Fin
s
Cons
Dis
c
Ba
nks
Current PE valuation
Most sectors trading cheaply on a PB basis (ignoring the cyclicality of earnings)
We are UW expensive healthcare and staples stocks
We are OW property and consumer discretionary, which look cheap on both PE and PB basis
Too early to be investing into materials as earnings are still bottoming
Financials look cheap in terms of cyclical earnings
Asia Pacific ex Japan sector-wise 12-month forward PE/PB relatively to historical high/low
Non contractual document
13
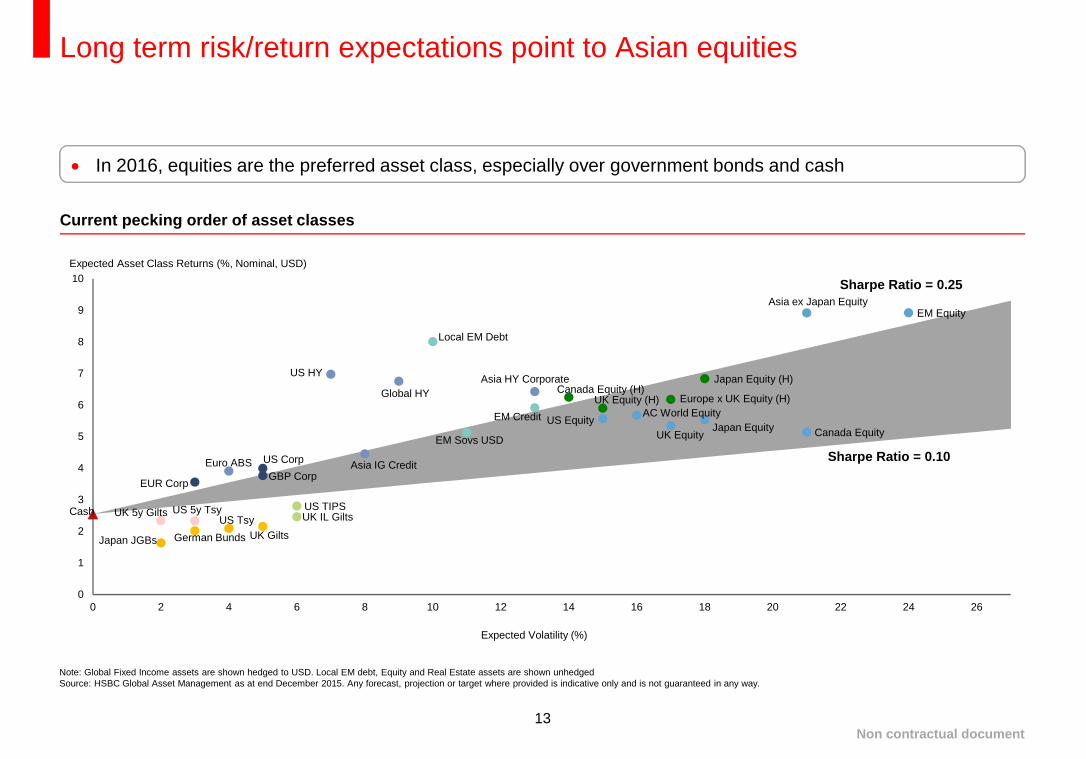
Long term risk/return expectations point to Asian equities
Note: Global Fixed Income assets are shown hedged to USD. Local EM debt, Equity and Real Estate assets are shown unhedgedSource: HSBC Global Asset Management as at end December 2015. Any forecast, projection or target where provided is indicative only and is not guaranteed in any way.
Cash US TIPSUK IL GiltsUS Tsy
UK GiltsGerman BundsJapan JGBs
US Corp
US HY
GBP CorpEUR Corp
EM Sovs USD
EM Credit US Equity
UK EquityJapan Equity
EM Equity
AC World Equity
Asia ex Japan Equity
Euro ABS
US 5y TsyUK 5y Gilts
Local EM Debt
Europe x UK Equity (H)UK Equity (H)
Japan Equity (H)
Canada Equity
Canada Equity (H)
Asia IG Credit
Asia HY Corporate
Global HY
0
1
2
3
4
5
6
7
8
9
10
0 2 4 6 8 10 12 14 16 18 20 22 24 26
Expected Volatility (%)
Sharpe Ratio = 0.25
Sharpe Ratio = 0.10
Expected Asset Class Returns (%, Nominal, USD)
In 2016, equities are the preferred asset class, especially over government bonds and cash
Current pecking order of asset classes
Non contractual document
14
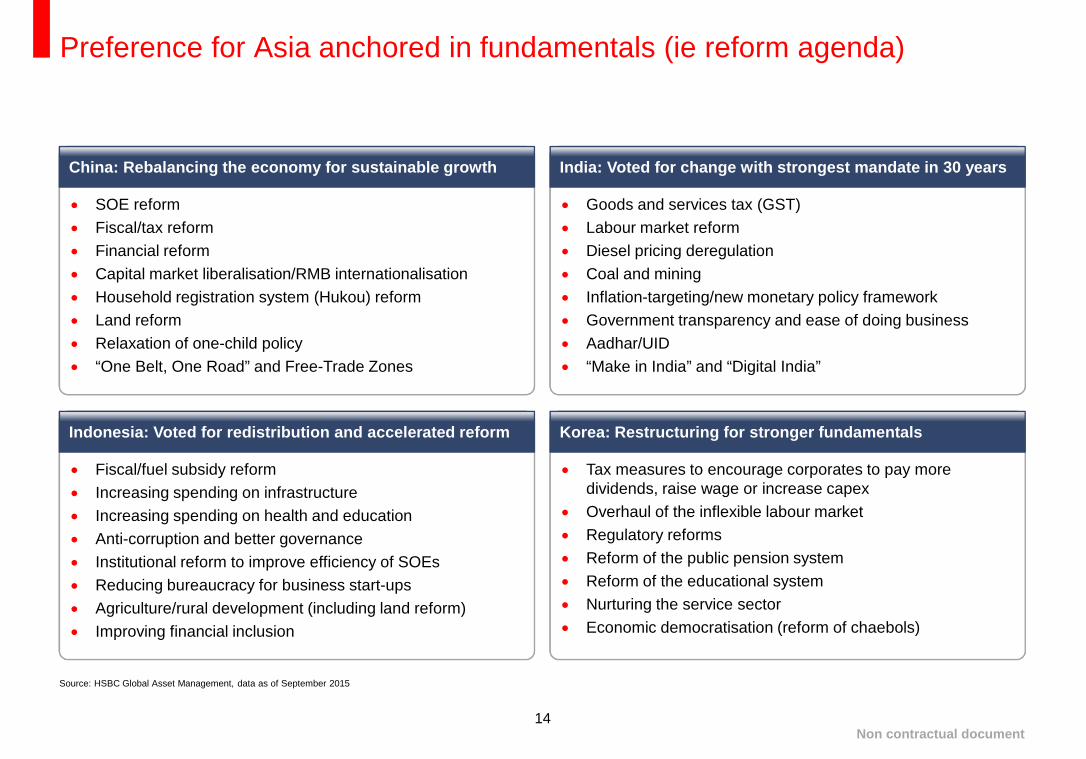
SOE reform
Fiscal/tax reform
Financial reform
Capital market liberalisation/RMB internationalisation
Household registration system (Hukou) reform
Land reform
Relaxation of one-child policy
“One Belt, One Road” and Free-Trade Zones
China: Rebalancing the economy for sustainable growth
Preference for Asia anchored in fundamentals (ie reform agenda)
Source: HSBC Global Asset Management, data as of September 2015
Goods and services tax (GST)
Labour market reform
Diesel pricing deregulation
Coal and mining
Inflation-targeting/new monetary policy framework
Government transparency and ease of doing business
Aadhar/UID
“Make in India” and “Digital India”
India: Voted for change with strongest mandate in 30 years
Fiscal/fuel subsidy reform
Increasing spending on infrastructure
Increasing spending on health and education
Anti-corruption and better governance
Institutional reform to improve efficiency of SOEs
Reducing bureaucracy for business start-ups
Agriculture/rural development (including land reform)
Improving financial inclusion
Indonesia: Voted for redistribution and accelerated reform
Tax measures to encourage corporates to pay moredividends, raise wage or increase capex
Overhaul of the inflexible labour market
Regulatory reforms
Reform of the public pension system
Reform of the educational system
Nurturing the service sector
Economic democratisation (reform of chaebols)
Korea: Restructuring for stronger fundamentals
Non contractual document
15
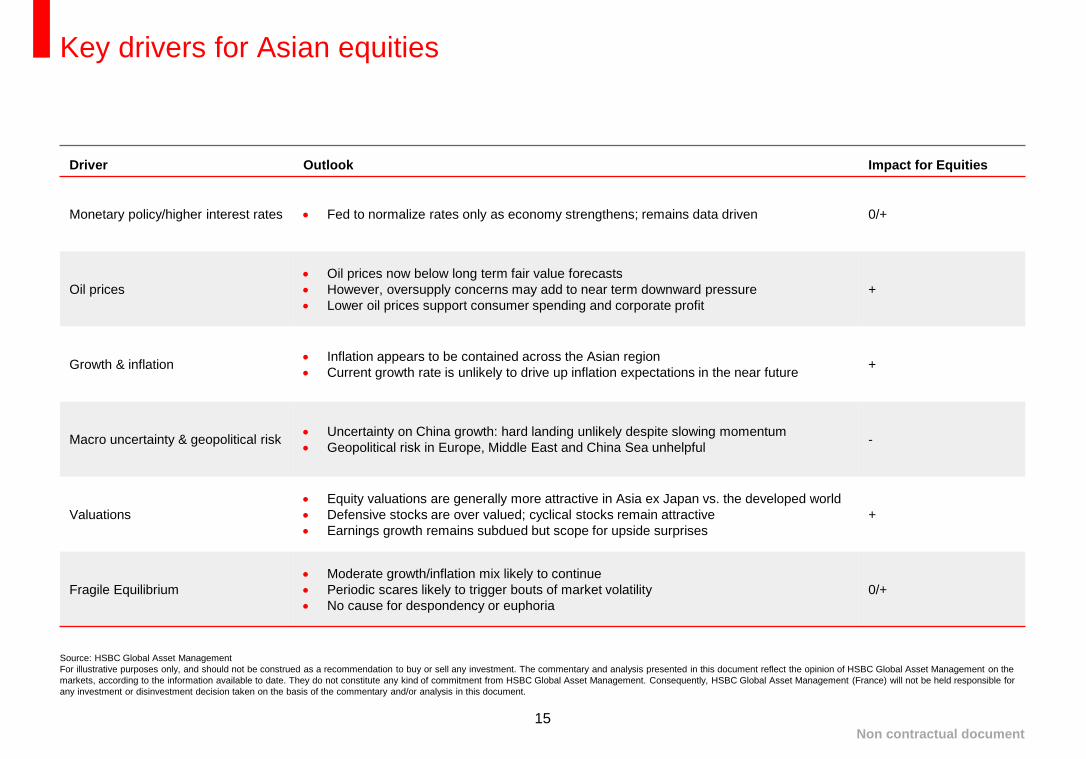
Key drivers for Asian equities
Driver Outlook Impact for Equities
Monetary policy/higher interest rates Fed to normalize rates only as economy strengthens; remains data driven 0/+
Oil prices Oil prices now below long term fair value forecasts However, oversupply concerns may add to near term downward pressure Lower oil prices support consumer spending and corporate profit
+
Growth & inflation Inflation appears to be contained across the Asian region Current growth rate is unlikely to drive up inflation expectations in the near future
+
Macro uncertainty & geopolitical risk Uncertainty on China growth: hard landing unlikely despite slowing momentum Geopolitical risk in Europe, Middle East and China Sea unhelpful
-
Valuations Equity valuations are generally more attractive in Asia ex Japan vs. the developed world Defensive stocks are over valued; cyclical stocks remain attractive Earnings growth remains subdued but scope for upside surprises
+
Fragile Equilibrium Moderate growth/inflation mix likely to continue Periodic scares likely to trigger bouts of market volatility No cause for despondency or euphoria
0/+
Source: HSBC Global Asset ManagementFor illustrative purposes only, and should not be construed as a recommendation to buy or sell any investment. The commentary and analysis presented in this document reflect the opinion of HSBC Global Asset Management on themarkets, according to the information available to date. They do not constitute any kind of commitment from HSBC Global Asset Management. Consequently, HSBC Global Asset Management (France) will not be held responsible forany investment or disinvestment decision taken on the basis of the commentary and/or analysis in this document.
Non contractual document
Where are the investment opportunities?
17
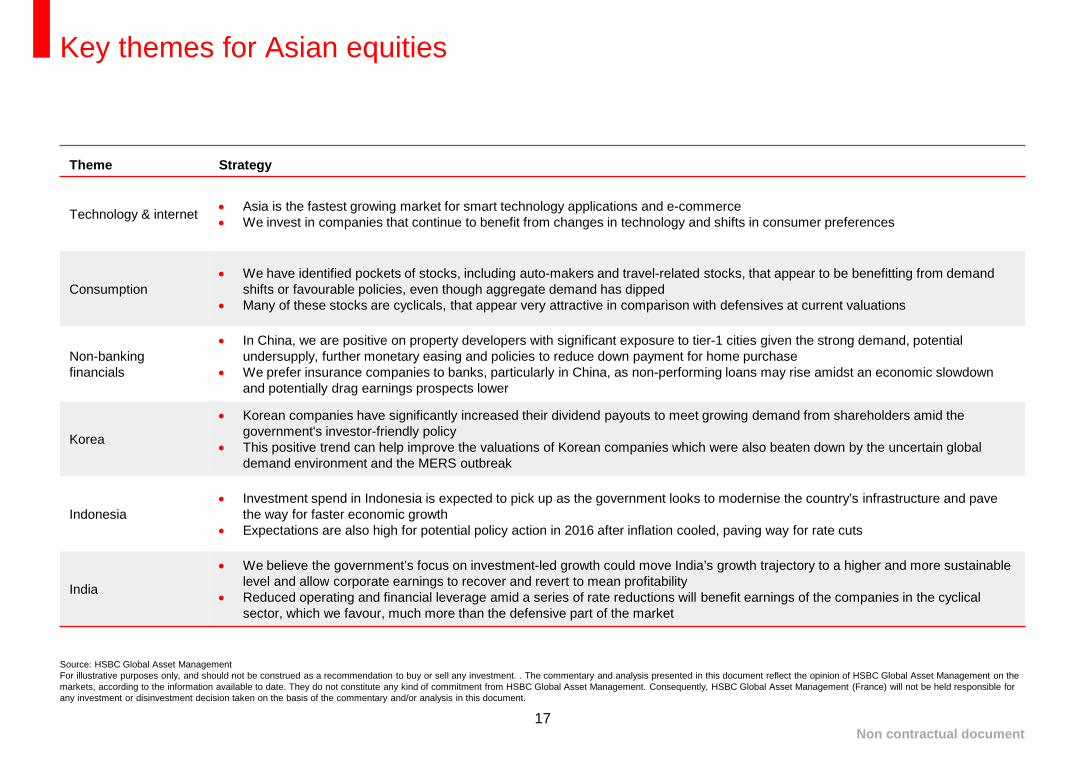
Key themes for Asian equities
Theme Strategy
Technology & internet Asia is the fastest growing market for smart technology applications and e-commerce We invest in companies that continue to benefit from changes in technology and shifts in consumer preferences
Consumption We have identified pockets of stocks, including auto-makers and travel-related stocks, that appear to be benefitting from demand
shifts or favourable policies, even though aggregate demand has dipped Many of these stocks are cyclicals, that appear very attractive in comparison with defensives at current valuations
Non-bankingfinancials
In China, we are positive on property developers with significant exposure to tier-1 cities given the strong demand, potentialundersupply, further monetary easing and policies to reduce down payment for home purchase
We prefer insurance companies to banks, particularly in China, as non-performing loans may rise amidst an economic slowdownand potentially drag earnings prospects lower
Korea
Korean companies have significantly increased their dividend payouts to meet growing demand from shareholders amid thegovernment's investor-friendly policy
This positive trend can help improve the valuations of Korean companies which were also beaten down by the uncertain globaldemand environment and the MERS outbreak
Indonesia Investment spend in Indonesia is expected to pick up as the government looks to modernise the country’s infrastructure and pave
the way for faster economic growth Expectations are also high for potential policy action in 2016 after inflation cooled, paving way for rate cuts
India
We believe the government’s focus on investment-led growth could move India’s growth trajectory to a higher and more sustainablelevel and allow corporate earnings to recover and revert to mean profitability
Reduced operating and financial leverage amid a series of rate reductions will benefit earnings of the companies in the cyclicalsector, which we favour, much more than the defensive part of the market
Source: HSBC Global Asset ManagementFor illustrative purposes only, and should not be construed as a recommendation to buy or sell any investment. . The commentary and analysis presented in this document reflect the opinion of HSBC Global Asset Management on themarkets, according to the information available to date. They do not constitute any kind of commitment from HSBC Global Asset Management. Consequently, HSBC Global Asset Management (France) will not be held responsible forany investment or disinvestment decision taken on the basis of the commentary and/or analysis in this document.
Non contractual document

18
Investment opportunityTechnology-enabled consumption: China
Source: CEIC, HSBC Global Asset Management, data as of September 2015. For illustrative purposes only and should not be construed as a recommendation to buy or sell any investment.
0
2
4
6
8
10
12
0.0
0.5
1.0
1.5
2.0
2.5
3.0
2007 2008 2009 2010 2011 2012 2013 2014
E-commerce (retail sales), rhs E-commerce (B2B), lhs
0
10
20
30
40
50
60
70
0
100
200
300
400
500
600
700
800
2006 2008 2010 2012 2014
No of Internet user (rural), lhs No of Internet user (urban), lhs
Internet penetration rate (rural), rhs Internet penetration rate (urban), rhs
In China’s 12th Five-Year Plan (2011-2015) includes plans to make China a global e-commerce leader
Smart technology and e-commerce are re-shaping the ways Chinese consumers purchase goods and services
The number of Internet users in China has grown rapidly, although the Internet penetration is still below 50%
The e-commerce market is becoming an increasinglyimportant channel for consumption The Internet market has grown rapidly
CNYtrn CNYtrn Million persons %
Non contractual document
19
Investment opportunityConsumption pick-up: India
Source: Bloomberg, HSBC Global Asset Management, data as of December 2015. For illustrative purposes only and should not be construed as a recommendation to buy or sell any investment.
1,200,000
1,300,000
1,400,000
1,500,000
1,600,000
1,700,000
1,800,000
1,900,000
130,000
140,000
150,000
160,000
170,000
180,000
190,000
200,000
Dec-1
2
Jan
-13
Feb-1
3
Mar-
13
Ap
r-13
May-
13
Jun
-13
Jul-1
3
Au
g-1
3
Se
p-1
3
Oct
-13
Nov-1
3
Dec-1
3
Jan
-14
Feb-1
4
Mar-
14
Ap
r-14
May-
14
Jun
-14
Jul-1
4
Au
g-1
4
Se
p-1
4
Oct
-14
Nov-1
4
Dec-1
4
Jan
-15
Feb-1
5
Mar-
15
Ap
r-15
May-
15
Jun
-15
Jul-1
5
Au
g-1
5
Se
p-1
5
Oct
-15
Nov-1
5
Dec-1
5
Car Sales (units) Two-wheeler sales (units)
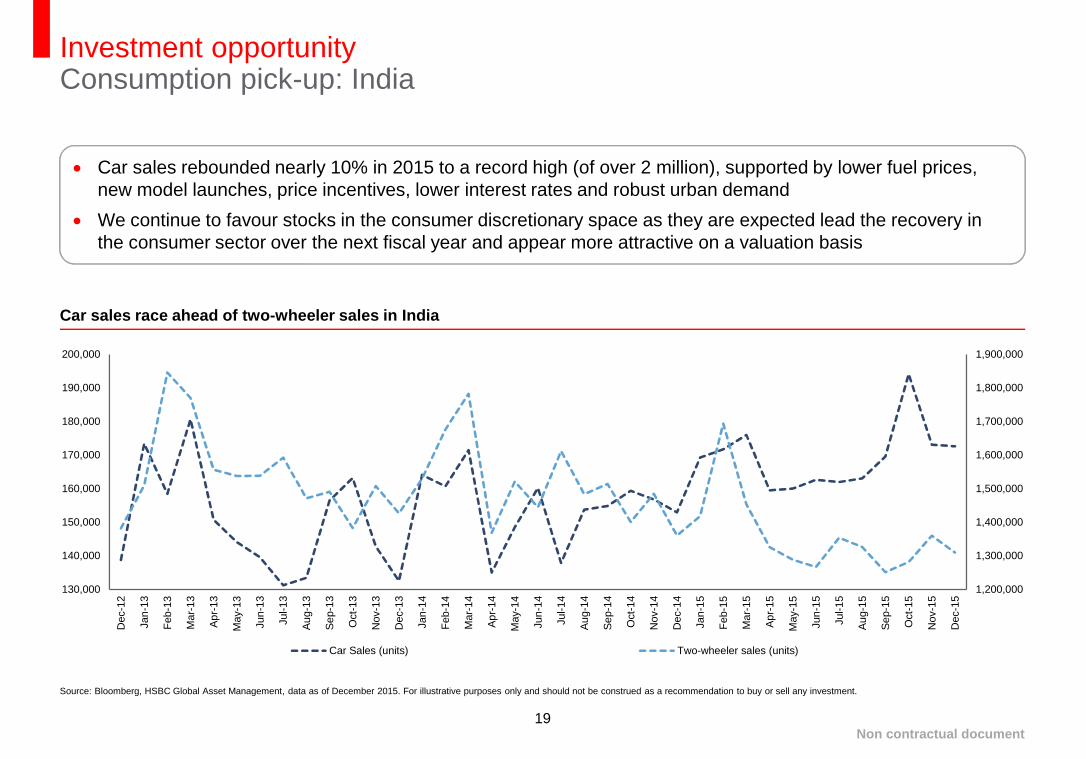
Car sales rebounded nearly 10% in 2015 to a record high (of over 2 million), supported by lower fuel prices,new model launches, price incentives, lower interest rates and robust urban demand
We continue to favour stocks in the consumer discretionary space as they are expected lead the recovery inthe consumer sector over the next fiscal year and appear more attractive on a valuation basis
Car sales race ahead of two-wheeler sales in India
Non contractual document

20
Investment opportunityReal Estate: Selective shortage in China
Source: Soufun, HSBC Global Asset Management, data as of November 2015. Any forecast, projection or target contained in this presentation is for information purposes only and is not guaranteed in any way. HSBC accepts noliability for any failure to meet such forecasts, projections or targets. For illustrative purposes only and should not be construed as a recommendation to buy or sell any investment.
Great divergence among different tiers in the Chinese property market
We expect undersupply in tier-1 cities in 2016
Demand supply imbalance has lead to double digit price growth in tier 1 cities in 2015
Demand/supply ratioCumulative ASP change since Jun-2005
Year to November (based on Soufun data)
Tier 1 17.4%
Tier 2 6.9%
Tier 3 -2%
Non contractual document
21
Investment opportunityKorea: Improved dividend payouts, inexpensive valuations
Source: Credit Suisse as of December 2015Any forecast, projection or target contained in this presentation is for information purposes only and is not guaranteed in any way. HSBC accepts no liability for any failure to meet such forecasts, projections or targets. For illustrative
purposes only and should not be construed as a recommendation to buy or sell any investment.
0.0%
0.5%
1.0%
1.5%
2.0%
2.5%
3.0%
3.5%
4.0%
4.5%
Chin
a
Hong
Kon
g
India
Indonesi
a
Ko
rea
Mala
ysia
Ph
ilippin
es
Sin
ga
pore
Taiw
an
Thaila
nd
Asia
ex
Japan
2013 2014 2015e
-5%
5%
15%
25%
35%
45%
55%
65%
Chin
a
Hong
Kon
g
India
Indonesi
a
Ko
rea
Mala
ysia
Ph
ilippin
es
Sin
ga
pore
Taiw
an
Thaila
nd
Asia
ex
Japan
2013 2014 2015e
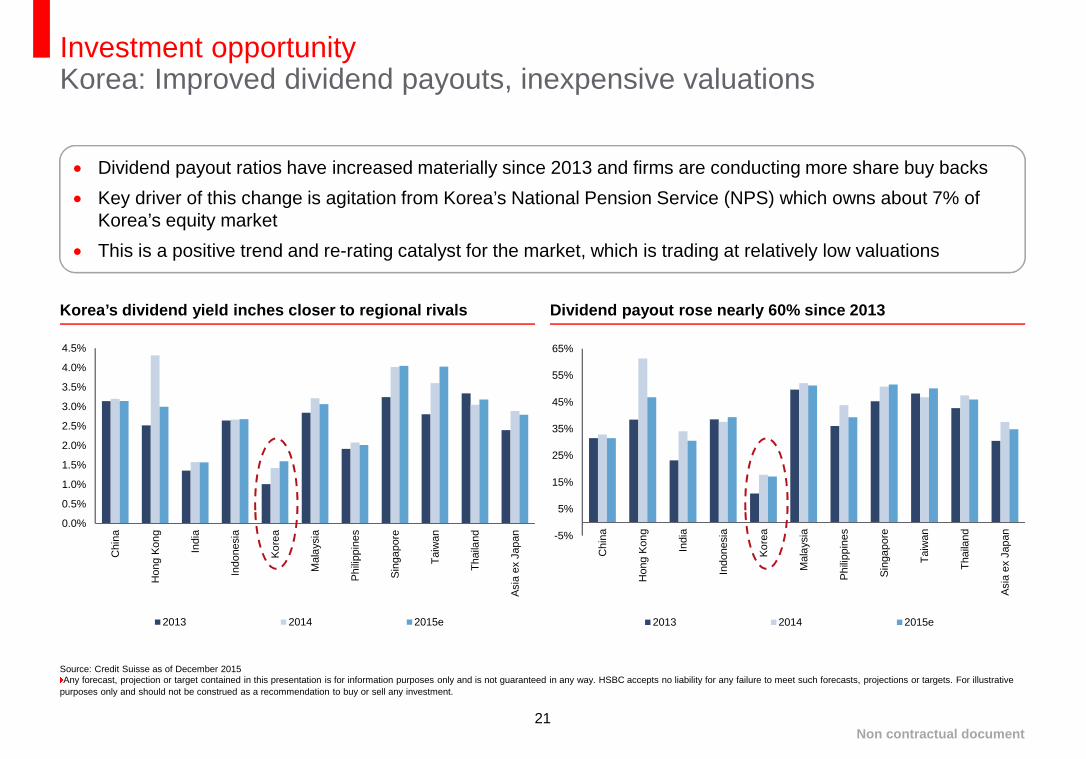
Dividend payout ratios have increased materially since 2013 and firms are conducting more share buy backs
Key driver of this change is agitation from Korea’s National Pension Service (NPS) which owns about 7% ofKorea’s equity market
This is a positive trend and re-rating catalyst for the market, which is trading at relatively low valuations
Korea’s dividend yield inches closer to regional rivals Dividend payout rose nearly 60% since 2013
Non contractual document
22
Investment opportunityIndonesia: Increased capex spending, rate cuts
Source: CEIC, Morgan Stanley as of December 2015. For illustrative purposes only and should not be construed as a recommendation to buy or sell any investment.
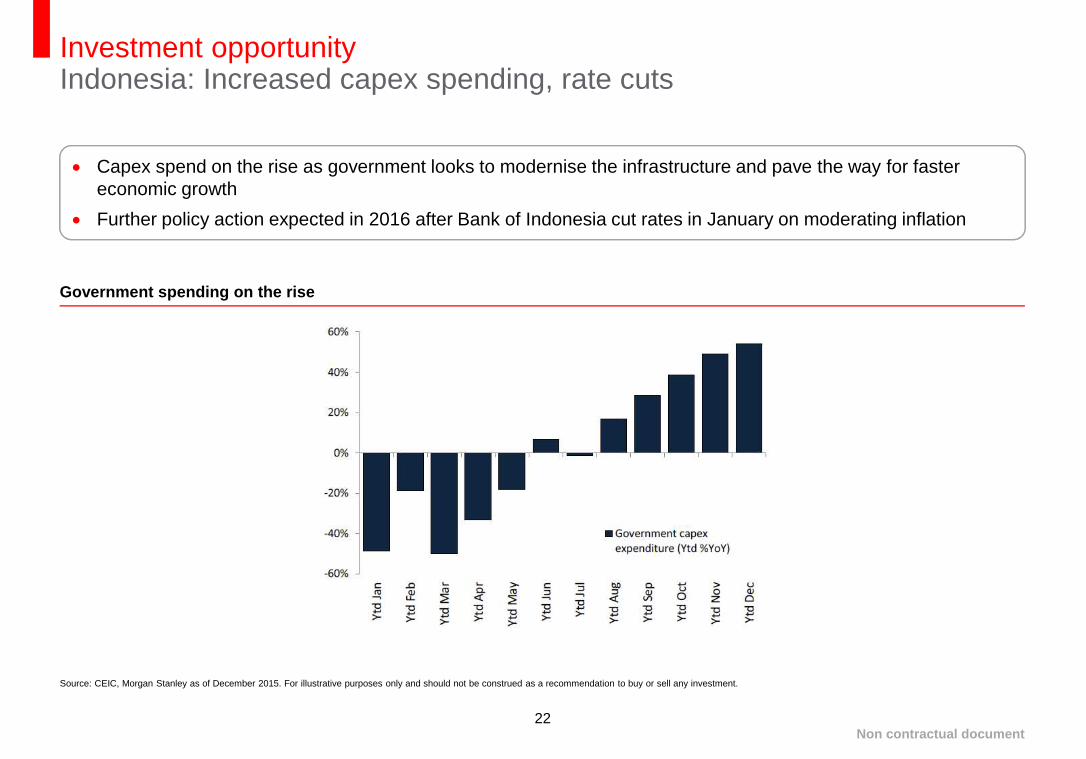
Capex spend on the rise as government looks to modernise the infrastructure and pave the way for fastereconomic growth
Further policy action expected in 2016 after Bank of Indonesia cut rates in January on moderating inflation
Government spending on the rise
Non contractual document

23
Investment opportunityIndia: Cyclical recovery-led growth
Source: Morgan Stanley as of December 2015. For illustrative purposes only and should not be construed as a recommendation to buy or sell any investment.
Industrial production Passenger car sales
Pick-up in high frequency data, including industrial production, consumption and capex, indicate that a cyclicalrecovery is underway, albeit at a slower pace than previously anticipated
Corporate earnings are expected to bounce back off their low base amid the ongoing growth recovery, reducedreal rates and other favourable macro economic factors that have put India in an advantageous position vis-à-vis other emerging markets
Improved high frequency data suggests recovery in domestic demand
Non contractual document
Focus on Asia ex Japan Small Caps

25
Asia ex-Japan small caps outperform the broad index over time…
Small caps tend to outperform in Asia over the long term
Asset class can underperform the broad index significantly in periods of extreme crisis
– Eg 1997 Asian financial crisis, 2000 bursting technology bubble, 2008 Global financial crisis
However, small caps are not just a bull market investment
Source: Bloomberg, data as at end-January 2016. For illustrative purposes only and does not constitute any investment recommendation. Past performance is not indicative of future performance
50
100
150
200
250
300
350
400
Jan-01 Jan-02 Jan-03 Jan-04 Jan-05 Jan-06 Jan-07 Jan-08 Jan-09 Jan-10 Jan-11 Jan-12 Jan-13 Jan-14 Jan-15 Jan-16
MSCI Asia ex Japan MSCI Asia ex Japan Small Cap
Performance of small cap index vs broad index since the technology bubble, indexed at 100
Non contractual document

26
In 2015, Asia ex Japan small caps outperformed their large cap peers, despite the challenging investmentenvironment
The outperformance also highlights the diversification benefits of including Asia ex Japan small caps in aninvestor's broader portfolio
…and periodically amidst heightened volatility
Source: Bloomberg, data as of December 2015. For illustrative purposes only and does not constitute any investment recommendation. Past performance is not indicative of future performance
80
85
90
95
100
105
110
115
120
Dec-14 Jan-15 Feb-15 Mar-15 Apr-15 May-15 Jun-15 Jul-15 Aug-15 Sep-15 Oct-15 Nov-15 Dec-15
MSCI Asia ex Japan Small Cap MSCI Asia ex Japan
Small caps beat out large caps in 2015
Non contractual document
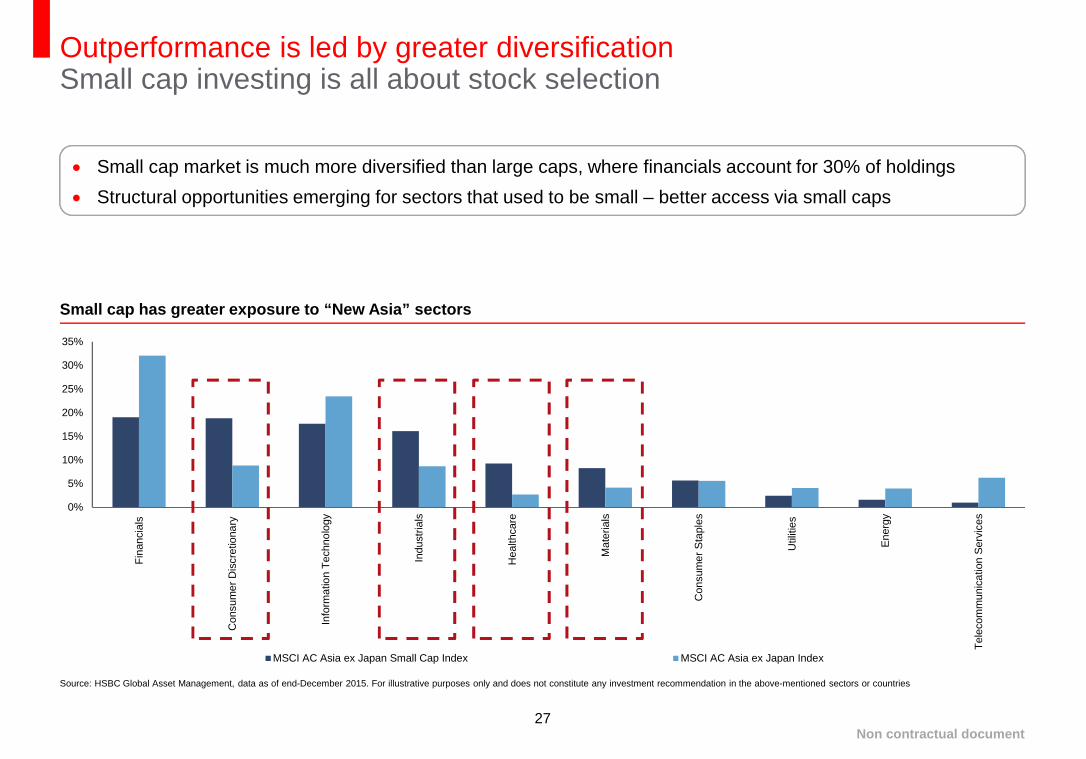
27
Small cap market is much more diversified than large caps, where financials account for 30% of holdings
Structural opportunities emerging for sectors that used to be small – better access via small caps
0%
5%
10%
15%
20%
25%
30%
35%
Fin
anci
als
Consum
er
Dis
cre
tiona
ry
Info
rmatio
nT
ech
no
logy
Indust
rials
Healthca
re
Mate
rials
Consum
er
Sta
ple
s
Util
itie
s
Energ
y
Tele
com
munic
atio
nS
erv
ices
MSCI AC Asia ex Japan Small Cap Index MSCI AC Asia ex Japan Index
Outperformance is led by greater diversificationSmall cap investing is all about stock selection
Source: HSBC Global Asset Management, data as of end-December 2015. For illustrative purposes only and does not constitute any investment recommendation in the above-mentioned sectors or countries
Small cap has greater exposure to “New Asia” sectors
Non contractual document

28
Small cap investing is all about stock selectionGreat inefficiency = great opportunity
Notes: Small caps are defined as stocks with market cap>$100 million but <$2 billion1. Stock with 3 or more analysts covering it.Any forecast, projection or target contained in this presentation is for information purposes only and is not guaranteed in any way. HSBC accepts no liability for any failure to meet such forecasts, projections or targets. For illustrativepurpose onlySource: Macquarie Research, data as of July 2015. For illustrative purposes only and does not constitute any investment recommendation. Past performance is not indicative of future performance
Activecoverage =
73.6%
0
1,000
2,000
3,000
4,000
5,000
6,000
7,000
Asia ex Japan Europe USA
Total no. small cap stocks Active sell-side coverage*
Activecoverage =
54.2%
Activecoverage =
34.6%
No. of stocks
Brokerage firms often emphasise large cap over small cap research
This lack of coverage is particularly stark in Asia and this creates inefficiencies – and opportunities
Fundamental research by experienced analysts is crucial
Small cap investing is about identifying and investing early in attractive companies
Lack of sell-side analyst coverage on Asia ex Japan small caps
1
Non contractual document

29
Outlook for automotive semiconductor revenue remains positive as semiconductor content per automobile is ona rising trend
Driven by increasing customer focus on safety, advanced driver assistance system (ADAS) products will helpdrive a structural growth story for the sector within the region
Stricter Corporate Average Fuel Economy (CAFE) in the US, reaching 35.5mg by 2016 and 54.5mg by 2025,should create incremental demand for greener and fuel-efficient vehicles
Investment opportunitiesAuto components
Source: Edmunds .com, data as at September 2014. For illustrative purposes only and does not constituteinvestment advice
Source: KPMG, Infineon, JP Morgan estimates, data as at July 2014. For illustrative purposes only and does notconstitute investment advice. Any forecast, projection or target contained in this presentation is for informationpurposes only and is not guaranteed in any way. HSBC accepts no liability for any failure to meet such forecasts,projections or targets
Rising trend for semiconductor content per automobile CAFE timeline
280
900
425
750
2,000
0
500
1,000
1,500
2,000
2,500
Conventional Electric Autonomous Car
2011 2020
Semis content in Evs is 3.0x worth of that in ICE-cars
Non contractual document
30
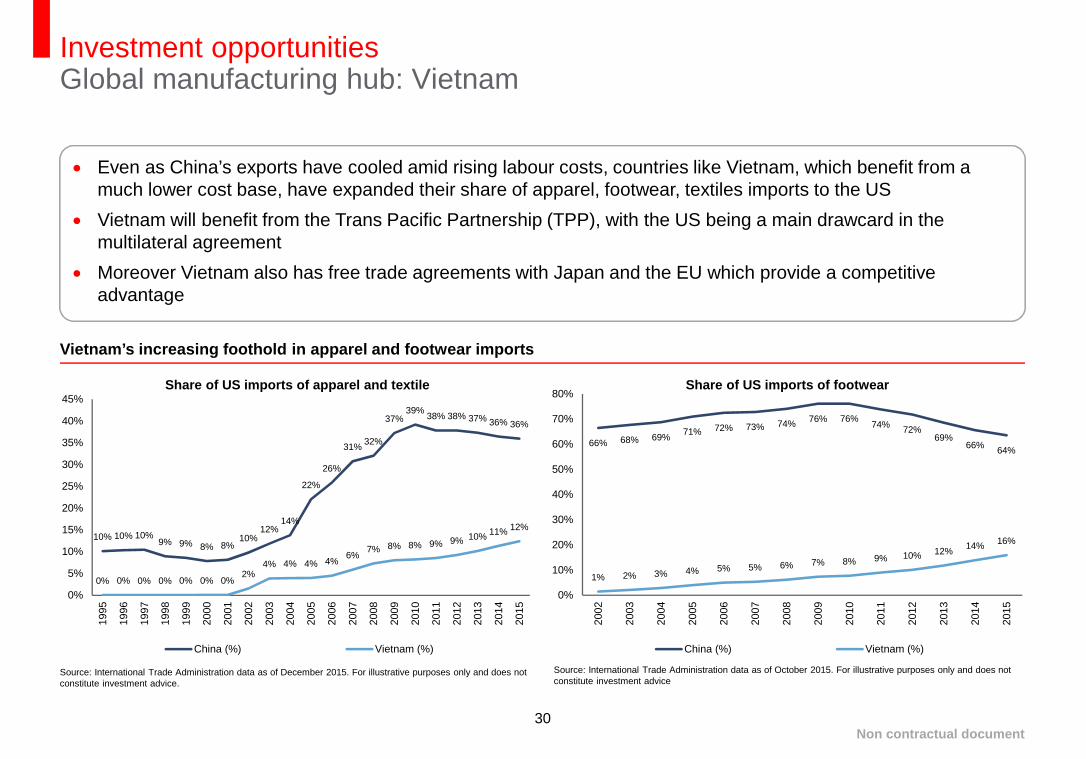
Even as China’s exports have cooled amid rising labour costs, countries like Vietnam, which benefit from amuch lower cost base, have expanded their share of apparel, footwear, textiles imports to the US
Vietnam will benefit from the Trans Pacific Partnership (TPP), with the US being a main drawcard in themultilateral agreement
Moreover Vietnam also has free trade agreements with Japan and the EU which provide a competitiveadvantage
Investment opportunitiesGlobal manufacturing hub: Vietnam
Source: International Trade Administration data as of October 2015. For illustrative purposes only and does notconstitute investment advice
Source: International Trade Administration data as of December 2015. For illustrative purposes only and does notconstitute investment advice.
10% 10% 10%9% 9% 8% 8%
10%12%
14%
22%
26%
31%32%
37%39%
38% 38% 37% 36% 36%
0% 0% 0% 0% 0% 0% 0%2%
4% 4% 4% 4%6%
7% 8% 8% 9% 9% 10%11% 12%
0%
5%
10%
15%
20%
25%
30%
35%
40%
45%
1995
1996
1997
1998
1999
2000
2001
2002
2003
2004
2005
2006
2007
2008
2009
2010
2011
2012
2013
2014
2015
Share of US imports of apparel and textile
China (%) Vietnam (%)
66% 68% 69%71% 72% 73% 74%
76% 76%74%
72%69%
66%64%
1% 2% 3% 4% 5% 5% 6% 7% 8% 9% 10% 12%14%
16%
0%
10%
20%
30%
40%
50%
60%
70%
80%
2002
2003
2004
2005
2006
2007
2008
2009
2010
2011
2012
2013
2014
2015
Share of US imports of footwear
China (%) Vietnam (%)
Vietnam’s increasing foothold in apparel and footwear imports
Non contractual document
31
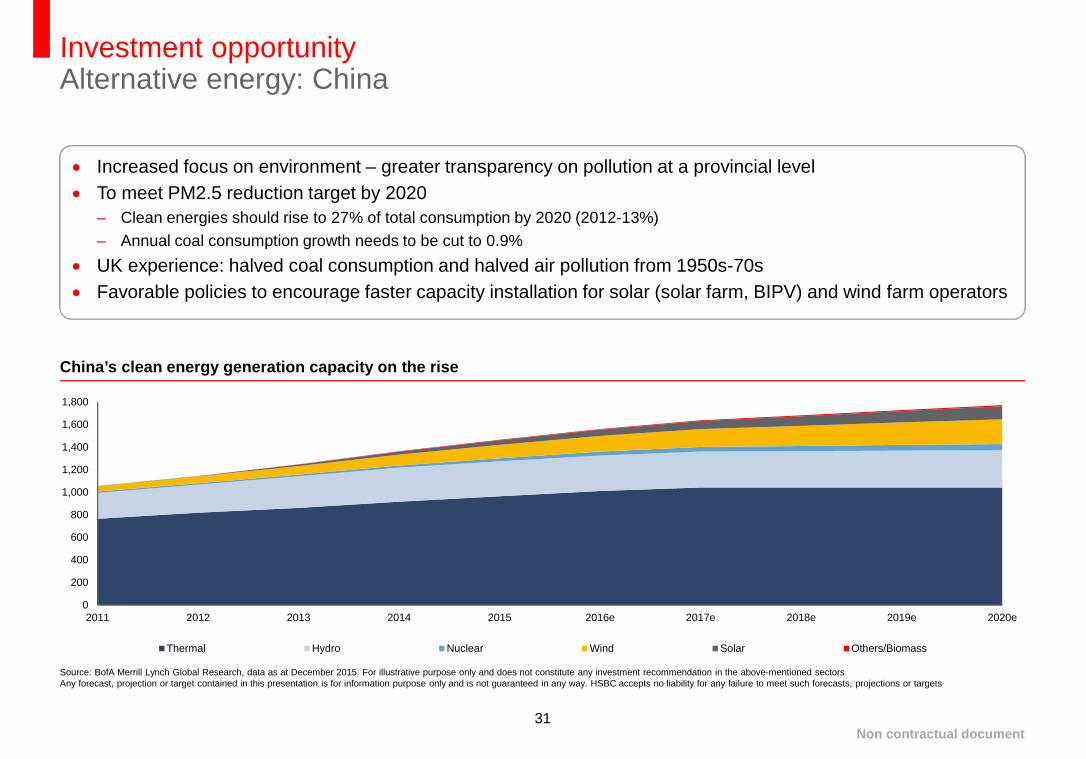
Increased focus on environment – greater transparency on pollution at a provincial level
To meet PM2.5 reduction target by 2020
– Clean energies should rise to 27% of total consumption by 2020 (2012-13%)
– Annual coal consumption growth needs to be cut to 0.9%
UK experience: halved coal consumption and halved air pollution from 1950s-70s
Favorable policies to encourage faster capacity installation for solar (solar farm, BIPV) and wind farm operators
Investment opportunityAlternative energy: China
Source: BofA Merrill Lynch Global Research, data as at December 2015. For illustrative purpose only and does not constitute any investment recommendation in the above-mentioned sectorsAny forecast, projection or target contained in this presentation is for information purpose only and is not guaranteed in any way. HSBC accepts no liability for any failure to meet such forecasts, projections or targets
0
200
400
600
800
1,000
1,200
1,400
1,600
1,800
2011 2012 2013 2014 2015 2016e 2017e 2018e 2019e 2020e
Thermal Hydro Nuclear Wind Solar Others/Biomass
China’s clean energy generation capacity on the rise
Non contractual document

32
Indian government has announced massive capacity addition targets – Scale up to 100,000 MW solar powerand 60,000 MW wind energy capacity by 2022
If achieved, this will put India among the top two renewable energy markets in the world, alongside China
Government plans to implement large-scale and small-scale solar and wind energy projects throughout thecountry through competitive auctions
Investment opportunityAlternative energy: India
Source: Deutsche Bank data as at December 2015. For illustrative purpose only and does not constitute any investment recommendation in the above-mentioned sectorsAny forecast, projection or target contained in this presentation is for information purpose only and is not guaranteed in any way. HSBC accepts no liability for any failure to meet such forecasts, projections or targets
24,376
60,000
4,347
100,000
0
20,000
40,000
60,000
80,000
100,000
120,000
Nov 15 2022 end
Wind Solar
CAGR – 14%
CAGR – 57%
E
India to step up alternative energy generation
Mega Watts (MW)
Non contractual document

33
Over the last two years the number of projects awarded has picked up in urban infrastructure segments suchas roads, buildings and metro projects
Given Modi government’s thrust on the infrastructure investment, we expect capex on urban infrastructureprojects to continue expanding
Investment opportunityUrban construction: India
Note:1. Y-o-y compares March-December 2015 with corresponding period of 2014Source: Emkay Research, data as at December 2015. For illustrative purpose only and does not constitute any investment recommendation in the above-mentioned sectorsAny forecast, projection or target contained in this presentation is for information purpose only and is not guaranteed in any way. HSBC accepts no liability for any failure to meet such forecasts, projections or targets. The commentaryand analysis presented in this document reflect the opinion of HSBC Global Asset Management on the markets, according to the information available to date. They do not constitute any kind of commitment from HSBC Global AssetManagement. Consequently, HSBC Global Asset Management (France) will not be held responsible for any investment or disinvestment decision taken on the basis of the commentary and/or analysis in this document.
Road projects awarded up 152.5% y-o-y1
Pick-up in National Highways Authority of India (NHAI)projects awarded
4,663
1,7351,234
643
3,360
5,058
6,380
1,1161,436
3,447
2,721
0
1,000
2,000
3,000
4,000
5,000
6,000
7,000
FY 06 FY 07 FY 08 FY 09 FY 10 FY 11 FY 12 FY 13 FY 14 FY 15 YTDFY 16
Length awarded
(Km)
Non contractual document
34
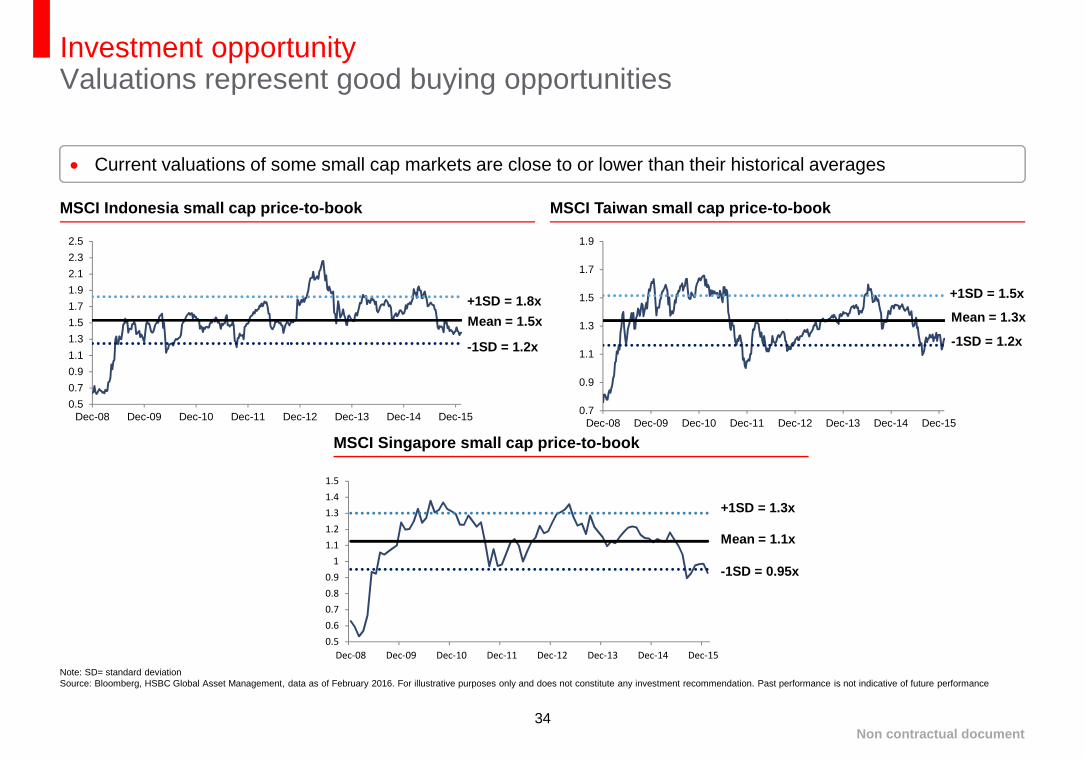
Investment opportunityValuations represent good buying opportunities
Note: SD= standard deviationSource: Bloomberg, HSBC Global Asset Management, data as of February 2016. For illustrative purposes only and does not constitute any investment recommendation. Past performance is not indicative of future performance
MSCI Taiwan small cap price-to-bookMSCI Indonesia small cap price-to-book
MSCI Singapore small cap price-to-book
Current valuations of some small cap markets are close to or lower than their historical averages
+1SD = 1.8x
Mean = 1.5x
-1SD = 1.2x
+1SD = 1.5x
-1SD = 1.2x
Mean = 1.3x
+1SD = 1.3x
Mean = 1.1x
-1SD = 0.95x
0.7
0.9
1.1
1.3
1.5
1.7
1.9
Dec-08 Dec-09 Dec-10 Dec-11 Dec-12 Dec-13 Dec-14 Dec-15
0.5
0.7
0.9
1.1
1.3
1.5
1.7
1.9
2.1
2.3
2.5
Dec-08 Dec-09 Dec-10 Dec-11 Dec-12 Dec-13 Dec-14 Dec-15
0.5
0.6
0.7
0.8
0.9
1
1.1
1.2
1.3
1.4
1.5
Dec-08 Dec-09 Dec-10 Dec-11 Dec-12 Dec-13 Dec-14 Dec-15
Non contractual document

35
Investment opportunityCompelling valuations of HK/China equities
Source: Bloomberg. HSBC Global Asset Management . Data as of end January 2016. Past performance is not indicative of future performance.
0.58
1.41
1.22
0.83
1.06
0.87
0.5
0.6
0.7
0.8
0.9
1
1.1
1.2
1.3
1.4
1.5
Dec-08 Dec-09 Dec-10 Dec-11 Dec-12 Dec-13 Dec-14 Dec-15
P/B Average +1 SD -1SD
0.62
1.71
0.77
1.51
0.95
0.5
0.7
0.9
1.1
1.3
1.5
1.7
1.9
Dec-08 Dec-09 Dec-10 Dec-11 Dec-12 Dec-13 Dec-14 Dec-15
P/B Average +1SD -1SD
HK-listed Chinese and Hong Kong small caps are trading at very inexpensive valuations relative to their ownhistory and many of their larger cap counterparts (MSCI China – 1.2x P/B, MSCI Hong Kong – 1.05x P/B)
As small caps listed in Hong Kong form a very diversified universe of stocks, we can gain exposure tointeresting growth stories in China without buying into the A-share market
MSCI China Small Cap Price-to-book (x) MSCI Hong Kong Small Cap Price-to-book (x)
Non contractual document

Key risks and disclosures
37
Key risks
Investor sentiment may be susceptible to macro concerns
Investor should be reminded that investment in some of the developing Asian countries may involve specialconsiderations and risks. Below could affect adversely the economies of such countries or the value of theinvestment
– Political changes
– Government regulation
– Social instability
– Diplomatic development
– Global economic development etc
Emerging markets can be significantly more volatile than developed markets, so that the value of investmentsmay be subject to larger fluctuations
Currency movement and market condition may affect the value of investments
Non contractual document
38
Important information
This presentation is distributed by HSBC Global Asset Management (France) and is only intended for professional investors as defined by MIFID.The information contained herein is subject to change without notice. Allnon-authorised reproduction or use of this commentary and analysis will be the responsibility of the user and will be likely to lead to legal proceedings. This document has no contractual value and is not by any meansintended as a solicitation, nor a recommendation for the purchase or sale of any financial instrument in any jurisdiction in which such an offer is not lawful. The commentary and analysis presented in this document reflectthe opinion of HSBC Global Asset Management on the markets, according to the information available to date. They do not constitute any kind of commitment from HSBC Global Asset Management. Consequently,HSBC Global Asset Management (France) will not be held responsible for any investment or disinvestment decision taken on the basis of the commentary and/or analysis in this document. Any forecast, projection ortarget where provided is indicative only and is not guaranteed in any way. HSBC Global Asset Management (France) accepts no liability for any failure to meet such forecast, projection or target.
All data from HSBC Global Asset Management (France) unless otherwise specified. Any third party information has been obtained from sources we believe to be reliable, but which we have not independently verified.
The performance figures displayed in the document relate to the past and past performance should not be seen as an indication of future returns. It is important to remember that the value of investments and any incomefrom them can go down as well as up and is not guaranteed. Capital is not guaranteed. Where overseas investments are held the rate of exchange may cause the value to go down as well as up. Investments inemerging markets are by their nature higher risk and potentially more volatile than those inherent in established markets. Funds that invest in securities listed on a stock exchange or market could be affected by generalchanges in the stock market. The value of investments can go down as well as up due to equity markets movements. Small and mid cap markets are occasionally affected by a temporary lack of liquidity; they may besubject to greater fluctuations than large cap markets and be more difficult for the fund manager to buy or sell.
Source: MSCI. The MSCI information may only be used for your internal use, may not be reproduced or redisseminated in any form and may not be used to create any financial instruments or products or any indices.The MSCI information is provided on an 'as is' basis and the user of this information assumes the entire risk of any use it may make or permit to be made of this information. Neither MSCI, any of its affiliates or any otherperson involved in or related to compiling, computing or creating the MSCI information (collectively, the 'MSCI Parties') makes any express or implied warranties or representations with respect to such information or theresults to be obtained by the use thereof, and the MSCI Parties hereby expressly disclaim all warranties (including, without limitation, all warranties of originality, accuracy, completeness, timeliness, non-infringement,merchantability and fitness for a particular purpose) with respect to this information. Without limiting any of the foregoing, in no event shall any MSCI Party have any liability for any direct, indirect, special, incidental,punitive, consequential or any other damages (including, without limitation, lost profits) even if notified of, or if it might otherwise have anticipated, the possibility of such damages.
Important information for Luxembourg investors: HSBC entities in Luxembourg are regulated and authorised by the Commission de Surveillance du Secteur Financier (CSSF).
Important information for Swiss investorsThis presentation is intended exclusively towards qualified investors in the meaning of Art. 10 para 3, 3bis and 3ter of the Federal Collective Investment SchemesAct (CISA).
The above document has been approved for distribution/issue by the following entities :
HSBC Global Asset Management (France)
421 345 489 RCS Nanterre. Portfolio management company authorised by the French regulatory authority AMF (no. GP99026) with capital of 8.050.320 euros. Postal address: 75419 Paris cedex 08,France.Offices: Immeuble Coeur Défense, 110, esplanade du Général Charles de Gaulle, 92400 Courbevoie - La Défense 4 . (Website: www.assetmanagement.hsbc.com/fr).
HSBC Global Asset Management (Switzerland) Limited
Bederstrasse 49, P.O. Box, CH-8027 Zurich, Switzerland (Website: www.assetmanagement.hsbc.com/ch)
Non contractual document, updated in February 2016 - AMFR_Ext_89_2016
Copyright © 2016. HSBC Global Asset Management (France). All rights reserved.