asia investment management coo survey 2015 - pwc pacific asset management leader ... asia investment...
TRANSCRIPT
Asia Investment Management COO Survey 2015
trade s gtrades g
investment management consul�ng

2
Justin OngAsia Pacific Asset Management LeaderPwC Singapore
The Investment Management industry is at a crossroads. A major transition is underway with the rapid growth of wealth in Asia, the rise of passive players, the compression of operating margins and increased regulations. In this highly complex and competitive landscape, the role of the Investment Management COO will grow in importance as strategic decisions on providing scalable product support, building or outsourcing major operational components and the adoption of best practices, will have a significant impact on a company’s development.
It is in this context that PwC and Stradegi have joined hands to conduct an annual Asia Investment Management COO survey, with the aim of understanding where the industry stands in terms of operational best practices, the priorities and challenges faced by COOs in Asia and the trends in operational outsourcing.
Over time, we hope to give investment managers insights into the competitive landscape and contribute to the improvement of the industry through greater sharing of best practices and trends.
Ultimately, the aim of having robust and efficient operations is to grow a higher degree of trust and healthy competition in the region. We welcome your feedback and comments on the results.
Foreword
Gordon Brown, CFA Managing PartnerStradegi Investment Management Consulting

Asia Investment Management COO Survey 2015 3
What are the priorities and challenges of the COOs in the coming years?
02Challenges
and priorities
Executive summary
The survey highlights that best practices in the back office are overlooked if not mandated by regulation, while asset managers have a tendency to focus more attention on the front and middle office. For an industry that wishes less regulation and more self-regulation, this is a concerning trend.
• It’s surprising to see that even some best practices that are recommended by regulators, such as establishing outsourcing oversight, are still not common practice in the industry.
• As a general rule, Asian players have a tendency to lag behind their global counterparts in best practice adoption. This trend is a threat to the competitiveness of Asian asset managers and could also be an indication of the different stages of maturity they are at.
• A majority of asset managers scored their operations higher than what is borne out by the actual adoption of best practices, as indicated on page 9.
• The drive for new products in new jurisdictions to meet new distribution channels, while at the same time being cost efficient, pose significant scalability challenges for COOs in the region.
• Data management is highlighted as the highest priority in managing performance and risk functions. This is especially relevant as Asian players aspire to incorporate performance and risk analytics into investment processes.
• Asian players have different priorities when it comes to performance and risk functions as compared to global players. Asian asset managers are still trying to establish the performance and risk functions, whereas global players are moving up the value chain and are looking to offer good fixed income attribution and robust reporting.
Where does the industry stand with regards to best practice adoption in investment operations?
01Best
practices
What are the key drivers of outsourcing decisions?
03Outsourcing
It comes as no surprise that meeting regulation and driving scalability are the top challenges voted by the COOs. The global impact of increased regulatory scrutiny and the need to reduce costs are common challenges faced by all financial institutions across the globe.
The survey results show that operational outsourcing, although low at the moment, is projected to grow. As asset managers strive to address operational scalability, the outsourcing option will always be on the agenda.
• Outsourcing budget allocation is currently under 20% of the overall operations and IT budgets for the majority of asset managers, but is expected to grow going forward.
• Asset managers are still not comfortable outsourcing front and middle office functions, but there seems to be an appetite to partially outsource some of them.
• Cost seems to be the main driver for Asian asset managers that influenced their decision to outsource whereas global players considered strategic significance of the function as the key driver for outsourcing.

4
The survey focused on three major markets in Asia, namely Hong Kong, Singapore and Malaysia. A total of 34 COOs participated in the survey. The survey questionnaire was prepared after we engaged 5 COOs in the region to ensure its relevance to the current industry demands and environment.
Most of the respondents this year were from Singapore, followed by Hong Kong and then Malaysia. We are cognisant that the Hong Kong and Malaysia numbers are not large enough to be statistically significant and therefore we have used the Asian vs. Global segmentation to form some meaningful themes on the differences between Asian and Global players.
44% of the respondents were from firms managing assets less than US $5bn, followed by almost a third (31%) managing assets between US $5bn and $50bn and the rest (25%) managing over US $50bn.
More than half (59%) of the asset managers follow a centralised or regional operational model. Almost 18% have mostly outsourced their operations.
Methodology and participant profile
Total
By Region of Operations
Asian 59%
Global 41%
By Asian HQ
Singapore 56%
Hong Kong 24%
Malaysia 15%
Japan 3%
No Asian HQ 3%
By Operating Model
Centralised 35%
Regional 24%
Mostly or Completely Outsourced 18%
Hub & Spoke 12%
Federated 9%
Partly Outsourced, Partly Internal 3%
$5 Bn or
below 44%
$5 - 20 Bn 20%
$20-50 Bn 9%
$50-100 Bn 9%
$100- 300 Bn 12%
$300Bn – 1 Trillion 3%
N/A 3%
Figure 2. Respondents by asset under management (AUM) in Asia
Figure 1. Breakdown of survey respondents

Asia Investment Management COO Survey 2015 5
Best practices

6
If you look at the full value chain of asset management functions, (if) there are 28 functions, 15 of them are back office. People forget that.
Rob Scott, Head of International Operations, Asia-based Global Asset Management Company, AUM USD 160+ Billion
Best practices are often overlooked in the back office
Back office Yes No N/A%
Do you have a project prioritisation committee?
Is there a technical development governance framework?
Are internal service levels documented, regularly measured and reported?
Do you have an outsourcing oversight process and committee?
Is there a process to define fund jurisdictional structures?
Is there a project management governance framework?
Is there a data management governance process?
Do you have a valuation and pricing process and committee?
Is there an application to support governance framework?
Is there a pricing error accountability and escalation process?
Is there a valuation and performance error reporting process?
Is there an information security framework?
44% 53% 3%
53% 32% 15%
65% 29% 6%
62% 29% 9%
53% 26% 21%
59% 26% 15%
70% 24% 6%
82% 15% 3%
76% 12% 12%
85% 9% 6%
88% 6% 6%
91% 3% 6%
0% 10% 20% 30% 40% 50% 60% 70% 80% 90% 100%
65% 32% 3%
88% 9% 3%
97% 3%
100%
65% 6% 29%
97% 3%
Is there a transaction cost analysis (TCA) process to validate best execution?
Is there an internal research and due diligence process?
Is there a soft dollar oversight process?
Is there a broker empanelment process?
Is there a demonstrable investment risk management process?
Do you have segregation of roles and responsibilities in the front office?
Front office
0% 10% 20% 30% 40% 50% 60% 70% 80% 90% 100%100% 0%
62% 24% 15%
79% 21%
85% 12% 3%
85% 6% 9%
100%
Middle office Do you comply with the
Global Investment Performance Standards (GIPS)?
Do you run performance measurement and attribution analysis for all funds?
Is there an independent investment risk oversight process?
Is there a client onboarding process?
Is there a product approval process?
Is there a compliance oversight process?
0% 10% 20% 30% 40% 50% 60% 70% 80% 90% 100%
88% 3% 9%
Figure 3. Best practices adoption rate in back, middle and front offices
We asked the COOs to select the best practices implemented in their firms’ operations across front to back office. Although there was healthy adoption of best practices observed in front and middle office functions, there was a tendency to overlook best practices in the back office.
Best practices having low adoption rateBack office1 Project prioritisation
(53% no adoption)2 Technical development
governance (32%)3 Internal service levels (29%)4 Outsourcing oversight (29%)
Middle and front offices1 Middle office - Global
Investment Performance Standards (24% no adoption)
2 Front office – Transaction cost analysis (32%)

Asia Investment Management COO Survey 2015 7
Total Adoption
Rate (n=34)
Adoption Rate
(Asian AMs)
Adoption Rate
(Global AMs)
Front officeIs there a transaction cost analysis (TCA) process to validate best execution? 65% 50% 86%
Is there an internal research and due diligence process? 88% 85% 93%
Is there a soft dollar oversight process? 65% 55% 79%
Is there a demonstrable investment risk management process? 97% 95% 100%
Is there a broker empanelment process? 97% 95% 100%
Do you have segregation of roles and responsibilities in the front office? 100% 100% 100%
Middle office
Is there a compliance oversight process? 100% 100% 100%
Is there a product approval process? 88% 80% 100%
Is there a client onboarding process? 85% 80% 93%
Is there an independent investment risk oversight process? 85% 85% 86%
Do you run performance measurement and attribution analysis for all funds? 79% 75% 86%
Do you comply with the Global Investment Performance Standards (GIPS)? 62% 50% 79%
Back office
Is there an information security framework? 91% 85% 100%
Is there a valuation and performance error reporting process? 88% 85% 93%
Is there a pricing error accountability and escalation process? 85% 80% 93%
Is there an application support governance framework? 76% 75% 79%
Do you have a valuation and pricing process and committee? 82% 70% 100%
Is there a data management governance process? 71% 65% 79%
Is there a project management governance framework? 59% 45% 79%
Is there a process to define fund jurisdictional structures? 53% 30% 86%
Do you have an outsourcing oversight process and committee? 62% 60% 64%
Are internal service levels documented, regularly measured and reported? 65% 60% 71%
Is there a technical development governance framework? 53% 40% 71%
Do you have a project prioritisation committee? 44% 35% 57%
Not all practices recommended by regulators have been implemented
Regulated practice
Figure 4. Best practices adoption rate - Asian and Global averageIt’s a governance issue. Regardless of the size of the asset manager, managers need to assure they have the right governance in place to minimise risk. This is especially true given the increased regulatory focus on outsourcing globally.
Jeff Plein, COO, Fullerton Fund Management
Adoption rate of 60% and under
Unsurprisingly, there’s a higher degree of best practice adoption in functions mandated by the regulator and lower adoption rate in functions that are left to the company’s discretion.
Meanwhile, certain functions which demand best practice adoption and are recommended by the regulator, such as outsourcing oversight, are surprisingly overlooked by some participants.
These results also suggest the level of priority that are placed on the different offices within the firm. It remains to be seen whether regulators continue to drive adoption or asset managers take the initiative to implement these practices.

8
Figure 5. Best practices adoption rate by AUM in Asia
Above $5 bn
$5 bn or below
Asian players lag their global counterparts in adopting best practices Where Asian asset managers lag behind their global counterparts in operational best practices are:
• Process to define fund jurisdictional structures• Complying with Global Investment Performance
Standards (GIPS) • Transaction Cost Analysis (TCA) process• Project management governance framework.
TCA process is one of the functions in front office that is not widely adopted across asset managers. Smaller asset managers tend not to adopt this practice, and further breakdown by operating region (Asian vs Global) has proved our hypothesis true: for global players, TCA process is mandatory; in our sample size, global players had relatively larger AUM and thus adopting TCA process adds value to their operations.
In terms of having processes to define jurisdictional structures, global players need to distribute their funds into more markets and are hence more likely to have these structures than Asian players who target fewer markets.
Asian asset managers versus global players
Scale and maturity of companies are influencing factors for adoption of best practices The survey result in Figure 5 reveals that asset managers who manage more than $5 bn have significantly higher best practice adoption rates than those who manage less than $5 bn. This finding suggests a strong correlation between the scale of business and best practices adoption rate, mainly the bigger the business, the greater the complexity in operations which usually calls for greater need of best practice to ensure operational efficiency and regulatory compliance.
This could be due to the fact that the Asian managers are smaller in size and are yet to achieve scale; their priorities and customer base are also different. Global players have faced higher regulatory scrutiny and have had to adopt best practices to ensure consistency and scale across global platforms in order to mitigate operational risk. As Asian Asset Managers grow geographically and in size, the adoption of best practices will take on more importance.
61%
72%
83%
72%
67%
89%33%
33%
40%
40%
47%
20%
0% 20% 40% 60% 80% 100%
Project prioritisation committee
Complying with GIPS standards
Outsourcing oversight process and committee
Project management governance framework
Technical development governance framework
Soft dollar oversight process

Asia Investment Management COO Survey 2015 9
Front Office
Middle Office
Back Office
33% 50% 17%
83% 67% 42%
94% 83% 67%
88% 88% 79%
83% 78% 57%
83% 85% 80%
97% 100% 90%
Perception versus reality in adoption of best practices
74% of the responding asset managers rate their current business operations 7 or better, on a scale of 10.
None of the COOs gave their operations a perfect score of 10 or an extremely poor score of 1 or 2.
The best practice perception is overall in line with the detailed scoring. However, those who rated themselves 7 have relatively low adoption of best practices in the back office.
Practices which are marked as No or N/A are considered to be not implemented at the respondent’s organisation. Adoption rate is calculated by number of practices which are selected as Yes divided by the total number of best practices in the respective function.
Score out of 10
Rated by COOs
3 3%
4 3%
5 9%
6 12%
7 35%
8 24%
9 15%
Perception Actual Best Practice Adoption
Figure 6. On a scale of 1 to 10, 10 being best in class, how do you score your current business operations?

10
Challengesand priorities
Asia Investment Management COO Survey 2015 11
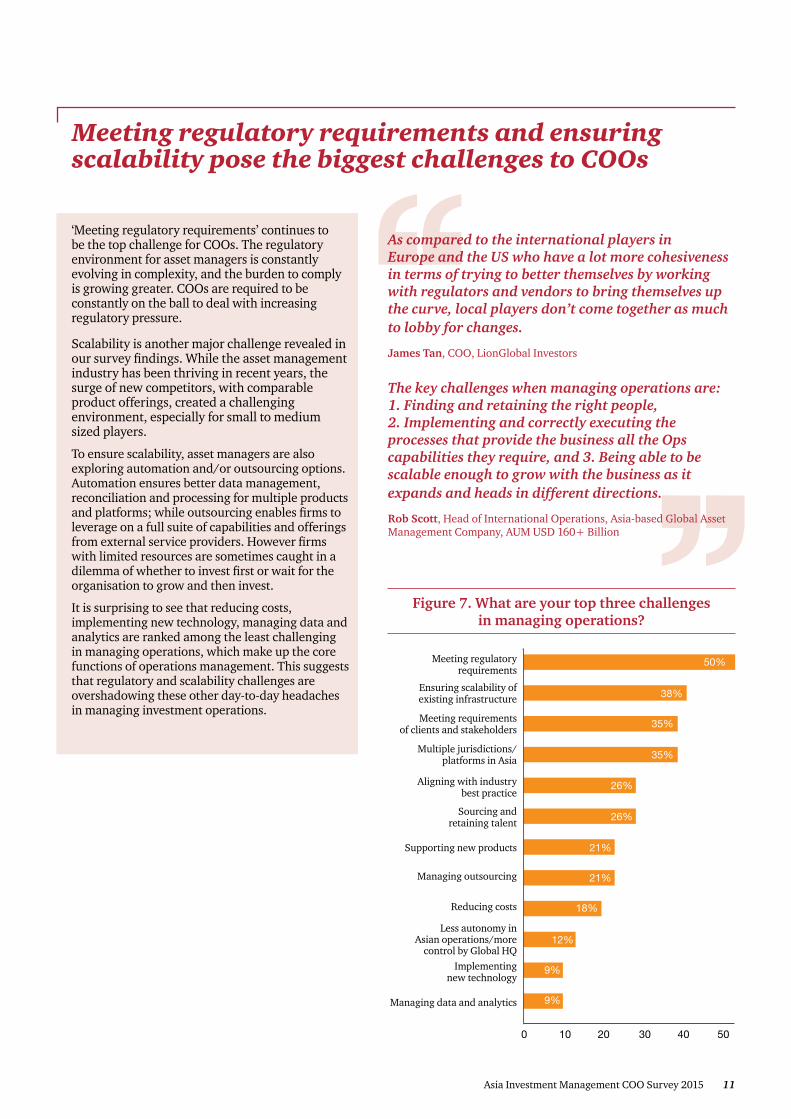
As compared to the international players in Europe and the US who have a lot more cohesiveness in terms of trying to better themselves by working with regulators and vendors to bring themselves up the curve, local players don’t come together as much to lobby for changes.
James Tan, COO, LionGlobal Investors
The key challenges when managing operations are: 1. Finding and retaining the right people, 2. Implementing and correctly executing the processes that provide the business all the Ops capabilities they require, and 3. Being able to be scalable enough to grow with the business as it expands and heads in different directions.
Rob Scott, Head of International Operations, Asia-based Global Asset Management Company, AUM USD 160+ Billion
Meeting regulatory requirements and ensuring scalability pose the biggest challenges to COOs
Figure 7. What are your top three challenges in managing operations?
0 10 20 30 40 50
50%Meeting regulatory requirements
Ensuring scalability of existing infrastructure
Meeting requirements of clients and stakeholders
Multiple jurisdictions/ platforms in Asia
Aligning with industry best practice
Sourcing and retaining talent
Supporting new products
Managing outsourcing
Reducing costs
Less autonomy in Asian operations/more
control by Global HQImplementing
new technology
Managing data and analytics
38%
35%
35%
26%
26%
21%
21%
18%
12%
9%
9%
‘Meeting regulatory requirements’ continues to be the top challenge for COOs. The regulatory environment for asset managers is constantly evolving in complexity, and the burden to comply is growing greater. COOs are required to be constantly on the ball to deal with increasing regulatory pressure.
Scalability is another major challenge revealed in our survey findings. While the asset management industry has been thriving in recent years, the surge of new competitors, with comparable product offerings, created a challenging environment, especially for small to medium sized players.
To ensure scalability, asset managers are also exploring automation and/or outsourcing options. Automation ensures better data management, reconciliation and processing for multiple products and platforms; while outsourcing enables firms to leverage on a full suite of capabilities and offerings from external service providers. However firms with limited resources are sometimes caught in a dilemma of whether to invest first or wait for the organisation to grow and then invest.
It is surprising to see that reducing costs, implementing new technology, managing data and analytics are ranked among the least challenging in managing operations, which make up the core functions of operations management. This suggests that regulatory and scalability challenges are overshadowing these other day-to-day headaches in managing investment operations.

12
The increasing demand for new products in new jurisdictions, coupled with the need to engage and use new distribution channels in a cost effective manner, pose significant challenges for COOs in the region.
Both retail and institutional investors are seeking not only performance from their portfolios, but also robust risk controls and customised services. Asset managers have to keep generating new product offerings, seek new distribution channels and markets. Firms serving predominantly institutional clients are also looking to target new markets and exhibit best practice investment processes.
The projected growth of wealth in Asia offers opportunities to asset managers, however it also invites increased competition to the market . The transaction in China where an e-commerce firm acquired an asset manager to offer a compelling product, is an example of how technology firms can leverage on their reach and lean operating model to disrupt the industry. Going forward, asset managers need to ensure that their operating model is not only robust and efficient, but also one that facilitates growth in a cost-effective manner.
Figure 8. What will be the top three drivers of change in your operations in the near term?
0 10 20 30 40 50 60 70
62%Launch of new products
Introduction of new distribution channels
Growth in existing distribution channels
Targeting new markets
Exhibiting best practice investment processes
Rising brand awareness
Liberal regulatory environment
Inorganic growth
Others
Launch of new products and distribution channels are ushering change in operations management
47%
44%
44%
38%
24%
18%
12%
6%

Asia Investment Management COO Survey 2015 13
Data management emerged as the biggest challenge when it comes to managing performance and risk functions
When asked about their top priorities in performance measurement (Figure 9) and risk analytics (Figure 10), COOs ranked data management as their number one concern for both areas, due to the fact that inaccurate and/or the lack of reliable data may have a negative impact on an asset managers’ decision-making, risk management, product development, regulatory compliance, and reporting functions. Specific to performance and risk functions, asset managers have to manage multiple data sources and unique valuation, pricing, performance and risk measurement requirements.
Clients and regulators are also prompting asset managers to deliver multiple reports. Hence, we see meeting reporting requirements and producing the appropriate analytics as top priorities.
Figure 9. What are your top three priorities in performancemeasurement and reporting in the near term?
Performance data management
Meeting reporting requirements
Inclusion of performance analytics in the investment process
Meeting performance disclosure requirements
Selecting the right solution
Fixed income attribution
Establishing an independent review process
Outsourcing of performance operations
Implementing GIPS
Investment and risk data management
Inclusion of risk analytics into investment process
Producing the appropriate analytics
Establishing an independent monitoring and oversight process
Selecting the right solution
Meeting risk reporting requirements
Defining the appropriate metrics
Outsourcing of risk analytics and reporting
62%
62%
44%
44%
32%
21%
21%
6%
9%
56%
56%
41%
38%
35%
32%
32%
6%
0 10 20 30 40 50 60 70
0 10 20 30 40 50 60
Figure 10. What are your top three priorities in risk analytics and reporting in the near term?
Most Asian organizations are smaller in terms of assets, staff, and maturity of business models. Many of the vendors’ capabilities are also evolving. Asian managers may not yet have the governance pressures nor the resources available to them to build risk functions to the extent of global competitors.
Jeff Plein, COO, Fullerton Fund Management
14
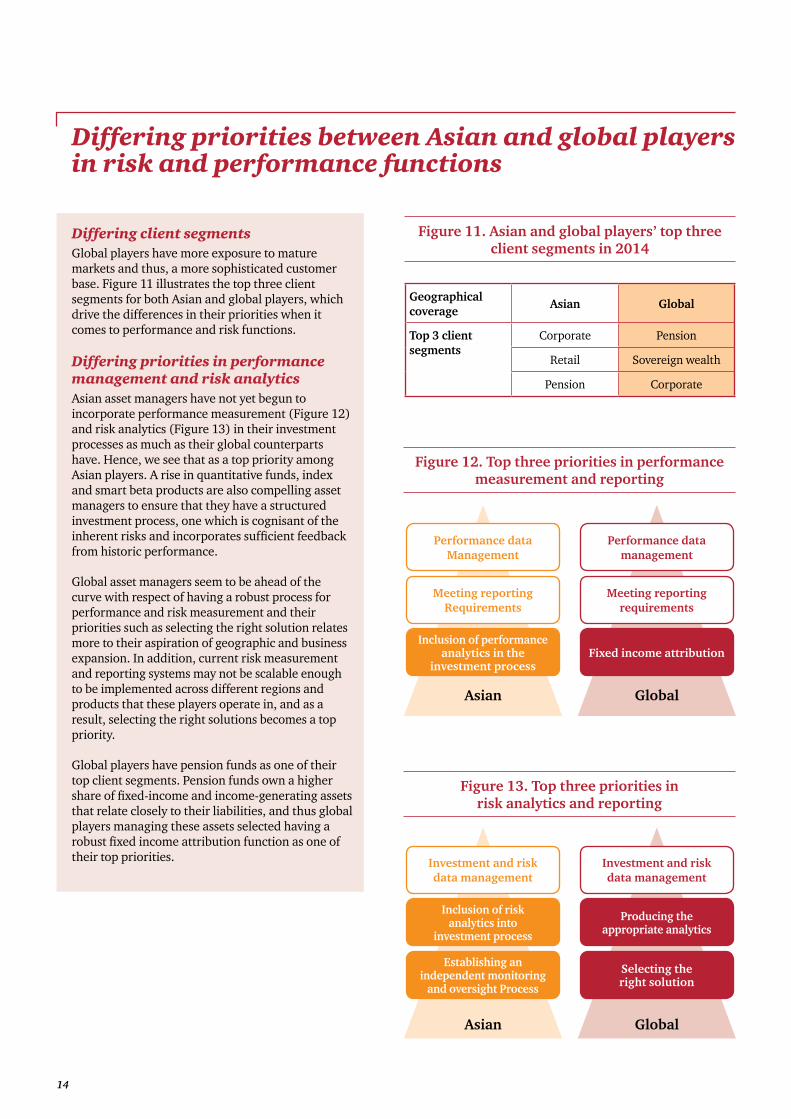
Differing client segments Global players have more exposure to mature markets and thus, a more sophisticated customer base. Figure 11 illustrates the top three client segments for both Asian and global players, which drive the differences in their priorities when it comes to performance and risk functions.
Differing priorities in performance management and risk analyticsAsian asset managers have not yet begun to incorporate performance measurement (Figure 12) and risk analytics (Figure 13) in their investment processes as much as their global counterparts have. Hence, we see that as a top priority among Asian players. A rise in quantitative funds, index and smart beta products are also compelling asset managers to ensure that they have a structured investment process, one which is cognisant of the inherent risks and incorporates sufficient feedback from historic performance.
Global asset managers seem to be ahead of the curve with respect of having a robust process for performance and risk measurement and their priorities such as selecting the right solution relates more to their aspiration of geographic and business expansion. In addition, current risk measurement and reporting systems may not be scalable enough to be implemented across different regions and products that these players operate in, and as a result, selecting the right solutions becomes a top priority.
Global players have pension funds as one of their top client segments. Pension funds own a higher share of fixed-income and income-generating assets that relate closely to their liabilities, and thus global players managing these assets selected having a robust fixed income attribution function as one of their top priorities.
Differing priorities between Asian and global players in risk and performance functions
Geographical coverage Asian Global
Top 3 client segments
Corporate Pension
Retail Sovereign wealth
Pension Corporate
Figure 13. Top three priorities in risk analytics and reporting
Figure 12. Top three priorities in performance measurement and reporting
Performance dataManagement
Meeting reportingRequirements
Inclusion of performanceanalytics in the
investment process
Performance datamanagement
Meeting reportingrequirements
Fixed income attribution
Asian Global
Investment and riskdata management
Inclusion of riskanalytics into
investment process
Establishing anindependent monitoring
and oversight Process
Investment and riskdata management
Producing the appropriate analytics
Selecting the right solution
Asian Global
Figure 11. Asian and global players’ top three client segments in 2014

Asia Investment Management COO Survey 2015 15
Outsourcing
16
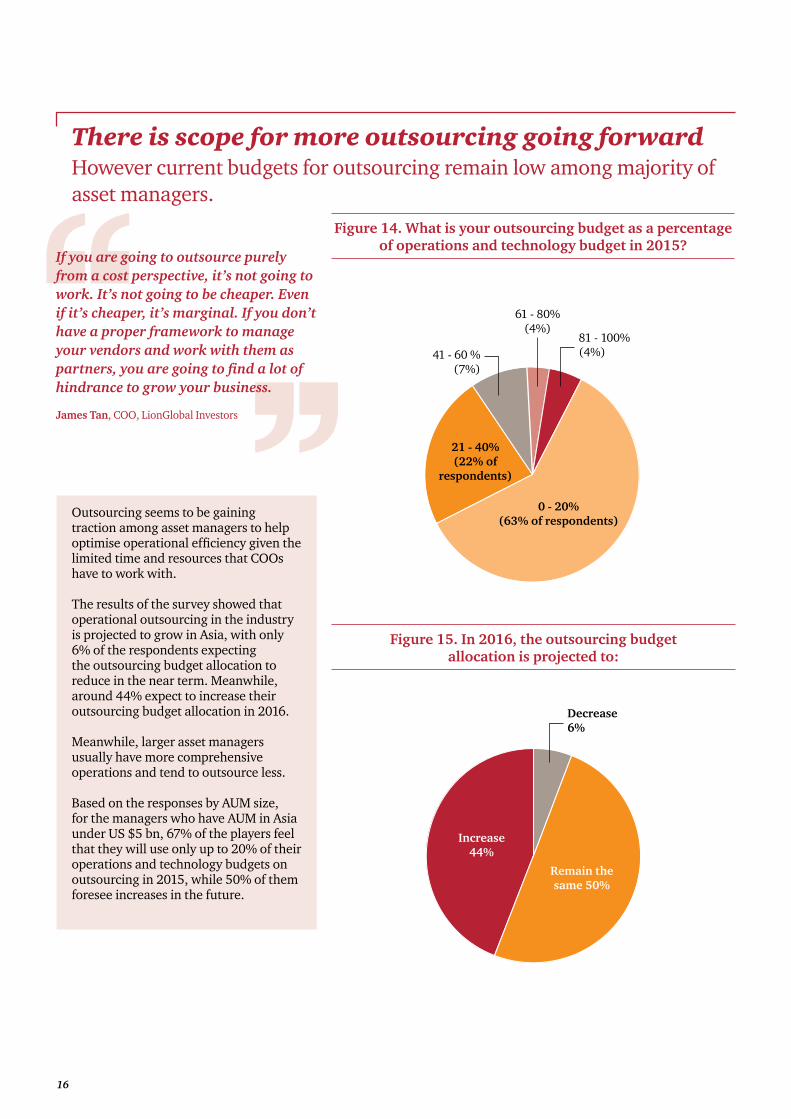
If you are going to outsource purely from a cost perspective, it’s not going to work. It’s not going to be cheaper. Even if it’s cheaper, it’s marginal. If you don’t have a proper framework to manage your vendors and work with them as partners, you are going to find a lot of hindrance to grow your business.
James Tan, COO, LionGlobal Investors
There is scope for more outsourcing going forward However current budgets for outsourcing remain low among majority of asset managers.
Outsourcing seems to be gaining traction among asset managers to help optimise operational efficiency given the limited time and resources that COOs have to work with.
The results of the survey showed that operational outsourcing in the industry is projected to grow in Asia, with only 6% of the respondents expecting the outsourcing budget allocation to reduce in the near term. Meanwhile, around 44% expect to increase their outsourcing budget allocation in 2016.
Meanwhile, larger asset managers usually have more comprehensive operations and tend to outsource less.
Based on the responses by AUM size, for the managers who have AUM in Asia under US $5 bn, 67% of the players feel that they will use only up to 20% of their operations and technology budgets on outsourcing in 2015, while 50% of them foresee increases in the future.
Figure 14. What is your outsourcing budget as a percentage of operations and technology budget in 2015?
Figure 15. In 2016, the outsourcing budget allocation is projected to:
41 - 60 %(7%)
81 - 100%(4%)
61 - 80% (4%)
0 - 20%(63% of respondents)
21 - 40%(22% of
respondents)
Increase44%
Remain the same 50%
Decrease 6%

Asia Investment Management COO Survey 2015 17
Asian asset managers’ main criteria in outsourcing is to reduce costs whereas global players value strategic significance the most
How Asian and global asset managers view ‘outsourcing’ further highlights the differences in their priorities. Asian managers consider cost as the most important criteria when deciding to outsource, whereas global managers adopt a more long term view that takes into consideration the strategic significance and the ability to release capacity as their key drivers to outsource.
Having the right pool of in house resources and talent is also a challenge encountered by Asian players. On the other hand, the global players have a larger resource base and thus do not consider in-house capability as important.
The contrast highlighted between Asian and Global managers comes down to the difference in their levels of business maturity. In the case of Asian managers, they are still relatively young and are striving to achieve scale. As a result they are cost conscious and tend to adopt a shorter term outlook. On the other hand, the businesses of global managers are more mature, and they are looking to partner with trusted credible service providers who can support their geographical and product growth aspirations.
Most importantly is how to manage their risk and to assure high quality service levels for their service providers. The challenge with outsourcing in Singapore is finding providers that have sufficient experience across functions that managers generally outsource. Equally important is having local teams on the ground that can interact with the various functions that require real-time support. There is an opportunity there for vendors, but vendors have got to have experienced people on the ground.
Jeff Plein, COO, Fullerton Fund Management
Figure 16. Rank the following aspects in order of importance when deciding to outsource
a function or execute it in-house.
Costs involved
Industry best practice
Strategic significance
Releasing capacity from non-core activities
Regulatory constraints
Criticality of the function
Security requirements
In-house capabilities
Asian asset managers
Rank No.1 Rank No.2 Rank No.3
Global asset managers
Rank No.1 Rank No.2 Rank No.3
Costs involved
Industry best practice
Strategic significance
Releasing capacity from non-core activities
Regulatory constraints
Criticality of the function
Security requirements
In-house capabilities
0 10 20 30 40 50 60 70
35% 30% 5%
10% 10%
15% 5%
5% 25%
15% 20%
15% 40%5%
15%
20% 15% 15%
0 10 20 30 40 50 60 70
7% 21% 42%
20% 15% 15%
7%21%
14%42% 7%
14%28%
14%7% 7%
7%7% 7%
7%
7% 14% 14%

18
Asset managers are not comfortable outsourcing most middle office functions, but there’s an appetite for partially outsourcing some of these functions
The survey responses reveal that asset managers are evidently more comfortable outsourcing functions where service providers have mature, reliable and tested service offerings. These functions include transfer agency, fund accounting, collateral management, trade matching and reconciliations, which have been a staple offering of fund service providers for a number of years and have become standard components of an efficient, cost effective and scalable operating model.
What comes as somewhat of a surprise is the lack of interest in outsourcing middle office functions such as investment performance, cash management and risk & compliance reporting. Based on our conversation with the COOs surveyed, this may be due to the quality and the maturity levels of the service offerings currently available in region.
The survey responses also highlight the desire of asset managers to outsource technology, application support and application infrastructure, which is in-line with the future-state where the industry is heading, but faces significant challenges with regulators.
Figure 17. Which of these functions are you comfortable outsourcing?
47
Completely Partially Maintain Outsource Outsource In house
0% 10% 20% 30% 40% 50% 60% 70% 80%
Outsource
Maintain Inhouse
Compliance
Risk analytics and reporting
Client billing
Investment book of record
Performance measurement & attribution
Collateral management
Cash management
Trade matching/ confirmation
Custodian reconciliation
End client statement production
Corporate actions processing
Technology – application support and application
infrastructure
Transfer agency
Fund accounting
74%26%
0%
9%26%
65%
21%21%
21%20%
58%
59%
50%35%
15%
47%15%
38%
47%
6%47%
38%
38%
38%
38%
41%
41%
35%
24%
24%
33%
35%
44%
26%
24%
11%18%
24%
71%
68%
21%
8%
Top rated functions to be completely outsourced• Transfer agency (71%) • Fund accounting (68%)• Technology, application support &
application infrastructure (44%)• Custodian reconciliation (38%)
Top rated functions to remain in-house• Compliance (74%)• Risk analytics and reporting (65%)• Client billing (59%)• Investment book of record (59%).
Asia Investment Management COO Survey 2015 19
Conclusion
Despite the recent market volatility in the emerging markets, and in particular across Asia, there is no doubt in our minds that the asset management industry will continue to see growth. Asset management is moving centre-stage, driven by the changing demographics and new opportunities created as a result of regulatory barriers which hinder banks and insurers by forcing them to abandon proprietary investing and other core businesses.
The rise in the volume of investable assets is set to increase from around $64 trillion in 2013 to $102 trillion by 2020, a compound growth rate of nearly 6%. Assets under management in the SAAAME (South America, Asia, Africa and the Middle East) economies are set to grow faster than in the developed world, and Asia will be a significant contributor to this.
The next decade will not be easy, however. Alongside rising assets, there will be rising costs. First, the costs of complying with regulation will remain high. Commercial cost pressures will rise as firms grow their distribution networks. Fees will be under continued pressure amid the ongoing push for greater transparency and comparability. Investment in technology and data management will need to be maintained or increased to maximise distribution opportunities and to cope with regulation and reporting. These challenges will require Asian COOs to pay particular attention to:
• Find efficiency in operating models, whether through revamping the target operating model or reassessing new ways of managing infrastructure and people.
• Manage compressed margins in an increasingly fee competitive world in product sales and distribution.
• Navigate the regulatory and compliance maze, while enabling business to grow.
Outsourcing will continue to remain a bug bear for COOs, as the drive for more outsourcing of non-core functions to increase scalability and operational effectiveness brings about regulatory compliance headaches. The high standards of governance and oversight over outsourced functions expected by new regulatory requirements across Asia will mean that those asset managers who do not have a formal and robust outsourced oversight function will need to step up very quickly.
Asian players can also do more to measure up to the next level of competitiveness and maturity, in relation to their global counterparts. In particular, raising the dial to make the back-office a larger part of the strategic equation within the overall business is critical to meeting the challenges of the next decade.

20
About
This information and data is part of PwC and Stradegi’s proprietary data and analytics structures and are non-commercial in nature and specifically non attributable regarding the identity of any underlying individual or organisation. Both PwC and Stradegi act as a supplier of data and analysis for the purpose of this report.
This publication has been prepared for general guidance on matters of interest only, and does not constitute professional advice of any kind. You should not act upon the information contained in this publication without obtaining specific professional advice. No representation or warranty (express or implied) is given as to the accuracy or completeness of the information contained in this publication, and, to the extent permitted by law, neither PwC or Stradegi accepts or assumes any liability, responsibility or duty of care for any consequences of you or anyone else acting, or refraining to act, in reliance on the information contained in this publication or for any decision based on it.
PwC and Stradegi are not affiliated.
PwC helps organisations and individuals create the value they’re looking for. We’re a network of firms in 157 countries with more than 208,000 people who are committed to delivering quality in assurance, tax and advisory services. Find out more and tell us what matters to you by visiting us at www.pwc.com.
trade s gStradegi is an Asia based management consultancy exclusively focused on the investment management industry. The team advises asset managers, insurance companies, pension funds and sovereign wealth funds in the areas of business strategy, operational best practices and governance.
The firm was established in 2013 in Singapore by a group of individuals with significant experience in senior roles on the buy-side. Our consultants have first-hand experience of the pains and frustrations that management teams go through in resolving Front, Middle and Back Office issues, and thus offer targeted and relevant advice.
The Stradegi team brings an expert, practical and independent view that is based on an in-depth understanding of the buy-side in Asia.
Contacts
Justin OngAsia Pacific Asset Management Leader PwC SingaporeTel: +65 6236 3708 Email: [email protected]
Ewan YeAsset Management Business Development ManagerPwC SingaporeTel: +65 6236 3009Email: [email protected]
Gordon Brown, CFA Managing Partner Stradegi Investment Management ConsultingTel: +65 6850 7851Email: [email protected]
Rohit Jaggi, CFA Business Development & MarketingStradegi Investment Management ConsultingTel: +65 6850 7651Email: [email protected]
trade s gtrades g
investment management consul�ng


trade s gtrades g
investment management consul�ng
© 2015 PwC and Stradegi. All rights reserved.