asia and the pacific division - international fund for
TRANSCRIPT

ASIA AND THE PACIFIC DIVISION
PORTFOLIO PERFORMANCE REPORT
ANNUAL REVIEW
July 2012 – June 2013
VOLUME I
JULY 2013
INTERNATIONAL FUND FOR AGRICULTURAL DEVELOPMENT (IFAD)


PORTFOLIO PERFORMANCE REPORT
ANNUAL REVIEW
July 2012 – June 2013
TABLE OF CONTENTS
Maps i Country codes iii Abbreviations and Acronyms iv Project and Programme Acronyms vi Executive Summary ix I. OVERVIEW OF THE ECONOMIC AND SOCIAL SITUATION IN THE REGION 1 II. COUNTRY PROGRAMMES 3
A. RB-COSOPs 3 B. Selected Country Programme Issues 5 C. Client Perspectives 7
III. CURRENT INVESTMENT PORTFOLIO AND OPERATIONS 7
A. Characteristics 7 B. Operations 9
IV. CURRENT GRANT PORTFOLIO AND OPERATIONS 12
A. Characteristics 12 B. Operations 14
V. MANAGEMENT PERFORMANCE OF THE ONGOING PORTFOLIO OF INVESTMENT PROJECTS 16
A. Project Management 16 B. Disbursement Performance 17 C. Loan Administration 17 D. Procurement 18 E. Financing Covenants 18 F. Audit 19 G. Monitoring and evaluation 19
VI. RESULTS OF THE ONGOING PORTFOLIO 20
A. Overall implementation Progress 20 B. Outputs and Outcomes 22 C. Targeting and Gender 28 D. Innovation and Learning 29 E. Knowledge Management 30 F. Scaling Up 31 G. Sustainability 32
VII. EVALUATION 34 VIII. PORTFOLIO MANAGEMENT 36
A. Supervision and Implementation Support 36 B. Risks 38 C. Portfolio at Risk 38 D. Problem Patterns 39 E. Pro-activity and Reduced Risk 40
IX. CONCLUSIONS AND THE WAY FORWARD 41

Appendices Table 1. List of Ongoing Investment Projects on 30 June
Table 2. List of Ongoing Grants Projects on 30 June
Table 3. PSR Ratings of Ongoing Projects
Table 4. GSR Ratings of Ongoing Grants
Table 5. Projects with Delays in Signing/Entry into force
Table 6.1. Disbursement Performance of Investment Projects
Table 6.2 Loans and DSF Grants with Disbursement Lag of 40 or more
Table 7.1. Relative Share of Co financiers in Ongoing Portfolio
Table 7. 2. Relative share of External co-financier in Ongoing Portfolio
Table 8.1. Projects Completed during Period under Review
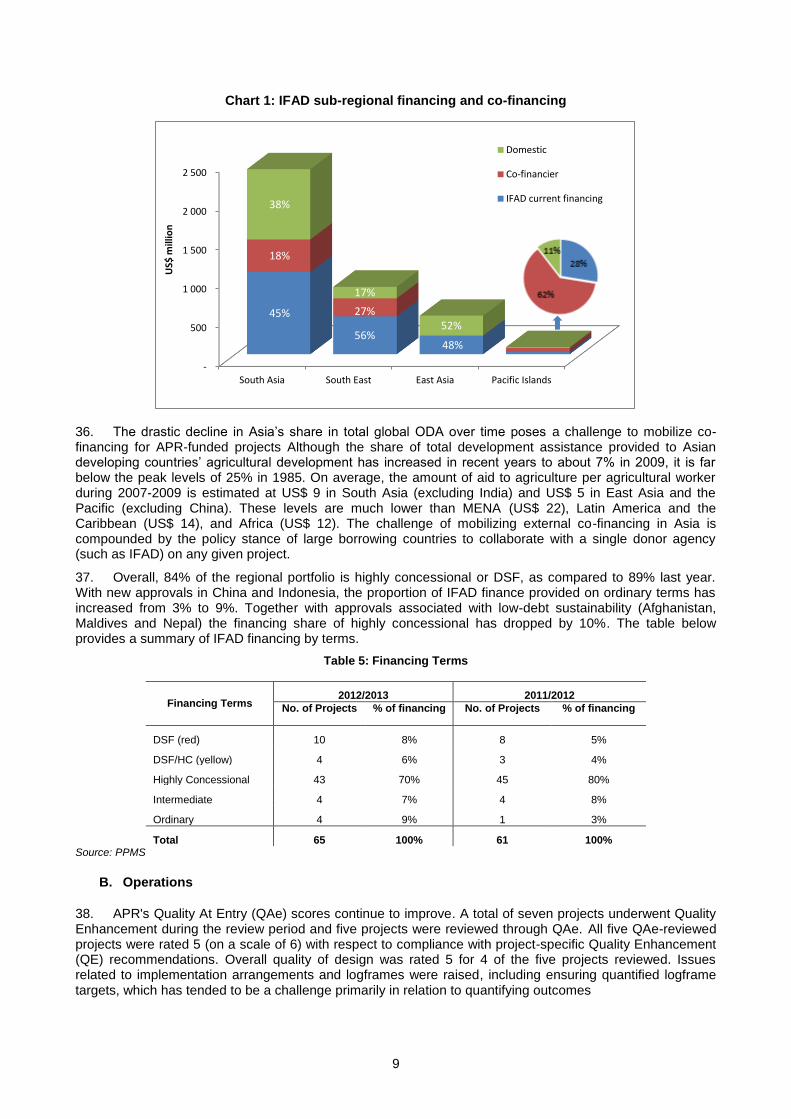
Table 8.2. Project completion during next review period
Table 8.3. Grants Scheduled for completion or closure during 2013
Table 8.4. Grants granted an extension during the period under review
Table 9.1. Project Extensions during Period under Review
Table 9.2. Grants granted an extension during the period under review
Table 9.3. Project with Time Overrun of over 15%
Table 10. Action Plan for Improving Portfolio Performance
Annexes
1. Investment Portfolio Characteristics
2. Grants Portfolio Characteristics
3. Investment Portfolio – Financial Data
4. Effectiveness Data

i

ii

iii
IFAD Country Codes used to designate financing instruments
AF Afghanistan
BD Bangladesh
BT Bhutan
KH Cambodia
CN China
FJ Fiji
IN India
ID Indonesia
IR Iran
KI Kiribati
KP Korea, Democratic People's Republic of
LA Lao People Democratic Republic
MV Maldives
MN Mongolia
MM Myanmar
NP Nepal
NZ New Zealand
PK Pakistan
PG Papua New Guinea
PH Philippines
WS Samoa
SB Solomon Islands
LK Sri Lanka
TH Thailand
TL Timor-Leste
TO Tonga
VN Viet Nam

iv
ABBREVIATIONS AND ACRONYMS
ADB Asian Development Bank
ECCA Environment and Climate Change Assessment
AIT Asian Institute of Technology
ECD Environment and Climate Division
AOS Annual Outcome Surveys
ENRM Environment and Natural Resource Management
APDF Anurapura Participatory Development Foundation
EoF Entry into Force
APMAS
Asia Project Management Support Project
ESCAP
Economic and Social Commission for Asia and the Pacific
APR Asia and the Pacific Region
EU European Union
APRACA
Asia-Pacific Rural and Agricultural Credit Association
FAO Food and Agriculture Organization
ARTS Audit Reports Tracking System
FFR Financing Facility for Remittances
ASAP Adaptation for Smallholder Agriculture Programme
FFS Farmers Field Schools
ASEAN
Association of Southeast Asian Nations
FLM Flexible Lending Mechanism
AusAID
Australian Agency for International Development
FM Financial Management
BTN Bhutanese Ngultrum
FMAQ Financial Management Assessment Risk Questionnaire
CC Climate Change
FMS Financial Management Specialist
CFS Controller's and Financial Services Division
FPSI Foundation of the Peoples of the South Pacific International
CGIAR Consultative Group on International Agricultural Research
GDP Gross Domestic Product
CIAT International Center for Tropical Agriculture
GEF Global Environment Facility
CIP International Potato Center
Ha Hectare
CIs Cooperating Institutions
HC Highly Concessional
CNY Chinese Yuan Renminbi
ICIMOD
International Centre for Integrated Mountain Development
CO Country Office
ICO IFAD Country Office
COSOP
Country Strategic Opportunities Programme
ICRAF International Centre for Research in Agroforestry
CPE Country Programme Evaluation
ICT Information and Communication Technology Division
CPIS Country Programme Issue Sheet
IFAP International Federation of Agricultural Producers
CPM Country Programme Manager
IFPRI International Food Policy Research Institute
CPO Country Programme Officer
IFRS International Financial Reporting Standards
DfID Department for International Development
IGAs Income Generating Activities
DMP Divisional Management Plan
INR Indian Rupee
DSF Debt Sustainability Framework
IOE Independent Office of Evaluation
EB Executive Board
IPSARD
Institute of Policy and Strategy for Agriculture

v
IPSAS International Public Sector Accounting Standards
PPMS Project and Portfolio Management System
IRRI International Rice Research Institute
PROCASUR
Corporation for Regional Rural Development Training
KfW Reconstruction Credit Institute (Kreditanstalt für Wiederaufbau)
PSR Project Status Report
KM Knowledge Management
PTA Policy and Technical Advisory Division
LCS Labour-contracting Societies
QaE Quality at Entry
LGS Loans and Grants System
QE Quality Enhancement
M&E Monitoring and Evaluation
R&D Research and Development
MDG Millennium Development Goal
RB-COSOP
Results-Based- Country Strategic Opportunities Programme
MENA Middle East and North Africa
RIMS Results and Impact Management System
MFIs Monetary Financial Institutions
RMF Results Management Framework
MPAT The Multidimensional Poverty Assessment Tool
SAIs Supreme Audit Institutions
MTR Mid-Term Review
SALT Sloping Agricultural Land Technology
MU 1 ha = 15 mu (China)
SCGs Saving and Credit Groups
NaRMG Natural Resource Management Groups
SDR Special Drawing Rigths (IMF currency equivalent)
NEDA National Economic and Development Authority
SF Strategic Framework
NGOs Non-Governmental Organizations
SHGs Self-Help Groups
non-CGIAR
non-Consultative Group on International Agricultural Research
SIDBI Small Industries Development Bank of India
ODA Official Development Assistance
SKM Strategy and Knowledge Management Department
OECD Organisation for Economic Co-operation and Development
SOE Statement of Expenditures
OSC Operational Strategy and Policy Guidance Committee
SSD Statistics and Studies for Development
PCR Project Completion Report
T4D Technology for Development
PCRV Project Completion Validation Report
ToRs Terms of References
PFRR Project Fiduciary Risk Rating
UN United Nations
PIUs Project Implementation Units
UNICEF The United Nations Children's Fund
PMU Project Management Unit
US$ United States Dollars
PPA Project Performance Assessments
WAs Withdrawal Applications
PPAF Pakistan Poverty Alleviation Fund
WFP World Food Programme
YPOs Young Partner Organizations

vi
PROJECT AND PROGRAMME ACRONYMS
Country Project Id
Loan / DSF grant No.
Project acronym
Project Name
Afghanistan 1460 8033 RMLSP Rural Microfinance and Livestock Support Programme
Afghanistan 1637 8112 CLAP Community Livestock and Agriculture Project
Bangladesh 1165 567 SCBRMP Sunamganj Community-Based Resource Management Project
Bangladesh 1235 609 MFTSP Microfinance and Technical Support Project
Bangladesh 1284 644 MFMSFP Microfinance for Marginal and Small Farmers Project
Bangladesh 1322 681 MIDPCR Market Infrastructure Development Project in Charland Regions
Bangladesh 1355 739 NATP National Agricultural Technology Project
Bangladesh 1402 725 FEDEC Finance for Enterprise Development and Employment Creation Project
Bangladesh 1466 786/808 PSSWRSP Participatory Small-scale Water Resources Sector Project
Bangladesh 1537 807 CDSPIV Char Development and Settlement Project IV
Bangladesh 1585 847 HILIP Haor Infrastructure and Livelihood Improvement Project
Bangladesh 1647 896 CCRIP Coastal Climate Resilient Infrastructure Project
Bhutan 1296 659 AMEPP Agricultural, Marketing and Enterprise Promotion Programme
Bhutan 1482 824 MAGIP Market Access and Growth Intensification Project
Cambodia 1175 551/8011 CBRDP Community Based Rural Development Project in Kampong Thom & Kampot
Cambodia 1261 623 RPRP Rural Poverty Reduction Project in Prey Veng and Svay Rieng
Cambodia 1350 8005 RULIP Rural Livelihoods Improvement Project in Kratie, Preah Vihear and Ratanakiri
Cambodia 1464 793 TSPRSDP Tonle Sap Poverty Reduction and Smallholder Development Project
Cambodia 1559 870/8101 PADEE Project for Agricultural Development and Economic Empowerment
China 1223 600 ECPRP Environment Conservation and Poverty Reduction Programme in Ningxia and Shanxi
China 1227 634 RFSP Rural Finance Sector Programme
China 1271 673 SGPRP South Gansu Poverty-Reduction Programme
China 1323 709 MRDP/XUAR
Xinjiang Uygur Autonomous Region Modular Rural Development Programme
China 1400 740 IMARRAP Inner Mongolia Autonomous Region Rural Advancement Programme
China 1454 766 DAPRP Dabieshan Area Poverty Reduction Programme
China 1478 778 SPEAR Sichuan Post-Earthquake Agriculture Rehabilitation Project
China 1555 855 GIADP Guangxi Integrated Agricultural Development Project
China 1627 875 HARIIP Hunan Agricultural and Rural Infrastructure Improvement Project
China 1629 885 YARIP Yunnan Agricultural and Rural Improvement Project
India 1040 444/794 NERCORMP II
North Eastern Region Community Resource Mngmnt Project for Upland Areas
India 1063 506 JCTDP Jharkhand-Chattisgarh Tribal Development Project
India 1121 538 National Microfinance
National Microfinance Support Programme
India 1155 585 OTELP Orissa Tribal Women's Empowerment Programme
India 1226 624 LIPH Livelihoods Improvement Project in the Himalayas

vii
India 1314 682 TWEP Tejaswini Rural Women's Empowerment Programme
India 1348 662/691 PT-Tamil Nadu
Post-Tsunami Sustainable Livelihoods Programme for the Coastal Communities of Tamil Nadu
India 1381 710 Mid-Gangetic Plains
Women's Empowerment and Livelihoods Programme in the Mid-Gangetic Plains
India 1418 748 MPOWER Mitigating Poverty in Western Rajasthan Project
India 1470 779 CAIM Convergence of Agricultural Interventions in Maharashtra's Distressed Districts Programme
India 1617 856 ILSP Integrated Livelihoods Support Project
Indonesia 1258 645 READ Rural Empowerment and Agricultural Development Programme in Central Sulawesi
Indonesia 1341 755 PNPM National Programme for Community Empowerment in Rural Areas Project
Indonesia 1509 835 SOLID Smallholder Livelihood Development Project in Eastern Indonesia
Indonesia 1621 880 CCDP Coastal Community Development Project
Laos 1301 660/8082 RLIP Rural Livelihoods Improvement Programme in Attapeu and Sayabouri
Laos 1396 771 NRSLLDP Northern Region Sustainable Livelihoods through Livestock Development Project
Laos 1459 8025 SNRMP Sustainable Natural Resource Management and Productivity Enhancement Project
Laos 1608 8089 SSSJ-CFSEOP
Soum Son Seun Jai - Community-based Food Security and Economic Opportunities Programme
Maldives 1347 663/692 PT-AFReP Post-Tsunami Agricultural and Fisheries Rehabilitation Programme
Maldives 1377 726 FADIP Fisheries and Agricultural Diversification Programme
Maldives 1624 8104 MEDEP Mariculture Enterprise Development Project
Mongolia 1205 592 RPRP Rural Poverty Reduction Programme
Mongolia 1455 836 PMPMD Project for Market and Pasture Management Development
Nepal 1119 8010 WUPAP Western Uplands Poverty Alleviation Project
Nepal 1285 646 LFLP Leasehold Forestry and Livestock Programme
Nepal 1450 8014 PAF II Poverty Alleviation Fund Project II
Nepal 1471 796 HVAP High-Value Agriculture Project in Hill and Mountain Areas
Nepal 1602 881/8106 Biu-Bijan Kisankalagi Unnat Biu-Bijan Karyakram
Pakistan 1078 554 Southern FATA
Southern Federally Administered Tribal Areas Development
Pakistan 1182 558 NWFP Barani
North-West Frontier Province Barani Area Development Project
Pakistan 1245 625 AJK Community Development Programme
Pakistan 1324 683 MI&OP Microfinance Innovation and Outreach Programme
Pakistan 1385 695 REACH Project for Restoration of Earthquake-Affected Communities and Households
Pakistan 1413 727 PRISM Programme for Increasing Sustainable Microfinance
Pakistan 1514 825 SPPAP Southern Punjab Poverty Alleviation Project
Pakistan 1515 837 GLLSP Gwadar-Lasbela Livelihoods Support Project
Papua New Guinea
1480 809 PPAP Productive Partnerships in Agriculture Project
Philippines 1253 661 RuMePP Rural Microenterprise Promotion Programme

viii
Philippines 1395 749 CHARMP II Second Cordillera Highland Agricultural Resource Management Project
Philippines 1485 767 RaFPEP Rapid Food Production Enhancement Programme
Philippines 1475 890 INREMP Integrated Natural Resources and Environmental Management Programme
Solomon Islands
1565 8070 RDP Rural Development Programme
Sri Lanka 1254 636 Dry Zone Dry Zone Livelihood Support and Partnership Programme
Sri Lanka 1316 712 SPEnDP Smallholder Plantations Entrepreneurship Development Programme
Sri Lanka 1346 664/693 PT-CRReMP
Post Tsunami Coastal Rehabilitation and Resource Management Programme
Sri Lanka 1351 665/694 PT-LiSPP Post-Tsunami Livelihood Support and Partnership Programme
Sri Lanka 1457 797 NADeP National Agribusiness Development Programme
Sri Lanka 1600 857 IIDP Iranamadu Irrigation Development Project
Timor-Leste 1576 8093 TLMSP Timor-Leste Maize Storage Project
Tonga 1628 8099 RIP Tonga Rural Innovation Project
Viet Nam 1272 647 DPRPR Decentralized Program for Poverty Reduction in Ha Giang and Quang Binh Province
Viet Nam 1374 701 IMPP Programme for Improving Market Participation of the Poor in Ha Tinh and Tra Vinh Provinces
Viet Nam 1422 741 DBRPP Developing Business with the Rural Poor Programme
Viet Nam 1477 768 3PAD Pro-Poor Partnerships for Agroforestry Development Project
Viet Nam 1483 810 3EM Project for the Economic Empowerment of Ethnic Minorities in Poor Communes of Dak Nong Province
Viet Nam 1552 826 TNSP Agriculture, Farmers and Rural Areas Support Project in Gia Lai, Ninh Thuan and Tuyen Quang Provinces

ix
Executive Summary
1. The APR portfolio review assesses key measures of efficiency and effectiveness in APR's portfolio of loans and grants for the period 1 July 2012 to 30 June 2013. The portfolio consists of US$ 1.7 billion in IFAD financing, and total project costs of US$ 6.0 billion. The review draws on corporate databases, an APR mid-term portfolio review covering the period July to December 2012, an APR divisional workshop held in March 2013, and surveys and interviews held with country teams towards the end of the reporting period. The review provides a launching pad for further work on improving divisional performance and impact.
Country Programmes
2. APR aims for IFAD to be recognized as a visible and effective leader in transforming small-scale farming into a sustainable business, enabling smallholders to benefit from emerging market opportunities that can lift them out of poverty and strengthening their resilience to climate variability. RB-COSOP formulation and reviews have highlighted a number of issues related to positioning IFAD in the region. They include: the interest of partners from Middle-Income Countries in IFAD playing a lead role as knowledge broker on rural poverty reduction options and models; the strengthened commitment to country-led programming as borrowers reach or approach middle-income status and consolidate institutional capabilities; and the need for adaptive programming in fragile states.
3. In line with APR’s vision and the evolving contexts in the region, RB-COSOPs formulated with governments and COSOP joint reviews are placing additional emphasis on: commercialization of smallholder agriculture and private sector participation; outreach to women and youth; remittances for development; and adaptation to climate change.
4. Results from IFAD's Client Survey of 2012 suggest improvements in all countries relative to a similar survey conducted in 2011. IFAD surveyed 152 partners from 7 countries in Asia. APR’s highest average scores were in its contribution to income and food security (average score of 4.7 out of 6). These concurrent improvements reflect the efficacy of IFAD's approach to enhancing market access for smallholders while also improving food availability. This two-pronged approach is increasingly promoted through higher investments in agricultural production combined with strengthening of pro-poor commodity chains.
Current Investment Portfolio and Operations
5. IFAD's current portfolio in the region consists of 65 approved projects and programmes and 41 ongoing grants across 30 member states for a total value of US$ 3.9 billion. The amount of IFAD financing increased from US$ 1.6 billion two years ago to US$ 1.8 billion today.
1
6. Key portfolio facts and figures:
Forty-two per cent of IFAD financing in the region continues to be attributed to markets, rural finance and natural resource management, of which half is attributed to markets and related infrastructure.
Currently US$ 1.1 billion of IFAD financing, or almost 60% of the portfolio value, is directed towards South Asia, through a total of 35 projects in 8 borrowing countries.
Co-financing has improved, from 0.92 during IFAD8 to 1.1 as of June 2013, according to IFAD's PPMS
7. In terms of operations, APR's Quality At Entry (QAe) scores continue to improve. A total of seven projects underwent Quality Enhancement (QE) during the review period and five projects were reviewed through QAe. All five QAe-reviewed projects were rated 5 (on a scale of 6) with respect to compliance with project-specific QE recommendations. Overall quality of design was rated 5 for four of the five projects reviewed. Issues related to implementation arrangements and logframes were raised, including ensuring quantified logframe targets, which has tended to be a challenge primarily in relation to quantifying outcomes.
8. Key operations facts and figures:
Nine new projects and two supplementary financing arrangements were approved during the reporting period for a total IFAD financing amount of US$ 345 million.
For the ten projects that entered into force during the reporting period, the time from approval to entry into force averaged five months.
1 This excludes Kazakhstan, Kyrgyzstan and Tajikistan, which have been transferred to NEN division in 2012. All historic portfolio
figures in this report exclude these three countries, leading to some deviations with APR overall figures reported in last year’s report.

x
Although 18 projects have closed of which 16 completed in the past two years, the ongoing portfolio grew from 56 projects as of 30 June 2011 to 64 projects as of 30 June 2013. Twenty one projects have entered into force during the past two years.
Five loan-funded projects were completed during the review period, and an additional 5 projects closed. On average, closing of the 5 projects extended for 5.7 months beyond the scheduled closing date. Five additional projects scheduled for closure during the reporting period have not yet completed administrative actions to do so.
As of 30 June 2013, DPR Korea is the only country in the APR portfolio in arrears, for a cumulative arrears of about US$ 7.6 million, an increase of US$ 1.5 million since 30 June 2012.
Current Grant Portfolio and Operations
9. In line with corporate targets, the number and value of the overall portfolio of effective grants have fallen sharply, from 68 active grants valued at US$ 44 million in June 2011 to 41 active grants valued at US$ 35 million by June 2013. Government agencies are the largest group of recipients, with a total approved financing of US$ 17.5 million. The 26 large grants effective in June 2013 (13 regional and 13 country-specific) constitute almost US$ 30 million, or 84%, of the current total grant value. The number of small grants has dropped from 24 last year to 15 this year, and their average size has increased from US$ 0.3 to US$ 0.4 million. The number of active regional grants (large and small) continues to diminish, from 29 in 2010 to 16 in 2013, reflecting an increasing focus on country-specific capacity-building efforts.
10. The grant policy output “Capacity of partner institutions strengthened” features the highest number and value of grant funding among currently ongoing grants – 24 grants amounting to US$ 17.7 million. This amount is almost matched by the allocation towards output 1: “Innovative activities, technologies and approaches in support of IFAD's target group”, although the number of grants is almost half, reflecting the higher cost of upstream research and development.
11. In terms of IFAD’s strategic framework objectives, almost half of the currently ongoing grants are in support of SF2, “Improved agricultural technologies”. The rest the portfolio is mostly distributed among policy support (SF6), pro-poor market development (SF4) and natural resource management (SF1).
12. IFAD's effective grant portfolio of US$ 35 million has been matched by US$ 12 million in co-financing, or 34% of IFAD grant financing. Similarly, co-financing of the 13 grants approved during the review period is US$ 3 million, or almost one third of the total value contributed by IFAD. Total co-financing mobilized for large regional grants amounted to US$ 9.3 million against the US$ 17 million mobilized by IFAD – a ratio of almost 1:2 in grant co-financing.
Management Performance of the Ongoing Portfolio of Investment Projects
13. The performance of project management has improved marginally over the past 12 months, from an average score of 4.0 to 4.1. Management quality disproportionally reflects onto risk flags and status, with 7 of the 10 projects scoring less than moderately satisfactory on project management also classified as problem projects.
14. APR overall disbursement exceeds the average IFAD disbursement profile by US$ 83 million. The equivalent of US$ 164 million was disbursed between July 2012 and June 2013. While this is a reduction compared to last year's disbursement of US$ 209 million, it is attributed to cyclical features of the portfolio, particularly the completion of 5 projects during the period. Generally, smaller projects are performing better in disbursement, and weaker disbursement scores are associated with lower PSR scores on 'Coherence between AWPB and implementation' and 'Quality of project management'.
15. Processing time of Withdrawal Applications (WAs) decreased from an average of 31 days in 2011-2012 to 18 days in 2012-2013. In order to facilitate loan and grant administration and disbursement efficiencies, the minimum withdrawal amounts for APR portfolios have been increased, where possible and in consideration of project-specific risk assessments. The newly introduced Financial Management (FM) strategy, guidelines and procedures have provided the foundation for applying the risk-based disbursement and financial assurance methodology. PSR ratings indicate improvements in compliance with procurement since the last review – 87% (55 projects) were rated moderately satisfactory or higher, and 13% (8 projects) were rated moderately unsatisfactory or lower. Timely receipt of audit reports decreased from 84% receipts for fiscal year 2011 to 67% for fiscal year 2012.
16. APR's portfolio has seen a marked increase in M&E performance over the reporting period. The average PSR score has increased from 3.5 last year to 3.9 in 2013; and the number of projects at satisfactory level increased from 34 of 62 last year to 45 of 63 in 2013. This corresponds to almost complete fulfilment of RIMS survey requirements and improved reporting on outcomes. Additionally, a user survey found that those projects that had applied APR's Annual Outcome Survey methodology perceive themselves

xi
to be better able to analyse and report on project outcomes. Overall, there is increasing attention to outcome monitoring, the most challenging aspect of project M&E.
Results
17. APR's average PSR ratings for overall implementation progress, and likelihood of achieving development objectives have improved. Moreover, the number of problem projects has fallen from 17 two years ago to 12 last year and 9 this year. Scores on impact domains, assets and food security have also improved relative to last year. The average rating for all 4 indicators appears to follow a distinct trend according to the age of the project. Ratings are modestly positive for younger projects but tend to drop around mid-term, a critical milestone in the project cycle, then increase as delivery accelerates following mid-term.
18. Based on 15 RIMS surveys,2 chronic malnutrition (height for age) has fallen from baseline to
completion- on average, from 49% to 37% for boys, and from 41% to 34% for girls. Acute malnutrition, as indicated by wasting (weight for height) has declined from 18% to 15% for boys, and from 8% to 6% for girls. Under-nutrition (weight for age) has also declined: from 32% to 19% for boys, and from 30% to 17% for girls. RIMS data from 9 projects reporting on food security at baseline and completion show that the percentage of households suffering from a first hunger season declined from 35% to approximately 20%. However, for those households suffering a first hungry season, the incidence of a second hungry season is higher, illustrating the challenges of chronic poverty in spite of overall reduction in extreme poverty.
19. The efficacy of targeting continues to score above APR's overall PSR average, and improved from 4.1 last year to 4.3 in 2013. The primary targeting method continues to be geographic; this is often combined with other measures to ensure that the poorest segments of the target group participate where benefits are direct and accrue to selected individual households.
20. According to aggregate PSR ratings, APR is performing satisfactorily in relation to the potential of scaling up and replication, with 78% of its projects rated as moderately satisfactory or better, with an average PSR score of 4.3. Recent COSOPs have palced more focus on strategically planning and managing for promoting the scaling up of impact. For example, recent country strategies for Bangladesh, Cambodia, China, and India include explicit strategies for pursuing scaling up of impact. Recent COSOPs have placed more focus on strategically planning and managing for promoting the scaling up of impact.
21. The various dimensions of project performance that are used to assess sustainability – institution building, empowerment, quality of beneficiary participation, responsiveness of service providers, exit strategy, environmental sustainability, and potential for scaling up – had an average score of 4.1. Higher scores are recorded in potential for scaling up (4.3), quality of beneficiary participation (4.3) and empowerment (4.2). Projects perform slightly less well on average in relation to responsiveness of service providers (4.0) and in defining an exit strategy (3.9).
Evaluation
22. During the review period, IFAD’s Independent Office of Evaluation conducted two Country Programme Evaluations (CPEs), five Project Performance Assessments and two Project Completion Report Validations. APR and governments participated in the evaluations, which benefitted from healthy exchange of perspectives. The overall rating for both independent CPEs (Indonesia and Nepal was moderately satisfactory (4). Among the key lessons is that resources allocated were insufficient to maintain an appropriate level of knowledge management, policy dialogue and active participation in donor coordination.
Portfolio Management
23. Feedback from client countries indicates marked improvements in supervision quality since APR began to implement direct supervision modalities in 2008. The declining levels of IFAD administrative budget allocated to supporting the supervision process are creating incentive and the necessity for country teams within the region to innovate with their supervision process and approaches. Implementation support has proven effective for addressing acute problem areas, particularly those related to project management or technical issues; but perhaps less so in resolving institutional bottlenecks. The existence of projects that cover multiple states or provinces within a single country continues to present challenges to APR supervision teams.
24. Among the eleven PSR ratings designated as risk flags, ratings less than 4 are more prevalent among disbursement, M&E, and delivery of AWPB. Between one quarter and one half of projects in the portfolio
2 Some projects intervening in two different provinces have submitted RIMS surveys for each province and are hence counted
separately.

xii
suffer from a score below par on each of these indicators. These three measures are inter-linked to operational management, and in particular to planning, execution and tracking of results. Interestingly, these areas of weakness do not seem to be attributed to the quality of project management, which is one of the best performing of the PSR risk flags this year.
25. For these and the other risk flags, portfolio performance has improved over the past 2 years, in term of percentage of projects rated 3 or less, against all indicators aside from counterpart funds. The largest improvements over the past two years were in the quality of financial management and in the performance of M&E. Pro-activity has improved for the second consecutive year, to 58%: only 5 of the 12 actual problem projects last year remain at risk this year too. Two of the five projects (KH-1464 and LA-1459) still in problem status are supervised by ADB. For 4 out of the latter 5 problem projects, the average risk flag scores have also improved since last year.
Conclusions and the Way Forward
26. There is room to improve efficiency and enhance delivery by expediting project start-up, accelerating the pace of implementation in the early years and ensuring timely completion. Current RIMS estimates for 2011 and 2012 indicate that approximately 18 million persons have been reached between 2010 and 2012. To expand outreach and meet the MTP target of reaching 30 million poor rural people by 2015, a faster pace of project delivery will need to be secured through higher levels of fulfillment of AWPBs targets. In terms of results delivery, PSR ratings and survey results show a good level of effectiveness throughout the portfolio. Through its supervision processes and strategically selected supplementary financing, APR will assess options to expand outreach, with a target of about 4 million persons per year.
27. To consolidate the grant portfolio and maximize value for money, several strategic changes are being introduced in grant planning and selection processes. In particular, grant-funded and loan-financed activities will have clearer differentiation and linkages – grants will continue to focus on supporting capacity building, innovations and other “soft” elements for which clients generally do not want to use loan funds; future grants could support project readiness to kick-start implementation.
28. To continue to improve the technical support APR provides to its clients, the division needs to draw on the diverse set of skills, expertise and competencies of APR and IFAD staff. APR will strengthen its collaboration with PTA, CFS, COM and other divisions that can assist CPMs and ICOs in the delivery of IFAD's work programme in Asia and the Pacific. Improving the quality and impact of country programmes also requires a continuous strengthening of APR's field presence.
29. Looking forward, two key thrusts will be pursued: portfolio strengthening to secure the achievement of MTP targets by 2015 and positioning IFAD as a preferred partner in pro-poor programming, capacity-building and policy-making.
Methodological Note on Review Process
30. This review assesses key measures of efficiency and effectiveness in APR's portfolio of loans and grants for the period 1 July 2012 to 30 June 2013. The portfolio consists of US$ 1.8 billion in IFAD financing, and total project costs of US$ 3.9 billion.
31. The review draws on corporate databases such as the divisional management plan, an APR mid-term portfolio review covering the period July to December 2012, an APR divisional workshop held in March 2013, and surveys and internal discussions held with country teams towards the end of the reporting period.
32. The review drew heavily on APR's Supervision Quality Assurance process, which:
(i) provided an oversight function on the quality of supervision (e.g. on issues of process, substantive assessments, stakeholder consultation and mission impact);
(ii) cross-checked alignment within supervision mission reports, their respective Project Status Reports and previous supervision findings;
(iii) ensured consistency with standardized corporate and divisional benchmarks; (iv) validated the coherence of project performance ratings; and (v) facilitated knowledge management and learning among CPMs, country teams and other IFAD
staff.
33. The APR portfolio review provides a launching pad for further work on improving divisional performance and impact. APR aims to deepen the discussion, and enhance its performance, through quarterly country programme updates and a mid-term portfolio review in January 2014.

1
I. OVERVIEW OF THE ECONOMIC AND SOCIAL SITUATION IN THE REGION
1. Among the world's developing regions, Asia and the Pacific has arguably witnessed the most dramatic overall transformation since 2000, enjoying widespread economic growth and lifting hundreds of millions out of extreme poverty. Asia and the Pacific has already achieved the MDG1 target for 2015 of halving US$ 1.25-a-day poverty levels. The absolute number of poor declined from about 1.5 billion in 1990 to about 758 million in 2010; relative to total population, poverty rates declined from 55% in 1990, to 21%. Assessed against other MDG targets, Asia's success in areas like health, education and access to safe drinking water all stand out globally. Progress towards MDG targets is particularly notable in view of the 30% increase in population since 1990.
2. With strong economic growth, most of the poor in Asia and the Pacific now live in middle-income countries. GDP growth in the region is forecast to increase to 6.6% in 2013 and to 6.7% in 2014 after having slowed from 9.2 % in 2010 and 7.3% in 2011 to 6.1% in 2012. As overall income growth has moved a number of countries (including India, Indonesia, Pakistan and Sri Lanka) into middle-income status, 80% of Asia's US$ 1.25-a-day poor now live in middle-income countries. Asia’s growth has relied on heavy resource consumption, resulting in an expanding ecological footprint. Intensive resource use, rising energy costs, growing pollution, limited resource endowments, and declines in the ability of ecosystems to provide critical services are all contributing to greater environmental, economic and social vulnerabilities.
3. Most of the progress in reducing poverty has taken place in East Asia, especially in China. South Asia, which accounted for 609 million extreme poor in 1990, still held 507 million in 2010 – about 40% of the world's poor. On the other hand, South Asia has achieved MDG targets for access to safe water, and met nearly 85% of the goal to close the gender disparity gap in primary and secondary education. This sub-region has also made good progress on child mortality rates.
4. Asia and the Pacific still remain home to almost two thirds of the world's poor, and two thirds of the world's 568 million undernourished and hungry people (measured in terms of caloric intake). Deprivation is particularly evident in the high prevalence and persistence of undernourished children – nearly three out of every four of the world's underweight children reside in developing Asia; almost one out of every two children in South Asia are stunted, including 61 million in India alone.
3 Deficiencies in essential micronutrients, such
as vitamin A, iron and iodine, are also widespread in the region.
5. Rural people in Asia and the Pacific face new, and perhaps more complex, challenges than they have in the past. Lifting the remaining poor out of poverty is now more challenging since the majority are chronically poor. A striking reality in Asia is that, although extreme poverty has halved, about 1.5 billion people in Asia still live below the US$ 2-a-day poverty line. For many countries in Asia, the multidimensional challenges of food security, climate change, social inclusion and economic opportunity need to be tackled together with the challenge of reducing poverty. Climate-related extreme weather events are compounding these challenges. Poor communities in both rural and urban settings are the most vulnerable to the negative impacts, with those in small island developing states facing the starkest challenges. Over the next decade, these challenges will become even more pronounced.
6. Over 70% of the region's poor reside in rural areas. Rural poverty has persisted due to factors such as eco-system degradation, limited infrastructure and restricted access to markets and financial services, in addition to weaker social services in rural areas. As growth in the agricultural sector has slowed, this has resulted in slower growth in rural employment and incomes, and an increased rural-urban income gap. The competition for land and changing market forces also mean that production of non-food crops is expanding faster than production of food crops, including in South Asia and East Asia, where hunger and undernourishment challenges persist or are growing.
7. Broader advances in gender equality need to be made. Almost half of the adult women in South Asia are illiterate, and girls are more likely to drop out of school than boys; women’s participation in the labour force is among the lowest in the world. Throughout Asia and the Pacific, women earn less, have few decision-making powers over income earned, and are less able to access services, credit and production assets.
8. Indigenous peoples do not fully share in the benefits of growth, and suffer higher and more chronic poverty than other groups as their access to natural resources diminishes, and their vulnerability increases. Of the 300 million indigenous people in the world, over 70% live in Asia and the Pacific, and one third are poor. Often in remote locations with limited access to markets and services and weak physical and social infrastructure, they face particular difficulties in adjusting to the normative rules and regulations of an
3 UNICEF (2012) State of the World’s Children 2012 and 2010 World Population Prospects.

2
increasingly market-oriented economy, which often challenge their traditional approaches to sustainable natural resource use. In almost all countries in the region, the income gap between indigenous peoples and the majority population is widening.
9. Fragile or conflict-affected states4 have seen substantially lower poverty reduction in comparison to
stable well-governed countries. High fertility and population growth rates, along with a large proportion of young people, mean that fragile states will continue to face a high demand for social services, jobs and political participation. Since vulnerability and fragility are often connected to an economic reliance on natural resources, climate change and environmental degradation will affect fragile states more directly and severely than in other countries.
10. Agriculture continues to employ between one and two thirds of the economically active population in developing countries of the region, a large majority of whom work on small farms. More than 2.2 billion people in the region rely on agriculture for their livelihoods. Agricultural GDP increased from US$ 2.4 trillion in 2000 to US$ 10.0 trillion in 2011 (from US$ 1.2 trillion to US$ 2.6 trillion when excluding China) in developing Asia. In 2007, about 87% of the world’s 500 million small farms (less than 2 hectares) were in Asia and the Pacific region. In many countries, average farm size continues to diminish.
11. Although high food prices reduce real incomes of the poor, the rising demand for food and high-value agricultural products has created attractive investment opportunities and transformed the agro-food industry. A recent study
5 focusing on two important staples of the region (rice and potatoes) illustrates how the surge
in demand has combined with an increase in scale and a change in technology (in terms of milling and storage), as well as improved communications through the use of mobile phones. These changes have diminished the role of village traders, linking farmers to wholesale markets or mills; while traders have made important investments in warehouses and increased their scale. Supermarkets and traditional food shops have shifted from unbranded products to packaged and branded ones, helping signal quality differentiation.
12. To ensure that poor rural women and men can benefit from these transformations, it is critical that higher food prices are transmitted to smallholder farmers. The diffusion of information and communication technologies is playing an increasingly important role in supporting rural entrepreneurship in the region. In addition to leveraging stronger linkages between producers and wholesalers, mobile phones are now used to share agricultural market information and improve transparency, transfer money and provide early warnings for unforeseen adverse conditions and crises.
13. Smallholder production and rural livelihoods are challenged by the growing likelihood of extreme weather conditions in the region. Enhancing the resilience of the rural poor requires channeling further efforts towards adaptation, not just in expanded research into improved crop yields and tolerance of temperature and water scarcity, but also in pest management, soil conservation and cropping patterns. Through its loans and grants programme, IFAD is investing in: (a) making agriculture less risky for smallholders; (b) conserving the environment and raising productivity; and (c) implementing adaptation measures to counteract the adverse effects of climate change.
14. Employment growth across Asia and the Pacific has led to significant increases in remittance flows. In 2012, an estimated 60 million migrant workers sent US$ 260 billion to their families, which accounts for 63% of global transfers.
6 Most remittance-receiving households in the region live outside the formal financial
system, particularly those from rural areas. They have limited access to savings accounts and other financial instruments that can help build assets. Thus, remittances play a significant role in providing relatively more stable sources of income than most other external flows- and are particularly important in fragile states. Providing rural households with more options for utilizing their money leverages the development impact of remittances.
15. Data indicate that over the past ten years, for all sub-regions in Asia, government spending in agriculture has reversed a continuous decline since the 1980s.
7 However, this growth has not matched the
growth in public revenues and in overall expenditure. As a result, the share of agriculture in public spending, along with public spending on agriculture per agricultural worker, remains below 1980 levels.
4 According to the OECD, 12 countries in Asia and the Pacific are fragile, meaning that they have weak capacities to carry out
governance functions, are vulnerable to shocks, and lack the institutions and capabilities to adapt to changing social needs and expectations: Afghanistan, Bangladesh, Myanmar, Nepal, North Korea, Pakistan, Sri Lanka, Timor-Leste in Asia; Marshall Islands, Federated States of Micronesia, Kiribati, Solomon Islands in the Pacific. 5 ADB and IFPRI. 2012. The Quiet Revolution in Staple Food Value Chains.
6 Source: IFAD 2013. Sending Money Home to Asia: Trends and Opportunities in the World’s Largest Remittance Marketplace.
7"Financial resource flows to agriculture: A review of data on government spending, official development assistance and foreign direct
investment", FAO ESA Working paper No. 11-19, December 2011

3
16. Decentralization has led to a more significant role for local government units in priority setting, budget allocations and execution of poverty reduction initiatives. The region's transformation reflects one of the most pronounced changes in today's global economy – featuring market reform, privatization of state-owned enterprises, increased trade and, in many countries, expansive devolution of fiscal and administrative powers to local governments. However, there is a risk that decentralization may widen gaps and increase rural-urban inequality. In China, for example, public spending per capita in the richest province is almost 50 times that in the poorest. Similar patterns are observed in India, putting an onus on central efforts to assure greater fiscal redistribution to poor regions. With an increasing share of revenues and spending taking place locally, those local administrations that lack own-revenue sources face major challenges in providing good services to their constituencies, and poor households cannot afford the high costs of basic public services. Under decentralization, a deliberate effort to measure poverty reduction and demonstrate innovative solutions is critical for nurturing local adaption and scaling up.
II. COUNTRY PROGRAMMES
17. APR’s vision is to position IFAD as a preferred partner for rural poverty reduction in Asia and the Pacific. In doing so, the division seeks to respond to the rapidly changing environment in Asia and the Pacific by enhancing existing instruments and seeking out innovative solutions that provide its clients with the financial resources, knowledge and technical solutions required to enhance the effectiveness of country-owned/locally driven poverty reduction initiatives. APR aims for IFAD to be recognized as a visible and effective leader in transforming small-scale farming into a sustainable business, enabling smallholders to benefit from emerging market opportunities that can lift them out of poverty; and in strengthening the resilience of impoverished rural households to climate variability and market volatility. It seeks to demonstrate, and scale up, effective models that create more jobs and increase the participation of poor rural people, particularly women and youth, in thriving rural economies.
18. RB-COSOP formulation and reviews have highlighted a number of issues related to positioning IFAD in the region. They include: the interest of partners from Middle-Income Countries (China and Indonesia) in IFAD playing a lead role as knowledge broker on rural poverty reduction options and models; the strengthened commitment to country-led programming as borrowers reach or approach middle-income status and consolidate institutional capabilities (e.g. as in the Philippines and Sri Lanka); and the need for adaptive programming in fragile states, such as in Myanmar and Nepal. In the Pacific, country partners have sought IFAD support to capitalize on opportunities for building public-private partnerships that offer remunerative and sustainable smallholder agriculture solutions. In addition, decentralization is emerging as a key challenge in several country partnerships: it multiplies the level of engagement needed from country teams and ICOs to address the diversity of implementation capacities of local authorities- particularly in the poorest and most remote rural areas, as experienced in IFAD-funded programmes in India, Indonesia, Lao PDR and Pakistan.
Box 1: Strategic partnership building includes South-South Cooperation and ICTs for Development
APR is exploring avenues for strengthening South-South partnerships with the Governments of China, Indonesia and South Korea, including through jointly-financed programmes to strengthen regional exchanges and knowledge sharing. This includes three country grants designed under an umbrella Technology for Development (T4D) programme that South Korea has agreed to fund and Intel has agreed to support. The T4D Programme seeks to apply ICTs to improve the dissemination of market and technical information, and to enhance service provision to poor households in remote areas. The programme will begin operations in 2013 with pastoral communities in India, as well as with smallholder farmers in Papua New Guinea and Cambodia. It will be expanded to Bangladesh in 2014.
A. RB-COSOPs
19. While no RB-COSOPs were presented to the Executive Board during the reporting period; APR is currently developing RB-COSOPs for the two poorest countries in the Mekong – Cambodia and Myanmar – and the poorest country in South Asia – Nepal. In addition, APR is currently developing its strategy for the Pacific, with a view to expanding its partnerships and engagement in addressing nutrition challenges and climate change. APR also intends to develop RB-COSOPs for two other fragile states, Afghanistan and Sri Lanka, in 2014.
20. An RB-COSOP for Myanmar scheduled for presentation to the EB in 2012 was postponed because of the rapid political changes taking place in the country, including a re-positioning of the Government's own poverty reduction strategies. To respond to the fast-evolving conditions, IFAD approved a small country grant to assist the Government in deepening its operational programming and in implementing the pro-poor

4
priorities it had adopted. The RB-COSOP is currently being updated; in the meantime, in view of the pressing challenge of addressing extensive poverty predominant in rural areas, a concept note for IFAD's first investment project in Myanmar was submitted to OSC, on 12 June 2013.
21. APR has 13 EB-apprved COSOPs of which 9 are RB-COSOPs and require an annual review. During this review period, annual reviews were conducted in 9 countries with RB-COSOP
8. Highlights from these
reviews are provided in Table 1.
8 The RB-COSOP review for Pakistan was postponed by Government and is scheduled for Q3 of 2013. The RB-COSOP for Viet Nam
was approved by the EB in 2012 and coincided with the completion of IOE’s Country Programme Evaluation for Viet Nam; the first review will be held by the end of 2013.
Table 1. Highlights of COSOP reviews during the review period
Afghanistan
(2008-2012)
Review:
(Dec 2012)
The current COSOP, scheduled to conclude in 2012 fits well with the Afghanistan National Development Strategy as do the one on-going (RMLSP) and one upcoming project. Initial lessons and recent emergence of district and village councils as the authorized institutions for local development and service delivery will inform future strategic directions for IFAD. Although the COSOP has the right sectoral priorities, based on the experience of RMLSP, the geographical concentration and activity menu needs to be further tightened for enhanced impact. Security conditions would continue to guide geographical targeting along with capacities of government and private service providers. Co-financing needs to be pursued more vigorously to enhance impact and promote better donor coordination.
Bangladesh
(2012-2018)
Review:
(Feb 2013)
Micro-finance, pro-poor infrastructure, open water inland fisheries and market access are the focus areas of the country portfolio. Main achievements include small farmers’ access to efficient agricultural technologies for crops, poultry, livestock and fish; to improved markets and financial services; and to water bodies under the leasing arrangements. Empowerment of women is being ensured through increased access to economic opportunities. To better capture achievements and impacts, an improved country M&E system will be made operational in 2013.
Cambodia
(2007-2012)
Review
(Dec 2012)
The IFAD programme in Cambodia has reached more than 220,000 smallholder households (above the 137,000 COSOP target) and estimates that around 70 percent have realized increases in yield or production of crops/livestock. IFAD projects reportedly contributed to increase farmers’ incomes (both on and off farm) (RPRP PCR) and assets (CBRD PCR). There is also evidence of reduction in debts and paying lower interest among IFAD project beneficiaries (Group Revolving Fund study), as well as improvements in women’s participation and leadership combined with decreases in domestic violence (RULIP MTR).
The annual review found that there is ample scope for increasing impact and sustainability through: (i) incorporation of beneficiary specific needs and motivations in the way support is provided; as well as (ii) design of delivery systems where service providers (both public and non-public) are adequately assessed and managed based on performance. Strengthening the public sector and supporting delivery of services by multiple stakeholders. is critical for higher sustainability and impact in the key emerging areas of intervention, such as promoting poor farmers access to markets and agribusiness development. Such activities require business-like expertise which is often found in private sector service providers. The Government has started to follow such an orientation under PADEE (CB-1559), where MAFF is partnering with non-public service providers in knowledge generation, rural finance and extension services to achieve greater effectiveness.
China
(2011-2015)
Review:
(Dec 2012)
As indicated by APR supervision processes, there is a significant improvement in household assets and incomes in the project areas, with an average PSR score of 4.8. Scores appear favourable as a result of solid performance with respect to rural infrastructure, improved access to land, and on-farm investments. In terms of food security, all IFAD-supported projects reported improvements in food availability and accessibility. Surveys reported high percentages of beneficiaries increasing grain production (49-73%), with corresponding decrease in the number of households suffering hunger. Chronic child malnutrition also decreased remarkably.
India
(2011-2016)
Review:
The annual review shows the overall performance of IFAD’s India portfolio to be satisfactory. The performance of on-going projects has improved with a reduction in the number of problem projects from 4 in 2011 to 2 in 2012. In terms of outreach, since January 2010, 1.5 million households have been reached. Impact surveys show that IFAD funded projects are reducing poverty, with increased income and ownership of assets, increased food security, improved housing, better

5
B. Selected Country Programme Issues
22. In line with APR’s vision and the evolving contexts in the region, RB-COSOPs formulated with Governments and COSOP joint reviews are placing additional emphasis on: commercialization of smallholder agriculture and private sector participation; outreach to women and youth; remittances for development; and adaptation to climate change. These areas are expected to gain increasing importance in strengthening the APR portfolio.
23. IFAD-funded projects in the region are increasingly engaging with private sector partners as prospective investors, service providers and integral partners in agricultural development. In Vietnam, for example, IFAD is a member of a Public Private Partnership Group (PPPG) and pursues a market oriented participatory approach in all project provinces. Planning and building sustainable partnerships between poor producer groups and private sector traders or processers, enabling further partnerships through small infrastructure, business environment development and small competitive grants is a new successful strategy for Vietnam and widely promoted by the country programme.
(Mar 2013) access to water and hygienic sanitation, and women’s empowerment.
Indonesia
(2009-2013)
Review:
(Feb 2013)
In 2012 about 2.4 million persons benefited from IFAD support, of which of 44.9 per cent were women. 21,500 households reported improved food security and 89.4 per cent households reported an increase in assets. Since commencement of the current COSOP in 2009 and through to 2012 the overall percentage of poor people living in rural areas of Indonesia has declined from 17.4 per cent in 2009 to 15.1 per cent in 2012. There are similar trends in the project provinces, with an average 4.6 per cent decline of poor people living below the poverty line, an average 1.0 per cent decline in the poverty gap index and an average 0.3 per cent decline in the poverty severity index.
The on-going IFAD-supported programmes and projects are working in provinces where poverty is highest relative to the rest of Indonesia– especially in West Papua, Papua and Maluku. Robust economic and the overall downward trend in poverty points to favourable opportunities for the ongoing (and forthcoming) IFAD-supported programmes and projects to contribute to reducing poverty in Indonesia.
Laos
(2011-2015)
Review:
(Dec 2012)
The joint review concluded that IFAD-supported projects have contributed significantly to poverty reduction in Laos through an increase in irrigated land, productivity enhancement in rice and livestock and diversification of farm production. IFAD's collaboration with the government has been excellent and IFAD’s country office has helped in raising IFAD’s engagement. A co-financing ratio of 1.28 compares well with the regional average. The country programme is supporting the creation of a policy think tank and helping to build the capacity of national institutions. IFAD projects have generally been very proactive in targeting the poor and vulnerable communities and different ethnic groups. It observed that rich experience was being generated but it was not always captured in a systematic manner. The review recommended a number of actions to improve implementation, expand impact, and enhance sustainability.
Nepal
(2007-2012)
Review:
(Dec 2012)
Economic empowerment, improvements in roads and market access, and inclusive development are the strategic thrusts of this COSOP, in line with the current Government’s policies and strategic priorities. At the project level, reports indicate positive impact on household food security and on forest cover, and good results in small rural infrastructure (irrigation, link roads, water mills, etc.) and in women’s empowerment. IFAD has successfully engaged with NGOs and development partners such as the World Bank. Impact on policy reform has been limited.
Philippines
(2010-2014)
Review:
(July 2012)
The approach articulated in the COSOP reflects the Philippine Development Plan for 2011-2016 (PDP) which focuses on strong inclusive growth in addition to improving governance, infrastructure, human capital, and social safety nets, as well as access to finance. After 2 years of the start of the COSOP period, it is not yet possible to make a detailed assessment of the effectiveness of the approaches proposed for reaching the three SOs. At the time of the review there was only limited information available to base an assessment for SO1 because of absence of outcome or impact data. This points to the need to improve timely collection and analysis of data from individual projects. IFAD-assisted projects have generated a number of innovative features that are being scaled up, or that lend themselves to potential scaling. According to the 2011 Client Survey the perception is that the aid effectiveness of the IFAD Philippines has shown a marked improvement in the past 2 years.

6
Box 2: Examples of Private Sector Partnerships in Asia and the Pacific
The HVAP project in Nepal (NP-1471) has undertaken 3 value chain studies (ginger, apple and vegetable seeds) and launched a first round call for interest from enterprises, cooperatives, producer groups, which received a strong and encouraging response. Inclusion of the poor, or lack thereof, in the funded activities is a risk and specific inclusion actions have now been included in each value chain action plan, in addition to the use of inclusion criteria in selecting priority proposals for funding and in the Post-Harvest Facility. In the Maldives, IFAD has leveraged private sector co-investment in key pro-poor value chains and is assisting in opening new market opportunities through the direct engagement of hotel resorts in procuring from IFAD target groups. The latter have received technical and organisational strengthening support from the IFAD-funded project, in order to strengthen the quality and reliability of their supply chain and thereby fulfil the requirements of these innovative partnerships. In Indonesia, opportunities for public-private partnerships are emerging to support smallholder market-oriented agricultural and fisheries development, market access and value chain development such as the partnership with MARS and ADM in providing services to poor cocoa farmers in Central Sulawesi and Papua. In Papua New Guinea, PPAP has successfully facilitated partnerships in coffee and cocoa between private sector operators - mostly agribusinesses and communities of smallholders - who have concluded written partnership agreements with their agribusiness counterparts. In many of these remote areas, IFAD-targeted smallholders had never received technical support and productive inputs prior to the establishment of these partnerships. In Cambodia, IFAD’s operations have established 2,919 private sector extension and animal health workers with good initial results.
24. Different experiences illustrate the opportunities and challenges in promoting innovative agricultural investment. In Solomon Islands, the SIRDP (SB-1565) provides equity funding managed by private banks aimed at reducing risk and encouraging rural business development. Under the scheme, private sector investors matched RDP equity grants at a ratio of more than 6:1, providing a total of more than US$ 6.6 million for the US$ 1.1 million granted under the project. This approach has now been replicated in Tonga. In Sri Lanka under NADEP, the Central Bank, which until recently has been implementing the equity finance component, was unable to forge appropriate internal mechanisms to conclude partnerships with the private sector- in spite of the receipt of viable, pro-poor partnership proposals from a number of established businesses. Similar challenges were faced under the equity-oriented Venture Capital Fund of IMPP in Viet Nam. A mid-term review of 3PAD in Viet Nam reported some weaknesses in the Agri-business Promotion Fund, with respect to selection process, pro-poor partnerships and business-farmer linkages, agreement enforcement and the capacity of the implementing partner to ensure effective monitoring. Important lessons have been generated by these experiences and shall inform future APR work in innovative and equity financing approaches.
25. In terms of support to SMEs, NMFP in India (IN-1121), MFTSP in Bangladesh (BD-1235) and MIOP (PK-1324) and PRISM (PK-1413) in Pakistan demonstrate successful examples of how IFAD can expand financial services to the rural poor, complementing the promotion of pro-poor services with technical support and capacity building. These cases also illustrate the importance of selecting project partners that are committed to improved organizational performance and that benefit from an enabling environment to improve outreach and delivery of financial services to the rural poor.
26. There are some good examples in Asia/Pacific countries of remittance schemes (funded under IFAD’s Financing Facility for Remittances) implemented to convert remittances into assets. For example an innovative approach to diaspora investment was piloted in the Philippines with an NGO working with migrant communities to to invest in an agricultural cooperatives. The programme was able to offer a guaranteed return of 6% plus a share in any profits. APR aims to replicate and scale up such innovative schemes, notably in the Philippines and Nepal. APR held extensive working discussions with Governments, banks and remittance service providers at the Global Forum for Remittances in Asia, held in Bangkok in May 2013.
27. Sustainable environment and natural resource management (ENRM) and adaptation to climate change are key priorities for the APR region, and are reflected in a number of RB-COSOPs. In close collaboration with the Environment and Climate Division, APR is further deepening the integration of ENRM and climate change issues into the APR portfolio. The Cambodia and Nepal COSOPs followed a similar strategic approach as that adopted for Viet Nam by including a strategic objective on adaptation to climate change,
9 a set of climate change indicators and a climate-informed pipeline of projects, two of which are co-
financed by grant funds from ASAP. The ASAP pipeline includes four operations (US$ 57 million in ASAP
9 Based on an in-depth environment and climate change assessment (ECCA) financed by ECD

7
financing) in Bangladesh, Cambodia, Nepal and Viet Nam to develop innovative responses that address climatic variability. In addition to ASAP and GEF-funded projects co-financed by IFAD, a number of APR’s regular loan projects include substantive ENRM activities – for example, the second phase of the Jharkhand Tribal Development Project (JTDP II) includes a component dedicated to integrated natural resource management.
C. Client Perspectives
28. Results from IFAD's Client Survey of 2012 suggest improvements in all countries relative to a similar survey held in 2011. As part of its corporate Client Survey for 2012, IFAD surveyed 152 partners from 7 countries in Asia.
10 Among the four segments
11 rated by respondents, APR’s highest average scores were
in its contribution to income and food security (average score of 4.7 out of 6). These concurrent improvements reflect the efficacy of IFAD's approach to enhancing market access for smallholders while also improving food availability. This two-pronged approach is increasingly promoted through higher investments in agricultural production combined with strengthening of pro-poor commodity chains.
Table 2: Client Survey Scores for APR
Co
un
try
Ow
ne
rsh
ip
Ali
gn
me
nt
Ha
rmo
niz
ati
on
Inc
om
e
Fo
od
Se
cu
rity
Em
po
we
rme
nt
Na
tio
na
l P
oli
cy
Dia
log
ue
Pa
rtic
ipa
tio
n i
n
Po
lic
y
Dis
cu
ss
ion
s
Eff
ec
tiv
e
Pa
rtn
ers
hip
s
Av
era
ge
2013 4.6 4.5 4.4 4.7 4.7 4.5 4.3 4.3 4.6 4.5
2011 4.3 4.5 3.9 4.4 4.2 4.4 3.7 3.7 n/a 4.1
29. ICOs in the region have contributed to an improvement in scores. The evolving business model of ICOs and out-posting of CPMs is expected, to ensure a stronger client orientation and higher level of effectiveness, as well as to generate cost-savings. However delays by host countries in approving necessary agreements have placed this expectation at risk. With added pressure on limited budget resources, this has magnified APR’s challenge in achieving a higher level of excellence and in deepening its engagement of country partners.
30. IFAD's focus on identifying opportunities and delivering the tools and methods for addressing the most challenging rural poverty conditions is the best driver for improving client satisfaction. The case of Bhutan, where IFAD does not yet have an ICO, is illustrative: Bhutan scores highest among all 32 surveyed countries with respect to impact, and was one of nine countries scoring 5 or higher on alignment. In this case, APR strengthened its client relationships by drawing on support from the India country team. This approach, together with IFAD's strategic focus in the country, has secured IFAD’s strong standing as a trusted and valued partner. Sub-regional clusters therefore appear to be a viable option for APR to support operations, and strengthen its engagement of country partners.
31. IFAD country partners rated 'national policy dialogue' and 'participation in policy discussions' lowest on average, corroborating an observation by IFAD's IOE (in its CPEs of Nepal and Indonesia) that resources programmed towards knowledge management, policy dialogue and active participation in donor coordination at the country level, although improving, remain insufficient.
III. CURRENT INVESTMENT PORTFOLIO AND OPERATIONS
A. Characteristics
32. IFAD's current portfolio in the Asia and Pacific region consists of 65 approved projects and programmes and 41 ongoing grants across 30 member states for a total project cost of US$ 3.6 billion. The amount of IFAD financing increased from US$ 1.6 billion two years ago to US$ 1.8 billion today. As of 30 June 2013, APR is providing investment and country grant financing to 24 countries. Additionally, Thailand and 9 countries in the Pacific Islands benefit from IFAD regional grant financing.
10
The survey was held among IFAD partners in the following countries: Bhutan, China, India, Laos, Maldives, Mongolia and Sri Lanka 11
1- IFAD’s aid alignment; 2- contribution to incomes/food security/empowerment; 3- policy dialogue; and 4- partnerships

8
Table 3: APR loan/DSF current financing and project cycle as of 30 June 2013 (US$ ‘000)
Not signed Not effective Ongoing Completed/Cancelled over review period Total
No. of
projects Total
financing No. of
projects Total
financing No. of
projects Total
financing No. of
projects Total
financing No. of
projects Total
financing
2012/2013 1 51 001 0 0 64 1 765 690 5 143 721 70 1 960 412
2011/2012 2 86 093 0 0 59 1 543 418 7 161 896 68 1 791 407
2010/2011 4 124 355 1 11 479 56 1 388129 5 83 810 65 1 589 446
Source: PPMS (current financing)
Current portfolio by sectors/themes
33. Support for developing market opportunities receive the largest single amount of IFAD financing in the region: 406 million, or 22%, of the current portfolio is directed towards this category – an increase of 5 percentage points since 2010/2011. During these past 2 years, the share of resources attributed to financial services has dropped from 17% to 11%. As illustrated in Table 4, shares remained fairly stable for the 12 other results categories, to which 66% of funds are distributed.
Table 4: APR - IFAD financing by result category (US$ '000) - current portfolio as of 30 June 2013
Sector 2010/2011 2011/2012 2012/2013 2010/2011 2011/2012 2012/2013
Market and related infrastructure 261 479 305 886 405 966 17% 18% 22%
Management 155 780 175 523 196 196 10% 11% 11%
Rural financial services 265 889 209 398 194 993 17% 13% 11%
Community driven development 205 916 178 652 172 204 13% 11% 9%
Natural resource management 89 944 151 148 151 758 6% 9% 8%
Research, extension and training 120 401 120 786 131 073 8% 7% 7%
Agricultural production 73 170 98 465 128 596 5% 6% 7%
Policy and institutional support 112 165 117 556 127 818 7% 7% 7%
Small and micro-enterprises 83 606 75 514 82 445 5% 5% 5%
Irrigation 35 675 54 867 77 008 2% 3% 4%
Livestock and rangelands 59 466 57 644 70 300 4% 3% 4%
Fisheries 54 598 54 470 58 724 3% 3% 3%
Human development 28 187 21 494 19 539 2% 1% 1%
Other 32 358 32 724 2 455 2% 2% 0%
Grand Total 1 578 633 1 654 127 1 819 074 100% 100% 100% Source: PD Front Office
34. Currently US$ 1.1 billion of IFAD financing, or almost 60% of the portfolio value, is directed towards South Asia, through a total of 35 projects in eight borrowing countries of the sub-region. Close to US$ 0.5 billion is allocated to South East Asia; and US$ 240 million to East Asia; the remaining US$ 25 million is committed to projects in the Pacific.
35. Co-financing has improved, from 0.92 during IFAD8 to 1.1 as of June 2013, according to IFAD's corporate databases. The Pacific features the second highest co-financing rate, 2:1, as a result of partnerships with AusAID, the EU and the World Bank.
9
Chart 1: IFAD sub-regional financing and co-financing
36. The drastic decline in Asia’s share in total global ODA over time poses a challenge to mobilize co-financing for APR-funded projects Although the share of total development assistance provided to Asian developing countries’ agricultural development has increased in recent years to about 7% in 2009, it is far below the peak levels of 25% in 1985. On average, the amount of aid to agriculture per agricultural worker during 2007-2009 is estimated at US$ 9 in South Asia (excluding India) and US$ 5 in East Asia and the Pacific (excluding China). These levels are much lower than MENA (US$ 22), Latin America and the Caribbean (US$ 14), and Africa (US$ 12). The challenge of mobilizing external co-financing in Asia is compounded by the policy stance of large borrowing countries to collaborate with a single donor agency (such as IFAD) on any given project.
37. Overall, 84% of the regional portfolio is highly concessional or DSF, as compared to 89% last year. With new approvals in China and Indonesia, the proportion of IFAD finance provided on ordinary terms has increased from 3% to 9%. Together with approvals associated with low-debt sustainability (Afghanistan, Maldives and Nepal) the financing share of highly concessional has dropped by 10%. The table below provides a summary of IFAD financing by terms.
Table 5: Financing Terms
Financing Terms 2012/2013 2011/2012
No. of Projects % of financing No. of Projects % of financing
DSF (red) 10 8% 8 5%
DSF/HC (yellow) 4 6% 3 4%
Highly Concessional 43 70% 45 80%
Intermediate 4 7% 4 8%
Ordinary 4 9% 1 3%
Total 65 100% 61 100% Source: PPMS
B. Operations
38. APR's Quality At Entry (QAe) scores continue to improve. A total of seven projects underwent Quality Enhancement during the review period and five projects were reviewed through QAe. All five QAe-reviewed projects were rated 5 (on a scale of 6) with respect to compliance with project-specific Quality Enhancement (QE) recommendations. Overall quality of design was rated 5 for 4 of the five projects reviewed. Issues related to implementation arrangements and logframes were raised, including ensuring quantified logframe targets, which has tended to be a challenge primarily in relation to quantifying outcomes
-
500
1 000
1 500
2 000
2 500
South Asia South East East Asia Pacific Islands
45%
56% 48%
18%
27%
38%
17%
52%
US$
mill
ion
Domestic
Co-financier
IFAD current financing

10
Table 6: QA Ratings for APR
January 2008 to 30 June 2012 (41 projects) 1 July 2012 to 30 June 2013 (4* projects )
% rated 4 or more Average score
% rated 4 or more
Average score
RMF - 1 88% 4.4 100% 4.6
RMF2D 85% 4.4 n/a n/a
RMF-2 88% 4.4 100% 4.8
RMF-3 83% 4.2 100% 4.3
RMF-4 76% 4.2 80% 4.4
OA 73% 4.2 75% 4.6
DO 66% 80%
* IFAD9 RMF ratings are excluded (does not include QAe scores for Bangladesh 1647)
Approvals
39. Nine new projects and two supplementary financing operations were approved during the reporting period for a total IFAD financing amount of US$ 345 million (see Table 7)
12. IFAD’s Executive Board
welcomed the partnership and co-financing inherent in the projects, particularly for Bangladesh CCRIP which is co-funded with KfW and the ADB Strategic Climate Fund for an amount of US$ 59 million, and the CLAP project in Afghanistan, which includes a partnership with FAO. An EB member also noted IFAD's comparative advantage in supporting poor tribal communities in India, including contributions towards enhancing productivity, improving natural resource management and supporting land titles for tribal people. Similarly the EB discussed the positive results from IFAD's programme in China, where Chinese researchers have estimated that benefits tripled with IFAD projects, and about 25 million persons were lifted out of poverty. Risk monitoring and mitigation measures in Afghanistan, Nepal and Indonesia were recognized, given the challenging contexts under which these projects are to be implemented. Overall the EB commended the high level of country ownership embedded in all these projects.
Table 7: Project approvals during the review period (US$ '000)
Source: PPMS *Approved under the lapse-of-time procedure.
12
Four financing arrangements were approved through Lapse-of-time procedures
Country Project
ID Project Name
Project Board
Approval
IFAD Current
Financing
Loan effectiveness
Afghanistan 1637 CLAP 13-Dec-12 58 001 08-Apr-13
Bangladesh 1647 CCRIP 10-Apr-13 40 512 28-Jun-13
China 1627 HARIIP 21-Sep-12 47 000 21-Sep-12
China 1629 YARIP 13-Dec-12 46 700 31-Jan-13
India 1649 JTELP 21-Sep-12 51 001
Indonesia 1621 CCDP 21-Sep-12 26 200 23-Oct-12
Maldives * 1624 MEDEP 06-Sep-12 2 487 09-Jan-13
Nepal 1602 Biu-Bijan 21-Sep-12 39 000 02-Dec-12
Philippines* 1475 INREMP 13-Dec-12 20 000 12-Apr-13
Number of projects 9 330 901
Supplementary Financing
Nepal* 1450 PAF II 10-Dec-12 10 000
Philippines* 1485 RaFPEP 30-Nov-12 3 665
Number of projects 11 344 566

11
Entry into Force and first disbursements
40. Average time to Entry into Force (EiF) and first disbursement continues to improve. For the ten projects that entered into force during the reporting period, the time from Board approval to EiF averaged five months. As a result, the average time taken from approval to entry into force has improved for the overall APR portfolio, from 9.4 to 8.9 months. For most projects, the duration was between 0 and 4 months; however two cases have skewed the average due to lengthy time until signature of the respective project financing agreement: the late signature of GLLSP in Pakistan (21 months) and HILIP in Bangladesh (10 months) added 3 months to the APR average.
Chart 2: Average period from project approval to EiF/First disbursement
41. For projects effective before 1 April 2013, seven projects have not yet begun disbursements. Two projects have experienced exceptional delays in effecting first disbursements. The longest delay has been with respect to additional financing approved in 2006 to complement the Post-Tsunami project in Tamil Nadu, India. The original loan has only recently advanced sufficiently to trigger disbursement under the more recently approved additional financing. The second delay is the Southern Punjab project in Pakistan, which was approved in December 2010 and entered into force September 2011.
Part of the delay can be explained by the diversion of project partners attention to the dengue outbreak following the 2010 flooding and the suspension of recruitments around the general elections in 2013. The other projects without a first disbursement ar shown in Table 8 of Annex 1.
Table 8: Maturity of portfolio 2010 – 2013
Maturity
42. The average maturity of APR projects is 3.9 years, compared to 3.7 in June 2012. While 18 projects have been closed in the past three years, the current portfolio has grown to 65 projects from 56 projects as of 30 June 2011. Twenty projects have entered into force during the past two years.
Project completion/closings
43. Five projects were completed during the review period; and an additional 5 projects closed. Projects closed during this period experienced a delay in closing by about 6 months on average. Eight projects scheduled for closure by 30 June 2013 have not yet completed administrative actions to do so. Four of these eight are in Pakistan- including three that were scheduled to close in earlier review periods. APR and CFS have had extensive communications with the Government of Pakistan, and a resolution is expected by September 2013. In the coming reporting period, twelve projects are scheduled for completion, and nine are scheduled to close. A list of projects completed and scheduled for completion is provided in Tables 8.1 and 8.2 of the appendix.
Project extensions and overruns
44. Out of the cohort of 54 projects as of 30 June 2012, 8 projects (15%) were extended, for an average of 7.6 months. The reasons for extension were mostly to ensure bridge financing between loans; to align with completion dates of co-financed activities; or to allow for knowledge sharing, policy dialogue and scaling up. In two cases, extensions were sought as a result of delayed achievement of targets. One of these is subject to phased sequential financing under Flexible Lending Mechanism arrangements. Four of these projects and one project extended in 2011 have a time overrun above 15%. A summary of extension rationale is provided in table 13 of annex 1.
Portfolio Maturity Number
of projects
Average loan size
('000 US$)
Average Project
Duration (years)
Not signed/not effective 1 51 001 8.0
< 1 year 9 34 432 5.9
< 3 years 17 30 347 5.5
< 5 years 18 25 777 6.6
<7 years 13 25 466 7.1
≥ 7 years 7 20 693 11.1
APR average: 3.9 65 27 949 6.8
0 5 10 15 20
2010/11 (Ongoing: 55)
2011/12 (59)
2012/13 (64)
11.4
9.4
8.9
7.7
6.5
6.5
Months
Approval to EiF EiF to first disbursement
16.0
16.3
19.2
*Excluding additional financing

12
Cancellation/Reductions
45. There have been no loan cancellations during this review period. SDR 2 million in undisbursed amounts have been recovered at the time of project completion. Of these, SDR 1.245 million was cancelled from 3 loans to Pakistan due to unutilized balance at the project completion. A total of SDR 450 000 was cancelled from a single loan to China at financial closing; and SDR 312 000 from a single loan to Cambodia.
Arrears
46. As of June 30 2013, DPR Korea is the only country in the APR portfolio in arrears, for a cumulative arrears of about US$ 7.6 million, an increase of US$ 1.5 million since 30 June 2012. Some small amounts have been paid against the outstanding balance of the arrears; however, with the UN Security Council imposing new sanctions, in March 2013, international payment transactions were blocked. IFAD and the Government are exploring options for repaying arrears by leveraging UN expenditures in North Korea.
IV. CURRENT GRANT PORTFOLIO AND OPERATIONS
A. Characteristics
47. The number and value of the overall portfolio of effective grants has been reduced dramatically, from 68 active grants valued at US$ 44 million in June 2011 to 41 active grants valued at US$ 35 million by June 2013. Of these, 16 are regional grants and 25 are country-specific. Eight grants are scheduled for completion within the next 12 months, and a similar number of new grants are envisaged for approval by June 2014.
48. Government agencies are the largest group of recipients, with a total approved financing of US$ 17.1 million. IFAD has also provided CGIAR centres with US$ 10.3 million; networks of governments or NGOs with US$ 6.8 million, and UN agencies with US$ 5.7 million. The remaining US$ 10.8 million has been granted to universities, NGOs or non-CGIAR research and policy centres. The largest single recipient among is FAO, which has benefitted from four grants for a total amount of US$ 4.7 million, almost 10% of the current portfolio.
Sub-regions/countries covered
49. Among the five sub-regions, South East Asia is the largest recipient of grants. Out of the 66 grants effective or completed during the reporting period, 24 South East Asia benefitted from 24, worth US$ 16.4 million. South Asia benefitted from 17 grants amounting to US$ 10.6 million; the Pacific from 6 grants amounting to US$ 4.7 million; and East Asia from 5 grants worth US$ 4.5 million. Thirteen grants, for an amount of US$ 13.4 million, cut across regions.
50. Three countries account for around two thirds of the country grants: Indonesia (4 in-loan capacity building grants worth US$ 4.0 million); Bangladesh (5 grants amounting to US$ 3.7 million) and the Philippines (4 grants amount to US$ 2.6 million). Viet Nam has the largest number of country grants (7) for a total value of US$ 2.4 million; Lao PDR participates in the most grants overall: ten regional in addition to one country grant.
Effective grants
51. The 26 large grants effective in June 2013 (13 regional and 13 country-specific) constitute almost US$ 30 million, or 84%, of the current total grant value, with an average of US$ 1.1 million per grant. The number of small grants has dropped from 24 last year to 15 this year, and their average size has increased from US$ 0.3 to US$ 0.4 million. Twelve are small country grants – a sharp reduction from 27 small country grants effective in June 2011 and 21 in June 2012, as allocations are increasingly directed to fewer but larger country grants.
52. The number of active regional grants (large and small) continues to decline, from 29 in 2010 to 16 in 2013. As indicated in table 1, the proportion of funds allocated to regional grants has dropped from 63% of APR grant funds in the previous reporting period to 52% this year, reflecting an increasing focus on country-specific capacity-building efforts.
Table 9: Effective grants, by window and size
Grant Window
Grants
Amount
No. % US$ %
Large regional
13 32 16 884 000 48
Small regional
3 7 1 500 000 4
Total regional
16 39 18 384 000 52
Large country-specific
13 32 12 715 100 36
Small country-specific
12 29 4 425 000 12
Total country specific
25 61 16 140 100 48
Total 41 100 35 524 100 100

13
0
5
10
15
20
25
SF1 SF2 SF3 SF4
US
$ m
illio
ns
2010-11 2011-12 2012-13
53. The grant policy output “Capacity of partner institutions strengthened” features the highest number and value of grant funding among currently ongoing grants. A total of 24 grants, amounting to US$ 17.7 million, are directed towards this output. This amount is almost matched by the allocation towards output 1: “Innovative activities, technologies and approaches in support of IFAD's target group”, although the number of grants is almost half, reflecting the higher cost of upstream research and development. The increase in capacity-building resources while the overall grant portfolio size has decreased, demonstrates APR's commitment to strengthen the capacity of IFAD country partners engaged in rural poverty reduction.
Chart 3: Number and value of grants, by revised Grants Policy Outputs
54. In terms of IFAD’s strategic framework objectives, almost half of the currently ongoing grants are in support of SF2, “Improved agricultural technologies”, which absorbs more than half of the value of the grant portfolio. The rest of the portfolio is mostly distributed among policy support (SF6), pro-poor market development (SF4) and natural resource management (SF1). Details are provided in Annex 2.
Table 10: Number and value of grants, by strategic framework objective
Strategic framework objective No. Financing
US$ %
1. Access to natural resources, and their management 6 4 158 000 12
2. Improved agricultural technologies and effective production services 18 18 894 100 54
3. Broader range of financial services 1 1 100 000 3
4. Transparent and competitive agricultural input and produce markets 7 4 749 000 13
5. Opportunities for rural, off-farm employment and enterprise development 1 500 000 1
6. Participation in local & national policy and programming processes. 7 5 623 000 16
Cross-cutting 1 500 000 1
Total 41 35 524 100 100
Loan and grant linkages
55. Eighteen grants, worth US$ 14.4 million, are classified as "in-loan grants" and therefore intrinsically tied to larger, IFAD loan-funded investment programmes. Fifteen of these in-loan grants target capacity building of institutions to improve services to poor rural women and men. Two of the remaining three in-loan grants (one each in Bangladesh and China) seek to promote innovative technologies and approaches in support of IFAD’s target groups; and the last one seeks to strengthen learning and knowledge sharing, with a view to scaling up successes from earlier projects (in Bangladesh).
56. Joint grant and loan workshops, or country annual review meetings, have been organized by IFAD in about half of the borrowing countries (Bangladesh, China, India, Indonesia, Lao PDR, Philippines and Viet Nam) in order to strengthen linkages particularly with regional grants. Visits to regional grant target areas have also been undertaken during project supervision missions.
57. Linkages between IFAD regional grants and investment projects have varied greatly. Grants focused on capacity building have close linkages to investment projects by nature of their scope and mandate. Regional Programmes seeking to introduce innovative technologies and methods, such as those to CGIAR institutions, are also closely related to loans through dissemination of technologies; in these cases, the strength of linkages has often been tied to the level of engagement with IFAD country teams.

14
Box 3: Examples of loan-grant linkages
The "Tonga Rural Innovations Project” became effective, scaling up what was originally a regional grant (“Mainstreaming of Rural Development Innovations Programme in the Pacific” - MORDI II 1081) to 84 000 households in 60 communities. The “Root and Tuber Crops Research and Development Programme for Food Security in Asia and the Pacific Region” (CIP 1239, also called FoodSTART) organized value-chain trainings to build capacity of investment project staff in West Papua, and in China, the HARIP Project earmarked US$ 1 million to scale up findings and results of the FoodSTART programme. In the Philippines, the programme has begun to cooperate with food business enterprises of indigenous populations in the Cordillera Hills through linkages with IFAD CHARMP2 loan project. The CIAT-implemented Food, Feed, Fibre, and Fuel for a Greener Future programme (4FGF) has developed strong linkages with IFAD projects; for example the RULIP programme in Cambodia is conducting more than 50 farmer field schools for about 1000 farmers on cassava. This is an explicit scaling up of the 4FGF pilot in response to farmer demand and has used the same production technologies and CIAT trainers. In Uttaranchal and Meghalaya, India, the “Livelihoods and Ecosystem Services in the Himalayas: Enhancing Adaptation Capacity and Resilience of the Poor to Climate and Socio-economic Changes” grant (ICIMOD 1113) has established seed banks and seed exchange mechanisms in collaboration with IFAD NERCORMP loan. Technologies developed under “Enabling Poor Rice Farmers to Improve Livelihoods and Overcome Poverty in South-East Asia through the Consortium for Unfavourable Rice Environments” (IRRI CURE 1108) are being scaled up in countries of South East and South Asia. They are contributing to the development of National Seed Programmes in Nepal and National Rice Programmes in the Philippines and Cambodia, in collaboration with IFAD investment projects by linking them with field demonstrations and technology transfer. These linkages have been facilitated by the national partnerships built into the grants and loans, both of which are led by the same government agencies.
Co-financing generated
58. APR’s effective grant portfolio of US$ 35 million has been matched by US$ 12 million in co-financing, or 34% of IFAD grant financing. Similarly, co-financing of the 13 grants approved during the review period is US$ 3 million, or almost one third of the total value contributed by IFAD.
59. Total co-financing mobilized for large regional grants amounted to US$ 9.3 million against the US$ 17 million mobilized by IFAD – a ratio of almost 1:2 in grant co-financing. Regional network organizations contributed the highest in co-financing among recent grants, with APRACA and ICIMOD allocating US$ 1 million and US$ 800 000 respectively.
B. Operations
Approvals
60. Thirteen grants were approved during the period under review, for a total amount of US$ 10.7 million. Four are in-loan large country grants, and three each are large regional, small regional and small country grants.
13 In relation to Grant Policy Outputs, the majority of financing and of grants continues to be allocated
towards capacity building.
Pre-implementation activities
61. Eleven of thirteen approved grants have become effective. The two grants not yet effective are: one in-loan large country grant for the Republic of the Philippines; and one standalone small country grant “Strengthening Capacity to implement the Government’s Poverty Alleviation and Rural Development Action Plan” in Myanmar. The Myanmar grant has been amended to better support innovative approaches under the rapidly evolving policy context following the change in Government, and became effective on 7 July 2013.
62. There is space to expedite grant effectiveness if grant agreements are drafted ahead of formal board approval. Time elapsing from approval to effectiveness has averaged 40 days, as compared to an average of 30 days last year. The increase is mainly attributed to a grant to Colombia University, as agreement covenants were only drafted for review by Colombia University following grant approval at IFAD. The time
13
APR also developed agricultural research grants funded under the newly established CGIAR window; and one grant, in Bangladesh, funded under IFAD's Adaptation for Smallholder Agriculture Programme.

15
taken to process the grant from approval to effectiveness was 4 months, most of which was related to internal processing.
Disbursements
63. The total amount disbursed during the reporting period decreased substantially compared to the previous period, from US$ 19 million to US$ 8 million. This reflects the significant number of projects completed, as well as the larger share of in-loan grants, which feature a disbursement profile similar to the accompanying loan. Large country grants have disbursed US$ 3.9 million out of a total IFAD financing of US$ 12.7 million.
64. Disbursement for large regional grants is considered moderately satisfactory, with US$ 8.5 million disbursed among the 13 grants from a total IFAD financing of US$ 16.9 million, or about 50% disbursement. Grants to IRRI and ESCAP have passed mid-term but disbursed only 31% and 19% of IFAD financing, respectively – indicating, respectively, delayed justification of expenses incurred, and slow implementation progress.
65. Disbursement of small regional and country grants is satisfactory: US$ 950 000 has been disbursed (out of US$ 1.5 million, or 63%, of total approved IFAD financing); and US$ 2.7 million disbursed out of US$ 4.4 million in approved IFAD financing for small country grants (62%). Interestingly, grants to middle-income countries (such as China, Indonesia and Pakistan) seem to consistently perform below target in terms of disbursement rate.
Maturity of the portfolio
66. Half of the 35 large grants have exceeded three years’ duration. This reflects the delay in closure for 7 regional grants, as well as the relatively longer duration of country grants, specifically 7 of the 9 older grants that are in-built with an investment project. Forty-five per cent of large grants are under 2 years from effectiveness. Fifteen grants were closed during the period under review and another 12 will be closing by December. Details are provided in Annex 2.
Time overruns
67. Seven of the eight grants with time overruns from last year were closed during the year under review. Four new entrants are currently experiencing time overruns of over 6 months, indicating recurring problems for APR in grant closures. However the trend is improving, with 11 of 19 grants closed last year but 15 closed this year out of 19 due for closing, in addition to the 7 overruns closed 3.
Extensions
68. Two regional grants with strong linkages to IFAD projects have been extended: the Asia Project Management Support Project implemented by the AIT; and the FoodStart Programme implemented by CIP. In the case of AIT, activities accelerated as it gradually became familiar with IFAD projects and country programmes. For CIP, the original duration approved by the Board was not consistent with the longer duration recommended and approved by QE/QA. In view of the strong interest expressed by IFAD country partners, additional time was considered warranted to consolidate grant successes and strengthen knowledge sharing with investment projects.
69. Out of 10 country grants due to close in the reporting period, 5 country grants were extended. Three are standalone small grants, and two in-built with loans. This illustrates the generally slow gestation period of country grants. Comparatively, country grants have limited incremental supervision cost; the net effect of programming longer durations would be to reduce IFAD transaction costs while allowing a more appropriate timeframe for innovations, capacity building, knowledge sharing and scaling up to materialize.
Cancellations
70. No grants were cancelled during the period under review.
Audit and fiduciary aspects
71. All but two audits due during the reporting period were received on time. Under Grant 1081, FPSI submitted the original audited financial statements; FPSI has been requested to also submit the requisite Audit Opinion Letter on the SOE, as this was not included in the package. The final audit has also been received for Grant 880-APDF, which was due for closure in 2010. CFS has agreed on an action plan with the recipient to address ineligible expenditures identified by the audit.
16
Future pipeline
72. The regional grant pipeline is largely oriented towards strengthening capacities of national partners and producers’ organizations. Subject to further reviews and approvals, the pipeline foresees: (i) continued collaboration with farmers’ organizations through a second phase of the Medium-Term Cooperation Programme with Farmers' Organizations in Asia and the Pacific; (ii) a large regional grant to ICIMOD to develop innovative livelihood options for smallholders in relatively isolated mountain areas to cope with climate variability and socio-economic change; (iii) improving project performance in fragile states, in partnership with FAO; (iv) a grant dedicated to knowledge sharing, communication and scaling up; (v) support to Pacific member states in testing replicable models to strengthen natural resource management and food security; (vi) a second phase of APMAS; (vii) continuation of the Learning Routes programme with PROCASUR, in support of structured and participatory learning processes that draw on proven successes in the field; and (viii) engagement in remittances programmes, GEF and ASAP funding and support to indigenous people in collaboration with IFAD's FFR, IFAP and ECD division.
Lessons learned
73. A number of key lessons have emerged from the implementation of ongoing regional grants:
All grants need to be justified by priorities specifically expressed in the respective RB-COSOP (or country results framework, as applicable), with close CPM involvement during design.
Scaling-up pathways should be elaborated for each new grant, with a view to ensuring that IFAD outreach and poverty reduction targets are supported.
Over-ambitious scope and coverage reduce the efficiency and effectiveness of implementation and supervision. Despite recent improvements, there is still a tendency for regional grant designs to be too ambitious and to cover many countries. APR will seek to ensure simpler designs, with not more than four countries per regional grant; and with clearly defined outputs that can lead to measurable impact.
Divisional reviews of supervision reports offer an effective tool for sharing of knowledge, disseminating good practices, and understanding common challenges.
Close involvement of associated IFAD country teams during grant design and CPM direct management improve relevance and enhance integration of grant activities into loan projects.
Overall, selection of grant recipients appears to be sound. The performance of all grant recipients but one has systematically been rated at 4 or higher. The rationale for competitive bidding, with its high administrative cost, therefore seems diminished, particularly in view of the specialized niche of most innovation-driven grant programmes and the direct capacity-building objectives of others.
V. MANAGEMENT PERFORMANCE OF THE ONGOING PORTFOLIO OF INVESTMENT PROJECTS
A. Project Management
74. The performance of project management has improved marginally over the past 12 months, from an average score of 4.0 to 4.1, and is clearly linked to project risk standings. According to APR supervisions, 53 projects score moderately satisfactory or better, 8 projects score moderately unsatisfactory, and two unsatisfactory. Management quality disproportionally reflects onto risk profiles, with the latter ten projects accounting for 40% of the total risk flags under the portfolio- mostly with respect to measures of fiduciary and M&E performance. Seven of the 10 projects are classified as problem projects.
75. Most projects with low management scores are being implemented in the poorest, the most under-developed and remote areas, and suffer capacity limitations as well as high staff turnover. Others are seeking to introduce innovative financing mechanisms around value chain concepts but have not progressed sufficiently by mid-term.
76. Among the highest rated projects is SGPRP in China, whose PCR identified the adequacy of programme coordination and management at all levels as the most important contributor to successful fulfillment of the project objectives. Implementation was led by Government using country systems, with careful attention to creating good management systems at each level of operations (province, district, village), especially with respect to financial management and M&E. Key ingredients for success included a high level of ownership by Government, and continuous, timely communication with stakeholders and partners. A number of well-performing projects were implemented by specialized funds or service institutions; for

17
example, MFTSP (BD-1235) FEDEC (BD-1402) in Bangladesh, NMSP (IN-1121) in India, PAF (NP-1450) in Nepal, and MIOP (PK-1324) and PRISM (PK-1413) in Pakistan.
Box 4: Leveraging decentralisation in Viet Nam
According to its PCR, DPRPR (VN-1272) has enabled decentralised government structures to adopt participatory development activities that achieved remarkable outcomes by the time of the project's completion in September 2011. With the aim of contributing to an improved socio-economic status of the poorest households, the project successfully promoted decentralisation to grassroots levels and supported participation of IFAD's target groups. Part of the success has been attributed to the comprehensive strategy for including capacity building for local officials and beneficiaries with decentralisation processes. The active participation of beneficiaries in planning and implementation of project activities gave encouraging results; especially for infrastructure development, where it is an important factor leading to efficiency, sustainability and quality of the project-supported infrastructure.
B. Disbursement Performance
77. During this review period, APR has exceeded the expected disbursement amounts (calculated by PMD based on average IFAD disbursement profile). The equivalent of US$ 164 million was disbursed between July 2012 and June 2013. The decrease from last year's disbursement amount of US$ 209 million can be attributed to the cyclical features of the portfolio, particularly the completion or closing of 15 projects during the period. Nonetheless, from the equivalent of US$ 1.9 billion in disbursable approved financing, US$ 801 million had been disbursed by 30 June 2013, exceeding the expected disbursement (US$ 718 million) by 12%. Excluding India, the ratio of APR actual disbursements compared to IFAD average) improves to 22%.
78. This is the third consecutive year that APR aggregate disbursements exceed the IFAD average project disbursement pace; and APR expects its disbursements to improve further. At a disaggregated level, all countries apart from India, Pakistan and Nepal have outperformed the expected disbursement pace. The largest shortfall (US$ 14 million) is for South Fata in Pakistan, which completed in 2012. PSR data shows that weaker disbursement scores are associated with below average PSR scores on 'Coherence between AWPB and implementation' and 'Quality of project management'. APR will provide implementation support and seek to ensure that the design of larger projects maintains simplicity in implementation.
79. Processing time of WAs decreased from an average of 31 days in 2011-2012 to 18 days in 2012-2013. To facilitate disbursement efficiencies, the minimum withdrawal amounts for APR portfolios have been increased where possible based on project-specific risk assessments. This has included higher thresholds for SOEs, Designated Accounts and Direct Payments. Viet Nam, operating under a decentralized withdrawal processing model, is the best case, at 12 days average WA processing time.
80. Since 2012, LGS decentralization in China, India and Vietnam has performed well. The objective of this initiative was to speed up the processing time of withdrawal applications while strengthening the financial capacity of the projects and IFAD staff in the countries. Decentralization of LGS to Viet Nam has been fully implemented in all projects this year, while India and China started the pilot project in 2012. The benefits of a decentralized review are: (i) the availability of a dedicated person with local language skills and knowledge about IFAD procedures; (ii) quicker communication with projects in case of discrepancies on WAs; and (iii) improvement in the quality of WA reviews.
C. Loan Administration
81. The newly introduced Financial Management (FM) strategy, guidelines and procedures have provided the foundation for applying the risk-based disbursement and financial assurance methodology. In 2013, a comprehensive and updated set of procedures was implemented to strengthen assurance on use of funds and facilitate their smooth flow to projects. The procedures included the introduction of the Financial Management Assessment Risk Questionnaire (FMAQ), at design and supervision, to assess the capabilities and controls in managing and reporting financial flows.
82. The “Project Fiduciary Risk Rating" (PFRR) classified 11 projects as “High Risk”, 51 as “Medium Risk” and the remaining 14 as “Low Risk”. In addition to facilitating faster disbursement in low-risk areas and more efficient disbursement processes overall, the PFRRs inform CFS participation in IFAD missions.
14 CFS
14
CFS Finance Officers spent 200 days in the field during the current reporting period, addressing fiduciary issues at design, negotiations, supervision, training and COSOP formulation. Table 2 in Annex 3 outlines CFS participation in APR field activities.

18
0
10
20
30
40
50
60
70
2011/12(Average: 3.9)
2012/13(Average: 4.0)
3% 2%
15% 11%
64% 68%
17% 19%
Nb. of pro
ject
Rating 1 Rating 2 Rating 3 Rating 4 Rating 5 Rating 6
missions placed emphasis on implementing the newly introduced risk assessment procedures as well as on strengthening capacity of partners.
83. Risk ratings and control actions are well-aligned with review findings from supervision and audit. The ratings draw on PSR scores for FM as recorded by IFAD supervision missions, as well as on the review of audit reports and the FMAQ assessment. They also correspond with governance challenges in fragile states: 8 of the 11 “High Risk” projects were identified in fragile countries: 4 in Pakistan; and 2 each in Nepal and Sri Lanka. A risk rating undertaken in Myanmar during the RB-COSOP design also lists this fragile state as high-risk.
84. In 2012 only 31% of projects used international standards for accounting and reporting purposes. The majority continue to use cash basis (36%) accounting and government standards (31%). This is an improvement over the previous year, when only 16% of projects (7/42) used international standards. Use of national standards is acceptable to IFAD, provided that country national standards are converging towards internationally accepted best practices. In APR, as in the rest of IFAD, CFS is promoting the use of best-practice reporting standards by requesting projects to consider IFRS- or IPSAS-compliant templates, designed by IFAD, when preparing financial statements.
85. The involvement of CFS officers at supervision or design stage of projects, either directly or through clearance of Financial Management Specialist ToRs by CFS, started to be implemented in most of the cases. CFS participation in missions ensured: (i) earlier identification of FM risks and development of risk mitigation actions in projects; (ii) constructive dialogue with borrowers/recipients; and (iii) closer cooperation with national audit institutions for the use of country systems.
86. The momentum for financial capacity building will be maintained, with an APR/CFS regional training event to be held in October 2013. This complements the new FM-e learning course available on IFAD’s external site. To the extent possible, CFS finance officers have trained FMSs on the CFS fiduciary risk assessment tool, either during design or supervision missions. FM capacity building at project level will help improve future APR portfolio ratings in FM.
D. Procurement
87. PSR ratings indicate improvements in
compliance with procurement since the last review. In this review period, 87% (55 projects) were rated moderately satisfactory or higher, while 13% (8 projects) were rated moderately unsatisfactory or lower. However, the ratings themselves still present various challenges since: (i) their application by the supervision mission does not consistently conform to the established Portfolio Review Guidelines; and (ii) they are not adequately substantiated by procurement data in the reports. In the future, better evidence to substantiate procurement scores should be provided in the Supervision Report and triangulated with additional information.
88. The eight projects rated moderately unsatisfactory or unsatisfactory suffered from a weak procurement strategy adopted, delays in procurement, or control lapses (including non-compliance with procurement guidelines/processes). Inconsistencies and non-compliance in reviews of tender/bid documents and procurement decisions.
E. Financing Covenants
89. Overall, governments' compliance with financing covenants is adequate, with an average PSR score of 4.2, at very low variance. Only 5 projects scored below 4. These adverse scores were mainly a result of late or lack of submission of AWPBs and their corresponding 18-month procurement plan; or the absence of requisite periodic progress reports.
Chart 4: PSR rating - Compliance with procurement

19
F. Audit
90. Timely receipt of audit reports decreased from 84% receipts for fiscal year 2011 to 67% for fiscal year 2012. Out of 19 audits not received as of 30 June 2013, 13 are to be prepared by national public auditors. In terms of timely submission, private audit firms have generally been more reliable than public auditors. In terms of quality, the performance of public and private auditors is generally similar, although this varies from country to country.
91. Auditors have not consistently provided a set of three separate opinions as required by the Audit Guidelines, although the opinions on financial statements have generally covered the WA schedule and Special Account. A total of 63% of auditors used internationally accepted standards, with the reminder using national standards.
92. More than 50% (30 out of 57) of all APR audits are performed by Supreme Audit Institutions (SAIs), which confirms implementation of IFAD commitments in using country systems. In November 2012, IFAD’s Audit Committee highlighted the importance of capacity building of SAIs and asked that a specific action plan be drawn up to ensure that IFAD prioritizes resources to this area. CFS has developed a plan to enhance IFAD engagement with SAIs, including various activities being performed in parallel to familiarize partners with IFAD guidelines and procedures, and strengthen compliance with IFAD requirements. CFS is strictly monitoring quality of audit reports presented within 60 days from receipt in IFAD. In all cases specific risk mitigation actions have been proposed to CPMs and project staff.
93. In 2012, 82% of reports received were of unqualified opinion (31/38) and the remaining 18% (7) were qualified. In only one case (554-PK) the qualified opinion was linked to ineligible expenditures identified by the auditors. The other qualified opinions were linked to technical reasons, especially in relation to the weak finance function in many PIUs– such as missing opening balances, non-uniform use of accounting standards, and differences between expenses claimed and recorded. There have been no Adverse Opinions or Disclaimer of Opinion since 2010.
G. Monitoring and evaluation
94. APR's portfolio has seen a marked improvement in M&E performance over the reporting period. The average PSR score increased from 3.5 last year to 3.9 in 2013; and the number of projects at satisfactory level (4 or higher) increased from 34 of 62 last year, to 45 of 63 in 2013. This corresponds with higher fulfillment of RIMS requirements and improved reporting on outcomes. Of the 48 projects required to report on RIMS output indicators, 47 submitted the required RIMS report on time; of 35 projects required to report on outcome indicators, 34 did so. All 15 IFAD-initiated projects completed between 2009 and 2012 have completed RIMS end-line surveys; 5 completion surveys are scheduled for projects ending in 2013. Of 33 projects approved since 2009, 19 baseline surveys have been completed; the remaining projects plan to execute baseline measurement by end of 2013.
95. A sample of RIMS surveys was reviewed and common features and challenges identified. APR undertook a stock taking of impact reporting through an assessment of a sample of RIMS baseline and completion surveys. The quality of data and surveys in Viet Nam and Philippines was reviewed by using Data Quality Review standards related to validity, integrity, precision, reliability and timeliness. Overall, quality of survey data and analysis are satisfactory and provide a broad picture of the extent to which IFAD interventions were successful. Though improving, the reports are mostly descriptive, and analysis has been limited. Some common challenges and recommendations are provided in Table 1 of Annex 4.
96. Tools and methodologies for outcome measurement are increasingly being used by better trained staff, and IFAD supervisions are placing additional emphasis on generating evidence to feed reviews. A user survey found that those projects that had applied APR's Annual Outcome Survey (AOS) methodology have drawn important lessons on project delivery, and perceive themselves to be better able to analyze and report on project outcomes. A growing number of projects are introducing the AOS methodology into their M&E plans and actions. Overall, there is increasing attention to outcome monitoring, which is the most challenging aspect of project M&E.
97. In several countries, project staff have been organized into country working groups that are trained and supported in planning M&E and in consolidating and reporting results. This has been the case in China, Indonesia, Nepal the Philippines and Viet Nam. In Viet Nam, a detailed project M&E Manual has been finalized and is being shared widely through the IFADAsia community. In all these cases, specific M&E action plans have been developed and are being pursued. Further, IFAD country teams for Bangladesh, Indonesia and Nepal have established project reporting templates, with easy-to-use data entry templates

20
0
10
20
30
40
50
60
70
2011/12(Average: 4.0)
2012/13(Average: 4.1)
2% 5% 3%
8% 10%
66% 60%
17% 24% 2%
3% N
b. of pro
ject
Rating 1 Rating 2 Rating 3 Rating 4 Rating 5 Rating 6
0
10
20
30
40
50
60
70
2011/12(Average: 4.0)
2012/13(Average: 4.2)
2% 3%
3%
12% 8%
59% 63%
22% 21% 2% 5%
Nb. of pro
ject
Rating 1 Rating 2 Rating 3 Rating 4 Rating 5 Rating 6
and automated reporting that are aggregated at country level for reporting on RB-COSOP results frameworks.
98. APR is also developing its online tools – on IFADAsia and Rural Development Indicators – to allow for capacity building (e-trainings), knowledge sharing and real-time data entry and viewing of results by IFAD partners. Given the high cost of project or even regional trainings, APR has placed its regional effort on presenting user-friendly guidelines, providing e-resources on IFADAsia, collating successful experiences, developing e-trainings, and identifying suitable local expertise in M&E. APR is also developing online M&E “dashboards” for automated presentation of periodic project and country results. In addition, a second-round IMI grant has enabled the Bangladesh country team to further develop the Multi-dimensional poverty assessment tool (MPAT).
VI. RESULTS OF THE ONGOING PORTFOLIO
A. Overall implementation Progress
99. APR's average PSR ratings for overall implementation progress, and likelihood of achieving development objectives have improved:
87% of projects were rated moderately satisfactory (4) or higher for implementation progress, compared to 84% last year.
89% scored 4 or above on likelihood of achieving objectives, compared to 83% for the previous review period.
100. Nine projects are rated moderately unsatisfactory (3) or less on at least one of these two indicators. Additionally, three other projects score 3 or lower on at least five of the eleven PSR measures used as risk flags- signifying their vulnerability to falling into risk status if delivery is not strengthened.
Eight projects are rated unsatisfactory in terms of overall implementation progress and thus classified as at risk (problem) projects.
Seven projects are considered unlikely to meet their development objectives and are also classified at risk.
In total this constitutes nine problem projects, 3 less than last year and 8 less than in June 2011.
Among the nine projects currently rated at risk, five had also been rated at risk last year.
Chart 5 : Overall implementation progress
Chart 6 : Likelihood of achieving development objectives

21
010203040506070
2011/12(Average: 4.1)
2012/13(Average: 4.1)
5% 19% 6%
53% 63%
24% 25% 5%
Nb. of pro
ject
Rating 1 Rating 2 Rating 3 Rating 4 Rating 5 Rating 6 n/a
Table 10: Actual and potential problem projects 2012/2013
Project name Implementation progress
Likelihood of achieving
development objectives
No. of risk
factors
KH-1464 Tonle Sap Poverty Reduction & Smallholder Development 3 3 7
IN-1381 Women's Empowerment and Livelihoods in Mid-Gangetic Plains 3 4 5
IN-1418 Mitigating Poverty in Western Rajasthan Project 3 2 8
LA-1459 Sustainable NRM and Productivity Enhancement Project 3 4 2
NP-1119 Western Uplands Poverty Alleviation Project 3 3 4
PK-1514 Southern Punjab Poverty Alleviation Project 3 3 2
PH-1395 2nd Cordillera Highland Agricultural Resource Management 2 2 5
SL-1457 National Agribusiness Development Programme 2 3 7
VN-1483 Economic Empowerment of Ethnic Minorities - Dak Nong 4 3 4
CN-1454 Dabieshan Area Poverty Reduction Programme 4 4 5
MV-1377 Fisheries and Agricultural Diversification Programme 4 4 5
SL-1316 Smallholder Plantations Entrepreneurship Development 4 4 5
101. The reasons for these unfavorable scores are primarily related to challenging institutional factors and implementation capacities. In a number of cases, a key institutional gap relates to the absence of Government champions that actively promote the project and resolve constraints, in spite of proactive oversight provided by IFAD. This appears to be the case in Dabieshan (CN-1454), where financial resources have not been made available on timely basis; in Southern Punjab (PK-1514), where Government has not met disbursement conditions 2 years since project approval; in 3EM in Viet Nam (VN-1483) where the PSC has not provided sufficient oversight, and DARD commitment to the Ethnic Minorities Livelihood Development appears weak; and in WELP (IN-1381), where NABARD leads project implementation due to Government request rather than a result of its own strategic interest. Illustrating the challrenge of volatile political conditions in fragile states, execution of WUPAP (NP-1119) slowed after Government assigned the project to a newly established Ministry at the last phase of the project, setting the project back to problem status that it had overcome last year. In Sri Lanka, the Central Bank was unable to forge the necessary accountability and legal authority to invest in viable private sector equity proposals. Following IFAD's mid-term and post mid-term missions, the PMU was recently re-located to the Ministry of Economic Development. Now championed by a more flexible and dynamic Ministry, the project is finally beginning to make headway.
102. For the other projects at risk or potential risk status, the primary reasons relate to:
slower than expected pace of implementation for TSPRSD in Cambodia (KH-1464), FADIP in Maldives (MV-1377) and SNRMP in Lao PDR. All three seek to organize cooperatives of farmer groups for improved productivity and market linkages but operate in difficult (or remote) areas with limited implementation capabilities;
some gaps in implementation capacities in Sri Lanka SPENDP (SK-1316,) particularly an imbalance between technical elements of plantation development and social ones related to participation and entrepreneurship;
unavailability of counterpart funds from local governments in Philippines CHARMP II (PH-1395).
Chart 7: PSR – Physical/financial assests

22
0
20
40
60
80
2011/12(Average: 4.1)
2012/13(Average: 4.1)
2% 5% 12% 6%
61% 68%
20% 19% 2% 2% 3%
Nb. of pro
ject
Rating 1 Rating 2 Rating 3 Rating 4 Rating 5 Rating 6 n/a
3.50
3.75
4.00
4.25
4.50
4.75
<1 <3 <5 <7 ≥7
Physical/financial assets Food security
Overall implementation progress Likelihood of achieving DO
103. Scores on impact domains, assets and food security have improved relative to last year. In terms of physical/financial assets, 89% of projects were rated 4 or above, which is an increase compared to last year’s review (80%). The number of projects that scored moderately unsatisfactory (rating 3) or less for this criterion decreased from 12 last year to 7 this year. In terms of food security, 89% scored 4 or better. TSPRSDP in Cambodia (KH-1464), MPOWER in India (IN-1418) and CHARMP II in Philippines (PH-1395) – all problem projects – received a rating of 2. 104. The average rating for all 4 indicators appears to follow a distinct trend according to the age of the project. Ratings are modestly positive for younger projects but tend to drop around mid-term, possibly reflecting a level of tolerance on these particular scores in the first phases of the project but an expectation of tangible progress by mid-term. Six of the 9 APR projects that are at risk fall in the category of 3 to 5 years. Following mid-term, there is normally a higher pace of activity, and more evidence of results.
Chart 9: Average PSR rating per maturity for selected indicators (2012-2013)
105. Performance against Results Management Framework Criteria is consistently positive. As per CPIS scores, all country portfolio ratings but one (Maldives) suggest that country programmes contributed in a moderately satisfactory way, or better, to increased incomes (RMF1). With respect to food security, Indonesia and the Maldives were rated moderately unsatisfactory. The average CPIS rating for food security decreased slightly from 4.11 to 4.00. Empowerment was rated highly satisfactory for one portfolio (Philippines) and satisfactory for six other portfolios (Afghanistan, Bhutan, Cambodia, Mongolia, Nepal and Vietnam). Apart from Sri Lanka, no country portfolio was rated less than moderately satisfactory. Alignment with the aid effectiveness agenda averaged slightly above moderately satisfactory (4.36).
B. Outputs and Outcomes15
106. Based on the annual RIMS data collected for number of individuals receiving project services, the 46 on-going APR projects reporting this indicator reached 2.8 million persons during the review period. This is dramatically lower than the incremental amount of 2011, which was estimated as 11.7 million persons. This apparent reduction is primarily a result of reporting anomalies: a number of projects reported outreach for the
15
The analysis in this section relies on: (i) PSR scores provided, based on validation checks in the field and informed judgements by IFAD supervisions; (ii) RIMS data at all three levels; (iii) evidence from six annual outcome surveys (AOS) and other qualitative sources (mission reports, progress reports, etc.); and (iv) seven project completion reports and 15 impact surveys.
Chart 8: PSR - Food security

23
first time in 2011, accumulating outreach from earlier years into the 2011 estimate. Further, until 2011 projects reported outreach in terms of households reached, rather than individuals
16.
107. With about 50 projects reporting, the average outreach is estimated at 5.5 million per year for the past 3 years. Extrapolating conservatively to 9 ongoing projects that are supervised by CI's (and not reporting through RIMS) suggests an outreach of about 18 million persons between 2010 and 2012. In order to meet the MTP target set by PMD for APR (30 million persons reached between 2010 and 2015), an additional 12 million persons need to be reached between 2013 and 2015, or 4 million per year.
Table 11: Aggregate RIMS achievements in APR portfolio (reporting projects only)
RIMS INDICATOR Unit 2011 2012
Ou
tre
ac
h
Individuals receiving project services Persons 12 005 715 2 778 448
Common property resources under improved management practices Ha 9 102 0
Land under irrigation scheme constructed/rehabilitated Ha 6 275 11 804
Ag
ric
ult
ura
l
tec
hn
olo
gie
s
People trained in crop production practices and technologies Persons 547 367 158 210
People trained in fish production practices and technologies Persons 47 881 4 664
People trained in livestock production practices and technologies Persons 82 384 51 285
Ru
ral
fin
an
cia
l
Se
rvic
e
Active borrowers Persons 2 315 700 1 094 554
Voluntary savers Persons 916 651 1 239 584
Ma
rke
t
-
ing
Marketing groups formed/strengthened Groups 1 445 921
Roads constructed/rehabilitated Km 2 124 753
Mic
ro-
en
terp
ris
e
People trained in business/entrepreneurship Persons 62 475 89 964
Enterprises accessing facilitated non-financial services Enterprises 8 649 8 125
Po
lic
ies &
Ins
titu
tio
n
s
People trained in community management topics Persons 156 223 276 934
Village/community plans formulated Plans 3 444 1 920
Impact domain 1: Household income and assets
108. Overall, project beneficiaries report improved household income and assets after participating in project activities. For example, the RIMS completion survey in LIPH (IN-1226), which supported vulnerable groups in the Himalayas with improved financial services to farm and non-farm SMEs, vocational skills for IGAs, and improved access to markets and social infrastructure, shows a decrease of households in the “poorest” and “poor” category of 23%, as measured through asset ownership indices. Another example from India, NERCOMP (IN-1040), indicates that improved access to financial services has led to a significant improvement in income compared to a control group. The project supported the establishment of self-help groups (SHGs) which, according to the project's 2012 Annual Outcome Surveys (AOS), encouraged women to save on a weekly, fortnightly or monthly basis. The AOS reports greater diversity of income sources among households in project villages compared to non-targeted villages. The number of households graduating from the ‘poorest’ to the ‘less poor’ category is significantly higher within the project area (75% compared to 45%). A 2011 study on the impacts of farmer training in AMEPP in Bhutan (BH-1296) indicates that 77% of farmers increased their household income, and 44% of these farmers had increased their annual incomes by more than US$ 155. AMEPP's 2012 RIMS completion survey recorded that ownership of household assets had increased and the percentage of poorest and poor households had decreased from 65% to 15%. This resulted in an increase in the number of average and better-off households from 35% in 2006 to 85% in 2012. Some of the increase in income can be attributed to the growing non-farm sector, but surveys show that crops and livestock are still the major income sources for most households.
16
When IFAD's requisite outreach indicators were modified (to individuals reached) for the 2011 reporting cycle, the new measure was largely estimated through crude multiplication. There has been some correction in 2012, since some activities target more than one person in the same single households.

24
0
20
40
60
Baseline Completion
Perc
enta
ge
Chronic malnutrition (boys) Chronic malnutrition (girls)Acute malnutrition (boys) Acute malnutrition (girls)Undernutrition (boys) Undernutrition (girls)
Box 5: Improving equity and empowering women in Bangladesh through land titles
Having security over land, in combination with the physical infrastructure, has significantly enhanced the livelihood opportunities for rural households participating in CDSP IV. CDSP IV is currently reviewing 1470 requests for land titles from poor people living on newly accredited coastal islands, locally known as chars. An important feature of the land title process developed through the project is that the wife’s name is written in the legal document, making her legally entitled to 50% of the total land. This strengthens her position in the family, gives her uninterrupted access to the land and a stronger position in many decision-making processes – for example, in opting to use the land as a collateral for credit. The AOS of 2012 found that 18% of surveyed households were able to improve their housing conditions
Impact domain 2: Human and social capital empowerment
109. There is good evidence that strengthening local self-help groups and institutions increased poor people’s capacities to exploit economic opportunities. In Bangladesh, MIDPCR (BD-1322) worked with labour-contracting societies (LCS) to engage 2570 poor, destitute, divorced or widowed women in infrastructure works, creating 245 046 person-days of employment. LCS members received training on construction techniques, IGA and microfinance, as well as social issues. According to the MTR 2013, in 2012 NERCORMP (IN-1040) helped form 42 Natural Resource Management Groups (NaRMG) and 51 SHGs, leading to a total of 493 NaRMGs and 1504 SHGs with 20 578 women members. Targeted communities cited a number of key benefits, including increased social cohesion and solidarity within villages and across ethnicities, increased self-confidence, access to credit, and active participation of women in village forums.
110. Direct support to construction/rehabilitation of social infrastructure, such as schools and health posts, combined with training, has proved to be effective in increasing human capital. According to data from 8 projects, the number of households with access to safe drinking water and sanitation increased from 67% to 75%, and from 30% to 43%, respectively. The impact evaluation of AJKCDP (PK-1245) found that construction of shelters and primary schools contributed to increased school enrolment. Combined with other basic infrastructure – roads, water supply and health facilities – the conditions of women and children improved. The study estimates that 34.4% of people trained in natural resources management, IGAs, and managing community organizations are applying the new acquired skills.
Box 6: Supporting grassroots health organizations and schools
In China, ECPRP (CN-1223) supported the construction and maintenance of 35 township hospitals and 1,010 village clinics, and trained 1600 village doctors. Over 40,000 women received training on women’s health. These activities have significantly contributed to improved health awareness, resulting in an increased number of women going to the hospital to deliver (86% compared to 20% at the start of the project) and a decrease in mortality rate for mother and child. Over 500 village schools and 1,420 village health points were rehabilitated and equipped, and 2,600 teachers received training. School drop-out rates decreased from over 30% at baseline to nearly zero by project end.
Impact domain 3: Food security and agricultural productivity
111. Based on 15 RIMS surveys,17
chronic malnutrition (height for age) has fallen from baseline to completion- on average, from 49% to 37% for boys, and from 41% to 34% for girls. Acute malnutrition, as indicated by wasting (weight for height) has declined from 18% to 15% for boys, and from 8% to 6% for girls. Under-nutrition (weight for age) has also declined: from 32% to 19% for boys, and from 30% to 17% for girls.
Chart 10: Project impact on child malnutrition from 15 surveys
112. RIMS data collected from 9 surveys reporting on this indicator for baseline and completion indicate that the percentage of households suffering from a first hunger season declined from 35% to approximately 20%. However, for those households suffering a first hungry season, the incidence of a second hungry season is higher, illustrating
17
Some projects intervening in two different provinces have submitted RIMS surveys for each province and are hence counted separately.

25
the challenges of chronic poverty in spite of overall reduction in extreme poverty.
113. RIMS data indicate that in 2012 crop and livestock trainings were attended by 136,728 and 36,649 persons, respectively, and led to adoption of improved agricultural practices. For example, RULIP (KH-1350) implemented farmer field schools (FFS) which provided training to farmers’ groups on topics that they had identified. According to the AOS 2013, FFS households adopt on average 3 to 4 different technologies and 83% of them reported increased productivity after they had adopted them. Promising child nutrition awareness activities are being introduced in the FFS, and preliminary evidence suggests changing nutrition patterns. According to the findings of the PCR, DPRPR HG (VN-1272) contributed to improved food security by introducing new production models. The rate of households experiencing one hunger season decreased sharply from 49% to nearly 18% during 2006-2011, while the rate of households facing two hungry seasons was nearly zero. The number of households with ‘from 4 to 6 hunger months per year’ dropped dramatically from 30% to 4%. Child malnutrition also dropped, and a comparison with national data shows that the improvement in child nutrition in the project area was higher than the province average.
114. Demonstrations with on-site technical trainings have proven to be an effective approach to introduce new technologies in SGPRP (CN-1271). Effective since 2006 and completed in September 2012, SGPRP benefited a total of 208, 000 households have directly benefitted from programme activities. According to its PCR, demonstrations of new technologies based on local resources has been one of the top activities in enhancing productivity of both land and labour, contributing to improved income and food security. The PCR also highlighted women’s participation and benefits as important contributors to the achievement of program’s social objectives. Improvement of women’s status and providing them with a stable income source brought benefits for the entire household. The RIMS completion survey of SGPRP in China (CN-1271) reports that 92% of the sampled households increased their crop production; as well as increasing cattle (35% of households) and sheep production (41%). The “double ridges” farming technique for maize was planted on about 125,620 hectares and yields increased by 30%, implying that the incremental production of maize increased by up to 380,000 tons in 2012. Nonetheless, while programme design was assessed as relevant and effective, the PCR noted that activities covered too many sectors, leading to challenges in coordination and in providing adequate implementation support.
Impact domain 4: Natural resources and the environment
115. About 21,000 people in over 500 NRM groups received training in natural resource conservation and management, according to RIMS reports from 47 projects. About 92,000 ha of land were brought under improved management; 2,350 rainwater harvesting systems were constructed; and 245 environmental management plans were formulated.
116. One good example is provided by ECPRP in China (CN- 1223) where improved water retention and natural forest and pastureland development improved crop and fodder production by an estimated 35%. Land improvement though levelling and terracing increased soil moisture retention and fertility, and reduced runoff and soil erosion. The rehabilitation and construction of irrigation facilities, including water cisterns, has increased the efficiency of water use by reducing canal leakage and water loss, and harvesting water runoff. Eighty-nine per cent of beneficiaries adopted the recommended water management practices they were trained in. Permanent greenhouses expanded the multiple cropping index to 200-300%. The programme has also developed 4,545 ha of forest, planted 5,216 ha of trees on road and farmland sides and restored 13,695 ha of natural pastureland through reseeding, rodent control and fencing.
117. Building on locally-proven technologies and providing the space for further technical innovation proved a successful formula for responding to environmental stress in Sichuan. SPEAR (CN-1478), which reached completion in September 2012, was designed to respond to the Wenchuan-earthquake of May 2008 and aimed at providing environmental friendly rural energy, through the construction of biogas systems and at enhancing access to services for ecological agricultural production. IFAD financing allowed for improvement of local biogas technologies and, combined with the support to training and technology transfer activities implemented through the project, provided the basis for pursuing ecologically sound agricultural production at farmer household level. By the end of the project, about 94,000 households benefitted from access to their own autonomous biogas production systems, an essential asset of daily life and for farm production. This contributed to savings in terms of energy costs, also improved household sanitation and the ecological environment and recycled waste as fertilizer. The successful outcomes are, according to the PCR, the result of a highly relevant project design which translated in strong support from the decentralised project units, relevant government departments and project beneficiaries.
118. The IFAD/GEF project in Viet Nam has garnered important results. In collaboration with 3PAD (VN-1477) it enabled the allocation of 78,531 ha of forest land to 72,000 beneficiaries, particularly to rural poor households and ethnic minorities. The project contributed to the development of eco-tourism in the Ba Be reservoir by developing the integrated strategy for ecotourism development, providing trainings to tourism

26
business households and improving infrastructure. The number of visitors to Ba Be increased from 145,761 in 2010 to 287,420 in 2012; 917 poor and near-poor households have benefitted from tourist-related activities. Innovative environmental opportunities have been sought through testing 9 models of 10 new high value forage species, which resulted in a higher success rate than expected- 36,000 trees were planted between 2011 and 2012 alone.
APR is currently implementing 5 GEF-funded projects, described in Table 12.
Table 12 Overview of IFAD/GEF projects in Asia and the Pacific
Country Focus Area Approaches Main results
ASEAN (Regional)
Sustainable peatland forest management
Improved institutional framework, partnership with the private sector, capacity building and sectoral guideline studies
Integrated management and reduced degradation of targeted peatlands and local community empowerment
Viet Nam Sustainable forest and land management
Assessment, capacity building and testing of sustainable forest and land management and PES (Payment for Environmental Services) options
Successful pro-poor ecotourism, and increased investment in forestry after land use planning and allocation
Sri Lanka Coastal zone restoration and sustainable management
Demonstration of best practices, co-management agreement, study tour, policy review and restructure
Increased economic benefits through development of livelihood options, and establishment of community revolving funds. Development of institutions for co-management
China Integrated Ecosystem Management approach to biodiversity conservation
Community-based planning, alternative livelihoods and biodiversity conservation
Various pilot programmes on alternative income generations (medicinal herbs, mushroom, biogas) linking to the conservation of an adjacent protected area
Mongolia Sustainable livestock management and CC adaptation
Strengthening the Pasture Herder Groups (PHG) and PHG-based adaptation investment
Pasture management plans developed and implemented in close collaboration with local government, and herders’ resilience to CC impacts is being improved
Impact domain 5: Institutions and policies
119. During the review period, almost 82,000 communities received project services and over 6,100 community organizations were formed or strengthened, of which 886 reported women in leadership positions. Almost 24,000 community workers and volunteers were trained, as well as 12,000 government officials and staff. Training in community management topics was extended to 240,630 persons.
120. Reliance on country systems has shown to be critically important for sustaining project benefits. Completed in December 2011, the objectives of ECPRP (CN-1223) the programme reached 216,000 households directly, at an estimated cost per direct beneficiary household of US$ 384. Sustainability has been assured as technical agencies and village committees were included in a participatory program implementation approach which provided the basis of continuity at project exit. The PCR highlighted the importance of having adequate staffing in the management unit and sufficient training of staff for a successful programme implementation.
121. There are notable examples in terms of promoting savings and credit groups in Viet Nam. For example, the HRDP programme in Ha Tinh established 2,570 village SCGs with 26,582 members. In Tuyen Quang, IFAD-supported groups have close to 20,000 members. SCGs tend to be well formed and sustained in most projects, and credit discipline is extremely good, with on-time recovery commonly at 98-100%. Group members have a practical means of obtaining credit for adopting new crop varieties, purchasing seedlings, or taking up backyard poultry activities. In addition, the SCGs have served as a forum for members to discuss opportunities for adopting new on- or off-farm IGAs and are a key facility for women’s empowerment.

27
Box 7: Upgrading Savings and Credit Schemes in Viet Nam
The 2012 CPE for Viet Nam found that the country programme has placed emphasis on financial intermediation at the grassroots level, but had limited impact on bank operations and lending policies. In line with the Agreement at Completion Point for the CPE, the country team has undertaken a review of investment options in the rural finance sector. The review highlighted that the primary IFAD models for rural finance in Viet Nam, which focused on women’s Savings and Credit Groups, or on credit provision through state banks, have been reasonably successful; yet can be further developed to increase their effectiveness. This would entail less emphasis on credit funds and more effort in building entrepreneurial and institutional capacities of farmer groups, around viable value chain opportunities supported by IFAD projects; as well as developing networks of savings groups into sustainable microfinance schemes. With such an approach, APR expects to build on the successful targeting of existing schemes while increasing linkages with banking sector and expanding opportunities for business development and poverty impact.
122. Strengthening of formal micro-finance institutions has also reached important milestones. The MIOP in Pakistan (PK-1324), which provided support to 23 YPOs by building better governance structures, risk management tools, transparent reporting systems, business plans, etc. At completion, 13 YPOs have graduated from the programme and become regular partner organizations of the PPAF. MIOP, which reached completion in September 2011, was assessed by the PCR as highly satisfactory. It complemented operations of the PPAF financed by the World Bank, by targeting the rural active poor and improving their access to a wider range of diversified and sustainable financial services and products, such as village banking, Islamic microfinance, settlement branches, women’s livestock cooperative farming. Microcredit enabled poor households to access agricultural inputs and livestock, and enhance their productivity and incomes. MIOP made important contributions towards deepening and expanding inclusive microfinance nationally: (i) enhanced accountability and transparency in the sector; (ii) diversification of products and market segmentation; (iii) expansion of the geographical coverage of microfinance activities; and (iv) increased efficiency. The programme benefited substantially from well-functioning management and financial information systems, which suggests that single-sector interventions in rural finance offer IFAD and its partners a focused approach to organizational performance and excellence.
Box 8: The Farmers’ Forum in Asia
One grant contributing to institutional development is IFAD's Medium Term Cooperation Programme in Asia, which promotes IFAD's Farmers’ Forum concept in ten Asian countries. Under the South Asia component, a vibrant network of approximately 87,000 small farmers has been established in India, Nepal and Sri Lanka, and is working actively with government bodies and policy makers. The Farmers’ Forum in India was successful in having farmers' demands recognized under the National Rural Livelihood Mission. In Nepal, the Farmers’ Forum and the Government agreed on an increased budget for the agricultural sector. The Farmers’ Forum is also acting as a platform for knowledge sharing among diverse farmer groups through exposure visits and capacity-building initiatives. Learning modules are being developed on such topics as land acquisition, and ecological agriculture, based on the needs expressed by members of the farmers’ organizations.
Impact domain 6: Markets
123. During the review period, projects across the region constructed 105 market infrastructures, 475 km of roads, 96 processing facilities and 64 storage facilities. They also formed 860 marketing groups with over 54,000 members, and provided training in post-production, processing and marketing to 39,687 people. In Bangladesh, MIDPCR (BD-1322) contributed to the development of 432km of roads and 66 rural markets, and extended financial and business development services for 18,525 people. All markets have been handed over to the respective market management committees. According to the 2013 supervision report, smaller markets built by the project in remote areas are attracting a large number of buyers and sellers from the neighbouring villages, and are increasingly frequented by traders from the upazilas (sub-districts) and district centres, gradually linking small markets to larger ones. A recent market impact study reports a 33% increase in the number of buyers and sellers, and a 44% increase in the volume of trade and new investments in the markets and neighbouring areas.
124. The RIMS+ completion survey of IMPP in Tra Vinh, Viet Nam (VN-1374), confirmed that households benefitting from project interventions are bringing more agricultural products to the markets compared to before the project and to a control group. IMPP implemented a set of activities to support effective interaction with markets and ensure the participation of the poor. Although selling products to traders is still more common than to enterprises, firms have created stable mutual business relationships with farmers.

28
125. Solutions for increasing production and improving market access were successfully implemented even in remote, mountainous areas. For example, AMEPP (BT-1296)
18 provided 132,000 farmers, over 50% of
whom were women, with inputs along with technical support, training, and access to credit. Physical targets were largely achieved and farm production increased (particularly for cash crops potatoes and oranges). Access to markets was improved by construction of farm roads and marketing infrastructure and establishing capabilities for collective marketing.
C. Targeting and Gender
126. The efficacy of targeting continues to score above APR's overall PSR average, and improved from 4.1 last year to 4.3 in 2013. The Poverty Focus and Gender Focus are rated at 4.5 and 4.4 on average, the highest average scores among APR's PSR scores and again representing a modest improvement over last year (4.3 and 4.2, respectively). Survey findings suggest that the asset ownership of the poorest quintiles are improving and child malnutrition and hunger is diminishing for most households. Yet, completion surveys indicate that those households experiencing a first hungry season generally have an equal likelihood of experiencing a second hungry season as before the project. This is often attributed to isolation, high transactions costs, or physical limitations to increasing production.
127. The primary targeting method has been geographic; this is often combined with other measures to ensure that the poorest segments of the target group participate where benefits are direct and accrue to selected individual households. Several projects in Pakistan have adopted the Poverty Score Card Methodology to identify beneficiaries and the poverty focus of the project. In China, geographic, household and individual targeting is maintained through careful selection of project areas based on socio-economic analysis, annual household ranking categorization, preferential focus to specific groups of beneficiaries (women and ethnic minorities, etc.).The ECRMP project in China (CN-1223) used Vulnerability Analysis Mapping (VAM) methods in selection of programme areas, contributing to the effective targeting of poverty counties and townships. In Cambodia, participatory wealth ranking methods are used to directly target poor villages within targeted poor communes, and poor households within villages.
128. IFAD’s continued focus on targeting poorest households and/or those areas which suffer from with high incidence of poverty and specific development problems due to their geographic locations, is seen as generally effective in strengthening awareness and commitment of project partners to targeting, gender equality and empowerment. Nonetheless uneven compliance with rigorous targeting criteria or the formal membership-based approach to community organisation is sometimes found to inhibit optimal targeting.
129. In some cases projects are adopting a more inclusive approach for components that do not lend themselves to differentiated targeting since their investment activities generate collective benefits, or where downstream investments in commodity chains or collective marketing make it difficult to direct benefits to poorer rural households. For example, AMEPP (BT-1296)
19 provided 132,000 farmers, of which over 50%
were women, with inputs along with technical support, training, and access to credit. Access to markets was improved by construction of farm roads and marketing infrastructure and capacity built for collective marketing. Physical targets were largely achieved, output of cash crops (potatoes and especially oranges) grew and project surveys suggest that AMEPP activities were effective in increasing farm production. While design gave priority to very poor household, the implementation phase found that, given the need to overcome high transaction costs and assure economies of scale, market-related interventions worked better with less poor farmers.
130. The inclusive approach needed for viable membership-based organisations presents challenges to pro-poor targeting Many projects work through community-based institutions such as producer groups, associations and cooperatives engaging in income generating activities in agriculture, livestock or fisheries, or the non-farm sector. Associations and cooperatives are inclusive in federating smaller groups or individuals in order to achieve economies of scale and generate higher revenues that can lead to institutional growth. AMEPP (BH-1296) supervisions found that producer groups supported by the project either do not target the poor or, when they do so, are at risk of failure. Chinese agricultural cooperatives generally target the less poor and larger farmers.
131. Where they have received adequate support to function effectively, participation in groups and grassroots organizations has translated into broad participation and better livelihoods for the rural poor, improving income-generating opportunities and access to inputs and markets. Benefits are also seen in women’s empowerment; SHGs and other women's institutions often play a catalytic role in extending the
18
Actual completion date 31 December 2012. 19
Actual completion date 31 December 2012.

29
benefits of collective action to the community as a whole, for instance by linking up with other rural development and poverty reduction programmes. However, in a number of projects, supervision missions have found weaknesses mainly in social cohesiveness, financial management and business skills of some groups.
Gender and Youth
132. There have been widespread efforts to improve outreach to women in APR’s portfolio. Economic empowerment of women under the portfolio has primarily focused on microfinance and self-help or savings and credit groups (for instance throughout the Viet Nam portfolio, in Afghanistan, Bangladesh, Pakistan and India); small or micro enterprise development alongside value chain strengthening (Bangladesh, Cambodia, Mongolia and Sri Lanka); and trainings on fisheries, horticulture and livestock (Afghanistan, Bangladesh, Lao PDR and Pakistan). A number of projects have supported participation and representation of women in community organizations, such as in Village Implementation Groups in China and Village Development Committees in India, to give a voice to women in defining community priorities and selecting sub-projects to be financed. There are also examples of interventions aimed at reducing drudgery for women, as in Bhutan, Bangladesh, Indonesia, Timor-Leste and Nepal. In collaboration with AIT under the APMAS grant, APR organized a writeshop on M&E which produced 4 guidance papers on methods for gender-sensitive monitoring and results-management. APR also supported the International Conference for Gender and Sustainable Mountain Development in a Changing World, held in Bhutan in October 2012, ensuring the participation of IFAD projects to share experiences and engage within communities of practice focused on mainstreaming gender issues.
133. Seventeen per cent of Asia’s population is between 15 and 24 years, but the regional differences are substantial. In Bangladesh, for example the median age is 23.9 years, in India half the population is below 24. Most projects reach out to rural young people as an integral part of their inclusive, pro-poor targeting approach. To address low employment opportunities, which is one of the main challenges faced by young people, projects focus on building their skills and bringing them together with potential employers. Efforts include a job connection programme by the Programme for DBRPP in Ben Tre Province in Viet Nam, a Young Professional Programme by the RMLSP in Afghanistan (AF-1460) providing practical experiences to young graduates; and vocational training under OTELP in India (IN-1155). In Cambodia, RULIP (KH-1350) has been establishing young farmer clubs since 1998 to support technical training on production, vegetable growing, chicken raising and other basic agriculture to young farmers, who are either students or jobless youth, so that they can assist their families. The project reviewed the status of the clubs and determined that 50 per cent of them were successful. Some clubs have been provided with vocational training (for example, in food and taro chip) and handicrafts (for example, weaving).
D. Innovation and Learning
134. For the fifth consecutive year, more than 70% of APR projects have been rated PSR scores of 4 or above under this criteria. As with previous years, Bangladesh and China feature strongly in the list of projects rated 5 or above, with four and three projects respectively. However also this year we see projects in Bhutan, India, Nepal, Pakistan, Philippines, Solomon Islands and Sri Lanka achieving this level of rating.
135. One notable project focussed on testing innovations on a small scale and then disseminating successful ones and providing finance and support services for their replication is FEDEC in Bangladesh (BD-1402). Partner organisations as well as FEDEC are generating technical reports on successful innovations that are disseminated to a large audience (farmers, other value chain stakeholders, relevant local and national administration, other projects and donors, each PO of the PKSF network). The publishing of the most promising projects in terms of replicability, impact on producers’ livelihoods and income is a key factor for the scaling-up of these activities and increased outreach in and outside Bangladesh. Newly introduced methods and products also include the cluster-based approach to SME development by RuMEPP in Philippines (PH-1253) and the introduction of livestock insurance and index-based crop insurance by PRISM in Pakistan (PK-1413).
136. Other innovations relate to new technical solutions, for example the construction of concrete block roads under SCBRMP in Bangladesh (BD-1165) to withstand severe weather events, sand-based mini hatchery and cage fish culture new to the project area, and innovative submersible dams used for dry season water conservation and irrigation, all of which are being replicated and scaled up. Also in Bangladesh, and mentioned elsewhere in this report, women's LCSs which in addition to employment opportunities, receive toll free access for selling goods in markets. In Bhutan, the introduction of low-cost electric fences by MAGIP (BT-1482) has reduced crop damage caused by wild animals.

30
137. Some innovations related specifically to agricultural technologies include: in Bangladesh, improved rice varieties that are being widely adopted under SCBRMP (BD-1165); in India: improved varieties of vegetables and leguminous crops in Orissa OTELP (IN-1155) and integrated paddy and vegetable production in Tejaswini TWEP (IN-1314); in Sri Lanka: planting rubber in forest buffer and introducing systems for specialised products including medicinal plants and mushrooms in SPENDP (SL-1316); and in Timor-Leste: new varieties of rice and maize with 20 to 50% higher yields.
E. Knowledge Management
138. APR country teams and projects continue to demonstrate a strong commitment to strengthening KM: KM features strongly in all COSOPs developed during the reporting period, as evidenced in advanced COSOP drafts for Cambodia and Nepal as well as in the new Pacific Sub-regional Strategic Opportunities Paper. In addition, a number of projects have formulated or refreshed their own KM strategies during the reporting period.
139. A number of important KM initiatives have taken place, including workshops and conferences where experiences, lessons and best practices are exchanged, and where training on KM can be part of the agenda. Two notable examples are: the ‘National Conference on Tribal People – Land, Livelihoods, Governance and Emerging Development’ organized in Odisha, India, in October 2012; and the Microfinance Summit in Pakistan organized by the Pakistan Poverty Alleviation Fund (PPAF). IFAD sponsorship of the latter event assisted PPAF in showcasing its experiences within IFAD-funded projects in reaching the rural poor and improving their links to markets. IFAD also co-financed an international conference in Bhutan that contributed to South-South & Triangular Exchange and network building among high-level government representatives, university professors, and international and national rural development organizations from Africa, Latin America and Asia. The conference focused on gender case studies and best practices regarding climate change and environmental issues, governance and food security in mountain areas.
140. Several IFAD grants have actively documented and disseminated experiences. These include: the ICFRAF-implemented Rural Upland Payment for Environmental Systems programme, which published a book, “Angels of the Earth”; CIAT’s “A Roots to Riches Story: Fine tuning South-East Asia’s Cassava Boom”; and the Pakistan Poverty Alleviation Fund's “Women of Substance Success Stories”. These products have been complemented by journal articles and policy briefs.
Box 9: Growth of the IFADAsia community
APR's primary platform for supporting learning and exchange of experiences and information is its IFADAsia online network. The network has accelerated connections and sharing between IFAD headquarters and field staff, project staff and partners. It contains more than 150 individual sites, and reaches almost 2 000 registered members. Since the beginning of the reporting period, the number of visits has increased from 651 to 5110, the number of visitors has increased from 591 to 4004, and returning visitors have increased from 20% to 73%.
141. A number of internal knowledge-sharing initiatives have been launched since January 2013. A reflection and learning event was held in Viet Nam in March 2013 and followed-up by cross-cutting groups developing new methods for exchange and cross-fertilization among peers and coaching between staff. In parallel, a number of consultations have been held with SKM on organizing KM support to IFAD programming in Asia and the Pacific. With a view to charting out a path for renewing and expanding IFAD's KM activities in the region, APR staff members have been actively involved in the development of IFAD's KM Framework.
Box 10: Documenting scaling-up experiences
During the review period APR has undertaken analytical work to appraise IFAD’s experience in the region in promoting scaling up. A publication “From Innovation to Impact: Scaling up Successes in Asia and the Pacific” has recently been published which documents successful case studies and lessons learned. Further review of the current regional portfolio indicates that there are approximately 30 good practices and innovations that are being scaled up in the region. Examples include: integrated dairy and poultry schemes being replicated in Afghanistan; support to ensure sustainable access to and management of water bodies for fishing communities through leases in Bangladesh; leasehold forestry in Nepal; the Micro Initiative Fund for poor small farming and backyard processing enterprises in Bhutan; and the development of village institutions for watershed management in India.
142. Nonetheless, challenges persist in strengthening project KM activities at project level. These are due in great part to the high turnover of project KM staff and delays in rehiring, and to the additional duties KM Officers carry out. APR's full-time KM position was abolished and KM support activities have been mainstreamed among APR staff. During this transition period, some explicit KM products, such as IFAD's

31
Reflecting the regional context, scaling up in Asia and the Pacific refers to instances where an innovation or method promoted by one development champion is conjoined with partnership funding and human resources for wider application, normally leveraging improved ratios of external or domestic co-financing.
regional bi-monthly newsletters, have been temporarily retrenched, although others continue, such as country newsletters and Occasional Papers.
F. Scaling Up
143. According to aggregate PSR ratings, APR is performing satisfactorily in relation to the potential of scaling up and replication, with 78% of its projects rated as moderately satisfactory or better, with an average PSR score of 4.3. Of the eight projects rated less than moderately satisfactory, five are “at risk” or “potentially at risk”, and seven of these projects were designed before 2008, when scaling up became a critical issue for IFAD.
144. Recent COSOPs have placed more focus on strategically planning and managing for promoting the scaling up of impact. For example, recent country strategies for Bangladesh, Cambodia, China, and India include explicit strategies for pursuing scaling up of impact. The RB-COSOP for Bangladesh explicitly targets the scaling up of women’s LCSs and approaches to community resource management. In China, the COSOP includes scaling up of good practices as an explicit strategic objective. In Nepal the COSOP delineates evidence-based learning as a key element of testing and scaling up innovations. Strategic planning for scaling up is also present in almost all projects approved since 2010. In addition emphasis has been placed on scaling up good practices and innovations from grant-funded action-research through the institutionalization of good practices into existing government programmes and services. Many of IFAD’s grants for agriculture research and technology have shown potential for scaling up (e.g. IRRI with rice production in unfavourable environments, CIP with roots and tubers, ICRAF with payment for environmental services).
145. From APR’s experience, the key drivers for scaling up relate to the need for strong champions, whether from government, development partners or from the beneficiaries themselves. Champions advocate for the political, policy and institutional space needed for successful scaling up. For instance, in Timor-Leste, key partners in Government have introduced new policies to support post-harvest and grain storage, creating the possibility for scaling up of the Timor-Leste Maize Storage Project (TL- 1576). The existence of implementing partners with clear vision and leadership, and the presence of committed local champions has have a strong influence on scaling up success
146. A number of pathways20
have been used to scale-up successes. Scaling up of projects focusing on community development, targeting of women and alternative modes for service provision has primarily taken the form of outreach to additional beneficiaries and villages/districts through expansion and saturation within the project area. For example, MIOP (PK-1324) expanded access to pro-poor microfinance products and services through low cost delivery channels to rural women and men in remote areas. Project components or
20
“By ‘pathway’ we understand the sequence of steps that needs to taken in the innovation-learning-scaling cycle to assure that a successful pilot is taken from its experimental stage through subsequent stages to the scale ultimately judged to be appropriate for the intervention pursued.” Scaling Up the Fight Against Rural Poverty: An insitituational review of IFAD’s Approach, Linn et al., Brookings Institute, Washington DC, 2010
Box 11: Scaling up in India
The India Country Programme has a number of follow-on projects. NERICOMP has been scaled up through a 2
nd phase
IFAD project (IN-1040) as well as through a much larger intervention, based on funded by the World Bank. ILSP (IN-1617) is scaling up successful rural development initiatives in the State of Uttarakhand, whereas JTEL is replicating successful tribal development initiatives in the State of Jharkhand (IN-1063). The Government of Orissa scaled up the model of tribal development implemented under OTELP (IN-1155), doubling OTELP outreach in the existing OTELP operating districts with an additional US$ 100 million in counterpart contribution and reaching an additional 70 000 households, bringing total coverage to 126 000 households. India's National Rural Livelihoods Mission aims to adopt the Vulnerability Reduction Funds approach implemented under the PTSLP in Tamil Nadu (IN-1348), which provides loans for recovery from livelihood loss, damage to housing, and medical expenses. In Maharashtra, the NRLM is using existing knowledge and capacity built under TWEP (IN-1314) for preparing the state perspective plan and a community operational manual as well as for training staff.

32
activities focusing on improved crop technology and farming practices are often replicated beyond the original project area once they are tested and validated. For example under the READ Programme in Indonesia (ID-1258), IFAD is partnering with MARS, a private company, to deliver technical training and support to poor cocoa farmers. Based on the success in the project areas, the partnership is being expanded to other provinces in the country.
147. In some cases, a single scaling-up pathway provided opportunities to expand several successes at once. For example, HILIP (BD-1585) is expanding the nearly completed SCBRMP (BD-1165) from one to five districts and is replicating three successes from SCBRMP and MIDPCR (BD-1322): leasing bodies of water (beels) to Beel User Groups; supporting locally-run Market Management Committees; and organizing women in Labour Contracting Societies.
148. There is also evidence of good practices that have been replicated by governments into national programmes; and of mainstreaming project innovations into existing government structures, processes or programmes. For example, in Indonesia microfinance and participatory development approaches have been mainstreamed as part of Government policy. In Viet Nam, methods to support poor households' transition from subsistence to market-oriented agriculture have been adopted within the Government-led Socio-Economic Development Plan. In the Philippines, RuMEPP (PH-1253) has influenced the Government's policy for supporting micro-enterprises, in addition to mobilizing Government budget for a multi-fold expansion of the project; and RaFPEP (PH-1455) has led to new amortization policies for communal irrigation systems.
G. Sustainability21
149. The various dimensions of project performance that are used to assess sustainability – institution building, empowerment, quality of beneficiary participation, responsiveness of service providers, exit strategy, environmental sustainability, and potential for scaling up – had an average score of 4.1 on a scale of 1 to 6, indicating an overall rating of moderately satisfactory. Higher scores are recorded in potential for scaling up (4.3), quality of beneficiary participation (4.3) and empowerment (4.2). Projects perform slightly less well on average in relation to responsiveness of service providers (4.1) and in defining an exit strategy (3.9). Successes and challenges in each dimension are described below. (Information on scaling up has been described in the previous section.)
Institution building
150. APR projects largely perform satisfactorily in terms of institution building. The average score is 4.1 moderately satisfactory. Nine out of the 63 ongoing projects are rated moderately unsatisfactory (3). Out of these 9 projects, 5 are at risk and 1 is potentially at risk, suggesting that there are probably broader implementation problems.. Most projects in the APR portfolio work with community-based institutions, and a number of projects also support apex institutions. Building mature and inclusive organizations and enterprises, and linking them with input suppliers and market outlets, has been challenging, and results are mixed. In a number of projects, supervisions have found weaknesses mainly in social cohesiveness, financial management and business skills. Those functioning well demonstrate that active participation in grassroots institutions translates into improved livelihoods, income-generating opportunities and access to inputs and markets, and increased empowerment.
Empowerment
151. All except five APR projects scored a 4 or 5 on empowerment, i.e. moderately satisfactory or satisfactory. The average score of 4.2 indicates that projects have generally supported poor rural women and men to develop and strengthen their organizations and communities. For example, dairy goat groups supported under RMLSP in Afghanistan (AF-1460) not only increased the technical know-how of their female members but also enabled them to address other important issues such as household dynamics, women’s rights, hygiene and nutrition. In India, women’s SHGs supported under IFAD projects often manage to obtain resources for development interventions in their villages (e.g. for sanitation) or influence policies to address gender issues (e.g. approval of a law to forbid sale of liquor resulting in a decrease in violence against women).
152. Of the five projects scoring below 3 on empowerment, two are in South Asia – where inequality is embedded in caste, gender or tribal norms and traditions – and 3 are in Southeast Asia. The supervision
21
Sustainability often reflects the level of commitment, locally, to IFAD-funded interventions as well as providing a proxy measure to effectiveness of interventions. Moreover, sustainability is a determinant of the benefit stream and therefore of the project's actual return on investment. Consequently, this review looks at sustainability in some level of depth.

33
assessment of MPOWER in India indicates that weak project execution, rather than any technical flaw or unforeseen circumstances, has hampered the development of grassroots institutions (primarily Village Development Committees and SHGs) and livelihood developments activities. The primary reason was a conflict between the PMU and the NGOs contracted to undertake social mobilization. The contractual arrangements prevented the NGOs from paying their staff on time, and holding onto them. Thus, field operations were hampered. In addition, there is a concern that, in the absence of a coordinated and highly sensitive approach to addressing deep-rooted gender inequalities, project activities such as microfinance may have adverse effects on rural women. Similarly, a rating of moderately unsatisfactory in SPENDP in Sri Lanka (SL-1316) reflects the focus, by implementing partners, on technical elements of crop development, with limited attention to strengthening grassroots institutions or to addressing gender equity – including in the management of resources.
153. Projects encountering difficulties in conducting participatory planning processes or failing to conduct them at all experienced problems in the implementation/outcome of associated activities. For example, in AMEPP (BH-1296), beneficiary participation in identifying and planning activities, such as site selection for collection centres and sale points, was not always adequate; as a result, some of these centres are unused.
Quality of receiver participation in community-led planning, execution and monitoring
154. The average scoring for beneficiary participation is 4.2. Only 6 projects were assessed to be moderately unsatisfactory, of which 3 are projects at risk and 1 is potentially at risk. With their strong focus on grassroots institution building, APR projects record a number of success stories in facilitating participatory and bottom-up planning, development and monitoring processes at the community level. For example, NERCORMP II (IN-1040) developed a community perspective planning methodology, which informed project AWPB preparation. This tool allows the communities to effectively participate in the planning process, map local resources, and plan and project actions over the medium-term.
Responsiveness of service providers
155. On average, the extent to which service providers respond to demands of their rural clientele, and to which beneficiaries are consulted and involved in the selection and monitoring of service providers has been rated 4.1, or moderately satisfactory. Ten projects (16 %) scored moderately unsatisfactory, and the remainder scored 4 or 5. Out of the ten projects scoring 3, five were problem projects or potentially at risk, indicating more systemic problems in implementation. Four projects were implemented in Laos or Viet Nam, where modalities of service provision traditionally tend to be more "supply-driven". The score of 3 for the tenth project, the Community Development Programme in Kashmir region of Pakistan reflects a mixed experience in service provision, with some challenges in responsiveness and budget for higher-level institutional support but significant engagement in planning and execution at the community level.
156. Overall, supervision reports confirm that targeted communities are satisfied with training delivery, provision of rural advisory services and the selection and implementation of activities. In general, project interventions have enhanced the provision of better quality, demand-driven and pro-poor rural advisory services by building the capacity of both public institutions and private-led/community-based service providers. Some projects have promoted market-oriented models in extension services. Projects have also increasingly helped establish linkages between smallholder producers and high-quality input suppliers and market outlets, including by supporting the service provision of farmers’ and producers’ organizations to their membership.
157. In spite of this overall success, some projects that introduced successful approaches for delivering private-led rural services face a number of risks. These were related to inadequate revenue generation for service providers, difficulties in establishing self-financing associations, and limited government resources to sustain the approaches.
158. Linked to these financial challenges, other projects experienced difficulties in ensuring that rural advisory and extension systems are of adequate quality, relevance and outreach, especially in the more remote locations; that these systems are participatory and market-oriented; or that financial services provide long-term loans that can enable farmers to invest in, sustain and expand improved agricultural activities.
Exit strategy
159. Projects seem to perform less well in defining an exit strategy (average score 3.9). This is largely due to difficulties in securing long-term government funding, particularly in view of annual and sometimes unpredictable budget allocation processes; or to the inability of community-based service providers to generate enough revenue to become self-financing organizations. However, some encouraging examples can be found. The Provincial People’s Committee of Quang Binh, Viet Nam will continue to provide

34
programme support to groups and cooperatives supported by DBRPP (VN- 1422) through the annual budgets of socio-economic development plans.
Environmental sustainability
160. Most projects have successfully adopted measures to ensure no adverse (potential) impact on the environment, in particular through monitoring infrastructure development and farming/fishing practices. For example, in SCBRMP (BD-1165) in Bangladesh conducted environmental impact assessments for construction work and the planting of trees and other vegetation for road protection. LIPH (IN-1226) in Uttarkhand, India, adopted the conservation best practices to prevent soil erosion and encroachment into forests in the hilly areas through communal forest management in collaboration with the Forest Department. A number of projects have contributed to protect, improve or restore the environment. For example, biogas systems constructed by SPEAR (CN-1478) contributed to a significant decrease in the use of chemical fertilizers and pesticides, and a reduction in firewood consumption. With the technical support of local agricultural extension agents, one township planted about 170 ha of groundnuts; biogas slurry was used as base fertilizer and the fluid from the biogas digester was used as fertilizer. This generated an additional income of over US$ 160 per farmer. Similarly, land improvement activities implemented by SGPRP (CN-1271) in China, such as land terracing, and biogas and solar energy development, have increased productivity and slowed or halted land degradation.
161. Some minor adverse outcomes have been observed, most likely due to the impact of climate change. For example, under AMEPP in Bhutan (BH-1296), some improved water sources intended for irrigation dried up due to climatic conditions. Climatic conditions have also affected marine activity and reduced the inshore fishing catch for fish marketing societies supported by PTSLP in India, placing some doubts on the sustainability of the fisheries management groups.
VII. EVALUATION
162. During the review period, IFAD’s Independent Office of Evaluation (IOE) conducted two Country Programme Evaluations (CPE), five Project Performance Assessments (PPA) and two Project Completion Report Validations (PCRV).
22 A comparison of the final project ratings for from the latter PPAs and PCRVs
with those provided by APR PSRs (in project completion reports) shows largest differences in relation to food security and physical financial assets (see Table 13 below). Interestingly, food security and incomes were the two highest rated areas in IFAD's Client Survey (at an average score of 4.7, though for different country coverage than IOE's evaluations). The differences can partly be explained by the different definitions used, with IOE's food security measure also including agricultural productivity. Household income and assets are rated as 4.0 by IOE, compared to Physical and financial assets that are rated as 4.6 by PCRs.
Table 13: IOE and PSR ratings at project completion
IOE criteria IOE rating
PSR rating
PSR criteria
Effectiveness 3.9 4.4 Likelihood of achieving development objectives
Household income and assets 4.0 4.6 Physical/financial assets
Food security and agricultural productivity
3.9 4.7 Food security
Institutions and policy 4.0 4.3 Institution building
Sustainability 3.7 3.7 Exit strategy
Innovation and scaling up 4.3 4.7 Innovation and learning/Potential for scaling up and replication
Gender equality and women's empowerment
4.6 4.5 Gender focus/Empowerment
Overall project achievement 4.0 4.6 Overall implementation progress
163. The overall ratings for the CPEs undertaken by IOE in Indonesia and Nepal was 4, moderately satisfactory. APR and governments participated in the evaluations, which benefitted from a healthy exchanges of perspectives.
22
The PPAs are: MFTSP (BD-1235) in Bangladesh; RPRP (KH-1261) in Cambodia; NMSP (IN-1121) in India; RPRP (MN-1205) in Mongolia; NMCIREMP (PH-1137) in Philippines. The PCRVs are: SFATADP (PK-1078) in Pakistan; and PT-LiSPP (SL- 1351) in Sri-Lanka. IOE also conducted one PPA in China and Bangladesh and one PCRV in China during the reporting period, but the final findings were not yet available at the time of preparation of the portfolio review. .

35
164. In Indonesia, the CPE acknowledged that IFAD could play a leading role in promoting productive, competitive and high-value smallholder agriculture, even after the country has transitioned into a middle income country. The CPE concluded that smallholder agriculture is and will continue to remain a very important sector for the Indonesian people and economy. The CPE noted that the COSOP process did not provide an adequate foundation for the country programme and that the Government’s role and contribution were limited. IFAD had had limited success in positioning itself strategically in relation to Government programmes and the activities of other development partners. It should place emphasis on identifying, promoting, validating and scaling up viable agriculture innovations that are appropriate for smallholder agriculture, in active partnership with the Government and with other strategic partners and stakeholders, including the private sector.
165. Notwithstanding the post-conflict challenges in this fragile country, IOE's CPE for Nepal found that IFAD's programme was highly relevant and rather effective in improving livelihoods and alleviating rural poverty. IFAD actively expanded the country programme despite the country’s enduring post-conflict situation. At the same time, sustainable impact was hampered until recently by a wide geographical and thematic spread. In spite of the successful leasehold forestry approach, innovation was considered relatively unsuccessful overall; and, as often found in development projects operating in fragile states, a number of activities were considered project-driven with limited evidence of sustainability. The programme supported the formation of thousands of beneficiary groups, the majority of which are still institutionally and financially weak. In spite of some important successes, in the CPE’s assessment, the challenges of building responsive local governments in conflict and post-conflict situations were underestimated.
166. Rated satisfactory (5), the Microfinance and Technical Support Project (BD-1235) in Bangladesh and the National Microfinance Support Programme (IN-1121) in India were both recognized for their considerable impact and successful and innovative approach to microfinance. NMSP adopted an innovative approach of commercializing microfinance through a public-sector MFI apex institution that on-lent funds to member MFIs. By completion, the project had reached 6.6 million beneficiaries – 500% of the appraisal estimate – with an IFAD loan of only US$ 22 million. The project was recognized by the PPA as one of the most leveraged projects for IFAD. In addition to leveraging SIDBI financial resources and partners, NMSP also partnered with DfID, which provided a major capacity building programme that is considered instrumental for the project's success. In the aftermath of the microfinance crisis in India, sustainability cannot be demonstrated. There is much ongoing debate on the causes of the crisis, and on solutions for revitalizing investment in small and micro-enterprises.
167. Similarly, MFTSP's success was a result of combining financial services with technical support to borrowers. MFIs have now added technical personnel as standard members of their advisory teams and their outreach methodology well into the post-project period. Targeting was effective. However, for both this project and NMFP, IOE's assessments suggest that the focus on sustainable microfinance had not reached the poorest; and that more could have been done to strengthen women's participation and empowerment – a key challenge in South Asia, where overall progress in gender equity has been below target. To further enhance the effectiveness of the microfinance activities, future projects are recommended to (i) ensure, in parallel with credit, sufficient support to income-generating activities; (ii) enhance the focus on qualitative aspects of women’s participation; and (iii) develop a differentiated strategy to reach the hard-core poor.
168. In relation to IFAD's Rural Finance Strategy and related Learning Notes, findings from recent experiences in APR's portfolio confirm that dedicated rural finance projects provide a focus and foundation for promoting innovative solutions and well-performing strategies for inclusive finance. This includes recently evaluated projects in India and Bangladesh as well as PRISM (PK-1413) in Pakistan. All three were founded on performance-based partnerships between Government and financial institutions, and successfully improved outreach to rural SMEs and micro-entrepreneurs. Nonetheless, this review notes that other experiences in the region suggest that, under certain conditions, embedding rural finance within a wider programme can be equally effective in expanding outreach to the poor. In China West Guangxi Poverty Alleviation Programme, which was evaluated in 2010/2011, such an approach allowed the project to operate 'as a framework for well-tuned, mutually reinforcing agricultural development activities'. This project delivery structure helps financial institutions identify and monitor clients, while the assistance of agricultural extension services contributes to the viability of investments. Activities to build the capacity of the target group, such as in financial literacy or in self-managed groups, are an important complement to rural financial services, particularly for the poorer segments of MFI clientele. A broader approach, e.g. including infrastructure and value chain development, helps connect farmers to markets, as was the case under WGPAP.
169. Market segmentation was an important feature of IFAD's successful rural finance interventions, such as PRISM project in Pakistan, China WGPAP, India NRFP and Bangladesh MFTSP. Differentiated services appropriate for poorer segments of the market and sensitive to gender differences permitted expanded

36
outreach and higher efficacy of lending operations. Group savings and lending schemes improved linkages with financial services for the poorest.
170. Two other assessments, both in fragile states in South Asia, suggest that the capacity of IFAD projects to support the rural poor is significantly hindered in volatile security contexts or in situations where households require complex multi-sector support to regain their livelihoods. SFATADP (PK-1078) in Pakistan faced a rapid deterioration in its security situation. With limited facilities for risk assessment and mitigation, the project failed to achieve it targets. The SFATADP assessment also underlined the need for a sound understanding of tribal societies to ensure an appropriate and effective approach to empowering women and enhancing their participation. In Sri Lanka, the PT-LiSP (SL-1351) was considered an appropriate response to the post-tsunami emergency, and contributed to re-establishing social and economic infrastructure. It adopted a participatory approach that generated local ownership and learning. Yet the programme had a wide range of activities whose budgets were not commensurate with needs. In addition, the complexity made coordination with other programmes more challenging. Weak M&E undermined the pace of problem identification and corrective action.
171. The assessment of the Northern Mindanao Community Initiatives and Resource Management Project (PH-1137), rated as satisfactory (5), indicates that IFAD does have a particular niche in ensuring locally driven development in post-conflict zones. Participatory processes carried out by partner local government units enabled communities to address their own priorities, and the Poverty Alleviation Fund allowed self-help groups and communities to mature through new development opportunities. This suggests that IFAD can have solid comparative advantage in re-establishing rural livelihoods in post-conflict areas. The assessment of the Rural Poverty Reduction Project (KH-1261) in Cambodia also highlights the success derived from supporting group formation (livelihood improvement groups) and participatory processes for commune or village planning and implementation.
VIII. PORTFOLIO MANAGEMENT
A. Supervision and Implementation Support
172. Of the 63 projects ongoing during the reporting period, 53 are directly supervised by APR. Six are supervised by the World Bank's IDA (Bangladesh: 2, Indonesia, Nepal, Papua New Guinea, Solomon Islands and Sri Lanka: 1 each); and 4 by the Asian Development Bank (2 in each of Cambodia and Laos) under Cooperating Institution agreements.
173. For the 53 directly supervised projects, a total of 51 IFAD supervision missions, 6 mid-term reviews, and 1 post mid-term review were conducted. All projects benefitted from at least one full supervision assessment, of an average duration 13 days, during the reporting period. 30 projects also benefitted from an implementation support mission- a total of 48 implementation support missions were undertaken during the reporting period (see next section for more details).
174. Feedback from Project Managers indicates marked improvements in supervision quality since APR began to implement direct supervision modalities in 2008. Project Managers expressed their appreciation for the amount of time spent in the field, consulting target group and local partners; and the consistency and quality of mission technical advice. Feedback surveys also reveal that mission Aide Memoires adequately incorporate comments of the project team; and that according to respondents missions are operating efficiently and effectively. Consultation on TOR and on timing of missions is appreciated, with few minor deviations. The most common recommendation received from Project Managers is to maintain the composition of supervision teams in subsequent supervisions.
175. In APR's assessment, the improvement of quality of supervision is primarily due to three key factors. First, increased experience of IFAD staff and country teams in undertaking supervision, and a strong commitment to continuously strengthen the support provided to IFAD clients and the target group. Second, rotation of country assignments in 2011 has brought a renewed level of energy and enthusiasm, as well as cross-fertilisation of experiences and a new mix of skill sets, technical expertise and operational insights. This has been complemented by drawing on country officers for supervision work outside their country of assignment, as well as the engagement by CFS officers and occasional involvement of technical advisors from PTA. Third, APR's Supervision Quality Assurance process has contributed substantially to these improvements. Although resource intensive, the process ensures an in-depth and integrated review of implementation performance across key strategic, operational and fiduciary areas; and that performance ratings are of significant rigor and robustness to inform portfolio-management decisions and IFAD's performance-based country programme allocations.

37
176. The declining levels of IFAD administrative budget allocated to supporting the supervision process are creating incentive and the necessity for country teams within the region to innovate with their supervision process and approaches. There are different supervision models emerging in the region related to the country context but also the need to increase the efficiency and effectiveness of the supervision process. In some country programmes supervision missions for a number of projects are clustered to reduce transaction costs and to strengthen the opportunities for knowledge management and learning. In other countries the CPM/CPO are leading and executing the supervision process together with government without any external consultant support. In addition there are also other emerging models which involve the clustering of supervision mission across a number of countries to create efficiencies and promote cross learning. APR will continue to monitor and evaluate the performance of the various models emerging.
177. Implementation support has proven effective for addressing acute problem areas, particularly those related to project management or technical issues; but perhaps less so in resolving institutional bottlenecks. There are examples where such support has moved projects out of problem status; or assisted challenged projects in resolving key constraints and bottlenecks. For example RULIP in Cambodia (KH-1350), which had fallen into problem status at the beginning of the reporting period, benefitted from multiple-purpose missions by the CPM and the country team, and was able to address key challenges e.g. in relation to farmer field schools and community mobilization. Similarly, READ and PNPM in Indonesia (ID-1258 and ID-1341) accelerated their improvements since moving out of problem status and SOLID (ID-1509) out of potential problem status. Notwithstanding these and other improvements, it is also noted that there are cases where intensive implementation support has improved project performance yet projects fall back into problem status due to institutional set-up. This includes WUPAP in Nepal (NP-1119), which is in the last phase of its Flexible Lending Mechanism programme and moved out of problem status in the previous reporting period. WUPAP fell back into actual problem status when the Government assigned the project to a newly formed Ministry and project execution slowed.
178. APR's commitment to supervision carries over into IFAD-funded projects that are supervised by co-operating institutions- the World Bank and ADB. A total of twelve supervision missions were undertaken for the ten projects ongoing during the reporting period that were being supervised by CIs. IFAD participated in 8 of these missions. Experience suggests that participation in supervision of CI-supervised projects is critically important for ensuring that IFAD can influence the supervision process and contribute its comparative advantages to improve performance of its co-financed projects.
Box 12: Active project supervision with co-operating institutions
Cambodia - Tonle Sap Poverty Reduction and Smallholder Development Project: Effective in February 2010, the project is facing substantial implementation delays, and the Livelihood Improvement component funded by IFAD is lagging far behind schedule. By participating in the supervision mission, IFAD has been able to ensure agreement with ADB and the Government's executing agencies on a series of actions required to address the main bottlenecks and concerns. These actions aim to speed up the formation of Livelihood Improvement Groups (LIGs), following appropriate technical procedures; enhance LIG management; provide mentoring support for LIG members; and secure viable animal health support services. Indonesia - National Programme for Community Empowerment in Rural Areas of Papua and West Papua: IFAD took the lead in a joint supervision mission to ensure a greater focus on the performance of IFAD financing in a much larger Government programme with lead donor funding by the World Bank. Leading the mission ensured all IFAD requisite reporting was fulfilled. Further, it enabled IFAD, the World Bank and Government to give due attention to the innovative features of agriculture and food security development formulated for the poorest areas of Indonesia. IFAD's leadership turned the spotlight on management gaps and forged agreement on corrective actions and progress markers, needed to ensure the project fulfils its mandate, and that its significant successes can be replicated in other parts of the country. Solomon Islands - Rural Development Program: Participation in the SIRDP supervision mission was particularly useful in knowledge sharing and strengthening ties amongst the 3 major co-financiers – IFAD, World Bank and AusAID. Agreement was reached on the importance of donor collaboration and the desirability to join forces again, in a single co-financed project to scale-up SIRDP successes.
179. The existence of projects that cover multiple states or provinces within a single country continues to present challenges to APR supervision teams. Supervision of such projects, which normally feature two or more parallel lead management structures each covering a separate administrative units (leading to varying implementation capacities, differing pace of progress and distant geographic locations) has overextended project supervision teams and resources. APR's lesson from this difficult experience is to henceforth design projects only in single states or provinces implemented by a contiguous lead partner, and provide existing multi-state projects with a higher share of supervision budget.

38
180. Budget restrictions in 2013 have reduced the number of regional grants supervision missions this year. During the period under review six large regional grants, (almost one third of the large regional grants) were supervised. For country grants, CPMs and CPOs have sought to ensure supervision in conjunction with other missions programmed in the country, or through the use of local consultants in order to enable a thorough follow-up of activities on an annual basis including better linkages with other country programmes. A number of country teams have also organized national workshops that included staff of both investment loans and R&D grants in order to strengthen exchange of experiences and information, thereby fostering linkages with loans.
B. Risks
181. A review of risks specified in Section C of the PSRs prepared during supervision suggests a number of repeated fiduciary risks. Among these:
procurement delays, which affect the quality of work and the possibility of ensuring maximum value for money;
the capacity of groups to manage revolving funds, which is not always demonstrated;
late or insufficient counterpart funding;
delays in budget approvals and flow of funds, particularly to decentralised levels (provinces, districts);
low quality of accounts or record-keeping at different levels of operations; and
delays in payments to service providers which influence quality and may limit future contracting options.
182. Implementation risks include the incomplete staffing of projects, or the limited capacity of recruited staff (especially at decentralised levels); staff turnover; delays in budget approvals; and operational challenges in adjusting government's approach and beneficiary perspectives to market-based ones.
183. In terms of sustainability, main risks highlighted by supervisions relate to:
maturity of groups, and their linkages with formal services;
strength of exit strategy or some doubt of capacity of local government units to continue operations after project end;
adequacy operations and maintenance arrangements for infrastructure investments; and
reliance on contracted service providers that cannot be engaged beyond project life.
C. Portfolio at Risk
Chart 11: Portfolio performance 184. APR has reduced the number of problem projects, from 17 two years ago to 12 last year, and to 9 this year. This translates into a reduction from 27% of projects at risk in June 2011 to 14% of projects at risk this year. Some problem projects have closed or have been cancelled; others have benefitted from implementation follow-up by IFAD country teams to resolve bottlenecks and constraints.
185. Indonesia and Lao PDR had the largest reductions in number of projects at risk and potential problem projects over the past two years, and therefore the largest improvements in PAR country scores. A detailed table with number of projects at risk, potential problem projects and projects not at risk in each country is provided as
table 10 in the appendices. As for the reduced ratings, Sri Lanka has an additional potential problem project, whereas Philippines has one less project not at risk (due to completion). Generally these ratings indicate an overall improvement in portfolio health, consistent with earlier analysis in this report.
0
10
20
30
40
50
60
70
2010/11 2011/12 2012/13
66% 75%
81%
7%
7% 5%
27% 19%
14%
Nu
mb
er
of
pro
ject
s
Portfolio Performance (2010/11- 2012/13)
Not at Risk Potential Actual Problem
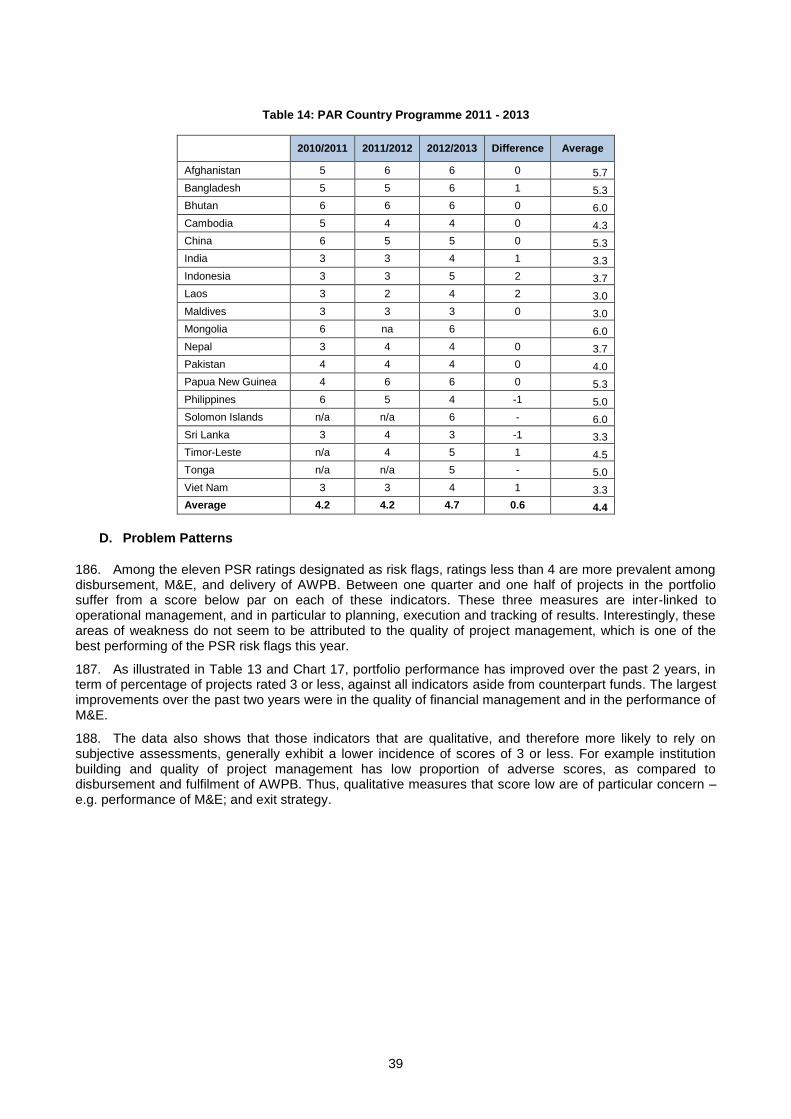
39
Table 14: PAR Country Programme 2011 - 2013
2010/2011 2011/2012 2012/2013 Difference Average
Afghanistan 5 6 6 0 5.7
Bangladesh 5 5 6 1 5.3
Bhutan 6 6 6 0 6.0
Cambodia 5 4 4 0 4.3
China 6 5 5 0 5.3
India 3 3 4 1 3.3
Indonesia 3 3 5 2 3.7
Laos 3 2 4 2 3.0
Maldives 3 3 3 0 3.0
Mongolia 6 na 6 6.0
Nepal 3 4 4 0 3.7
Pakistan 4 4 4 0 4.0
Papua New Guinea 4 6 6 0 5.3
Philippines 6 5 4 -1 5.0
Solomon Islands n/a n/a 6 - 6.0
Sri Lanka 3 4 3 -1 3.3
Timor-Leste n/a 4 5 1 4.5
Tonga n/a n/a 5 - 5.0
Viet Nam 3 3 4 1 3.3
Average 4.2 4.2 4.7 0.6 4.4
D. Problem Patterns
186. Among the eleven PSR ratings designated as risk flags, ratings less than 4 are more prevalent among disbursement, M&E, and delivery of AWPB. Between one quarter and one half of projects in the portfolio suffer from a score below par on each of these indicators. These three measures are inter-linked to operational management, and in particular to planning, execution and tracking of results. Interestingly, these areas of weakness do not seem to be attributed to the quality of project management, which is one of the best performing of the PSR risk flags this year.
187. As illustrated in Table 13 and Chart 17, portfolio performance has improved over the past 2 years, in term of percentage of projects rated 3 or less, against all indicators aside from counterpart funds. The largest improvements over the past two years were in the quality of financial management and in the performance of M&E.
188. The data also shows that those indicators that are qualitative, and therefore more likely to rely on subjective assessments, generally exhibit a lower incidence of scores of 3 or less. For example institution building and quality of project management has low proportion of adverse scores, as compared to disbursement and fulfilment of AWPB. Thus, qualitative measures that score low are of particular concern – e.g. performance of M&E; and exit strategy.

40
Chart 12: PSR risk flags - percentage of projects with a rating of 3 or lower
E. Pro-activity and Reduced Risk
189. The number of projects at risk has been reduced from 12 last year to 9 this year. Pro-activity has improved for the second consecutive year, to 58%: only 5 of the 12 actual problem projects last year remain at risk this year too. Two of the five projects (KH-1464 and LA-1459) still in problem status are supervised by ADB; and one (PH-1395) is co-funded with ADB.
Table 14: Current status of 2011/2012 projects at risk
Country Proj. ID Project acronym Project status
Cambodia 1464 TSPRSDP APP
China 1454 DAPRP PPP
India 1314 TWEP NAR
India 1418 MPOWER APP
Laos 1459 SNRMP APP
Maldives 1347 PT-AFReP NAR
Maldives 1377 FADIP PPP
Pakistan 1494 CMSP Cancelled
Philippines 1395 CHARMP II APP
Sri Lanka 1316 SPEnDP PPP
Viet Nam 1422 DBRPP NAR
Viet Nam 1483 3EM APP
Total actual problem projects: 12 5
* Tajikistan KLSP was transferred to NEN division on 1st June 2012 and is excluded.
190. On average the reduced risk for APR is 80%: 4 out of 5 problem projects improved their average risk flag scores since last year. The only exception is MPOWER in India (IN-1418), which is due for a mid-term review in 2013.
0%
10%
20%
30%
40%
50%
60%
Disb. rate M&E AWPB Exit strategy Financialmgt.
Counterpartfunds
Innovation&learning
Serviceproviders
Audits Project mgt. Instit.building
2010/2011 2011/2012 2012/2013

41
Table 15: Reduced risk index
Country Proj. ID Project name
Reduced Risk Index
2011/2012 Risk flags average
2012/2013 Risk flags average
Variance
Cambodia 1464 TSPRSDP 2.5 3.1 0.6
India 1418 MPOWER 3.9 3.2 -0.7
Lao PDR 1459 SNRMP 3.7 3.8 0.1
Philppines 1395 CHARMP II 3.3 3.5 0.2
Viet Nam 1483 3EM 2.7 3.5 0.8
Total 5 Reduced Risk Index 80% 4
IX. CONCLUSIONS AND THE WAY FORWARD
191. Rural areas in Asia and the Pacific are changing, and policy makers in the region are challenged with ensuring greater food security, boosting rural incomes of farmers and employment in rural communities, addressing increased environmental and social vulnerability, and better managing risk to harness investment in agriculture and rural areas. The rise in agricultural commodity prices, increased interest from private and public investors in the agricultural sector, and the growing global awareness of the need for sustainable agriculture have all contributed to creating new opportunities – but also risks – for smallholder farmers.
192. With strong economic growth, most of the poor in Asia and the Pacific now live in middle-income countries. The context for IFAD engagement with its in Asia and the Pacific membership is changing with the agricultural sector structurally transforming in many countries. This is leading to demand for a new range of support and services from IFAD that move beyond the traditional low interest loan financing. Many of APR country programmes are attempting to adjust to this transformation, but more attention is need to adapt IFAD’s business model.
193. In line with RB-COSOPs formulated with Governments and the COSOP joint reviews, APR expects to strengthen its emphasis on: commercialization of smallholder agriculture and private sector participation; outreach to women and youth; remittances for development; and adaptation to climate change. In relation to climate change, this will include a higher level of co-financing with GEF, and additional ASAP financing. Efforts are also underway to scale up good examples in Asia/Pacific countries of pro-poor remittance schemes (funded under IFAD’s Financing Facility for Remittances) implemented to convert remittances into assets.
194. The size of APR's portfolio is expanding and most indicators suggest improvements in portfolio performance, including improved QAe scores as well as higher PSR scores; and a lower ratio of projects at risk. Nonetheless, there is room to improve efficiency and enhance delivery by expediting project start-up, accelerating the pace of implementation in the early years and ensuring timely completion. Increased attention will need to be given to operational capacities and performance of implementing partners, with progress markers include the speed of entry into force and first disbursements. In collaboration with CFS, APR shall seek to ensure timely project closing processes, reminding the borrower before project completion of all requisite steps for closure of the financing accounts.
195. Co-financing ratios have improved over the reporting period. Yet, with declining ODA to rural sectors in Asia and the Pacific, mobilizing co-financing will continue to be a challenge. Domestic and potentially regional financing resources play an increasingly important role in complementing IFAD financing. However, APR must innovate in mobilizing cofinacing from non-traditional sources. To capitalize on opportunities for private sector partnerships, APR shall take stock of its experiences and develop best practice guidelines for collaboration with private sector actors.
196. To consolidate the grant portfolio and maximize value for money, several strategic changes are being introduced in grant planning and selection processes. In particular, grant-funded and loan-financed activities will have clearer differentiation and linkages – grants will continue to focus on supporting capacity building, innovations and other “soft” elements for which clients generally do not want to use loan funds; future grants could support project readiness to kick-start implementation.

42
197. IFAD client surveys suggest that IFAD is well-recognized in the region for its strategic focus, and is appreciated as a partner for rural poverty reduction. Impact surveys suggest that its strengths are in contributing to higher incomes and improved food security. APR has demonstrated successful models of service provision that: support poor rural people in increasing their production; strengthen the organizations of rural households; and improve their access to natural and financial resources, services and markets. In doing so, IFAD projects in the region seek to develop capacities of service providers and enhances their modes of outreach to poor rural people, and to promote adaptive planning and learning that can feed lessons into policy-making.
198. A faster pace of implementation and improved performance of projects are critical for APR to meet its medium-term targets of reaching 30 million people by 2015. Current RIMS estimates for 2011 and 2012 indicate that approximately 18 million persons have been reached between 2010 and 2012. To expand outreach, a faster pace of project delivery will need to be secured through higher levels of fulfillment of AWPBs targets. In terms of results delivery, PSR ratings and survey results show a good level of effectiveness throughout the portfolio. Through its supervision processes and through strategically selected supplementary financing, APR will assess options to expand outreach, with a target of about 4 million persons per year.
199. APR projects and partners recognize that poor rural people and their organizations are entrepreneurs and risk-managers in their own right. Nonetheless, adapting to fast-evolving market conditions and climate variability remain manifest challenges for IFAD target groups. These challenges include sustainability of benefit streams, ranging from sustainable natural resource use to operational viability of marketing or producer groups. For example, apex institutions – which build capacities of poor rural people and their organizations to leverage economies of scale and improve linkages – often need to rely on partial if not full revenue generation from profitable lower-tier member institutions. More attention during design and supervision is called for in assessing long-term financial viability of base operations, in order to improve linkages with markets and potential for business growth. Where needed to ensure sustainability of benefits, IFAD-funded projects need to make the case for higher commitment of domestic resources beyond the IFAD project financing period.
200. Targeting is performing well. However more evidence is needed on whether benefits are sufficient to move people out of poverty. Targeting and outreach need to be measured better and assessed during supervisions and MTR, and at completion. This calls for improved M&E as well as strengthening stakeholders' commitment to poverty targeting through awareness raising and capacity building.
201. For APR to strengthen its policy impact and scaling up, it needs to strengthen M&E and knowledge management at project and country levels. M&E capacities and performance need to be strengthened for enhanced knowledge management and learning that can leverage scaling up. Moreover, communications, and organizational branding need to be further enhanced for IFAD to improve its visibility in the region and enhance pro-poor policy-making. IFADAsia is a key institutional asset for fulfilling APR's KM and communication objectives.
202. IFAD-funded projects will also need to place more emphasis on participatory implementation arrangements. Projects are increasingly addressing the changing institutional make-up of rural service provision (agricultural research and extension, supply of inputs, marketing of outputs, etc.), including exploring new modes for more cost-effective services and private sector linkages. The operational self-sufficiency of service provision is critical for sustainability, and requires sufficient resources, time and care towards organizational strengthening for both service providers as well as community and self-help institutions.
203. To continue to improve the technical support APR provides to its clients, the division needs to draw on the diverse set of skills, expertise and competencies of APR and IFAD staff. APR is currently mapping staff expertise around specific thematic areas and in relation to geographical coverage. Based on the mapping and clusters, staff can provide back-up or coaching support within their teams, or to the portfolio as a whole. APR will also need to strengthen its collaboration with PTA, CFS, COM and other divisions that can assist CPMs and ICOs in the delivery of IFAD's work programme in Asia and the Pacific.
204. ICO staff, and the experiences and skills they bring, are critical to the success of APR’s operations. Besides coordinating programme activities, ICO staff are making active and important contributions to core business functions such as project design, supervision, knowledge management and country strategy formulation. Improving the quality and impact of country programmes requires a continuous strengthening of APR's field presence.

43
205. Looking forward, two key thrusts and corresponding actions need to be pursued:
Securing the achievement of MTP targets by 2015 – portfolio strengthening
Hold follow-up meetings to review overall and country-level performance in relation to efficiency and effectiveness of APR and country portfolios.
Periodically review efficiency measures such as project start-ups, disbursement and pace of execution and disbursement.
Develop resolution plans for each problem project, and performance management plans for potential problem projects.
Strengthen results measurement at project and country levels with a view to support learning, sustainability and scaling-up. Further pursue action plans on M&E, learning and scaling up, with particular attention to countries with larger portfolios or higher rural poverty rates, or those with higher PAR scores.
Develop a procurement database/register to better track compliance of procurements undertaken by projects, and monitor delivery of contracts as approved.
Increase staff engagement in supervision. CPMs will lead key supervision missions: the first supervision mission, MTR and at least the last full supervision mission before PCR. CPMs or CPOs will also participate in and influence supervisions by co-operating institutions, and monitor the use of CI budgets.
Consider options for increasing supervision and implementation support resources, including drawing from in-house resources, in cases of project complexity, large project size and/or weak implementation performance.
Positioning IFAD as a preferred partner in pro-poor programming, capacity-building and policy-making
Renew APR's regional priorities with attention to IFAD engagement in value chains, PPPs, food security, partnership building and policy dialogue – aligning APR’s vision, capabilities and resources around a strategic action plan.
Strengthen knowledge management and communications by renewing APR's newsletter, investing in the Rural Poor briefs and other knowledge products, and mainstreaming IFADAsia. Capture and communicate lessons learned in key intervention areas by drawing on practical project experiences and field-tested case material.
Map thematic competencies and organizational functions of APR staff, with a view to developing thematic or geographic teams.
Improve planning processes with PTA, CFS and other divisions, ensuring collaborative arrangements that allow for timely and higher-level technical inputs.
Strengthen ICOs (and, where appropriate, establish sub-regional hubs, particularly where host country agreements are delayed).
Build capacities of IFAD staff in communication, policy dialogue and knowledge management.
Continue to build capacities of key partners through strategic use of grant resources, in close linkage with the investment programme.


Appendices
Table 1. List of Ongoing Investment Projects on 30 June
Table 2. List of Ongoing Grants Projects on 30 June
Table 3. PSR Ratings of Ongoing Projects
Table 4. GSR Ratings of Ongoing Grants
Table 5. Projects with Delays in Signing/Entry into force
Table 6.1. Disbursement Performance of Investment Projects
Table 6.2 Loans and DSF Grants with Disbursement Lag of 40 or more
Table 7.1. Relative Share of Co financiers in Ongoing Portfolio
Table 7. 2. Relative share of External co-financier in Ongoing Portfolio
Table 8.1. Projects Completed during Period under Review
Table 8.2. Project completion during next review period
Table 8.3. Grants Scheduled for completion or closure during 2013
Table 8.4. Grants granted an extension during the period under review
Table 9.1. Project Extensions during Period under Review
Table 9.2. Grants granted an extension during the period under review
Table 9.3. Project with Time Overrun of over 15%
Table 10. Action Plan for Improving Portfolio Performance


1
Table 1. List of Ongoing Investment Projects on 30 June
Current Portfolio for APR as at 30/6/2013 30-Jun-13
Status Country Project Board Loan Date Project Loan Approval Signing of Comp. Closing Date Date Effect. Date Date
Ongoing
Afghanistan 1460 Rural Microfinance and Livestock Support Programme 30/4/2009 7/7/2009 24/8/2009 30/9/2014 31/3/2015
Afghanistan 1637 Community Livestock and Agriculture Project 13/12/2012 8/4/2013 8/4/2013 30/6/2019 31/12/2019
Bangladesh 1165 Sunamganj Community-Based Resource Management Project 12/9/2001 14/11/2001 14/1/2003 31/3/2014 30/9/2014
Bangladesh 1322 Market Infrastructure Development Project in Charland Regions 13/12/2005 3/5/2006 22/9/2006 30/9/2013 31/3/2014
Bangladesh 1402 Finance for Enterprise Development and Employment Creation Project 12/9/2007 10/10/2007 8/1/2008 31/3/2014 30/9/2014
Bangladesh 1355 National Agricultural Technology Project 13/12/2007 22/1/2008 25/3/2008 31/12/2013 30/3/2014
Bangladesh 1466 Participatory Small-scale Water Resources Sector Project 15/9/2009 6/11/2009 6/11/2009 31/12/2017 30/6/2018
Bangladesh 1537 Char Development and Settlement Project IV 22/4/2010 9/5/2011 9/5/2011 30/6/2018 31/12/2018
Bangladesh 1585 Haor Infrastructure and Livelihood Improvement Project - Climate Adapation 15/9/2011 18/7/2012 18/7/2012 30/9/2020 31/3/2021 and Livelihood Protection
Bangladesh 1647 Coastal Climate Resilient Infrastructure Project 10/4/2013 28/6/2013 28/6/2013 30/6/2019 31/12/2019
Bhutan 1482 Market Access and Growth Intensification Project 15/12/2010 22/4/2011 22/4/2011 30/6/2015 31/12/2015
Cambodia 1350 Rural Livelihoods Improvement Project in Kratie, Preah Vihear and 18/4/2007 28/5/2007 31/8/2007 30/9/2014 31/3/2015 Ratanakiri Cambodia 1464 Tonle Sap Poverty Reduction and Smallholder Development Project 17/12/2009 15/2/2010 15/2/2010 31/8/2017 28/2/2018
Cambodia 1559 Project for Agricultural Development and Economic Empowerment 3/4/2012 8/6/2012 8/6/2012 30/6/2018 31/12/2018
China 1323 Xinjiang Uygur Autonomous Region Modular Rural Development 14/12/2006 13/2/2007 29/4/2008 30/6/2014 31/12/2014 Programme China 1400 Inner Mongolia Autonomous Region Rural Advancement Programme 13/12/2007 12/2/2008 12/11/2008 31/12/2014 30/6/2015
China 1454 Dabieshan Area Poverty Reduction Programme 17/12/2008 19/2/2009 19/8/2009 30/9/2015 31/3/2016
China 1555 Guangxi Integrated Agricultural Development Project 13/12/2011 20/1/2012 20/1/2012 31/3/2017 30/9/2017
China 1627 Hunan Agricultural and Rural Infrastructure Improvement Project 21/9/2012 21/9/2012 21/9/2012 30/9/2017 31/3/2018
China 1629 Yunnan Agricultural and Rural Improvement Project 13/12/2012 31/1/2013 31/1/2013 31/3/2018 30/9/2018
India 1040 North Eastern Region Community Resource Mngmnt Project for Upland Areas 29/4/1997 20/5/1997 23/2/1999 30/9/2016 31/3/2017
India 1155 Orissa Tribal Empowerment and Livelihoods Programme 23/4/2002 18/12/2002 15/7/2003 31/3/2014 30/9/2014
India 1348 Post-Tsunami Sustainable Livelihoods Programme for the Coastal 19/4/2005 11/11/2005 9/7/2007 31/3/2017 30/9/2017 Communities of Tamil Nadu
India 1314 Tejaswini Rural Women's Empowerment Programme 13/12/2005 12/10/2006 23/7/2007 30/9/2015 31/3/2016
India 1381 Women's Empowerment and Livelihoods Programme in the Mid-Gangetic 14/12/2006 11/12/2008 4/12/2009 31/12/2017 30/6/2018 Plains India 1418 Mitigating Poverty in Western Rajasthan Project 24/4/2008 17/10/2008 11/12/2008 31/12/2014 30/6/2015
India 1040 has approval, signing and effectiveness dates of 1st loan but completion/closing of top-up. 1

2
Status Country Project Board Loan Date Project Loan Approval Signing of Comp. Closing Date Date Effect. Date Date
India 1470 Convergence of Agricultural Interventions in Maharashtra's Distressed 30/4/2009 30/9/2009 4/12/2009 31/12/2017 30/6/2018 Districts Programme
India 1617 Integrated Livelihood Support Project 13/12/2011 1/2/2012 1/2/2012 31/3/2019 30/9/2019
Indonesia 1258 Rural Empowerment and Agricultural Development Programme in Central 2/12/2004 22/11/2006 18/11/2008 31/12/2014 30/6/2015 Sulawesi
Indonesia 1341 National Programme for Community Empowerment in Rural Areas Project 11/9/2008 18/11/2008 17/3/2009 31/3/2016 30/9/2016
Indonesia 1509 Smallholder Livelihood Development Project in Eastern Indonesia 11/5/2011 5/7/2011 5/7/2011 31/1/2019 31/7/2019
Indonesia 1621 Coastal Community Development Project 21/9/2012 23/10/2012 23/10/2012 31/12/2017 30/6/2018
Laos 1301 Rural Livelihoods Improvement Programme in Attapeu and Sayabouri 19/4/2005 13/10/2005 15/3/2006 31/3/2014 30/9/2014
Laos 1396 Northern Region Sustainable Livelihoods through Livestock Development 14/12/2006 29/1/2007 10/7/2007 30/9/2013 31/3/2014 Project Laos 1459 Sustainable Natural Resource Management and Productivity Enhancement 17/12/2008 18/2/2009 23/7/2009 30/9/2016 31/3/2017 Project
Laos 1608 Soum Son Seun Jai - Community-based Food Security and Economic 13/12/2011 22/12/2011 22/12/2011 31/12/2017 30/6/2018 Opportunities Programme
Maldives 1347 Post-Tsunami Agricultural and Fisheries Rehabilitation Programme 19/4/2005 25/9/2005 21/4/2006 31/12/2013 30/6/2014
Maldives 1377 Fisheries and Agricultural Diversification Programme 12/9/2007 2/4/2008 15/9/2009 30/9/2014 31/3/2015
Maldives 1624 Mariculture Enterprise Development Project 6/9/2012 9/1/2013 9/1/2013 31/3/2018 30/9/2018
Mongolia 1455 Project for Market and Pasture Management Development 11/5/2011 17/6/2011 26/8/2011 30/9/2016 31/3/2017
Nepal 1119 Western Uplands Poverty Alleviation Project 6/12/2001 5/2/2002 1/1/2003 15/7/2016 31/12/2016
Nepal 1285 Leasehold Forestry and Livestock Programme 2/12/2004 7/6/2005 7/9/2005 30/9/2014 31/3/2015
Nepal 1450 Poverty Alleviation Fund Project II 13/12/2007 8/5/2008 31/7/2008 30/6/2014 31/12/2014
Nepal 1471 High-Value Agriculture Project in Hill and Mountain Areas 17/12/2009 5/7/2010 5/7/2010 30/9/2017 31/3/2018
Nepal 1602 Kisankalagi Unnat Biu-Bijan Karyakram 21/9/2012 2/12/2012 2/12/2012 31/12/2019 30/6/2020
Pakistan 1413 Programme for Increasing Sustainable Microfinance 12/9/2007 22/11/2007 7/5/2008 30/9/2013 31/3/2014
Pakistan 1514 Southern Punjab Poverty Alleviation Project 15/12/2010 30/9/2011 30/9/2011 30/9/2016 31/3/2017
Pakistan 1515 Gwadar-Lasbela Livelihoods Support Project 11/5/2011 31/1/2013 31/1/2013 31/3/2019 30/9/2019
Papua New Guinea 1480 Productive Partnerships in Agriculture Project 22/4/2010 14/9/2010 14/9/2010 30/6/2016 31/12/2016
Philippines 1253 Rural Microenterprise Promotion Programme 19/4/2005 11/11/2005 31/10/2006 31/12/2013 30/6/2014
Philippines 1395 Second Cordillera Highland Agricultural Resource Management Project 24/4/2008 4/6/2008 14/11/2008 31/12/2015 30/6/2016
Philippines 1485 Rapid Food Production Enhancement Programme 17/12/2008 2/9/2009 9/11/2009 31/12/2016 30/6/2017
Philippines 1475 Integrated Natural Resources and Environmental Management Programme 13/12/2012 12/4/2013 12/4/2013 30/6/2020 31/12/2020
Solomon Islands 1565 Solomon Islands Rural Development Programme 15/12/2010 11/11/2011 11/11/2011 30/11/2013 30/6/2014
Sri Lanka 1346 Post Tsunami Coastal Rehabilitation and Resource Management 19/4/2005 1/12/2005 16/10/2006 30/9/2013 31/3/2014 Programme Sri Lanka 1316 Smallholder Plantations Entrepreneurship Development Programme 14/12/2006 8/5/2007 6/11/2007 31/12/2017 30/6/2018
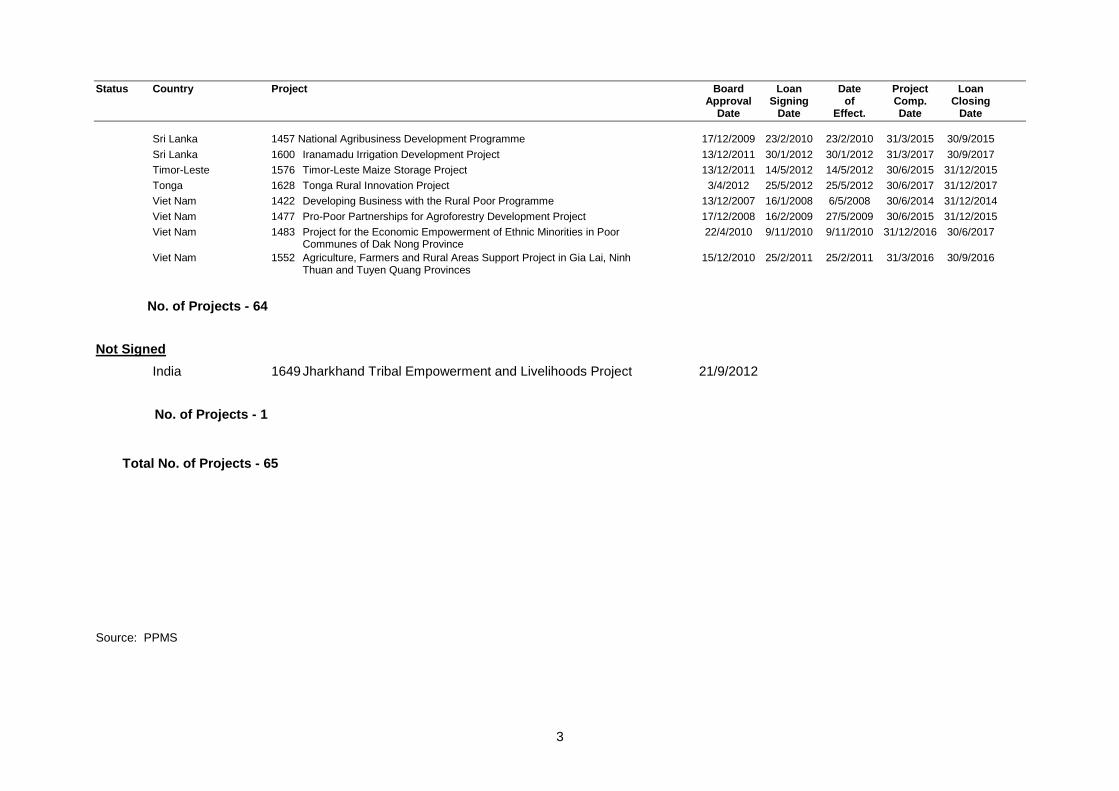
3
Status Country Project Board Loan Date Project Loan Approval Signing of Comp. Closing Date Date Effect. Date Date
Sri Lanka 1457 National Agribusiness Development Programme 17/12/2009 23/2/2010 23/2/2010 31/3/2015 30/9/2015
Sri Lanka 1600 Iranamadu Irrigation Development Project 13/12/2011 30/1/2012 30/1/2012 31/3/2017 30/9/2017
Timor-Leste 1576 Timor-Leste Maize Storage Project 13/12/2011 14/5/2012 14/5/2012 30/6/2015 31/12/2015
Tonga 1628 Tonga Rural Innovation Project 3/4/2012 25/5/2012 25/5/2012 30/6/2017 31/12/2017
Viet Nam 1422 Developing Business with the Rural Poor Programme 13/12/2007 16/1/2008 6/5/2008 30/6/2014 31/12/2014
Viet Nam 1477 Pro-Poor Partnerships for Agroforestry Development Project 17/12/2008 16/2/2009 27/5/2009 30/6/2015 31/12/2015
Viet Nam 1483 Project for the Economic Empowerment of Ethnic Minorities in Poor 22/4/2010 9/11/2010 9/11/2010 31/12/2016 30/6/2017 Communes of Dak Nong Province
Viet Nam 1552 Agriculture, Farmers and Rural Areas Support Project in Gia Lai, Ninh 15/12/2010 25/2/2011 25/2/2011 31/3/2016 30/9/2016 Thuan and Tuyen Quang Provinces
No. of Projects - 64
Not Signed
India 1649 Jharkhand Tribal Empowerment and Livelihoods Project 21/9/2012
No. of Projects - 1
Total No. of Projects - 65
Source: PPMS

4
Table 2. List of Ongoing Grants Projects on 30 June
Grant No.Implementing
AgencyProgramme
Approval
Effectiv.Completion and Closing
Grant Amount
(USD/IFAD)Cofinancing USD Countries
998A AITAsia and the Pacific Region Asian Project Management Support
(APMAS) programme
15/09/09
18/12/09
31/12/13 30/06/14 no
cost + bgt reallo1400000 400000 Cambodia, Lao PDR, India, Viet Nam
1108 IRRI
Enabling Poor Rice Farmers to improve Livelihoods and
Overcome Poverty in South and South-East Asia through the
Consortium for Unfavourable Rice Environments (CURE)30/04/2009
28/07/2009
30/09/2013
31/03/20141 500 000 1 250 000
Nepal, India, Philippines, Indonesia,
Vietnam, Laos, Cambodia (Myanmar and
Thailand will be covered by other donor
partners' grants)
1227 IRRI
Programme for Improving Livelihoods and Overcoming Poverty
in the Drought Prone Lowlands of South East Asia 07/10/2010
16/12/2010
31/12/2014
30/06/2015 1 200 000 320 000
Cambodia, Indonesia, Myanmar,
Philippines, Thailand
1239 CIPRoot and Tuber Crops Research & Dev Programme for Food
Security in the Asia and the Pacific Region
05/12/2010
22/03/2011
31/03/2015 30/09/2015
extension granted1 450 000 600 000
China, India, Indonesia, Philippines,
Bangladesh
1244 ESCAP
Leveraging pro-poor public private partnership for rural dev.-
widening access to energy services for rural poor in Asia and the
Pacific
05/12/2010
10/08/2011
30/09/2015
31/03/20161 350 000 580 000
Bangladesh, China, Indonesia, Lao PDR,
Nepal
1286 FAOPro-poor Policy Approaches to Address Risk and Vulnerability at
the Country Level
04/05/2011
13/02/2012
31/03/2016
30/09/20161 500 000 900 000 Cambodia, Laos, Nepal, Vietnam
1284Univ. of Kassel
WATERCOPE
Supporting National Research Capacity and Policy Development
to cope with dwingling water resources and intensifying land use
in the transborder Altay Dzungarian Region of Mongolia and
China
04/05/2011
29/07/2011
30/09/2015
31/03/20161 485 000 2 013 000 Mongolia and China
1304 PROCASURStrenghtening Knowledge Sharing on Innvative Solutions Using
the Learning Routes Methodology in Asia and the Pacific
29/08/2011
27/10/201131/12/2015 30/06/2016 1 000 000 400 000 Vietnam, Mongolia, Laos
1308 CIAT
Improved Forage-based Livestock Feeding Systems for
Smallholder Livelihoods in the Cambodia-Laos-Vietnam
Development Triangle
29/08/2011
16/09/2011
30/09/2015
31/03/20161 500 000 500 000 Cambodia, Laos, Vietnam
Large Regional APR

5
Grant No.Implementing
AgencyProgramme
Approval
Effectiv.Completion and Closing
Grant Amount
(USD/IFAD)Cofinancing USD Countries
1363 ICRISAT Sustainable Management of Crop-based Production System for
Raising Agricultural Productivity in Rainfed Areas
07/04/2012
07/05/201230/06/2016 31/12/2016 1 500 000 1 000 000 India, Laos, Nepal, Vietnam
1386Trustees of
Columbia Univ
Climate Risk Management in Agriculutre (Laos, Indonesia and
Bangladesh)
12/08/12
07/12/201231/12/2014 30/06/2015 700 000 140 000 Laos, Indonesia, Bangladesh
1396 SNVInclusive Business Models to Promote Sustainable
Smallholder Cassava Production (IBC)
14/10/2012
13/12/2012
30/06/2015
31/12/2015 no cost
extension
1 199 000 250 000 Laos, Cambodia, Vietnam
1403 APRACA
Enhancing the Access of Rural Poor to Sustainable Financial
Services through Policy Dialogue, Capacity Building and KS in
Rural Finance (CB, NP, Myam, BD?)
30/11/2012
21/01/201331/03/2016 30/09/2016 1 100 000 1 000 000 Cambodia, Nepal, Myanamar
Sub-total 13 16 884 000 9 353 000
1347 WOCANCapacity Building for Women's Leadership in Farmer Producer
Organisations in Asia and the Pacific Region
26/11/2011
22/12/2011 31/12/2014 30/09/2015 500 000 125 000
Laos, Maldives and Sri Lanka (links
Nepal, China, Philippines)
1421 SPCDevelopment and Pilot Implementation of Integrated Pacific
Island Organic/Ethical Trade Initiatives
17/12/2012
21/12/201231/12/2014 30/09/2015 500 000 120 000 Fiji, Kiribati
1433 IFPRI
Collaborative research and capacity strengthening for
monitoring and evaluation and impact assessment of
IFAD projects in India and Bhutan (10 projects in
India)
20/12/2012
08/03/201331/03/2016 30/09/2016 500 000 32 500 India and Bhutan
Sub-total 3 1 500 000 277 500
Large Regional APR
Small Regional APR

6
727 NP in-loan 646 NP Leasehold Forestry & Livestock Programme
02/12/2004
effective
07/09/2005
30/09/2013
31/03/20141 220 000 0 Nepal
781 LA in-loan 660-LARural Livelihoods Improvement Programme in Attapeu and
Sayabouri
19/04/2005
effective
15/03/2006
31/03/2014
30/09/2014 Reallocation of
loan and grant proceeds
Jan 09
690 000 0 Laos
997 VN in-loan 741 VN Developing Business with the Rural Poor Programme
13/12/2007
effective
06/05/2008
30/06/2014 31/12/2014 550 000 0 Vietnam
1029 IN in-loan 748 IN Mitigating Poverty in Western Rajasthan Project24/04/2008
11/12/200831/12/2014 30/06/2015 608 000 0 India
1030 PH in-loan 749 PHSecond Cordillera Highland Agricultural Resource Management
Project
24/04/2008
14/11/200831/12/2015 30/06/2016 561 000 0 Philippines
1106 IN
in-loan 779
Maharashtra State
Agricultural
Marketing Board
in-loan grant Convergence of Agricultural Interventions in
Maharashtra's Distressed Districts Programme
30/04/2009
04/12/200931/12/2017 30/06/2018 1 000 000 0 India
1114 BD IRRISupport to Agricultural Research for Climate Change Adaptation
in Bangladesh
30/04/2009
23/07/2009
30/09/2013
31/03/2014 no cost
extension
700 000 91 387 Bangladesh
835 ID in-loan MFSmallholder Livelihood Development Project in Maluku and
North Maluku
11/05/2011
05/07/201131/01/2019 31/07/2019 1 080 000 0 Indonesia
847 BD in-loan Haor Infrastructure and Livelihood Improvement Project15/09/2011
18/07/2012
30/09/2020
31/03/20211 000 000 0 Bangladesh
1388 in-loan 875 Hunan Agricultural and Rural Infrastructure Improvement Project21/09/2012
21/09/2012
30/09/2017
31/03/20181 000 000 0 China
Large Country APR

7
1392 in-loan 880 Coastal Community Development Project 21/09/2012
23/10/201231/12/2017 30/06/2018 2 000 000 305 000 Indonesia
1402 in-loanRaFPEP Rehabilitation of Key Agricultural Infrastructure
damaged by tropical storm Sendong
4/12/2012
APPROVED1 306 100 0 Philippines
1445 LGED Coastal Climate-Resilient Infrastructure Project10/04/2013
28/06/201330/06/2019 31/12/2019 1 000 000 0 Bangladesh
Sub-total 13 12 715 100 396 387
726 IDin-loan 645 ID Min
Agr
TA for Capacity Bldg Central Sulawesi--Loan (Rural
Empowerment and Agr. Development Programme in Central
Sulawesi)
02/12/2004
18/11/2008
effective
31/12/2014 30/06/2015
Amendment to the loan
Jan 09
500 000 0 Indonesia
782 PH in-loan 661 PH RuMEPP Grant - Rural micro-enterprise
19/04/2005
effective
31/10/2006
31/12/2013
30/06/2014500 000 0 Philippines
783 MV in-loan 663 MV Tsunami response
19/04/2005
effective
21/04/2006
31/12/2013 30/06/2014
2nocostext+reall200 000 0 Maldives
1053 IDin-loan
755 ID
IFAD Support to the National Programme for Community
Empowerement in Rural Areas
11/09/2008
17/03/200931/03/2016 30/09/2016 400 000 0 Indonesia
1200 VN
in-loan
PPC Dak Nong
Province
Project for the Sustainable Economic Empowerment of Ethnic
Minoritiies of Poor Communities in Dak Nong Province (3EM)
22/04/2010
09/11/201031/12/2016 30/06/2017 500 000
0
Vietnam
1214 CENESTAUsing Agricultural Biodiversity and Farmers' Knowledge to Adapt
Crops to Climate Change in Iran
19/08/2010
11/10/2010
31/12/2013
30/09/2014200 000
0
Iran
1257 PK DPAPSupport for Institution Building of the Diamer Poverty Alleviation
Programme
17/12/2010
22/12/201031/12/2013 30/09/2014 200 000
600 000
Pakistan
1271 CN IPRCCPromoting South South Cooperation with China in Poverty
Reduction through Knowledge Sharing
20/12/2010
24/05/201130/06/2014 31/03/2015 338 000
452 000
China
826 VN in-loan MAFin loan Agriculture, Farmers and Rural Areas Support Project
in Gia Lai, Ninh Thuan and Tuyen Quang Provinces
15/12/2010
25/02/201131/03/2016 30/09/2016 310 000
0
Vietnam
Large Country APR
Small Country APR

8
1400 Min Boder Affaris
Strenghtening capacity in the Dept of Rural Dev for preparation
of an evidence based rural dev strategy for rural poverty
reduction
26/11/2012 APPROVED 300 000 10 000 Myanmar
1430 PCDF Partnership in High Value Agriculture (PHVA)17/12/2012
21/12/201231/12/2014 30/09/2015 500 000 114 696 Fiji
1444 WFPTools for Strategy Dev on Food Security, Poverty
Reduction and Climate Change Adaptation
01/02/2013
11/02/201331/03/2015 30/09/2015 477 000 402 000 Bangladesh
Sub-total 12 4 425 000 1 578 696
TOTAL APR only 41 effective approved 35 524 100 11 605 583
Small Country APR

9
Table 3. PSR Ratings of Ongoing Projects
C.1 C.2 IP DO
Coun
try
Proj
ect
Id
Proj
ect
Nam
e
Effe
ctiv
enes
s da
te
IFA
D C
urre
nt F
inan
cing
(USD
'000
)
Tim
e le
ft f
or c
ompl
etio
n
(yea
rs)
Top-
up
Coop
erat
ing
Inst
itut
ion
Fina
ncia
l man
agem
ent
Dis
burs
emen
t ra
te
Coun
terp
art
fund
s
Loan
cov
enan
ts
Proc
urem
ent
Aud
its
Proj
ect
man
agem
ent
M&
E
AW
PB &
impl
emen
tati
on
Gen
der
Pove
rty
Targ
etin
g
Inno
vati
on &
lear
ning
Inst
itut
ion
build
ing
Empo
wer
men
t
Ben
efic
iary
par
tici
pati
on
Serv
ice
prov
ider
s
Exit
str
ateg
y
Scal
ing
up &
rep
licat
ion
Phys
ical
/fin
anci
al
asse
ts
Food
sec
urit
y
Impl
emen
tati
on
prog
ress
Dev
elop
men
t ob
ject
ives
Ris
k fa
ctor
s
Ris
k fl
ags
aver
age
Proj
ect
stat
us 2
012/
2013
Afghanis tan 1460 RMLSP 24 Aug 09 23 895 1.3 IFAD 3 4 5 3 5 3 5 4 4 4 5 4 4 4 5 4 4 3 5 4 4 5 4 2 4.2 NAR
Bangladesh 1165 SCBRMP 14 Jan 03 21 973 0.8 IFAD 5 5 6 5 5 5 6 5 5 6 5 5 6 5 5 5 5 5 5 5 5 5 5 0 5.3 NAR
Bangladesh 1322 MIDPCR 22 Sep 06 24 947 0.3 IFAD 5 4 5 5 5 5 5 6 5 6 6 6 6 5 5 5 5 5 6 5 4 6 6 0 5.2 NAR
Bangladesh 1402 FEDEC 08 Feb 08 35 031 0.8 IFAD 5 5 5 5 5 5 5 5 5 5 5 5 5 6 5 5 5 5 5 5 5 5 6 0 5.0 NAR
Bangladesh 1355 NATP (LOT) 25 Mar 08 19 450 0.5 WB 4 4 5 5 4 4 4 5 5 5 5 5 5 5 4 5 5 4 4 4 4 4 5 0 4.6 NAR
Bangladesh 1466 PSSWRSP 06 Nov 09 32 000 4.5 ○ AsDB 4 2 4 4 4 4 4 4 4 4 4 4 4 4 4 4 4 4 4 4 4 4 4 1 3.8 NAR
Bangladesh 1537 CDSP IV 09 May 11 47 300 5.0 IFAD 3 4 4 5 4 4 5 4 4 5 5 5 4 5 5 5 4 4 5 4 4 4 4 0 4.5 NAR
Bangladesh 1585 HILIP - CALIP (LOT) 18 Jul 12 56 093 7.3 IFAD 4 3 4 4 4 4 3 4 3 4 4 4 4 4 4 4 4 4 4 4 4 4 4 2 3.8 NAR
Bhutan 1482 MAGIP 22 Apr 11 8 490 2.0 IFAD 4 4 4 4 4 4 4 3 3 4 4 5 5 4 4 5 5 3 6 4 4 4 4 1 4.1 NAR
Cambodia 1350 RULIP 31 Aug 07 12 014 1.3 ○ IFAD 4 4 3 5 4 4 4 4 4 5 5 5 4 4 4 5 4 4 4 4 4 4 4 1 4.3 NAR
Cambodia 1464 TSPRSDP 25 Feb 10 13 380 4.2 AsDB 4 1 5 4 4 4 3 2 3 2 3 4 2 3 3 3 3 2 3 2 2 3 3 7 3.1 APP
Cambodia 1559 PADEE 08 Jun 12 35 000 5.0 IFAD 4 5 4 4 4 4 4 4 4 4 4 4 4 4 4 4 4 4 4 4 4 4 4 0 4.1 NAR
China 1323 MRDP - XUAR 29 Apr 08 25 148 1.0 IFAD 4 5 5 5 5 4 4 4 4 5 5 5 5 5 4 4 5 5 5 5 5 5 5 0 4.6 NAR
China 1400 IMARRAP 12 Nov 08 30 001 1.5 IFAD 4 4 3 5 4 5 4 4 4 4 4 5 4 4 4 4 4 3 4 4 4 4 4 1 4.1 NAR
China 1454 DAPRP 19 Aug 09 31 875 2.3 IFAD 3 3 3 3 4 4 3 3 4 5 4 4 3 4 4 4 4 3 3 4 4 4 4 5 3.6 PPP
China 1555 GIADP 20 Jan 12 47 000 3.8 IFAD 5 4 5 5 5 4 5 3 4 5 5 5 4 5 5 4 5 5 5 5 5 4 4 1 4.5 NAR
China 1627 HARIIP 21 Sep 12 47 000 4.3 IFAD 4 1 4 4 4 4 4 4 4 4 4 4 4 4 4 4 4 4 4 4 4 4 4 1 3.7 NAR
India 1040 NERCORMP II 23 Feb 99 42 900 3.3 ○ IFAD 4 4 6 5 4 4 5 5 5 5 5 5 4 4 5 4 4 4 5 5 4 5 4 0 4.6 NAR
India 1155 OTELP 15 Jul 03 19 996 0.8 IFAD 4 4 6 5 4 4 4 4 5 5 5 4 5 5 5 5 4 6 6 5 5 5 5 0 4.5 NAR
India 1348 PT-Tami l Nadu 09 Jul 07 29 916 3.8 ○ IFAD 3 3 6 4 3 3 4 3 2 4 5 5 3 4 5 4 4 4 4 4 4 4 4 4 3.9 NAR
India 1314 TWEP 23 Jul 07 39 448 2.3 IFAD 3 3 5 4 4 3 4 4 4 5 5 5 3 3 4 4 4 3 4 3 4 4 4 2 4.1 NAR
India 1381 Mid-Gangetic Pl . 04 Dec 09 30 169 4.5 IFAD 3 2 4 4 4 3 4 3 3 3 5 5 3 4 5 4 3 4 3 4 4 3 4 5 3.5 APP
India 1418 MPOWER 11 Dec 08 30 969 1.5 IFAD 3 2 5 4 4 3 3 2 2 3 3 3 3 3 3 3 3 2 2 2 2 3 2 8 3.2 APP
India 1470 C-AIM 04 Dec 09 41 109 4.5 IFAD 4 2 5 4 4 5 4 4 2 5 4 4 3 4 4 4 4 4 4 4 4 4 4 1 4.1 NAR
India 1617 IULSP 01 Feb 12 89 910 5.8 IFAD 4 1 4 4 4 4 4 4 4 4 4 4 4 4 4 4 4 4 4 4 4 4 4 1 3.7 NAR
Indones ia 1258 READ 18 Nov 08 21 582 1.5 IFAD 4 5 4 4 3 4 4 4 4 4 4 4 3 4 4 4 4 3 5 4 4 4 4 1 4.0 NAR
Indones ia 1341 PNPM 17 Mar 09 68 530 2.8 WB 3 6 5 4 4 4 4 3 4 5 5 4 4 4 4 4 3 4 4 4 4 4 4 2 4.3 NAR
Indones ia 1509 SOLID 05 Jul 11 50 190 5.6 IFAD 4 3 5 4 3 4 3 3 4 5 5 5 4 3 4 4 4 4 4 4 4 4 4 4 3.9 NAR
Indones ia 1621 CCDP 23 Oct 12 26 200 4.5 IFAD 4 4 4 4 4 4 4 4 4 4 4 4 4 4 4 4 4 4 4 4 4 4 4 0 4.0 NAR
B.3: Susta inabi l i tyProject data B.1: Fiduciary aspects B.2: Pr. implement. progressO
ngoi
ng (
> 6
mon
ths
)

10
C.1 C.2 IP DO
Coun
try
Proj
ect
Id
Proj
ect
Nam
e
Effe
ctiv
enes
s da
te
IFA
D C
urre
nt F
inan
cing
(USD
'000
)
Tim
e le
ft f
or c
ompl
etio
n
(yea
rs)
Top-
up
Coop
erat
ing
Inst
itut
ion
Fina
ncia
l man
agem
ent
Dis
burs
emen
t ra
te
Coun
terp
art
fund
s
Loan
cov
enan
ts
Proc
urem
ent
Aud
its
Proj
ect
man
agem
ent
M&
E
AW
PB &
impl
emen
tati
on
Gen
der
Pove
rty
Targ
etin
g
Inno
vati
on &
lear
ning
Inst
itut
ion
build
ing
Empo
wer
men
t
Ben
efic
iary
par
tici
pati
on
Serv
ice
prov
ider
s
Exit
str
ateg
y
Scal
ing
up &
rep
licat
ion
Phys
ical
/fin
anci
al
asse
ts
Food
sec
urit
y
Impl
emen
tati
on
prog
ress
Dev
elop
men
t ob
ject
ives
Ris
k fa
ctor
s
Ris
k fl
ags
aver
age
Proj
ect
stat
us 2
012/
2013
Laos 1301 RLIP 15 Mar 06 20 491 0.8 IFAD 4 5 6 5 4 4 4 3 4 4 4 4 4 4 3 4 4 4 3 5 5 4 4 1 4.3 NAR
Laos 1396 NRSLLDP 10 Jul 07 2 994 0.3 AsDB 5 3 4 4 4 4 4 4 4 5 5 4 4 4 4 5 3 3 4 4 4 4 4 2 4.1 NAR
Laos 1459 SNRMP 23 Jul 09 15 000 3.3 AsDB 4 4 4 4 4 4 4 4 4 4 3 3 4 4 4 4 3 3 4 4 4 3 4 2 3.8 APP
Laos 1608 SSSJ-CFSEOP 22 Dec 11 13 963 4.5 IFAD 4 3 4 4 4 4 4 4 3 3 5 4 4 4 3 4 3 4 4 4 4 4 4 3 3.8 NAR
Maldives 1347 PT-AFReP 21 Apr 06 4 296 0.5 ○ IFAD 5 3 5 5 4 4 5 3 4 3 4 4 4 4 4 5 4 4 5 4 3 4 4 3 4.1 NAR
Maldives 1377 FADiP 15 Sep 09 3 505 1.3 IFAD 4 2 3 4 4 4 4 3 3 4 4 3 3 4 4 3 3 4 5 2 3 4 4 5 3.5 PPP
Mongol ia 1455 PMPMD 26 Aug 11 11 479 3.3 IFAD 4 4 4 4 4 4 5 4 3 5 5 5 4 5 4 4 4 4 4 4 4 4 4 0 4.3 NAR
Nepal 1119 WUPAP 01 Jan 03 20 487 3.0 IFAD 2 3 3 2 4 4 3 4 3 4 4 4 4 4 5 4 4 4 5 4 3 3 3 4 3.5 APP
Nepal 1285 LFLP 07 Sep 05 14 708 1.3 ○ IFAD 3 4 4 4 2 4 4 5 4 4 5 5 5 5 5 5 4 4 5 4 4 4 5 1 4.1 NAR
Nepal 1450 PAF II 31 Jul 08 14 000 1.0 ○ WB 5 4 4 4 4 3 5 4 5 5 6 5 4 4 5 5 5 4 4 5 5 5 4 1 4.5 NAR
Nepal 1471 HVAP 05 Jul 10 15 282 4.3 IFAD 5 3 3 4 4 4 3 5 3 4 4 4 4 3 4 3 4 4 4 3 3 4 4 4 3.7 NAR
Nepal 1602 Biu-Bi jan 02 Dec 12 39 000 6.5 IFAD 4 3 3 4 4 4 4 4 4 4 4 4 4 4 4 4 4 4 4 4 4 4 4 2 3.8 NAR
Pakis tan 1413 PRISM 07 May 08 35 006 0.3 IFAD 5 3 6 5 5 5 6 5 5 6 4 5 5 5 4 5 5 5 5 5 4 5 5 1 5.0 NAR
Pakis tan 1514 SPPAP 30 Sep 11 40 169 3.3 IFAD 4 1 4 3 4 4 4 4 3 4 4 4 4 3 4 4 4 3 4 3 4 3 3 2 3.6 APP
PNG 1480 PPAP 14 Sep 10 13 973 3.0 WB 4 3 5 4 5 3 5 4 4 4 4 4 4 4 4 5 5 4 5 4 4 4 5 2 4.3 NAR
Phi l ippines 1253 RuMePP 31 Oct 06 19 130 0.5 IFAD 5 5 6 3 4 4 5 4 5 6 5 5 5 4 5 5 5 4 5 5 4 5 5 1 4.7 NAR
Phi l ippines 1395 CHARM II 14 Nov 08 27 120 2.5 IFAD 4 2 1 4 3 5 2 4 4 6 4 4 3 3 4 4 3 2 3 3 2 2 2 5 3.5 APP
Phi l ippines 1485 RaFPEP 09 Nov 09 19 565 3.5 ○ IFAD 4 5 4 4 4 3 4 4 4 5 5 4 4 4 4 4 4 3 3 4 5 5 4 1 4.2 NAR
Solomon Is . 1565 RDP 11 Nov 11 3 996 0.4 WB 4 4 4 4 5 4 4 4 3 4 4 4 5 4 4 4 4 3 4 4 4 4 4 0 4.1 NAR
Sri Lanka 1346 PT-CRReMP 16 Oct 06 29 877 0.3 ○ IFAD 4 4 5 5 4 3 4 4 6 6 5 5 5 4 5 5 5 4 5 5 5 5 5 1 4.5 NAR
Sri Lanka 1316 SPEnDP 06 Nov 07 22 548 4.5 IFAD 3 3 3 4 3 3 4 3 4 4 4 3 4 3 3 4 4 4 5 5 4 4 4 5 3.5 PPP
Sri Lanka 1457 NADeP 23 Feb 10 25 000 1.8 IFAD 2 2 3 4 3 3 2 2 2 3 4 4 4 4 4 4 4 4 4 4 4 2 3 7 3.1 APP
Sri Lanka 1600 IIDP 30 Jan 12 22 231 3.8 IFAD 4 2 4 4 4 4 4 5 4 4 4 4 4 4 4 4 4 4 4 4 4 4 4 1 3.9 NAR
Timor-Leste 1576 TLMSP 14 May 12 4 945 2.0 IFAD 4 4 4 4 3 4 4 5 4 4 5 4 4 4 4 5 4 4 4 4 4 4 4 1 4.2 NAR
Tonga 1628 TRIP 25 May 12 3 000 4.0 IFAD 3 4 2 4 4 4 4 3 4 4 4 4 4 4 4 4 4 4 4 4 4 4 4 2 3.7 NAR
Viet Nam 1422 DBRP 06 May 08 35 550 1.0 IFAD 4 4 5 5 5 5 5 5 5 5 4 4 4 4 5 5 4 4 4 4 4 5 5 0 4.7 NAR
Viet Nam 1477 3PAD 27 May 09 21 000 2.0 IFAD 5 4 3 5 4 5 4 3 4 5 4 4 4 4 4 4 4 2 5 4 4 5 5 2 4.1 NAR
Viet Nam 1483 3EM 09 Nov 10 19 810 3.5 IFAD 4 2 4 4 4 4 3 4 3 4 4 5 4 3 4 3 3 4 4 4 4 4 3 4 3.5 APP
Viet Nam 1552 TNSP 25 Feb 11 48 349 2.8 IFAD 4 3 4 4 4 4 4 4 4 4 3 3 3 4 4 3 3 4 4 4 4 4 4 4 3.6 NAR
B.3: Susta inabi l i tyProject data B.1: Fiduciary aspects B.2: Pr. implement. progress
Ong
oing
(>
6 m
onth
s )

11
C.1 C.2 IP DO
Coun
try
Proj
ect
Id
Proj
ect
Nam
e
Effe
ctiv
enes
s da
te
IFA
D C
urre
nt F
inan
cing
(USD
'000
)
Tim
e le
ft f
or c
ompl
etio
n
(yea
rs)
Top-
up
Coop
erat
ing
Inst
itut
ion
Fina
ncia
l man
agem
ent
Dis
burs
emen
t ra
te
Coun
terp
art
fund
s
Loan
cov
enan
ts
Proc
urem
ent
Au
dits
Proj
ect
man
agem
ent
M&
E
AW
PB &
impl
emen
tati
on
Gen
der
Pove
rty
Targ
etin
g
Inno
vati
on &
lear
ning
Inst
itut
ion
build
ing
Empo
wer
men
t
Ben
efic
iary
par
tici
pati
on
Serv
ice
prov
ider
s
Exit
str
ateg
y
Scal
ing
up &
rep
licat
ion
Phys
ical
/fin
anci
al
asse
ts
Food
sec
urit
y
Impl
emen
tati
on
prog
ress
Dev
elop
men
t ob
ject
ives
Ris
k fa
ctor
s
Ris
k fl
ags
aver
age
Proj
ect
stat
us 2
012/
2013
China 1271 SGPRP 22 Aug 06 29 254 -0.7 IFAD 5 5 6 6 5 4 6 5 6 6 6 6 5 5 5 6 5 5 6 5 6 6 6 0 5.5 NAR
China 1478 SPEAR 30 Sep 09 30 470 -0.7 IFAD 4 4 5 5 5 5 5 4 5 5 5 5 5 5 4 5 5 5 5 5 5 5 5 0 4.8 NAR
India 1226 LIPH 01 Oct 04 39 920 -0.5 IFAD 3 4 5 4 4 4 4 3 3 5 4 3 4 3 4 4 4 4 5 4 5 4 4 1 4.1 NAR
Pakis tan 1245 AJK 02 Sep 04 21 766 -0.7 IFAD 4 3 5 4 4 4 4 3 4 5 4 4 3 4 4 4 3 4 3 4 4 4 4 3 3.9 NAR
Sri Lanka 1254 Dry Zone 22 Dec 05 22 311 -0.2 WB 5 4 5 5 4 4 5 5 5 4 3 3 4 4 4 5 5 4 5 5 5 5 5 1 4.5 NAR
Total PSRS 63 Avg. 2.4 9 Avg. 4.0 3.4 4.3 4.2 4.0 4.0 4.1 3.9 3.9 4.5 4.4 4.3 4.0 4.1 4.2 4.3 4.0 3.9 4.3 4.1 4.1 4.1 4.2 1.9 4.1
2011/2012 Avg.3.8 3.5 4.4 4.1 3.9 4.0 4.0 3.5 3.8 4.3 4.2 4.1 4.0 3.9 4.1 4.1 3.9 3.7 4.2 4.1 4.1 4.0 4.0 2.5 4.0
3.7 3.4 4.4 4.1 3.9 4.0 3.9 3.6 3.7 4.1 4.1 4.0 3.9 3.9 4.0 4.0 3.9 3.7 4.1 4.0 4.0 3.9 3.9 2.7
*including Pakistan - 1494 CM SP (cancelled pro ject)
B.3: Susta inabi l i ty
3.9 3.9 3.9
Com
plet
ed
2010/2011
Project data B.1: Fiduciary aspects B.2: Pr. implement. progress
4.0
4.0 4.2 4.1 4.1
4.0 4.0 4.0 4.1
0
10
20
30
40
50
60
70
2010/11 2011/12 2012/13
3744
51
4
43
1512*
9
Nb
. Of
PSR
s
Project status
Not at Risk Potential Actual Problem
6360*56

12
Table 4. GSR Ratings of Ongoing Grants
Section B: Grant management performance
Country
Receipient
Institution LGS No. Grant
Grant recipient
performance
Coherence
btwn APW&B
and
implementn Disb
Financial
reports
Technical
reports
Relevance
Target Grp
Gender
Focus
Env and
Climate
Focus Innovation
KS and
KM
Linkages
Loans
Scalin
up
Implmntn
progress Superv
Asia-Pacific
APRACA 1403
Enhancing the Access of Poor Rural
Peoplt to Sustainable Financial Services
through Policy Dialogue, Capacity-
Building and Knowledge Sharing in Rural
Finance
NA NA 5 NA NA NA NA NA NA NA NA NA NA
Mekong sub-reg
FAO 902
Enhancing Agr Competitiveness of Rural
HHs in the Greater Mekong Sub-region5 5 5 3 4 4 4 3 5 4 3 3 4
Cambodia, Laos, India
Vietnam AIT 998A
Asian Project Management Support
Programme3 5 4 4 4 5 6 NA 5 5 6 4 4 Dec-12
Vietnam, Cambodia, Laos
CIAT 1031
Programme for Linking Smallholder
Livelihoods of Poor Smallholder Farmers
to Emerging Environmentally Progressive
Agro-industrial Markets.
5 5 4 3 3 5 5 6 6 5 6 6 5
Nepal, India, Indonesia,
Philippines, Vietnam,
China, Mongolia ICRAF 1032
Programme on Rewards for Use of and
Shared Investment in Pro-poor
Environmental Services
5 5 5 5 5 5 5 5 5 6 5 5 5 Sep-12
India, Nepal, Sri Lanka,
Cambodia, Indonesia,
Laos, Myanmar,
Philippines, Vietnam, ChinaFAO 1034
Medium Term Cooperation Programme
with Farmers Orgs in the Asia and the
Pacific Region: SouthEast sub-
programme
5 5 5 5 4 5 5 NA 5 4 5 5 5 Dec-12
Nepal, India, Philippines,
Indonesia, Vietnam, Laos,
Cambodia
IRRI 1108
Enabling Poor Rice Farmers to Improve
Livelihoods and Overcome Poverty in
South and South East Asia through the
Consortium for Unfavourable Rice
Environments
6 6 5 4 5 5 5 5 6 5 5 6 6
Bhutan, India, Nepal
ICIMOD 1113
Livelihoods and Ecosystem Services in
the Himalayas: Enhancing Adaptation
Capacity and Resilience of the Poor to
Climate and Socioeconomic Changes
5 5 5 5 5 5 4 5 5 5 5 5 5 Sep-12
Cook Islands, Fiji, Kiribati,
Marshall Isls, Niue, PNG,
Samoa, Solomon Isls,
TongaFAO 1180
Food Security and Sustainable
Livelihoods Programme in the Pacific1 1 1 3 1 1 1 1 1 1 1 1 1 Dec-12
SecC: Progress
targeting, inclusion,
innovation
SecD: Impl
assessment

13
Section B: Grant management performance
Country
Receipient
Institution LGS No. Grant
Grant recipient
performance
Coherence
btwn APW&B
and
implementn Disb
Financial
reports
Technical
reports
Relevance
Target Grp
Gender
Focus
Env and
Climate
Focus Innovation
KS and
KM
Linkages
Loans
Scalin
up
Implmntn
progress Superv
Cambodia, Indonesia,
Myanmar, Philippines,
ThailandIRRI 1227
Programme for Improving Livelihoods and
Overcoming Poverty in the Drought-prone
lowlands of South East Asia5 5 5 5 5 5 5 5 5 5 4 5 5 Apr-13
Bangladesh, China, India,
Indonesia, Philippines
CIP 1239
Root and Tuber Crops Research and Dev
Programme for Food Security in Asia
and the Pacific Region
5 5 5 5 5 5 5 5 5 5 5 5 5 Aug-12
Bangladesh, China,
Indonesia, Laos, Nepal
ESCAP 1244
Leveraging Pro-poor Public Private
Partnerships for Rural Dev - Widening
Access to Energy Services for Rural
Poor in Asia and the Pacific
4 4 4 5 5 4 4 4 4 4 4 4 4
Cambodia, Laos, Nepal, Vt
FAO 1286
Pro-poor Policy Approaches to Address
Risk and Vulnerability at the Country
Level
3 3 5 5 NA NA NA NA NA NA 4 NA 3
Mongolia, China
Watercope 1284
Supporting Naitonal Research Capacity
and Policy Dev to cope with dwindling
water resources and intensifying land
use in the transborder Altay-Dzungarian
region of Mongolia and China
3 4 5 5 5 5 4 4 4 4 4 4 4
Cambodia, China, Laos,
VT, India
PROCASUR 1304
Strenghtening KS on Innovative Solutions
using the Learning Routes Methodology
in Asia and the Pacific
5 5 5 5 5 5 5 4 5 5 4 4 5
Cambodia, Laos, VT
CIAT 1308
Improved Forage-based Livestock
Feeding Systems for Smallholder
Livelihoods in the Cambodia-Laos-VT Dev
Triangle
5 4 5 4 4 4 4 4 4 5 4 4 4
Indonesia, Laos, BD Trustee of
Columbia
Univ 1386
Climate risk management in Agriculture
with demonstrations sites in Indonesia,
Laos and Bangladesh
4 NA NA NA NA 4 4 4 4 NA 4 4 4
India, Laos, Nepal, VT
ICRISAT 1363
Sustainable Management of Crop-based
Production Systems for Raising
Agricultural Productivity in Rainfed Asia
5 5 5 NA NA 5 4 5 5 5 5 NA 5
Laos, Cambodia, VT
SNV 1396
Inclusive Business Models to Promote
Sustainable Smallholder Cassava
Production (IBC)
5 5 5 NA NA 5 4 4 4 4 5 5 5
Bangladesh
IRRI 1114
Support to Agric Research for Climate
Change Adaptation (SARCCAB) in
Bangladesh5 5 4 4 5 5 3 3 4 4 5 5 5
84 82.00 87.00 70.00 65.00 82.00 77.00 67.00 82.00 76.00 84.00 75.00 84.00
4.2 4 4.3 3.5 3.2 4.1 3.8 3.3 4.1 3.8 4.2 3.7 4.2
SecC: Progress
targeting, inclusion,
innovation
SecD: Impl
assessment
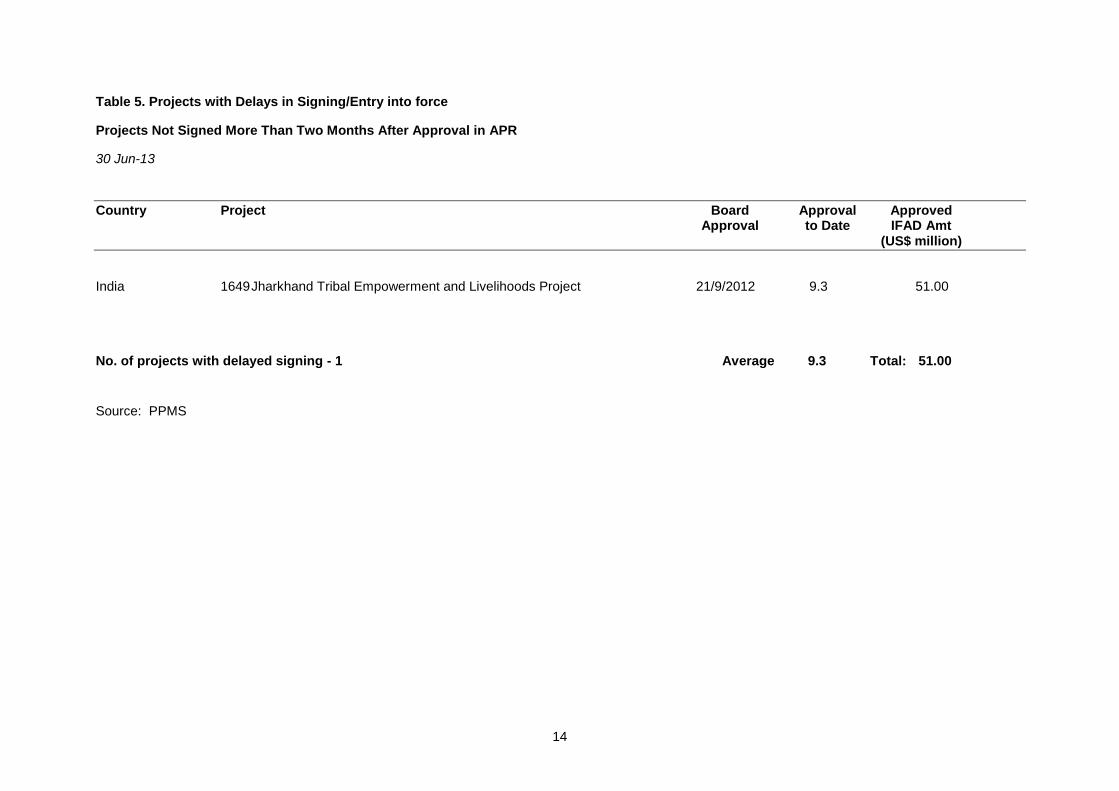
14
Table 5. Projects with Delays in Signing/Entry into force
Projects Not Signed More Than Two Months After Approval in APR
30 Jun-13
Country Project Board Approval Approved Approval to Date IFAD Amt (US$ million)
India 1649 Jharkhand Tribal Empowerment and Livelihoods Project 21/9/2012 9.3 51.00
No. of projects with delayed signing - 1 Average 9.3 Total: 51.00
Source: PPMS

15
Table 6.1 Disbursement Performance of Investment Projects
APR Region - Disbursement Performance of Loans and DSF Grants
as at 30 Jun 2013
08-Jul-13
Reg. Country Loan /DSF Grant No. Project Name Effect. Date
Loan amt (SDR m)
Disb. 30/6/13 (SDR m)
% Disb.
Expected Disb (SDR m)
Expected % Disb
Disb. Lag
APR Afghanistan 8033 Rural Microfinance and Livestock Support Programme 24/08/2009 16.00 10.72 67% 6.01 38% -78%
APR Afghanistan 8112 Community Livestock and Agriculture Project 08/04/2013 37.65 0.00 0% 0.38 1% 100%
APR Bangladesh 567 Sunamganj Community-Based Resource Management Project 14/01/2003 17.55 16.70 95% 16.56 94% -1%
APR Bangladesh 681 Market Infrastructure Development Project in Charland Regions 22/09/2006 17.55 16.24 93% 13.18 75% -23%
APR Bangladesh 725 Finance for Enterprise Development and Employment Creation Project 08/01/2008 23.15 22.32 96% 13.03 56% -71%
APR Bangladesh 739 National Agricultural Technology Project 25/03/2008 12.30 8.58 70% 6.92 56% -24%
APR Bangladesh 786 Participatory Small-scale Water Resources Sector Project 06/11/2009 14.16 1.31 9% 4.90 35% 73%
APR Bangladesh 807 Char Development and Settlement Project IV 09/05/2011 30.86 5.40 17% 4.76 15% -14%
APR Bangladesh 808 Participatory Small-scale Water Resources Sector Project 18/10/2010 6.53 0.63 10% 1.37 21% 54%
APR Bangladesh 847 Haor Infrastructure and Livelihood Improvement Project - Climate Adaptation and Livelihood Protection 18/07/2012 34.45 1.22 4% 2.02 6% 40%
APR Bangladesh 896 Coastal Climate Resilient Infrastructure Project 28/06/2013 26.10 0.00 0% 0.26 1% 100%
APR Bhutan 659 Agriculture, Marketing and Enterprise Promotion Programme 14/06/2006 9.25 9.23 100% 7.24 78% -28%
APR Bhutan 824 Market Access and Growth Intensification Project 22/04/2011 5.60 2.42 43% 0.86 15% -181%
APR Cambodia 793 Tonle Sap Poverty Reduction and Smallholder Development Project 15/02/2010 4.25 0.07 2% 1.32 31% 94%
APR Cambodia 8005 Rural Livelihoods Improvement Project in Kratie, 31/08/2007 6.40 6.40 100% 4.03 63% -59%
Reg. Country Loan /DSF Grant No. Project Name Effect. Date
Loan amt (SDR m)
Disb. 30/6/13 (SDR m)
% Disb.
Expected Disb (SDR m)
Expected % Disb
Disb. Lag
APR Cambodia 8005 Rural Livelihoods Improvement Project in Kratie, Preah Vihear and 08/06/2012 0.85 0.07 8% 0.06 7% -17%
APR Cambodia 8048 Tonle Sap Poverty Reduction and Smallholder Development Project 15/02/2010 4.25 0.07 2% 1.32 31% 94%

16
APR Cambodia 8101 Project for Agricultural Development and Economic Empowerment 08/06/2012 11.30 2.41 21% 0.83 7% -190%
APR Cambodia 862 Rural Livelihoods Improvement Project in Kratie, Preah Vihear and 08/06/2012 0.85 0.07 8% 0.06 7% -17%
APR Cambodia 870 Project for Agricultural Development and Economic Empowerment 08/06/2012 11.30 0.96 8% 0.83 7% -15%
APR China 673 South Gansu Poverty-Reduction Programme 22/08/2006 20.15 20.15 100% 15.14 75% -33%
APR China 709 Xinjiang Uygur Autonomous Region Modular Rural Development 29/04/2008 16.70 11.83 71% 8.89 53% -33%
APR China 740 Inner Mongolia Autonomous Region Rural Advancement Programme 12/11/2008 19.10 15.15 79% 9.12 48% -66%
APR China 766 Dabieshan Area Poverty Reduction Programme 19/08/2009 21.44 9.42 44% 8.06 38% -17%
APR China 778 Sichuan Post-Earthquake Agriculture Rehabilitation Project 30/09/2009 19.40 19.40 100% 7.29 38% -166%
APR China 855 Guangxi Integrated Agricultural Development Project 20/01/2012 29.65 5.26 18% 2.65 9% -99%
APR China 875 Hunan Agricultural and Rural Infrastructure Improvement Project 21/09/2012 30.25 0.00 0% 1.82 6% 100%
APR China 885 Yunnan Agricultural and Rural Improvement Project 31/01/2013 30.45 0.00 0% 0.61 2% 100%
APR India 585 Orissa Tribal Empowerment and Livelihoods Programme 15/07/2003 16.05 15.68 98% 15.06 94% -4%
APR India 624 Livelihoods Improvement Project in the Himalayas 01/10/2004 27.90 22.64 81% 24.88 89% 9%
APR India 662 Post-Tsunami Sustainable Livelihoods Programme for the Coastal Communities of Tamil Nadu 09/07/2007 9.95 8.36 84% 6.25 63% -34%
APR India 682 Tejaswini Rural Women's Empowerment Programme 23/07/2007 27.75 14.96 54% 17.44 63% 14%
APR India 691 Post-Tsunami Sustainable Livelihoods Programme for the Coastal Communities of Tamil Nadu 19/01/2009 10.40 0.00 0% 4.58 44% 100%
APR India 710 Women's Empowerment and Livelihoods Programme in the Mid-Gangetic Plains 04/12/2009 20.40 2.02 10% 7.05 35% 71%
Reg. Country Loan /DSF Grant No. Project Name Effect. Date
Loan amt (SDR m)
Disb. 30/6/13 (SDR m)
% Disb.
Expected Disb (SDR m)
Expected % Disb
Disb. Lag
APR India 748 Mitigating Poverty in Western Rajasthan Project 11/12/2008 18.46 3.86 21% 8.82 48% 56%
APR India 779 Convergence of Agricultural Interventions in Maharashtra's Distressed Districts Programme 04/12/2009 26.82 2.38 9% 9.27 35% 74%
APR India 794 North Eastern Region Community Resource Management Project for Upland Areas 12/07/2010 12.60 4.87 39% 3.02 24% -61%
APR India 856 Integrated Livelihood Support Project 01/02/2012 56.70 0.00 0% 5.10 9% 100%
APR Indonesia 645 Rural Empowerment and Agricultural Development Programme in Central Sulawesi 18/11/2008 14.30 11.47 80% 6.83 48% -68%
APR Indonesia 755 National Programme for Community Empowerment in Rural Areas Project 17/03/2009 42.03 30.75 73% 18.70 44% -64%
APR Indonesia 835 Smallholder Livelihood Development Project in Eastern Indonesia 05/07/2011 30.30 3.97 13% 3.90 13% -2%
APR Indonesia 880 Coastal Community Development Project 23/10/2012 15.87 1.77 11% 0.71 4% -150%

17
APR Laos 660 Rural Livelihoods Improvement Programme in Attapeu and Sayabouri 15/03/2006 11.30 10.51 93% 9.06 80% -16%
APR Laos 711 Northern Region Sustainable Livelihoods through Livestock Development Project 10/07/2007 2.00 0.98 49% 1.26 63% 22%
APR Laos 8025 Sustainable Natural Resource Management and Productivity Enhancement Project 23/07/2009 10.10 5.22 52% 3.80 38% -38%
APR Laos 8082 Rural Livelihoods Improvement Programme in Attapeu and Sayabouri 24/08/2011 1.55 0.58 37% 0.20 13% -188%
APR Laos 8089 Soum Son Seun Jai - Community-based Food Security and Economic Opportunities Programme 22/12/2011 8.85 1.04 12% 0.95 11% -10%
APR Maldives 663 Post-Tsunami Agricultural and Fisheries Rehabilitation Programme 21/04/2006 1.40 1.40 100% 1.10 78% -28%
APR Maldives 692 Post-Tsunami Agricultural and Fisheries Rehabilitation Programme 12/10/2006 1.45 1.18 81% 1.06 73% -11%
APR Maldives 726 Fisheries and Agricultural Diversification Programme 15/09/2009 2.35 0.59 25% 0.88 38% 34%
APR Maldives 8104 Mariculture Enterprise Development Project 09/01/2013 1.65 0.00 0% 0.03 2% 100%
APR Mongolia 836 Project for Market and Pasture Management Development 26/08/2011 7.25 1.86 26% 0.93 13% -100%
Reg. Country Loan /DSF Grant No. Project Name Effect. Date
Loan amt (SDR m)
Disb. 30/6/13 (SDR m)
% Disb.
Expected Disb (SDR m)
Expected % Disb
Disb. Lag
APR Nepal 576 Western Uplands Poverty Alleviation Project 01/01/2003 15.60 9.18 59% 14.72 94% 38%
APR Nepal 646 Leasehold Forestry and Livestock Programme 07/09/2005 7.15 7.15 100% 6.01 84% -19%
APR Nepal 646 Leasehold Forestry and Livestock Programme 30/04/2012 0.98 0.52 5% 0.07 7% -658%
APR Nepal 796 High-Value Agriculture Project in Hill and Mountain Areas 05/07/2010 4.75 0.76 16% 1.16 24% 34%
APR Nepal 8014 Poverty Alleviation Fund Project II 31/07/2008 2.50 2.36 94% 1.26 50% -87%
APR Nepal 8050 High-Value Agriculture Project in Hill and Mountain Areas 05/07/2010 4.75 0.76 16% 1.16 24% 34%
APR Nepal 8100 Leasehold Forestry and Livestock Programme 30/04/2012 0.98 0.27 28% 0.07 7% -286%
APR Nepal 8106 Kisankalagi Unnat Biu-Bijan Karyakram 02/12/2012 12.85 0.83 6% 0.51 4% -61%
APR Nepal 881 Kisankalagi Unnat Biu-Bijan Karyakram 02/12/2012 12.85 0.83 6% 0.51 4% -61%
APR Pakistan 554 Southern Federally Administered Tribal Areas Development Project 24/07/2002 13.40 3.62 27% 12.71 95% 72%
APR Pakistan 558 North-West Frontier Province Barani Area Development Project 09/05/2003 11.15 6.13 55% 10.48 94% 42%
APR Pakistan 625 Community Development Programme 02/09/2004 15.25 14.38 94% 13.82 91% -4%
APR Pakistan 683 Microfinance Innovation and Outreach Programme 01/09/2006 18.30 18.03 99% 13.75 75% -31%
APR Pakistan 727 Programme for Increasing Sustainable Microfinance 07/05/2008 22.85 20.32 89% 12.16 53% -67%
APR Pakistan 825 Southern Punjab Poverty Alleviation Project 30/09/2011 26.35 0.00 0% 3.43 13% 100%

18
APR Pakistan 837 Gwadar-Lasbela Livelihoods Support Project 31/01/2013 18.55 0.00 0% 0.37 2% 100%
APR Papua New Guinea 809 Productive Partnerships in Agriculture Project 14/09/2010 9.22 2.32 25% 2.25 24% -3%
APR Philippines 661 Rural Microenterprise Promotion Programme 31/10/2006 12.35 11.74 95% 9.00 73% -31%
APR Philippines 749 Second Cordillera Highland Agricultural Resource Management Project 14/11/2008 16.15 3.68 23% 7.71 48% 52%
APR Philippines 767 Rapid Food Production Enhancement Programme 09/11/2009 10.69 9.95 93% 3.74 35% -166%
Reg. Country Loan /DSF Grant No. Project Name Effect. Date
Loan amt (SDR m)
Disb. 30/6/13 (SDR m)
% Disb.
Expected Disb (SDR m)
Expected % Disb
Disb. Lag
APR Philippines 890 Integrated Natural Resources and Environmental Management Programme 12/04/2013 13.25 0.00 0% 0.13 1% 100%
APR Solomon Islands 8070 Solomon Islands Rural Development Programme 11/11/2011 2.55 2.39 94% 0.27 11% -772%
APR Sri Lanka 636 Dry Zone Livelihood Support and Partnership Programme 22/12/2005 15.10 14.92 99% 12.28 81% -21%
APR Sri Lanka 664 Post Tsunami Coastal Rehabilitation and Resource Management Programme 16/10/2006 9.40 9.34 99% 6.86 73% -36%
APR Sri Lanka 693 Post Tsunami Coastal Rehabilitation and Resource Management Programme 18/09/2008 10.95 10.24 94% 5.48 50% -87%
APR Sri Lanka 712 Smallholder Plantations Entrepreneurship Development Programme 06/11/2007 15.25 7.34 48% 9.06 59% 19%
APR Sri Lanka 797 National Agribusiness Development Programme 23/02/2010 15.55 1.65 11% 4.83 31% 66%
APR Sri Lanka 857 Iranamadu Irrigation Development Project 30/01/2012 14.35 0.66 5% 1.28 9% 48%
APR Timor-Leste 8093 Timor-Leste Maize Storage Project 14/05/2012 3.20 0.76 24% 0.24 7% -223%
APR Tonga 8099 Tonga Rural Innovation Project 25/05/2012 2.60 0.40 15% 0.19 7% -110%
APR Viet Nam 741 Developing Business with the Rural Poor Programme 06/05/2008 22.30 17.29 78% 11.87 53% -46%
APR Viet Nam 768 Pro-Poor Partnerships for Agroforestry Development Project 27/05/2009 14.11 8.12 58% 5.77 41% -41%
APR Viet Nam 810 Project for the Economic Empowerment of Ethnic Minorities in Poor Communes of Dak Nong Province 09/11/2010 12.80 2.02 16% 2.70 21% 25%
APR Viet Nam 826 Agriculture, Farmers and Rural Areas Support Project in Gia Lai, Ninh Thuan and Tuyen Quang Provinces 25/02/2011 31.50 6.33 20% 5.59 18% -13%
86 loans/dsf grants 1 274.50 526.41 41% 471.84 37% -12%
Expected disbursement is calculated from the IFAD model, as at 30/6/2013.
Percentage disbursement is calculated against the loan amount net of cancellations.
Projects with closed loans have been excluded.
Source: LGS/PPMS

19
Table 6.2 : APR Loans and DSF Grants with Disbursement Lag of 40 or more
as at 30 Jun 2013
08-Jul-13
Reg. Country
Loan /DSF Grant No.
Project Name Effect. Date
Loan amt
(SDR m)
Disb. 30/6/13
(SDR m)
% Disb.
Expected Disb
(SDR m)
Expected % Disb
Disb. Lag
APR Bangladesh 808 Participatory Small-scale Water Resources Sector Project 18/10/2010 6.53 0.63 10% 1.37 21% 54%
APR Bangladesh 786 Participatory Small-scale Water Resources Sector Project 06/11/2009 14.16 1.31 9% 4.90 35% 73%
APR Cambodia 793 Tonle Sap Poverty Reduction and Smallholder Development Project 15/02/2010 4.25 0.07 2% 1.32 31% 94%
APR Cambodia 8048 Tonle Sap Poverty Reduction and Smallholder Development Project 15/02/2010 4.25 0.07 2% 1.32 31% 94%
APR India 748 Mitigating Poverty in Western Rajasthan Project 11/12/2008 18.46 3.86 21% 8.82 48% 56%
APR India 710 Women's Empowerment and Livelihoods Programme in the Mid-Gangetic Plains 04/12/2009 20.40 2.02 10% 7.05 35% 71%
APR India 779 Convergence of Agricultural Interventions in Maharashtra's Distressed Districts Programme 04/12/2009 26.82 2.38 9% 9.27 35% 74%
APR Pakistan 558 North-West Frontier Province Barani Area Development Project 09/05/2003 11.15 6.13 55% 10.48 94% 42%
APR Pakistan 554 Southern Federally Administered Tribal Areas Development Project 24/07/2002 13.40 3.62 27% 12.71 95% 72%
APR Philippines 749 Second Cordillera Highland Agricultural Resource Management Project 14/11/2008 16.15 3.68 23% 7.71 48% 52%
APR Sri Lanka 857 Iranamadu Irrigation Development Project 30/01/2012 14.35 0.66 5% 1.28 9% 48%
APR Sri Lanka 797 National Agribusiness Development Programme 23/02/2010 15.55 1.65 11% 4.83 31% 66%
12 loans/dsf grants 165.47 26.08 16% 71.06 43% 63%
Expected disbursement is calculated from the IFAD model, as at 30/6/2013.
Percentage disbursement is calculated against the loan amount net of cancellations.
Projects with closed loans have been excluded.
Only loans/DSF grants that have been effective for one year or more at 30/6/2013 are included.
Loans/DSF grants with zero disbursement are excluded.
Source: LGS/PPMS

20
Table 7. 1. Relative Share of Co financiers in Ongoing Portfolio
Current Portfolio as of 30 June 2013 (on-going, and not signed projects)
EXTERNAL CO-FINANCIERS US$ '000 %
Multilateral Donors 543 301 14%
Bilateral Donors 142 396 4%
International NGOs 4 649 0%
To be determined 21 273 1%
Subtotal 711 619
DOMESTIC FINANCING US$ '000
Private Sector 22 595 1%
Financing Institutions 367 676 10%
Governments 694 719 18%
Beneficiaries 143 175 4%
Local NGOs 29 654 1%
Other 62 217 2%
Subtotal 1 320 036
Total co-financing 2 031 655
IFAD FINANCING (Current) 1 816 691 47%
TOTAL FINANCING (Current) 3 848 346 100%
Co-Financiers Share in Total Financing 53%
DOMESTIC FINANCING share in total co-financing 65%
EXTERNAL CO-FINANCIERS share in total co-financing 35%
Leveraging factors : $1.12
Chart: Regional portfolio by financing source and type
IFAD 47%
Government 18%
Multilateral Donors
14%
Dom. Financing Inst. 10%
Bilateral Donors
4%
Beneficiaries 4%
Other 4%

21
Table 7. 2. Relative share of External co-financier
External Co-financier agency
Nb. Of projects
Nb. Of countries Country
Current Amount (US$ '000) %
AsDB 7 4 Bangladesh, Cambodia, Laos, Philippines 245 670 20.0%
World Bank 4 4 Bangladesh, Nepal, Papua New Guinea, Solomon Islands 193 641 57.9%
United Kingdom/DfID 1 1 India 40 014 3.3%
Spanish Fund 2 2 Bangladesh, Indonesia 37 545 3.1%
SCF 1 1 Bangladesh 29 970 2.4%
Netherlands 2 1 Bangladesh 25 377 2.1%
EC 2 2 Philippines, Solomon Islands 23 319 1.9%
WFP 4 3 Nepal, India, Laos 21 411 1.7%
To be determined 4 3 Bangladesh, Philippines, Viet Nam 21 273 1.7%
OFID 1 1 Philippines 10 000 0.8%
Germany/KfW 1 1 Bangladesh 8 839 0.7%
European Union 1 1 Papua New Guinea 7 798 0.6%
Australia/AusAID 1 1 Solomon islands 6 101 0.5%
Finland/FINNIDA 1 1 Cambodia 5 748 0.5%
United States/USAID 1 1 Sri Lanka 5 456 0.4%
GEF 3 3 Mongolia, Philippines, Viet Nam 4 651 0.4%
Switzerland/SDC 1 1 Laos 3 506 0.3%
Luxembourg 1 1 Viet Nam 3 365 0.3%
FPCR (Food Price Crisis Response ) 1 1 Solomon islands 2 999 0.2%
Heifer Int 1 1 Nepal 2 500 0.2%
Germany/GIZ 2 1 Laos 2 184 0.2%
Swedish Complementary 1 1 Bhutan 2 002 0.2%
Germany 1 1 Viet Nam 2 000 0.2%
SNV (NGO) 3 3 Nepal, Bhutan, Cambodia 1 771 0.1%
AsDB-CCF 1 1 Philippines 1 410 0.1%
FAO 3 3 Afghanistan, Cambodia, Philippines 1 269 0.1%
UNDP 1 1 Cambodia 1 163 0.1%
iDE 1 1 Cambodia 378 0.0%
Germany/DED 1 1 Laos 259 0.0%
Total 711 619

22
Table 8.1. Projects Completed during Period under Review
Country Proect. Id
Project Name
IFAD Current
Financing (US$ '000)
Loan effectiven
ess
Original Completi
on Date
Original Project duratio
n (years)
Current Project
Completion
Date
Years of Effectivene
ss
Nb. Of Extension
s %
Disb.
China 1271 SGPRP 29 254 22 Aug 06 30 Sep 12 6.1 30 Sep 12 6.1 0 100%
China 1478 SPEAR 30 470 30 Sep 09 30 Sep 11 2.0 30 Sep 12 3.0 1 100%
India 1226 LIPH 39 920 01 Oct 04 31 Dec 12 8.3 31 Dec 12 8.3 0 81%
Pakistan 1245 AJK 21 766 02 Sep 04 30 Sep 11 7.1 30 Sep 12 8.1 1 94%
Sri Lanka 1254 Dry Zone 22 311 22 Dec 05 31 Dec 12 7.0 31 Mar 13 7.3 1 99%
Total nb. of Projects 5
143 721
Table 8.2. Project completion during next review period
Country Project Id
Project Name
IFAD Current
Financing (US$ '000)
Loan effectiveness
Original Completion
Date
Original Project
duration (years)
Current Project
Completion Date
Years of
Effectiv.
Nb. Of
Exten.
Bangladesh 1165 Sunamganj Project 21 973 14 Jan 03 31 Mar 14 11.2 31 Mar 14 11.2 0
Bangladesh 1322 MIDPCR 24 947 22 Sep 06 30 Sep 13 7.0 30 Sep 13 7.0 0
Bangladesh 1402 FEDEC 35 031 08 Jan 08 31 Mar 14 6.2 31 Mar 14 6.2 0
Bangladesh 1355 NATP (LOT) 19 450 25 Mar 08 31 Mar 13 5.0 31 Dec 13 5.8 1
India 1155 OTELP 19 996 15 Jul 03 31 Mar 13 9.7 31 Mar 14 10.7 1
Laos 1301 RLIP 20 491 15 Mar 06 31 Mar 14 8.0 31 Mar 14 8.0 0
Laos 1396 NRSLLDP 2 994 10 Jul 07 30 Sep 13 6.2 30 Sep 13 6.2 0
Maldives 1347 PT-AFReP 4 296 21 Apr 06 30 Jun 11 5.2 31 Dec 13 7.7 1
Pakistan 1413 PRISM 35 006 07 May 08 30 Jun 13 5.2 30 Sep 13 5.4 1
Philippines 1253 RuMePP 19 130 31 Oct 06 31 Dec 13 7.2 31 Dec 13 7.2 0 Solomon Islands 1565 RDP 3 996 11 Nov 11 30 Nov 13 2.1 30 Nov 13 2.1 0
Sri Lanka 1346 PT-CRReMP 29 877 16 Oct 06 31 Dec 11 5.2 30 Sep 13 7.0 1
Total nb. of Projects 12 237 187

23
Table 8.3 Grants Scheduled for completion or closure during 2013
Grant number Completion date Closing date Remarks
902 FAO 30/09/2012 31/03/2013
Final docs being sent
1105 CN 30/09/2012 31/03/2013
Project closing activities
1265 MFBH 30/09/2012 30/06/2013
Project closing activities
1010A AIT 31/12/2012 30/06/2013 Project closing activities
783 MV 31/12/2012 30/06/2013
Project closing activities
1034 FAO 31/12/2012 30/09/2013
Project closing activities
1263 FLANZ 31/12/2012 30/09/2013 Project closing activities
1267 UNIMAS 31/12/2012 30/09/2013 Project closing activities
1064 VN 31/12/2012 30/09/2013
Project closing activities
1223 VN 31/12/2012 30/09/2013
Project closing activities
712 LK 31/03/2013 30/09/2013
Project closing activities
1235 PH 30/06/2013 30/09/2013
Project closing activities
1157 IPSARD 30/06/2013 30/09/2013
Project closing activities
1356 WB 28/02/2013 30/11/2013 Project closing activities
1113 ICIMOD 30/06/2013 31/12/2013
Project closing activities
998A 31/12/2013 30/06/2014
On-going
Table 8.4. Grants granted an extension during the period under review
Grant number Type of Gr
Original Completion date
New Completion date New Closing date Disb. rate
AIT 998A Large Reg
31/12/2012 31/12/2013 30/06/2014 100%
CIP 1239 Large Reg
31/03/2014 31/03/2015 30/09/2015 91%
712 LK Small C 31/12/2012 31/03/2013 30/09/2013 92%
NEDA 1235 Small C 31/12/2012 30/06/2013 30/09/2013 100%
IPSARD 1157 Small C 31/12/2012 30/06/2013 30/09/2013 90%
783 MV Small C 31/12/2012 31/12/2013 30/06/2014 99%
BD 1114 Large C 30/09/2012 30/09/2013 31/03/2014 95%

24
Table 9.1. Project Extensions during Period under Review
Country Proj. ID Project
Supervising Inst.
Loan Effectiveness
Original Completion Date
Current completion
Closing date
Project duration
No. of exten
s. Time
overrun
Afghanistan 1460 RMLSP IFAD/IFAD 24 Aug 09 30 Sep 13 30 Sep 14 31 Mar 15 5.1 1 24% Bangladesh 1355
NATP (LOT) World Bank 25 Mar 08 31 Mar 13 31 Dec 13 30 Mar 14 5.8 1 15%
India 1155 OTELP IFAD/IFAD 15 Jul 03 31 Mar 13 31 Mar 14 30 Sep 14 10.7 1 10%
Indonesia 1621 CCDP IFAD/IFAD 23 Oct 12 31 Oct 17 31 Dec 17 30 Jun 18 5.2 1 3%
Maldives 1347 PT-AFReP IFAD/IFAD 21 Apr 06 30 Jun 11 31 Dec 13 30 Jun 14 7.7 1 48%
Nepal 1119 WUPAP IFAD/IFAD 01 Jan 03 31 May 14 15 Jul 16 31 Dec 16 13.5 1 20%
Nepal 1285 LFLP IFAD/IFAD 07 Sep 05 30 Sep 13 30 Sep 14 31 Mar 15 9.1 1 12%
Nepal 1450 PAF II IFAD/IFAD 31 Jul 08 30 Sep 12 30 Jun 14 31 Dec 14 5.9 1 42%
Pakistan 1413 PRISM IFAD/IFAD 07 May 08 30 Jun 13 30 Sep 13 31 Mar 14 5.4 1 5%
Total 9
Table 9.2. Grants granted an extension during the period under review
Table 9.3. Project with Time Overrun of over 15%
Country Project ID Project
Supervising Inst.
Loan Effectiveness
Original Completion Date
Current completion
Closing date
No. of extens
ions Time
overrun
Afghanistan 1460 RMLSP IFAD/IFAD 24 Aug 09 30 Sep 13 30 Sep 14 31 Mar 15 1 24%
India * 1348 PT-Tamil Nadu IFAD/IFAD 09 Jul 07 30 Sep 15 31 Mar 17 30 Sep 17 0 18%
Maldives * 1347 PT-AFReP IFAD/IFAD 21 Apr 06 30 Jun 11 31 Dec 13 30 Jun 14 1 48%
Nepal 1119 WUPAP IFAD/IFAD 01 Jan 03 31 May 14 15 Jul 16 31 Dec 16 1 20%
Nepal * 1450 PAF II IFAD/IFAD 31 Jul 08 30 Sep 12 30 Jun 14 31 Dec 14 1 42%
Sri Lanka * 1346 PT-CRReMP IFAD/IFAD 16 Oct 06 31 Dec 11 30 Sep 13 31 Mar 14 1 34%
Total 6
*Supplementary Financing
Grant number Type of Gr
Original Completion date
New Completion date New Closing date Disb. rate
AIT 998A Large Reg
31/12/2012 31/12/2013 30/06/2014 100%
CIP 1239 Large Reg
31/03/2014 31/03/2015 30/09/2015 91%
712 LK Small C 31/12/2012 31/03/2013 30/09/2013 92%
NEDA 1235 Small C 31/12/2012 30/06/2013 30/09/2013 100%
IPSARD 1157 Small C 31/12/2012 30/06/2013 30/09/2013 90%
783 MV Small C 31/12/2012 31/12/2013 30/06/2014 99%
BD 1114 Large C 30/09/2012 30/09/2013 31/03/2014 95%

25
Table 10. Action Plan for Improving Portfolio Performance
Country Project affected
Specific issues Recommended follow-up Responsibility Target date
Country Programme management
Bangladesh All Country program performance monitoring
Preparation of a Country Programme Assessment Framework (CPAF) to which all projects regularly report.
CPM, CPO December 2013
Bangladesh All Annual COSOP Review To be prepared annually and discussed with stakeholders plus extended donor group
CPM, CPO December 2013
Indonesia All Country Programme Management
· IFAD to hold 3 country programme management team meetings in 2013 · Support strengthening National Steering Committee in Indonesia · Establishment of Country Office before the end of 2013 · Formalize agreements with universities to assist in building in-country network support for country programme
CPM, CPO December 2013
Nepal All COSOP formulation
· Further to CPE workshop and signed ACP, design new COSOP (2013-2018) · Carry out various studies with regard to formulation of a new COSOP (2013-2018) · Hold consultations with the Government, stakeholders and the
development partners (setup new COSOP CPMT and COSOP annual review).
CPM, CPO December 2013
Pakistan All Macro-economic instability
a) Ensure continued political and institutional support; (b) ensure that project initiatives are owned by local stakeholders and that these partners are not being forced to participate; & (c) ensure the appointment of competent project management teams.
CPMT, GoP Ongoing
Project Management
Afghanistan All Security situation Focusing in relatively stable areas where the risk of conflict is low CPMT, GoA Ongoing
Cambodia All
Decentralised project implementation arrangements used for IFAD projects since 1998 may no longer be appropriate in light of RGC evolving decentralisation programme.
No change to design of ongoing projects. New projects, particularly ASPIRE, will be designed in accordance with the emerging decentralised structures. The current review of functional assignment in agriculture (NCDDS and MAFF) may lead to decisions to assign some agriculture service functions to sub-national administrations. Design of ASPIRE will follow RGC policy decisions in this respect.
CPMT, RGC End 2013
Country Project affected
Specific issues Recommended follow-up Responsibility Target date
Cambodia TSSP Delays in implementation · In 2011 ADB, IFAD, and the Government agreed to restructure
the project implementation arrangements and financing plan. The IFAD financing agreement is being amended accordingly.
CPMT June 2013
India MPOWER,
WELP Persistent problem projects
· Provide Implementation Support where needed · Critically assess performance during JRM/MTR and make recommendations regarding future of the project. · Discuss with DEA and the state government about the plan for taking the projects out of problem category
ICO December 2013

26
Laos All
Large size of on-going country programme – small amounts of money available for supervision missions and implementation support missions
· In 2013 there are 4 on-going projects. These projects are covering Northern Laos and Southern Laos. The same supervision mission team will cover two projects (longer missions) in order to ensure savings and maintain high supervision standards
CPM December 2013
Nepal All Weak Project management
· Improve annual workplan and budget and annual reporting · Develop managing for development results methods · Improve technical monitoring of activities · Improve project efficiency
CPM, CPO, Projects
August 2013 October 2013
December 2013
Pakistan All Security situation Keep low profile and consider the local sensitivities CPMT, GoP Ongoing
Supervision/ Implementation
Bhutan MAGIP Supervision mission
· Ensure timely supervision for MAGIP · Ensure senior mission leaders for supervision. · Ensure some degree of continuity of consultants between MTR and supervision for MAGIP.
CPM, CPO December 2013
China MRDP, DAPRP
Low quality of project implementation for some components
Projects assisted with reviews to identify inadequacies and mitigations required, and to exchanges with other successful PMOs to share and learn
PMO, IFAD Continuous
China DAPRP,
YARIP, HARIP
Limited understanding of program and module strategies affects implementation quality
Refresh training and capacity building to IAs and PMOs PMO, IFAD December 2013
Country Project affected
Specific issues Recommended follow-up Responsibility Target date
India All JRM and follow-up missions
· Ensure one full JRM for all on-going projects, and follow-up ISMs for all problem projects. · Organise appropriate mix of experts for JRMs/ MTR. · Hold regular TPRMs chaired by DEA.
CPM, CPO December 2013
India All (in
particular LIPH and TWREP)
Large size of on-going country programme (10 ongoing projects) and multiple two-state projects leads to very low unit costs for JRMs
· Process fewer larger loans covering only one state. Projection shows that this approach will reduce the size of the country programme from 10 projects in 2012 to 7 projects by 2016. This will enable higher unit costs for JRMs and higher quality.
CPM December 2016
Indonesia All Enhanced implementation support for problem projects
· 2 full missions undertaken for each project in 2013 CPM, CPO, CPMT December 2013
Laos All Supervision missions · Ensure one full supervision mission for all on-going projects · Ensure continuity of consultants between design and supervision missions
CPM, CPO December 2013
Laos RLIP, SSSJ Implementation support missions · Periodic implementation support missions on M&E and financial management
CPM, CPO December 2013
Mongolia PMPMD
On-lending of the US$ 500 000 credit line to participating bank to provide access for the PMPMD target group members to financial services.
Supervision/implementation support MOF Jun 2013

27
Nepal All Supervision and follow-up missions
· Ensure one full supervision and one follow-up mission for all on- going projects. · Ensure continuity of consultants (national and international) in the missions.
CPM7CPO December 2013
Pakistan All Delays in start-up Follow up with GoP & provincial authorities and provide Implementation support
CPMT, GoP Ongoing
Country Project affected
Specific issues Recommended follow-up Responsibility Target date
Pakistan All Non-compliance of rigorous targeting criteria by projects
Implementation Support & Supervision Follow-ups CPMT, GoP Ongoing
Viet Nam All Technical guidance following supervision missions
· Ensure follow-up missions for all problem projects; · Ensure a pool of expertise on strategic areas for the country programme; · Consolidate on implementation aspects where success has been
proven such as market-oriented participatory, commune-driven planning, a market-oriented approach to agriculture and rural development, including value chain approaches, rural enterprise development, vocational training, etc.;
· Generate and use M&E information more effectively to support better rural development strategy design, resource allocation and performance review.
CPM December 2013
Financial Management
Afghanistan RMLSP Ineligibility of tax expenditures MOF to clarify tax exemption entitlements on goods and services procured under the project
Project, MAIL, MoF Immediate
Afghanistan RMLSP Accounting/FM System Properly manage project’s financial transactions and reporting Project, MAIL, MoF Immediate
Bangladesh ALL Financial Management Financial management CFS October 2013
Bhutan MAGIP Improved Financial Management · Orient Dzongkhag finance/accounts staff on IFAD fiduciary aspects. · Ensure timely audit for MAGIP.
CPM, CPO August 2013
China All Low disbursement rates compared to the financial achievements reported by the projects
Proactive follow up with projects, and provide action and results oriented guidance and training.
PMO, IFAD Immediate and
continuous
Country Project affected
Specific issues Recommended follow-up Responsibility Target date
India All Poor Financial Management
· FM consultant to be recruited for all JRMs. · CFS to provide close follow-up on FM. · Procurement specialist to be recruited on retainer contract to advise on no-objections to procurement actions. · Periodic FM training events organized for project FM staff. · India included in 2013 procurement audit by HQ
ICO, CFS December 2013
India All Low disbursement rates · In-country assistance from ICO in processing high quality of Withdrawal Applications, and frequent follow-up with projects.
ICO December 2013
Laos All Poor FM · FM consultant to be recruited for all supervision missions in 2013 CPM, CPO December 2013

28
· Periodic FM training events organized for project FM staff
Laos All Low disbursement rates · Deliver trainings in FM · Ensure all new projects have retroactive financing in order to undertake all preparatory activities before project’s approval
CPM, CFS December 2013
Laos All co-financed
projects Improved Disbursement in Co-Financed Projects
· IFAD has worked with ADB on improving the planning process and consequently the disbursement rate which has significantly improved. The country presence has been key to this achievement and those efforts will be continued
CPM Ongoing
Mongolia PMPMD
Making arrangements for the financing of the operations of the Loan Guarantee Facility under MOF for sustainability.
Supervision/implementation support MOF and IFAD July/August 2013
Nepal All Weak Financial Management
· Implement selected Tally accounting software · FM training event to be organized for all FM staff. · FM consultant to be recruited for all supervision missions. · Make sure CPISU financial manager is operational
CPO, Projects CPM7CPM
CPM, CPO
August 2013 September 2013
December 2013
Pacific SIRDP, PPAP,
TLMSP Late delivery of Audit Reports
CPM and CFS increase pressure on Cooperating Institution (WB) and directly on responsible government agencies
CPM, CFS 31-lug-13
For next year from 1 Jan 2014
Pakistan All Pending actions on Audit Observations/Paras
Special coordination/meetings with Projects/GoP and provide FM support CPMT, GoP Ongoing
Country Project affected
Specific issues Recommended follow-up Responsibility Target date
Pakistan All Financial management and Knowledge Management
Provision of FM and KM support to projects/programmes and at the country programme level
CPMT Ongoing
Philippines
CHARMP2, RaFPEP, RuMEPP
Slow process of withdrawal applications and fund releases
· DA Central Office to review and transmit WA documents to IFAD within five working upon receipt from the PSO · PSO to request IFAD to increase the authorised fund release from US$ 1.5 to US$ 2.5 million · Regional and provincial offices of NIA to improve accounting, preparation of documents and submission of SOEs · IFAD to reduce processing for a WA to 10 days in line with the directive of the comptroller · NEDA to include this concern on the ODA report; Projects to have
a tracking system for WA processing (Project-DOF-IFAD-Bangko Sentral-BTr-DBM-Project
· ICO to track the stages of WAs
· DA, CHARMP2 · DA, CHARMP 2
· NIA and RaFPEP · IFAD CFS and
CPM, CPO · NEDA PMS
· CPA
· February 2013 · April 2013 (upon
signature of DA Secretary)
· Start last quarter of 2012
· Immediately · Next NEDA ODA
Report · Beginning
February 2013
Philippines
CONVERGE, FishCORAL,
RaFPEP Top-Up Financing
Delayed GoP processing (ICC/NEDA Board for CONVERGE and DBCC for RaFPEP Top-Up Financing)
· Continue implementing the NISs rehab in Bukidnon (retroactive financing as at 08 October 2012) while following up on the signing of the amended RaFPEP Financing Agreement
· Provide technical assistance to DAR for CONVERGE component 1 when needed · Constantly follow-up, meet and discuss with BFAR management for FishCoRAL project design and required documentation · Meet with NEDA, DA and DAR on the effects of the new GoP financing mechanism to CONVERGE and FishCoRAL
· RaFPEP/IRPEP, CPM, CPO
· CPM, CPO
· CPM, CPO
· CPM, CPO
Beginning January 2013
Beginning January
2013 Beginning January
2013 Jun-13

29
Sri Lanka All Weak financial management capacity
FM training workshop, & targeted implementation support during supervision missions
Country team, with CFS support
Ongoing
Country Project affected
Specific issues Recommended follow-up Responsibility Target date
Project Management – Human Resources
Afghanistan RMLSP Limited capacity of MFI Opportunities for capacity building are in-built into project design; & implementing partners are able to strengthen capacity by hiring additional staff and procuring qualified national and international consulting services
Project, GoV Immediate
Bhutan MAGIP Strengthening the programme mgt. capacity
· Capacity building / exposure visits for the programme coordination unit (PCU) of MAGIP · One orientation programme on programme management for all key entities of MAGIP
CPO, CPM December 2013
Cambodia RULIP, TSSP,
PADEE Ending of government-donor agreed scheme for salary support
· Coordinate with donor partners and government to agree overall policy. · Seek innovative solutions to ensure incentives and accountability of project staff
Projects, GoC Ongoing
China GIADP, HARIIP, YARIP
Slow progress at project start up · Intensified counselling from ICO; · Training of CPMO staff by the provincial PMO
PMO, ICO Continuous
China DAPRP. YARIP
Low capacity of PMOs and IAs staff Capacity building in planning and management for PMOs and module implementation modalities for implementing agencies.
PMOs, IFAD
India Most projects Frequent rotation of Project Directors
· Where possible negotiate with state government to provide additional charge of the projects to the PDs in case they are transferred
· Have full time competent APDs recruited from the open market with competitive salary packages.
ICO December 2013
Indonesia All Project Management Capacity · APMAS leadership training to be held in July/ August 2013 · Provision of strengthened and regular management advice for project managers and staff
CPM, CPO December 2013
Country Project affected
Specific issues Recommended follow-up Responsibility Target date
Maldives FADIP, MEDEP
Slow pace of implementation Regular implementation support & follow-up with MOFA, the lead agency Country team Ongoing
Mongolia PMPMD
· Recruitment of value chain experts to provide support and services for the implementation of the Market Development Component. · Recruitment of one service provider for pasture management and one for women groups for enterprise development.
Review of the TORs for individual consultants and RFPs. PMU, IFAD August 2013

30
Nepal All Vacant project staff positions
· Engage in dialogue with Government to fulfil all (government) positions. · Ensure all contracted position are timely filled up. · Increase the use of national technical assistance positions
CPO Continuous
October 2013
Pakistan All Implementing capacity of partners (a) Ensure appropriate adaptive measures and technologies and (b) provide additional support to project for adaptation
CPMT, GoP Ongoing
Sri Lanka All Potentially all projects High turnover of project staff Country team Ongoing
Country Project affected
Specific issues Recommended follow-up Responsibility Target date
Procurement
Indonesia All Procurement
· Procurement specialist to be retained to support procurement activities under the IFAD portfolio. · IFAD to continue to liaise with LKPP (National Procurement Authority) to discuss procurement issues and harmonisation with IFAD. · Procurement technical specifications developed as a part of AWPB
CPM, CPO, CPMT December 2013
Philippines
CHARMP2, RaFPEP, RuMEPP,
INREMP and upcoming projects
Efficient procurement and solving other project implementation bottlenecks
· Conduct joint IFAD-NEDA quarterly monitoring of CHARMP2 · Conduct quarterly meetings of IFAD assisted projects · Monitor implementation of agreed actions during quarterly meetings of IFAD-PH projects (loan and grants) · Submit to NEDA issues raised in KLM6/ACPoR5 for GoP appreciation and possible action
· CPM, CPO, NEDA PMS
· CPM, CPO, CPA, projects
· CPM, CPO, CPA, projects
· CPM,CPO
· Beginning April 2013
· Beginning April 2013
· Beginning May 2013
· May-13
Knowledge Management
Bangladesh All KM
· Continue newsletter, Ifadasia, blogs and other media for knowledge sharing. · Draw from results generated by the Country Program Assessment Framework (CPAF)
CPM, KM Officer October 2013
Bhutan MAGIP KM · One KM orientation event for key project staff of MAGIP. · At least 2 case studies on good practices from any component of intervention.
CPO, CPM December 2013
China All Limited knowledge capturing and sharing at country program and project levels
Development KM action plan at country and project level and conduct activities to increase dissemination of KM products; and provide training and capacity building for PMOs
PMO, IFAD Between mid-2013 to end December 2013
India All Insufficient KM and knowledge sharing within and between projects and outside.
· JRMs to follow up action taken by the project for implementing KM strategies. · 2 newsletters prepared by ICO with inputs from projects. · On going capacity support for project KM staff by ICO. · Better loans-grants synergies.
ICO December 2013

31
Country Project affected
Specific issues Recommended follow-up Responsibility Target date
Indonesia All KM and IFAD “visibility”
· Continue implementation of KM Strategy for country programme with enhanced focus on developing media links · Develop various knowledge products for country programme · Further develop dissemination approach for policy studies under READ
CPM, CPO, CPMT December 2013
Laos All Insufficient KM · Links from programmes websites to IFADAsia website · Periodic KM events (at least once a year) · Exchange of visits to countries implementing similar components
CPM, CPO December 2013
Pacific
PPAP SIRDP TRIP
PHVA, POETCom
Insufficient knowledge sharing between countries
Use individuals from some country programmes as technical advisors to other programmes, Advocacy and stronger promotion of sharing materials and experiences through electronic and face to face networking
CPM, Regional coordinator
July 2013 October 2013 January 2014
M&E
Bhutan MAGIP Annual Outcome Survey · To facilitate successful conduct of annual outcome survey CPO, CPM December 2013
Cambodia
RULIP, TSSP, PADEE, ASPIRE,
AIMS
Improve M&E, learning and KM through coordinated approach
ASPIRE design to include provision for coordinating M&E and knowledge management across all RB-COSOP programmes
ASPIRE design team
Mid 2014
China
MRDP, DAPRP, GIADP, HARIIP
Inadequate attention to M&E and reporting, especially at county and levels below
Capacity building through cross project learning and community of practice among IFAD projects; Develop M&E operational guideline; Standardize logframe, RIMS and M&E forms of all projects.
PMO, IFAD October 2013
China MRDP M&E and RIMS not timely and sub-standard
M&E and RIMS to be aligned for two project phases PMO July 2013
Country Project affected
Specific issues Recommended follow-up Responsibility Target date
Maldives All Weak M&E system & capacity Continued support for system enhancement & staff capacity building Country team, with
support of APR focal point
December 2013
Nepal All Weak M&E & KM
· Reinforce the country programme level M&E system. · Engage interns to prepare the case studies on KM. · Develop a comprehensive country level KM system within IFADAsia
CPM, CPO February 2013
March 2013

32
Pacific
SIRDP PPAP TRIP PHVA
TLMSP
Weak M&E, including late baseline data collection, late or missing MIS and financial management IT arrangements
· Technical support using implementation support budget, explore possibilities of small regional grant to bolster project capacity on
M&E to do case studies and documentation that will lay groundwork for scaling up.
· Implementation support on MIS, financial management
CPM, Regional coordinator
March 2014
Sri Lanka All, & NADEP in particular
Weak M&E system & capacity Support for system development / enhancement & staff capacity building Country team, with
support of APR focal point
Ongoing
Viet Nam All Using Knowledge Management for Impact
· Co-ordinate and oversee enhanced production and dissemination of communication and advocacy materials, including brochures, posters, pamphlets, and press releases;
· Train the IFAD Project Knowledge Management Officers (KMOs) periodically on KM guidelines documentation, KM techniques; · Make media arrangements for IFAD staffs at events and during
the missions; · Maintain and update of IFAD Vietnam Programme Website
CPM, CPO, KM/ Communication
specialist December 2013
Country Project affected
Specific issues Recommended follow-up Responsibility Target date
Sustainability
Afghanistan RMLSP Formulation of exit strategy
Through engagement of suitable technical assistance; the strategy need to be formulated covering realignment of FAO budget with current extended support needs of KDU, incremental draw down of external support and capacity development of KDU, updating of KDU Business plan, calculation of viability gap fund/KDU support etc.
PMU Immediate
Philippines RaFPEP, RuMEPP
Sustainability planning and preparation for project completion
· Pilot test the establishment of “municipal coordination council” or activate existing municipal committees to monitor and support completed CISs in three regions · Develop sustainability plan for MEs · Undertake Project Completion Impact Survey · Prepare draft PCR with the results of the project completion impact survey included and submit report to IFAD
· NIA Regions, NIA NPCU, RaFPEP
· RuMEPP Provincial, regional DTI offices, PMU,
SBC, MFIs and M&E · RuMEPP PMU
RuMEPP
· Start last quarter of 2012
· Beginning 31st
January 2013
· January- February 2014
Project Design
Nepal
ASAP, rural micro-
enterprises & remittances
Quality project design
· Consultation with Civil Society Organizations and donor communities in the country Finalize COSOP design · Engage in dialogue with the government for the new design and
finalize it for implementation from July 2012 onwards (ASAP, micro-enterprises)
· Initial design of ASAP
CPM, CPO
· Jan – May 2013 · Apr – May 2013
· June 2013
· August 2013

33
Country Project affected
Specific issues Recommended follow-up Responsibility Target date
Policy linkages and dialogue
Philippines CHARMP2, RaFPEP, RuMEPP
Documentation and sharing of project case stories/policy briefs
· Submit publication of project case stories/compendium of success stories and policy briefs for RuMEPP · Submit to IFAD conclusions of the policy dialogues conducted by NFA
Projects
· RuMEPP and CHARMP2
on 30 April 2013; · RaFPEP by
May 2013 · By April 30 2013
Philippines RaFPEP, RuMEPP
Sustainability planning and preparation for project
completion
· Pilot test the establishment of “municipal coordination council” or activate existing municipal committees to monitor and support completed CISs in three regions · Develop sustainability plan for MEs · Undertake Project Completion Impact Survey · Prepare draft PCR with the results of the project completion impact survey included and submit report to IFAD
· NIA Regions, NIA NPCU, RaFPEP
· RuMEPP Provincial, regional DTI offices,
PMU, SBC, MFIs and M&E
· RuMEPP PMU RuMEPP
· Start last quarter of 2012
· Beginning 31st January 2013
· January-
February 2014
Viet Nam All
Enhancing Policy Impact: the Link between Project Experience, Government and Partners
· Improve connection between central level policy dialogue/national programmes, IFAD loan projects and supporting grant projects
· Focus the policy messages around the market-based agriculture for poverty reduction approach and public-private partnership (PPP) approach
· Develop a learning route on selected policy themes and organize policy dialogue forums to upscale lessons
CPO December 2013
Country Project affected
Specific issues Recommended follow-up Responsibility Target date
Targeting
Bhutan MAGIP Improving Gender Mainstreaming · One gender orientation event for key project staff of MAGIP. · Improved gender disaggregated data from project results
CPO, CPM December 2013
Partnership
Cambodia
TSSP, PADEE, ASPIRE,
AIMS
Move towards Programme Based Approach and strengthen partnership and alignment with RGC and development partner programmes
ASPIRE explicitly to prepare for PBA in extension sub-sector and to trial programmatic elements including programme budgeting, coordination of knowledge management and M&E (see below) and strengthening and deepening of partnerships. Some programmatic features will include coordination with ongoing projects (mainly PADEE).
CPMT, Projects Mid-2014 for design of ASPIRE; ongoing
process
Institution
Afghanistan
All
Uncertainty in policy/regulations areas
To ensure long-term sustainability of several achievements of the project the issue of clarity of registration of para-veterinaries; animal health; registration/standardization of veterinary pharmaceuticals, etc need to be quickly addressed CPMT/GoA Immediate
Afghanistan Lack of Institutional and policy framework for the Microfinance Sector
Realise full potential of the sector attention needed for devising a framework


Annexes
1 Investment Portfolio Characteristics 2 Grants Portfolio Characteristics 3 Investment Portfolio – Financial Data 4 Effectiveness Data


1
Annex 1
Investment Portfolio Characteristics
Chart 1: APR portfolio size – project cycle (as at 30 June 2013)
Source: PPMS Chart 2: Sub-Regional share of portfolio (IFAD Current Financing (US$ '000))
Table 1: Portfolio by Financing Source and Type as at 30 Jun 2013
US$ '000
Financing Type
No. of Projects
IFAD Financing (current)
Government Beneficiaries Domestic Other
External Co-
financing
Total %
C 9 134 793 62 944 24 458 0 449 540 671 735 17%
E 33 1 083 434 453 485 74 237 455 786 0 2 066 942 54%
F 23 598 464 178 290 44 480 26 356 262 079 1 109 669 29%
Total 65 1 816 691
694 719
143 175
482 142
711 619
3 848 346
100%
% 47% 18% 4% 13% 18% 100%
Source: PPMS
0
10
20
30
40
50
60
70
2010/2011 2011/2012 2012/2013
7 8 9 4
15
5 5 6 5 1 0 0
4 2 1
56 59
64
1
No
.of
pro
ject
Approved
Loan Closed
Completed
Not effective
Not signed
Ongoing
Cancelled
-
500 000
1 000 000
1 500 000
2 000 000
2010-112011-12
2012-13
57% 58% 58%
29% 27% 27%
12% 13% 13% 1% 2% 1%
US$
'00
0
South Asia South East East Asia Pacific Islands
1 504 800 1 615 846 1 816 691
Source:PPMS

2
Table 2: Co-financing sources – Projects newly approved under review period
Projects newly approved under review period ( 9 projects + 2 top-ups)
EXTERNAL CO-FINANCIERS US$ '000 %
Multilateral Donors 154 339 19%
Bilateral Donors 16 639 2%
International NGOs 2 500 0%
To be determined 19 495 2%
Subtotal 192 973
DOMESTIC FINANCING US$ '000
Private Sector 2 762 0%
Financing Institutions 0 0%
Governments 171 425 22%
Beneficiaries 25 237 3%
Local NGOs 0 0%
Other 55 738 7%
Subtotal 255 162
Total co-financing 448 135
IFAD Current FINANCING 344 566 43%
TOTAL FINANCING 792 701
Co-Financiers Share in Total Financing 57%
Domestic Financiers Share in Total co-financing 57% International Co-Financiers Share in Total Financing 43%
Leveraging factor: $ 1.30 Source: PPMS

3
Table 3: Projects reviewed through QE and QA
Quality Enhancement Quality Assurance
Country Project QE date Country Project QA date
Bangladesh CCRIP - 1647 Sep-12 Nepal Biu-Bijan - 1602 Jul-12
Laos FNML (LOT)- 1680 Feb-13 India JTELP - 1649 Jul-12
Viet Nam SRDP - 1662 Feb-13 Afghanistan CLAP - 1637 Oct-12
Pakistan LAMP - 1676 Mar-13 China YARIP - 1629 Oct-12
Bangladesh HILIP/CALIP (LOT) - 1585 Apr-13 Bangladesh CCRIP - 1647 Feb-13
Philippines CONVERGE - 1547 May-13
China SSADep - 1699 Jun-13
Total 7 5
Table 4: Project approvals during the review period (loans, DSF grants and top-up loans)
Country Project ID Project Name
Project Board
Approval
IFAD Current
Financing (US$ '000)
Entry into force
Approval to entry
into force (month)+ (Disb. %)
Cooperative Institution
Approval to First Disb. lag as of 30 June
(months)
Afghanistan 1637 CLAP 13 Dec 12 58 001 08 Apr 13 3.8 IFAD/IFAD 6.5
Bangladesh 1647 CCRIP 10 Apr 13 40 512 28 Jun 13 2.6 IFAD/IFAD 2.7
China 1627 HARIIP 21 Sep 12 47 000 21 Sep 12 0 IFAD/IFAD 9.3
China 1629 YARIP 13 Dec 12 46 700 31 Jan 13 1.6 IFAD/IFAD 6.5
India 1649 JTELP 21 Sep 12 51 001 IFAD/IFAD 9.3
Indonesia 1621 CCDP 21 Sep 12 26 200 23 Oct 12 1.1 (11%) IFAD/IFAD (4.8)
Maldives 1624 MEDEP 06 Sep 12 2 487 09 Jan 13 4.1 IFAD/IFAD 9.8
Nepal 1602 Biu-Bijan 21 Sep 12 39 000 02 Dec 12 2.4
(11.8%) IFAD/IFAD (8.5)
Philippines 1475 INREMP 13 Dec 12 20 000 12 Apr 13 4.0 AsDB 6.5
Number of projects 9 330 901 Average 2.5 7.2
Supplementary Financing
Nepal 1450 PAF II 10 Dec 12 10 000 IFAD/IFAD
Philippines 1485 RaFPEP 30 Nov 12 3 665 IFAD/IFAD
Number of projects 11 344 566
Source: PPMS

4
Table 5: Projects entered into force during the review period
Source: PPMS
Table 6: Projects entered into force during the review period – from approval to first disbursement*
IFAD Current
Financing (US$ '000)
2012 2013
Country Proj. Id
Project Name
J F M A M J J A S O N D J F M A M J J
Afghanistan 1637 CLAP 58 001 X
Bangladesh 1585 HILIP-CALIP
56 093 X
Bangladesh 1647 CCRIP 40 512 X
China 1627 HARIIP 47 000 X
China 1629 YARIP 46 700 X
Indonesia 1621 CCDP 26 200 X
Maldives 1624 MEDEP 2 487 X
Nepal 1602 Biu-Bijan 39 000 X
Pakistan 1515 GLLSP 30 000 X
Philippines 1475 INREMP 20 000 X
10 projects US$ 366 million
Average time from approval to EOF: 5.0
*Boxed durations signify completion of first disbursement; x indicates date of entry into force Source: PPMS
Country Proj. Id
Project Name
IFAD Current Financing (US$ '000)
Project Board Approval
Entry into Force)
Approval to Entry into Force (months)
First disb. date
% Disb
Approval to First disb. (m)(Lag as of 30 June)
Entry into force to First disb.(m) (Lag as of 30 June)
Afghanistan 1637 CLAP 58 001 13 Dec 12 08 Apr 13 3.8 0% (6.5) (2.7)
Bangladesh 1585
HILIP - CALIP (LOT) 56 093 15 Sep 11 18 Jul 12 10.1 29 Nov 12 3.5% 14.5 4.4
Bangladesh 1647 CCRIP 40 512 10 Apr 13 28 Jun 13 2.6 0% (2.7) (0.1)
China 1627 HARIIP 47 000 21 Sep 12 21 Sep 12 0.0 0% (9.3) (9.3)
China 1629 YARIP 46 700 13 Dec 12 31 Jan 13 1.6 0% (6.5) (4.9)
Indonesia 1621 CCDP 26 200 21 Sep 12 23 Oct 12 1.1 14 Feb 13 11.2% 4.8 3.7
Maldives 1624 MEDEP 2 487 06 Sep 12 09 Jan 13 4.1 0% (9.8) (5.7)
Nepal 1602 Biu-Bijan 39 000 21 Sep 12 02 Dec 12 2.4 06 Jun 13 11.8% 8.5 6.1
Pakistan 1515 GLLSP 30 000 11 May 11 31 Jan 13 20.7 0% (25.7) (4.9)
Philippines 1475 INREMP 20 000 13 Dec 12 12 Apr 13 3.9 0% (6.5) (2.6)
10 365 993 5.0 Average 9.3 (9.6) 4.7 (4.3)

5
Chart 3: Average period from project approval to EOF/ First disbursement to approval/EOF (Ongoing total projects)
Source: PPMS
0 5 10 15 20
First disb. toentry into
force
First disb.to approval
Approval toEntry into
force
7.7
19.2
11.4
6.5
16.3
9.6
6.5
16
8.9
Months 2012/13 (64) 2011/12 (59) 2010/11 (Ongoing: 55)

6
0
2
4
6
8
10
12
14
16
18
20
2010-11 2011-12 2012-13
4
2 1 1
0 0
5
10 9
20
18 17
16 15
18
10 10
13
4
6 7
Num
ber
of pro
ject
Not signed Not effective < 1 years < 3 years < 5 years < 7 years ≥ 7 years
Table 8: Current ongoing projects with no first disbursement as at 30 June 2013*
Country Project ID
Project Name
Project maturity
(as of 30
June)
Project duration
(as of 30
June)
First disb.
Expected Disb
amount as of 30 June 2013 (SDR
m)
First disb to
approval (lag as of 30 June)
(m)
First disb to entry into force (lag
as 30 June) (m)
China 1627 HARIIP 0.8 5.0 None 1.82 9.3 9.3
China 1629 YARIP 0.4 5.2 None 0.61 6.5 4.9
India 1348-
Top-up PT-Tamil 4.4 8.2 None 4.58 86.4 53.4
India 1617 IULSP 1.4 7.2 None 5.10 18.6 16.9
Maldives 1624 MEDEP 0.5 5.2 None 0.03 9.8 5.7
Pakistan 1514 SPPAP 1.8 5.0 None 3.43 30.5 21
Pakistan 1515 GLLSP 0.4 6.2 None 0.37 4.9 4.9
Total 7 Average lag 23.7 16.6
* Projects that were not yet effective as at 1st April 2013 are not included.
Source: PPMS
Chart 6: Maturity of Portfolio 2010 - 2013
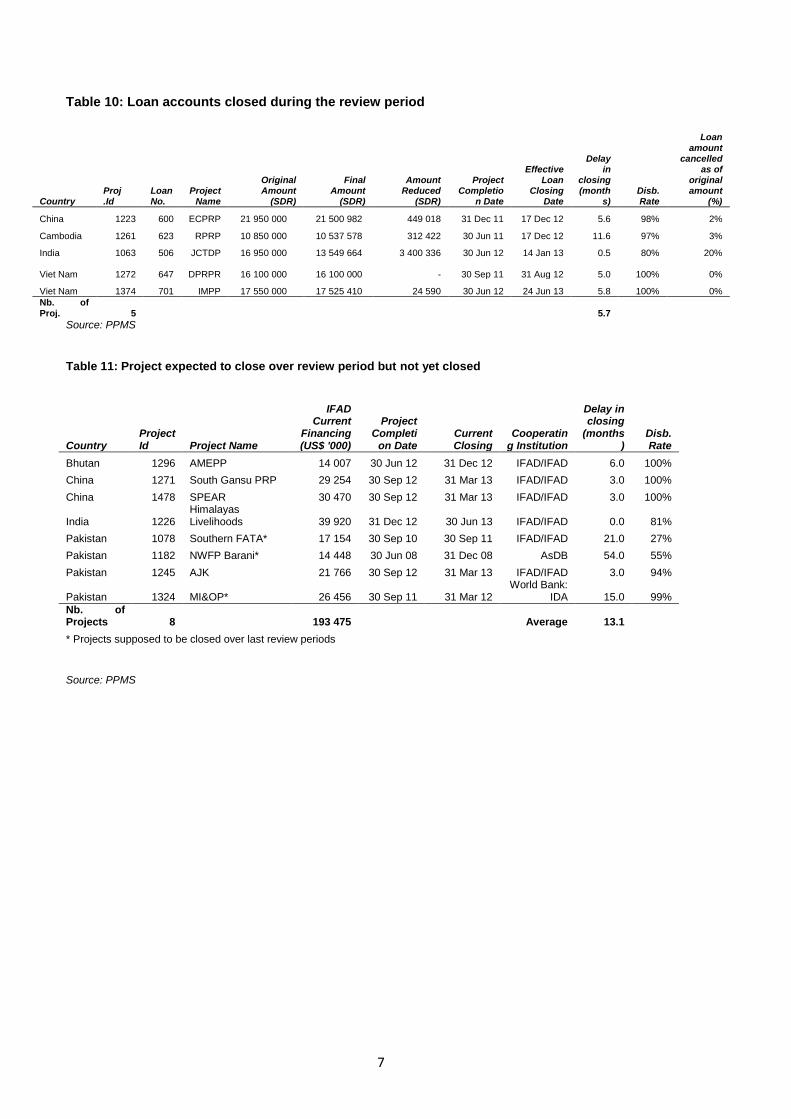
7
Table 10: Loan accounts closed during the review period
Source: PPMS
Table 11: Project expected to close over review period but not yet closed
Source: PPMS
Country Proj .Id
Loan No.
Project Name
Original Amount
(SDR)
Final Amount
(SDR)
Amount Reduced
(SDR)
Project Completio
n Date
Effective Loan
Closing Date
Delay in
closing (month
s) Disb. Rate
Loan amount
cancelled as of
original amount
(%)
China 1223 600 ECPRP 21 950 000 21 500 982 449 018 31 Dec 11 17 Dec 12 5.6 98% 2%
Cambodia 1261 623 RPRP 10 850 000 10 537 578 312 422 30 Jun 11 17 Dec 12 11.6 97% 3%
India 1063 506 JCTDP 16 950 000 13 549 664 3 400 336 30 Jun 12 14 Jan 13 0.5 80% 20%
Viet Nam 1272 647 DPRPR 16 100 000 16 100 000
- 30 Sep 11 31 Aug 12 5.0 100% 0%
Viet Nam 1374 701 IMPP 17 550 000 17 525 410 24 590 30 Jun 12 24 Jun 13 5.8 100% 0%
Nb. of Proj. 5 5.7
Country Project Id Project Name
IFAD Current
Financing (US$ '000)
Project Completi
on Date Current Closing
Cooperating Institution
Delay in closing
(months)
Disb. Rate
Bhutan 1296 AMEPP 14 007 30 Jun 12 31 Dec 12 IFAD/IFAD 6.0 100%
China 1271 South Gansu PRP 29 254 30 Sep 12 31 Mar 13 IFAD/IFAD 3.0 100%
China 1478 SPEAR 30 470 30 Sep 12 31 Mar 13 IFAD/IFAD 3.0 100%
India 1226 Himalayas Livelihoods 39 920 31 Dec 12 30 Jun 13 IFAD/IFAD 0.0 81%
Pakistan 1078 Southern FATA* 17 154 30 Sep 10 30 Sep 11 IFAD/IFAD 21.0 27%
Pakistan 1182 NWFP Barani* 14 448 30 Jun 08 31 Dec 08 AsDB 54.0 55%
Pakistan 1245 AJK 21 766 30 Sep 12 31 Mar 13 IFAD/IFAD 3.0 94%
Pakistan 1324 MI&OP* 26 456 30 Sep 11 31 Mar 12 World Bank:
IDA 15.0 99%
Nb. of Projects 8 193 475 Average 13.1
* Projects supposed to be closed over last review periods

8
Table 12: Project closing over next review period
Country Project Id Project Name
IFAD Current
Financing (US$ '000)
Project Completion
Date Current Closing
Cooperating Institution
Disb. Rate
Bangladesh 1 322 MIDPCR 24 947 30 Sep 13 31 Mar 14 IFAD/IFAD 93%
Bangladesh 1 355 NATP (LOT) 19 450 31 Dec 13 30 Mar 14 World Bank: IDA 70%
Laos 1 396 NRSLLDP 2 994 30 Sep 13 31 Mar 14 AsDB 49%
Maldives 1 347 PT-AFReP 4 296 31 Dec 13 30 Jun 14 IFAD/IFAD 81%
Pakistan 1 413 PRISM 35 006 30 Sep 13 31 Mar 14 IFAD/IFAD 89%
Philippines 1 253 RuMePP 19 130 31 Dec 13 30 Jun 14 IFAD/IFAD 95% Solomon Islands 1 565 RDP 3 996 30 Nov 13 30 Jun 14 World Bank: IDA 94%
Sri Lanka 1 254 Dry Zone 22 311 31 Mar 13 30 Sep 13 World Bank: IDA 99%
Sri Lanka 1 346 PT-CRReMP 29 877 30 Sep 13 31 Mar 14 IFAD/IFAD 94%
Total 9 162 007
Table 13: Extensions granted during reporting period
COUNTRY PROJECT Justification for Extension
Afghanistan* RMLSP RMLSP was originally scheduled for 3 years only. Given the challenging operational context, additional time was sought to consolidate successes and ensure smooth handover of partner responsibilities (e.g. FAO, NGOs, etc) to Government and community organizations.
Original 30-Sep-13
Revised 30-Sep-14
Bangladesh NATP (LOT)
Alignment with World Bank completion date to ensure continued synergetic support to activities, and increased fulfillment of target objectives. Original 31-Mar-13
Revised 31-Dec-13
India OTELP
The Government of Orissa is substantially scaling up this successful programme and sought additional support and accompaniment by IFAD through a 1 year extension Original 31-Mar-13
Revised 31-Mar-14
Maldives* PT-
AFReP Project start-up had been delayed by about 3 years- in part due to political crises. Additional capacity building for community producer organizations and service providers is needed to achieve/sustain project objectives
Original 30-Jun-11
Revised 31-Dec-13
Nepal* WUPAP This Flexible Lending Mechanism (FLM) project released funds according to fulfillment of triggers in 3 phases. These triggers were accomplished with some delays. Extension necessary in line with the phasing philosophy under FLM
Original 31-May-
14
Revised 15-Jul-16
Nepal LFLP LFLP has been a key policy-related project in support of impoverished rural households in Nepal, with important lessons for the Government's strategy on sustainable natural resource utilization. The extension sought to capitalize on emerging opportunities to scale-up the approach and influence policy-making, with a backdrop of cost-savings under the project.
Original 30-Sep-13
Revised 30-Sep-14
Nepal* PAF II
(i) Align with World Bank completion dates and (ii) bridging finance ahead of IFAD supplementary financing.
Original 30-Sep-12
Revised 30-Jun-14
Pakistan PRISM Extension permitted support to the Financial Inclusion Conference organized by PRISM- which included dissemination of its lessons, successes & policy recommendations. The Conference itself had been postponed due to parliamentary elections.
Original 30-Jun-13
Revised 30-Sep-13
* Overrun of more than 15%. In addition Sri Lanka Post Tsunami (SL-1346), extended in 2011, has an overrun of more than 15%.

1
Annex 2
Grants Portfolio Characteristics
Table 1: Number and value of grants, by revised Grants Policy Outputs
Outputs Nb of grants
US$ %
US$
1.Innovative activities promoted and innovative technologies and approaches developed in support of IFAD’s target group
13 14 605 100 41
2. Awareness, advocacy and policy dialogue on issues of importance to poor rural people promoted by, and on behalf of, this target group
3 2 138 000 6
3. Capacity of partner institutions strengthened to deliver a range of services in support of poor rural people
24 17 781 000 50
4. Lesson learning, knowledge management and dissemination of information on issues related to rural poverty reduction promoted
1 1 000 000 3
Total 41 35 524 100 100
Table 2: Relationship of grants to specific investment projects
Chart 1: Number of grants by window
20 17
13
7 4 3
11 10
13
27
20
12
0
5
10
15
20
25
30
2010-11 2011-12 2012-13
NO
. fo
Gra
nts
Large regional Small regional
Large country-specific Small country-specific
Nb of grants
Amount US$ %Amount US$
In loan grants
18 14 425 100 41
Stand-alone grant-project related: Capacity building
8 5 500 000 16
Stand-alone grant- project related: Implementation support
2 838 000 2
Stand-alone grant-project related: Applied Research and studies
5 5 312 000 15
Stand-alone testing of innovations 5 6 399 000 18
Stand-alone grants - Non project related 3 3 050 000 8
Total
41 35 524 100 100

2
Table 3: Grants approved, by window and size
Chart 2: Grants investment by window and size
Table 4a: Grants approved, by Strategic Framework objective
0
5
10
15
20
25
30
35
40
45
2010-11 2011-12 2012-13
58% 59%
48%
3% 3%
4%
21% 23%
36%
18%
15% 12%
US$
Mill
ion
s
Large regional Small regional Large country specific Small country specific
Regional Country Total number Amount (US$)
Large 3 4 7 8 305 100
Small 3 3 6 2 427 000
Total 6 7 13 10 732 100
Amount (US$ )
4 149 000 6 583 100
Objective of grant
Nb grants
Nb Amount
% US$ %
SF1 2 15 1 177 000 11
SF2 3 23 4 306 100 40
SF3 1 8 1 100 000 10
SF4 4 31 3 199 000 30
SF5 NA NA
SF6 2 15 450 000 4
Others (KM) 1 8 500 000 5
Total 13 100 10 732 100 100

3
Table 4b: Grants approved, by Grants Policy Outputs and Strategic Framework Objectives
Innovation Policy
Capacity Building
Knowledge Management
US$
Natural Resource Management 1 1 1 177 000
Improved Ag Technologies 1 2 4 306 100
Financial Services 1 1 100 000
Input & Produce Markets 1 2 1 3 199 000
National Policy and Programming 1 1 450 000
Other 1 500 000
Total value (US$) 2 899 000 300 000 6 383 100 1 150 000 10 732 100
Table 5: Grants approved, by revised Grants Policy expected outputs
Table 6: Age structure of large grant portfolio
Nb of grants not signed/effective
<1 year <2 years
<3 years >= 3 years
TOT
Regional Large
NA 3 6 3 8 20
Large Country
1 4 1 NA 9 15
Outputs Number of grants
Amount
US$ %
1. Innovative activities promoted and innovative technologies and approaches developed in support of IFAD’s target group 3 2 899 000 27
2. Awareness, advocacy and policy dialogue on issues of importance to poor rural people promoted by, and on behalf of, this target group
1 300 000 3
3. Capacity of partner institutions strengthened to deliver a range of services in support of poor rural people
7 6 383 100 59
4. Lesson learning, knowledge management and dissemination of information on issues related to rural poverty reduction promoted
2 1 150 000 11
Total 13 10 732 100
100

4
Table7: Grant closed during the period under review
Grant Type Grant number Closing date Closed on
Large Regional 1179 FAO 30/09/2012 10/05/2013
875 APRACA 30/09/2012 07/12/2012
821 FAO 31/03/2011 17/12/2012
1032 ICRAF 31/03/2013 06/06/2013
Small Regional 1198 IHD 31/03/2012 04/06/2013
Small Country 1063 IRRI 31/05/2012 26/04/2013
1019 TRCB 30/06/2012 09/11/2012
1236 FAO 31/03/2013 18/12/2012
907 MARD 30/09/2011 09/11/2012
914 BT 30/09/2010 18/10/2012
967 IN 31/12/2010 07/02/2013
1085 SRSP 31/12/2010 15/03/2013
1088 SEARCA 31/12/2011 10/10/2012
1090 INTERCAFE 31/12/2011 29/10/2012
Large Country 728 VN 31/03/2012 01/10/2012

1
Annex 3
Investment Portfolio – Financial Data
Project management
Chart 1: Quality of project management (PSR)
Source: PSR - Online
Financial Management
Chart 2: Acceptable disbursement rate (PSR)
Source: PSR - Online
0
10
20
30
40
50
60
70
2010/2011(Average: 3.9)
2011/2012(Average: 4.0)
2012/2013(Average: 4.1)
2% 4% 2% 3%
21% 24% 13%
55% 42% 57%
20% 27% 22%
3% 5%
Nb
. of
pro
ject
Rating 1 Rating 2 Rating 3 Rating 4 Rating 5 Rating 6
0
10
20
30
40
50
60
70
2010/11 2011/12 2012/13
5% 5% 6%
21% 19% 14%
27% 25% 25%
23% 27% 38%
16% 15%
14% 7%
8%
2%
Nb
. Of
pro
ject
Rating 1 Rating 2 Rating 3 Rating 4 Rating 5 Rating 6

2
Chart 3: Annual disbursement (US$ million)
Source: CFS
Chart 4: Disbursement performance: Disbursed vs. Expected disbursement (SDR m)
Source: LGS
-
200
400
600
800
2010/2011 2011/2012 2012/2013
207.9 205.3 179.4
567.8 603.8 699.8
US$
mill
ion
APR IFAD
538.9 496.0 526.4 477.1 428.3 471.8
1 111.0 1 115.7
1 274.5
0
200
400
600
800
1000
1200
1400
2010/2011 2011/2012 2012/2013
SDR
mill
ion
APR disbursement performance
Total Disbursed Expected Disb Total Loan amt

3
Table 1: WA statistics
Country WA average processing
time Number of WAs Amount Paid (US$)
2011/ 2012
2012/ 2013
Dif 2011/ 2012
2012/ 2013
2011/2012 2012/2013 Difference
AFGHANISTAN 29 20
(9) 6 11 3 385 996 7 018 812 3 632 816
BANGLADESH 26 13
(13) 56 62 27 368 602 17 672 127 -9 696 475
BHUTAN 24 19
(5) 9 10 2 875 577 3 177 325 301 748
CAMBODIA 22 21
(1) 9 15 2 161 358 6 998 022 4 836 664
CHINA 36 17
(19) 63 35 43 379 592 35 996 297 -7 383 295
INDIA 40 17
(23) 60 49 24 772 129 33 043 842 8 271 713
INDONESIA 16 20
4 11 21 14 175 191 10 720 879 -3 454 312
LAO PDR 49 11
(38) 42 66 5 883 644 5 766 599 -117 046
MALDIVES 17 15
(2) 9 7 1 469 139 685 827 -783 312
MONGOLIA 24 41
17 2 2 1 533 499 1 347 408 -186 091
NEPAL 22 14
(8) 21 27 7 956 469 7 039 070 -917 399
PAKISTAN 31 20
(11) 18 5 13 436 781 5 851 706 -7 585 075
PAPUA NEW GUINEA
- 13 34 942 930 2 598 651 1 655 721
PHILIPPINES 27 16
(11) 21 30 7 589 880 5 071 274 -2 518 605
SOLOMON ISLANDS
- 11 3 646 076 3 646 076
SRI LANKA 26 17 (9) 65 49 18 344 447 11 148 453 -7 195 994
TIMOR LESTE 16
- 3 1 159 471 1 159 471
TONGA 18
- 2 607 109 607 109
VIET NAM 30 12
(18) 86 40 30 070 400 19 837 364 -10 233 036
APR 28 18
(10) 491 479 205 345 635 179 386 312 -25 959 323
Source: CFS

4
Table 3: Average Disbursement Processing Time (days) during the review period
Country Q3 2012
Q4 2012
Q1 2013
Q2 2013
Average for 2012/13
APR AVERAGE 20 15 19 16 18
AFGHANISTAN 26 22 14 14 20
BANGLADESH 12 11 15 13 13
BHUTAN 24 26 19 10 19
CAMBODIA 18 20 26 18 21
CHINA 26 9 14 10 17
INDIA 22 15 15 15 17
INDONESIA 16 8 25 18 20
LAO PDR 13 11 11
MALDIVES 14 14 18 15
MONGOLIA 41 41
NEPAL 55 36 43 14 39
PAKISTAN 18 11 28 20
PHILIPPINES 21 9 17 19 16
SRI LANKA 20 12 18 18 17
TIMOR LESTE 1 23 16
TONGA 10 25 18
VIET NAM 16 12 7 8 12
Note: Projects administered by Cooperating Institutions are not included such as Papua New Guinea and Solomon Islands. (Source: CFS)
Chart 6: Average disbursement processing times
Source: CFS
70
28
18
0
10
20
30
40
50
60
70
80
2010/2011 2011/2012 2012/2013
Nu
mb
er
of
day
s

5
Chart 7: Average amount of WA (US$)
Source: CFS Table 4 : Loan Reduction during the review period
Borrower Loan no.
Closing Date
Effective Closing Date
Cancellation/Reduction Reduction in SDRs
Effective Date in LGS
CAMBODIA 623 31/12/2011 17/12/2012 17/12/2012 -312 422.24
CHINA 600 30/06/2012 17/12/2012 17/12/2012 -449 018.16
CHINA 778 31/03/2013 21/02/2013 -1.07
INDIA 506 31/12/2012 14/01/2013 18/12/2012 -335.91
PAKISTAN 554 31/03/2011 18/12/2012 -758 394.91
PAKISTAN 558 31/12/2009 18/12/2012 -219 924.02
PAKISTAN 683 31/03/2012 17/12/2012 -266 395.91
Total Reduction Amount
-2 006 492.22
Source: CFS
APR Audit reports basic data for the period 01 July 2012 – 30 June 2013 (AS AT 05/07/2013)
528 901
418 219 374 502
279 685 258 810 320 418
0
100 000
200 000
300 000
400 000
500 000
600 000
2010/2011 2011/2012 2012/2013
US$
APR IFAD

6
Chart 8 : Timely receipt and type of opinion
Source: CFS Chart 9: Type of audit institution and standards used to perform the audit
Source: CFS Chart 10 : Type of accounting standards used by projects to account and prepare financial reports
Source: CFS
33%
12%
55%
67%
Timely receipt of audit reports and type of opinion (as at 30/06/2013)
19 audit reports due not received38 audit reports due received7 audit report qualified31 audit reports unqualified
type of opinion timely receipt of audit reports
unqualified
qualified
received not received
11 Public Auditors used ISA/INTOSAI
29%
6 Public Auditor used non-
ISA/INTOSAI 16%
13 Private Auditors used
ISA 34%
8 Private Auditor used non-ISA
21%
11 Public Auditors usedISA/INTOSAI
6 Public Auditor used non-ISA/INTOSAI
13 Private Auditors used ISA
8 Private Auditor used non-ISA
13%
18%
36%
2%
31%
5 projects used IFRS
7 projects used IPSAS
14 projects used cash basis
1 project used mod.cash basis
11 projects used Gov.Standards

7
Table 8: CFS – Audit reports assessment
Country Financial products
Submitted
official
reports
Cooperating
institutionDue date
Process
status
Inherent
Risk rating
YES NO Mandatory Significant Minor Fin.stats. WAs Spec.Acc. Fin.stats. WAs Spec.Acc.
Afghanistan G-I-DSF-8033- YES IFAD/IFAD 20/06/2013 Active medium X X X X X
Bangladesh L-I--567- YES IFAD/IFAD 30/12/2012 Active medium X X X X X
Bangladesh L-I--681-,G-C-NL-681- YES IFAD/IFAD 30/12/2012 Active medium X X X X X
Bangladesh L-I--725- YES IFAD/IFAD 30/12/2012 Active low X X X X X
Bangladesh L-I--739- YES World Bank 30/12/2012 Active medium X X X NO OPIN NO OPIN
Bangladesh L-I--644- YES IFAD/IFAD 30/12/2012 Active low X X X X X
Bangladesh L-I--609- YES IFAD/IFAD 30/12/2012 Active low X X X X X
Bangladesh L-I--807- YES IFAD/IFAD 30/12/2012 Active medium X X X X X-NO SEP
Bhutan L-I--659-,G-I-C-780- YES IFAD/IFAD 30/12/2012 Active medium X X X NO OPIN NO OPIN
Bhutan L-I--824-,G-C-SEC-824- YES IFAD/IFAD 30/12/2012 Active medium X X X NO OPIN NO OPIN
Cambodia G-I-DSF-8005- NO IFAD/IFAD 30/06/2013 Active -
Cambodia L-I--793-,G-I-DRF-8048- NO IFAD/IFAD 30/06/2013 Active -
China L-I--740- YES IFAD/IFAD 30/06/2013 Active - X X X X X
China L-I--673- NO IFAD/IFAD 30/06/2013 Active -
China L-I--709- YES IFAD/IFAD 30/06/2013 Active - X X X X X
China L-I--778-,G-I-C-1105- YES IFAD/IFAD 30/06/2013 Active - X X X X X
China L-I--766- YES IFAD/IFAD 30/06/2013 Active - X X X X X
India L-I--710- YES IFAD/IFAD 30/09/2012 Active medium X X X X X
India L-I--506- YES IFAD/IFAD 30/09/2012 Suspended medium X X X X X
India L-I--585-,G-C-GB-585- YES IFAD/IFAD 30/09/2012 Active medium X X X X X
India L-I--624-,G-I-C-967- YES IFAD/IFAD 30/09/2012 Active medium X X X X X
India L-I--662- YES IFAD/IFAD 30/09/2012 Active medium X X X X X
India L-I--682- YES IFAD/IFAD 30/09/2012 Active medium X X X X X
India L-I--748-,G-I-C-1029- YES IFAD/IFAD 30/09/2012 Active medium X X X X X
India L-I--779-,G-I-C-1106- YES IFAD/IFAD 30/09/2012 Active low X X X X X
India L-I--794- YES IFAD/IFAD 30/09/2012 Active low X X X X X
Indonesia L-I--645-,G-I-C-726- NO IFAD/IFAD 30/06/2013 Active -
Indonesia L-I--755-,G-I-C-1053- NO World Bank 30/06/2012 Active -
Indonesia L-I--835-,G-I-C-835- NO IFAD/IFAD 30/06/2013 Active -
Laos G-I-DSF-8089 YES IFAD/IFAD 30/03/2013 Active medium X X X X X
Laos L-I--711- NO AsDB 30/03/2013 Active -
Laos G-I-DSF-8025- NO AsDB 30/03/2013 Active -
Laos L-I--660-,G-I-C-781- YES IFAD/IFAD 30/03/2013 Active medium X X X X-NO SEP X
Maldives L-I--692, L-I--663 NO IFAD/IFAD 30/06/2013 Active -
Maldives L-I--726- NO IFAD/IFAD 30/06/2013 Active -
Mongolia L-I-836-,G-G-FSS-1- NO IFAD/IFAD 30/06/2013 Active -
Nepal L-I--796-,G-I-DSF-8050- YES IFAD/IFAD 14/01/2013 Active medium X X X X-NO SEP X
Nepal L-I--576-,G-I-C-567- YES IFAD/IFAD 14/01/2013 Active medium X X X X X
Nepal L-I--646-,G-I-C-727- YES IFAD/IFAD 14/01/2013 Active medium X X X X X
Nepal G-I-DSF-8014- YES World Bank 14/01/2013 Active - X X X X-NO SEP X
Major
control/fin.manan
gement issues
Action plan to be implemented Unqualified Qualified

8
Country Financial products
Submitted
official
reports
Cooperating
institutionDue date
Process
status
Inherent
Risk rating
YES NO Mandatory Significant Minor Fin.stats. WAs Spec.Acc. Fin.stats. WAs Spec.Acc.
Pakistan L-I-554 YES IFAD/IFAD 30/12/2012 Suspended medium X X X X X
Pakistan L-I--727- YES IFAD/IFAD 30/12/2012 Active medium X X X X X
Pakistan L-I--625- YES IFAD/IFAD 30/12/2012 Active medium X X X X X
Papua New Guinea l-I-809- NO World Bank 30/06/2013 Active -
Philippines L-I--661-,G-I-C-782- NO IFAD/IFAD 30/06/2013 Active -
Philippines L-I-749- YES IFAD/IFAD 30/06/2013 Active - X X X X X
Philippines L-I--767-,G-C-EC-767- NO IFAD/IFAD 30/06/2013 Active -
Solomon Islands G-I-DSF-8070- NO World Bank 30/06/2013 Active -
Sri Lanka L-I--797- NO IFAD/IFAD 30/06/2013 Active -
Sri Lanka L-I--636-,G-I-C-712- NO World Bank 30/06/2013 Active -
Sri Lanka L-I--664-,G-C-CDN-664- NO IFAD/IFAD 30/06/2013 Active -
Sri Lanka L-I--712- NO IFAD/IFAD 30/06/2013 Active -
Viet Nam L-I--768, G-GEF-FSP-19 YES IFAD/IFAD 30/06/2013 Active - X X X X X
Viet Nam L-I--701-,G-I-C-872- YES IFAD/IFAD 30/06/2013 Active medium X X X X X
Viet Nam L-I--741-,G-I-C-997- YES IFAD/IFAD 30/06/2013 Active - X X X X X
Viet Nam L-I--810-,G-I-C-1200- YES IFAD/IFAD 30/06/2013 Active medium X X X X X
Viet Nam L-I--826-,G-I-C-826- YES IFAD/IFAD 30/06/2013 Active - X X X X X
Major
control/fin.manan
gement issues
Action plan to be implemented Unqualified Qualified

1
Annex 4
Effectiveness Data
Results of the on-going portfolio
Chart 4 : Project impact on child malnutrition (RIMS)
Source: RIMS On-Online
Chart 5 : Impact domain: Food security and agricultural productivity
Source: RIMS On-line
0
10
20
30
40
50
60
Baseline Completion
Pe
rce
nta
ge
Chronic malnutrition (boys) Chronic malnutrition (girls)
Underweight (boys) Underweight (girls)
Acute malnutrition (boys) Acute malnutrition (girls)
0
5
10
15
20
25
30
35
40
% of HH suffering from first hungry season % of HH suffering from second hungryseason
Food security
Baseline Completion

2
Chart 6 : Impact domain : Human and social capital empowerment
Source: RIMS On-line
Table 1a: Findings of RIMS Survey Quality Reviews in Philippines and Viet Nam
Data quality issues observed Recommendations
Validity 1. In some project areas the sample size is inadequate, which may affect the representativeness of collected data;
2. There are doubts as to whether enumerators or data collectors were adequately trained. Also, there were cases of losing trained enumerators, who were replaced by untrained data collectors. In some cases, project teams faced turnover of trained enumerators due to late commencement of data collection.
3. Sampling errors are not estimated. 4. Estimation of indicators for the whole population
is not performed.
1. The sample size needs to be varied depending on population size and other parameters, rather than being standardized.
2. Enumerators need to be selected in advance by investigating their background, experience in data collection, knowledge of local place or people, etc.
3. Data collection phase needs to be started on schedule to avoid losing trained personnel;
4. Existing or potential sources of error for each indicator should be identified and, if possible, documented in IFAD’s RIMS Practical Guidance;
5. Sampling errors need to be estimated for all indicators on the basis of accuracy.
6. Parameters for the whole population need to be estimated using statistics from the RIMS survey.
Integrity There are indications that transcription errors may have occurred during data collection, data entry and data transfer. The number of observations in reports do not match the number in the dataset; and the number varies from one table to another.
1. If possible, all the indicators or indices need to be estimated by project team;
2. If IFAD continues to receive raw data from project teams and estimate indicators or create analytical tables, then IFAD needs to perform a data quality check on received raw data.
Precision The margin of error is not presented. This measure indicates the extent to which data can provide a basis for decisions on interventions.
Margins of error and variation statistics need to be estimated.
29.85
67.21
43.24
75.10
0
10
20
30
40
50
60
70
80
% of HH with access to safe sanitation % of HH with access to safe drinking water
Sanitation and water
Baseline Completion

3
Reliability 1. Reporting of indicators is generally quite descriptive.
2. It is difficult to assess the reliability of data collected in baseline and end-line survey by comparing dates and data collection processes.
3. In some cases there is inconsistency in the analysis of indicators (e.g. if the proportion of HHs experiencing hungry season is higher in project area than that in non-project area, we would expect higher malnutrition indicators in project area).
4. Inappropriate comparisons are made done against secondary data without knowledge of the reference period, coverage or methodology for estimating secondary data.
1. Other analytical tools (variation, quartiles, cross tabulation, scatter plots etc.) of descriptive analysis should be employed in the analysis of child malnutrition, relative wealth index, food security and HH characteristics.
2. Baseline and completion survey dates should be included in the completion survey report.
3. A table should be created that illustrates data collection processes at baseline & completion.
4. Association analysis (chi-square, scatter plot etc.) among related indicators needs to be carried out.
5. Project teams need to be trained on basic tools of statistical analysis.
6. The reference period, coverage and methodology of estimation of secondary data have to be known to people who intend to use secondary data in RIMS survey report.
Timeliness 1. There have been delays in conducting baseline surveys.
2. The timing of conducting end-line surveys seems to differ from that of baseline surveys, limiting comparability.
1. Baseline surveys need to be scheduled and undertaken within a project's first 6 months.
2. The mid-term and completion surveys need to be conducted in the same months as the baseline survey.
Table 1b: Performance against RMF indicators
Increased income Improved food security Empowerment Aid effectiveness agenda
Country 2012-2013 2011-2012 2012-2013 2011-2012 2012-2013 2011-2012 2012-2013 2011-2012
Afghanistan 4 4 4 4 5 5 4 5
Bangladesh 5 4 5 5 4 5 5 4
Bhutan 5 5 5 5 5 4 3 4
Cambodia 5 5 5 5 5 5 4 4
China 5 5 5 5 4 5 4 4
India 4 4 4 4 4 4 4 4
Indonesia 4 3 3.5 3 4 4 4 5
Kyrgystan 4 5 5 5
Lao 4 4 4 4 4 4 4 4
Maldives 3 3 3 1 4 1 na na
Mongolia 4 4 5 5 5 5 5 5
Nepal 4 4 4 4 5 4 5 4
Pacific Islands 4 4 4 4 4 4 4 4
Pakistan 5 4 4 4 4 4 5 4
Philippines 4 5 4 5 6 5 6 5
Sri Lanka 4 4 4 4 3 3 na na
Tajikistan 3 3 3 5
Vietnam 4 4 4 4 5 4 4 4
Average 4,25 4,06 4,00 4,11 4,44 4,11 4,36 4,38

4
Table 2: Project’s innovations
BD 1165 SCBRMP Adaptation to the seasonal changed between dry and flood seasons, including construction of innovative submersible das used for dry season water conservation and irrigation, innovative cement concrete block road construction and promotion of commercial jujube gardens.
BD 1322 MIDPCR labour contracting societies (LCS) for construction works, highly systematic approaches to value chain development
BD 1355 NATP
BD 1402 FEDEC Introduction of pesticide-free vegetable production; scaling-up/mainstreaming of livestock health cards; and the development of fish and seafood culture as a complementary activity to rice culture in paddy fields or floodplains
BT 1482 MAGIP Use of low cost electric fences to reduce damage to crops by wild animals
CN1271 South Gansu Delegation of technical training to relevant farmer cooperatives and development of a post-project scheme to increase sustainability of project effects.
CN1323 XUARMRDP Development of organic agriculture in extremely remote areas which are isolated from the local economy.
CN1478 SPEARP Use of fibreglass covers in the construction of biogas digesters, instead of using conventional concrete covers (which has improved the quality of biogas systems and reduced leakages, increasing the life span of the systems); Selection of biogas system engineers by the representatives of target groups, village committees and governments of township and county levels
IN 1155 OTELP Community based adult literacy trainers
NP 1285 LFLP Development of formal 40 year leasehold agreement of degraded forest areas for groups of poor households, which demonstrates the positive effect on poverty achieved by leasehold approaches to natural resources.
PK 1413 PRISM Development of innovative microfinance products including livestock and index-based crop insurance, as well as MIS monitoring & evaluation system
PH 1253 RuMEPP Adoption of an integrated value chain cluster-based approach to microenterprise development, assisted by local government units and the private sector.
SI 1565 SIRDP
LK 1346 PTSCRRMP District entrepreneur cooperatives and women’s group savings
Portfolio at risk

5
Table 3: PAR Country Program 2011 - 2013
2010/2011 2011/2012 2012/2013
Country NAR
PPP
APP
Total
PAR
NAR
PPP
APP
Total
PAR
NAR
PPP
APP
Total
PAR*
Afghanistan 1 0 0 1 5 1 0 0 1 6 1 0 0 1 6
Bangladesh 7 0 0 7 5 6 0 0 6 5 7 0 0 7 6
Bhutan 1 0 0 1 6 2 0 0 2 6 1 0 0 1 6
Cambodia 2 0 1 3 5 1 0 1 2 4 2 0 1 3 4
China 6 0 0 6 6 5 0 1 6 5 6 1 0 7 5
India 5 1 3 9 3 7 0 2 9 3 7 0 2 9 4
Indonesia 0 0 2 2 3 2 1 0 3 3 4 0 0 4 5
Laos 0 2 1 3 3 1 2 1 4 2 3 0 1 4 4
Maldives 0 0 2 2 3 0 0 2 2 na 1 1 0 2 3
Mongolia 1 0 0 1 6 1 0 0 1 na 1 0 0 1 6
Nepal 2 1 1 4 3 4 0 0 4 4 4 0 1 5 4
Pakistan 3 0 1 4 4 4 0 0 4 4 2 0 1 3 4
Papua New Guinea 1 0 0 1 4 1 0 0 1 6 1 0 0 1 6
Philippines 3 0 0 3 6 2 0 1 3 5 2 0 1 3 4
Solomon Islands 4 1 0 0 1 4 1 0 0 1 6
Sri Lanka 2 0 2 4 3 3 0 1 4 4 3 1 1 5 3
Timor-Leste 4 1 0 0 1 5
Tonga 1 0 0 1 5
Viet Nam 3 0 2 5 3 3 1 2 6 3 3 0 1 4 4
Total (Average for PAR) 37 4 15 56 4.2 44 4 11 59 4.3 51 3 9 63 4.7
% 66% 7%
27%
75% 7%
19%
81% 5%
14%
* Estimated PAR for 2013
Source: PSR On-line
Table 4: PSR Indicators Risk Flags
Nb of projects with a score of 1, 2 or 3 (Risk flags)
Performance areas 2010/2011 2011/2012 2012/2013
Acceptable disbursement rate 30 54% 29 49% 29 46%
Performance of M&E 22 39% 27 46% 18 29% Coherence between AWPB & implementation 18 32% 19 32% 17 27%
Exit strategy 18 32% 18 31% 15 24%
Quality of financial management 23 41% 21 36% 14 22%
Counterpart funds 7 13% 8 14% 12 19%
Innovation and learning 14 25% 12 20% 12 19%
Responsiveness of service providers 16 29% 14 24% 12 19%
Quality and timeliness of audits 16 29% 14 24% 11 17%
Quality of project management 14 25% 16 27% 10 16%
Institution building 14 25% 16 27% 10 16%
No. projects with > 3 risk flags & total share 18 32% 16 27% 14 22%
Total nb. PSRs completed 56 59 63 Source: PSR On-line

6
Pro-activity and reduced risk
Table 5: Pro-activity (Complete list of 2011-2012 APP)
Country Proj. ID
Project Name
Proactivity Index
2011/2012 Actual
problem projects
2012/2013 Project status
1 Cambodia 1464 TSPRSDP APP APP
2 China 1454 DAPRP APP PPP
3 India 1314 TWEP APP NAR
4 India 1418 MPOWER APP APP
5 Laos 1459 SNRMP APP APP
6 Maldives 1347 PT-AFReP APP NAR
7 Maldives 1377 FADIP APP PPP
8 Pakistan 1494 CMSP APP Cancelled
9 Philippines 1395 CHARMP II APP APP
10 Sri Lanka 1316 SPEnDP APP PPP
11 Viet Nam 1422 DBRPP APP NAR
12 Viet Nam 1483 3EM APP APP
Total 12 Proactivity Index 58%
* Tajikistan KLSP (Actual problem) was transferred to NEN division on 1st June 2012 and is excluded

7
Table 7 : Actual and Potential Problem Projects 2012/2013
Actual and Potential Problem Projects 2012/2013
Country Project ID Project Name
Date EB approval
Completion date
Nb of years left
Problem project last year?
Nb, of risk factors
Actual problem
Cambodia 1464 Tonle Sap Poverty Reduction and Smallholder Development Project 17-Dec-09 31-Aug-17 4.2 yes 7
India 1381 Women's Empowerment and Livelihoods Programme in the Mid-Gangetic Plains 14-Dec-06 31-Dec-17 4.5 no 5
India 1418 Mitigating Poverty in Western Rajasthan Project 24-Apr-08 31-Dec-14 1.5 yes 8
Laos 1459 Sustainable Natural Resource Management and Productivity Enhancement Project 17-Dec-08 30-Sep-16 3.3 yes 2
Nepal 1119 Western Uplands Poverty Alleviation Project 06-Dec-01 15-Jul-16 3.0 no 4
Pakistan 1514 Southern Punjab Poverty Alleviation Project 15-Dec-10 30-Sep-16 3.3 no 2
Philippines 1395 Second Cordillera Highland Agricultural Resource Management Project 24-Apr-08 31-Dec-15 2.5 yes 5
Sri Lanka 1457 National Agribusiness Development Programme 17-Dec-09 31-Mar-15 1.8 no 7
Viet Nam 1483 Project for the Economic Empowerment of Ethnic Minorities in Poor Communes of Dak Nong Province 22-Apr-10 31-Dec-16 3.5 yes 4
Total 9 3.1 4.9
Potential problem
China 1454 Dabieshan Area Poverty Reduction Programme 17-Dec-08 30-Sep-15 2.3 yes 5
Maldives 1377 Fisheries and Agricultural Diversification Programme 12-Sep-07 30-Sep-14 1.3 yes 5
Sri Lanka 1316 Smallholder Plantations Entrepreneurship Development Programme 14-Dec-06 31-Dec-17 4.5 yes 5
Total 3 2.7 5

Enabling poor rural people to overcome poverty
Portfolio Performance ReportAnnual Review 2012-2013
ASIA AND THE PACIFIC DIVISION
July 2013
VOLUME I

Enabling poor rural people to overcome poverty
Portfolio Performance ReportAnnual Review 2012-2013
ASIA AND THE PACIFIC DIVISION
July 2013
VOLUME II