ashok k. lahiri saumen chattopadhyay anuradha bhasin
TRANSCRIPT

SIKKIMThe People’s Vision
ASHOK K. LAHIRI SAUMEN CHATTOPADHYAY ANURADHA BHASIN
in association with
A. PREMCHAND SUBIR ROY
G O V ER N M EN T OF SIKKIM , g a n g t o k
in association with
INDUS PUBLISHING COMPANY, NEW DELHI

Published by Indus Publishing Company
FS-5, Tagore Garden, New Delhi 110027 Ph.: 5151333, 5935289
E-mail: [email protected] and
Government of Sikkim, Gangtok
Copyright © 2001 Planning and Development Department, Government of Sikkim, Gangtok
ISBN 81-7387-123-X
All rights reserved. No part of this book may be reproduced in any manner without written permission of the publisher.
Printed at B.B.N. Printers, Najafgarh Road Indl. Area, New Delhi

F orew o rd
‘Sikkim—the People's Vision’ is about the people and for the people of Sikkim. This document is also a substantive example of transparent functioning of the State. It has not hidden anything but has had a hard and dispassionate look at what we are at the turn of the century. It has captured facts and figures as much as other details. We now have a benchmark from where we can continue to measure our progress well into the 21st century. This is perhaps the greatest aspect of this book and exercise.
It is indeed wonderful that we have been able to make this document happen. It is due to the tireless work of the authors that this has come to see the light of day. This document provides us with an excellent futuristic perspective of Sikkim. I would like to acknowledge the contribution of Dr. Ashok K. Lahiri, Director, National Institute of Public Finance & Policy (NIPFP) and his team in the preparation of this vital document.
We are working toward documenting our old values with new and contemporary thinking. We have a lot to imbibe in terms of wisdom from our tradition and culture. Much of it is lost in the march toward uncontrolled development.
We are not only looking at economic development per se. We are for the overall improvement of the quality of life of the people of Sikkim so that in the process they become much more resilient and competitive. The world is demanding this and we have but little choice in terms of these parameters. However, in this process we must not lose sight of our overall goal of seeing that our biodiversity, our environment and our culture are kept intact, perhaps enriched. This calls for a balanced approach to development.
The key to this is to be able to control our population growth. We hope to achieve a constant population figure of 5 lakhs by the year 2050. We can do this by a ‘we two, our one’ policy that we need to foster and encourage. Our people must enjoy the best health that is possible today; the best of education that should be within the reach of our people and also the best in terms of development benefits. The purchasing power must and will improve.
After Sikkim became the 22nd State.of India in 1975, the State made remarkable strides in all fronts. The basic indicators in economic, social, cultural, environmental and political arena are quite revealing. The Human Development Index which has consistently improved from 0.454 in 1991 to 0.532 in 1998 in Sikkim is also significantly higher than many other States of India. This is recorded and published in another landmark report, The Sikkim Human Development Report 2001, produced by our Government. Another noted economist, Dr. Mahendra P. Lama, Professor, Jawaharlal Nehru University, New Delhi, has prepared this report.
We have conserved our ecology without jeopardizing the development needs. Our State has been one of the most peaceful States in the country with a very high degree of political stability and unparalleled socio-communal harmony. There is political consensus on major issues including that of adopting second- generation economic reforms to make the Sikkimese economy more dynamic and competitive.

6 Sikkim: The People \s Vision
The challenges ahead are diverse and formidable. They are primarily brought about by a new paradigm of development we are now increasingly advocating. Under this new development instruments, the role of State will be increasingly diminished. We strongly desire that the market-oriented development interventions we are now designing and implementing should inevitably cater to the needs and aspirations of the people. We have no other alternative than to keep aside the popular apprehensions and work towards maximizing the gains.
On the other hand, no one is sure about the real impact of the ongoing process of globalisation. It is quite expected that Sikkim will also be both positively and adversely affected by this worldwide phenomenon. Our State being a small, landlocked and developing one, we have always tried to protect it from the external shocks. A critical question is that of meeting and tackling these challenges without adversely affecting the present political economy and traditional socio-cultural norms and practices.
Therefore, we have to gear up ourselves on all fronts. We need to devise very effective institutional responses. We are moving towards more scientific management of our economy aimed at changing the entire face of governance, productivity and efficiency in the State.
Sikkim is now being repositioned by indigenising and internalising the entire process of globalisation which are primarily triggered by forces that are actual alien to our system. This is a Herculean task for us in Sikkim. We want each segment of Sikkim and every Sikkimese to be comfortable with the globalisation process.
This is why we would like to build on our strengths like high socio-economic indicators, friendly and congenial social atmosphere, democratic freedom based on sound principles of decentralisation and empowerment of have-nots, and most crucially environmental security. The political stability and existence of strong multi-culturalism based on well-established traditions of secularism are also our great advantages.
Like many other States in India and many other communities, we do have systemic weakness. We would like to decimate all of them without underplaying them. We in the government are fully aware of critical issues like fiscal prudence, employment strategy, environmental dislocation, privatization and disinvestments, demographic onslaughts, service deliveries, persistent poverty and inequality syndrome raised in this report. In fact, my Government has been keenly promoting democratic values and institutions that are aimed at doing away with all these inherited inequality and deprivation.
We are committed to consistently and effectively implement at least some of the very critical and useful recommendations. We have planned a very time-bound implementation of these recommendations. The process has already begun.
As the head of the Government and also an all-season friend of the downtrodden and hapless, I would like to dedicate this document to the People of Sikkim who discovered, nurtured, built and provided this distinct stature to this Himalayan State. The villages are the greatest asset and strength of the Sikkimese society. We will ensure that every Sikkimese is going to be an equal partner in both the process of participating in and sharing the benefits of development process.
I would also like to assure the people of Sikkim in particular and the people of India in general that we will all work towards making Sikkim a model State in the country where every citizen will live to his and her full potential both as a human being and a responsible citizen of this great nation.
Gangtok
1 August 2001
P a w a n C h a m lin g
Chief Minister of Sikkim
A c k n o w led g em en ts
We would like to express our appreciation for the co-operation extended to us by the officials of the Government of Sikkim. Our extensive discussions with people from different government ministries and departments and from various institutes were invaluable in the preparation of this document. A list of those we met and would like to thank follows.
Task force reports prepared by the departments of Animal Husbandry and Veterinary Sciences, Horticulture, Education, Health and Family Welfare, Tourism, Public Works, Urban Development and Housing, Industries and Power, and material supplied by the Department of Finance provided basic information and data for the report.
We would also like to thank Mr. S.W. Tenzing, Chief Secretary, Government of Sikkim for his help during our visits to the state and for his insights into major aspects of the Sikkimese economy.
Mr. G. Goparma, current Director and Mr. Chettri, former Director of the Bureau of Economics and Statistics provided us with support during our visit to the state. Mrs. Jyotsna Subba, Deputy Director of the Bureau of Economics and Statistics, was extremely helpful in organising meetings and travel around the state and as a resource person for supplying data for the report. Mr. S. Mitra, Joint Director, Bureau of Economics and Statistics has been helpful in providing us with the necessary help. Mr. Suresh Lamichaney, of the Bureau of Economics and Statistics, who accompanied us on our trip to the South and West Districts, was a valuable source of information on the state.
Dr. Indira Rajaraman, Professor, NIPFP, provided extremely useful comments on the structure and content of the report. Secretarial assistance was given by Mr. R. Parmeswaran. We would like to express our thanks to Ms. Jeeta Mohanty for her research assistance in the final stage of the Report preparation.
A shok K. L ahiri
S aum en C hattopadhyay
A nuradh a B hasin

8 Sikkim: The People \s Vision
Hon’ble Chief Minister, Mr. Pawan Chamling
Mr. Gyaltsen, Hon’ble Minister for Tourism and Land Revenue
Mr. P.T. Gyamtso, Secretary to Chief MinisterMr. B.B. Gooroong, Political Advisor to the Chief MinisterMr. A.W.K. Langstael, Accountant General
Mr. Sonam Wangdi, Chief SecretaryMr. Alok Rawat, Resident CommissionerMr. Tashi Tobden, Principal Secretary, Finance
Mr. Rinzing, Secretary, LawMr. Tashi Densapa, Secretary (formerly Tourism)Mr. G.K. Gurung, Secretary, AgricultureMr. H.R. Pradhan, Secretary, HorticultureMs. C.K. Cintury, Secretary, IndustriesMr. P.P. Kharel, Secretary, PowerMr. T.T. Dorjee, Secretary, Health and EducationMr. G.K. Subba, Secretary, Animal HusbandryMr. Karma Gyatso, Secretary, TourismMr. L.B. Rai, Secretary, Urban DevelopmentMr. S. Basi, Secretary, Co-operativesMr. N.S. Lepcha, PCE-cum-Secretary, Roads and Bridges
Mr. Rudra Pradhan, Director, Budget and FinanceMr. Pintso Bhutia, Director, Pay and AccountsMr. S. Pauljor, Principal Director, Animal HusbandryMr. P.P. Sharma, Director (Veterinary Services), Animal HusbandryMr. A.K. Singh, Joint Director (Dairy), Animal HusbandryMr. S.K. Pradhan, Director, Health and Family WelfareMr. B.B. Subba, District Development Officer, GayzingMr. M.B. Gurung, District Engineer (East), Roads and Bridges
Mr. T.M. Roy, Deputy Accountant General
Mr. P.S. Banerjee, Deputy General Manager, NABARDMr. K.K. Bhaduri, Chief Manager, State Bank of IndiaMr. S.K. Bhattacharya, Assistant General Manager, State Bank of IndiaMr. K.B. Chhetri, Chairman-cum-Managing Director, State Bank of Sikkim
Mr. M.P. Chamling, Manager, Temi Tea Estate

Acknowledgements
Mr. H.P. Chhetri, Director, State Institute of Rural Development, KarfectorDr. D.K. Pradhan, Senior Veterinary Officer, Animal Husbandry Farm, KarfectorMr. T.B. Subba, Sikkim Co-operative Milk Producers’ UnionMr. M.G. Kiran, Director, Industries, Managing Director, SIDICOMr. C. Raju, General Manager, SIDICOMr. Taga Khampa, MD, SITCOMr. A.D. Mishra, General Manager, State Tourism Development Corporation
Mr. Panniker, Principal, Pelling Senior Secondary School, West District Mr. R. Kumar, Joint Director, State Institute of Education Mr. Sharma, DIETMr. K.R. Chakravorty, HoD, Political Science, Sikkim Government CollegeMr. K.S. Brar, Lt. Col SOI (Res) Chief Engineer, Project SwastikMs. N. Yethenpa, Addl Secretary, P & DMr. T. Sharma, Joint Director, P & DMr. Lama, Research Officer, P & DMr. S.K. Pradhan, Research Officer, P & D
Bureau of Economics and StatisticsMr. N.S. Alley, Deputy Director Mr. S. Mitra, Joint Director Mr. B.B. Bagdas, Asst. Director Mr. K.P. Gupta, DSO (Namchi)Mr. R.R. Nepal, Section Officer Mr. D.K. Chettri, Section Officer Mr. P. Bhutia, Statistical Assistant Mr. W.T. Bhutia, Statistical Assistant Mr. R. Gyatsho, Computer Assistant Ms. Kunzang Lhamu
Mr. D.K. Mukhopadhyay, Director (SP), Planning Commission, New Delhi Dr. Mahendra P. Lama, Professor, Jawaharlal Nehru University, New Delhi Mr. P.D. Rai, Managing Director, Sikkim Computers, Gangtok Mr. M.L. Lakhotia, Managing Director, Tashi Delek Hotel, Gangtok
Mr. Vinay Sheel Oberoi, United Nations Development Programme, New Delhi

C o n ten ts
Foreword 5
Acknowledgements 7
Executive Summary 15
Chapter 1 Vision for Sikkim: Goals and Objectives 20
Chapter 2 Background: Recent Trends and Emerging Issues 23
2.1 Human Development: A Satisfactory Record 23
2.2 Unfulfilled Potential: Some Sectors—Performance, Promise and Potential 31
2.3 Unplanned Development 38
2.4 Anomalies of Growth 42
2.5 State Finances: Government Under Pressure 44
2.6 Business as Usual: Unsustainable and Precarious 50
Chapter 3 Fulfilling the Vision 57
3.1 Economic Strategy 57
3.2 Strategy: The Fiscal Components 65
3.3 Strategy: The Sectoral Components 72
3.4 Role of the Public Sector: Pursuit of Progress with Stability,Equity and Efficiency 81
3.5 Role of the Private Sector 93
3.6 Role of the Community 95
3.7 Role of Technology in the Delivery of Selected Services 97
3.8 Laying the Foundation in Secondary Schools 98
References and Bibliography 99
Appendix Tables 103
Index 140

12 Sikkim: The People’s Vision
List of Boxes
1.1 A Historical Entrepot 202.1 Regional Disparities 272.2 Better Education Means Better Health Care 282.3 Tuberculosis is a Killer 312.4 World Demand for Livestock Products 352.5 A Visit to Chung Thang in the North District 402.6 Good Governance is Important 412.7 Failures in Delivery in Sikkim 422.8 Financing in Special Category States 442.9 A Comparison Amongst the Special Category States 492.10 Determining a State’s Share in Union Tax Revenue 522.11 The Eleventh Finance Commission’s Recommendations on Restructuring SCSs Finances 563.1 Estimation of Budgetary Subsidies 693.2 Pioneers in Ecological Tea Cultivation 733.3 Uruguay: Growing and Processing Citrus 743.4 Tanzania: Poultry Farming 763.5 Measuring the Impact of Tourism: The Tip of the Iceberg 783.6 Schooling is Vital for Development 87
List of Charts
2.1 Sikkim’s Human Development Index 232.2 Proportion of Untrained Teachers, 1992-93 252.3 Sikkim’s Gender Development Index 282.4 Infant Mortality Rates: Sikkim and the Northeast 292.5 Female-Male Sex Ratio by Age 302.6 Male-Female Death Rates in Rural Areas, Sikkim 302.7 Large Cardamom Yield, 1976-97 322.8 Citrus and Ginger Yield, 1976-97 322.9 Livestock Population, 1977-97 352.10 Per Capita Income and Per Capita Grants 452.11 State’s Dependence on Central Resources 472.12 Scenario 2: Additional Central Grants 552.13 Scenario 3: Debt with Additional Borrowing 55
List of Tables
2.1 School Dropout Rate, 1998 252.2 Number of Educational Institutions 282.3 Sectoral Shares of GSDP at Current Prices 432.4 Buoyancies of the State’s Own Taxes 46

Contents 13
2.5 Key Fiscal Variables: 1989-90 to 2000-01 482.6 Net Inflow/Outflow of Resources from Borrowing 502.7 Finances of Special Category States: A Per Capita Comparison, 1997-98 502.8 Base Scenario: Summary of Results 543.1 Maximum Rate of Basic Stamp Duty on Conveyance 663.2 Sikkim’s Share of Union Income Tax and Tax Collection Under State Laws 673.3 Explicit and Implicit Subsidies: Recovery Rates 683.4 Tax and Non-Tax Concessions 703.5 Annual Cost of Explicit Subsidies 71

14 Sikkim: The People's Vision
Key Indicators: Sikkim Capital: Gangtok Population 1991 Census: 4,06,457 Status: Special Category State
Sikkim IndiaTotal area (sq. kms.) 7,096 32,87,2636Operational holdings (% of total land mass) 1990-91 15.69 59Forest area (%) 1997 44.9 19.4Districts (no.) 4 466Taluks/sub-divisions (no.) 8 3,298Urban agglomerations/towns (no.) 8 2,987Villages (no.) 453 5,89,226Rainfall (millimetres) 19981 3274.5 NALand elevation (metres) 440 to 8540 Oto 8611
DemographyPopulation, (lakhs) 1991 4.06 8,463.03
Urban (lakhs) 0.37 2,176.11Rural (lakhs) 3.69 6,286.91Male (%) 53 52Female (%) 47 48Scheduled caste (%) 5.93 6.48Scheduled tribe (%) 22.36 8.08
Estimated mid-year population (lakhs) 1/7/20005 5.65 10,059.23Population density (per sq. km.) 1991 57 267Females per ’000 males 1991 878 927Estimated birth rate (per ’000)1997 19.8 27.2Estimated death rate (per ’000) 1997 6.5 8.9Infant mortality rate (per ’000) 1997 51 71Life expectancy at birth 1995 n.a. 59
Male 65.7 64.1Female 46.7 39.6
InfrastructureIndex of social and economic infrastructure2 108.99 100.00Roads (km. of road per ’000 sq. km.) 220 544Per capita power consumption (kwt. hrs/per person) 98.5 236Banks (no. per lakh population) 8.3 7.3
EconomyPopulation below poverty line (%) 1993-94 41.43 35.97
1995-96 1996-97 1995-96 1996-97Per capita income (rupees) 9,472 12,1284 9,578 10,7713Sectoral share of income
Primary (%) 52.03 32.44 29.9 28.8Secondary (%) 13.65 17.47 28.2 28.3Tertiary (%) 34.31 50.09i 41.9 42.9Rainfall (millimetre) 1997 2920.50Land elevation (metres) 440 to 8540
Notes: 1. Data for Sub-Himalayan West Bengal and Sikkim— Statistical Abstract India, 1999, CSO. 2. Report o f the Eleventh Finance Commission, Annexure VI-5. Original reference, T.C.A. Anant, K.L. Krishna and Uma Datta Roy Chaudhury (1999) ‘Measuring Inter State Differentiation in Infrastructure’. 3. Per capita NNP at current prices— National Accounts Statistics 1997, 1998, CSO. 4. Sikkim ranks thirteenth among the states. 5. From Population Projection fo r India and States, Registrar General, India, New Delhi, 1996. 6. Statistical Abstract India, 1999, CSO.

E x ec u tiv e S u m m a r y
Sikkim, a small and beautiful state nestled in the Himalayas, scores well in terms of human development indicators, but faces problems of poverty and unemployment. The vision for Sikkim sets the state on an accelerated path of eco-friendly sustainable development. The key objectives of the development strategy are to alleviate poverty, create income generation opportunities by empowering the people through education and employable skills and building the requisite infrastructure. Historically, Sikkim has played a major role as a gateway to Tibet and northern China from the warm waters of the Bay of Bengal and Indo-Gangetic plain. A large part of the population derived their economic sustenance from cross-border trade with Tibet, through Nathu La, an all- weather pass situated at a height of 14,000 ft in the Himalayas. Nathu La has been closed for traffic since the Chinese conflict in 1962. Employment generation in Sikkim will benefit substantially once trade resumes through Nathu La with the relative normalisation of relations with China. However, Sikkim aspires to be far more than an entrepot to Tibet. The next decade will see the state building on its inherent strengths and, with the government as a facilitator, benefiting from the liberalisation and globalisation processes that are sweeping the rest of the country.
Economy: The present challenges
The state’s total population is only around 5.5 lakh and nominal income has been growing at an impressive annual rate of around 14.5 per cent since 1989-90; however, Sikkim has the fifth highest incidence of poverty among the states, with 41.4 per cent of the population below the poverty line (1993-94). Furthermore, with 38 per cent of the population below the age of 15, the number of young people entering the workforce and looking for jobs in industry and services will increase in the near future.
A stagnant agricultural sector combined with steadily declining industrial activity has severely limited employment opportunities outside the government. Public administration has, by default, become the propelling force behind income growth. Further, growth that has taken place has been regionally imbalanced, with the North District still remaining relatively backward in comparison with the other three districts.
Business as usual: Unsustainable and precarious
The cornerstone of the development strategy pursued so far has been a super-active government in all areas of economic activity. This has put the government under severe fiscal stress. Expenditure on wages and salaries (including pensions) and interest payments pre-empt almost half of total

16 Sikkim: The People’s Vision
government expenditure. Fuelled partly by the implementation of the State Pay Commission recommendations, the fiscal deficit rose to a staggering 21 per cent of gross state domestic product (GSDP) in 1998-99; outstanding debt as a percentage of GSDP touched 72 per cent the same year. At the same time, revenue collection, both tax and non-tax, has been falling. Grants, plan and nonplan, have been financing nearly 43 per cent of government expenditure, which has risen to more than 40 per cent of GSDP in recent years.
The expansionary impact of high government expenditure in terms of income generation has, however, been limited, indicating a ‘missing multiplier’ within the system. This could be partly because of the high import intensity of consumption and partly the result of beneficiaries maintaining their funds outside the state. The little impact there has been of government expenditure has been unsatisfactory: the modem infrastructure that has been built up in education and health over the last two decades under several Plan schemes is currently in a state of disrepair and underutilisation.
A continuation of the present fiscal stance is unsustainable and precarious for the government. This document delineates three scenarios facing the government depending on the path it follows to bridge the widening resource gap in the next five years: one, through additional grants from the centre which will amount to around 20 per cent of projected GSDP by 2004-05; two, through additional borrowing, which will result in a very sharp increase in the debt-to-GSDP ratio; and three, by compressing capital outlay to zero by the terminal year of projection, 2004-05. All three scenarios are bleak and unacceptable. There is an urgent need for devising a new strategy.
Designing a new strategy
Achieving the goal of an accelerated path of eco-friendly, sustainable development requires three fundamental pre-conditions. These are (i) empowering people with the right education and skills to enable them to benefit from recent developments in science and technology, (ii) building up the right infrastructure, particularly in roads and power, and (iii) fiscal consolidation and reform, which will constitute the core of economic restructuring.
The strategy consists of fostering a public-private sector partnership in key infrastructural areas with the application of science and technology. The state’s strength in horticulture and animal husbandry is to be promoted with the help of roads and power on the one hand, and education on the other. These two critical inputs are prerequisites for the application of science and technology in the state. Industry, especially service-oriented industries such as tourism and information technology, has tremendous potential that needs to be exploited through vibrant public-private sector partnerships.
Defining the role of the public sector
Given the fact that the government is under severe fiscal stress, the role of the public sector needs to be redefined. The objectives of the public sector would be (i) the pursuit of economic stability, (ii) improving the delivery of services, (iii) promoting efficient utilisation of allotted resources and (iv) creating an enabling framework for private sector to invest in the state, while disseminating the message that “Sikkim is open for business.” The achievement of these objectives will need (i) a rationalisation of government staff, (ii) introduction of Electronic Data Processing (EDP) systems

Executive Summary 17
on a selective basis, (iii) utilisation of public expenditure benefits, (iv) introduction of competitive tendering, and (v) strengthening of public expenditure management systems.
Sectoral strategy
In spite of increasing literacy and growing school enrolment figures, educational achievement continues to be relatively low, mainly because of a lack of access to schooling and a low level of school completion. The absence of regular or cheap mass transport to and from school, poor state of schoolroom infrastructure and largely untrained workforce of teachers are some of the factors behind this. Though non-completion of education is largely the result of economic factors, the major noneconomic reason for the high rate of school dropout is the curriculum and teaching methods: what children learn in schools is often rigid, formally taught and unrelated to their lives. The universal teaching medium is English, even though the vast majority of the teachers are not fluent in the language.
Increased access to schools, compulsory and good quality teacher training, and curricula that are relevant to the state and in line with the medium-term goals of the economy, will greatly improve the employability of the emerging school graduates. Skill-based secondary education and well-targeted vocational training will also support the thrust areas in the economy which will allow it to move to a higher growth path. The immediate introduction of compulsory computer training courses in schools will lay the groundwork for a computer-literate workforce in the near future.
Health standards have improved significantly in the last 15 years; but, a high child mortality rate, low immunisation rate for children and high death rate for rural women of child-bearing age indicate that family health needs attention. Despite the creation of impressive health infrastructure— in excess of the national norms—poor rural connectivity between villages and health centres means that many people still do not have access to primary healthcare. Further, the excess health infrastructure has led to high administrative expenses in healthcare, added to which patients are reimbursed for treatment outside the state.
The state should move from providing free health services to every one, to making basic health services widely accessible, especially to the poor. The basic health service package will include pregnancy-related care, family planning services, treatment for common serious illnesses of young children and control of tuberculosis, a major killer in the region. Other preventive measures will focus on providing a healthier environment especially for the poor through proper sanitation, sufficient and safe water supplies, good living conditions, and adequate garbage disposal.
Sikkim’s diverse ecological conditions support the cultivation of different kinds of fruits, vegetables and commercial crops like cardamom, ginger, and oranges. However, fruit and vegetable production has fallen, and production of even the lucrative cardamom crop has stagnated.
Horticultural yields are low and cultivation costs high because of outdated farming practices and the high cost and inadequate supply of inputs like seeds and seedlings. Almost all inputs have to be imported into the state and then transported across long distances; the rocky terrain means that transportation costs are high and supply is erratic, which tends to erode producers’ competitive edge.

18 Sikkim: The People’s Vision
There is a shortage of well-trained, specialised staff on government farms to disseminate information on good farming practices and modem techniques. The marketing structure—or lack of it—is one of the weakest links in the value chain for horticulture. Farmers’ cooperatives have, so far, played hardly any role in disseminating information on markets and prices or in helping farmers market their produce; there are no functioning cold storages or wholesale markets. Farmers, especially in the interior regions, are largely dependent on middlemen for credit and for a marketing outlet.
Animal husbandry forms an integral part of the household economy of the state. However, the increase in the output of livestock products has not kept pace with demand. This sector shares some of the problems of horticulture, such as the difficulties of transporting inputs and their high costs, (which has resulted in a severe feed and fodder shortage), outdated farming practices and the almost complete absence of a marketing structure. In addition, the quality of animal stock is poor and animal health care facilities inadequate.
The development of horticulture to fully exploit its employment and income generating potential will mean strengthening all three stages: production, procurement/transportation, marketing and distribution. Yields can be vastly improved by encouraging modem farming practices, ensuring the timely supply of inputs like seeds and irrigation facilities, and through better linkages between farmers and the market to allow them to assess prices and consumers’ needs. Animal husbandry also stands to gain considerably from the application of modem technology—more scientific farming techniques, such as breeding and animal health services, improved inputs and access to marketing information through better communication facilities.
The experience of direct government involvement in horticulture and animal husbandry has not been a happy one. The government should now endeavour to become a facilitator for promoting private sector activities in the identified sectors, especially in agro-processing, seeds and nursery plants, feed and fodder supply and marketing infrastructure such as cold storages. It has an invaluable role to play in spreading awareness among farmers of the benefits of private sector entry, in setting up autonomous agricultural boards, liaising between farmers and the state for improved extension services, and working closely with producers’ co-operatives to improve farm management practices and the quality of produce. The government must shift its focus from monitoring ‘inputs’ (money spent) to monitoring ‘outputs.’ ‘Voice’ is critical for maintaining productivity and effectiveness of government expenditure. Community participation can strengthen the users’ ‘voice’ and improve the effectiveness of government expenditure in extension services.
Apart from the private sector, producers’ co-operatives can supplement direct government involvement in a host of areas such as input and credit supplies, as well as marketing networks. While the government has to act as a catalyst (without financial exposure) to energising and promoting cooperatives, the latter will have to bear all the risks and with the aim of becoming commercially viable ventures.
Tourism is an area that has, so far, remained underdeveloped in the state. While this has had undeniable environmental benefits, judicious development of the tourist potential of the state could provide a major source of revenue for many years to come. The limited growth of tourism is a reflection of the lack of awareness of the tourist opportunities in Sikkim, inadequate tourism

Executive Summary 19
infrastructure and poor connectivity of the state. To prevent the untrammeled exploitation of the tourist potential of the state, it is important that the government formulate policies to promote environmentally sustainable tourism; added to this will be a greater role for Sikkim Tourism Development Corporation, and development and promoting of special interest tourism such as travel to cultural and religious heritage sites, adventure tourism and business tourism.
Despite its tremendous hydro-potential, the state suffers from power shortages. Seasonal shortfalls and operational inefficiencies have reduced the plant load factor to only 30 or 40 per cent. Administrative expenses are high and tariffs are below cost, which have seriously constrained the sector financially. The state should capitalise on its hydro-potential by inviting independent power producers to set up power plants, so that Sikkim becomes a net power exporter: additional power generation is becoming necessary for any expansion of economic activity, for the application of the latest technology and to generate revenue to fund development in identified sectors. Setting up a Regulatory Board/Power Commission and strengthening the transmission line from Melli to Gangtok are important first steps for this process. A high-level expert committee can also be set up for advice on private sector participation and to increase public awareness on the relative eco-friendliness of small hydro-power projects.
The state’s lifeline is its roads and they are a critical input for the growth of all sectors. The absence of a rail network or commercial air services into the state means that roads are the only means of access. Unfortunately, the topography and climate of the region make the terrain vulnerable to landslides and erosion, and the roads are in continuous state of disrepair; poor maintenance of the roads has exacerbated the problem of poor connectivity. It has become imperative to examine the feasibility of widening National Highway 31 A, the state’s main link with the rest of the country, to upgrade existing roads and to improve their maintenance. Expenditure management has to be reviewed to ensure cost effectiveness. One major step could be to tender projects at the national and international level.
Given the pattern of resource endowment of the state, the focus of promoting income generating activities should be on processing of raw materials produced within the state, such as horticulture and animal husbandry and on service-oriented industries, such as tourism in the short to medium term and information technology in the medium to long term.
The broad contour of the fiscal reform includes raising more through tax revenues, revamping the tax administration, revising user charges, and containing spiralling subsidies, explicit and implicit. Expenditure management/prioritisation is another major area for reform. The thrust should be on rightsizing the public sector by putting a ban on all fresh employment. The state should consider disinvestment for all the state level public sector units.

1
V ision for S ik k im : G o als a n d O bjectives
The State of Sikkim, nestled in the Himalayas with exceptional natural beauty and a rich wealth of alpine meadows, rhododendrons, orchids, butterflies and birds, has set the goal of putting itself on an accelerated path of eco-friendlv sustainable development. The aim is to build on the state’s strengths, benefit from the post-liberalisation spurt in growth in the rest of the country and, with judicious use of modem technology, in less than two decades, leave the centuries of underdevelopment rapidly behind.
Among the thirty-two states and Union Territories in India in 1993-94, Sikkim had the fifth highest incidence of poverty with the proportion of people below the poverty line (2,400 calories and 2,100 calories per day per person in rural and urban areas, respectively) at an unacceptably high of 41.4 per cent. The population of the state is expected to increase from 5.5 lakh in 1999 to 7.4 lakh in 2015. Furthermore, with the number of young people below the age of 15 at almost 38 per cent of the total population, there will be a large increase in the number of people entering the work force in the near future.
Box 1.1 A Historical EntrepotHistorically, Sikkim has played a major role as a gateway to Tibet and northern China from the warm waters of the Bay of Bengal and the Indo-Gangetic plain. A large part of the population derived their economic sustenance from cross-border trade through Nathu La, an all-weather pass at a height of 14,500 ft. to Tibet across the Himalayas. Nathu La has remained closed for traffic since the Chinese conflict in 1962. Employment generation in Sikkim will benefit substantially once trade resumes through Nathu La with the relative normalisation of relations with China. But, Sikkim aspires to be much more than just an entrep6t to Tibet.
K ey G oal
Development is about people, and importantly about people at the lower rungs of income distribution. Given the considerable level of income-poverty and the changing age-profile of the population, the kev goal of the development strategy is income generation for the young and the bottom half of the population mostly through providing opportunities for self-employment in services and small scale industry. While poverty may be expected to come down with rapid growth, empowering the poor with education and technical skills is not only a good in itself but will also accelerate the process of poverty alleviation.

Vision for Sikkim: Goals and Objectives 21
T w o-P ronged A pproach
The key goal is sought to be achieved through a two-pronged approach. The first relates to modem advances in science and technology that enable Sikkim today to aspire for much more than just being an entrepot. Science has compressed distances and shrunk the world into a global village. “Distant and inaccessible” Sikkim should aim at becoming a thriving centre of information technology, biomedical and scientific research of tomorrow. Sikkim should seek to benefit from science and technology in three areas.
• First, the enormous hydroelectric potential from the ran of the two snow-fed perennial rivers Teesta and Rangit can be harnessed to yield an estimated 8,000 MW of power valued at approximately Rs. 1,600 crore per annum. The pollution-free nature of hydel power, the low variable costs of generation, and the growing demand-supply gap for electricity in the country argue in favour of such projects in Sikkim. Given the considerable cost of civil engineering works for hydroelectric power projects, the main challenge lies in strengthening the transmission linkage with the Eastern region grid, improving the investment climate (including through proper tariff policy) and attracting investors —with the involvement of the Power Trading Corporation—to bear the costs and risks of such projects.
• Second, with modem technology, it is possible to overcome the problem of accessibility that has historically thwarted Sikkim’s potential as a tourists’ paradise. Sikkim has tropical and temperate forests, alpine meadows and snow-capped peaks, including the spectacular Kanchenjunga (28,169 feet), the third highest peak in the world and its presiding deity. It is richly endowed with several lakes, two major rivers, the Teesta and Rangit, and an almost incredible treasure of flora and fauna. The religious, aesthetic and cultural traditions—for example, the collection of Tibetan books at the Namgyal Institute of Tibetology, the Rumtek monastery of the Karma Kargyupa sect of Buddhism, and the Phlaglhapsol festival with masked dances in honour of Kanchenjunga—are the other major attractions for tourism in Sikkim. Modem technology should be utilised to build roads, airlinks, cable cars, and comfortable tourist accommodations, so that Sikkim can become a recognisable centre on the international tourist map. Given the considerable investments needed for these purposes, the main challenge here again is how to attract investors who will not only fund these projects but also share the associated risks. Furthermore, rules have to be framed and enforced to promote tourism in an environmentally sustainable manner.
• Third, the potential for a wide range of fruits, vegetables and flowers from Sikkim’s tremendous agro-climatic variation—from semi-tropical lowlands to temperate terraces—should be utilised through the strengthening of marketing machinery. Improved linkages with the rest of the country will allow Sikkim to attract tourists, and to tap into the expanding domestic and global markets for orchids, cut flowers and bulbs, “winter” vegetables during summer, and exotic fruits.
The second element of the approach is to envisage a substantially different public sector which aims at promoting the first goal through active collaboration with the private sector and the community, in addition to being more responsive to local needs and effective in the provision of services.
The vision, thus, is of a prosperous Sikkim with an effective public sector, thriving trade, abundant

22 Sikkim: The People’s Vision
hydroelectric power, tourism, horticulture and floriculture and without poverty, illiteracy and unemployment.
S cope of the R eport
This report aims at articulating, in the first instance, the goals that Sikkim should aim at achieving during the medium term. Subsequently, the report spells out, in some detail, the economic strategy, the contours of the supporting fiscal policy framework, and indicates the future roles to be played by the public and the private sectors, and the community in the fulfilment of the goals.
F ulfilling the V ision
The government cannot make the vision come true by carrying on its “business as usual.” There has to be a strategic withdrawal of the state from widespread untargeted subsidies and direct employment creation, combined with a critical emphasis on setting up a congenial business infrastructure including the legal framework to foster private sector activities.
Private investment—both from within and outside the state—will be attracted to Sikkim only if the state has good infrastructure, both physical and social. Highest priority needs to be accorded to roads, bridges, telecommunication and power on the one hand and to top quality basic education and basic health on the other. An important infrastructural agenda item for the government will be the preservation of Sikkim as a “green” state. Development will be pursued without damaging Sikkim’s natural wealth and beauty—its forests, lakes and the entire natural environment. To do otherwise will be shortsighted and counterproductive. Thus, for all projects—roads, infrastructure for tourism, hydroelectric projects, clearing land for horticulture and floriculture—the government will work out a compensatory programme of trees planted for trees cut, forest area extended for forest area sacrificed, and green cover restored for green cover destroyed.

2B a c k g r o u n d : R ecent T r en d s a n d E m erging Issu es
2.1 H uman D evelopm ent: A S atisfactory R ecord
The state has registered impressive improvement in human development since the mid-1970s and scores well in its human development indicators. It has lower birth, death and infant mortality rates than the country as a whole. Its population is currently growing at an annual rate of 1.3 per cent compared to the all-India rate of 1.8 per cent. The Human Development Index (HDI), recently computed for Sikkim,1 has shown steady improvement since 1991, although the rate of increase has slowed down between 1995 and 1998. The HDI which was 0.454 in 1991 rose to 0.509 in 1995 and to 0.532 in 1998 (chart 2.1). The East District has the highest HDI scores, followed by the South, West and the North.
Chart 2.1 Sikkim's Human Development Index
Source: The Sikkim Human Development Report, 2000.
2 .1 .1 E d u c a t i o n
TrendsSikkim’s literacy rate of 78 per cent is well above the national average of 62 per cent.2 In government schools, students pay no tuition fees and receive textbooks and exercise books free; uniforms are
1 The HDI has been calculated as the average value of the income index, the life expectancy index and educational attainment index. These in turn are based on life expectancy at birth, adult literacy rate, enrolment ratio, per capita income and adjusted per capita income. See Lama (2000).
2 This is the literacy rate according to the National Sample Survey, 1996-97. The 1991 census estimates the literacy rate at 56.94 per cent.
24 Sikkim: The People’s Vision
distributed free upto Class V. As a further incentive the government gives generous scholarships and other grants. As a result, Sikkim’s monthly expenditure of Rs 960 per student is far above the all-India average of Rs 210 per student.3
In spite of the good progress in education in the last decade, there are continuing problems such as lack of access to schooling and a low level of school completion. These interrelated problems have combined to keep achievement levels lower than they could have been. Only 37 per cent of the 2,201 students who appeared, passed the AISSE Class X examinations in 1999.4 Sikkim shares many education-related problems with other parts of India. These include poverty, low educational status of parents, occupational pressures, poor quality of education and teaching, poor schoolroom infrastructure. Furthermore, the physical environment and climate of this hill state make attending school an arduous task.
Issues
Increasing Access— The Supply Side
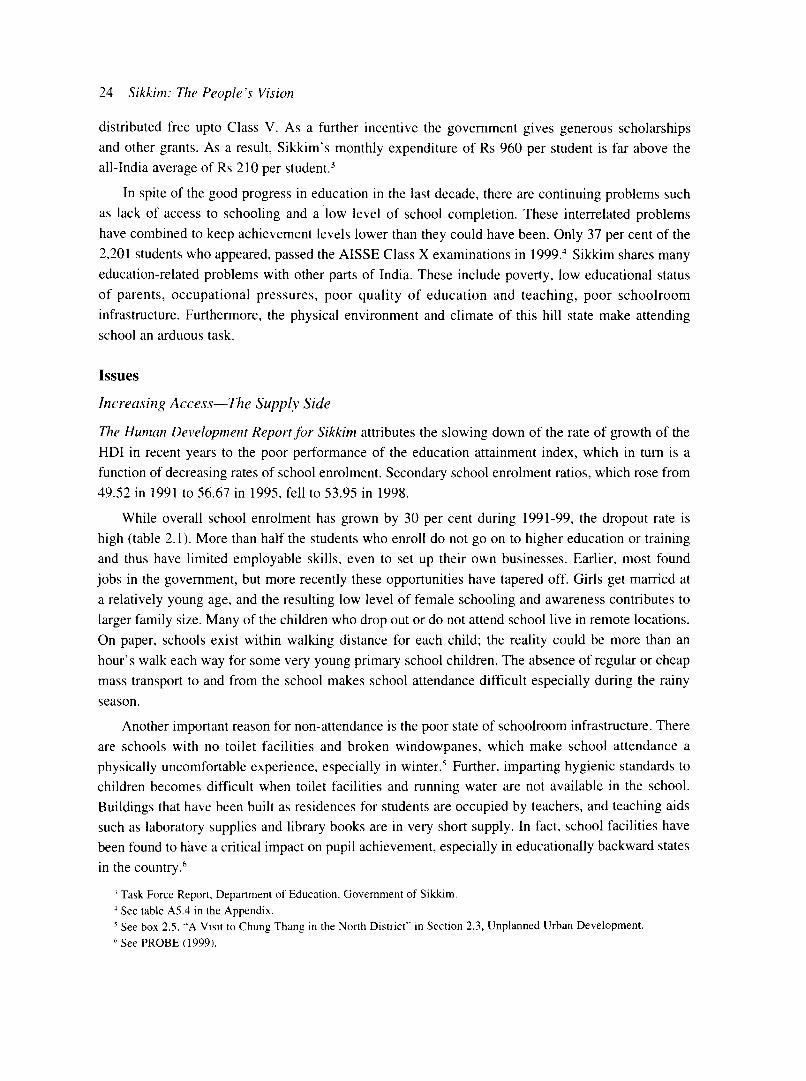
The Human Development Report for Sikkim attributes the slowing down of the rate of growth of the HDI in recent years to the poor performance of the education attainment index, which in turn is a function of decreasing rates of school enrolment. Secondary school enrolment ratios, which rose from 49.52 in 1991 to 56.67 in 1995, fell to 53.95 in 1998.
While overall school enrolment has grown by 30 per cent during 1991-99, the dropout rate is high (table 2.1). More than half the students who enroll do not go on to higher education or training and thus have limited employable skills, even to set up their own businesses. Earlier, most found jobs in the government, but more recently these opportunities have tapered off. Girls get married at a relatively young age, and the resulting low level of female schooling and awareness contributes to larger family size. Many of the children who drop out or do not attend school live in remote locations. On paper, schools exist within walking distance for each child; the reality could be more than an hour’s walk each way for some very young primary school children. The absence of regular or cheap mass transport to and from the school makes school attendance difficult especially during the rainy season.
Another important reason for non-attendance is the poor state of schoolroom infrastructure. There are schools with no toilet facilities and broken windowpanes, which make school attendance a physically uncomfortable experience, especially in winter.5 Further, imparting hygienic standards to children becomes difficult when toilet facilities and running water are not available in the school. Buildings that have been built as residences for students are occupied by teachers, and teaching aids such as laboratory supplies and library books are in very short supply. In fact, school facilities have been found to have a critical impact on pupil achievement, especially in educationally backward states in the country.6
3 Task Force Report, Department of Education, Government of Sikkim.4 See table A5.4 in the Appendix.5 See box 2.5, “A Visit to Chung Thang in the North District” in Section 2.3, Unplanned Urban Development.6 See PROBE (1999).

Background: Recent Trends and Emerging Issues 25
Table 2.1: School Dropout Rate, 1998
(per cent)
North South East West
Class II 27.3 27.7 31.3 41.3
Class III 13.6 12.2 6.8 4.6
Class IV 26.0 27.5 16.3 19.6
Class V 22.0 9.3 16.6 15.7
Class VI 12.3 19.5 -0.8 4.9
Class VII 31.1 23.4 26.9 28.0
Class VIII - 12.1 -12.9 -4.2 -9.4
Class IX 56.0 49.0 43.8 61.1
Class X 30.6 34.8 39.7 17.1
Class XI 21.3 41.4 11.4 6.3Class XII 3.7 25.4 22.2 46.9
Source: Department of Education, Government of Sikkim.
Teachers are the Critical Educational Input
A major lacuna in the education system is the lack of training for teachers. Sikkim has a workforce of teachers that is still largely untrained. In fact, local teachers do not have to be trained to teach at any level in Sikkim. At the primary level, 1,825 out of 3,188 teachers had not been trained, while 973 out of 2,147 at the higher level are untrained (chart 2.2).
Chart 2.2 Proportion of Untrained Teachers, 1992-93
70 1 60 -50 -
g 40 -s 30
Cl20
10 -
0
□ % Untrained
■ % Trained
Primary Middle High/higher
Source: Department of Education, Government of Sikkim.
Teachers often do not have a good grasp of the material they have to teach, of English, in which they impart the knowledge, and teaching methods. Many have completed less than 10 years of schooling, and the quality of education the teachers themselves have received may not equip them to teach effectively. Studies show that there is a positive relationship between the average number of years of teacher education and student achievement. Demand for training will be created when

26 Sikkim: The People ’s Vision
teachers are given incentives to improve their qualifications and enrol in in-service training programmes through distance learning or open universities.
Sikkim’s teacher/pupil ratio of 1:19 at the primary level is good compared to the all-India ratio of 1:46 in 1995.7 However, the distribution is highly uneven, and in certain schools the actual number of students per teacher could be far above the state average. In secondary schools, the number of students in humanities sections is typically far higher than the number in science classes, and teacher/ pupil ratios could go up to 1:80, thus adversely affecting the teacher’s effectiveness.
Creating a Need fo r Education— The Demand Side
For poor families the opportunity cost of schooling children is often higher than the actual costs. Children are needed to help in the fields, or at home to look after younger siblings or farm animals. In some parts of Sikkim, “dry rations” in the form of uncooked rice is distributed as an “incentive” for parents to send children to primary school. However, as experience in other parts of the country has shown,8 this tends to reward enrolment rather than actual school attendance. Also, dry rations have none of the nutritional and socialisation benefits that accrue from a mid-day meal. A hungry child makes a poor learner, and mid-day meals have clearly had a beneficial effect on school attendance, by providing an incentive to both parents and children.
One of the most important factors influencing enrolment and attendance is active parent participation in education. Parents have to feel that their children are benefiting from attending school—and for this, the quality of education has to be high so that children’s skills and their earning power are seen to have been visibly enhanced. “Pupil achievements are significantly influenced by the teaching-learning process. In many states, regularity of classwork and homework is positively associated with pupil achievement. Other significant variables are the frequency of tests, and parental involvement.”9
Reducing Dropout— Toward more Relevant Education
Non-completion of education is largely because of economic factors, but the major non-economic reason for dropout is that what children learn is rigid, formal and unrelated to their lives. As in other parts of the country, teaching is done mainly through lectures, dictation of notes and rote memorisation. The lack of teacher training means that there is a huge reliance on the centrally produced government textbooks, often of poor quality and irrelevant to the hill-culture of Sikkim.
Teaching in Sikkim is done in the official language, which is English. However, the vast majority of teachers are not fluent in the language. Studies have shown that literacy is slow if teaching of basic skills is conducted in a language that is not spoken at home, and is even slower when the teachers themselves are not fluent in the dominant official language. This has been a problem in many countries and one solution has been to teach the first few grades of primary school only in the first language so that children develop solid skills; only then are other languages introduced.
7 Ibid.* Ibid.9 Ibid.

Background: Recent Trends and Emerging Issues 27
Lowering Regional and Gender Disparities
For a variety of reasons the North district has remained less developed than other parts of the State, and the East has been relatively most developed (box 2.1). This is clear from the HDI, which is partly based on educational attainment and enrolment ratio. In terms of the enrolment ratio, the North has consistently lagged behind the other districts in the three periods over which the HDI has been computed; on educational attainment, it performs better than only the West district. In comparison the East district is significantly ahead of the other districts in both indices and in all periods.
Even though the State performs well on its Gender Development Index (GDI),10 the enrolment of girls is lower than that of boys’ at all levels, except in the middle school. Their dropout rate is
Box 2.1 Regional DisparitiesDevelopment has not been regionally balanced. The East District, which is closest to the large markets of Siliguri in West Bengal and which is home to the capital city, Gangtok, is most developed in terms of its infrastructure, civic facilities, access to health and education schemes and employment opportunities. The South and West districts have also benefited as a consequence of their location and proximity and better connectivity with West Bengal and Gangtok.
The North, in contrast, is farthest from domestic markets and, because of its mountainous terrain and more extreme climate, is sparsely populated. It is almost entirely surrounded by the high mountains and spurs of the Himalayas, which range in height from 17,000 feet to 28,000 feet. Unlike the other districts, the habitations are scattered, there are very few roads, and the area is traversed by a single state highway. Only 7.69 per cent of Sikkim’s population live in this district, which accounts for 60 per cent of the land area; its population density is consequently extremely low at only 7 persons per square kilometre, compared to 187,131 and 84 in the East, South and West, respectively. Only 14 per cent of the land is cultivated, compared to the East, South and West where cultivated area is approximately 29 per cent of the total area in the district.
Even though its position has been improving, the North still scores lowest on both the human development and gender development indices in all three time periods, compared to the other districts.
Health-wise, the North has the highest crude death rate and infant mortality rate; IMR is 60 per thousand live births, compared to the state average of 51 and the crude death rate is 9.94 (per thousand) compared to the state figure of 7.23. The sex ratio in the North is most unfavourable: 916 per 1000, compared to 927 in the East, 922 in the West and 924 in the South.
In the North only 66.24 per cent of the rural houses have electricity, compared to 81.82 per cent in the East, 77.78 per cent in the West and 71.17 per cent in the South (see Gyatso and Bagdass, 1998).
10 See chart 2.3. Between 1991 and 1995 the GDI rose from 0.445 to 0.499; the rate of increase slowed down after 1995 and in 1998 the GDI was 0.528. See Lama (2000).

28 Sikkim: The People’s Vision
Chart 2.3 Sikkim ’s Gender Development Index0.6
0.55
0.5
0.45
0.4
0.35North East West South State
Source: The Sikkim Human Development Report, 2000.
higher, because of the relatively early age of marriage. Over 60 per cent of rural women and 70 per cent of urban women get married before they are 20 years old." Investment in girls’ education is important; studies have shown that family health and education are positively linked with the level of the mother’s education.
Table 2.2: Number of Educational Institutions
Institutions North South East West Total
Senior secondary schools 2 16 18 7 43Secondary schools 11 24 22 20 77Upper primary schools 9 38 44 31 122Primary schools 33 100 119 83 335Lower primary svhools 21 48 35 75 179Pre-primary schools 76 212 235 216 739Total schools 152 438 473 432 1495
Source: Department of Education, Government of Sikkim.
Box 2.2 Better Education Means Better Health Care
There is a close link between education and better health care. Education, particularly of females, greatly improves the ability of households to manage basic childcare, increases the nutritional content of diets, ensures more effective diagnosis of diseases, and improves elementary health care. The role of education in bringing down the rate of population growth is even more dramatic. There is a particularly strong link between female literacy and fertility.
Source: Haq and Haq (1998).
1991
1995
1998
" See Gyatso and Bagdass (1998), p 88.

Background: Recent Trends and Emerging Issues 29
2 .1 .2 H ealth
TrendsSikkim’s health standards have improved significantly over the last 15 years. Better health and medical facilities have reduced the infant mortality rate from 88 per thousand in 1988 to 51 per thousand in 1997, against the national rate of 71 per thousand (see chart 2.4). The birth rate in 1997 was 19.8 per thousand and the death rate was 6.5 per thousand, which are lower than the all-India average of 27.2 and 8.9 per thousand, respectively. Medical services are free for almost everyone in the state, and food and medicines are distributed at no cost to all inpatients in hospitals and primary health centres. The state also pays for secondary and tertiary health care treatment outside the state.
Chart 2.4 Infant Mortality Rates, Sikkim and the Northeast
80 -|
70 -
6 0-
IssuesDespite the strides made in health care, there is a need for better family health care. The child mortality rate of 32.12 per cent is far higher than national rate of 11.1 per cent (1996). Female babies below the age of one year have a far higher death rate (22.28 per cent) than male babies (15 per cent). One reason could be the low rate of child immunisation: Only around 53 per cent of children below the age of one year (both rural and urban) were immunised against all six vaccine preventable diseases. Only 62 per cent of rural children and 66 per cent of urban children below the age of five were fully immunised.12
The female/male ratio (females per 1,000 males) is far below the all-India figure. In the 1991 census the female/male ratio was 878 for Sikkim, compared to the all-India ratio of 927. The sex ratio for Sikkim deteriorates steadily between the ages of 30 and 59 to touch a low of 655 in age
12 Gyatso and Bagdass (1998).

30 Sikkim: The People's Vision
group 55-59 (chart 2.5). The death rate for rural women aged 15 to 50 years is extremely high (43.85 per cent) compared to men (23.87 per cent) in the same age group (chart 2.6).13 A major reason could be a high maternal mortality rate (no data is available to verify this) as natal care is still largely undertaken by untrained people. Despite the numerous PHCs and staff, most of the deliveries take place outside the health centres. Around 53 per cent of the deliveries in the rural areas are carried out by relatives or untrained midwives. Further, 41.24 per cent of the rural women and 22.91 per cent of the urban women do not receive any antenatal care.
Chart 2.5 Female-Male Sex Ratio by Age
1000
900 ■
800 •
■5 700 ■Eo 600 o01 500Q.JS 400 -| ee
| 3 0 0 .U.
200 ■
10 0 ■
0 ■
Age Group
Chart 2.6 Male-Female Death Rates in Rural Areas, Sikkim50
45
40
35 i
30
25
20 H
15
10
5
0<1
H xlU- 5 6 - 1 4 1 5 - 5 0
Age Group
^Male
® Female
i51 +
13 Ibid.

Background: Recent Trends and Emerging Issues 31
Alcoholism is an emerging problem in the state. While it is difficult to put a figure on how many people are alcoholics, consumption is especially high among men over the age of 31. Experience elsewhere in the country has shown that strong community efforts are generally more effective than medical interventions to help people overcome alcohol dependence.
The detection and cure rates of tuberculosis (24.5 per cent and 58.6 per cent, respectively) continue to be low, making it the primary cause of known deaths in the State.
Box 2.3 Tuberculosis is a Killer
Tuberculosis kills or debilitates more adults between the ages of 15 and 59 than any other single infectious agent. Without appropriate treatment, 60 per cent of those with the full-blown disease will die. Tuberculosis is best prevented by curing infectious persons early in the course of the disease, thus interrupting transmission to others. Well-run programmes can cure up to 80-90 per cent of patients, poorly administered programmes cure 30 per cent or less, leading to larger numbers of sustained cases of infection and related deaths and to new infections.
Source: World Development Report, 1993.
Administrative expenses are high. The state exceeds the national norms on primary health centres (PHCs) and primary health sub-centres (PHSCs) by 10 and 62 respectively. Staffing and operating costs are high, especially as many of them function from rented premises. Thus for every rupee of health care provided, the administrative expense of dispensing the care is more than Rs 2. In addition to excessive infrastructure within the state, expenses for treating people outside the state are high.
Family health and preventive care need to be strengthened. Inadequate primary health care is partly a result of the poor connectivity of many villages with the nearest health centre. While medical services are free, often the facilities are more than a day’s journey away. The recent mandatory inclusion of a woman doctor in every PHC should have a positive impact on women’s health, but until roads and access is improved, the effects will be limited. Improving healthcare for infants and children, an important goal in itself, will also help reduce family size.
2 .2 U n f u l f i l l e d P o t e n t i a l : Som e S e c t o r s — P e r f o r m a n c e ,P rom ise and P otential
2.2 .1 H orticulture
TrendsSikkim’s diverse ecological conditions ranging from tropical to alpine support the cultivation of a variety of fruit, vegetables, in and out of season, and are also excellent for commercial crops like cardamom, ginger, oranges, etc. The varied climate also allows Sikkim to supply to the neighbouring areas “winter” vegetables grown at higher altitudes during summer.
Productivity and yields, however, have remained low because horticulture, like the other land- based activities in the state, is practised in a largely traditional fashion. Most of the area is still under

mono-cropping (one estimate put it at 93 per cent of the unirrigated area); farmers use traditional tools and follow traditional practices; crop cultivation is mainly manual or animal-based; and the use of chemical fertilizers and pesticides is low.
Fruit and vegetable production has been declining. Between 1990-91 and 1996-97, fruit production fell from 8.05 thousand tonnes to 3.5 thousand tonnes, vegetable output fell from 35 thousand tonnes to 27 thousand tonnes and production of even the lucrative cardamom crop stagnated at 3.6 thousand tonnes. Ginger is the only major cash crop whose output has increased from 16 thousand tonnes to 25 thousand tonnes during this period (see charts 2.7 and 2.8).
32 Sikkim: The People’s Vision
Source: Department of Agriculture, Government of Sikkim.
Chart 2.8 Citrus and Ginger Yield, 1976-1997
6 , 0 0 0 -
5.500 -
5.000 -
4 . 500 -
u 4 , 000 - iX 3 , 500 -
3. 000 -
2 . 500 -
2 . 000 -
1975-6 1980-1 1985-6 1990-1 1995-6 1996-7
Source: Department of Agriculture, Government of Sikkim.

Background: Recent Trends and Emerging Issues 33
Issues
Horticulture is still largely a small-scale operation in the state, and production is mainly for the domestic and local markets. Apart from bottlenecks in the supply of inputs such as seeds and nursery plants, farmers are hampered by the lack of any marketing infrastructure for their produce, and lack the incentive to change their methods. Farming techniques will improve and productivity will rise only when farmers have access to vastly improved marketing channels. A simultaneous take-off in tourism could give horticulture a big thrust by increasing the local demand for flowers, top quality fresh, frozen and canned fruit and vegetables, and processed fruit in the form of jams, juices and pulp.
Production
The cost of cultivation is high, which is partly because of bottlenecks in the supply of inputs. One reason why crop yields have fallen, or stagnated at best, is because of the poor quality of seeds, and because of the untimely or inadequate supply of seedlings. At present, almost all the indigenously grown seeds are produced in government farms, which cannot meet the demand. Seeds have to be brought in from other states, involving higher costs and often delays in delivery.
Orange/citrus fruit production has fallen from 15,450 tonnes to 9,000 tonnes between 1990-91 and 1996-97 (chart 2.8); while orange growers face many of the problems plaguing other horticulturists, low orange yields is a result of aging orchards. Most of the orchards are over 25 years old and orchardists are reluctant to replant despite a subsidised replanting package provided by the state horticulture department, because they do not want to lose even the small income generated by the old trees. Similarly, most of the cardamom plants have reached the end of their economic life of 25 years and need to be replaced. Here, too, replacement rates have been slow. Of the 23,600 hectares under cultivation, only around 500 hectares are being replanted annually; ideally, the annual replanting should be 1,500-2,000 hectares. One reason for this is the shortage of seedlings, 20 lakh seedlings are needed per 500 hectares. State farms supply around 2-3 lakh seedlings and the Spice Board arranges around 5 lakh seedlings from their certified nurseries, leaving a large demand-supply gap uncovered.
Only a small percentage of the cultivated area is irrigated, and cultivators typically time their crop cultivation to coincide with the monsoon. This has contributed to keeping yields low and limited the range of crops that can be grown. Most of the streams flow through deep gorges, making them impossible to tap for irrigation purposes. Diverting water from these streams through field channels has resulted in poor water use efficiency, and has had a disastrous effect on the fragile landscape, causing landslides.
There is a shortage of well-trained, specialized staff on government farms to disseminate information on good farming practices and modem techniques. Furthermore, the facilities for soil and plant analysis in these government units are inadequate.

34 Sikkim: The People’s Vision
Procurement/Transport, M arketing and Distribution
The marketing structure is one of the weakest links of the horticultural value chain. Farmers have no access to market information on crops. This hampers them in making informed decisions about what to cultivate, when and where to sell and, combined w'ith the absence of any wholesale markets, makes them completely dependent on the marketing structure of the middlemen; collusion among the middlemen has kept farmers’ margins very low.
Most of the cardamom crop, for example, is grown on very small holdings, in the interior of the North District, the least well-connected region in the state. Growers have limited access to motorable roads or to road transport and the majority of the crop is marketed through private traders who buy the produce at very low margins, and even underweigh the crop. Similarly, orange producers enter into pre-harvest contracts with traders—who often loan them money at the beginning of the season; this leaves the farmer with no room for maneuverability on prices.
The transport infrastructure is poor. There is an exclusive dependence on roads for transport of inputs and marketable produce. The mountainous terrain tends to keep transportation costs high and erodes producers’ competitive edge. Bad weather conditions can delay the supply of inputs and lead to spoilage of fresh produce and flowers. Produce is also wasted because of poor storage facilities and the near absence of cold storages. Non-scientific post-harvest technology for harvesting, packing and grading often results in produce being damaged by insects, pests and fungi. A significant amount of cardamom output, for example, deteriorates post harvest, because of poor storage and curing conditions.
Expanding Tea Cultivation
The largest tea estate in Sikkim is Temi Tea Estate, which produces some of the finest quality tea. It currently produces at full capacity and in 1997-98 earned Rs. 86 lakh in revenues. It can only increase production by expanding its cultivable area through acquiring contiguous forest land (which will require central government permission) or persuading the neighbouring small-holders, who farm the surrounding areas, to shift to tea cultivation. However, concerns of food security have tended to make them reluctant to release land from the current subsistence farming activities for non-food production. The gestation period for tea bushes is 4-5 years, and one way would be to compensate them for income lost in the interim through some loan facility. One-fourth of the tea produced is sold in the local market at subsidised rates which just cover costs, and the remainder through auction houses in Kolkata.
2 .2 .2 A nim al H usbandry
TrendsAn estimated 50 per cent of Sikkim’s total area of 7,100 sq. kms. is used for livestock farming. The importance of animal husbandry in Sikkim becomes evident when the figure of 50 per cent of total area under livestock farming is compared with only 11 per cent of area under cultivation. As the traditional occupation of 90 per cent of the population, animal husbandry already forms an integral part of the household economy of the state. Almost every family supplements its income through rearing of some livestock.

Background: Recent Trends and Emerging Issues 35
Box 2.4 World Demand for Livestock Products
A new study by the International Food Policy Research Institute (USA), the Food and Agriculture Organization and the International Livestock Research Institute (Kenya), has found the demand for livestock products rising dramatically in developing countries. ‘For all developing countries the combined per capita consumption of beef, mutton, goat, pork, poultry, eggs and milk rose by an average of about 50 per cent per person between 1973 and 1996.’ In 2020, per capita demand for meat in the developing world is likely to be about 29 kilograms, while demand for milk will be 63 kilograms of milk a year, up from 21 kilograms and 41 kilograms, respectively, in 1993.Source: http://www.ilri.org.
Even though the output of livestock products has risen in the last 20 years, it has not kept pace with local demand. There has been a sharp fall in livestock numbers (chart 2.9) and the poor quality of animals has kept yields very low. Efforts are being made to improve the stock of animals but a severe feed and fodder shortage, poor animal healthcare facilities and unscientific farm techniques keep constraining yields to low levels.
Chart 2.9 Livestock population, 1977-97
Yaks —
’oultry |
Goafs
Pigs ~
I sn eep
I B u n aioes“"
- 80 -60 -40 -20 0 20 40 60
P e r c e n t a g e C h a n g e
Source: Department of Animal Husbandry, Government of Sikkim.
Efforts are being made to cross breed local cows with Jersey varieties to increase milk yield. Breeding activities are handled exclusively by the Animal Husbandry Department, but it has not been able to keep up with the demand, mainly because of a shortage of funds.
Issues
There is an acute scarcity of feed and fodder: A recent study has estimated that there is a shortage of

36 Sikkim: The People's Vision
up to 65.6 per cent in green fodder, 44.76 per cent in dry fodder and 78.66 per cent in concentrate. Feed and fodder accounts for 60-70 per cent of the cost of producing livestock products, and this is consequently the weakest link in the production chain. Farmers use poor quality fodder because they are short of funds, or do not have the necessary knowledge, or do not have access to improved varieties of seeds. With the gap made up by imports from outside the state, the availability and price of feed vary according to weather and road conditions. Good quality, balanced and nutritive feed, which is more economical than low-cost, unbalanced feed because of the higher productivity, is essential for fostering livestock development in Sikkim.
Farmers still follow old, traditional practices. New, more scientific techniques have not been introduced to improve productivity and to prevent the spread of disease. The lack of trained technical people in this sector, largely because of the absence of post-secondary school vocational training in animal husbandry, continues to constrain the diffusion of best practices in the sector.
Animal health services are inadequate. Outbreaks of diseases—like swine fever, rabies, anthrax— are frequent. There are not enough healthcare service centres, and no disease investigation laboratories in the districts; most polyclinics have inadequate facilities; and there is a shortage of technically trained manpower to run the centres.
The procurement and marketing of animal products is inadequate. Milk procurement in particular is extremely low and the Sikkim Milk Union (a major milk producers’ cooperative) is currently running at a deficit of Rs 45 lakh because of its declining procurement levels and high operating costs. A recent study of the Sikkim Milk Union has recommended that it would have to double the quantity of milk processed if it is to break even. Poor milk collection infrastructure and lack of local milk processing facilities result in a high degree of spoilage. Poor road conditions also constrain the transportation of milk from the producing to the processing and consuming centres.
2 .2 .3 I ndustry
TrendsThere is little industrial activity in the state, and recent years have, in fact, seen a decline in industrial output. At end-March 1996 there were only 1,683 provisionally registered and 313 permanently registered private sector industrial units, mostly in the small scale or tiny sector and promoted by first-generation entrepreneurs. Of the registered industrial units, only 225 are functioning while most others are sick. There are no central government enterprises in the state, and of the 14 state public sector enterprises, only Sikkim Time Corporation (SITCO) is functioning efficiently.
The Indian Companies Act and the Industrial Disputes Act do not apply in Sikkim. Companies are registered under the Registration of Companies Act, Sikkim, 1961, and cannot raise equity from the domestic capital markets.
IssuesIndustrial development in the state has been inhibited by inherent factors such as physical remoteness, difficult terrain, lack of raw materials and markets, and high transport and marketing costs. These

Background: Recent Trends and Emerging Issues 37
have tended to keep industrial development low if not non-existent, despite the many steps taken by the government to encourage development. The government set up the Sikkim Industrial Development and Investment Corporation (SIDICO) to accelerate industrial development by providing financial assistance, technical consultancy, marketing assistance and to distribute technical inputs to small and micro enterprises. However, several units that were set up with equity from SIDICO have found themselves in financial difficulties because they were not able to access working capital funds. This, in turn, has had an adverse effect on SIDICO’s finances. SIDICO has a very poor recovery rate, and its losses accumulated to Rs 11.66 crore in 1997.
Several concessions and subsidies were given to private entrepreneurs under the Industrial Policy of 1996. But, these have not resulted in any noticeable increase in industrial activity. In many cases, entrepreneurs allegedly did not receive the benefits promised. Some departments did not comply with the provisions of the policy; for example, in some cases, deferment of excise duties was not carried through. The state has thus experienced a process of de-industrialisation in the recent past.
2 .2 .4 P ower
Sikkim has an installed capacity of 38.10 MW and a peak deficit of 17 MW (in 1997-98), which means that at peak hours 45 per cent of the demand for power is unmet. In addition, transmission and distribution losses in the state are over 20 per cent. Most of the power projects are hydro and run-of-the-river type, which yields only 50 per cent of the installed capacity during winter. All these factors—seasonal and operational inefficiencies—make the plant load factor in Sikkim a low 30 to 40 per cent.
At present Sikkim’s power is supplied through a combination of the state’s own generation and the state’s quota from the central sector generation. Central sector power flows into Sikkim from the West Bengal State Electricity Board (WBSEB) grid via the Vidyutnagar-Melli 66 KV line. Unfortunately the weakness of the WBSEB grid and the large dependence on run-of-the-river projects results in frequent tripping of power in Sikkim. Demand, on the other hand, has been growing at 15 to 20 per cent per year, which is likely to accelerate when all the houses have a power link.
The power sector is seriously constrained by financial resources. Revenue has been consistently less than half of the non-plan expenditure and the gap has been increasing at an average of around 20 per cent per year. The share of plan expenditure in total expenditure has also been declining from 84 per cent in 1987-88 to 66 per cent in 1997-98. Revenue losses have increased with increasing sales, given the difference in the power tariff of Re 1 per unit against a central sector purchase price of Rs. 1.53 per unit.
The state has not yet appointed a State Electricity Regulatory Commission (SERC) nor has the State Electricity Department been corporatised. The first steps towards privatisation of the sector have been taken with the recent creation of the Sikkim Power Development Corporation, which will be responsible for all future generation projects.

38 Sikkim: The People’s Vision
2 .2 .5 T ourism
Sikkim’s most important asset is its natural beauty. The altitude of the terrain ranges between 300 and over 5000 metres. It is covered with tropical forests, temperate forests, alpine meadows and snowcapped peaks. It is also richly endowed with several lakes, two major rivers, the Teesta and the Rangit, and a treasure of flora and fauna. The tourism potential of the state has been very thinly exploited. Consequently, the degradation of environment from tourism has also been limited. But, there remains an excellent opportunity to exploit the tourism potential in a sustainable manner without damage to the environment.
Tourism in Sikkim caters mainly to two types of travellers. The majority is low-budget tourists, who typically spend a day or two in Gangtok, and hardly venture outside the capital. A smaller segment of tourists consists of mountaineers and trekkers, who head for the more remote regions of the state. More than 60 per cent of the 1.45 lakh tourists that visit Sikkim annually are from West Bengal. The average stay of one to two days is low, compared to the national hill-station average of 6 days, and is highly seasonal, being concentrated around the months of May and October.
The limited growth of tourism is a reflection of the lack of awareness of Sikkim as an attractive tourist destination and inadequate tourism infrastructure. While the Information and Publicity Section of the Tourism Department has offices in Siliguri, Kolkata and Delhi, it has made little effort to disseminate information on the attractions of the state, and tourist traffic remains largely regional and confined to the capital. Road infrastructure and hence connectivity within the state is poor, hotels are few and tourists are dependent on private taxis, whose service and rates are unregulated. The nearest airport and railhead are a four-hour road journey (140 kms.) away, a journey, which can be extremely unpredictable, especially during the monsoon.
2.3 U nplanned D evelopment
2.3 .1 M anaging U rban G row th
Development efforts have largely been concentrated in urban areas, and the state has witnessed a high rate of migration from the villages to the towns. Rapid urbanisation has far outpaced the supply of infrastructure and civic amenities. Although the census data show a decline in urban population from 16.65 per cent in 1981 to 9.15 per cent in 1991, urban population according to the Annual Plan,1998-99 is closer to 20 per cent. Lower urban population figures in the census data are a result of the re-demarcation of some of the revenue blocks surrounding Gangtok as rural land. Earlier these blocks were part of the Gangtok Municipal Corporation.
With no firm policy for the acquisition and disposal of plots in urban areas, urban development has been largely unplanned. Most of the towns have seen rapid building activity in the last few years, with little attention to aesthetics, building laws, civic amenities or even to local materials and styles. Apart from the environmental hazards that result from overbuilding and congestion, many of the towns and their surrounding areas are fast becoming eyesores in an otherwise serene and beautiful Himalayan landscape. The process is not reversible, and if unchecked could—for a start—destroy the tourism potential of the state. If detailed master plans are drawn up for taking place. Building

Background: Recent Trends and Emerging Issues 39
plans should be approved in advance: norms on height and areas of structures the development of all towns, and strictly adhered to, this would check the haphazard development that is, location, etc. have to be enforced and, if feasible, the use of traditional materials or architectural styles promoted. If possible, buildings should be constructed only on the hill-ward side of roads, so that the mountain views are not obstructed.
Infrastructure and civic amenities have developed in response to problems rather than as a result of planning based on projections. The result is that in the major towns only around 61 per cent of the population is covered by water supply schemes. Only 52.82 per cent of the urban population have access to sanitation facilities and some parts of the urban areas are still covered only by the old system of septic tanks, with waste being mostly emptied into streams.
Economic Rates
The government has been the sole provider of infrastructure in the state, and it provides most of these services at prices that are a fraction of the costs. Revenue generation is particularly low in the urban areas: trade license fees are assessed at old, antiquated rates and user charges either do not exist or are not enforced for civic amenities like parking and sanitation.
Road Infrastructure
Roads play a critical role in the mountainous state. They are not only costly to build and maintain, but are like lifelines for the population. Inadequate access control, allowing shops and other establishments to be built along the roadside, lax parking rules and even more lax enforcement of rules have resulted in traffic congestion and delays in commuting.
The absence of a rail network or commercial air services means that motor transport is the only means of getting around. And among the roads, there is a heavy dependence on a single highway— National Highway 31A (NH 31 A)—which is Sikkim’s main transport link with the rest of the country, and the world for that matter. Any major disruption to NH 31A cuts Sikkim’s only link with the outside world. The proposed second highway linking Darjeeling, Singla, Naya Bazar, Namchi and Singtam, once built, will not only increase mobility, but also bring down costs. It will serve as an alternative route to NH 31 A, and will also provide an important road link between several towns.
Roads and highways are not well maintained. The topography and climate of the region make the terrain vulnerable to landslides and erosion. The average rainfall is 400-600 cm from June to October and the entire state falls in Seismic Zone IV, which is subject to earthquakes of severe intensity. Thus roads are in constant need of repair. While the climate and terrain make road maintenance an ongoing and expensive exercise, timely maintenance can save a lot of work and money in the long run. Several tracts of roads, including the main highway, have not been repaired for long periods. In many places, the rubble has been cleared only to the extent that traffic can squeeze through. This makes the journey into and out of the state time-consuming, arduous, and dangerous in places.
Sikkim’s expenditure on road maintenance is high. The national standard for road maintenance is 0.3 worker per kilometre, or one worker to maintain three kilometres of road. Sikkim, in comparison

40 Sikkim: The People's Vision
allots 2 workers per kilometre, which has resulted in 600 to 700 workers on the muster rolls of the East District alone. At a monthly salary of over Rs 2,000 per worker, the wages and salary bill for road maintenance is a huge outgo from the state’s exchequer, despite which road conditions continue to be very poor.
2 .3 .2 U tilisation of P ublic E xpenditure B enefits
The experience of Sikkim shows that benefits intended to be reaped through public expenditure appear to be unutilised or underutilised by the community either because of inertia or other reasons. As a consequence, there are schools with damaged facilities and health centres with vastly underused expensive equipment (see box 2.5).
Box 2.5 A Visit to Chung Thang in the North District
The Primary Health Centre at Chung Thang has impressive medical facilities: an operating theatre, laboratory, dispensary, labour room, stores, and expensive dental equipment. However, much of this infrastructure is underutilised:
The operation theatre has not been used since 1998, when the last operation—minor sterilisation surgery—was performed.
Of the two doctors in the health centre, one had been transferred and the other was on leave. The only healthcare patients could receive at the Centre was medication that was being dispensed by the nurse—a Class X graduate with only two years of training. Thus, for any ailment other than minor aches and pains, patients had to go to Gangtok.
Fairly sophisticated dental equipment (supplied by Confident Dental Equipment Private Ltd.) was covered with dust and had apparently hardly, if at all, been used.
The toilet had sinks with no taps or mirrors and flushes that were not functioning.
The Government Secondary School in Chung Thang also showed poor infrastructural upkeep.
Many of the windows had no windowpanes.
The hostel that had been built to hpuse students was sparsely occupied by teachers. The canteen for students was not functioning, but a cook was on the payroll.
Two toilets built for teachers and students were covered with garbage and were inaccessible. Girls were allowed to use the toilet in the neighbouring Primary Health Centre, which itself did not have a functioning flush.
2.3 .3 G overnance and C orruption
Good governance is essential for development (see box 2.6). In Sikkim many of the elements that contribute to good governance have been eroded over the years. In particular, the large-scale recruitment of under-qualified persons to government posts has had an adverse impact on many areas of the economy and particularly on governance standards in the state. In per capita terms, Sikkim

Background: Recent Trends and Emerging Issues 41
has the highest public sector employment in the country: There are over 11,000 employees on the muster roll of various government offices.
Misgovemance and corruption lower state revenues and increase the fragility of the financial system. Government expenditure increases as commissions to various people have to be accommodated; its composition also tends to shift from spending on operations and maintenance to spending on new equipment.
Box 2.6 Good Governance is Important
Key institutional capacity elements of good governance are a comprehensive legal framework defended by an impartial and competent judicial system, accountable, open and transparent executive decision-making, coupled with a capable, flexible and efficient bureaucracy and strong civil society participation. Opportunities for corruption increase with the number and complexity of rules, licenses, taxes, and subsidies which set up conflicting property rights and require complicated resolutions. An efficient, uncorrupt bureaucracy is a key factor and it tends to encourage investment. Efficiency of public services is particularly important for the poor, who depend on public services, such as primary education and health, to improve their lot and mitigate the risks they face. Non-transparent budgeting and spending, widespread subsidies, and corruption are likely to lower the efficiency and equity of public spending.Source: India: Policy to Reduce Poverty and Accelerate Sustainable Development, 2000, World Bank.
Governance in Sikkim in this century has to set a standard for other states to emulate. As the government increasingly moves out of many of its traditional spheres, it can begin a serious downsizing process, which will allow it to focus on better delivery of truly public services. Since the government has a vital role to play in fostering development, one way to rein in corruption is to ensure the broad-based participation of people in the process: development should involve all government branches, civil society and the business community and ensure their commitment to an anti-corruption agenda. Plan schemes should be reviewed and prioritised, as over the years several Plans have been continued and expanded incrementally. All the schemes should be thoroughly reviewed and prioritised; new schemes should be made contingent on the availability of resources.
2.3.4 D ecentralisatio n
People’s participation in the development process and their influence on decision-making in the government are important if the delivery of goods and services is to improve. The decentralisation of power to local bodies such as the panchayats increases the efficiency and responsiveness of the government, as public involvement in the design and implementation of systems makes them more transparent, and bureaucrats and elected leaders more accountable. (In this regard, the state should expedite the submission of the Report of the State Finance Commission and act on its recommendations after due deliberation.)

42 Sikkim: The People’s Vision
Box 2.7 Failures in Delivery in SikkimAdministrative expenses were alarmingly high; for example, in medical services administrative expenditure accounts for 64 per cent to 73 per cent of total expenditure.
For health care worth one rupee, administrative expenses were more than Rs. 2.The state had 10 primary health centres and 62 primary health sub-centres more than the
norms stipulated by the Central government, resulting in huge extra avoidable expenditure on maintenance, rents and wages and salaries.
Despite the massive infrastructure and excessive manpower within the state, the Health Department has incurred substantial expenditure for treatment of the general public outside Sikkim. Source: Government of Sikkim, March 31,1998.
2 .4 A nomalies of G rowth
Sikkim has been growing at a satisfactory nominal rate of nearly 14.5 per cent per annum between 1980-81 and 1995-96. Real growth rate during 1980-81 to 1991-92 was impressive at 10 per cent, which is far higher than the all-India average growth. Nevertheless, the excellent growth performance masks fundamental problem of unemployment and poverty facing the economy today. High growth should have ideally led to low unemployment and eradication of poverty. But according to Planning Commission estimates (1994-95), Sikkim ranks fifth in the country in terms of poverty. It is clear that the benefits of growth have not percolated down to the people at the lower rungs of the economic ladder. Furthermore, with almost 38 per cent of the population below the age of 15, a large number of young people will be joining the labour force in the near future, which could exacerbate the unemployment problem, unless job opportunities are created for them.
For at least 65 per cent of the population, agriculture is the main means of livelihood. However, the stagnant share of agriculture in the state income could compel people to look for jobs in industry or the services sector. Available evidence indicates a very limited organised sector in the state.14
With liberalisation of the Indian economy, private investment, both domestic and foreign, has received a tremendous boost. Sikkim, however, has received neither any major domestic investment nor any foreign investment. The benefits of economic reform sweeping the economy seem to have bypassed Sikkim, notwithstanding its high growth performance.
2.4.1 S e c t o r a l G r o w t hV
Agriculture contributes nearly 49 per cent of the state’s income (table 2.3), compared to 25 per cent at the all-India level; industry accounts for only 15 per cent, compared to 27 per cent for the nation; and services account for 36 per cent of the state’s income, in comparison to the all-India figure of 48 per cent.15 In recent years, the sectoral composition has shifted from industry to services. While
14 According to the new GSDP estimates published by the CSO, the share of agriculture declines, while the share of the tertiary sector increases (see table 2.3).
15 According to GDSP estimates. However, the new estimates indicate a substantial increase of upto 50% in the share of services at the expense of agriculture (see table 2.3).

Background: Recent Trends and Emerging Issues 43
the combined share of industry (manufacturing) and services has remained the same at around 52 per cent during the last decade and a half, the share of manufacturing has declined to 2.5 per cent in 1995-96 from around 6 per cent in 1980-81. Public administration has, by default, become the propelling force behind the growth of services. In spite of high growth rates in the state, employment opportunities outside the government have remained restricted.
Sectoral shares for the period 1996-97 and 1997-98 according to the new GSDP series published by the CSO are given in the table below.
Table 2.3: Sectoral Shares of GSDP at Current Prices
(per cent)
Sector 1980-81 1985-86 1990-91 1993-94 1995-961 1995-9# 1996-972
Agriculture and Allied activities 48.68 47.40 42.63 45.30 48.99 33.30 32.44
Industry 20.91 19.62 14.74 14.90 14.94 19.37 17.47
Mining & quarrying 0.23 0.21 0.21 0.26 0.22 0.21 0.12
Manufacturing 6.07 5.35 3.97 3.04 2.51 4.94 4.61
Construction 15.10 13.28 10.41 11.10 10.54 11.48 10.30
Services 30.40 32.98 42.63 39.80 36.08 47.33 50.09
Transport 1.11 2.55 3.65 3.05 2.63 2.34 3.39
Trade, hotels, etc. 5.95 5.46 8.66 8.05 6.62 12.22 13.46
Public administration 9.28 8.88 11.98 11.99 11.10 11.25 12.04
Notes: 1. Provisional data. 2. New estimates of GSDP published by CSO.
Source: Central Statistical Organisation.
Constant Share of Agriculture
Population has grown faster than economic activity in the agricultural sector. With few employment opportunities outside the sector, the growth of agricultural labour force has also exceeded the growth of cultivated area. The mounting demographic pressure and physical limits to cultivable land have made Sikkim a net importer of all the essential agricultural goods.
Declining Share of Industry
Industry’s share in GSDP is only 15 per cent, of which 10 per cent is accounted for by construction, and 2.5 per cent by registered manufacturing (table 2.3). Industrial activity is quite rudimentary. There is virtually no organised private industry of any size in the state. Nearly, all the units of any size are in the public sector, most of which run at a loss.
Rising Share of Services
Of the 36 per cent share of services in the state’s income, 11 per cent is accounted for by traditional subsistence activities, unskilled construction work or government employment. The share of public administration has risen nearly by 2 per cent points during the period, which in part reflects the philosophy that the government’s major task is to provide employment. For example, the Public Works

44 Sikkim: The People’s Vision
Department organises its work with the non-commercial objective of generating employment. It justifies its demands for more funding for road building projects in remote areas, not on the grounds that roads are important for economic development but that these projects will result in more jobs.
From the new estimates (shown separately in the last two columns of the table 2.3) it is clear that share of agriculture has drastically declined to around 32 per cent in the year 1996-97. Industry’s share has shown a modest increase to around 17 per cent in 1996-97 which is still lower than the 21 per cent share it had in 1980-81. The services sector has witnessed a large increase to around 50 per cent in 1996-97.
2 .4 .2 “J obless” G rowth
The lack of correspondence between the growth of employment opportunities in the private sector and the impressive growth rate attained by the state deserves a deeper probe. The rise in the share of services in GSDP (propelled mainly by public administration) at the expense of industry is one explanation for this phenomenon. Sikkim is non-industrial and, therefore, mainly characterised by significant ‘imports’ from outside. So the expansionary impact of expenditure within the state in terms of employment and income generation is minimal, as a significant part of the demand leaks out of the state economy. The high import intensity of expenditure has restricted the potential for income and, therefore, employment generation within the state.
2.5 S t a t e F in a n c e s : G o v e rn m e n t U n d e r P r e s s u r e
Ny /2 .5 .1 S ikkim’s S pecial R elationship with the C entre
Sikkim is one of 10 Special Category States (SCSs) which receive substantial financial and non- financial support from the central government. It currently gets 90 per cent of its plan assistance as grants, and the remaining 10 per cent as loans.
Box 2.8 Financing in Special Category States
Special Category States (SCSs) receive preferential treatment in the distribution of normal central assistance for state plans. From the total central assistance available for state plans, funds are earmarked for externally aided projects and special area programmes (hill areas, tribal sub-plans, border areas, North-East Council, etc). The remaining state plan assistance is distributed in the ratio o f30:70 between the 10 SCSs and 15 non-SCSs. This gives the SCSs a far higher proportion than is warranted by population proportionality, given that the total SCS population was only around 6 per cent of the national population in 1999. The Gadgil formula does not apply in the determination of the distribution between non-SCSs and SCSs. If it had, the SCSs would have been at a disadvantage since the formula assigns higher weights to population (according to the 1971 census) and deviation of per capita income from the national average.
The SCSs also receive plan assistance on far more favourable terms than do other states. Their grant-loan ratio is 90:10, which is 30:70 for non-SCSs. The inter se distribution among the SCSs is determined by previous plan size and the special problems and priorities of each state.

Background: Recent Trends and Emerging Issues 45
The Missing MultiplierIn Sikkim, per capita grants (including plan and non-plan grants) have been a substantial 60 per cent of per capita income since 1989-90 (chart 2.10). Inflows of grants from the Centre have been financing nearly 50 per cent of state government expenditure.16) Although the share has been fluctuating, there is no clear sign of a decline. Transfers from the Centre are exogenous injections of resources into the state’s economy. A part of such transfers pays for the wages and salaries of government employees, while the rest goes into government consumption and investment. Either way, the inflow of grants directly generates incomes and expands the size of the market. Normally a rupee spent by the government should lead to many rupees worth of income being generated in the state.17 The chain of income generation that results in additional income generation of a multiple of the additional government expenditure is known as the multiplier effect.
The ratio of total government expenditure (revenue expenditure and capital outlay) to GSDP was as high as 82.4 per cent in 1995-96, which implies an average multiplier of only 1.21. Normally, high expenditure should lead to a much higher level of income. The low value of the average multiplier or the “missing multiplier” could either be a result of a large proportion of government expenditure on goods and services produced outside the state, which would fail to trigger off a chain of income generation within the state, or the result of beneficiaries parking their funds outside the state. It could also point to the possibility of gaps in expenditure management and leakages.
16 Grants, both plan and non-plan, as a proportion of total government expenditure, comprising capital outlay and revenue expenditure (net of lotteries), was nearly 49.9 per cent in 1989-90 and has been raised to 51.3 per cent in 1999-2000.
17 For example, a rupee paid as income to a government employee will not only directly generate a rupee of additional income for the employee, but indirectly generate say another 80 paise of income for the grocer, baker, weaver, etc. when the employee spends 80 paise out of the Re 1 income. Subsequently, there will be further rounds of income generation as the grocer, baker and weaver in turn spend parts of their additional income on their consumption and so on. Ultimately, at the “end” of the chain, income could rise by as much as Rs. 5.

46 Sikkim: The People *s Vision
2.5.2 T rends in R evenue and E xpenditure
The government’s collection of tax and non-tax revenue is declining, even though recorded GSDP has been growing steadily (chart 2.11). Further, the low buoyancy of the state’s own taxes has resulted in the unsatisfactory performance of taxes (table 2.4). Except for state sales tax and motor vehicles tax, buoyancies are well below one. Over the years, own-tax revenue as well as non-tax revenue (net of lotteries) as a proportion of GSDP have fallen from a peak of 7.79 per cent and 10.07 per cent, respectively, in 1989-90 to 6.66 percent and 3.97 per cent, respectively, in 1998-99 and have been revised to 6.45 per cent and 4.74 per cent, respectively, in 1999-2000. As a result, total own receipts (own-tax and non-tax) in terms of GSDP dropped by nearly 7 per cent during the period 1989-90 to 1997-98.18
Table 2.4: Buoyancies of the State’s Own Taxes
Taxes Buoyancies1
Total own-tax revenue 0.579Taxes on income levied under the state laws 0.572Land revenue 0.642Stamps and registration fees 0.710State excise tax 0.326Total state sales tax (inclusive of CST) 1.061State sales tax 0.931Tax on vehicles 1.278Other taxes on commodities and services 0.009
Note: 1. Estimated for the period 1989-90 to 1998-99.
Source: National Institute of Public Finance and Policy, Working Estimates.
Even within total state sales taxes, a category that has a buoyancy in excess of unity, it is the Central Sales Tax (CST) collected on inter-state sales that has performed well. Sikkim collects CST at the rate of 4 per cent on declared goods, which are goods specified under Section 14 of the CST Act, 1956. However, the CST on commercial crops, such as cardamom, ginger and tea is levied at 3 per cent of sale value. Total revenue from CST was as much as Rs 1.27 crore out of total state sales tax revenues of Rs 7.4 crore in 1995-96. State sales tax had a buoyancy of only 0.931, indicating a falling share of such revenues in the GSDP.
The fall in the collection of tax and non-tax revenue by the state was compensated by a marginal rise in the share of Central taxes and a large increase in grants. In terms of GSDP during 1989-90 to 1995-96, the share of Central taxes and grants have risen from 8.33 and 39.62 per cent, respectively, to 9.52 and 51.08 per cent, respectively. Although the share of Central taxes is expected to go up to13.10 per cent, grants are expected to go down to nearly 43 per cent in 1999-2000. The composition of own revenues has also been changing over the years: in 1989-90, own-revenues—both tax and non-tax (without lotteries)—constituted nearly 27 per cent of total revenue receipts (without lotteries), and the share is expected to go down to only 20.61 per cent in 1999-2000.
18 Lotteries are excluded.

The fall in non-tax revenue has been mainly due to poor collection from interest receipts, profit and dividends, and economic services. The share of social services in non-tax revenue (net of lotteries) has remained nearly stagnant while the shares of interest receipts, etc., and economic services have actually fallen.19 In economic services, the growth in yields has been particularly poor in education, health and road transport, indicating the non-revision or inadequate revision of user charges over the years.
Background: Recent Trends and Emerging Issues 47
Note: Own revenue includes own-tax and non-tax; grants-in-aid include plan and non-plan grants; total revenue excludes lotteries; total expenditure is the sum of revenue expenditure (net of lotteries) and capital outlay.
Sources: Finance Accounts, various issues; An Abstract o f Public Finance: 1979-80 to 1994-95 and Annual Financial Statement (Budget) 2000-01, Government of Sikkim.
Over the period 1989-90 to 1999-2000, capital outlays in terms of GSDP have fallen by more than 4 per cent. Capital outlay in terms of GSDP, after rising to 26.33 per cent in 1991-92 from 22.84 per cent in 1989-90, fell to 13.07 per cent in 1998-99. Though the proportion of public sector capital outlays in GSDP as well as the shares of both social and economic services in GSDP have been fluctuating over time, a clear downward trend is visible.
There has been a substantial rise in revenue expenditure during the late nineties, with a significant jump in 1998-99 by more than 10 per cent points. The rise may be ascribed to the implementation of the Pay Commission recommendation. There is an apparent shift towards social services and away from economic services. A cause for concern is the steady rise in interest payment (in terms of GSDP) from 3.65 per cent in 1989-90 to 6.12 per cent in 1995-96 and projected at more than 9 per cent by
19 The shares of interest receipts, profits, and economic services in non-tax revenue (without lotteries) are likely to fall to 1.7, 1.2 and 42.4 per cent in 1999-2000 from 6.3, 0.96 and 61 per cent, respectively, in 1989-90.

48 Sikkim: The People’s Vision
Table 2.5: Key Fiscal Variables: 1989-90 to 2000-01
(per cent of GSDPX)
1989-90 1991-92 1993-94 1994-95 1995-96 1996-97 1997-98 1998-99 1999-20002 2000-013
Revenue Receipts 65.81 70.31 62.21 55.75 71.51 65.87 64.72 63.75 67.47 NAOwn-tax revenue 7.79 5.95 5.78 4.40 5.75 5.54 5.92 6.66 6.45 6.00Non-tax revenue4 10.07 11.04 7.62 5.99 5.16 5.12 4.71 3.97 4.74 NAShare of central taxes 8.33 9.83 9.97 8.51 9.52 13.57 12.97 13.13 13.10 12.57Grants from the centre 39.62 43.50 38.85 36.85 51.08 41.64 41.11 39.99 43.18 43.80
Revenue Expenditure 56.50 59.77 52.24 51.13 61.03 60.86 60.29 73.71 70.92 NAInterest Payment 3.65 5.73 6.01 6.07 6.12 6.10 7.08 7.93 9.36 9.68Social services 19.23 20.19 17.44 17.42 22.26 23.12 23.29 30.22 25.46 21.32Economic services 25.19 25.15 19.88 19.13 23.17 21.83 20.75 22.16 23.89 22.35
Capital ExpenditureCapital Outlay 22.84 26.33 18.61 15.52 21.35 17.43 17.41 13.07 18.49 21.30Social services 6.80 6.38 6.37 5.00 6.79 5.05 5.37 4.23 5.87 8.52Economic services 15.24 18.42 11.46 9.77 13.46 11.39 10.97 8.18 12.17 12.44
Deficits and DebtRevenue deficit5 -9.31 -10.54 -9.96 -4.61 -12.66 -7.17 -6.70 7.82 -0.03 -5.26Fiscal deficit 14.25 15.83 8.50 10.62 8.46 10.35 10.96 20.91 18.49 16.02Primary deficit 10.60 10.09 2.50 4.55 2.34 4.24 3.88 12.98 9.13 6.34Outstanding debt 55.26 63.29 59.40 56.59 58.33 57.88 57.88 71.87 80.33 84.43
Notes: 1. GSDP from 1995-96 has been projected to grow at an estimated rate of 14 per cent per annum.2. Revised estimates.3. Budget estimates.4. Excludes collection from lotteries.5. Difference between revenue expenditure and revenue receipts, but inclusive of lotteries.
Sources: Finance Accounts, various issues and Annual Financial Statement (Budget) of the Government of Sikkim, June 2000.
1999-2000. The rise in the interest burden is attributable to a shift in the composition of debt towards the more expensive internal borrowing, and saving and provident fund, away from loans and advances from the centre.
Sikkim’s fiscal health is good if judged by its revenue surplus. The revenue balance has been in surplus every year since 1989-90 except for 1998-99. In 1998-99, the revenue surplus turned into a deficit of Rs 54.94 crore, but the problem appears to have been rectified, with a revenue surplus of Rs 48 crore budgeted for the year 2000-01. There is a problem, however, with the state’s high nonplan revenue deficits, which have increased from Rs. 3.39 crore in 1990-91 to Rs. 58.7 crore in 199798. The Eleventh Finance Commission estimates for 2000-01 show a very high non-plan revenue deficit of Rs. 169.70 crore. The surplus on the revenue account is, therefore, primarily attributable to transfers from the centre on plan account, which have allowed the state to spend more than its borrowings on capital formation.
The fiscal deficit which had been fluctuating during this period at around 12 per cent, has shown an upward trend in recent years. It went up to Rs. 146.86 crore in 1998-99 from Rs. 67.53 crore in1997-98. As a percentage of GSDP, the fiscal deficit touched an alarmingly high level of 20.91 per cent in 1998-99, up from 10.96 per cent in 1997-98. Payment of salary arrears arising out of pay

Background: Recent Trends and Emerging Issues 49
revision as reflected in the profile of revenue expenditure led to a rapid rise in the fiscal deficit in1998-99, a part of which was impounded into the provident fund. Budget estimates indicate that the primary deficit is expected to decline from 10.6 in 1989-90 to 6.34 in 2000-01 after soaring to 12.98 in 1998-99. A steady rise in interest payment is exerting pressure on the government to economise on expenditures and limiting the primary deficit to make room for interest payments (see table A3.9).
2 .5 .3 D ebt
The state’s outstanding debt as a percentage of GSDP has been rising. Sikkim’s indebtedness to the centre and the financial institutions has reached very high levels, with larger plan sizes leading to higher borrowing. Continuation of the trend will soon result in a scenario where debt servicing (repayment of loans) and interest payment together will outweigh borrowings, and thereby lead to a reverse flow of resources. Outstanding debt which was estimated to be Rs. 112.7 crore at end-March, 1990, has grown nearly six times by 2000.
Interest payment and debt servicing as a percentage of borrowing from the three alternative sources tends to be very close to 100 (table 2.6). For internal debt (which is market borrowings), in fact, debt service has exceeded 100 per cent of gross borrowings almost continuously since 1993-94,
Box 2.9 A Comparison Amongst the Special Category States
A per capita comparison of the major fiscal variables of the Special Category States (SCS) is presented in table 2.7. In 1995-96, Sikkim’s per capita income (NSDP at factor cost at current prices), while lower than the national average, was less than that of only two of the NorthEastern states. Sikkim also has the lowest population amongst all the SCSs.
For own-tax revenues per capita, Sikkim, like all the SCSs, ranks below the national average, but is second among all the SCSs.
For non-tax revenues (excluding lotteries), Sikkim is far above the all-India average, ranking just below Arunachal Pradesh.
In terms of share in tax devolution, Sikkim ranks fourth amongst the SCSs.
In terms of per capita grants, not only is Sikkim higher than the national average (as is to be expected), it is the highest among the SCSs, followed by Arunachal Pradesh and Mizoram.
For per capita plan outlay in 1997-98, Sikkim was second only to Arunachal Pradesh and far above the national figure. Given the poor state of infrastructure in the state, expenditure on this front is in line with the priorities of the government.
In comparison with the other SCSs, Sikkim performs well in terms of per capita own-tax and non-tax revenue. Plan expenditure-wise too, Sikkim is close to the top. These positive features, however, are clouded by its high outstanding debt, although the per capita debt estimates tend to be high partly because of Sikkim’s low population.
Source: State Finances: A Study o f Budgets o f 1999-2000, Reserve Bank of India, January 2000.

50 Sikkim: The People's Vision
implying a net outflow of resources. This is a serious cause for concern, as debt service in such a situation starts to displace other government expenditures.
Table 2.6: Net Inflow/Outflow of Resources from Borrowing
(per cent)
Year Debt servicing + Interest payment / Addition during the year
Internal debt Loans & advances from Centre Other liabilities1
1993-94 127 102 74
1994-95 101 93 89
1995-96 99 89 92
1996-97 116 89 86
1997-98 105 98 87
Note: 1. Includes small savings, provident fund, reserve funds and deposits.Source: Report o f the Comptroller and Auditor General o f India, Government of Sikkim, 1998.
Table 2.7: Finances of Special Category States: A Per Capita Comparison, 1997-98
(in rupees)
Own Tax Non-tax Share in Central Taxes
Grants Outstanding Debt (on March 30,1998)
Plan Outlay
Arunachal Pradesh 86.1 480.7 2,143.2 4,646.7 6,845.3 5,272.4
Assam 342.7 148.1 573.3 616.8 2,414.1 586.8
Himachal Pradesh 736.1 325.8 1,006.6 1,269.1 6,129.2 1,558.2
Jammu & Kashmir 382.7 283.9 1,182.1 2,617.2 6,100.4 1,616.5
Manipur 148.4 168.7 1,291.8 1,978.0 3,595.2 1,704.1
Meghalaya 316.4 128.5 1,233.0 1,318.1 2,411.9 1,642.3
Mizoram 86.9 327.1 2,727.2 4,618.3 6,523.7 3,190.3
Nagaland 208.7 282.2 2,611.8 3,084.1 7,395.6 1,813.1
Sikkim 513.1 543.6 1,666.7 4,741.6 6,685.4 4,119.9Tripura 198.2 96.6 1,189.6 1,510.7 3,113.8 1,217.8
All States 833.3 250.7 414.6 248.5 2,884.9 650.0
Note: 1. Excludes lotteries.Source: State Finances: A Study o f Budgets o f 1999-2000, Reserve Bank of India, January, 2000.
2 .6 B usiness as U sual: U nsustainable and P recarious
The management of state finances is becoming increasingly difficult. The revised estimates of the fiscal deficit and outstanding debt at 18.49 per cent and 80 per cent, respectively, of GSDP in 19992000 are clear indications of the unsustainability of the present fiscal stance. A continuation of the present situation will result in the government being forced to take several strong and unpopular measures in the future to avert a crisis and restore sustainability. Forced adjustments to deal with crises are invariably arbitrary, and have adverse and undesirable consequences. The base scenario presented below is one of the many ways events could unfold if ‘business carries on as usual’. The

Background: Recent Trends and Emerging Issues 51
idea is not to predict the shape of the things to come, but to illustrate the adverse consequences of not initiating on an urgent basis the process of adjustment and fiscal reforms.
2.6 .1 T he P rojection M ethodology
The total resources of the government comprise revenue receipts and capital receipts (net). Revenue receipts have been projected on the basis of historical trends. The different components of own-tax revenue have been projected till 2004-05, based on their respective buoyancies estimated for the period of 1989-90 to 1997-98 and an assumed GSDP nominal growth rate of 14 per cent per annum.20 Given that the rate of growth of nominal GSDP is higher than in the past and the lack of own-tax buoyancy (apart from sales and motor vehicles taxes), the share of own-tax revenues in GSDP declines further from 6.40 per cent in 1999-2000 to 5.25 per cent by the year 2004-05.
Non-tax revenues have also been projected at a disaggregated level. The four components of non-tax revenues are revenues from (i) interest receipts, dividends and profits, (ii) general services, (iii) social services, and (iv) economic services. For interest receipts, dividends and profits, the historical negative annual growth rate of 4 per cent has been extrapolated until 2004-05. Revenues from general services include (under the miscellaneous head) receipts from lotteries, which tend to be very high, although the associated expenditures for lotteries also tend to be considerable. The average rate of growth of 6 per cent in the last two years has been applied to revenues from general services to obtain the projections. Similarly, for projecting the other two components—revenues from social and economic services—the average growth rates of 14 per cent and 6 per cent, respectively, observed during 1989-90 to 1999-2000, have been used. Because of the considerably slower growth in the components of non-tax revenues relative to GSDP, non-tax revenues decline from 3.69 per cent of GSDP in 1999-2000 to 2.55 per cent in 2004-05.21
Sikkim’s share of Central tax revenues as estimated by the Eleventh Finance Commission has been incorporated for the period 2000-01 to 2004-05 (see the Report o f the Eleventh Finance Commission, June 2000, Annexure VI-8) for the projection exercise. Sikkim’s share in Central taxes falls marginally over the period by 1.15 per cent under the baseline scenario.
The total plan grants of the state government have been allowed to grow at a robust rate of 14 per cent, which is higher than the Plan Authority estimates contained in the memorandum submitted to the Eleventh Finance Commission. Non-plan grant estimates have been taken from the Eleventh Finance Commission and comprise two parts: non-plan revenue grant and upgradation and special purpose grants. The estimates of the Eleventh Finance Commission have been used to project the future profile of non-plan grants. This results in an increase in grants, including the share in taxes as a proportion of GSDP, from 44 per cent in 1999-2000 to 49 per cent in 2004-05.
20 Tax revenue in period (t + 1) = tax revenue at t x ( 1 + tax buoyancy x GSDP growth rate). The Finance Commission has used a GSDP growth rate of 13 per cent for its projection.
21 The projected estimate of own-tax revenue exceeds the state’s estimate by 5 per cent in 2004-05, whereas the projected non-tax revenue is lower than the state’s estimate. The state’s estimate is based on an application of 10 per cent annual growth rate to the 1999-2000 estimate of non-tax revenue, which is lower than the Budget estimate resulting in a higher profile of non-tax revenue. Growth rates have been applied to the Budget estimate of non-tax revenue in the above projection exercise.

52 Sikkim: The People’s Vision
According to the Eleventh Finance Commission, since a substantial amount of grants-in-aid is being given to SCSs to meet the demand on non-plan revenue account, the diversion of plan expenditure to the non-plan category should be discontinued, and Planning Commission funds should be used for plan expenditures and to build sound infrastructure for accelerated development. Total grants are expected to experience a downfall from 42.80 to 40.91 during 1999-2000 to 2004-05.
Capital receipts (net), comprising internal debt, loans and advances from the Centre, savings and provident fund, recoveries and net withdrawal of funds from the Public Account net of small saving and provident fund, have also been taken to be the same as the estimates submitted to the Eleventh Finance Commission by the state government. The drastic fall is expected because the state had an abnormally high fiscal deficit for two consecutive years as a result of the implementation of the State Pay Commission’s recommendations. Under the baseline scenario, total receipts decline by nearly 15 percentage points from 84.4 per cent in GSDP in 1999-2000 to 69.7 per cent in 2004-05 (net of lotteries).
Box 2.10 Determining a State’s Share in Union Tax Revenue
Based on an assessment of the Centre and states’ budgetary resources and requirements, the Eleventh Finance Commission (EFC) has suggested that the states’ share should be fixed at 29.5 per cent of the net proceeds of all taxes and duties in the Union List from 2000-01 to 2004-05. The inter se distribution among the states will be based on 28 per cent of net proceeds; the additional 1.5 per cent of all shareable Union taxes and duties will be allocated separately. States that levy and collect sales tax on sugar, textile and tobacco are not entitled to a share of this 1.5 per cent.
The inter se distribution of the aggregate share of the states in central tax revenues is determined by the following criteria and relative weights.
Relative Weights to Determine the Inter se Shares of States
Criteria Population Income Area InfrastructureIndex
Tax Effort FiscalDiscipline
Relative Weight (%)
10.0 62.5 7.5 7.5 5.0 7.5
The major considerations in the selection of these criteria, which are based on equity and efficiency, are resource deficiency, the cost of providing services and fiscal discipline
To evolve a suitable structure of incentives to provide for fiscal discipline, the tax effort and index of fiscal discipline together have been assigned a weight of 12.5 per cent.
Sikkim’s share has been fixed at 0.184 per cent. It may be noted that the index of fiscal discipline for Sikkim (which measures its own revenues as a proportion of revenue expenditure) has deteriorated from a ratio of 0.2023 (1990-91 to 1992-93) to 0.1395 (1996-97 to 1998-99). The deterioration is also reflected in the index which is 71.44 vis-a-vis 100 for all states.
Source: Report o f the Eleventh Finance Commission fo r 2000-05, June 2000.

Background: Recent Trends and Emerging Issues 53
Expenditures have also been projected at a disaggregated level. The different components of revenue expenditure (except for interest payments which are state government’s estimates) have been extrapolated; capital outlays are based on historical growth rates. Past trends indicate a shift in the composition of revenue expenditure from economic services to social services. For 1989-90 to 199798, the growth rates for social and economic services have been estimated to be 18 and 12.5 per cent per annum, respectively, in conformity with this compositional change.22 For the components of general services, organs of state and pension and miscellaneous services, the historical growth rates for the period 1989-90 to 1997-98 of 14 and 5.7 per cent, respectively, have been applied. For the period 1992-93 to 1997-98, for fiscal and administrative services, the growth rates applied are 18.2 and 15 per cent, respectively.23 The surplus in the revenue account turns eventually to a deficit by the year 2001-02 and rises further to 12 per cent of GSDP by 2004-05.
Capital outlay has been projected to grow at nearly 12 per cent per annum, the rate estimated for the period 1989-90 to 1999-2000. The falling share of capital outlay observed in the past not only continues but gets accentuated over the projection years. By 2004-05, the share falls by 1.6 percentage points to 16.7 per cent. The historically determined growth of expenditures is obtained by aggregating revenue and capital expenditure.
Total receipts from all sources, including borrowing, fall short of the resource requirements for financing the projected expenditures, which consist of revenue and capital outlays over the projection period.24 The balance of resources is defined as total receipts minus total expenditure and this is negative for all years. This is clearly a precarious and unsustainable situation. Since the state cannot freely borrow more, the brunt of adjustment is likely to be borne by some combination of expenditure compression, in particular capital outlay and maintenance (the discretionary elements of expenditure) and additional resource mobilisation, for example, from tax and non-tax sources. Three scenarios have been delineated to indicate what the state may have to do to deal with the evolving fiscal stress (table 2.8).
2.6.2 T he S cenarios
In the first scenario, the entire burden of adjustment is borne by a compression of capital outlay, which is completely squeezed (and turns out to be a negative per cent of GSDP by 2004-05). This illustrates how precarious and unsustainable the scenario is as capital outlay, which is linked to Plan grants, cannot decline to such a level.
In the second scenario (chart 2.12), additional grants from the Centre (over the normal share that the state receives) are expected to finance expenditure. The requirement for additional grants
22 Estimated growth rates for social and economic services for the period 1989-90 to 1999-2000 were higher by 19.69 and 13.5 per cent, respectively. This may partly reflect the implementation of the recommendations of the State Pay Commission.
23 Growth rates for the period 1989-90 to 1997-98 were higher at 21.4 and 16.5 per cent, respectively. The applied growth rates were chosen as they relate to the recent past.
24 Since receipts and expenditure are net of lotteries, the future revenue profile is underestimated by the extent of the net revenues from lotteries, which was around 3.45 per cent of GSDP (or Rs. 27.9 crore) in 1999-2000.

Table 2.8: Base Scenario: Summary of Results
54 Sikkim: The People*s Vision
(per cent of GSDP)
1999-20001 2000-01 2001-02 2002-03 2003-04 2004-05
A. Revenue Receipts (net of lotteries) 66.88 72.08 68.06 65.60 63.31 60.54Own Tax Revenue 6.40 6.13 5.88 5.65 5.44 5.25Non-Tax Revenue (net of lotteries) 3.69 3.42 3.18 2.95 2.74 2.55
Share in Central Taxes 12.98 10.75 11.05 11.28 11.58 11.83Grants 42.80 51.78 47.96 45.71 43.54 40.91
B. Capital Receipts (net) 14.10 9.81 11.84 11.16 10.06 9.18Total Receipts (net of lotteries) (A+B) 84.37 81.89 79.91 76.75 73.37 69.72I. Revenue Exp. (net of lotteries) 68.04 69.93 71.18 71.74 72.81 74.30
Social Services 25.24 26.13 27.04 27.99 28.98 29.99
Economic Services 23.68 23.37 23.06 22.76 22.46 22.17
Gen. Service of which Interest Payment 8.76 9.91 10.41 10.20 10.49 11.18
II. Capital Outlay 18.33 18.00 17.67 17.35 17.04 16.73Total Expenditure (net of lotteries) (I+II) 86.37 87.93 88.85 89.09 89.85 91.02
Revenue Deficit -0.03 -4.18 1.22 4.39 7.88 12.25
Balance of Resources -4.01 -7.05 -10.59 -14.86 -19.79Fiscal Deficit 16.10 9.68 11.73 11.05 9.96 9.09
Primary Deficit 7.34 -0.23 1.32 0.85 -0.53 -2.08
Outstanding Debt 77.47 77.58 79.73 80.94 80.92 80.04
Scenario I Residual: Capital Outlay 13.99 10.62 6.77 2.18 -3.07
Scenario II Residual: Additional Central Grants 4.01 7.05 10.59 14.86 19.79
Scenario III (Res. Add. Borrowing) Fiscal Deficit 13.69 20.22 25.03 30.43 37.01
Primary Deficit 3.78 8.37 11.44 14.32 17.71
Outstanding Debt 81.65 91.84 105.59 123.05 144.95
Memorandum ItemsRevenue Receipts2 191.44 188.50 176.01 165.68 156.11 146.58
Non Tax Revenue2 129.25 119.84 111.12 103.04 95.54 88.59
Net Borrowing3 14.91 9.63 11.68 11.00 9.92 9.06
Total Receipts2 205.53 198.31 187.86 176.84 166.17 155.77
Total Revenue Expenditure2 191.40 184.32 177.24 170.08 163.99 158.83
Total Expenditure2 209.74 202.32 194.91 187.43 181.03 175.56
Notes: 1. Revised estimate; 2. Includes lotteries: 3. Includes recovery of loans and net public account transactions other
than small savings and provident fund.Source: NIPFP, Working Estimates.
steadily increases to 19.79 per cent of the projected GSDP by the end of the projection period. This again is clearly unrealistic, given the stress that Central government finances are already experiencing.
In the third scenario (chart 2.13), the state borrows from the market to meet the shortfall in resources. Once the state takes recourse to additional borrowing in the first year of projection, interest payments rise. These feed into the next year’s expenditure, which are then higher than what they

Per
cent
of
GSDP
Pe
r ce
nt o
f G
SDP
70.0
Background: Recent Trends and Emerging Issues 55
Chart 2.12 Scenario 2: Additional Central Grants
1999-00(B) 2000-01 2001-02 2002-03 2003-04 2004-05Year
CentralGrants
' Grants incl. Add.Grants
Chart 2.13 Scenario 3: Debt with Additional Borrowing
1999-00(B) 2000-01 2001-02 2002-03 2003-04 2004-05
Year
OutstandingDebt
Debt with Add. Borrowing
56 Sikkim: The People's Vision
Box 2.11 The Eleventh Finance Commission’s Recommendations on Restructuring Special Category States (SCSs) Finances
The Eleventh Finance Commission (EFC) Report has outlined how state finances should be restructured. The poor economic bases of the SCSs mean that their own revenue sources can finance only a small fraction of their revenue expenditure. The gap is generally bridged by resources from the Centre. The non-plan revenue deficits of SCSs before devolution tend to be very large. Since 90 per cent of central assistance for the state plans is in the form of grants, their revenue accounts are generally in surplus. Even so, the SCSs have high fiscal deficits, often exceeding 10 per cent of their GSDP. In view of this, the EFC has suggested the following:
The non-plan revenue account gap after devolution of central taxes should be bridged by Finance Commission grants. This would halt the diversion of plan resources to the non-plan account.
The Centre should assume responsibility for development infrastructure in key areas that require large investments.
The system for plan assistance to SCSs needs to be reviewed.
Source: Report of the Eleventh Finance Commission for 2000-05, June 2000.
would have been. The state falls into a vicious debt trap with the fiscal deficit reaching an unmanageably high level of nearly 37 per cent by the end of the projection year, and the debt-to- GSDP ratio skyrocketing to nearly 145 per cent.
The three scenarios clearly indicate a deep-rooted malaise in the current situation which needs to be addressed through vigorous reforms. Even if the second scenario is accepted as remotely plausible, the desirability of building Sikkim largely on the basis of Central grants needs to be examined: while this may be possible in the medium term, in the longer run such a dependency could be disastrous. The falling share of capital outlay in scenario 1 or burgeoning debt to GSDP ratio (scenario 3) is not the only manifestations of the crisis. Despite a continuous rise in Central grants, the result is a fall in capital outlay as a percentage of GSDP. The declining share of own revenue, and steadily increasing revenue expenditure as reflected in the revenue deficit are at the root of the crisis.

F ulfilling the V ision
3.1 E c o n o m ic S t r a t e g y
3.1.1 S atisfactory P rogress
Sikkim has made great progress in terms of human and gender development in the last three decades. For example, literacy has gone up from 17.7 per cent in 1971 to 78 per cent in 1996-97, well above the all-India average of 62 per cent. The infant mortality rate, similarly, went down from 88 per thousand in 1987-89 to 51 per thousand in 1997. The state does not have the problems of female infanticide and dowry deaths, and in 1995, female enrolment ratio in middle school was higher for girls than for boys. During recent years there has been considerable progress with the Human Development Index (HDI) improving from 0.454 in 1991 to 0.532 in 1998.'
Per capita income (net state domestic product at factor cost at 1980-81 prices) more than doubled from Rs 1,571 in 1980-81 to Rs 3,492 in 1991-92.2 This increase was much sharper than the 37 per cent increase in the average per capita income in the country. The rapid increase resulted in per capita income in Sikkim, which was lower than the all-India average in 1980-81, exceeding the country average by 57 per cent in 1991-92.
In spite of good progress in HDI, the Gender Development Index (GDI), and per capita income, problems of poverty and unemployment persist and the sustainability of the development strategy of the past is under serious doubt. Doubts about the sustainability of the strategy get reinforced by the deceleration in the growth of HDI and GDI in recent years. For example, the HDI, after increasing from 0.454 in 1991 to 0.509 in 1995, improved only to 0.532 in 1998. Similarly, the increase in the GDI from 0.499 in 1995 to 0.528 in 1998 was smaller than the increase from 0.445 to 0.499 between 1991 and 1995.
3.1 .2 P ast S trategy
The cornerstone of the development strategy pursued so far has been a super-active government in all spheres of economic activity. Direct government employment has increased to about 25,000 in1999, implying a quarter of the population (assuming 4 dependants per government employee)
1 See Lama (2000).
2 Data for real per capita income in Sikkim is available only up to 1991-92, Indian Public Finance Statistics (1998-99).

58 Sikkim: The People’s Vision
depending directly on the government for their livelihood.3 Expenditure on wages, salaries and pension, and on interest payments, constitute 35.4 per cent and 8.9 per cent, respectively, of total government expenditure. For example, in 1998-99 the share of these two items in total government expenditure was pre-empting almost half of total government expenditure. The impact of public spending on the state’s economy has been somewhat limited. With the Gross State Domestic Product (GSDP) at only 1.2 times government expenditure, there is a problem of the “missing multiplier”. A rupee of government expenditure appears to be generating little extra income beyond the rupee of income that it directly generates in the first round. While the implementation of several plan schemes has contributed to the establishment of relatively modem infrastructure in education and primary health, available evidence suggests that some of these assets are in a state of bad repair and utilisation, and some services have already been adversely affected.
Revenues of the government—including devolved funds from the centre, plan assistance, and own revenues—have not kept pace with galloping expenditure resulting in double digit fiscal deficits in seven out of the past ten years. Fuelled partly by the implementation of the Pay Commission’s recommendations, the deficit reached a staggeringly high figure of 20.91 per cent of GSDP in 199899; the revised figure for 1999-2000 is 18.5 per cent of GSDP. High deficits have resulted in mounting debts. The debt-to-GSDP ratio has rapidly increased from 55.3 per cent in 1989-90 to over 80 per cent in 1999-2000. In 1995-96, in terms of the debt-to-GSDP ratio, Sikkim was the third highest in India after Jammu and Kashmir, and Nagaland. The debt-dynamics, by contributing to the burgeoning interest burden, has squeezed the share of capital expenditure in total government expenditure in Sikkim. The relevant share has fallen from 28.8 per cent to 21.4 per cent between 1989-90 and 19992000. The strategy of generating further direct employment in the government and stepping up government expenditure in other areas without improving the effectiveness of government expenditure is unsustainable.
3 .1 .3 D esigning a N ew S trategy
Strategy may be defined as a consistent well-articulated plan to achieve stated goals over a specified time frame. The stated goal is achieving an accelerated path of eco-friendly sustainable development, with a sharp focus on income and employment generation for the youth and the economically weaker sections of the population. Past strategy not only has not delivered the stated goals, but also is unsustainable. Thus, there is an urgent need for devising a new strategy.
The strategy design has to contain a clear delineation of the instruments to achieve these goals. Further, as already stated, the goal has to be achieved through a two-pronged approach of applying science and technology to economic activity and through government-private sector partnership. These instruments have to aim at promoting private sector initiatives in identified sectors, enhancing the application of science and technology in these activities, and empowering the people with appropriate skills for employment in the identified sectors. Such a strategy specifying the components of the vision or goals, the sectors that will act as thrust areas to these goals, and the instruments that will
' Government for this purpose includes departments of the Government of Sikkim and district administration. It does
not include public sector enterprises.

Fulfilling the Vision 59
promote activities in the specified sectors to realise the vision are shown in the economic strategy matrix that follows. The last column of the matrix explains in brief how the instruments will help in the realisation of the goals.
Horticulture (including the growing of fruits, vegetables, flowers, ornamental shrubs and trees), poultry and animal husbandry can help the state build on its existing strengths, generate employment and alleviate poverty. The sectors have languished without the application of modern science and technology (including improved seeds, feed and fodder, and modem farm practices), proper roads, smooth transportation and storage facilities, access to markets and remunerative prices, and veterinary facilities. Given the eco-friendly income and employment potential of these sectors, the government must redress these deficiencies.
3.1.4 E conom ic S trategy
The experience of direct government involvement in agricultural farms, animal breeding, and cold storage (which was closed for over six years and has only recently been leased out) has not been a happy one. Accordingly, the government needs to shift its role to that of a facilitator for promoting private sector activities in horticulture, poultry and animal husbandry. The government must attract the private sector to set up a feed and fodder plant to alleviate supply problems. It must also encourage the private sector to set up cold storage and processing factories. The mission of attracting private investment will have to involve identifying problems faced by private entrepreneurs, aiding them with land acquisition and funding from banks and financial institutions. While joint venture projects can be considered, the prime aim of the government should be to entrust full management responsibility and risk to the private investor.
Vision/Goals Sectors Instruments Intended Effects
Removal of poverty; creation of employment opportunities in the economy, both in selfemployment and in the
private sector.
Horticulture, Poultry, Animal Husbandry
• Strengthen co-operatives to
improve the input and credit supply, access to information
and marketing networks.
• Encourage private sector
participation in areas such as feed and fodder development, setting up cold storages, veterinary services and agroprocessing;
• Strengthen extension services.
• Farmers will be better
informed about new technologies, prices and markets, and
have access to more timely
supply and better quality of inputs and health services.
• Better storage facilities & the
introduction of agro-processing
will encourage farmers to
increase production and generate a surplus for export.
Promotion of congenial business infrastructure and resources.
Industry, especially service-oriented industry such as tourism and
information technology.
• Promote Sikkim as an investment and tourist destination.
• Announce a new industrial
policy, with emphasis on IT.
• The growth of private industry will increase employment opportunities directly and
indirectly, with the growth in
supporting and related industries.

60 Sikkim: The People \s Vision
Vision/Goals Sectors Instruments Intended Effects
• Identify land to be used as
industrial growth centres; lease
sheds to private individuals.
• Simplify laws to allow land to
be used as collateral.
• D evelop an envionmentally
sound tourism policy; strengthen
the State Tourism Development Corporation.
• The growth of eco-friendly
tourism will create jobs at all income levels, directly and
through its high trickle down
effect, reduce regional disparities and boost the
demand for local industry and
services.
Education • Education Department to set up a cell to monitor job
opportunities in the medium
term.
• Reorient the education
curriculum and set up
vocational training institutes in
line with thrust areas.
• Children will grow up with a
vision and employable qualifications/training that will equip
them to get jobs and contribute
towards the development of the
state and the country.
Roads, Power • Review expenditure
management in the road sector
and improve cost-effectiveness.
• Widen NH 31A and other link
roads from West Bengal to the
South and West Districts of
Sikkim.
• Improve state roads.
• Set up a Regulatory Board/ Power Commission.
• Strengthen the transmission
line from Melli to Vidyutnagar
(Siliguri).
• Set up a high-level expert committee to advise the state on the modalities of attracting private investment in the power
sector.
• Sikkim’s connectivity with
the rest of India will improve. This w ill improve marketing
opportunities for Sikkim ese
goods, lead to better and more
timely supply o f inputs, and increase the attractiveness of
Sikkim as a tourist destination.
• The state will become a more
attractive investment destination for independent power
producers; by becoming a net exporter of power, this sector
can be a revenue earner for the state.
Strategic withdrawal of the state and the
attainment of fiscal
viability.
Fiscal Reform Increase tax revenues.
Revise user charges.
Revamp tax administration.
• Tax and non-tax revenue will be buoyant and the growth of committed unproductive expenditure will be reined in.

Fulfilling the Vision 61
Vision/Goals Sectors Instruments Intended Effects
• Redirect subsidies to the
economically needy in the
medium term.
Funds will be released for
public investment in the thrust sectors and this will lay the
ground for a thriving private
sector.• Impose a ban on all new
government employment,
disinvest all state-level public enterprises.
• Strictly monitor all state and
centrally sponsored projects.
Apart from the private sector, producers’ co-operatives can supplement direct government involvement in a host of areas such as input and credit supplies, as well as marketing networks. While co-operatives have to be promoted by the government, it is imperative that the co-operatives bear the risks, so that they become viable ventures. What is important is to limit the government’s financial exposure to co-operatives either through direct loans or guarantees; the government has to act more as a catalyst to energise existing co-operatives and promote new ones in areas where they do not exist. Co-operatives need not supplement private ventures, but complement them through better dissemination of information, pooling of risks, and filling in where private initiatives are lacking. Examples are networking through Internet or telephones to inform members about prices of products such as cardamom or ginger ruling in important trading centres in the country, and facilitating borrowing from banks and financial institutions against the collective security of all members (on the Bangladesh Grameen Bank model). The aim of the co-operatives should be to improve market efficiency by improving access to information and reducing imperfections such as excessive middlemen’s margins.
The government’s direct involvement, however, will be required in extension services. While private sector (for example, seed manufacturers’) initiatives can be a substitute in areas such as familiarising the farmers with improved seed varieties, in the short run most extension services, because of the strong externalities associated, will have to be provided by the government. Although the government’s outlay on extension services in agriculture, horticulture and animal husbandry in 1998-99 has been Rs 640 lakh, results have been unsatisfactory and this is despite a 884 strong force of extension service workers in these sectors. The government must change the focus from monitoring of ‘inputs’ (money spent) to monitoring of ‘outputs’ (e.g., oranges produced, quality of curing of cardamoms, etc.).‘Voice’ is critical for maintaining the productivity of government expenditure, and community participation can strengthen the users’ ‘voice’ and improve the effectiveness of government expenditure in extension services.
Given the location of the state and its resource endowments, the viability of processing large amounts of raw materials transported from outside the state appears to be questionable. The focus has to be on processing of raw materials produced within the state and service-oriented industries. Service-oriented industries such as tourism in the short to medium term and information technology in the medium to long term hold important promise for employment and income generation.
62 Sikkim: The People’s Vision
Encouragement of these industries, however, will require promotion of Sikkim as a tourist and investment destination. Such promotion through advertisement campaigns in the print and electronic media, both at home and abroad, can be costly. Thus, it needs to be orchestrated with the help of media and advertisement experts, experienced travel agents, tour operators and investment bankers. A new industrial policy needs to be announced with the government playing the role of a facilitator. In this policy framework, the emphasis should be not on tax benefits but on making land and buildings available on an ownership or lease basis for industrial purposes, and on smooth processing of government permits and clearances. Promotion of tourism will require strengthening the Sikkim Tourism Development Corporation through staff restructuring and clearly defined performance benchmarks.
Achieving the goal of sustainable development will only be possible if three fundamental conditions are met. These are: (i) empowering the people with the right education and skills to benefit from the progress of modern science and technology, (ii) building up the right infrastructure, particularly in roads and power, and (iii) fiscal consolidation and reform. Fiscal reforms are needed to ensure that there is some fiscal space for augmenting expenditure on infrastructure, both physical and social. The tremendous progress of literacy in Sikkim hides the lack of emphasis on vocational and technical areas. A surfeit of liberal arts graduates and inadequate supplies of workers with vocational training has hampered the process of employment expansion in Sikkim. The Education Department has to monitor job opportunities, revise the curriculum and set up training institutes for equipping students for jobs in the thrust areas in the long run. Failure to impart the appropriate skills to the local residents for absorption in the growth industries and sectors will lead to not only unnecessary loss of jobs to out-of-state workers, but also increases in recruitment and employment cost of industry.
Power shortages and the lack of road-connectivity have been two major impediments to economic growth in the state. The power shortfall of 14.03 MW with an installed capacity of 38.10 MW in 1997-98 is not only ironic when viewed in the context of the 8,000 MW hydroelectric potential of the state, but also a serious impediment to the development of industry and tourism in the state. While the generation of hydroelectric power will not only promote economic activity in the state but also contribute to the state exchequer, the investments required for setting up hydroelectric power projects are considerable. It is neither feasible nor desirable for the state to pump huge funds into hydroelectric projects and bear the associated management responsibility as well as risks of executing and running such projects. On the other hand, attracting private investment in hydroelectric power involves paying attention to a considerable amount of technical and financial details such as the optimum concession period, power purchase agreement, and financial structuring of the project. The government should set up a high-level committee of distinguished experts to advise and guide it on how to attract private investors and negotiate with them. The high-powered committee can also help in explaining the nature of the proposed projects and neutralise hostility to hydroelectric projects because of environmental considerations. The committee can build up popular support for the proposed run-of-the-river projects in Sikkim by highlighting their eco-friendly characteristics.
Given that power may have to be exported to the rest of the country, strengthening of the links to the Eastern grid by upgrading the transmission line between Melli and Vidyutnagar (as recently

Fulfilling the Vision 63
proposed by the Power Grid Corporation) is a prerequisite for attracting private investors into the power sector. Further, private investment is hampered by the existing tariff structure—the current electricity tariff of Re. 1 per KWh compared to the generation cost of Rs. 1.53 per KWh implies higher losses with higher production—and this needs to be revised to make generation a profitable activity. Tariff determination will have to be depoliticised by setting up a State Electricity Regulatory Commission.
Lack of proper road communication facilities is another serious constraint on the growth of the state. In the absence of a rail network or commercial air services, roads are the only means of getting to and around the state.4 A single highway—National Highway 31A under the jurisdiction of the Border Roads Organisation, an all-India organisation—is Sikkim’s main transport link with the rest of the country and the world. Travel and transportation along this important highway is slow not only because of inadequate width but also because of the shops, houses and establishment on the sides with an inappropriate access control policy. Furthermore, given the state’s fragile terrain, heavy rain resulting in landslides on NH 31A often cuts Sikkim’s only link with the outside. State highways and village link roads suffer from the same limitations as NH 31 A, only more acutely. Marketing opportunities for goods produced in Sikkim, the price, quality and timely availability of inputs, and the attractiveness of Sikkim as a tourist destination cannot improve without a second highway linking Sikkim to the rest of the country and improvement in the quality of all roads, including village link roads. While the second highway linking Sikkim to the rest of the country may be developed by the Border Roads Organisation, the responsibility for the other roads will have to be borne by the state government. The government should review and improve the cost-effectiveness of the expenditure management system, including workers per kilometre of road maintenance, the muster-roll system of employment and the tendering system.
The fiscal position of the state has become precarious and unsustainable with the fiscal deficit and debt as a proportion of GSDP at 20.91 per cent and 71.87 per cent, respectively, in 1998-99. Thus, reform is essential for restoring fiscal sustainability. Fiscal reform is also essential for opening up fiscal space and step-up outlays on infrastructure such as education, roads, water supply, sanitation and urban facilities and for achieving sustainable growth. Necessary steps include raising more revenues and rationalisation of user charges in line with costs, revamping the tax administration, redirecting subsidies only to the needy in the medium term, containing the growth of the public sector through a ban on all new employment, privatisation of public sector enterprises, and better expenditure management with strict monitoring of all projects and departmental activities. In expenditure management the emphasis has to shift to a monitoring of output and actual delivery of public services (away from a purely mechanical analysis of outlays) and scrutiny of processes and an exploration of alternative ways for the delivery of services.
While the economic strategy has to be consistently pursued over the medium term to achieve the goal of sustainable growth, a bold beginning should be made with some immediate steps that are delineated below.
4 The Eleventh Finance Commission has recommended a grant of Rs. 50 crore for the construction of an airport near Pakyong (East District).

64 Sikkim: The Peoples Vision
3 .1 .5 Immediate S teps
Announcing two maior policy changes in the budget speech for 2000-2001 could make a bold beginning. First, the new focus is on fostering growth through private sector participation. And, second, the new policy is one of adjusting the size of the government and improving its effectiveness. These policy announcements will send the right signal to the people and the investor community that it is no longer ‘business as usual’, and improve the investment climate as well as the morale of public administration.
The State Budget for 2000-2001 should also announce two important schemes for making a fresh start in the promotion of horticulture and improving the quality of education in the state. In horticulture, the scheme relates to the promotion of producers’ co-operatives to share marketing information and technical know-how in cardamom and ginger, the two most important cash crops of Sikkim. The scheme should be initiated on a pilot basis in a few areas with the stated aim of evaluating the success of the scheme at the end of the year and extending it to other areas only if the scheme is deemed successful. In education, the scheme relates to the introduction of computer training to students in secondary schools. Again the scheme should be introduced on a pilot basis in a total of twenty schools appropriately selected from the four districts. While the government will provide part of the finances for the purchase of computers in the selected schools, matching contribution will be sought from the students at the rate of at least Rs 25 per month to improve parent participation. The scheme will be extended to more schools only after an evaluation of the pilot schemes at year-end and on the basis of demands for such an extension from students and parents. It should be clarified that the levy of fees is essential to solicit a proper feedback from the parents and the students about the quality of computer education being provided by the schools.
Immediate steps involve the appointment of two committees for attracting private investment to the state. One committee should be asked to focus exclusively on the power sector, and should consist of distinguished experts in the field from all over the country. This committee should advise the government on the appropriate modalities for harnessing the hydroelectric potential of the state in an environment-friendly way and through a public-private partnership. The second committee should consist of senior bureaucrats and be entrusted with adequate powers and one immediate goal, namely to promote a joint venture or a purely private enterprise in poultry feed and cattle fodder within the next twelve months. After the successful promotion of such a venture, the committee may be asked to advise on how and in what areas similar joint ventures may be attracted.
On the revenue front, after having implemented the uniform floor rate of sales taxes recommended by the Chief Ministers’ Committee on November 16, 1999 and putting an end to the granting of fresh sales tax incentives to industries, the state should try to augment revenues through better tax administration. Introduction of computerised collection of data, including assessment, scrutiny and audit, can bolster revenue administration significantly. The setting up of computerised check posts at the four border crossings into the state to register the names and addresses of the consignee and the consignor, and the nature and value of the consignment can provide the state with an independent source of information on its tax base.

Fulfilling the Vision 65
The rate of stamp duty in Sikkim is a low of 1 per cent of the consideration value. The corresponding rates in Andhra Pradesh, Bihar, Madhya Pradesh, Orissa and West Bengal vary between4.2 per cent and 7.5 per cent. The rate of stamp duty in Sikkim should be increased to 5 per cent.
What is needed is a forceful statement of the goals that Sikkim has decided to achieve, followedby immediate actions to demonstrate the resolve of the government and the leadership to implement policies that will steer Sikkim to the stated goals. The key to success lies in enabling and empowering people with the right skills and information, promoting a market and private sector friendly economic, legal and administrative environment, providing sound social and physical infrastructure, and ensuring that the government is an efficient and cost-effective machinery for delivering public goods. The strategy delineated above should help Sikkim achieve its stated goals.
3 .2 S trategy: T he F iscal C omponents
Fiscal reform forms the core of the economic strategy and is a necessary condition for all the other reforms. For one, the funds for implementing the other areas of reform will be available only through fiscal restructuring. While fiscal reforms are essential for waste reduction and public dependency on the system, the thrust would mainly be on two areas: improving tax and non-tax collection and expenditure restructuring.
3.2 .1 T ax and N on-T ax C ollection
The low buoyancy of almost all the state’s own taxes has meant that tax collection has been declining, a situation that can be addressed in the ways listed below.
• Land revenue is a major area of concern. The Department of Land Revenue collects fees and taxes annually for various work contracts and as land revenue. Rates, which remained unchanged for decades, were revised upward on September 1, 1998, which may have a positive impact on collection. A point of major concern is the alarmingly high cost of land revenue collections; it was more than seven times the gross collection5 between 1994-95 and 1996-97. One reason for this is the high departmental expenditure on other activities, which are subsumed under tax administration expenses. Other states face a similar problem, but even by national standards, Sikkim’s expenditure on tax collection is high. These need to be reduced and realigned along with the rates of collection so that the Department of Land Revenue becomes a net revenue earner.
• Sikkim, like many other states in India, does not levy agricultural income tax. However, taxes on commercial crops, such as cardamom, ginger and oranges, levied at the time of inter-state sale of produce as central sales tax are a major source of revenue.
• There is no urban land tax, but the state collects some taxes from urban land (excluding private land) in the form of ground rent from different markets. The rate of ground rent was last modified on April 1, 1998. In a medium-term framework, the state needs to introduce an agricultural income tax with a generous threshold level, and an urban land tax.
5 According to the Memorandum to the Eleventh Finance Commission, expenditure on gross collection was 900 per cent in 1994-95 and 718.75 per cent in 1996-97.

66 Sikkim: The People’s Vision
• Stamp duty is 1 per cent of consideration value and registration fee is 2 per cent of consideration value. While these have been recently revised, they are still far below national norms. The Committee of State Finance Ministers (NIPFP, 1996) recommended a maximum rate of around 8 per cent, to be eventually reduced to 6 per cent. The maximum rates of stamp duty on conveyance (consideration value) for some states are given in table 3.1.
Table 3.1: Maximum Rate of Basic Stamp Duty on Conveyance
State Conveyance(per cent)
Additional Duties
Orissa 4.2 A surcharge on stamp duty is levied at the rate of 2 per cent of
the value of immovable property within the area of the Orissa
Town Planning and Improvement Trust Act; a surcharge is also
levied at the rate of 3 per cent o f the value of immovable
property under the Orissa Development Authority Act.
Andhra Pradesh 5.0 A surcharge of 5 per cent is levied on the value of consideration
in the entire state.
Bihar 7.0 A surcharge on duty is levied at 85 per cent; an additional
surcharge of 10 per cent is also levied.
Madhya Pradesh 7.5 Additional stamp duties of 4 per cent and 2 per cent are levied
in corporation and municipal areas, respectively, on instruments
of sale, gift and usufructuary mortgage of immovable property. Depending on the location, the rural counterparts o f this
additional duty are 1 per cent and 1.5 per cent.
West Bengal 5.0 Additional duty of 2 per cent is levied on instruments of sale, gift, and usufructuary mortgage of immovable property located
within the Calcutta municipal area.
Source: Sen, Tapas (1999), Reform of Stamp Duty Administration in Orissa, mimeograph, NIPFP, New Delhi.
• The state has taken steps to implement uniform floor sales tax rates of 4, 8, and 12 per cent and the upper and lower rates of zero and 20 per cent, recommended at the Chief Ministers’ Conference on November 16, 1999. The Sales Tax Act (1983) has been modified by the promulgation of the Sikkim Sales Tax (Amendment) Ordinance, 2000. The Ordinance was followed by a Notification dated January 17, 2000 detailing the sales tax rates of the listed items.
It should focus next on overhauling the tax administration. There should be a gradual move towards computerisation of data collection, including assessment, scrutiny and audit. The four check-posts to the state should also be computerised to facilitate cross-checking of information to prevent any leakage of revenue.
• Revenues from motor vehicle taxes collected under the Sikkim Motor Vehicles (Taxation) Act, 1982 constitute only 4.6 per cent of own-tax revenue compared to 8.2 per cent for all states (Sen, 1998). Sikkim does not levy road tolls or entry taxes on passengers and goods, and could consider introducing these in the medium term.

Fulfilling the Vision 67
• All enlisted contractors are now under the purview of “works contract” under the State Sales Tax Act and they now are liable to pay sales tax of 2 per cent, which will be deducted at source from their gross bill amounts. However, the state has so far not levied any tax on professionals, which is an important revenue source in some states.
• Sikkim does not accept its share of Central income tax because the Sikkim State Income Tax Manual, 1948 is in operation in the state, which implies that the provisions of the Income Tax Act (Central Act) 1961 have yet to be implemented in the state. The outcome is that the state government accepts the state’s share of Union excise duty, but not its share of income tax from the centre. Table 3.2 shows this amount along with the collection of income tax levied under the state laws.
Table 3.2: Sikkim’s Share of Union Income Tax and Tax Collection Under State Laws
(Rs. crore)
Year Share of Income-tax from Centre
Amount Returned by Sikkim
Collection of Income Tax Under State Laws
1995-96 17.64 17.64 6.551996-97 17.08 9.241 8.201997-98 26.58 17.012 9.051998-99 18.27 18.27 15.00
Notes: 1. The difference of Rs 7.84 crore from the refund of income tax will be paid in monthly instalments
of Rs 2 crore from December, 1999. 2. The difference of Rs 9.57 crore which was released on account of Voluntary Disclosure of Income Scheme has been treated as non-Plan grants-in-aid.
Sources: Government of Sikkim, Finance Accounts (various issues) and Annual Financial Statement (Budget) of the Government o f Sikkim, 1999-2000.
• User charges are low, and even these low charges are usually not recovered. User charges should be increased, new areas should come under the net and the government should take firm measures to recover unpaid dues. An increase in user charges will improve accountability and the quality of goods and services provided. Some areas in education, health and transport are potentially good sources of non-tax revenue: for example, tuition fees could be charged at the secondary and higher school levels and parking fees could be introduced in Gangtok and other major towns. Apart from enhancing the exchequer, the former measure will inculcate a sense of responsibility and participation among the parents.
• There are some goods and services that the government provides free to all state residents. It would be better off gradually phasing out the blanket provision of these and directing subsidies to only people below the poverty line, after they have been properly identified.
3 .2 .2 R e c o v e r y o f L o a n s an d A d v a n c e s
The recovery rate of government loans to departments and institutions is very low according to the Accountant General s Report. There was no recovery in the housing, crop husbandry, animal husbandry, dairy development, fisheries, industries and minerals sectors for the five years between

April 1, 1993 and April 1, 1998. Outstanding loans at the beginning of 1997 totalled Rs 8.64 crore, of which only Rs 72.5 lakh has been recovered. No interest has been paid on outstanding loans.
The enforcement of loan and interest recovery will, apart from raising resources, send a strong signal to borrowers that they cannot continue to misuse the loans facility. It will also improve monitoring and evaluation in the sanctioning of loans.
3 .2 .3 E xpenditure P rioritisation
It is imperative that the state redefines its expenditure priorities to promote sustainable income- and employment-generating activities in identified sectors. As long as there are people below the poverty line, subsidies for primary education and primary health should continue. At the same time subsidies have to be well-directed and accrue only to the truly needy. The basic objective of the subsidy policy should be to encourage the formation of human capital, foster the setting up of industries and provide infrastructure.
The annual cost of subsidies in Sikkim has increased significantly in recent years. While subsidies for industries, co-operatives and agriculture are on the decline, they have been increasing rapidly in areas such as food and civil supplies. Subsidies are both explicit and implicit; the estimates of “subsidies” in the Budget refer only to explicit subsidies, but there are many subsidies that arise outside the Budget and remain unnoticed, such as government investment in public enterprises in the form of equity and loans. An assessment of the full impact of subsidies on state finances would require a quantification of implicit subisidies as well. Implicit subsidies are estimated as the unrecovered cost in the provision of public goods and services (apart from pure public goods6 such as defence and public administration). In theory it is possible to recover the cost of providing the services in proportion to the extent of their consumption (see box 3.1 for the estimation method). Recovery rates have been calculated for Sikkim and are listed in table 3.3.
The deterioration of recovery rates shown in table 3.3 is an indication of the alarming growth in subsidies, which is a cause for concern. The government should review the profile of beneficiaries
68 Sikkim: The People’s Vision
Table 3.3: Explicit and Implicit Subsidies: Recovery Rates
(per cent)
Sectors 1991-92 1997-98
Education: Primary Education: Secondary Medical and Public Health
Road Transport Power Tourism
0.350.300.58
68.00
10.6322.00
0.12
0.200.32
28.377.465.96
Sources: NIPFP Working Estimates; Finance Accounts, 1991-92 and 1997-98,
Government of Sikkim.
6 Where the principle of non-excludability and non-rivalry are applicable.

Fulfilling the Vision 69
Box 3.1 Estimation of Budgetary Subsidies
A subsidy (S) may be defined as the excess of variable or recurring cost (Cv) and annualised capital cost (Cc) over recoveries (R) in the form of user charges, dividends, interest received, etc.
Therefore,
S = Cv + Cc - R
Correspondingly, the subsidy rate and the recovery rate may be defined as s = S/C and r = R/C,
where C = Cv + Cc and ( s + r) = 1
For the purpose of estimation,Cv can be taken as revenue expenditure for the sector, and Cc is capital expenditure (K) for the sector (excluding equity investment at the beginning of the period) multiplied by the sum of d and i, where d and i are the depreciation and interest rates, respectively, and the sum of equity and loans (L) advanced for the service at the start of the period, i.e.,
K(d + i ) + Li
R is the sum of revenue receipts from the service (RR), interest (I) and dividend (D) and other revenue receipts from the sector concerned, i.e.,
R = RR + 1 + D
Interest rates are taken to be 13 and 11.7 per cent for the years 1997-98 and 1991-92, respectively. The depreciation rate is generally taken to be the sum of nominal inflation rate and some real depreciation rate reflecting the average life of the asset. For transport, d is taken as 20 per cent, and for the rest, it is 10 per cent. The estimates of the recovery rate are sensitive to assumptions regarding i and d, but the extent of subsidies in the sectors concerned are unlikely to be grossly overestimation or underestimated.
Source: Srivastava and Sen (1997).
and redirect subsidies to only those below an appropriately defined income limit. A vision for the state cannot be delineated with the continued provision of subsidies to the entire population.
3.2.4 E x p e n d itu r e M a n a g e m e n t
■ Expenditure management and control is a vital aspect of fiscal reform. The state government has instituted some austerity measures since 1992-93, including an attempt at downsizing the government and restricting official tours, but these have had an insignificant effect on savings (which increased from Rs 20 lakh to Rs 50 lakh between 1997-98 and 1998-99). A bigger impact on savings will be possible by curbing discretionary expenditure and careful monitoring and assessment of plan expenditures on various schemes. Other areas of expenditure management are listed below.

70 Sikkim: The People’s Vision
• One-third of total government expenditure goes towards financing wages and salaries. The Pay Commission provisions which were implemented from 1996 has increased the expenses of the state exchequer by Rs 53.20 crore per annum. The present annual liability for wages and salaries is more than Rs 175 crore, which is an increase from 20 per cent to 34 per cent of GSDP between 1995-96 and 1998-99. The government is grossly overstaffed. New appointments and creation of new posts should be halted. Staffing of all the departments should be reviewed and the existing labour force more efficiently deployed.
• Out of the plan allocation, nearly 20 per cent is spent on wages and salaries. Employment that is created under the plan and centrally sponsored schemes (CSS) should be temporary in nature; at present, these workers continue to be employed even after completion of the schemes.
• Current employment in the work-charged and muster-roll establishments—particularly the departments of Public Works and Roads and Bridges—should be reviewed for downsizing.
• The provision of vehicles to government employees is excessive. In states like Rajasthan this facility has been curbed substantially and effectively. Given the absence of a public transport system in Gangtok, buses can be introduced to transport employees to and from work: apart from economising on expenditure, this will also improve office attendance and punctuality.
.• Non-plan expenditures need to be focussed on to bring down the costs of operation and maintenance. This to ensure that the assets created over two decades of planning are well maintained. In fact, maintaining roads, schools and dispensaries has become more important than creating new assets, which, without proper maintenance, become dysfunctional in a few years’ time.
Table 3.4: Tax and Non-Tax Concessions
(Rs. lakh)
Description 1992-93 1995-96 1996-97 1997-98 1998-99 1999-2000
Concessions onExcise duties 77.38 51.12 61.05 64.15 71.00 71.00
Land revenue 2.20 2.20 2.20 2.20 2.20 2.20
Road transport 1.80 1.98 2.05 1.98 2.00 2.50
EducationFee exemptions 335.00 383.00 417.00 438.00 460.00 483.00
Textbooks 82.00 79.41 126.00 71.37 130.00 150.00
Exercise books — 68.02 81.56 87.32 89.16 100.00
Uniforms — 108.76 256.56 205.36 235.00 260.00
Public lighting 62.48 104.32 103.81 127.39 150.00 175.72
Total 560.86 798.81 1,050.23 997.77 1,139.36 1,244.42
Source: Memorandum to the Eleventh Finance Commission, 1998.
The table above (table 3.4) shows details of concessions (tax and non-tax) given by the state government. It gives an estimate of the loss in government revenue.
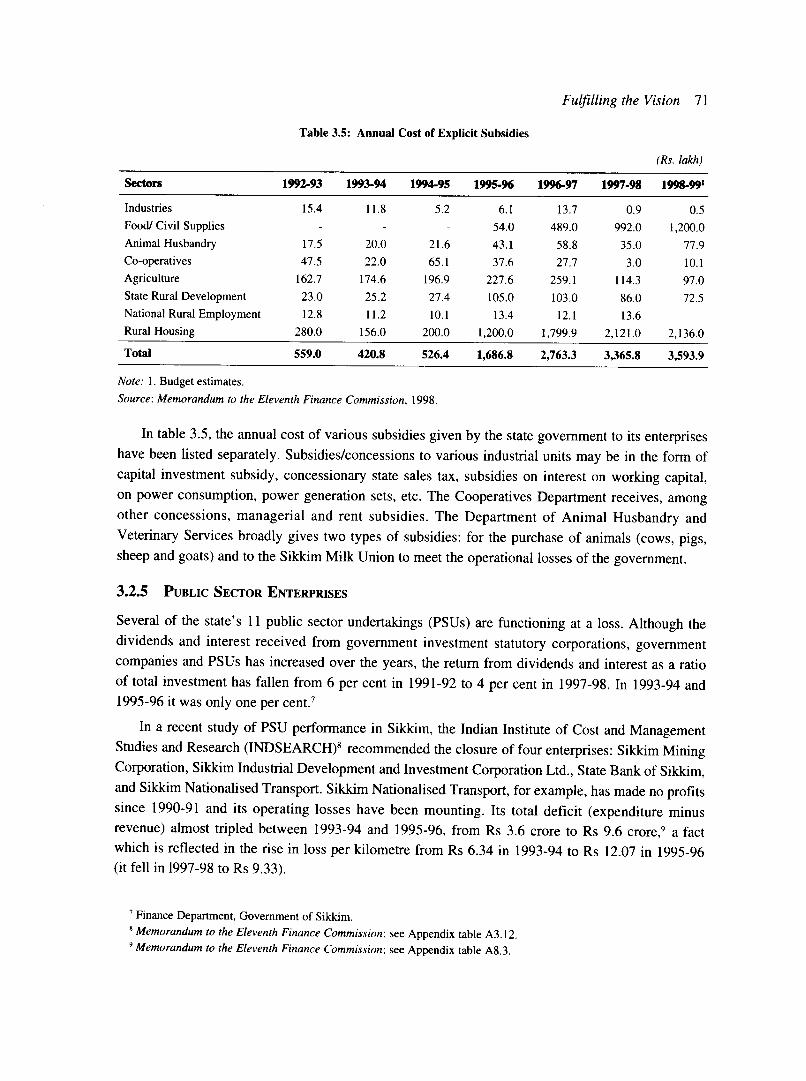
Fulfilling the Vision 11
Table 3.5: Annual Cost of Explicit Subsidies
(Rs. lakh)
Sectors 1992-93 1993-94 1994-95 1995-96 1996-97 1997-98 1998-991
Industries 15.4 11.8 5.2 6.1 13.7 0.9 0.5Food/ Civil Supplies - - - 54.0 489.0 992.0 1,200.0Animal Husbandry 17.5 20.0 21.6 43.1 58.8 35.0 77.9Co-operatives 47.5 22.0 65.1 37.6 27.7 3.0 10.1Agriculture 162.7 174.6 196.9 227.6 259.1 114.3 97.0State Rural Development 23.0 25.2 27.4 105.0 103.0 86.0 72.5National Rural Employment 12.8 11.2 10.1 13.4 12.1 13.6Rural Housing 280.0 156.0 200.0 1,200.0 1,799.9 2,121.0 2,136.0
Total 559.0 420.8 526.4 1,686.8 2,763.3 3,365.8 3,593.9
Note: 1. Budget estimates.
Source: Memorandum to the Eleventh Finance Commission, 1998.
In table 3.5, the annual cost of various subsidies given by the state government to its enterprises have been listed separately. Subsidies/concessions to various industrial units may be in the form of capital investment subsidy, concessionary state sales tax, subsidies on interest on working capital, on power consumption, power generation sets, etc. The Cooperatives Department receives, among other concessions, managerial and rent subsidies. The Department of Animal Husbandry and Veterinary Services broadly gives two types of subsidies: for the purchase of animals (cows, pigs, sheep and goats) and to the Sikkim Milk Union to meet the operational losses of the government.
3 .2 .5 P u b l i c S e c t o r E n t e r p r i s e s
Several of the state’s 11 public sector undertakings (PSUs) are functioning at a loss. Although the dividends and interest received from government investment statutory corporations, government companies and PSUs has increased over the years, the return from dividends and interest as a ratioof total investment has fallen from 6 per cent in 1991-92 to 4 per cent in 1997-98. In 1993-94 and1995-96 it was only one per cent.7
In a recent study of PSU performance in Sikkim, the Indian Institute of Cost and Management Studies and Research (INDSEARCH)8 recommended the closure of four enterprises: Sikkim Mining Corporation, Sikkim Industrial Development and Investment Corporation Ltd., State Bank of Sikkim, and Sikkim Nationalised Transport. Sikkim Nationalised Transport, for example, has made no profits since 1990-91 and its operating losses have been mounting. Its total deficit (expenditure minus revenue) almost tripled between 1993-94 and 1995-96, from Rs 3.6 crore to Rs 9.6 crore,9 a fact which is reflected in the rise in loss per kilometre from Rs 6.34 in 1993-94 to Rs 12.07 in 1995-96 (it fell in 1997-98 to Rs 9.33).
7 Finance Department, Government of Sikkim.8 Memorandum to the Eleventh Finance Commission; see Appendix table A3.12.9 Memorandum to the Eleventh Finance Commission; see Appendix table A8.3.
72 Sikkim: The People’s Vision
The financial results of these state companies show that among the consumer enterprises only Sikkim Jewels Limited and Sikkim Time Corporation made profits; Sikkim Flour Mills broke even in 1993-94 with an accumulated loss of Rs 1.27 crore. SIDICO made profits of Rs. 2.44 crore in 1997-98; the Chanmari Workshop, Sikkim Mining Corporation and State Bank of Sikkim incurred losses during 1994-95, 1995-96, and 1996-97, respectively, the latest years for which their accounts have been finalised.10
Sikkim does not have a state electricity board and the Power Department does not maintain accounts on a commercial basis: there are no annual reports, balance sheets, or profit and loss accounts. The accounts of the department are rendered to the Accountant General of Sikkim. The gross operating deficit of the Department has been rising steadily, from Rs 4.46 crore in 1993-94 to Rs 10.07 crore in 1997-98, as revenue expenditures have increased more rapidly than revenue receipts (including realisation of arrears). With the recent creation of the Sikkim Power Development Corporation, keeping track of profit and loss accounts, etc., should become easier.
A comprehensive disinvestment plan is needed for each of these enterprises, including the profit- making Sikkim Time Corporation, which should be considered for privatisation. The rest, which are burdens on the state exchequer, should be privatised or liquidated.
3.3 S trategy: T he S ectoral C omponents
H o r t ic u l t u r e
To allow horticulture to realise its full potential in terms of employment and income generating opportunities requires strengthening of all three stages between the producer and the consumer, namely, production, procurement/transportation, marketing/ distribution. Horticulture, like many of the other sectors in the economy, has stagnated without the application of modem science and technology in farming methods, inputs and the other stages in the value chain.
Yields can be vastly improved by introducing modem fanning practices and implements that are suitable for hill farming, through an improved supply of inputs like seeds and irrigation facilities, and by creating linkages between farmers and the market to allow them to assess prices and consumers’ needs. The area under horticulture can be increased by extending cultivation to land that is presently not being cultivated because it is steeply sloped or undulating or being left fallow.
Increased fertiliser use will increase yields, but care should be taken that it does not drastically change the soil’s ecological balance. The efficacy of different pesticides, their mode of application and concentration should be tested before they are used. The current low chemical, fertiliser and pesticide use can be converted to an advantage by promoting organic farming and building up a brand equity for Sikkim’s products. The state should encourage the use of organic fertiliser and pesticides to produce fruit and vegetables that can be exported to specialised international markets for organic produce.
10 Comptroller and Auditor General, Government of Sikkim, March 31, 1998.

Fulfilling the Vision 73
Similarly, marketing and distribution will benefit with improvements in communication like telephones and Internet, which will allow farmers to access current market information on crop prices, techniques of production, and inputs.
Focus on Two Crops: Tea and Citrus
Tea Production
A quarter of the tea produced by the Temi Tea Estate is sold in the local market at prices marginally higher than cost, and the remainder is sold through auction houses in Kolkata. The estate could realise a better price if the tea were sold directly to buyers abroad. Worldwide, and particularly in the West, there is an increasing demand for organic tea, and several of the tea growers in and around Daijeeling have started tapping into this lucrative market. In Sikkim, the small-growers’ scheme to initiate tea cultivation in the Sang Martham area should prove to be very profitable, especially since it has tied up with the Makaibari tea estates in Darjeeling. Much of the Makaibari tea is now organically grown and has found excellent markets in other countries.
Citrus Processing
Till recently, Sikkim was a fruit processing state, which supplied some processed oranges to the rest of the country. Now, however, its citrus and orange produce is sent to Bhutan for processing. With a large part of the value-addition done elsewhere, the state loses out on valuable income and employment generation. The government should seriously explore the feasibility of reviving its fruit-processing factory in Singtam, modernising it and expanding it so that fruit processing can be carried out on a large scale. Apart from providing local orange farmers an assured market for their produce, reducing
Box 3.2 Pioneers in Ecological Tea CultivationThe organic cultivation of plants produces unpolluted food, provides health protection for plantation workers, and on a long-term basis helps to increase soil fertility and restore the ecological balance which gets lost with intensive tea cultivation. In monocultures, intensive use of pesticides and fertilizers leaches the soil and is dangerous for those who live and work there. Insufficient safety regulations and growing contamination of drinking water damage the health of plantation dwellers.
Organic fanning replaces artificial fertilizer by compost made of cow dung and plants gathered from around the plantation and distributed on the fields by hand. Shade trees prevent soil erosion and improve the microclimate around the plants. Initially, yields decline drastically but then stabilise over the years. Organic tea cultivation has lower crop yields than conventional cultivation, but the slower growth produces tea that is more aromatic and fetches higher rates.It employs more people on a regular basis who benefit from the improved infrastructure and social services, such as health care, housing and education. Through workers’ committees, plantation workers have a say in the way things are done on the plantations. The European fair trade organisations buy organically grown tea from different plantations in Asia, including the Samabeong plantation in Daijeeling, Singampatti in South India and Idulgashena in Sri Lanka.

74 Sikkim: The People’s Vision
spoilage and transportation costs, this will create direct employment opportunities, as well as in spin off ancillary industries like packaging, transporting, etc.
In keeping with the government’s new role as a facilitator rather than a producer, the factory at Singtam could be operated by a major food processing chain or a large corporation, which will work closely with fanners to improve yields, invest in specific infrastructure to reduce wastage and in research to develop specific varieties of fresh and processed produce for export, and improve quality through better packaging and storing technology. Over time competition provided by the entry of more than one major food-processing corporation will benefit farmers and employees.
The domestic market for packaged fresh orange juice is increasing. Several new brands have recently entered the market, many international fast-food chains have set up outlets in metros and their demand for juice, jams, etc is growing. However, growth will probably take place mainly through exports, once agricultural subsidies are phased out under WTO agreements. Rationalisation of tariffs and restrictions on food items will give India access to larger export markets and make it more price competitive in global markets.
The government could provide support through setting up an autonomous board for orange growers to act as a nodal point for extension work, help in farmer education and work closely with the farmers’ cooperatives to improve farm management practices and the quality of farm produce. The board can also help with credit, marketing, and information on the market. A customer export cell may be set up to deal with all formalities and simplify documentation procedures.
It is most important to create awareness among the farmers that the entry of large investors is to the benefit of the entire industry. So far, farmers have been reluctant to replant their orchards, preferring to live off the little income generated by the old trees. The entry of large companies, who will guarantee the purchase of good quality oranges, is likely to encourage replanting at a faster rate (see box 3.3, on citrus processing in Uruguay). Once success has been achieved with citrus, fruit and vegetable processing can be extended to other fresh produce grown in the state.
Box 3.3 Uruguay: Growing and Processing CitrusAzucitrus, a citrus growing and processing enterprise in Uruguay, has had a remarkable development impact despite its continuing struggle for commercial viability. The International Finance Corporation (IFC) decided to invest in the project because of its strategic development potential. In May 1982, the company had already begun to use cutting-edge irrigation technology from California and had imported and planted world-class citrus fruit varieties on a commercial scale for the first time in Uruguay. It had a well-run nursery for propagating and promoting imported varieties and introduced a frozen orange juice concentrate plant.
Development Impact
The combination of relative abundance of land and historically unfavourable incentives in Uruguay had promoted a low-technology agriculture that exhausted natural resources. Open- range grazing and monoculture cropping were producing low yields and degrading the resource base. On a micro level, Azucitrus, as the first major attempt to develop a citrus sector, has played a key role in shifting resources into an activity where Uruguay has a comparative advantage.

Fulfilling the Vision 75
The country’s citrus output more than doubled in the 1981-96 period (233 per cent) and exports rose more than sixfold, from less than $10 million annually to $60 million. Rapid growth in earnings from citrus exports has been achieved by high growth rates of output suitable for export and by an increasing shift from low-value, low-quality produce to high-quality, high- value produce sold in North America and the European Union. This shift has been achieved by developing irrigated land suitable for production of high-quality output, by importing and adapting the best varieties of citrus fruit, and by efficient processing and marketing. What is most impressive is that this industry did not exist before the mid-1970s. The economic impacts have been far-reaching:
Transferring Technology: Creating a state-of-the-art producer and exporter of citrus in Uruguay has brought new technology to the country. Azucitrus’s management has incorporated advanced technology into the design of its production and processing operations. An advanced irrigation system used in conjunction with meteorological equipment to measure daily evapo- transpiration, which, together with tensiometer readings, is used to determine irrigation needs. It has imported plant varieties that set the international standard. These imported varieties have been adapted to local conditions through an ongoing program of research at the company’s laboratory and nursery.
Creating Tnhs: Azucitrus is an important source of employment in the local area. The project employs 1,500 workers and staff, 200 of who are permanent employees and the rest seasonal, part-time workers. At harvest time, 750 fruit pickers may supplement the regular work force of 125 persons at the orchard, depending on crop size and weather. Similarly, at the packing shed and processing plant, 570 part-time workers may join the regular work force of about 70 persons. Seasonal workers are employed an average of seven months a year, and their wages are well above the country’s minimum wage.
Spinning Off Investments: The company has invested in a refrigerated shipping terminal nearby which sells refrigeration facilities and loading services to several fruit packers and shippers in the area. With this facility, Azucitrus no longer needs to truck its fresh fruit exports to the nearest port, which is some 450 km away. Other companies are also clearly benefiting, as is the economy.
Protecting the Environment: The shift of resources to citrus growing has improved soil productivity in the region. Citrus growing has no adverse impact on the soil. In fact, the project has no known harmful environmental effects whatsoever.
Demonstrating Success: Before the project, Uruguay had no modem citrus plantations. By innovating in a number of important areas, including export, state-of-the-art irrigation, international marketing, packaging, crop adaptation, and research, the company has created a path for a wide range of other Uruguayan firms to initiate similar activities. Its irrigation operations, for example, have had a profound effect on the way agriculture will be carried out in northwestern Uruguay.
Source: Fitchett, Delbert A., and Frederick Z. Jaspersen: The Private Sector and Development: Five Case Studies, International Finance Corporation.

76 Sikkim: The People’s Vision
A n im a l H u s b a n d r y
As in horticulture, the sector offers great potential benefits from the application of modem technology to the different stages: modem farm techniques, better breeding and animal health services, improved inputs, and access to marketing information through better communication facilities.
The expansion of both poultry and pig farming, which are currently small-household enterprises, would offer excellent employment and income-generating opportunities in rural areas for women, small and marginal farmers, weaker sections of the community and educated, unemployed youth. The consumption of meat and eggs among the local population is very high, and likely to increase as incomes rise. Pig farming is already a widespread activity in which approximately 25,000 households are engaged; pigs are among the most efficient feed-converting animals, with a carcass return of almost 60-80 per cent of their live weight.
Box 3.4 Tanzania: Poultry FarmingIn 1994 the International Finance Company (IFC) lent $1 million to Tanbreed, which produces day-old-chicks (DOCs) and has strong ties to smallholders, mainly women, who make a living breeding chickens for home consumption or for sale to restaurants. Tanbreed and its parent company Interchick produce nearly 5 million DOCs a year, of which 4.5 million are sold and 300,000 retained for fattening and subsequent sale as frozen meat. Between 1991 and 1995, sales increased by 140 per cent. Each year since the IFC loan the company has ploughed back its profits to expand production. The market for chicken and eggs has grown with urbanisation and rising incomes.
Developmental Impacts
Creating jobs: Interchick is a large employer by Tanzanian standard. Also, most of the shopkeepers, like their customers, are women. In the plant, most of the employees are men, but women sew the feed bags, do other manual work, and perform some clerical work.
Providing business opportunities: Interchick’s sales of broilers and layers and bags of feed have increased the number of poultry farmers in the neighbouring areas and greatly increased their profits.
Fostering entrepreneurship: Poultry keeping does much to foster the elements of entrepreneurial success, while providing opportunities to many people who can afford to begin only on a small scale. Successful poultry farmers can gradually increase the size of their operations and may eventually diversify by adding livestock, fruit, vegetables, and other crops.Or, they may link forward by acquiring outlets for what they produce.
Providing a market for domestic suppliers: Interchick also provides a market for domestic suppliers by purchasing a variety of ingredients for its feed. It also offers income-earning opportunities to producers, traders, and transporters of these ingredients. Feed producers give farmers, fishermen, ginneries, and hulleries a market for products they could never sell elsewhere. Feed production and DOC sales to outlying areas open income-earning opportunities for middlemen and transport contractors.

Fulfilling the Vision 11
Transferring knowledge and technology: By introducing sophisticated methods into its own operation Interchick has educated its own employees and suppliers. It distributes information to its customers on different aspects of poultry keeping. Interchick is also setting up a farmers’ club to run training seminars, provide free vaccines, supervise the vaccination process, and promote disease control, which will especially help first-time poultry farmers.
Improving Diets: Tanzania’s average calorie intake of 2,250 Kcal a day (FAO estimates) is slightly above the 2,007 Kcal average for Sub-Saharan Africa as a whole. In the early 1990s it had the lowest meat and egg production per capita in East Africa. This transformation has been made possible by the large expansion in poultry production and consumption, partly from the liberalisation of the economy, from the removal of price controls on meat and eggs, and partly from efforts of firms like Interchick to increase rapidly the supply of DOCs from satisfactory overseas grandparent stock.
Source: Fitchett, Delbert A., and Frederick Z. Jaspersen: The Private Sector and Development: Five Case Studies, International Finance Corporation.
Two of the weakest links in the development of animal husbandry are the supply of adequate feed and fodder and an efficient marketing network. Most livestock breeders are small farmers who face difficulties in marketing their produce, and this has in a large way hampered the expansion of production. In areas such as poultry, despite good progress by the Venketeshwara Hatcheries in supplying day-old-chicks (DOCs) to breeders, it has not been able to meet the demand and DOCs still have to be imported from West Bengal. In all these areas, there is a need for private initiatives to supplement the existing government efforts.
In dustry
As the outcome of the Industrial Policy of 1996 has shown, incentives and sales tax concessions cannot have a sustained positive impact unless the fundamentals of the economy are sound. The new policy failed to attract any noticeable amount of private investment in industry either from outside or locally. Local motivation to initiate business enterprises seems low; road and power conditions are still poor in the state, and leasing land by investors from outside the state is a tenuous process.
Industrial strategy has to be based on encouraging private investment not through tax benefits but by improvements in infrastructural facilities, easing the process of land leasibility and applying for approvals. The gradual withdrawal of the state as a large-scale employer coupled with encouragement of private investment in industry through basic inputs and infrastructural facilities would be an important starting point.
Privatisation of the state’s public sector undertakings, if it occurs, could lead to an expansion of employment and income opportunities. The withdrawal of the state as a provider of direct employment will also improve the supply side of the labour market, by motivating people to acquire skills suitable for employment in modem industry and cutting down on search costs for public sector employment.
The government has to not only announce that “Sikkim is open for business,” but back it up

78 Sikkim: The People’s Vision
with concrete action such as facilitating the setting up of business through providing single- window clearances and improving infrastructure.
T o u r is m
Tourism is a human-resource intensive activity; it is a major source of jobs at varying levels of skills. The wide range of climatic zones in the state and its diverse cultural, religious and ecological base could—if tourism targets the right kind of traveller—expand the industry to a year-round business. The very high trickle-down effects of tourism means that an expansion in the industry will not only increase incomes of those directly employed, but will provide a tremendous boost to allied sectors such as transport, telecommunications, retailing, etc. The indirect and induced benefits could, in fact, be several multiples of the direct benefits of tourism development (see box 3.5).
Appropriate and effective development of tourism in Sikkim could help alleviate poverty as well as remove some of the regional disparities. For example, careful promotion of tourism in the North District, which is least developed and has most of the high-altitude land, would certainly enhance development in the region.
Tourism development should be sustainable and undertaken with an environment impact analysis at every stage. Otherwise, expanding the industry could prove counterproductive: the wrong type of development, such as over-construction for example, could create landslides and deprive the region of its rich flora and fauna. The next phase of tourism development has to be based on a new administrative culture, which is more responsive to environmental needs.
The opening of Nathu La can be expected to increase not only the passage of goods from the country to Tibet but also the flow of tourists travelling to Tibet, including Lhasa and Manas Sarovar.
Box 3.5 Measuring the Impact of Tourism: The Tip of the IcebergNew research has shown that the impact of economic activity in tourism and travel is much wider than is currently captured in national income accounting. Today the tourism industry in India is estimated to support 9.3 million jobs directly, but the trickle down effects of this industry are such that it actually provides employment to 17.4 million people. At present travel and tourism “economy” accounts for 5.8 per cent of total employment in India and 5.6 per cent of GDP; in 2010 this is expected to grow to 6.8 per cent of total employment and 8.2 per cent of GDP. Tourism and travel goes beyond providing products and services for directly tourist “consumption,” such as lodgings, restaurants, travel services, etc; there is a multiplier effect on an enormous and diverse range of activities like security services, food and beverage suppliers, furnishings and furniture products, glass, iron and steel products, etc.
The result is that so far public analysis and related policy have tended to underestimate the impact of tourism in terms of its employment and income generation potential. It is important that policy makers analyse the full effects of the tourism and travel “economy.”
Source: World Travel Tourism Council.

Fulfilling the Vision 79
Sikkim can expect to benefit from both. But, the quantum of benefit will depend upon how the state positions itself for providing facilities such as good all-weather roads, motor repair shops, gas stations, hotels, restaurants and rest houses. Transit tourists will be tempted to spend a few extra days in Sikkim if tourist facilities such as conducted tours, comfortable accommodation and awareness about Sikkim’s natural beauty can be created.
In several areas, such as Pelling and Mangan, the government will have to act as a catalyst for creating transit facilities. First and foremost, is the need for rapid transportation of the traveller from the plains to the transit facilities in the state. The modern tourist will be loath to spend a day commuting from Bagdogra to her destination in Sikkim. The widening and improvement of NH 31A and the development of an alternative road from Siliguri to Gangtok is a prime necessity in this regard.
Second, in tourist centres such as Pelling, the government has to attract private hoteliers of repute to set up world-class facilities for world-class tourists. These facilities may have to include cottages with modern-day comforts, restaurants with gourmet and local cuisine, shopping and entertainment facilities, pony rides and guided treks. Given the lumpiness and long gestation period of such investments, the government may have to think of making land available on concessional lease, and even taking up an equity stake in such ventures.
Third, the private investor in such transit centres will have to be encouraged to build toll roads, with generous government assistance from the nearest connecting point on NH 31 A, to rapidly transport the visitor to the destination. Last but not least, the full potential of tourism benefits will accrue to the state only if the government promotes the training of the local people in acquiring such tourism-related skills as knowledge of language of the tourists, how to be a guide, hoteliering and cooking.
P o w e r
The power shortfall in the state is a serious impediment to growth in the other sectors of the economy. Apart from being essential for growth, development of the hydro-electrical potential can be an important source of revenue. The proposed five-stage power projects on the River Teesta have been estimated by the Central Electricity Authority to have a potential of 3,635 MW. The export of surplus power to power deficient areas, once the transmission link with the Eastern grid has been strengthened, will be a major source of revenue for the state government.
The state’s topography lends itself ideally to run-of-the-river projects, constructed as a series of small-sized units along the river. Apart from the lower civil engineering costs and shorter gestation period of these projects vis-a-vis larger hydro projects, they are far more environmentally friendly as they do not submerge large tracts of land or displace populations. An important first step for the Expert Committee could be to make people aware of the relative environmental friendliness of such smaller hydro projects. A further advantage of a series of hydro projects is that the revenue from the units first constructed can be partly used to build the next project and partly accrue to the government as revenue.
These projects should ideally be developed and operated by private producers. The size of the

80 Sikkim: The People 's Vision
projects would generate sufficient interest among international power producers, which would result in the use of up-to-date technology, and possibly shorter gestation periods. The state government would not need to give a counter-guarantee because such projects would be covered by the central government’s Mega Power Project policy. Under this policy, the recently constituted Power Trading Corporation (which has equity participation from the Power Grid Corporation of India, National Thermal Power Corporation and the Power Finance Corporation) will buy all the power generated from such plants for further sale. However, the government has to lay down the groundwork to attract private producers, and among other things this includes raising tariff rates and privatising distribution.
The recent proposal by the Power Grid Corporation of India to provide a 132 KV transmission line from Vidyutnagar in Siliguri to Gangtok will help transfer power from the Eastern grid to meet the growing demand-supply gap in the state. The transmission link is expected to terminate with a 2x50 MVA, 132/66 KV substation at Gangtok. The link would also enhance the reliability of Sikkim’s power system, which is currently largely dependent on run-of-the-river hydro projects which have very low firm capacities and need to be backed up by thermal capacity from the Eastern region. Strengthening this link and the connections with the Eastern/National grid will reduce the market risk and encourage investors in hydro projects.
R o a d s
Much of the road network is a relic from the past, when roads were built to accommodate the transport requirements and limited resources of the time. They are narrow, have numerous blind curves, and often a very steep gradient; bridges tend to have a low tonnage capacity. Increased demand for road transport services have made it imperative that the major connecting links are widened, the steep gradients and curves smoothened and bridges strengthened and widened to handle heavier loads.
New roads have to be very carefully planned and should be sanctioned only after rigorous environmental impact analysis. The importance of roads to the state’s development means that they cannot be built based on short-term goals, such as employment generation or saving funds. Such an approach could prove more expensive in the long run as poorly built roads get washed away and have to be entirely replaced. It would be far more cost effective in the long run if the roads are built using the best available material and with all the appropriate supporting structures—retaining walls, drains and parapets—to allow them to withstand landslides, heavy monsoon rain—and even earthquakes. Another advantage of well-built roads, especially in hill areas, is that maintenance is easier and so is repair after a calamity, both of which prolongs longevity.
U r b a n D e v e l o p m e n t
The scarcity of usable land in Sikkim makes it imperative that there are well-formulated laws to govern its use. A key task for the government is to formulate a land-use plan for the next 50 years. The plan will have well-demarcated areas, and within these areas, sectoral development should be planned with a 15-20 years timeframe. Land for this purpose should be acquired and put to use only according to the land-use pattern prescribed. Much of the recent buildings in Gangtok and other towns have been based on materials and styles of the larger cities of the plains. Apart from being

Fulfilling the Vision 81
inappropriate for the climate and topography of Sikkim, they impinge on the aesthetics of the serene Himalayan landscape. Building rules could be formulated to promote a return to traditional building styles and materials, which are more in harmony with the surrounding landscape and also serve to preserve and promote a pride in the culture of the region.
Utility fees have to be use-based and strictly enforced. Cost recovery has to be enhanced not just for fiscal reasons, but to increase economic efficiency as well. There is no urban land tax and user fees for sewerage and water are not enforced. Roads are a precious commodity in this hill region; they are difficult to build and expensive to maintain. Parking on them in congested urban areas should entail some cost; a parking fee structure should be evolved for parking on the main thoroughfares of the larger towns.
As in other parts of the country, most of the service providers are government monopolies, and the incentive to improve efficiency is low. To finally attract private funding in the infrastructure, a beginning has to be made to charge commercial rates for infrastructure services.
3 .4 R ole of the P ublic S ector: P ursuit of P rogress with S tability, E quity and E fficiency
In the fulfillment of the vision articulated in the previous pages, the public sector continues to play a major role, but with a change. It is no longer envisaged as the employer of the first and last resorts, but seen as a provider of economic stability and a facilitator of growth with equity and efficiency through the promotion of a series of networks with the corporate sector, non-governmental organisations and the community.
The objective of the public sector continues to be (a) pursuit of economic stability, (b) emphasis on delivery of services, and (c) promotion of efficient utilisation of allotted resources. The achievement of these objectives requires, in turn, (i) rationalisation of government staff, (ii) introduction of EDP systems on a selective basis, (iii) utilisation of public expenditure benefits, (iv) introduction of competitive tendering, and (v) strengthening of public expenditure management system.
3.4 .1 R ationalisation of S taff
The public sector has so far played the role of being the major employer in the state. While government, as the biggest organisation tends to be the largest employer, it is admittedly clear that its present levels of staffing are not tenable. Attempts have to be made to reduce the pervasive surplus staff. Toward this end the following approaches should be considered:
• Elimination of overlap, fragmentation of functions and amalgamation of some tasks and organisations.
• Selective contracting out, including maintenance operations and shifting the work charged established from government to the private sector.
• Pooling of services within each department through the establishment of secretarial pools and other common services.
• Leasing rather than purchasing; and the application of electronic technology.

82 Sikkim: The People’s Vision
3.4.2 Introduction of EDP S ystems
The government of Sikkim has already made a beginning in the application of electronic technology to government operations. But the use of computers is largely viewed as a mechanical adjunct to the existing mechanical process and utilised mostly for data storage. It is important that the government also takes steps to advance the application of technology, both to demonstrate its usefulness and to reduce costs of operations (see section 3.7 entitled ‘Role of Technology in the Delivery of Selected Services’).
3.4 .3 U tilisation of P ublic E xpenditure B enefits
The experience of Sikkim shows that some intended benefits may have been created well ahead of their demand. As a consequence, there are schools with damaged facilities and health centres with vastly underused expensive equipment. The intended benefits to be reaped through public expenditure are not in fact finally taken advantage of by the community either because of traditional inertia or due to other factors.
Better utilisation of the existing facilities could be ensured through inspection by. government officials, provision of incentives to the intended users or through greater participation and oversight by the local community of users. Of these three approaches, the most relevant for Sikkim in the current setting and the trends of the immediate future is the participation of the local community. The maintenance of the existing assets should be handed over to the user community, which should be permitted to explore the levy of small fees for services rendered, or partnerships with the corporate sector. This has been deliberated upon in section 3.6.
3 .4 .4 I n t r o d u c t io n o f C o m p e t it iv e T e n d e r in g
The experience of Sikkim shows that outlays on construction and maintenance have come to acquire a non-commercial and social dimension as well; they are used as a vehicle for employment of the local people in the form of work charged establishment on a regular basis. Moreover, contracts under Rs 10 lakhs are determined at the local level and it is far from clear whether the advantages of competitive bidding are availed of.
It is appropriate that the government envisages some degree of commercialisation so that, where appropriate, contracts could be awarded on a state-wide basis. This could attract more private investment from outside. More important, competitive bidding would enable the government to take advantage of securing economies in expenditure.
3 .4 .5 Improved P ublic E xpenditure M anagement S ystems
In securing improved functioning of the government, attention has to be paid to the system of expenditure management. The existing practices lack focus; there is no anchor of expenditure control and there is very little review of budget estimates. Personnel requirements are dealt with by one agency while plan programmes are considered by another, and the revenue account is assessed by yet another agency. The plan programmes are supply driven while a major part of the revenue budget is devoted to personnel, debt, and transfers. The budget outcome is invariably different from the initial estimates,
Fulfilling the Vision 83
largely due to the increase in subsidies because of price increases. There is very little organised cash management, and when requirements tend to exceed the amounts of ways and means agreed with the State Bank of Sikkim, issues to departments are reduced. The whole process reveals a lack of recognition of the resource restraint.
It is appropriate that the financial management system is improved through the following measures:
• Location of all budget responsibilities in a single office;
• Introduction of EDP systems in the budget process;
• Formulation of finding resource ceilings within which adjustments have to be made in the event of resource shortage; and
• Evaluation of completed projects and programmes.
3 .4 .6 P r o m o t in g S e c t o r a l G r o w t h
In promoting growth in selected sectors, the government will have to shift its role from active participant to facilitator and promoter of private sector activities. In general terms, it will formulate policy that sets the stage for a takeoff, by ensuring the basic infrastructure such as roads, power, etc., that supports the activity, removing bottlenecks in inputs and credit supplies and in marketing, and encouraging the entry of the private sector in the appropriate areas. To do this effectively it will identify problems faced by private investors—whether connected with project funding, approvals, or land acquisition—and then ease the process for their entry. Even in the case of joint ventures, the government will entrust full management responsibility and project risk to the private investor.
H o r t ic u l t u r e
The government will encourage growth of the horticultural sector by formulating policy that encourages the use of modem technology and more scientific techniques and eases the entry of private enterprise. It will
• actively encourage private sector entry into setting up cold storages and agro-processing industry;
• spread awareness among farmers about the benefits of private investor entry;
• to modernise the sector and make it more efficient, apply selected fiscal incentives, such as subsidies on modem equipment, fiscal incentives for private entrepreneurs who set up businesses particularly in the rural areas and lower sales tax on processed foods.
The government, however, still has a very important role to play in the area of extension services because of the strong externalities associated. Its efforts so far have not been adequate: despite an outlay of Rs 640 lakh on extension work in agriculture, horticulture and animal husbandry in 199899, results have not been satisfactory. The focus will be on building a skilled workforce of scientific and extension government officers who are recruited with stringent minimum standards, and who regularly attend retraining and refresher courses that keep them in touch with the latest developments in the field.

84 Sikkim: The People’s Vision
The Horticulture Department will continue to have an important if altered role: firstly, to make farmers aware of the latest developments in their areas and of changes in market conditions and secondly, to encourage the formation of farmers’ groups and societies, and work through these societies to help farmers access inputs, including credit.
Supply o f Inputs
• Encourage the development of commercial nurseries to allow the supply of quality plant material and hybrid seeds. The government will not produce seeds itself, but encourage a well-regulated seed market. To control quality, foundation seeds will be produced in the government farms and then distributed to registered private seed farms which have seed processing units.
• Have a mandatory replacement schedule for old orange trees with new cultivars (which have greater disease resistance and higher yields) with a time-bound package to compensate cultivators for the loss in income during the transition. Old trees and plants are more disease prone, and more likely to spread disease to others.
Supporting Infrastructure
• Improve roads and transport systems• Encourage the development of wholesale markets. The Indo-Swiss Project has recently decided
to partially fund the setting up a wholesale market at Rangpo. However, the Agricultural Marketing Act needs to be amended to give farmers a larger role in its functioning and to allow them to benefit directly from prevailing prices.
• Remove procedural bottlenecks so that fresh goods are cleared quickly at transport junctions to prevent spoilage.
It will also set up special autonomous boards for all major fruits and vegetables whose task will be to
• work with co-operatives to update farm management practices, help spread the use of new technology and tools and generally improve the quality of produce;
• liase with the government department on extension work;• act as a resource in farmer education;• collect and maintain information on prices, analyse market trends, domestically and inter
nationally, so that farmers and co-operatives can make more informed decisions on cropping patterns, etc.;
• facilitate the provision of crucial inputs like credit extension to individuals and co-operatives;• provide basic and specialised infrastructure and develop market mechanisms like market yards,
export promotion boards, etc., to develop this fairly dispersed activity.
A n im a l H u s b a n d r y
In this sector, too, the public sector needs to gradually give way to private initiatives in some areas

Fulfilling the Vision 85
in which it traditionally has had a monopoly: agricultural farms, animal breeding, the supply of feed and fodder, and the provision of veterinary services. It will, however, remain in the area of extension services (see above in Horticulture) while it strengthens its role by hiring a well-trained workforce. The Extension and Training Wing of the Animal Husbandry Department has an important role to play in dissemination of information on and demonstration of new techniques, breeds and equipment to the farmers through livestock shows, calf rallies and exhibitions. Such shows and exhibitions provide an opportunity for interaction between officials and livestock breeders, and encourage healthy competition among breeders.
Supply o f Inputs
• Develop natural pastures and grazing grounds, in conjunction with the Forest Department.
• Ensure that feed is available at all times to even the most remote areas in the quantity needed.
• In animal health, allow private providers into basic animal health services and restrict its role to providing only services like sanitary control, border controls, quarantine operations, etc.
Supporting Infrastructure
• Set up one slaughterhouse in each district; at present there is only one in the state. Introduce regular meat inspection procedures to ensure hygienic and wholesome quality of meat.
• Promote post-secondary school vocational training in animal husbandry to deal with the lack of adequately trained staff.
• Identify marketing bottlenecks and set in place regulatory, infrastructure, and institutional policies to minimise marketing costs.
I n d u s t r y
In keeping with its new role, the government has to adopt a pro-investor approach of encouraging the private sector into industry, by formulating clear and simple guidelines for the thrust areas. Procedures for setting up enterprises should be transparent, and incentives and schemes have to be followed through. The focus will be on promoting industries which are essentially environment friendly, make use of indigenous raw materials and produce high-value, low-volume products. Service- related industries, such as tourism and information technology, will receive priority.
The state will encourage the entry of private enterprise into the industrial sector by announcing a new industrial policy that will focus not on fiscal incentives but on:
• creating the enabling framework in which private capital will be encouraged to set up business in the state; the message to be transmitted is “Sikkim is open for business”;
• setting up regulatory mechanisms so that private capital can enter infrastructure development;
• expanding vocational training programmes in schools and colleges in line with industry needs;
• setting up industrial estates with accompanying services to help entrepreneurs from outside Sikkim circumvent issues of land leasing. Apart from attracting private entrepreneurs to set up business, industrial parks with their own captive mini-power plants, industrial water supply,

86 Sikkim: The People ys Vision
roads, street lighting and sanitation will contain the negative environmental effects of industrialisation.
P o w e r
While it is not feasible for the government to directly fund and manage hydroelectric projects, it has to lay the groundwork for private entry into this area. It will encourage the entry of independent power producers by laying out clear guidelines for private sector entry and setting up a strong regulatory mechanism.
An initial step will be setting up a high-level committee of distinguished experts for advice and guidance on how to attract private investors and negotiate with them, as well as clarify to the public at large the environment friendliness of run-of-the-river hydro-electric projects. The Power Grid’s decision to strengthen the transmission link to the Eastern grid, between Vidyutnagar and Gangtok should be implemented as soon as possible—apart from making Sikkim a more attractive destination for power investors, it will improve the quality of power in the state. The power tariff structure also needs a thorough overhauling if private producers are to be invited to set up projects. The current low tariff makes increases in generation a loss-making proposition. In fact, the whole issue will have to be depoliticised by setting up a State Electricity Regulatory Commission, as other states have begun to do.
The Sikkim Power Development Corporation has to be strengthened and its functions more clearly defined. At present, its activities overlap with the Power Department, and a first concrete step towards unbundling power services could be to shift the generation functions to the Corporation while transmission and distribution activities remain with the Department.
T o u r is m
The state has an important role to play in developing tourism and promoting Sikkim as an attractive tourist destination. It will
• formulate policy that promotes environmentally sustainable tourism;
• strengthen the Sikkim Tourism Development Corporation (STDC) to function along the lines of similar organisations in Kerala, Himachal Pradesh, etc. The STDC will develop a strategy to market Sikkim as a must-see tourist destination. A first step would be to analyse the different tourist segments and adapt promotion programmes for each segment. A joint government-private sector approach to promotion can be done through professional advertising agencies and public relations companies which sell Sikkim in the domestic and foreign markets; and
• develop and promote special interest tourism such as cultural and religious heritage sites (which will have a special bearing for Buddhist visitors from East Asia), adventure tourism, flora and fauna trails (a rhododendron trail or valley of the butterflies) and business tourism (as a location for conventions and conferences). The STDC could develop special interest tours, and organise hotels, transport facilities, etc. so that they can be sold as a package to tourists.

Fulfilling the Vision 87
3.4.7 T he S ta t e ’s R ole in B asic S ervic es: E ducation and H ealth
Provision of basic health services and education will remain within the purview of the state, especially to the poorer sections of society; it will seek to eradicate regional and gender differences in the provision of basic services by investing in these areas. It is responsible for providing its citizens a good quality of life, including clean air and water, civic amenities and infrastructure like power, housing and transport. It will involve local communities, such as the panchayats, strengthen cooperatives and seek to attract private sector funds in selected areas.
E d u c a t io n
The state has played a very active part in education in the last 20 years, with good results. But, the next educational thrust has to involve a new role for the government. It has to make better, more efficient use of its funds: by targeting the beneficiaries more carefully and by inviting nongovernmental organisations and the private sector to do some of the tasks it now performs, such as the implementation of training programs. This will free public funds and allow the government to focus on more fully and better providing the infrastructure and other services that only it can— universal primary education, building and transport infrastructure, food incentives, facilities, etc.
Box. 3.6 Schooling is Vital for Development
Schooling fosters agricultural innovation. Farmers with more basic education are more productive and more likely to profit from new technology. The benefit is therefore greatest in areas of faster innovation, because schooling provides the fundamental cognitive skills that farmers need to respond to changing circumstances and to learn from new experiences.
It enhances one’s ability to reallocate resources in response to economic change - to weather, price fluctuations or the peaks and troughs of business cycles. People with more schooling tend to be more venturesome and more willing to take the risks necessary to adapt quickly to a changing economic environment.
Schooling promotes the use of new technologies in the home, for health, nutrition, learning and contraception. Here, parents’ schooling, especially the mother’s, is critical. Child mortality declines and nutritional status rises with increased parental education, contributing greatly to children’s welfare and development.
Source: World Development Report, 1998/99.
Improving Access to Schooling
• New schools should be well located. While providing some transport to school children could be a medium-term goal, the location of new schools should be carefully planned so that they are constructed in areas that are easy to get to. Even more important than new school buildings, however, is maintaining, expanding and upgrading facilities in existing schools: making sure there are enough classrooms, toilets, furniture and that the libraries and laboratories are up-to- date, well equipped and receive supplies as and when needed.

88 Sikkim: The People's Vision
• The number of teaching staff also has to keep pace with student enrolment. While the overall teacher-pupil ratio of 1:20 (on average) is good, some classes—such as the humanities sections in senior schools—have a large number of students per teacher because of substantially higher enrolment of students vis-a-vis the science sections.
• Providing daycare for siblings either at the school or in a village creche has very effectively improved the schooling of rural girls in other parts of the country.
• Good quality non-formal education programmes can supplement existing education systems, especially in the more remote areas. These are most successful when they are set up by the state and conducted with active community participation.
Improving the Quality o f Teaching
• Minimum qualifications should be enforced when hiring teachers and they should be given incentives to improve their qualifications and enroll in in-service training through distance learning or open universities. Qualifications for hiring teachers have been relaxed for locals, but the school children may have been short-changed in the process. While preference may be given to local candidates in the hiring process, there should be no compromise on the minimum level of qualifications. In addition, the minimum number of years of schooling for teachers could be raised from the current 10 to 12 years.
• Teachers’ training courses need to be restructured. Pedagogy courses will move teachers away from lecture, dictation of notes and rote-memorisation ways of teaching. Primary teachers especially could be encouraged to teach, wherever possible, less through textbooks and more through play and activity-based learning, through songs, dance, storytelling, playacting, sketching, etc. Regular workshops could be organised at the district and state levels. Teachers should receive in-service training to equip them to handle curricula materials and impart them to children.
• Students in Sikkim have traditionally not been predisposed to the study of mathematics, physics and chemistry. It is important to focus on this lacuna by training teachers of these subjects in the subject matter and pedagogy. Also, since English is the official language of instruction, some kind of English language certification could be made mandatory for teachers.
Developing a Locally Relevant Curriculum
• Information on Himalayan life, culture, and the eco-system could very effectively be integrated into the syllabus from primary school and become a separate course from classes V onward. This will inculcate in children an awareness of the fragility of the environment in which they live, as well as make learning more relevant.
• New textbooks and workbooks, containing more relevant material, which is attractively presented, should be introduced. Encouragement should be given to local initiatives to develop supplementary learning materials. The production and distribution of textbooks could be handed over to the private sector, with the state regulating the quality of the materials.

Fulfilling the Vision 89
Improving Job Prospects Through Skill-Based Secondary Education
• Education can be better targeted if a two-pronged approach is adopted: a) improving teaching and classroom equipment for students in Classes XI and XII who intend to pursue higher studies or a professional degree so that they are on par with the best in the rest of the country; and b) developing appropriate vocational training courses to equip students to find employment in some of the emerging areas in the state such as agronomy, floriculture, the hospitality industry, etc.
• The Education Department could set up a cell to analyse the kinds of jobs that are likely to be generated in the next 20 years and divert educational resources towards developing appropriate skills in these areas. This will help prevent a continued mismatch between training and employment. Comprehensive surveys have to be conducted regularly, especially among the emerging sectors like power, tourism, software, so that a market-oriented planning approach can be undertaken for education.
• It is important to market the employment and business opportunities of vocational courses to students and their parents. Setting up an employment cell in some of the major schools can help students explore their career options at the beginning and at the end of their training. Until students get more exposure through Internet, travel, etc., they will remain largely unaware of their job options other than the family vocation or the government. The Department of Education could help increase their exposure by organising routine visits by and discussions with people from different professions—banking, information-technology, accountancy, architecture, sociology, engineering, etc.—especially to the more remote schools.
Lowering Regional and Gender Disparities
Regional and gender disparities could be dealt with by having conveniently located schools, more hostels, especially girls’ hostels in rural areas, flexible school hours, more female teachers and better school facilities.
Improving Targeting o f Subsidies
The demand for education will increase if the actual cost and opportunity costs of sending children to school decreases. While tuition, textbooks and uniforms are given to all the students, there are many hidden costs to sending children to school, such as admission fees, development fees, and the costs of workbooks and stationery.
• To attract more students to school, the government should fully subsidise students who cannot pay, while recovering full costs from those who can afford it. A recent excellent move towards better targeting educational grants has been made with the Chief Minister setting up a task force to examine the introduction of fees at the secondary school level. There are several private schools in the state, which have no trouble attracting fee-paying students.
• The current provision of uncooked rice to increase enrolment in primary schools does not have the same benefits as the mid-day meal scheme, because the rice is shared with other family members or sold in the open market. Further, unlike the mid-day meal scheme, it does not ensure

school attendance. The scheme should be replaced with a better targeted incentive, such as providing a wholesome hot meal of perhaps nutri soyabean biscuits (as is being done in some districts under the UNICEF programme) and noodles during school hours. In some states the task of providing the meal is done in rotation—a different family cooks and provides the meal for all the schoolchildren each day. Another incentive would be to give children milk at school —this would have the advantages of improving their nutrition as well as increasing the offtake of milk especially in areas like the North District where the demand for milk is low.
H e a l t h
Providing Primary and Secondary Services for the Poor
The state should move from providing all health services free to everyone, to giving only primary and secondary services. At a minimum, it will provide access to an essential package of clinical services with special focus on the poor. The basic package will include:
• Pregnancy-related care (prenatal, childbirth and postpartum);
• Family planning services—to reduce maternal and child deaths;
• Treatment for common serious illnesses of young children, such as gastro-related disease, acute respiratory infection, etc.; and
• Control of tuberculosis, which is the leading killer of adults in the state.
For pregnancy-related care, three major components need to be strengthened:
• Information, education and communication which will be designed to create a demand for clinical services, and to alert women and others to danger signs;
• Community-based obstetrics with trained nurse-midwife staff to provide prenatal care, including immunisations, detection of complications, early referrals and safe abortion; and
• District hospital facilities to provide essential obstetrics services and neonatal resuscitation. In regions where women are highly isolated, priority should be prenatal care and the prevention and cure of infections.
Prevention
State-provided health care has to have a strong preventive focus by providing a healthier environment, ensuring full immunisation, especially for children, and strengthening the prevention of diseases, particularly tuberculosis, pneumonia, asthma and gastro-intestinal infection which are the main causes of mortality. The public sector will
• provide a healthier environment especially for the poor through proper sanitation, adequate supply of clean water and garbage disposal systems, good living conditions, etc.;
• set up a strong education programme to spread information on individual hygiene, a clean environment and the incidence of common water-borne diseases like diarrhoea, dysentery, and gastro-enteritis;
90 Sikkim: The People ’s Vision

Fulfilling the Vision 91
• complete immunisation coverage of children against the vaccine preventable diseases;
• spread awareness on TB control through effective IEC (information, education and communication) activities, and an information system for management, monitoring and evaluation. Ensure the regular and timely supply of drugs.
Encourage the Private Sector in Tertiary Healthcare
The state will create an environment to encourage the entry of private providers into tertiary healthcare. It will also need to frame regulations to ensure that the quality of services is maintained. The construction of the new Manipal Medical College and Hospital in Gangtok will introduce a variety of tertiary healthcare facilities into the state over the next few years. While the government may continue to partly fund tertiary care, funding needs to be increasingly directed towards the poorer sections of society.
Lowering Administrative Expenses
• Effective targeting of publicly subsidised clinical services to the poor and corresponding efforts to encourage cost recovery from more affluent groups are important. Modest fees collected at health centres could be retained and reinvested locally to improve the quality and reliability of basic services.
• Costs would be greatly reduced if outpatient diagnostic tests were performed before admitting patients to the hospital; home-care is supported as an alternative to long-term hospitalisation for some ailments; treatment protocols are modified, for example, reducing unnecessary surgeries; and treating TB patients and many surgical cases on an outpatient basis.
Improving Delivery o f Services
• To deal with the lack of connectedness between villages and health centres, one solution would be to have a roving, mobile medical service linked to the primary health centres (PHCs) or district hospitals. The service could have a fixed routine for visiting villages that are not well linked or are relatively further away from the PHCs and dispense primary healthcare services, first aid and drugs. However, until roads improve, all services that depend on roads, will continue to be erratic.
• Public health services should move from monitoring inputs such as immunisations carried out, to assessing the effects, such as the effectiveness of these measures. If this shift is made it will help the state better assess its current programs, target its efforts and measure the effectiveness of health personnel.
I n f r a s t r u c t u r e
Some of the funds for building the physical infrastructure will be available from the centre and the state as in the past, but an increasing proportion of investment will have to be drawn from the private sector. As in several other areas, the state will need to formulate an active policy to attract private

92 Sikkim: The People’s Vision
investment; it will also have to make more effective and efficient use of its own funds and secure the cooperation of the central government in areas under the latter’s control.
Pricing of services has to be rationalised to reflect economic costs—and this will further attract private investors into infrastructure services. The government has so far almost exclusively provided infrastructure, and subsidised the pricing of these services. Before private investors are likely to enter areas like power, the tariffs will have to be revised upward. Also, the state will need to target subsidies and to structure them as transparent transfers from the state budget to a given utility.
Central government’s support will have to be coopted for those areas like telecommunications and airports, which are under central control. On areas like power and roads, where there is overlapping authority between centre and state, policy will have to be coordinated.
R o a d s
• New roads have to be carefully planned, especially as the threat of landslides becomes exacerbated as more roads are built. Building the proposed second highway linking Darjeeling, Singla, Naya Bazar, Namchi and Singtam will increase mobility of people and goods, and bring down costs. Not only will it provide an alternative route to the NH 31 A, it will also provide an important road link between several towns.
• Maintenance of hillroads is very important because there are usually no alternate routes, nor can traffic be diverted. Repairs and the removal of debris have to be done promptly, because if delayed they can snowball into major crises, with severe effects on the ecology and environment. Most of the roads lack an efficient drainage system, and this has further weakened their structure and resulted in distress. Effective drainage on both sides of the road is a way of drastically reducing maintenance costs.
• Upgrading existing roads: The increased movement of goods and people have made it important that the major connecting links (many of which were built to handle a different type of traffic) are widened, the steep gradients and curves smoothed, and bridges strengthened and widened to handle heavier loads.
• Expenditure management: NH 31A is maintained by the Border Roads Organisation, which is also responsible for any expansion activities on NH 31 A. So far, only local tenders have been floated for road and bridge building projects. Projects costing less than Rs 5 lakh are tendered at the panchayat level, and usually contracted by a local resident. Larger projects can be tendered at the national or even international level, so that the state has access to the latest technology and top- quality construction, which will mean better service and perhaps eventually lower costs.
• Better managed public transport system: In the absence of a well-connected bus service, the government should encourage the private taxi services, but should strongly regulate them. Bus services should be reliable, more frequent and routes and timings planned so that they link all the villages, markets and towns. The transport system should be tailored to the growing needs of tourism and adventure sport travel. A luxury bus service connecting Gangtok and Bagdogra airport could be timed to link with the arrival of flights to and from Kolkata and Delhi, to allow seamless

Fulfilling the Vision 93
travel into the state. A major reason why visitors prefer to visit Sikkim as part of organised tours is the lack of regulated and reliable transport options.
O t h e r T r a n s p o r t
Until a full-fledged airport is built, the existing helicopter service between Bagdogra and Gangtok should be expanded to accommodate more people and more flights. The possibility of introducing small (50-seater) commercial plane services from Bagdogra to Gangtok should be explored for the medium-term.
3.5 R ole of the P rivate S ector
The private sector will play an increasingly important role in the growth of the economy. Many of the services and goods so far provided by the public sector have been inadequate (seeds and seedlings, animal health, breeding, etc.) or disappointing (citrus processing, cold storages).
H o r t ic u l t u r e
There are a number of areas in which private producers should be encouraged to supplement or replace government efforts.
• The supply of seeds and seedlings can improve if private nurseries and seed farms are set up. These could even be run by cooperative societies. Given the government’s inability to cope with the demand, private entrepreneurs should be encouraged to set up progeny orchards and nurseries.
• To improve marketing conditions, private providers could be encouraged to set up cold storage facilities at appropriate locations. This will allow the mass export of perishables like flowers, fruit, meat products, etc. The cold storage at Majithar, with a capacity of 2,000 MT has only recently been leased out after lying closed for over six years. It is important that this and other storage facilities be linked with cooperatives and private producers.
• Agro-business, based on fruit and vegetable processing, should ideally be undertaken by a large food chain or other corporate house. Sikkim once was a major supplier of processed fruit to hotels and airlines in the rest of India, but it now exports fruit for processing outside the state. In 1997-98, 760 tonnes of oranges were exported, mainly to Bhutan, for processing into orange products. Making the value-addition within the state would benefit local producers and industry, especially given the high transportation costs involved. Once more-modern techniques are adopted and surpluses generated, fruit and vegetables that are not top quality can be used for processing or semi-processing. The success of many international fast food chains in the main cities, has given a big boost to farmers who grow tomatoes (for sauce), potatoes (fries), fruit (juices and jams), etc. in states like Punjab and Himachal Pradesh.
A n im a l H u s b a n d r y
• Providing daycare for siblings either at the school or in a village creche has very effectively improved the schooling of rural girls in other parts of the country.

• To tackle the problem of short supply, private producers should be invited to set up plants for manufacturing of feed and fodder.
• Improvements in animal stock can be supplemented by private initiatives. Another bull breeding farm (like the one at Karfectar) could be set up under private management. The government should, however, regulate livestock breeding activity to maintain the genetic pool of indigenous stock.
• Animal health services would be improved and public services and funds better directed if the state withdraws from providing services such as clinical treatment, in favour of the private sector. The government should set up a system of full cost recovery for services where private participation is promoted, like non-compulsory vaccinations and clinical services.
P o w e r . I n d u s t r y a n d T o u r is m
The private sector has to capitalise on the opportunities for value addition and utilise the assistanceoffered by the state.
E d u c a t io n
• The state’s efforts in providing secondary school education and teacher training need to be supplemented by private initiatives. Good private boarding institutions can be encouraged to set up schools in the state: this will ease some of the pressure on the existing schools, improve educational standards and improve job opportunities for well-qualified teachers. A boarding school of national excellence would attract students from other areas, including abroad; several students from Nepal and Bhutan are currently studying in private boarding schools in and around Gangtok.
• There is one teacher-training institute in Sikkim, which is privately run. It could expand the number of courses and take in more students per session (at present it only enrolls 20 students for its nine-month B.Ed. course).
• Vocational training programmes and courses in computer education have been very effectively provided by the private sector in other parts of the country.
H e a l t h
• As in education, the private sector can help supplement the government’s efforts to deliver healthcare services, especially in tertiary care. Given the vast infrastructure of health centres that already exist in the state, primary and secondary healthcare is best provided by the public sector. But the private sector has an important role in tertiary care. Regulation by the government will help ensure the quality of private service.
• It is important that the new Manipal Medical College focus on training health professionals in areas of special concern to the state, such as tuberculosis, gastro-diseases, etc.
94 Sikkim: The People ’s Vision

Fulfilling the Vision 95
3 .6 R ole of the C ommunity
The community has traditionally played a very strong role in Sikkimese society, especially in the rural areas. Many of the functions that are now being dispensed by the state can be taken over by the community, perhaps via the panchayat or the farmers’ cooperatives. A Cooperatives Department was set up in Sikkim at the time of the state’s merger with the Union in 1974-75, and it now has offices at the district level and sub-divisional levels. At present, there are 304 registered societies in the state, with a membership of 32,881 farmers. There are relatively few non-governmental organisations functioning in the state.
Greater utilisation of the existing facilities could be ensured through inspection by government officials, provision of incentives to the intended user or through greater participation and oversight by the local community of users. Greater participation by the local community associated with inspection by government officials should ensure greater and more efficient utilisation of the existing facilities.
The biggest danger to development in the state is environmental degradation and only the community at large can prevent this from occurring. Hill communities, having developed in relative isolation, are relatively closely knit and are the most effective guardian of forests, lakes and the environment in general.
E d u c a t io n
• Non-formal education programmes can supplement primary schooling in areas that are not located near a formal institution. These programs are most successful when there is active community participation, when the local people themselves design the programme and take responsibility for it. The building is often donated by the local community, school hours and holidays are determined keeping in mind local needs, learning is practical and costs low to make it affordable. Most important, the schoolhouse is in the vicinity, and bad weather conditions and poor roads and transport facilities do not keep children and the teacher from attending. Teachers, with a minimum of stipulated training, should be selected from within the community, to cut down on teacher absenteeism.
• Another system, that has worked in other states, is to employ a village woman (who has been educated till at least Class V) who will teach in school in place of the frequently absent teacher. Experience shows that education levels improve especially when local monitoring controls the quality of the education. Frequent training workshops are held for these teachers to learn and teach, and they are encouraged to make their classes relevant to local needs.
H e a l t h
• NGOs in the area of health can be encouraged in various aspects of health at the grass-roots level through logistical and technical support. They along with the panchayats can help raise people s awareness about identifying their own health problems and solving them with local resources. A large proportion of health problems can be resolved or prevented by people

96 Sikkim: The People's Vision
themselves if they have the knowledge. Preventive health programmes can be run by NGOs, the panchayat, or other community-based groups, using as a medium the radio, television, community gatherings, etc.
• A system of community health workers can help complement the work of primary care providers in rural areas. They will spread information on sanitation, nutrition, family planning, child health, and immunisation, be on hand at all times to provide primary services and first aid and be a valuable referral point between the PHCs and the rural community. Apart from imparting information about family planning measures, health community workers or NGOs should encourage couples to postpone the birth of their first child, better space their children, etc.
• Alcoholism is an emerging problem. Successful alcohol rehabilitation programs in South India show that community efforts are generally more effective than medical interventions in helping individuals overcome alcohol dependence, partially because of the importance of sustained encouragement, which is more easily offered by the community than by health service institutions.
• Many of the rural people rely on more holistic indigenous medical remedies and local herbs for prevention and treatment. This could be effectively incorporated into the community health programme as they provide effective and low-cost solutions to many health problems.
H o r t ic u l t u r e a n d A n im a l H u s b a n d r y
Producers’ cooperatives have an important role to play in horticulture and animal husbandry, by supplementing direct government involvement in a host of areas such as input and credit supplies and marketing. The aim of the cooperatives should be to improve market efficiency by improving access to information and reducing imperfections such as excessive middlemen’s margins. They can help complement private ventures by better dissemination of information, pooling of risks and helping to fill in gaps in private initiative. These include keeping members informed about prices of relevant products in important trading centres in the country—through Internet or the telephone and borrowing from banks and financial institutions against the collective security of all the members (as in the Bangladesh Grameen Bank model). Apart from this, they can use technology to supplement government extension work by disseminating information on the latest techniques, seeds, and other inputs. As one of the immediate steps, the government should promote producers’ cooperatives in the two major cash crops, cardamom and ginger, to disseminate marketing information and technical know-how. The scheme will be initiated on a pilot basis in a few areas, and the success of the scheme evaluated at the end of the fiscal year. It will be extended to other areas only if successful.
In the area of milk supply, for example, cooperatives can provide farmers an assured market (which is critical for a perishable commodity like milk), provide a farmer-controlled mechanism for delivering essential support services and allow farmers a direct share in the benefits. Farmer members should have full control of the cooperative, with no intervention from the government. They can also supplement state efforts to cope with the demand to improve the breeding stock of cattle and tackle the problem of poor quality fodder by undertaking fodder development activities. Currently, ginger growers are being organised under the Indo-Swiss Project into associations or producers

Fulfilling the Vision 97
societies so that they can more effectively interact with the Department to increase production and to control diseases.
New scientific methods of animal rearing can be spread through the local panchayats; the State Institute of Rural Development (SIRD) is conducting training courses for panchayat members on these issues. Similarly, milk quality can be improved if farmers are taught to handle milk more hygienically, through workshops and sessions conducted by the SIRD.
While cooperatives have to be promoted by the government, it is imperative that they bear the risks and become commercially viable ventures. What is important is to limit the government’s financial exposure to cooperatives either through direct loans or guarantees, with the government acting more as a catalyst to energise the existing ones and to promote new ones in areas that they do not exist. Growers’ cooperatives have to be strengthened and made independent of the government— in fact, the more independent they are, the more effective will be their functioning.
3.7 R ole of T echnology in the D elivery of S elected S ervices
The use of technology in the delivery of government services is particularly relevant in a state like Sikkim where communication and access are major problems. The Government of Sikkim has already made a beginning in the application of electronic technology to government operations. It is the first state in the country to have computerised all its land records. But the use of computers is still largely viewed as a mechanical adjunct to the existing mechanical process and utilised mainly for data storage. It is important that the government takes steps to advance the application of technology, both to demonstrate its usefulness and to reduce costs of operations.
A beginning may be made with the introduction of on-line systems in the office of the Chief Pay and Accounts Officer. This office should be made responsible for the (i) pay-roll, including those that are now maintained by the self accounting departments, (ii) payment of pensions, and (iii) transfers to zilla parishads. These operations are rendered easier through the availability of off-the-shelf software that lends itself to easy customisation and the homogeneous nature of transactions. The application of on-line systems will result in staff savings and more important, quick delivery of services not to mention the quick compilation of a substantial part of public outlays.
Information technology can be effectively used to increase the government’s interface with the public and to enhance the quality of state services. The government will keep a database of citizens, which will help target welfare programmes and minimise the misuse of funds. The spread of electronic networks and incorporation of information technology in the day-to-day functioning of the government will allow the public easy, quick and convenient access to government services and help cut down on corruption. For example, individuals will be able to apply for a birth certificate or renew their driving licences electronically; and projects could be given clearances online.
Within the government, too, the process of decision making will be quicker by cutting down on transit delays in sending and receiving information. Video-conferencing of meetings between ministers, bureaucrats and district officials, could speed up decision making and shorten the time period between policy decision and implementation.

98 Sikkim: The People’s Vision
Tax revenues can be enhanced by the introduction of computerised collection of data, including assessment, scrutiny and audit. Computerised checkposts at all the four border crossings into the state would provide an independent source of information on its tax base regarding the names and addresses of the consignor and consignee and the nature and value of the consignment.
3 .8 L aying the F oundation in S econdary S chools
To lay the basis for this boom in electronic governance, technical education has to become an integral part of the secondary school syllabus; computer classes should be made mandatory and schools should be wired to the Internet to put students in touch with world developments and recent technologies. As mentioned in the section on Economic Strategy, one of the schemes the government should announce in the Budget for 2000-01 is the introduction of computer training in secondary schools. It will initially be introduced on a pilot basis in around 20 schools across the four districts. The government will provide part of the finance for the purchase of computers for these schools, and matching contributions will be sought from the students at the rate of at least Rs 25 per month to improve parent participation. The scheme will be extended to more schools only after an evaluation of the pilot scheme at the end of the year and only on the basis of demands for such an extension from the students and their parents.

R eferences a n d B ibliog raphy
Chopra, P.N. (1985). Sikkim, S. Chand and Company, New Delhi.
Das Gupta, Manas. (1992). Sikkim: Problems and Prospects o f Development, Indus Publishing Company, New Delhi.
Das, B.S. (1996). The Sikkim Saga, Vikas Publishing House, New Delhi.
Fitchett, Delbert A. and Jaspersen, Frederich Z. The Private Sector and Development: Five Case Studies, International Finance Corporation.
Government of India, Indian Public Finance Statistics, 1998-99.
Government of India. (June 2000). Report of the Eleventh Finance Commission,
.........(various years). National Account Statistics, GSDP, Central Statistical Organisation, Departmentof Statistics, Ministry for Planning, Statistics and Programme Implementation, New Delhi.
Government of Sikkim. (1999). Recommendations o f the State Finance Commission, Lower Secretariat, Gangtok.
.........(March 1999b). Annual Financial Statement (Budget) o f the Government of Sikkim, 1999-2000,Ministry of Finance, Gangtok.
......... (1997). Sikkim: Ninth Five-Year Plan 1997-2002, Planning and Development Department,Gangtok.
......... (December 1998). Forecasts o f Receipts and Expenditure (Revenue and Capital Account) andDebt Position, Volume II, Finance Department, Gangtok.
......... (1999a). Memorandum to the Eleventh Finance Commission, Accountant General of India,Sikkim, Gangtok.
.........(September 1998a). Memorandum to the Eleventh Finance Commission, Volume III, SubsidiaryPoints, Finance Department, Gangtok.
......... (various years). Finance Accounts, Comptroller and Auditor General of India, Gangtok.
.........(1995). An Abstract of Public Finance, 1979-80 to 1994-95, Finance Department, Gangtok.
.........(March 31, 1998b). Report of the Comptroller and Auditor General of India, Comptroller andAuditor General of India, Gangtok.
Gyatso, T.R. and B. B. Bagdass. (1998). Health Status in Sikkim, Department of Health and Family Welfare, Government of Sikkim, Gangtok.
Haq, Mahbub ul and Khadija Haq. (1998). Human Development in South Asia, Oxford University Press, Karachi.
Indian Roads Congress. (1995). Seminar on Design, Construction and Maintenance of Hill Roads, Technical Papers, New Delhi.Kaul, G.L., and N. K. Dadlani. (1996). Strategies for Horticulture Development in India, Department of Agriculture and Co-operation, Ministry of Agriculture, Government of India, New Delhi.
Lama, Mahendra P. (2000), The Sikkim Human Development Report 2000 (to be published).
National Bank for Agriculture and Rural Development. (1999). Potential Linked Credit Plan, 19992000, Gangtok.National Sample Survey, Various years.Public Report on Basic Education in India. (1999). The PROBE Team in association with the Centre for Development Economics, Oxford University Press, New Delhi.
Report of the Eleventh Finance Commission (for 2000-2005), June 2000.Reserve Bank of India, January 2000, State Finances: A Study of Budgets of 1999-2000.Reserve Bank of India. (1999). Report on Trend and Progress of Banking in India 1998-99, Mumbai.
Risley, H. H. (1928). The Gazetteer ofSikhim, Low Price Publications, Delhi.Sen, Tapas K. (1998). Tax Administration in India: Motor Vehicle Tax, National Institute of Public Finance and Policy, New Delhi.Sen, Tapas K. (1999). Reform of Stamp Duty Administration in Orissa, National Institute of Public Finance and Policy, New Delhi.Srivastava, D.K. and T. K. Sen. (1997). Government Subsidies in India, National Institute of Public Finance and Policy, New Delhi.Website, International Livestock Research Institute.World Bank. (2000a). Entering the 21s' Century: World Development Report 1999/2000, Oxford University Press, New Delhi.......... (1996). India, Livestock Sector Review: Enhancing Growth and Development, Report No.14422-IN, World Bank, Washington. D.C.......... (2000b). India: Policies to Reduce Poverty and Accelerate Sustainable Development, WorldBank, Washington, D.C.
100 Sikkim: The People’s Vision

A ppen d ix T a bles

List of Appendix Tables
Al. Key IndicatorsA 1.1 Key Indicators: District-wise 105
A2. EconomyA2.1 Gross State Domestic Product (at Factor Cost by Industry) at Current Prices 106A2.2 Gross State Domestic Product (at Factor Cost by Industry) at Constant Prices 107A2.3 Per Capita GSDP of States: New Series 108
A3. Sikkim Government FinancesA3.1 Revenue Receipts 109A3.2 Non-Tax Revenue 110A3.3 Revenue Expenditure 112A3.4 Capital Expenditure 114A3.5 Capital Receipts 116A3.6 Structure of Grants 117A3.7 Structure of Debt 118A3.8 Fiscal Deficit 119A3.9 Fiscal Deficit as per cent of GSDP 120A3.10 Fiscal Variables 121A3.11 Financial Results of Public Sector Units 122A3.12 Financial Results of Working Statutory Corporations 122
A4. Demographic ProfileA4.1 Estimated Birth and Death Rates 123A4.2 Birth, Death and Infant Mortality Rates 123A4.3 Age and Sex Distribution of Population 124A4.4 Females’ Age at Marriage 124A4.5 Sex Ratio by Age Group 125A4.6 Health Statistics 125A4.7 Unemployment Rate 126A4.8 Occupational Distribution 126
A5. Educational ProfileA5.1 Literacy Rate 127A5.2 Classwise Enrolment 127A5.3 Teacher-Pupil Ratio 128A5.4 Results of the AISSE (Class X) 128A5.5 Results of the AISSC (Class XII) 128A5.6 Number of Educational Institutions 129A5.7 Expenditure on Educational Institutions 129A5.8 Human Development Index and Education Components: 1991, 1995 and 1998 130
A6. AgricultureA6.1 Land-Use Patterns: 1976-91 130

A6.2 Foodgrain OutputA6.3 Area Under Different CropsA6.4 Agricultural Yield: 1975-97A6.5 Veterinary Services
A7. Industry and ServicesA7.1 Registered IndustriesA7.2 Co-operativesA7.3 Tourist Traffic
A8. InfrastructureA8.1 Road Statistics (the Special Category States) A8.2 Road LengthA8.3 Operational Performance of the Transport SectorA8.4 CommunicationsA8.5 Power
A9. Banking IndicatorsA9.1 Banking IndicatorsA9.2 State-wise Credit Deposit RatioA9.3 Number of Bank BranchesA9.4 Credit Deposit RatioA9.5 Recovery Rate: District-wiseA9.6 Recovery Rate: Bank-wise
104 Sikkim: The People’s Vision

Appendix Tables 105
Table A l.l: Key Indicators: District-wise
Total North East South West
Area (sq. kms.) 7,096 4,226 954 750 1,166
Disrticts (no.) 4 1 1 1 1
Sub-divisions (no.) 8 2 2 2 2
Zilla panchayat wards (no.) 92 20 27 23 22
Gram panchayat units (no.) 159 20 48 42 49
Gram panchayat wards (no.) 873 98 269 243 263
Revenue blocks/ villages (no.) 453 53 134 145 121
Towns (no.) 8 1 3 2 2
Cultivated area (hectares) 1,09,068 15,272 31,707 29,498 32,591
Households (no.) 1991 76,329 6,658 34,241 17,924 17,506
Population 1991 4,06,457 31,240 1,78,452 98,604 98,161
Urban population (%) 9.10 2.57 17.86 2.61 1.80
Rural population (%) 90.90 7.49 36.06 23.63 23.72
Scheduled tribe population (%) 22.36 19.03 41.4 18.34 21.23
Scheduled caste population (%) 5.93 4.61 51.83 23.10 20.46
Decennial growth rate (%) 1981-91 28.47 18.90 28.60 29.78 30.55
Population density (per sq. km.) 57.00 7.00 187.00 131.00 84.00
Literacy rate (%) 1991 56.94 53.55 65.13 54.08 45.62
Males (%) 65.74 63.64 73.10 63.18 54.92
Females (%) 46.69 40.69 55.66 43.7 35.26
Total main workers (%) 1991
Marginal workers (%) 1991
Non-workers (%) 1991
40.45
1.06
58.49
42.9
1.23
55.87
37.14
1.37
61.49
41.8
0.98
57.22
44.32
0.54
55.14
Source: Bureau of Economics and Statistics, Government of Sikkim

•s:5
3u
G*3°*Eo©£
s•9
>>£8uOCOu.
31flu
£oQ4>a
O
N<*)3aH
$inS
I
NS
£
£iOs00Os
So
i£
£00gOv
£iIO00Os«/>00
iw*
*sOs
3iN00Os<NX
00
*Os
r*Osr*l
X<s
ONVO
o
t>rt ronco(N
Os<S©
VO00X
ONr -in 26
3
rT c i<N r i<N
iti OShro
r-8 33
7VO VO \6
o 213
VO<N
oT On
VOOs
©r-vo(N^tTt 18
9
u i © o '
s ^rOs
ONCO
210
rTfSoC oC
t - r -VO V) ONTf00 X oo"
s XfH o00
vo"f-H
i
00 <N —<N rt <N
VO
92 O m co oo o —\o <—
^ in
2 on£5 Tf \Doe r -^ Tt
IT)OOrT
S Ttoo<S <N
ITi _<*} o ri
m co co
<N
CA
W>W)
u*E&£
•c&0<
Os©
VOot
X
»rT
»Ti$
005<*T
0000IT)
Xrf
VO<s<*r
CO — 1 1 00 r- © 00 o • r - 00 CO COo O' ON 00 © ^t CO ON <N VO CO
— ^ ON r- <N <N (N— co" (N in"
CO m 1 • Cn| vo t^ CO o « . vo 00 CO VOO CO ON r- CO r- —N ON 00 r» ON— O n »—* o 00 VC» °0-T co" rf co" — ' co" co"
ON • • CO , Os CN o • • <N 00 m ooON ON 00 X o vO 00 CO 00
o_ r*l ON vO CO (N(N Tf co"
00 Tj- I 1 00 in X ON o ■ ' ON vo in CO VOvo >n CM o r - <N o o (No o . OS o '"t in 00— co" r i CN — " co" co"
m in r - — o
O ON m cnON— 00 CN O r - cn
soCNo
VOOsr*ici
r-IT)IT)
cn<*>
OO CN — <N t
ON00
§3cr>> GOu .Sto .£
■§ 5
Tf ON Tt \D O '
o in mr - 00 00
r- CO CO<N
<N 00 Tf OVO ^t Op_ VO co in— " cn"
r - ^ — r -CN<N
m r- O n in ON VO _rf fS — t r- vO r-in ©^ r- ^t csvo" ro <N
CO r- VO CMin CO <Nvo rf <N vO
00 vo (N r-On ON O min CO CM
ON — Tt 00ro —
00 VO oo r-CN —
m r- r- Tf CN —
— in \D in Ov
— . — 00 coco — —
8 S .2
c* D
£
1/5CO60
UJ
rr o • • VO CO r- oVO tj- (N ON<s Os (N
CMoo co
co"vO<N
nt"o^oC
fS VO<N <t> \C VO
Oni-H ^ 00 ^
© o 00in >o i/T
Tt O ' » in VO ON CO min CM CO VO O 0000 o r** 00 ro<n" rl ri
2 o
o oTfm
fS o0© fTir f
00 <N o ©
^ S ofSr<r
2 8
r i
^ 9 oi-H On
prj 00ooIT)
t :E.
e
8 .
e<3
2 S
On 9OnO n
OnvO00
££O
u
CO o CNrJ Oo (N o
(N cm"
O S
2 3CO o
—<N —
r - <n vo ^VD (N
r- On r\i in m —
on r-Tf — <Tt —'
in o oO n OO00 CO (N
-H Tt CNVO 00 ONr- O On
SOn 00 vo m ON r-
OO O CO — VOin oc in
r f O OntJ- t"'- CO
— CM m Tf CMin OO Os inCO CO m CO
O on— ON COON fO ^^ 00 ^CO CO
V3 .S
I *&0
H 00 0
£"TOCO
x>D
Cu>
£ Sour
ce:
Cent
ral
Stat
istica
l O
rgan
isatio
n.

Appendix Tables 107
a* vo OSVO I/) OsVO fSI/i VO VO
ON mTf CO1ft vo VO
*Cfiu
00ON
G•a•co©
£ouu0 u93•**Aw3
1
8aQ
yj
<sc4<£2
sK
& ri t-* CMTt in (Nift VO VOn I/i in
305
00<N
■O4>«<-a
su-COD<
~ so
00 VO CO
n oCO i—iOv os it) in
0© Tt•T) rTf CO»/i in
I £voro CO
oo sovc in r i co
S£ °© in vof*> CO
3+ ^CO
O mCO
os in r-
r- in in
Tt m m
CO Tf 00
O invo
^ oc (N (N
r-<N
I/i -Hco o IS ^n
•c00<
GOC'5b60o
Q0roon
3n
fN©
in PO VO <n
oott
IT)©V©<N
00r-
5Tf
©VOCO
Tt —<CN Os r-m
oo co Tt os m <n—• m oo vo os <nr- in — os '
«n vo os *-* oCO OS ^ Tt HO vO co OS
CO Os co r-
i/i r-<s -H
Tt os vo os(N
VOOsCOTtm(N
00c
vo COr- in r- •
O VOo in r-
m vo Tt cn os mvo vo O vo vom CO (N Os
CM O (N 00 in —(N CO 00 COin co -h -h
o ^ ^ o r- vo—■ o (N oo in r-in co i—1 oo
Oco00
fl .51 s
00(L>O'
VO <N 00 Tt CO OS— in in O —Tt (N ^ oo
<N CO —iTt CO (N 1
OS <N NO Tt <N VO in00 —I ^ 00 CO 00 (No co — r-- '
eoU
c3£C/3c300
’C
w
fsinvo
TtfNCJVO
00Tt
l/inTt
i/ios
©r*n
<NfN
00VO00
n00
0000VO
(N00Tt
COCOTt
o o
ovoCO
mOs
VO00
© VO 2 r-
ri oo
c3OC36Soo<D0003
t:oOh
a>C/5
co r- os -H r- m
CNTt
(NVO
w C § -2 Dh 03
sf iou
o 00m VO —*r- in CN
O Tt CO OS COTt os in inVO Tt so co ^
oo os —• co o—* *-h os r- oTt os co in ^ os
oo in rs osCO Tt 00 00co r-* O oo
m Tt O (N r- <n
00CNCO
Tt VO VOvo o so oo in
os in Ttvo r- osno *-h in
Tt VOvo inTt —
OSTt in
2 3'•'JV3 ,C | *j J3 W)
. C5 1Vh S3H PQ
m Tt O vo oo r-
ON <N o Tt r- no
cn in oo roo osCO Tt NO
O os On^ Os ^CO co
— Tt ooin co os coTt ^ Tt
r- -* r- co in co
CN C\| (Nin os cNco Tt co
00Tt
es■s
« - « <D X)S.
Sour
ce:
Cen
tral
Sta
tistic
al O
rgan
isat
ion.

108 Sikkim: The People's Vision
Table A2.3: Per Capita GSDP of States: New Series
(In Rupees)
1994-95 1995-96 1996-97 Average All India ranking
Special Category States
Nagaland 12,153.00 12,919.00 13,726.00 12,932.67 8
Mizoram 10,378.00 12,489.00 14,267.00 12,378.00 9
Himachal Pradesh 11,018.00 11,693.00 13,750.00 12,153.67 11
Sikkim 10,133.00 11,067.00 12,128.00 11,109.33 13
Arunachal Pradesh 9,708.00 11,371.00 11,037.00 10,705.33 14
Jammu & Kashmir 8,820.00 10,139.00 11,063.00 10,007.33 17
Meghalaya 9,055.00 10,145.00 10,271.00 9,823.67 18
Manipur 7,817.00 8,218.00 10,363.00 8,799.33 20
Tripura 7,460.00 7,474.00 9,017.00 7,983.67 21
Assam 7,457.00 8,042.00 8,406.00 7,968.33 22
Other States
Andhra Pradesh 9,992.00 11,316.00 12,791.00 11,366.33 12
Bihar 5,099.00 5,242.00 6,245.00 5,528.67 25
Goa 21,110.00 ' 24,569.00 29,548.00 25,075.67 1
Gujarat 14,560.00 16,105.00 18,330.00 16,331.67 5
Haryana 14,728.00 16,347.00 19,707.00 16,927.33 4
Karnataka 10,890.00 12,244.00 13,968.00 12,367.33 10
Kerala 10,874.00 13,203.00 15,197.00 13,091.33 7
Madhya Pradesh 8,383.00 9,602.00 10,783.00 9,589.33 19
Maharashtra 16,109.00 19,644.00 21,541.00 19,098.00 2
Orissa 7,340.00 8,246.00 8,141.00 7,909.00 23
Punjab 16,620.00 18,177.00 20,908.00 18,568.33 3
Rajasthan 9,053.00 10,068.00 12,010.00 10,377.00 15
Tamil Nadu 12,171.00 13,679.00 15,929.00 13,926.33 6
Uttar Pradesh 6,748.00 7,409.00 8,950.00 7,702.33 24
West Bengal 8,922.00 10,271.00 11,320.00 10,171.00 16
Source: Report o f The Eleventh Finance Commission, June 2000.

&a
4>;►PC
ro<o>3H
\OsOs
m (N in 3
VO m
ooinvo
o o in vo osr4
S-iro1i r- r-i 2
tH
m ^ r O r O O © O O s O s T t O$ § K 8 8 § 2 K 2 ^ §T f > « h 00 X T t V Oin in ~ “ ~ ~4 ^ in in -h ^^ i-H
« <»i h h 't t^ iJ « u5 <s n* r* co ro i-h2 3 oo V© oo 003 ^ ro rf -h ^
(N G\ H ^ (Nri O fO >ri \o“ ^ oo oCO
o o o8’ vd o-H CO vo ^ -H
CM Ttvd ^ vd O in coCO ’—1
Tt © oci in in o oo oo
T f Tt
ro © o'
00c*rfTf
OCO 00 VO r- Ties aTCO
5 ro r-2 s I a
vo vo »n co o VO r r- Tf
cm ^
co in in On <N ^ r-
CM o O n in 00 <N— - - „ . o^c^i Tt Tt’ t^K N 1- h ac ^ -h on r, R ■h N O ^ N K ^ ^ OS
fS © © ‘ o o rs >©^ S § 2? o
. ro 00 00 CM<S Os Os
h N VC VC T f VOOS OooC oTN <*>
© OSvo v©
3 3 §s. , Q\ vo V) -H
in in vi yo N h^ © os co ro ooOs O (N
-H T t O n
Tt Tto r- m oCMro
oo in ©O Tt H H
Os c4 i>CS OO H
V©
O o(N ONo 00 00 ^
s ^ 8!r O 0 \ COS H >n oo^ vo m n Ov in^ <N O'
Os
fS m cmCM
= * OS Tt co oo (N in vo vo
^ N N >n Os ,X -J^ ^ 8 S»n *n ro Os ^ «k.r
v o v © T t o s r O T t » n r ~O © VO (N N - 00 00
oo h >n inX Tt oi On ri ri vd h fS rf - w « -v - ' -Tt in in (N
O 0 0 0 0 ^ ^ rt (SJ N K C O -Hi-T rs h>r K 80 <n dr 00
in os 5 oo os inoo oo os m © ’ ^ vd S co vo cm r- r- r-
i> t© >2 S ^* " ro rs m inN h voOs <*> “ ‘
co ro oo in in in ^ co r ^ o o o s ^ H © o o < ^ ) ^o s v d ( N i n i n \ o o o t o o v ^ ^ c O f N ^ ( N O s ^ H r ^ f S i - ^ O s — ('‘v
Os COcm oo
o o o cm
in coTf Tt
-h ^ w ov m osH N > T t -
OVO
© Os OJ3 °o_ r- co
O s Tf O— ^ on in
v© Os n oo ve Os© © in in
r *„ m w.. 'V in os ^ ^Tf rr> »n oo m m•n <n ^
CO © 00 vo vo O2 X rH ^ O . .ro oo p-h in vo vo
OS 00 -<N oo Tt '
vo in s
© o o r4 vd vd
vo in co in co o -• -• -• So O -■
f O v © i n - H f o ^ - H T t v o i n o o o h n co ^ r<f —T —T ^ T+ —T
r j ^ o s o s c o f O v q r ^ f N r ^ o q — — vq^qoTtosTtvomt > C 95 ^ ^ ^ on (N (N o d v d (N r4 r4 co os K?r _ v ^ o © * n i n c o c N i n c N o * n * o i n o o oo © oo — ^
vo v© m ^ co v© TtT f >
rf <n " ^ o fS rs ^
CO Tt|n
in fs H ff) CO—h ' jn ^ r-K — I oo
co o vq v© o ooTf (N ri 2 vd os
CO Tt ^ CM
N <N h ^
3 1 s* s '© ^> <N V©^ ^ in ^
vov©oovoininincNCNvooocoTt 3 3 T t d ^ -H a ) OO O so 00 T t T fos in ^ Tt VO co co
Tt ro vq r-*n v© oi co
Os 00 Tt Os 00 , X V, rl 2 VO OO VO OS, s 2 S 2 ^ 5 ^ 0 0 'o n ®▼H V© Tt ^ fO ^ — I t\
H rj' cn prf
(N oo <N — "
t"* VO ^ 2 h ON ^ cm <S vo os^ o' ~
© i n T t T t
r-; Tfin rofS
<n Tt o vq cm Tt00 ON h ^ fO 00co oo co oo <N) in(N
o vo in in vo vofO ro in oo Tt^ ^ c iri * > ri K \C * ri coHr in Tt <s oo co r- r- co os^ rs <n <n — T on — T
N JN H ^ ov^ *? © © in ro osin »n v© inro co ro
® i ^ ^ ^ t ^ c o c o h ( N x i n O v f f \ t > r^ r^*ncor^o6osvdosodo^os — — — ^ — oo
©h rf ri
(N — Tf
TfV’ i l"- \LJ W' (J ^ (NT t O H O O c n O S r H X » H T t VO CO CN © y * O
o \ > ^ t X ' O i n r ) h ( NS s S s ° o ^ ° o 2 ^ o o^ v o o o v o c m o o ^ v o v o <s vo co vo wo os m o
rsT —T cm
V© vo © V©$ 3 £ gro fn n in ^ ^ ^ ro ih
h h ^ o O N r n ^ f v t s c o y pt ^ ^ h O s h ^ ^ d d- N IT)r* cm <N
CO N in hco oo (N i n
Ttv©TfTtoTfKvOinr -Oro^ o S &(S r ^ CO fS ^ —
<N
OS os Tt i_ - . CO CO
Tt § Tt 00 •n «s oo Os <n oo Tt in -T vo" — T
CT3C
w
aD
o
2 £
8 •&4> ^p c 8v i+s *> c ag Sj > ^
PQ+w sV c 3 4> c ► 5 v >► u
£ * a oH <
= £I 8 «I £ g
eoM 2 —« 8 T3S ccd ^ osH H J
00 &CU 03
£ u c ^I g1 t*•a S. x2 0 3
1 3 CL Uc z* ^ gc« ° Xa. «> «£ S s5 S 5oo H oo
fS
x * «2 3 S
S ^
'Oo
o %O cd Co a
o
^ 03W- ts<t> s
oo H O W
^ §.£*S o> o tt2 3Wh 2<u fl# ^ i O H
ro
tta c’cD<+-!o03
O Ma> Mc3 sJS i3 0Q
3 CV;►t/3 h ^ tt <u ^3 a00 ©
Z
S
«
2G*
<%1/5-oc<D’H
-3«r|x . ’Coa) s ccd cd oo ’H,
§ g s z
O NNoo h
73c
. ^5« C <D C
1 1! ?a> w00 c73 <D1 sE^ SIo o
PQ-ac03
301
(DT3
§ | « .5"O
3Co

Tabl
e A3
.2:
Non-
Tax
Rev
enue
n o Sikkim: The People’s Vision
*■*a
3
ooW* —> O m soSOTt
a© ® vo o vo vo »/>f e E S o d d o ^ ^ o ^ X ^ c o O c o O l" - — —VO ^ — Tt
O VO M (N -
— O i n sO
© o os i n co d
po o» sicofN
vo m m cn —o in on
T t dosVOf" TtCN
oo
TtCN
vOCN Qs oCO
po po oo ® ON po fN V Os
> vOPO PO ■^ £CN PO —00
PO ^ On
5S 9 dri po —vo
VO Os VO^ ^ -4!n n 3PO <Nr>
Ttjo _;N ^ * OsfN <N
— — OsOsOs
oo m co —>
in oo — ^— • in in
CN00
TtCN
O nin
CN00CO
oCNOSCNCO
00mmoos
oo»/>o00
PO00OSTf§
T N 0 0
i-5 osTt
i-* 00 Tt
o o ©in —
oTt
On 00 Tt — —'
O OS — d
<N Tt~ <N CN —
Oo
oo
vqT t
vOo
ITiO vO 'O PO (NsO O f "*—1 ^
— ' in ’ oo oo
in vo — o
fN CN Os Os © ®SO CN 00os r- t <N m Po —
vO>S O•*, co CN (N
oCN
POTfroo
00VOOsvdfN
Ovd
CO
in
CNTt
OSin
T t CN CN —
oo Tt m— * o
Tt O —;— (N —
in cn inCO CN O
VOTtCN
TtoPO©vo
PO _ 00 fN t"*ri —.
on
0000VOVO
r- —fN —
mTt >IT> £ ^© ^ ^1~ SOfN <N
so t>O 9 \ Os- 3 -
vqTt
r-T t
CNTt
vOCO
CNo
vqoi
q ^ co d
sO CNo
o o o oTtVT)fN
m _Tt Tt — CN
O ooo
CM o oo —’ in in —'Tt co— CN
On -< o Tt► (N
oo o r -
fN
mo
00o
sq o Os CN m cn^ CN
i n ooCO —'^ CN
CNCO 00o
cocn O vo CN
o vo VO O d d ^ 8
0 0 CO^ o
(No
U 2O vo o o
O m o o
o inCO <N (N On r -
r- r- r-00 ON — ‘
£ Os ^•v <N —CO CO COd vd vd
O CN
CO
oTt SO ^ 0 0
d t t o om oo
i r- voJ oV Tt — o 2O Tt
cn co vq CN CN
00* 2 2
Tt
Tt
r-o
Tto
—. o —— 1 Tt
T t vq in cn co «n cn oo
► cX %■s *H 8C K° r.- ll -H eS
a.*c
eoj-a
a>2
w£•a **C 5« <u «3 t5 S
JVea
t:
oa-
•otu*T3<U
<=o-op
X)DO-
W) e3
•I g § IX £
E
"E,e
oX) 03 — 1
(D
•c3O
oon
« .s.a >t tD in
Eoeoo
&-oc03X)
Oho«->U
&-T3C
cds’3<
c<D£ao
03Q
2£
&
oU-
DOb£
I 8ex01oU

Appendix Tables

4>U3•3caxwa>sc;►VX
co
-SiZaHa
5 <in Z Os
Os <*> V© N.m KTf V©m lr>
© <N VO VO »n t \
vo2oT
Tf — 00 r- <N sO m osin Tt <N m OS 00o in vd in cn rSoC (N VO 00 NO ON VO (N
w* —■* O' <N in —
3 vq o vq 00 r- in o00 d (N vd rn Os (Nri o (N VO o 00 m m© On 00 os<N O CN
00 <s
ON
os Os Os m<*> <s00 nin rffS <s
VO moo 00 oo Osoo oo fS "5tvh' <N r ffS
00 VO fO ©tH <N ri inOs in m00 oo" ©90 <N n
3»n VO vofS Os<N in<N
o s Osa© oo oo oo"
m cr> t" *\ OS Os
rs
fSOs
rT
r-n
nVO
nsVO
— O n vq — O nOs (N 00 <N vd oOs 00 O r- 00 00 (N
;£00cn
^t-
in vo in Os Os 00in vd rn Os 00 vd—^ <N •—« — 00 ^t ^tovO (N rn
<N (NCN
cn (N o Osin >— l in— < oo O n rf- CH Tf 00
in (Nq_CO
CM OS
in o 00 Os <N00 vd <N (Nm O n
Oscn(N
Os (N cn VOo.
Tf o CM o O n vOo< rn 00 00
8 5 .r-o 00 in CM (NVO
vq CO 00 00 rn O nin O n Tf in 00r*(Ncn
(Nm CO00 r- CN VOin
§ % in U-ir- <*> <s
in irf i-*' */T(Svo
ITl lr> wm00 00
r- ^ <s <N m *n
i
«£1 §= 1a> RQ, ^* &
(Sin00osoo
N<sf*f
wa>3c>a>
c2ss>>*>&S
CO+<a>u3H3ca>attW M3 £ s s s 2 §" 31 O fi <
t:cdt:oa.
coc3o3•T3W
OnvO
vO00
OS
©fS
in In in N
r ivoinin
inr noor i
oo coCO Tf (N —<
oo fS rn00 fn00 OS t -
r400OS©
r * i
©<soo
OS00m
in CO in r- —in CO CO
vO<N
sO t VO to r-
r-vo
(N <N oOs CO sdm Os COCO r- vO<N
vq (Noo 00m o (N(N r- m
CN —«(N rt in <N
(Nin
inos<Nm
ocor-CM
co^t
mc*in
m in inS CO CO
<N Tf 00
><u73C03
X>V-3
ts1 s
a.a,3C/5
UrnWc3£
-a03o
j5
co
UPQO~ 0Ca3
H00U00(4-1o<D
oX)JST3cc3Urn3oX5cd
J
3C2
13
T3C
o00
4>x:
<N oo rn os r- Tt os
(N —;
in 2> O (N cn
in CO vqvo vd00 (N oOn (N
<N
CO q in in (N CO O n <N 00 oNO CO vd — i Os fn in oin (N 00 CO (N Os o 00 00 COo (N O' — r*i COco — l^ CO
oo <ns s
cm<N
i n
Eocou
00008(N
(N(NU-i
00srn
m CO in Oso oo CO Os tvqc\T
vO O Os
m Os —t (No vd ^t OsO n vo <—* (N min
00 CO r";(N
VO
o CO (Nvd (N (Ns CM OvO
co
CO ^t o <N inOS Os CO CO o Os— ^ CO CO CO r- OS (NvO 00 VO <N VO COin <N co" (N
On VO Tf r-"in Tt" o 00 vd sdo t- t O VO 00 r- CMr- CO 00 'd- (N
CO
in oo m o CO inr-‘ vd vd ^t * ininm mm vo
tOsvO(N
00 VOOs
On 00 CO OS 00 CO in Osin (N CO CO CO CO<N 00 CO CO ON m o mo CO CO CO in Tt
<N
r-oo<N
in^t
vO<N
r-(N
o -rSO On O <N
VO CO (N Osc4 t ON 00VO 04 CO os*n <N (Nin (N
r-or-oo
vq<N00
(Nr-
r n
(N
00CM
<N
(N00(NrnfN
a
T3<U _S ^ o313 - L-T3
e<uea.o
H j><D73
13Wn3
oo-Ooo
T3Ca3
>%60V-I<DCPQ
3-T3C
001 00
G3g£oo
t;ocx<3
H
in<nr-<N
mOs(N
rt os vqin r- in—. vo(N <N(N
Tt \d»n r- oo
as —<oo in Os in VO
(N VO O m r-
c<DSCo
' >c<uT3C03>,W)o
'ocx;
Oso(N
Osm(N
C<ua
•C?
II.
Non
Dev
elop
men
tal
Expe
nditu
re
2,46
6.0
2,96
3.2
3,74
6.7
4,54
6.5
5,39
8.6
36,9
15.4
66
,585
.5
87,6
01.1
98
,690
.3
112,
777
115,
059.
1 54
,703
.2
C. G
ener
al S
ervi
ces
2,466
2,9
63
3,747
4,5
46
5,399
36
,915
66,58
5 87
,601
98,69
0 11
2,777
11
5,059
54
,703
(a)
Org
ans
of St
ate
291.
1 30
1.0
331.
2 34
4.5
356.
6 52
0.3
606.
7 61
6.4
809.
5 1,
025.
6 1,
120.
0 1,
029
Con
td.

19
89
-0
19
90
-1
19
91
-2
19
92
-3
19
93
-4
19
94
-5
19
95
-6
19
96
-7
19
97
-8
19
98
-9
19
99
-0
R 2
00
0-1
B CN yrt oc
in ro r-VO 0© r |oc oo"
ro in O inin 00 o ONin in NO innO r-" r l inro ro
rj Ttinro ON r-"NO o
r- OO m Tt oOs 00 (NVO Tf ONTf nO ON r- I>ON ON
>n XCN © nOTfin ir (N
irT in
<N CN CNin Tf— nC ONro
rf
r , _in OO oc
ON ONTt CN CNrT ro
oc SO NOvd Os o<nO ON ON
00 ocCN ri
rO roro ro ronOCN SO nO
ri rf
00 vc# NOriNOCN
CN ri
<N’-fCN
ONr -
nO^ t
oTt<N
r -or -o
ONcoON
NO00vo
^ 00 r - (N — VO
in — ri Tf’ r- ro O in
in on O n ro oc inNO Tf
ro^ t
NOo
ONr -
(Nin
ONONro
<Nro
in
ON TtON ^
o o
5 «cn ro
NO
r -roO
nDONr-
r -inONm
*-H oo vo in in on ri ©
ON ON ON Ori ro
SO NO NO — in ON OO nO roNOin O n On
o00 dNO 8 dinmON ON inON
—• 00 00 oc r- ro CN T-H
rf-
r -ON
oTt-nOm
^ 2 Qn . rl- On r -
ONoCN
mNOo'
<Nr - ‘ —00 <N <N
ooo
"Occ0ONO nOn
vo OC ro oo—
© CNOO no oo in
o
sr - r - — voCN ~
— ©— Tf— Tf— o
CN roON Tf
X>0>T3Ou>
£
q (N CN NO NOri 00 in ro— NO CN NO
<D in ro
ro _ r - inTf ON nO ocTt NO t1- CNr- ro CN —'
c<u
U
X<uT3
CU
T3C3
s 1 ^ fc
§ .5
»- <D£ -C£ O
NO CN nO Tiro
X4)-o
-o .£- g
,o .£ ^ c
I £■r <O-oj—CXa
<
^ O ' — <N —
ON <NTf
<Uc<D X)w <U or- r > — "
e<U
CJ
e
c.2c<u
d ,
T3cCO
’OO
JO
"aw©
sc
oo-a3
x
o> -£5
Ss0£
c — .s•2 « 15c/3 O 5c .22 Ecu i— a>Oh 2 a£ ©
U
*oc
£ * ■a mw o
c(UE £(Uoao
c«TD
paT3
V3 3oj oCO 'CE s<u c3
O
U hT30^

a
=2
ri r- o vo ri cn ri rf Tt ON fN H
<nON
so cn r> O nm 00in (N Tt
r-r- 00Tt 8cn
vqoo<N VOIft f*i
V-oONvOTto vOcn
in m o o in vd — • oTt ^ Tt
CN O^ inoc ve o iftcn
<NoinVOin
riSO
CNVOcnVO
cU
<n r-SO Tf ^ © ri oc© Tt N H
On iftr- i> ri ^ IT) On
Tt ift** r4 rn <n so r- ri ©t"* H
^ 00 od
vOo00 — '(N T t
Tf ON 00 cn
| SO cn vC ON^t Tt ON<N
r- 00 CM r-© in 00 vOr4 ri ri vdr- r- m — o00 ON(N vO (N (N
© # ift (N ON inTt ift Tf ri KSO © in 00 vOs riri m (N Tt<N
OoTtr-ON
r-<N<N
vOvosO
<N O nO inTt vd r-r- inin —
ONOC in miIft — 00CNso
cnO
ino
oovdmoo
00Tt
cnr-
On00Tt r- oo r-" cn —<
in O n
£ 'Q
\D »n no o2> »n vo —Tt
<N 00 On <N O O n
cn O ©r- cn
ocn
vo3cn
mvO
cnCN
inr- so^ TtO n SO in _Tt ^t
mS
© qoo 00 in m
ri cn
00 00 Tfri cn oo ooCN <N
© ofN <n in m <N <N <N <N
VOONO n
in Tfso SO £^ 00© ooO n O n 00SO
wm inO n in <N 00
cn<s— riTf ON
<s <N r- in 00ri ri mi ri odin o vo
sCN O
cn
O nOTt
CMin © d <N <Nin m
t"*r5cn (N
<N
iftONO n
so on ©s© so O nift ^ OnIf) H IT)n © ONSO ^
rf in © 00CN vO <N cn ri
in Tt^tcn — oo O <N
00 vO r- oc ri — so
oin
vqcnm
vq — ; ON 00oc © r- — oom ri
o00^ ooo oo o ri ^ ift
a>u3‘-oc4>aw
£urrr?<QJzCOH
in
I
ri£
nN
oo vq cnri r-’ ri© r- iftt> so riri so soTf
© rfin oo sofS <s tso r- rt— SO SO
SOO n ri Tf O(Nn
ift ift
3 00©©fN _ __on ri ©SO soTt
so m on© © rih n rjn oo ttCJ so soTt
© in cirr r-*h n »so ©^ >n ttri
so so sori o\ Ttoo in onr- so 5ON Tf Tf
Tf riO n m O oc
Tt qr4 cn© cn ri cn
riTtinSO
©Tfri
SOOOri
S 3— ON
<N o ONON ri 00VO 00 m<N cn ON
m ON ocO n Tt 0000 r- 00cn <N O n
vq vO r-Tt r-* — iTt — < r-cn r4 00
ON q ONCN ,—! ri00 o ON(N — ON
ONo
r-oc
SOri©
riTt
©t"*5
ONr-r-
fS ON © ^ in Tt ri — ri
r- in r-; On r- Tt 00 00
in OOS
<N Tt in in00 vo m ON (N ON ON
CN (N m cn CN CN
cn o Tt ON Tt t"- SO vqTt VO Tt in inr- o Tt VO m 00 ON On
(N(N (N CN
Tt Tt in o 1^vd in CN 00 od cn in inON Tfcn(N
r -cn (Nm
<N 00(N oo 00
ON inri in Tt —iO o cn mCN r- (N m(N
fSod
Tt
Ttin
vO O O n vd Tt Tt O nso Tt r- ^vo ri t—
oo
r- »-hsd O n O n Tfcn
ift
cn vqvo —'vo — '
TtTt
ONTt
TT Tt(N
<N <N© ori cnTt t
ONri
sor4iftri
<N©riri
in
£N
ON
ON
vqrimcn
ocn
ONON<N
ON<N
OH
N+ tt+< a>a tj
3 3 ’>uO cOJ VVI*08 sa iscoU
o'3>a>*s©
73 Q <©H
3-T3PJ
CJ« U pc 03 'S3o Oc3
'Eay;ucn ’C
cxa.3 o3O<D
C/3 00
H 1c3 <u> '5o
3
— ■— ^
c’>OC3’O.2
c«*►u u.a> 3c/5uE
3
W)©c <©o
w> ^6 o
c<usO-’a3><uT3
30^
60t
E3
'•3<D 1E c
ooT3 60Vho O <u
'c? o cW
o 3
'TDe
c«a>#wc/3<Da u-a*cnu. 75(U bC/3 a> 4>O ca> aEo w 73e
t;oa.
0)a
aca>EajDa>aeoZ
COpC
C3Ic
C3x:
e0) <uU fa2 s£ o
<uE
T 3
O-©a
£COa
c>
T3
c3<U£T3C03

1989
-0
1990
-1
1991
-2
1992
-3
1993
-4
1994
-5
1995
-6
1996
-7
1997
-8
1998
-9
1999
-0
R 20
00-lB
o o oo in
voO n
CMON
COVO
ooCOCM
in5
CO
CM00
sin
jo
uccc>>
I =i
53 a?O >o
5«
coUo
CO r- Tt VO COin rr> ONin CM <Nr- r- m m oi— i vOCM CM
o o
ONo3
CO CO00 oo i/> mn cn
Pco coV© voSO VO co CO
c
^ 'SV s e 3a•s ’S
aoH
m rj vo COON CM 00 CM CMo 00 © ONON 00 mVO CO CM
ro00
CM
00CM
CMCO
50 5£ §S Je <o _Uas _ .■§ 29+ ^ /~VoH
o r- onCMvo
00voONONin
<s00vom
£ON ^r-
m m 00 00ffi co r- ^
cm ^on* zX
© Sr- ^
m £ r-
ON ^ in £ cm © in *n in «n
m »n in ^ w «•>
o<
P h03u-T3C23
T3
COU
ojrt
O<NVOCO
t<N
r-’ S
om
»n
T9C
c->Ca>BX3#CC©u
Os inCO in ini-H in CMm ON oON vo vo
o o inON ONCO 1—1 oON vO VO
in CM00 CO1—1 VO ^t
r- ^t in
CO ovd vd COCO vo ONVO m 00
! o inin CMl-H CM inVO CM VO
rf in oin vd COC i 5
ooON 3^ voCM
mfMvoCM
00oCM
ON
in
vqCM
©VO<#ws£
>2PhCfl0DC
fiCO
^ Tfin on o n- ^ asTt ^
00
vq
ovd
O nCO
CM
T2 g03 c
oO h<DQ
invo vor- onCO — t
— ; Tfvd COON00 CM OCO CM
00 ^ K ^O co ^ 00 CO ^
osCMCMCOCM
inCM
covd00t
00in
VO CM CM ON CM ON CO o
o
CMCM
00TfOs
t"- vo r? oo
2 S3 00
on in © PVO^ yX —4 00
o<uc03
C<ua.
>oa
Tf oO 00 CO 00vo 00
OS l/)r- ooON X Or- r"
CM00^tOS
oVO
or-CMVOCM
T3VCQ'O
in
VOON
m
® 3 Xu g o— V —a©H
>o>
>vo
CM‘n
O nCMVOONCM°o
mTtONON
o ^ r- o o £Tt ©CM 00
-t ^o so m o
ON
ON
PO ONo gm, OnCM ^
©VO »r-~ ^cm £rcm
ONCM OgCO 2 00 2 ,—4 ”
in ©oo n
U
>
^2c£<u
co © O oTf 00 voON in °oCM roVO CM CM
CM
‘n °o °o §2 §
>KOoo
»ovo
K-3
00
<u0DT33X><UO
OQT3C C03V
s-a
oc<u
T3XW
2. Fo
r 19
96-9
7 ot
hers
in
clud
es
info
rmat
ion
and
publ
icity
.
Sour
ce: F
inan
ce
Acc
ount
s, va
rious
is
sues
, G
over
nmen
t of
Sikkim
an
d A
nnua
l Fi
nanc
ial
Stat
emen
t (1
999
and
2000
).

116 Sikkim: The People's Vision
a
U
<
zaH
Os © qT-H ©’ r*5 coTf PM —© Ov 00 OCin Tf X oc
in in r- r-rn <*5 © doc ITs *nrn © —oj sc so
in ur, o Oir] VO 00 oc d ds© 00 oc O'os VO r- oco n
o- 00wm 00 d d00 00 oc o om 00 in m, Os —n ri “
in rn © O 0 qas — (N3fS
00 OC CN<NfN r- r-
SO © © o or4 in rS m] ocr- © O vCF« SO sO vO »nTf —
00 in in ori © miTf n <NfS Tf —m r<i ~
os as rn co Tf t|-in m Tt tt
O O 00 OC oo d oo oo d
© © 00 o ri o o o o Cl oin © Os
m"tocin
in d d d sC d
o o o o d o d d
oo ocCO co
00 oc r- o — o 00 q o00 oc — * oc ro d— sC r , C4 c*~, IT, o(**, ir,n SC sC Tf04 0404
© © Os o — o© © Tf d d© 04 oc ino oc04
<S © so ON SO 0404 © in OC 3ON in oc mr- in TfON 00 1
©d
o — o o d d
nOo-
q Tf p o^ r i d 'C co o o- in co —
in r 0C ^rj- t- o~ r- o~rrj OC rf Tf
O O
od
© o q qOs* ON in
nCnC
TfSO00
vCoc in
^ ^ oc oc q© ^ ff) rrj it!Tf Os 00 oc sOOs X Tt "t Crr N - -
r- —
oi oi in in oi© 04 04 04 r- insocq TToi 04 04 nC
ri *no Tfin Os in ir'‘ r - r— kn ^r i OJ — —
Os so O^ 00 OC c0\ N Tf t r,Os 1-* 00 OC m
a3 ojcc« a>a c ,£
0£c a>■o Qtf c© cn u Um aja u
© g cn ecU <
y
o
u
2Qoc
w C ^
oo
o in © SO ro — in r - in o r*', oooin
04*r- ©m TfONTf
Tf
ONdro oc oc
Tfocr -
w docind
o o q r , o o r- q r*% © SO NO nC O'; o Tf o<*5 ro — ! 04 d Tf CO d so © TT 04 o i d Tf d oo— O O O co 04 o r- in CO nC o— sC Tf Tf r- — — m 04 r - — ■ 1 in li
sCONTf
oi —
sC sO^ Irr Tf
Tf Tf— O vO — o r - © Tf NO — ON — < o o ONO d oc 00 d © r-* — CO NO o i sd dvC r , r , © p j o 04 m Tf o COoc — in 04 00 NO OI Tf OJ
in co 04 o OI sO o O' 04 o t t"; Os O- o vO NO OI o CO ooi X oc O' Tf CO d vd d d SO 04* Tf oc sd m] so d CO dsC O' o- O' in O' CO nC O' o oc in04 ■“ 04 04 04 Tf 04 Tf04 in sO oc
o Tf
d CO COin— ON Os
OC 04 OJ_! Os ONO' 04 04O' 00 OC
a soio-
o Tf rt co
ON Tf o O 04 in >n — o- Tf o O; o00oc CO
Tf ascod so* SO
ONCOsONO
com sdO' 00O'
coNO d oicoO'd
04 Os O sO sO o 04 h; 04 Tf in — in NO o o~sd co d oi Os sd OC o d CO CO doc in in 04 CO r<i O' ON Tf 04 inOs 1 co 04 ' Tf04 in ON OC oc
Od
© q Tf q Tf Tf o Tf OJ O 04 in sO in in co Tf O ON00 oc CO d CO CO o o © Tf o< d — Tf o d Tf— o- O' O' o CO r i m O' O' • — o OJ ON00 oc — oc — co Tf CO — —
Tf 00 oc sO q sC O" o o in O Tf 00 in Tf o ON «n 00 O OJ
rn CO Tf — CO o d 00 ON d oi in oi *— o sd in oo d _ic*~t m Tf oc ON ON 04 SO — r^ , O' co inON Os ON Tf Tf sO 04 1 04 CO CO Os
r - — ci ©OJ r ^ . q r . SO o 04 OC O © © 04 o O'; Tf sC q in oco04
^ 6
sO
oON.mON
Cod ON ON04
o SO © SO©ON
1
COsO04
o COCO oiin
sdw ONNO d
« q■is u>C c4> oU U
c<u
£D-
c d. — si— ... m
S j
(U
o
► C3"S
u uu.O
■ts4>
T3 S
= ! .«*- ^ © Bfe .s ► ** © B O © £ u
<u
’>~ 2s «■- ”? ,.
i l l i r iv — £
■2 £ 5 £ 60 *
^ S <% * 8
3U.
CL<U
> rt ° § a£<D
a: £ *o ~
iV^
^:
R de
note
s re
vise
d es
tim
ates
an
d B
deno
tes
bu
dg
et
est
ima
tes.
1.
Ex
clu
sive
of
W
ays
an
d m
eans
a
dva
nce
s,
2.
Pub
lic
Acc
ou
nt
net
of
sma
ll
savi
ng
and
pro
vid
en
t fu
nd
.
Sour
ce:
Fina
nce
Acc
ou
nts
, va
rio
us
issu
es.
Go
vern
me
nt
of
Sikk
im
and
An
nu
al
Fin
an
cia
l S
tate
me
nt
(199
9 an
d 2
00
0).

Appendix Tables

118 Sikkim: The People's Vision
-s:*3
OC fNro ocm Tt © ^r- romOs © © © co n *■ rofN3
.COJQCt3w3s-5?
ro<SCQH
ooOsOs
&Os
so2
in o\Os
S
roOsOs
fS£
s
© i/> so Os s© TtTt ©© r- in ~o s ^<nin —sC roIT) COro ^
V©fSr-Ttr-fN
inin3
ro NH fNm Tt ro ciTt osnr- mso or- ^2 5fNin ~vofN rO fN Tt os r-
oo ©© Os fN rO3 S
o o fN ON sq trn i/S fN ro —i ro— vO s© Tt ro00 un ro un so fNoc fN Tt OO
o ro Os un r- Tfro CN Os* o — OsO m, 5 Tt ro inm CO r- s©SO sO SO
o SO SO oco Tt ro Tt ino sO 3 m ro t>CN Tt ro oc mTt QC m, CN Tf
Tt q ro (N O m«ri 00 fN O ri s©Tt wn fN CN wno Tt ro — CN ©CN s© Tt CN s©
q r- fN Tt r- fNro d in ro fNoc <N t ro (N ©r- un
5 ro CN m
o oc in r- — s©ro oc od Os*oc ro 8CN
CO TtSO ro oofN IT, ro
00 ON un CN fNr‘ un ©* od o 0004 ON SO o ro Tt2 CN ro vC Tt r-ro
o sO so q r - SOOs un fN un —.’ ro*SO ON 00 o ON 0000 © r o r o ro
00 ro 00 NOr o uS Os* __ r i ©*00 oc SO 00 wn fNTt fNOs r o IT ifN
m OnCN Tf CN
©Tt
o o d no o —U~> ON (N
O Oo so o —ro cn t o —
CNomO s
00T t00
mON
oTt
Tt —vo — Tt r-
ro^d
00 —;on in —— vO
r- —ON CO
oCN
r J CN —0 0 d Tt TtTt r o Tt r - ON
r o ON u n
r-©Tt
© Tt r o in 0 0 inro in fN r o O^ fN in Ttso CN fN r o ON SO nO inoc SO CN CN m TtTt —
o8(NCcdOsONON
<D£o300
I •-Z.^ c O << c* ?3<yj £S •§ C 3.= c/5
osooos
Tt Ttro *t r- n fN ro ^ rov© Osr-' 2in o s oo ^r- fN
a>wes•wc«a>£
£a>a&£3*333
0)Q733uo3
vq — cn vO Tt
CN
& Q
roodocs©s©
mt>s©Tt
3a>E
©O
B ~3
X
o OC 1 r- soin —! © Tto ON. o c CNCO CN fN r o »—H(N
-O&Q
5*’53CJ<uc*
ooOs
°8c/5OfiG'>C9
J2Q
3a>!2*>©
3X)<u
<uOX)'O3X
oc<uT3CQT3C
3O•c
(DT3
OJOcT3a:
I
cc3C£

Appendix Tables

(as
per
cent
ofG
SDP
)
1989
-0
1990
-1
1991
-2
1992
-3
1993
-4
1994
-5
1995
-6
1996
-7
1997
-8
1998
-9
1999
-0
R 20
00-1
B
120 Sikkim: The People's Vision
— T t o r<\ 0 0 o c o c n— O ' o X q r - T t — o r or -' o d r i ° sC d o T t

1989-90
1990-91
1991-92
1992-93
1993-94
1994-95
1995-96
1996-97
1997-98
1998-99
1999-00
R 2000-01
B
Appendix Tables 121
©©so
f" IT) T f Tt rtso Tt
so
in VO r- rjvo Os ^ri v© ri riSO ^
r-#Tf
h TJ M h» in h it)
m^ . *+ in r-
so fNfN m
mr-inm
os in in x
— oc fNfN r- vcri i/i hso
so os ri ©oc ‘
I-* ©in in sq *-« m
*■« i/im os © r- in
Tt rn © OC f Os
Os Tt—. inoo vd SO
- ^X |S oinso
©oc Tt© ON r- vOOs '-w-ocvO (Nm uocn ©ri CNin TtTt < vCn fN© Ttcn riTt vCTt ocON ONON
rirr Os cn rn O^ fN rirJ fN 00 ri uo vd vd Tt00 Ttcn o^ri o^
QC oo o ON fN vO vO ON Os r- r- cn ON cn ri oc Ttvo S vq (N Os m Tt OC 00 Tt o Tt ri ON uo oo
ri r-’ ri ©r- ON uofN cnCN oc I/O ri Osoo o OO ON ©oo OCri dcn ori
fN O' ON o m fN vO cn 00 oo CN OC r» 00 cn sOOs rj VO r- ON CN © CN r- 00 OS Ov oc n oc r-Os in cn ri __; ri d ri ri Tt oc vd © ri Tt vd dm fN r- m rJ 00 n r ri CN ri
oo uo oc Os oc ON uo r- r- o o SO oc 90 o r-in p Tt — * fN O fN r- cn ON r- Os oc 90 vO uo r-
* fN co © rn o uo o K vd © cn — o OsTt VO fN n r- in n CN
Tt O' ON fN r- o CN cn rj uo Os ON r- in Tt oo o cn TtsO ri ON m r- oc 00 ^t o cn r] — ; ri fN 00 r- r- ^t
ri ri sd © vd rn — uo — oc © Tt — vd O^Tt vo CN CN r- in r^ CN
00 oo o r- I/O ri <N VO r- in ON vO r- vO so Tt ri oo r- oc© in n ON © — n — 1 ri r- Tt cn vq Tt cn ri p p
ri cn vd vd ri cn V-N vd cn ri ri od ri oc ri r- ONin so CN r) fN oc in ri CN
in rj Tt oo ^t r- n cn fN o r- fN uo Os oc ooc so r- m vO o Tt »n p r- vO vC SO uo in Tt Ttsd ri ri _‘ vd vd o< in uo o< vd Tt © Tt sd — vd 00ri in vO in CN CN
in so m Tt (N in Tt oo vo ^O vO © o © Ci sOoc oo uo oc r| fN o Tt oo SO cn Tt oc ON •n U“i Tt Tt — oooc ri vd ri vd ON OC vd —’ d ON od ri Os* ri OC ocm in r- in r^ ri
Os rj o r - o oc 00 fN Tt fN cn cn OC oc Tt O cnfN >/o fN p vq vq OC o r- —1 p r - r^ Os OC r- Tfin ri ri o r-’ ri ri vd vO — — ri uo fH Tt ON
Tt so CN CN fN ON CN ci
© rj uo vO </0 oc ON uo ri oo fN o Tt ri ON Os OC cn 00in in Tt — r- t"; — ri cn Tt uo oo o fN rj uo Ttri Tt rn ON Os UO o I/O sd vd OC vd o in d ri cn riTt m n CN fN oc so ri cn
OC ri ON m VO oc vO r i oo ri cn ri Tt oc in ON OC ooin Os m 00 r - Tt ro r- in cn cn Tt so —; © r- uo vOSO ro —' Tt Tt OO cn vd Tt vd cn oc Tt © d r i sd
^t in CN fN r - vO n cn
fN Os ON Tt © uo ro ON Tt o Tt Tt in o SO t T oo cnSO in OC n r- in vq CM —' OC oo r| cn cn fN sD fN cn r-Os in vd sd rn ON I/O r i vd uo ON ON Tt o in vd r i vdri in n fN — r- 1 in
©
.2* i0J 0>w !»a> o> u u22 x 3 Ac *■*“ Ia o
4>t/3 itS■S 5 ui l l > S cS U ©
0£C£o
T3C3 c/:S <2 ££ c oU £ aEo
£ ^ - 033 Cu
-> C/2 b/ fc *1 cS
— T3 5 C•s wS- o-~ w■8 g ■« c« > Z vc*
CJ zz> ’-5
-C£ oC/3
Cu •03 Q„U 08 U
LLl
.ts-o W<u G3 -2 E T3<u _> aa> u 0 1/3
-Cw a>a ^ wHr! on-Si e w73 .5 "o>> T3 —i=! c 2c iS ^.E « «
* 1 -
•oc3
C<D*H’>u!a.
yVote
: Fo
r 19
96-9
7 on
war
ds,
the
ratio
s co
rres
pond
to
proj
ecte
d G
SDP
at the
rat
e of
14 pe
rcen
t pe
r an
num
.So
urce
: Fi
nanc
e A
ccou
nts,
vario
us
issu
es,
Gov
ernm
ent
of Sik
kim
and
Ann
ual
Fina
ncia
l St
atem
ent
(199
9 an
d 20
00)
and
Cen
tral
Sta
tistic
al O
rgan
isat
ion.
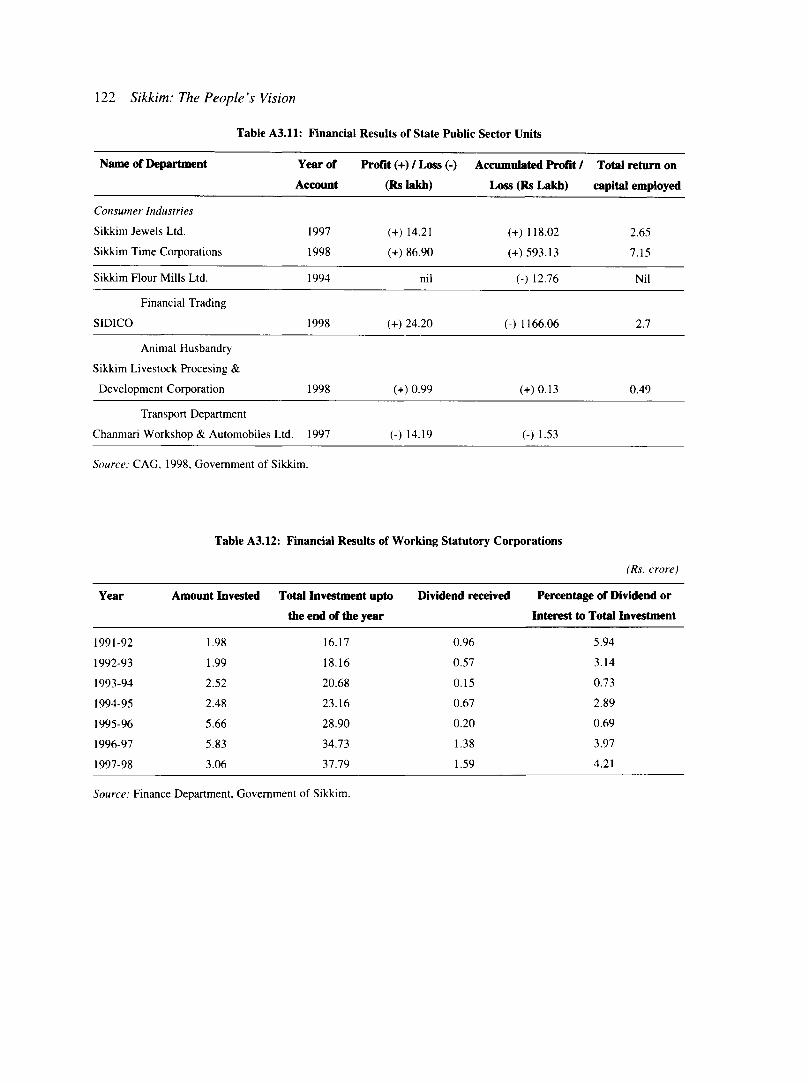
122 Sikkim: The People's Vision
Table A 3.ll: Financial Results of State Public Sector Units
Name of Department Year of
Account
Profit (+) / Loss (-)
(Rs lakh)
Accumulated Profit /
Loss (Rs Lakh)
Total return on
capital employed
Consumer Industries
Sikkim Jewels Ltd. 1997 (+) 14.21 (+) 118.02 2.65
Sikkim Time Corporations 1998 (+) 86.90 (+) 593.13 7.15
Sikkim Flour Mills Ltd. 1994 nil (-) 12.76 Nil
Financial Trading
SIDICO 1998 (+) 24.20 (-) 1166.06 2.7
Animal Husbandry
Sikkim Livestock Procesing &
Development Corporation 1998 (+) 0.99 (+) 0.13 0.49
Transport Department
Chanmari Workshop & Automobiles Ltd. 1997 (-) 14.19 (-) 1.53
Source: CAG, 1998, Government of Sikkim.
Table A3.12: Financial Results of Working Statutory Corporations
(Rs. crore)
Year Amount Invested Total Investment upto
the end of the year
Dividend received Percentage of Dividend or
Interest to Total Investment
1991-92 1.98 16.17 0.96 5.94
1992-93 1.99 18.16 0.57 3.14
1993-94 2.52 20.68 0.15 0.73
1994-95 2.48 23.16 0.67 2.89
1995-96 5.66 28.90 0.20 0.69
1996-97 5.83 34.73 1.38 3.97
1997-98 3.06 37.79 1.59 4.21
Source: Finance Department, Government of Sikkim.

Appendix Tables 123
Table A4.1: Estimated Birth and Death Rates
Year
Birth Rate Death Rate Natural Growth Rate
Sikkim India Sikkim India Sikkim India
1981 31 33.9 8.9 12.5 22.1 21.4
1982 31.6 33.8 9.5 11.9 22.1 21.9
1983 34.5 33.7 10.9 11.9 23.6 21.8
1984 31.7 33.9 10.2 12.6 21.5 21.3
1985 33.1 32.9 10.7 11.8 22.4 21.1
1988 33.8 31.5 10.1 11 23.7 20.5
1989 31.4 30.6 9.1 10.3 22.3 20.3
1990 26.3 30.2 7.3 9.7 19 20.5
1991 22.5 29.5 7.5 9.8 15 19.7
1992 22 29.2 5.8 10.1 16.2 19.1
1993 24.3 28.7 6.9 9.3 17.4 19.4
1994 24.6 28.6 2.9 9.2 21.7 19.4
1995 22.5 28.3 6.9 9 15.6 19.3
1996 20 6.5 13.5
1997 19.8 27.2 6.5 8.9 13.3 18.3
Source: Sample Registration Scheme, Office of the Registrar General.
Table A4.2: Birth, Death and Infant Mortality Rates
States
Crude Birth Rate Crude Death Rate Infant Mortality Rate CPR*
Total Rural Urban Total Rural Urban Total Rural Urban 1998
Arunachal Pradesh 21.4 22.3 12.2 5.8 6.1 2 41 49 17 12.6
Assam 28.2 29 20.7 9.9 10.3 5.9 76 79 37 17.6
Manipur 19.7 20.5 17.6 5.9 5.8 6.2 30 21 28 21.3
Meghalaya 30.2 32.9 16.6 8.8 9.7 4.4 54 56 52 3.9
Mizoram 15 16.4 13.3 4.8 5.7 3.7 19 22 15 38.2
Nagaland - - 7.9 - - 2.7 - - 16 7.9
Sikkim 19.8 20 12.8 6.5 6.6 3.5 51 51 41 20.7
Tripura 18.3 18.9 15.5 6.8 6.9 5.8 51 53 39 25.6
India 27.2 28.9 21.5 8.9 9.6 6.5 71 77 45 45.4
* Couple Protection Rate.
Source: Central Statistical Organisation, 1998.

124 Sikkim: The People s Vision
Table A4.3: Age and Sex Distribution of Population
Age group Males Females Total
No. % No. % No. %
0 — 1 4,418 2.83% 4,384 3.04% 8,802 2.972 — 3 7,539 4.83% 7,451 5.17% 14,990 54 — 5 8,164 5.23% 7,863 5.45% 16,027 5.46 — 14 36,997 23.71% 36.247 25.14% 73,244 24.56
15 — 20 20,145 12.91% 20,154 13.98% 40,299 13.3621 — 25 14,125 9.05 % 15,011 10.41% 29,136 9.5726 — 30 13,694 8.78% 13,253 9.19% 26,947 8.8231 — 35 10,247 6.57% 9,248 6.41% 19,495 6.3836 — 40 10,375 6.65% 8,482 5.88% 18,857 6.2341 — 45 7,006 4.49% 5,262 3.65% 12,268 4.146 — 50 6,265 4.02% 4,897 3.40% 11,162 3.7351 — 60 8,979 5.75% 6,361 4.41% 15,340 5.1961 & over 7,909 5.07% 5,448 3.78% 13,357 4.59Not recorded 165 0.11% 124 0.09% 289 0.1Total 156,028 100.00% 144,185 100.00% 300,213 100
Source: Health Status of Sikkim, 1998, Department of Health and Family Welfare, Government of Sikkim.
Table A4.4: Females’ Age at Marriage
(percent)
Age at Marriage
10-14 15-19 20-24 15-44 60-69 70-79 80+
Arunachal Pradesh 2 2 25.4 77.1 69.9 49.6 42.5 33.5
Assam 1.9 23.4 66.5 87.7 59.2 20.9 12.7
Manipur 1.3 39.4 55.9 65.1 46.7 34.3
Meghalaya 1.4 16.8 62.8 66.6 56.6 43.4 35
Mizoram 0.7 9.6 53.3 59.6 62.6 43.9 27.6
Nagaland 1.3 7.7 36.2 53.4 78 68.7 56.7
Sikkim 1.4 24.4 66.3 67.5 69.5 55.7 42.5Tripura 1.2 24.4 70.1 71.7 49.1 32.3 19.3
India 4.5 35.3 81.8 79.5 52.5 30.7 23.4
Source: Bureau of Economics and Statistics, Government of Sikkim.

Appendix Tables
Table A4.5: Sex Ratio by Age Group
(females per thousand males)
Age Group Sex Ratio
0 — 4 965
5 — 9 1000
1 0 — 14 922
15 — 19 902
20 — 24 911
25 — 29 838
30 — 34 754
35 — 39 727
40 — 44 701
45 — 49 662
50 — 54 655
55 — 59 726
60 — 64 750
65 — 69 721
70 — 74 781
75 — 79 857
80 + 838
Total 878
Source: Population Census.
Table A4.6: Health Statistics
(total numbers)
North East South West Total
Hospitals 1 2 1 1 5
PHCs 3 8 6 7 24
PHSCs 19 48 39 41 147
Beds 80 500 220 120 920
Doctors 12 104 28 21 165
Auxiliary nurses & midwives 42 186 111 97 436
Staff nurses 5 81 8 4 98
In-patients 117 2,786 2,938 3,826 9,667
Out-patients 3903 99,743 79,201 74,561 2,51,408
Population per doctor 3114 2,052 4,212 5,590 2,950
Source: Bureau of Economics and Statistics, Government of Sikkim.

126 Sikkim: The People’s Vision
Table A4.7: Unemployment Rate
(per thousand)
Rural Urban
ST SC Others ST SC Others
Arunachal Pradesh Male 10 0 8 0 0 10Female 2 0 1 0 0 9
Assam Male 31 32 33 44 14 36Female 21 8 14 16 18 34
Meghalaya Male 3 0 3 3 0 15Female 0 0 0 5 0 12
Mizoram Male 10 0 0 2 0 0Female 2 0 0 2 0 0
Nagaland Male 10 0 0 39 0 7Female 0 0 0 1 0 20
Sikkim Male 0 0 4 0 0 9Female 0 0 7 0 0 13
Tripura Male 0 6 10 0 0 40Female 5 5 12 0 13 32
India Male 6 9 12 99 26 24Female 2 3 4 4 10 11
Source: Bureau of Economics and Statistics, Government of Sikkim.
Table A4.8: Occupational Distribution
(per cent)
Occupation North East South West Total
Agricultural labourers 14.95 8.4 5.12 7.29 7.82Livestock, forestry, fish. 3.39 3.28 2.12 1.49Mining & quarrying 0.01 0.44 0.09 0.07 0.22Household industry 1.3 0.92 0.68 0.47 0.77Other manufacturing 1 5.61 2.71 0.89 3.26Construction 12.39 10.61 4.63 2.42 7.09
Trade and commerce 3.06 8.67 3.67 2.14 5.23
Transport, storage, communication 0.92 3.26 1.21 0.5 1.82
Other services 16.74 19.54 8.97 7.32 13.43
Source: Working Group Zonal Planning Team, Assam Agricultural University, 1998.

Appendix Tables 127
Table A5.1: Literacy Rate
Sikkim India
Year Male Female Total Male Female Total
1951 11.19 1.2 6.59 27.16 8.86 18.33
1961 19.5 4.2 12.3 40.4 15.34 28.31
1971 25.37 8.9 17.74 45.95 21.97 34.45
1981 43.85 22.2 34.05 56.5 24.97 43.67
1991 65.7 46.76 56.94 64.13 39.29 52.21
Source: Population Census.
Sikkim India
1993 (Jan-Dee) 67 56
1991 (July-June) 69 57
1994-95 74 58
1995-96 75 59
1996-97 78 62
Source: NSS Sample Surveys.
Table A5.2: Classwise Enrolment
North South East West Total
Pre-primary 2,298 6,895 9,696 6,772 25,661
Class I 1,809 6,999 10,893 6,927 26,628
Class II 1,316 5,064 7,480 4,064 17,924
Class III 1,137 4,444 6,974 3,876 16,431
Class IV 842 3,221 5,835 3,118 13,016
Class V 657 2,921 4,868 2,630 11,076
Class VI 576 2,353 4,909 2,502 10,340
Class VII 397 1,802 3,587 1,801 7,587
Class VIII 445 2,034 3,737 1,970 8,186
Class IX 196 1,038 2,100 766 4,100
Class X 136 677 1,267 635 2,715
Class XI 107 397 1,122 595 2,221
Class XII 103 296 873 316 1,588
Source: Bureau of Economics and Statistics, Government of Sikkim.
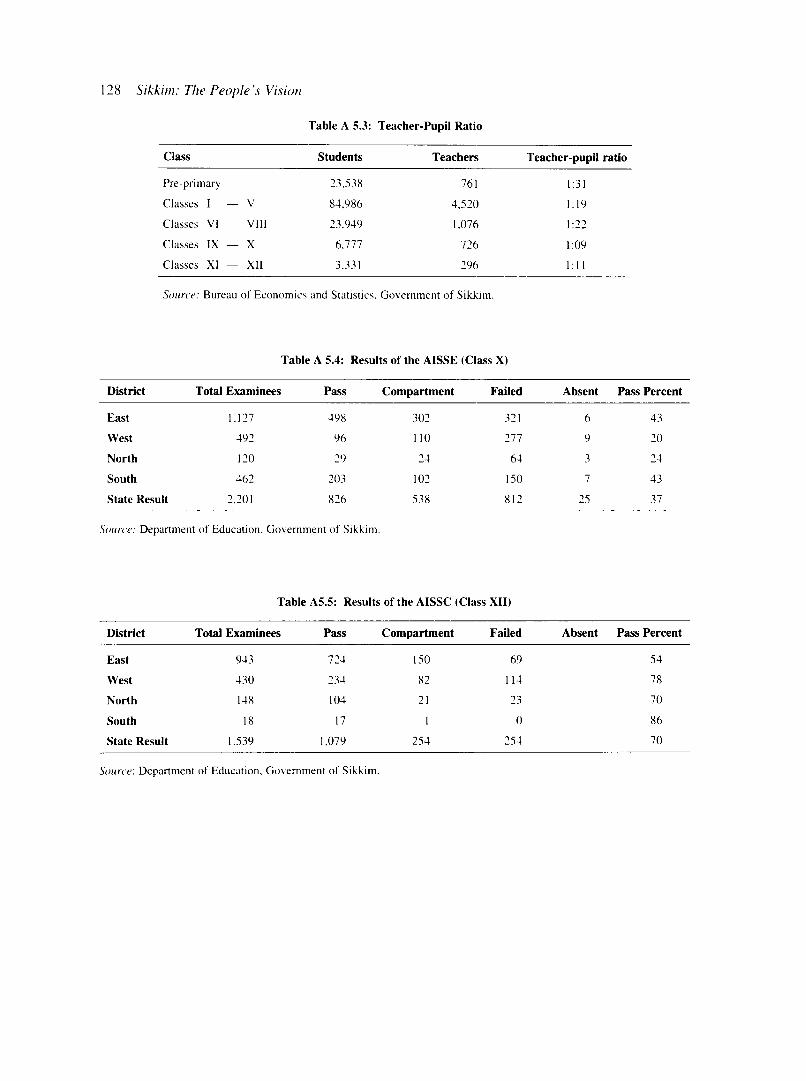
128 Sikkim: The People's Vision
Table A 5.3: Teacher-Pupil Ratio
Class Students Teachers Teacher-pupil ratio
Pre-primary 23,538 761 1:31
Classes I — V 84,986 4,520 1:19
Classes VI — VIII 23.949 1,076 1:22
Classes IX — X 6,777 726 1:09
Classes XI — XII 3.331 296 1:11
Source: Bureau of Economics and Statistics, Government of Sikkim.
Table A 5.4: Results of the AISSE (Class X)
District Total Examinees Pass Compartment Failed Absent Pass Percent
East 1,127 498 302 321 6 43
West 492 96 110 277 9 20
North 120 29 24 64 3 24
South 462 203 102 150 7 43
State Result 2,201 826 538 812 25 37
Source: Department of Education, Government of Sikkim.
Table A5.5: Results of the AISSC (Class XII)
District Total Examinees Pass Compartment Failed Absent Pass Percent
East 943 724 150 69 54
West 430 234 82 114 78
North 148 104 21 23 70
South 18 17 1 0 86
State Result 1.539 1,079 254 254 70
Source: Department of Education, Government of Sikkim.

Appendix Tables 129
Table A5.6: Number of Educational Institutions
Institutions North South East West Total
Senior secondary schools 2 16 18 7 43
Secondary schools 11 24 22 20 77
Upper primary schools 9 38 44 31 122Primary schools 33 100 119 83 335
Lower primary schools 21 48 35 75 179
Pre-primary schools 76 212 235 216 739
Total schools 152 438 473 432 1,495
Degree-level colleges 1 2 3
Teacher training colleges 1 1Sheda, Deorali 1 1Sanskrit mahavidyalaya 1 1Law colleges 1 1Teachers’ training institutes 1 2 3
Sanskrit pathshalas 2 8 2 12Monastic schools 14 12 16 8 50
Madrasa 1 1I.T.Is 1 1
Total colleges 14 14 29 13 70
Source: Bureau of Economics and Statistics, Government of Sikkim.
Table A5.7: Expenditure on Educational Institutions
Sikkim India
in lakh % of Total in lakh % of Total
High/higher school 573 35.05 4,25,710 40.88
Midlle school 346 21.16 249,252 23.94
Primary school 502 30.70 3,09,491 29.72
Pre-primary school 80 4.89 2,292 0.22Vocational - - 19,091 1.83
Others 134 8.20 35,478 3.41
Total direct expenditure 1,635 100.00 10,41,314 100.00Per cent of total expenditure 71.52 97.36
Indirect expenditure 651 28.48 28,209 2.64
Total expenditure 2286 100.00 10,69,523 100.00
Source: Expenditure on Recognised Education Instituions: 1991-92.

130 Sikkim: The People’s Vision
Table A5.8: Human Development Index and Education Components: 1991,1995 and 1998
Literacy Index Enrolment Ratio Index Educational Attainment Index
1991 1995 1998 1991 1995 1998 1991 1995 1998
State 0.569 0.674 0.738 0.436 0.476 0.448 0.525 0.608 0.641
North 0.535 0.657 0.73 0.351 0.382 0.362 0.473 0.565 0.607
East 0.651 0.748 0.806 0.458 0.5 0.47 0.587 0.665 0.694
West 0.456 0.587 0.666 0.423 0.462 0.436 0.445 0.545 0.589
South 0.541 0.638 0.696 0.433 0.472 0.446 0.505 0.583 0.613
Source: Lama, The Sikkim Human Development Report, 2000.
Table A6.1: Land-Use Patterns: 1976-91
(in hectares, percentages in italics)
1976-77 1980-81 1990-91
Land under operational holdings
Net area sown 64,927 78,321 63,254
9.15 11.04 8.91
Area under current fallow 501 4,428 3,906
0.07 0.62 0.55
Other uncultivated area excluding fallow 4,925 4,560 10,830
0.69 0.64 1.53
Fallow, other than current fallow 944 9,474 9,204
0.13 1.34 1.3
Cultivable wasteland 1,153 681 9,807
Area unavailable for cultivation 6,613 11,604 14,300
0.93 1.64 2.02
Total operated area 79,062 1,09,068 1,11,302
Per cent of total geographical area 11.14 15.37 15.69
Permanent pasture and grazing area 1,34,289 72,937 1,25,-997
Area under non-agricultural use 6,612 85,362 14,301
Barren area 2,04,010 1,80,250 1,60,000
Area under miscellaneous trees & groves 417 5,450 NA
Forest area 2,85,210 2,56,533 2,98,000
Total un-operated area 6,30,538 6,00,532 5,98,298
Note: Total geographical area of Sikkim = total operated area + total un-operated area = 7,09,600 ha.
Source: Department of Agriculture, Government of Sikkim.

Appendix Tables 131
(thousand tonnes)
Table A6.2: Foodgrain Output
Crop 1975-76 1980-81 1985-86 1990-91 1995-96 1996-97 1997-98
Rice 10.00 10.63 17.05 22.04 21.68 22.06 21.45
Wheat 0.15 10.30 11.22 13.08 15.30 14.81 14.20
Maize 16.50 28.93 49.25 57.50 56.56 56.63 55.71
Finger-millet 3.20 3.84 4.30 4.62 4.75 4.71 4.73
Barley 0.50 0.46 1.30 1.18 1.57 1.56 1.51
Buckwheat 0.80 1.38 1.38 1.42 1.74 1.61 1.60
Total cereals 31.15 55.54 84.50 99.84 101.60 101.38 99.20
Urd 0.60 2.92 2.90 3.05 3.22 3.30 3.30
Other pulses 0.10 0.20 1.70 2.38 2.70 2.69 2.31
Total foodgrain 31.85 58.66 89.10 105.27 107.52 107.37 104.81
Rapeseed & mustard 0.20 0.90 2.30 2.65 4.38 4.24 4.27
Soyabean 0.50 1.81 3.10 3.02 3.20 3.36 3.29
Other oilseeds - - 0.15 0.04 0.04 0.04 0.04
Total oilseeds 0.7 2.71 5.55 5.71 7.64 7.64 7.6
Orange/citrus fruit 3.60 7.35 12.10 15.45 8.70 9.00
Other fruit 1.10 3.00 6.10 8.05 3.30 3.50
Total fruits 4.70 10.35 18.20 23.50 12.00 12.50
Vegetables 5.00 3.40 23.90 35.00 28.00 30.00
Potatoes 8.00 6.64 26.40 34.97 24.00 27.80 26.00
Large cardamom 2.30 3.50 3.90 3.60 3.60 4.58
Ginger 2.00 3.20 10.90 16.00 29.00 25.00
Rhizomatic crops 0.10 0.20 1.10 3.00 1.60 1.00
Cut flowers (in lakh) - - - - 8.00 12.00 15.00
Miscellaneous 12.40 13.54 42.30 57.57 58.20 58.38
Source: Department of Agriculture, Government of Sikkim.

132 Sikkim: The People’s Vision
Table A6.3: Area Under Different Crops
(thousand hectares)
Crop 1975-6 1980-1 1985-6 1990-1 1995-6 1996-7
Rice 11.4 14.8 15.5 16.05 15.94 15.95
Wheat 0.15 7 7.4 7.82 8.43 8.4
Maize 28.5 30.2 39 39.9 39.93 39.94
Finger-millet 4.8 5 4.8 4.9 5 5
Barley 0.9 0.58 1 0.9 1.08 1.1
Buckwheat 1.5 2.76 2 1.72 2.19 2.06
Total cereals 47.25 60.34 69.7 71.29 72.57 72.46
Urd 1.55 4 3.9 4.01 4.44 4.41
Other pulses 0.15 0.12 1.6 2.12 2.29 2.3
Total pulses 1.7 4.12 5.5 6.13 6.73 6.71
Rapeseed & mustard 0.5 1.7 2.7 3.1 5.84 5.66
Soyabean 1 2.3 3.7 3.62 3.81 4.02
Other oilseeds 0.3 0.07 0.08 0.08
Total oilseeds 1.5 4 6.7 6.79 9.73 9.76
Orange/citrus fruit 1.4 2.62 4.6 6 6.6/3.63 6.8/3.69
Other fruit 1.5 3.08 4.45 5.5 2.6/2.08 2.65/2.2
Total fruits 1.91 5.7 9.05 11.5 9.2/5.1 9.35/5.89
Vegetables 1 0.84 3.8 5.15 5.8 6
Potatoes 2.4 1.9 5 5.36 5.5 5.7
Large cardamom 11.1 14 20.9 22 23.5 23.6
Ginger 0.5 0.64 2.3 3 4.5 4.6
Rhizomatic crops 0.1 0.1 0.42 1.15 1.6 1.6
Flowers 0.35 0.5
Total miscellaneous 13 28.62 31.51
Source: Department of Agriculture, Government of Sikkim.

Appendix Tables 133
Table A6.4: Agricultural Yield: 1975-97
( kilograms/hectare)
Crop 1975-6 1980-1 1985-6 1990-1 1995-6 1996-7
Rice 877.19 718.24 1,100.00 1,373.21 1,372.61 1,378.96Wheat 1,000.00 1,471.43 1,516.22 1,672.63 1,817.60 1,761.90Maize 578.95 957.95 1262.82 1,443.61 1,416.02 1,419.52Finger-millet 666.67 768 895.83 942.86 950 932Barley 555.56 793.1 1,300.00 1,311.11 1,451.48 1,400.00Buckwheat 533.33 500 690 825.58 790.97 776.7Total cereals 659.26 920.45 1,212.34 1,401.88 1,402.60 1,398.07
Urd 387.1 730 743.59 760.6 724.1 748.3Other pulses 666.67 833.33 1,062.50 1,122.64 1,179.04 1,173.91Total pulses 411.76 733.01 836.36 885.81 878.9 894.19
Rapeseed & mustard 400 529.41 851.85 854.84 750.96 752.65Soyabean 500 786.96 837.84 834.25 841.99 820.9Other oilseeds 500 571.43 500 500Total oilseeds 466.67 677.5 828.36 840.94 784.54 778.69
Orange/citrus fruit 2,571.40 2,805.34 2,630.43 2,575.00 2,396 2,439Other fruit 733.33 974.03 1,370.79 1,463.64 1,587 1,590Total fruits 1,620.60 1,815.79 2,011.05 2,043.48 2,102 2,207
Vegetables 5,000 4,047.62 6,289.47 6,796.12 4,482 4,500Potatoes 3,333.33 3,494.74 5,280.00 6,524.25 4,000 4,093Large cardamom 230 250 186.6 163.64 191.48 190.67Ginger 4,000.00 5,000.00 4,739.13 . 5,333.33 5,333.00 5,434Rhizomatic crops 1,000.00 2,000.00 2,619.05 2,608.70 2,625.00 8,812Flowers 3,000 3,333Total miscellaneous 1,477.99 1,827.04
Source: Department of Agriculture, Government of Sikkim

Table A6.5: Veterinary Services
134 Sikkim: The People's Vision
North East South West Total
Veterinary hospitals 3 4 2 3 12
Veterinary dispensaries 4 9 7 5 25
Stockman centres 9 18 15 16 58
Veterinary doctors 5 34 5 7 51
Source: Department of Animal Husbandry and Veterinary Services, Government of Sikkim.
Table A7.1: Registered Industries
(number)
As on 1.3.1997 East North South West Total
Registered 958 120 435 265 1778
Source:Bureau of Economics and Statistics, Government of Sikkim.
Table A7.2: Co-operatives
(number)
As on 31.3.1997 East North South West Total
Milk Producers Co-operative Societies 10 5 9 11 35
c .c .s . 55 10 23 27 115
Number of Milk P.C.S. 30 1 19 35 85
Membership of all Co-operative Societies 9453 1482 8863 9438 29236
Source: Bureau of Economics and Statistics, Government of Sikkim.
Table A7.3: Tourist Traffic
(number)
1995 1996 1997*
Domestic 98556 107169 67225
Foreign 5866 8639 5601
*Till June, 1997.
Source: Bureau of Economics and Statistics, Government of Sikkim.

Tabl
e A8
.1:
Road
St
atist
ics
(the
Spec
ial
Cate
gory
St
ates
)ea
u £5* sI « 5 ■§>3 s £ «
3a &Au 3L*£
O
*s£2*3 1§
H c OSJS& &w §
£ I | 38. I 1 i * Ia * * t £ &
«8>3
$
03
1 1 5 i» a
1 B ^
1 H * i
h &
I I■s ■'I f ST- 3 I
i §es 91 | s §■ «« if 4 |,2 §■s •<1 S '
£ § I i9® Ift.
S' I 8 IfH O ^ m £ i
CO l Tt co 00 in Tt IT) oCO 00 ON CN in r- O n tH o00 o 00 CO 00 o Os O Tf fNCN <N Tf m in m SO Tf ro fN
<N CO Tf (N Tf CO ON 00Tf O Tt in Tf o m ro r-SO in od O n in sd 00 o so soCO (N
SOr-VOTtSOTf
SOTf
OOco
moco
<Nri
o(73C5<
Tt 00 00 SO r - CO IT)ri in ON 00 SOm r^Tt m CO r - Tt CN IT)r - Tt o Tt Tf fNfN
^ Tt<N SO
CN ^ coTt
Tf so^ CN
03J3
£
t"~m
osTt
soo00in
CN
cn
< ffi
3sa03
r-oTt
ONosTf
CN 00 00oOs O00 O
cn soSO <N
in
Tfcncn
ro —h00 ~h‘
FH O fN ^t
rorooo
Onin ooTf
00ri
00 Ttri o00 Tt
rot"*
aUh 03
.1 IC 60c3 <D
T 3 03
I 2 E 1S> E. ~ *c a s£ H c/3 *<
00 00 Tf O n 00 in r- so00 00 in ri CO yml r->‘r- o Os CN CO o so 00CN <N CO CN ro
Tf 00 CN CO Tf »/>OsSO Os
soSO 00
inTt
00in £m Tf OS - m Tf fN
<D6003
X)fic2o
inOnTfOnOS
O_o2<D
SOOSIinOsOs
-T3e
2557303O0C
aQQ
aco

136 Sikkim: The People's Vision
(Km.)
Table A8.2: Road Length
1992-93 1994-95
Nationalised Highway 40.00 40.00
State Highway 225.00 186.00
Major District Road 446.00 464.00
Other District Road 845.00 849.00
Total Roads (State) 1516.00 1727.75
Surfaced 719.00 776.75
Unsurfaced 897.00 911.00
Source: Bureau of Economics and Statistics, Government of Sikkim.
Table A8.3: Operational Performance of the Transport Sector
1993-94 1994-95 1995-96 1996-97 1997-98
Average number of vehicles held 328 328 315 308 307
Average number of vehicles on road 259 214 212 215 222
Fleet utilisation (%) 79 65 67 70 72
Effective Km operated (in lakhs) 84 82 82 82 82
Average effective km. Covered per fleet per day 70 68 71 73 73
Loss per Km (in paise) 634 837 1207 1034 933
Passengers km scheduled (in lakhs) 1108.87 1108.87 1108.87 1108.87 1180.41
Passengers km operated (in lakhs) 451.97 445.62 470.88 517.47 412.58
Occupancy ratio (%) 41 40 42 47 35
Source: Accountant General, Memorandum to the Eleventh Finance Commission.
Table A8.4: Communications
Particulars East North South West
Telephone Exchange (All electronics) 8 3 5 3
Telephone in use 4575 178 909 440
Public Call Office 5 - - 1
Village Panchayat Telephones 36 26 69 64
STD/ISD/PCO 73 1 10 1
PBX 2 - - —
Telegraph Office 1 - - 1
Combined Office 5 - - 1
Source: Bureau of Economics and Statistics, Government of Sikkim.

Table A8.5: Power
Appendix Tables 137
Year Installed Capacity Finn Power Load Peak Load Peak Shortfall
1988-89 21.50 11.30 17.00 5.70
1989-90 21.60 11.40 20.00 8.60
1990-91 21.60 11.40 23.00 11.60
1991-92 21.80 11.65 23.00 11.351992-93 25.80 13.65 23.00 9.351993-94 31.80 16.65 25.00 8.351994-95 33.80 18.65 28.00 9.351995-96 35.80 19.65 30.00 10.351996-97 35.80 19.65 32.00 12.351997-98 38.10 19.95 33.98 14.03
Source: Annual Report 1996-97 & 1997-98, Power Department, Government of Sikkim.
Table A9.1: Banking Indicators
East North South West Total
Number of Branches
Total 21 6 7 8 42Rural 12 6 7 8 33Semi-urban 9 - — _ 9
Number of Loans Accts. (Priority Sector) 8455 1774 4818 4049 19096Number of Loans Accounts per branch (Priority Sector) 403 295 688 506 455Average Population covered per branch 8498 5206 14086 12270 10015Average No. of Villages covered per branch 6 7 18 14 10Total Deposits (31.3.1998) (Rs.in lakh) 22525.43 662.95 2212.86 1536.45 26937.69Average Deposit per Branch (Rs.Lakh) 1072.04 110.49 316.12 192.05 641.37Growth in Deposit
1998 over 1997 9.81 18.78 14.04 16.70 10.731997 over 1996 25.42 26.42 34.35 12.56 25.33
Total Loans Outstanding (31.3.1998) (Rs Lakh) 4869.45 199.75 441.89 394.95 5906.04Percentage increase in Outstanding
1998 over 1997 44.10 30.16 15.91 10.40 38.271997 over 1996 0.01 40.21 30.98 1.82 3.41
Outstanding per accounts (Rs Lakh) 0.57 0.11 0.09 0.10 0.31Outstanding per branch (Rs Lakh) 231.87 33.29 63.12 49.36 140.62Percentage of agricultural advances to total advances 7.30 38.92 28.02 38.96 12.04Credit deposit (CD) Ratio (as on 31.3.1998) 21.60 30.13 20.00 27.00 21.90
Source: Potential Linked Credit Plan: 1999-2000, National Bank for Agriculture and Rural Development, Gangtok, Sikkim.

Tabl
e A
9.2:
St
ate-
wise
C
redi
t D
epos
it R
atio
138 Sikkim: The People's Vision
a!
£
<2
£
£
§
CCs*&<»
ovs
u&
sooe«ccu&3
So
u.8.
c#o
eCQCCh*&3
co
'£Pu&
§
Ic/5u8.
ICA
x - m h h voM rf J J yO 0— cn Tt — <nTt © in
m os — CN inm
in oo oo vq r-; cn cn — o© rnn \ d h o o i n i r i « ' i r i N i/i cn — cn in — cn cn cn in
Tt rn vq (N Tt <N ON oo rn rnd ^ ^ o o i n ^ ^ r i H i / icn — cn in — cn m <s in
\C in Tt —• r-r- cn Tf Tt— Tf sC ------ —as as
cm cn^ oe od so
— r, h - oc n h t M( N < N v d c n i n c n c N o d t ^ ^ O cn cn vo — — ( N c n i - N i n
— vq— Tf Tf <N
r*; vq in cn r-in cn cn tin cn cn cn Tf
fn oo ri os
oo m in <n ocn — Tf
CO*3dtf
CN Os Os Os ^ 00in in oc cn ^— — cn ^ n in
" a. & _CQ c3W f"*oZ < <
1 1C 00ctf <L>2 S
T3C c3___ £ 128 3) §< -S ^•j- s ’c s =S Z H CC
-oc
cctfCQ
OCOsON00OsOsa
•ScaQQ
Occ>
ca3c
§-t*
3SCO
a>-co
tt
a>,c£
Os
a>3CQH
4s cc5 <3 03 °
u01 *2 § a tt
£3 e os tt
cCQttI£
« JXto eu 08 £ tt &
1 33ss eCC 68 tt
CC
as (N m in CN
OCN VO 00 00 <N
T f O O O Tt
as o o o os
cn O —1 O t
in cn in <n t-*
vo oo oo m — m
sz -C^ n 3cd O OPJ Z W So
urce
: Po
tent
ial
Link
ed
Cred
it Pl
an:
1999
-200
0, N
atio
nal
Bank
for
A
gric
ultu
re
and
Rura
l D
evel
opm
ent,
Gan
gtok
, Si
kkim
.

Appendix Tables
Table A9.4: Credit Deposit Ratio
District 1995-96 1996-97 1997-98
East 20.66 16.47 21.6
North 24.79 27.5 30.13
South 20.15 19.64 19.96
West 30.04 27.17 26.51
Total 21.28 17.56 21.90
Source: Potential Linked Credit Plan: 1999-2000, National Bank for Agriculture and Rural Development,
Gangtok, Sikkim.
Table A9.5: Recovery Rate: District-wise
District 1995-96 1996-97 1997-98
East 26.17 25.48 29.7
North 25.92 38.59 31.12
South 22.31 35.99 34.00
West 37.5 50.45 35.14
Total 27.01 32.5 33.50
Source: Potential Linked Credit Plan: 1999-2000, National Bank for Agriculture and Rural Development,
Gangtok, Sikkim.
Table A9.6: Recovery Rate: Bank wise
Percent recovery
District As on 30.6.97 As on 30.6.98
State Bank of India 26.15 29.1
Central Bank of India 42.77 37.4
U C O Bank 34.4 30.90
Canara Bank 68.13 82.6
Vijaya Bank 96.31 88.30
Bank of Baroda 33.87 48.3Bank of India 95.79 71.1Total 32.52 33.54
Note: Percent of recovery is defined as (collection/demand).
Source: Potential Linked Credit Plan: 1999-2000, National Bank for Agriculture and Rural Development,Gangtok, Sikkim.

In dex
Accountant General, Sikkim 72 Administrative expenses 42 Agricultural Income Tax 65 Agricultural Marketing Act 84 Agriculture 42, 44 Agro-climatic variation 21 Agro-processing 83,93 Airport 38, 92 AISSE results 24 Alcoholism 31, 96Animal husbandry 34-36, 59, 61, 84-85, 93, 96
Animal stock 94 Community role 96-97 Department 35, 71, 85 Extension services 85 Feed, fodder 35, 36, 59, 64, 77, 94 Health services 94 Inputs 85 Marketing 77, 85 Public sector role 84-85 Private sector role 59, 93 Trends 34
Arunachal Pradesh 49, 50 Assam 50
Bagdogra 92, 93Bangladesh Grameen Bank 61, 96 Bay of Bengal 20 Bhutan 93, 94 Birth rate 23Border Roads Organisation 63, 92 Buddhism 21, 86 Budget 51Building rules 80-81 Bureaucracy 41
Capital outlay 45, 47, 53, 54 Capital receipts 52 Cardamom 32, 46, 64, 65, 96 Central Electricity Authority 79 Centrally Sponsored Schemes 70
Chanmari Workshop 72 Chief Pay and Accounts Officer 97 Child mortality rate 29, 87 China 20 Chung Thang 40 Citrus 32, 33, 73-75
Uruguay 74-75 Climate 39 Cold storages 83, 93 Community role 95-97
Animal husbandry 96 Education 95 Health 95 Horticulture 96
Computer training 64 Computerisation 64, 82, 83, 97-98
Checkposts 64, 98 Data collection 6
Concessions 70 Construction, share 43 Co-operatives 36, 64, 71, 95, 96
Milk 96 Producers 61
Corruption 40, 41 Crop yield 33
Daijeeling 39, 73 Death rate 23, 29, 30 Debt
Internal 50Outstanding 48, 49, 50, 54 Servicing 49, 50 to GSDP ratio 58
Decentralisation 41 Delhi 92 Depreciation 69 Development
Strategy 20, 57 Sustainable 20, 57, 58
DistrictsEast 23, 25, 27, 28, 40

Index 141
North 23, 25, 27, 28, 34, 40, 90 South 23, 25, 27, 28, 60 West 23, 25, 27, 28, 60
Downsizing 41 Dropout rate 25, 26
Earthquake 39 Eastern grid 62 Ecological conditions 31 Economic services 47, 48, 51, 54 EDP 82, 83Education 23-28, 60, 89, 94, 87-90
Access to 24, 87 Basic 2, 87 Boarding schools 94 Community role 95 Curriculum 88 Department 62, 89 Institutions 28 Non-formal 95Official language, English 26, 88 Private sector role 94 Public sector role 87-90 Subsidies 26, 68, 89-90 Vocational & Technical 62, 64, 85, 89
Electricity 21Eleventh Finance Commission 48, 51, 52, 56 Employment generation 20, 44 Enrolment 24, 27 Environment 38, 78, 95 Excise duties 70Expenditure management 40, 69, 79, 92 Externally Aided Projects 44
Farming techniques 33Feed, fodder 35, 36, 59, 64, 77, 94Fertiliser 32, 72Fiscal
Deficit 48, 54, 58 Reform 60, 62 Sustainability 63
Fitchell, D.A. and Jasperson, F.Z. 75, 77 Floriculture 22 Forest Department 85
Gadgil Formula 44 Gangtok 27, 38Gangtok Municipal Corporation 38 Gender Development Index 27, 28, 57 Gender disparities 27, 28, 57, 88, 89 Ginger 32, 46, 64, 65, 96
Global markets 21 Governance 40, 41 Government
Employment 70, 81 Expenditure 41, 58, 69-70 Wages and salaries 70
Grants 44, 50, 54, 56 Non-plan 45 Plan 45, 51
Gross State Domestic Product 42, 43 Gross State Domestic Product, sectoral shares 41 Ground rent 65 Growth 42
“Jobless” 44 Sectoral 42-44, 83
Gyatso and Bagdass 27, 28
Haq and Haq 28 Health 28, 29-31, 87, 90-91, 94
Administrative expenses 31, 91 Community healthworkers 96 Community role 95-96 Delivery of services 91 Indigenous remedies 96 Prevention 90 Primary 31, 90 Private sector role 94 Public sector role 90-91 Secondary 90 Tertiary 91
Highway, National 27 Highway, National 31A 39, 60, 63, 79, 92 Himachal Pradesh 86, 93Horticulture 22, 31, 33, 59, 61, 64, 72-75, 83-84, 96
Boards 84Community role 96-97 Extension services 61, 83 Horticulture Department 84 Inputs 72, 84, 93 Marketing 34, 84, 93 Nurseries, commercial 84 Private sector role 93 Production 33 Public sector role 83-84 Technology in 59 Trends 31-32
Human Development Index 27, 23, 57 Human Development Report 23, 24, 28, 57 Hydroelectric potential / projects 21
Incentives 26

142 Sikkim: The People’s Vision
Income Tax Act 67 Indian Companies Act 36 Indo-Gangetic plain 20 Indo-Swiss Project 84 Industrial Disputes Act 36 Industrial policy 62, 77, 85 Industry 36-37, 59, 77-78, 85-86
Private sector role 94 Public sector role 85-86 Share 42
Infant mortality 23, 27 Information Technology 61, 97-98
Industries 85 Secondary Schools 98
Infrastructure 91 Education 24 Road 38, 39
Institute of Cost and Management Studies and Research 71Interest rates 69Interest receipts 47, 51International Finance Corporation 74International Food Policy Research Institute 35International Livestock Research Institute 35Internet 61Irrigation 32
Kanchenjunga 21 Karfectar 94 Karma Kargyupa 21 Kerala 86 Kolkata 34, 38, 92
Lama, Mahendra P. 23, 27, 57 Land revenue 46, 65 Land tax 65, 70 Language, official 26, 88 Legal framework 41 Liberalisation 42 Literacy 23, 57 Livestock 35, 36 Loans from centre 44, 50, 52
to departments and institutions 67-68 Lotteries 46
Madhya Pradesh 65, 66 Majhitar 93 Makaibari 73 Mangan 79Manipal Medical College 91, 94 Manipur 50 Marketing channel 33
Marketing infrastructure 33, 34 Maternal mortality rate 30 Milk 35, 96, 97 Mining and quarrying 43 Mizoram 49,50 Mono-cropping 32 Motor vehicles Act 6 Motor vehicles tax 66 Multiplier 45, 58
Nagaland 50, 58 Namchi 39Namgyal Institute of Technology 21 Nathu la 20,78 Nayabazar 39 Nepal 94Non-plan expenditure 70 Non-tax 46, 47, 48, 50, 51, 53, 54, 70
Collection 65-67 North-East Council 44 Net State Domestic Product 49
Orchards 33 Orissa 65, 66
Pay Commission 47, 52, 58, 70 Pelling 79Per capita income 49,5 Plan outlay 50 Plan schemes 41 Planning Commission 42, 52 Population 20, 27 Population, urban 39 Poultry 35, 59
Tanzania 76-77 Poverty 42 Poverty line 20Power 37, 60, 62, 63, 64, 68, 72, 79-80, 86
Department 72 Hydroelectric potential 21 Hydroelectric projects 21 Power Trading Corporation 21 Private sector role 94 Public sector role 86 Tariffs 37, 63, 74 Transmission links 37, 60, 80, 86
Primary deficit 48, 49, 54 Primary Health Centres 30, 40, 42, 91 Primary Health Sub-Centres 31, 42 Private sector 93-94
Animal husbandry 93

Index 143
Education 94 Health 94 Horticulture 93 Industry 94 Power 94 Tourism 94
Profits and dividends 47 Public administration 43, 44 Public sector 81-93
Animal husbandry 84-85 Education 87-90 Health 90-91 Horticulture 83-84 Industry 85-86 Infrastructure 91-92 Power 86 Roads 92-93 Tourism 86
Public sector enterprises 36, 71-72 Privatisation 77
Punjab 93
Rajasthan 70Rangit 21, 38Raw materials 61Regional disparities 27Registration of Companies Act, Sikkim 36Revenue
Deficit 48, 54 Expenditure 45, 54, 56 Non-plan 56 Receipts 46-47
Roads 39, 60, 80, 92-93 Public sector role 92-93 Toll roads 79
Rumtek monastery 21
Sales Tax Ordinance 66 Sanitation 39School government 23, 40 School number 28 Seismic zone 39 Semi-tropical 21 Sen, Tapas 66 Services 44
Share 42 Sex ratio 30 Sikkim Flour Mills 72Sikkim Industrial Development and Investment Corporation
37,71Sikkim Jewels Limited 72
Sikkim Milk Union 36, 71Sikkim Mining Corporation 71Sikkim Nationalised Transport 71Sikkim Power Development Corporation 37, 72, 86Sikkim State Income Tax Manual 67Sikkim Time Corporation 36, 72Sikkim Tourism Development Corporation 62, 86Siliguri 27, 38Singla 39Singtam 39,73,74Social services 47, 51, 53, 54Special Area Programmes 44Special Category States 44, 49, 50, 56Srivastava and Sen 69Stamp duty 65, 66Stamps and registration fees 46State Bank of Sikkim 71, 83State Electricity Regulatory Commission 37, 63, 86State Finance Commission 41State Institute of Rural Development 97State sales tax 46, 66State Sales Tax Act 67Subsidies 67, 68, 89
Education 26, 68, 89-90 Explicit 71, 68-69 Implicit 68, 69 Recovery rate 68-69
Subsidised rate 34
Tariff policy 21 Tax
Administration 60, 66 Agricultural income 65 Buoyancy 46, 51 Central sales 46Central taxes, share 46, 48, 50, 51, 67 Collection 65-67 Vehicles 46, 66State’s own 46, 48, 50, 53, 54, 70 Urban land 65
Tea 34, 46, 73 Organic 73
Teacher-pupil ratio 26, 88 Teachers 25-26, 88, 94
Training 25, 26, 88, 94 Technology 20, 58-59, 97 Teesta river 21,58, 79 Telecommunications 22, 78 Temi Tea Estate 34 Temperate 21 Temperate forests 38

144 Sikkim: The People's Vision
Tendering, competitive 82 Tibet 20, 78Tourism 21, 22, 35, 38, 60, 62, 68, 78-79, 86
Hotels 79Private sector role 94 Public sector role 86
Trade license fees 39 Training-in-service 26 Transfers 45 Transport 34, 68, 93
Airline 93 Public 92
Transport, share 43 Tripura 50 Tuberculosis 31, 90
Urban development 38, 80UNICEF 90User charges 67, 81
Venketeshwara Hatcheries 77 Veterinary services 71 “Voice” 61
Water supply 39West Bengal 27, 66West Bengal State Electricity Board 37Wholesale markets 34