ashish project
DESCRIPTION
marketing research and concept testingTRANSCRIPT
A
PROJECT REPORT
ON
“Market Research and Concept Testing”
Submitted In Partial Fulfillment of Requirement for the Award of the Degree
„Masters of Business Administration‟
SAVITRIBAI PHULE PUNE UNIVERSITY
Submitted by Ashish RajendraShitole
Under the Guidance of Mr. Chaitanya Gosawi
MBA- 2013-15
Anandwali, Nandanwan hills, Chandsi
NASIK

DECLARATION
I hereby declare that the project work entitled “Market Research and Concept
Testing ” to “Universal College of Management” is a record of an original work done
by me under the guidance of “Mr.ChaitanyaGosavi” and this project work is submitted
in partial fulfillment of the requirement for the award of the degree of “Masters of
Business Administration” (MBA). The information submitted is true and original to the
best of my knowledge.
Date : Ashish RajendraShitole
Place:

ACKNOWLEDGEMENT
Every Project is always incomplete without proper assistance and guidance.
Hence, I would like to thank and express my gratitude to all those people who have
helped me in completion of project directly or indirectly.
With great pleasure and privilege, I present this report on “Market Research and
Concept Testing‟‟ which I underwent at “UNIVERSAL COLLEGE OF
MANAGEMENT.”
Firstly, I would like to thank and express my gratitude to my project guide Mr.
C.A. Gosavi , for guiding me throughout my entire project.
Also, my special thanks to:-
Mrs. Vishakha Waiker
For their kind cooperation, providing me useful information and guidance, without which
I would have not been able to complete the project work successfully.
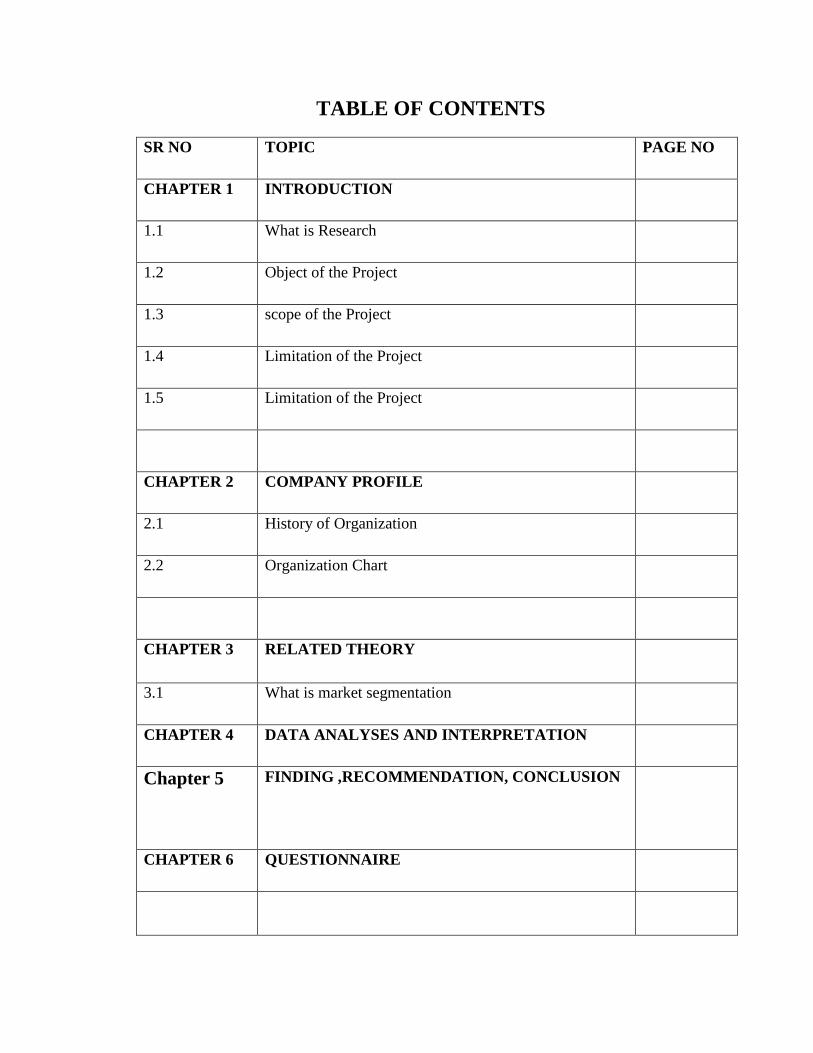
TABLE OF CONTENTS
SR NO TOPIC PAGE NO
CHAPTER 1 INTRODUCTION
1.1 What is Research
1.2 Object of the Project
1.3 scope of the Project
1.4 Limitation of the Project
1.5 Limitation of the Project
CHAPTER 2 COMPANY PROFILE
2.1 History of Organization
2.2 Organization Chart
CHAPTER 3 RELATED THEORY
3.1 What is market segmentation
CHAPTER 4 DATA ANALYSES AND INTERPRETATION
Chapter 5 FINDING ,RECOMMENDATION, CONCLUSION
CHAPTER 6 QUESTIONNAIRE

CHAPTER .1
INTRODUCTION
CHAPTER 1: INTRODUCTION
1.1 INTRODUCTION
1) Power saver
In todays day to day life the electricity that comes to our homes, Shop & company is not
stable in nature. There are many fluctuations, ups and downs, and surges in this current.
This unstable current cannot be used by any of the household appliances. Moreover, the
fluctuating current wastes the electric current from the circuit by converting electrical
energy into heat energy. This heat energy not only gets wasted to the atmosphere, but
also harms the appliances and wiring circuit.
A House hold power saving device is generally used in residential homes to save energy
and to reduce electricity bills. Electricity fluctuation is a common phenomenon in every
household, and the power savers work on reducing this current fluctuation and increasing
the energy efficiency.
There are several types of power saving devices available in the market today. These
household power saving devices have recently received a lot of attention from both
consumers and manufacturers. The power saver is a small device which is to be plugged
in any of the AC sockets in the house. Moreover, some of the companies claim that their
power savers save up to 40% of the energy. So how true are these claims? Let’s learn
more about household power saving devices by understanding how they work.
How does the power saver works
Power savers work on the principle of surge protection technology. Power savers work on
straightening this unstable electric current to provide a smooth and constant output. The
fluctuation in voltage is unpredictable and cannot be controlled. However, the power
savers utilize current fluctuation to provide a usable power by acting like a filter and
allowing only smooth current to pass through the circuit. Power savers use capacitors for

this purpose. When there is a surge of current in the circuit, the capacitor of the power
saver stores the excess current and releases it when there is a sudden drop. Thus only
smooth output current comes out of the device.
Moreover, a power saver also removes any type of carbon in the system, which facilitates
further smoother flow. The main advantage of power savers is not that they provide a
backup system in times of low current, but that it protects the household appliances. It is
known that a sudden rise in the power can destroy the electrical appliance. Thus, the
power saver not only protects the appliance but also increases its life. Moreover, they also
reduce the energy consumption and thus the electricity bills.
The amount of power saved by a power saver depends on the number of appliances on
the circuit. Also, the system takes at least a week to adapt itself fully to the circuit, before
it starts showing its peak performance. The maximum amount of voltage savings will be
seen in areas wherein the current fluctuation is the highest.
IS IT WORTH BUYING A POWER SAVER?
Though household power saver provides several advantages, many people believe that
the claims made by the power saver manufacturing companies are false. Almost all
people who buy power savers do it to reduce their electricity bills. Many people who
have used these power savers said that they could reduce their electricity bills with the
devices; however the reduction was not as much as they had expected. Moreover, they
couldn’t figure out if the reduction in electricity bills was due to the power savers or
because of their efforts to reduce their electrical usage.
With hundreds of power saver products available in the market today, it gets difficult to
assess which is the best for usage. Many of these manufactures provide a 30 days money
return scheme for the unsatisfied customers. It is recommended that people go for such
schemes as it would not risk the money invested. However, experts believe that many
power savers take more than 30 days to get adaptable to the circuit and to show their peak
performance. Thus, it sometimes becomes difficult to choose the right kind of power
saver for your needs.
But there can be ways to check if the power saver is working for you or not. You can ask
an electrician to check the power in the circuit using a wattmeter, before and after the
device is switched on. However, there is no guarantee that there will be power saving
even if the wattmeter shows positive results. This is because power savers don’t work
well with heavy loads such as air conditioners, geysers, heaters etc. Thus, buying a power
saver involves risking money; however it is at least worth to try out the device with the
30 days money back scheme.
2) Voltage Stabilizer
A voltage stabilizer is an electrical appliance used to feed constant voltage current to
electrical gadgets like ACs and computers, and protects them from damage due to voltage
fluctuations. It works on the principle of a transformer, where the input current is
connected to primary windings and output is received from secondary windings. When
there is a drop in incoming voltage, it activates electromagnetic relays which add to more
number of turns in the secondary winding, thus giving higher voltage which compensates
for loss in output voltage. When there is rise in the incoming voltage, the reverse
happens, and, thus, the voltage at the output side remains almost unchanged.
The Voltage stabilizer provides an output voltage with a specified limit for supplying to
load irrespective of wide fluctuation in the input voltage, independentof load power
factor and without introducing harmonic distortion. The voltagestabilizer adjusts
automatically the voltage variation whether high or low to the proper voltage level
necessary for the safe operation of equipments.Excessive voltage fluctuation are hazard
to costly electronic and electrical equipment’s like T.V. sets, VCRs, refrigerators and
other scientific and medical equipment’s etc. Voltage stabilizers are used along with
these equipment to protect them from damage due to wide line voltage fluctuations.
1.2 MARKET DEMOGRAPHICS
1) Stabilizer
The poor power condition in India has created a huge market for voltage regulators.
Particularly in India, the voltage condition is always dismal. So there is huge market for
voltage regulators.
The voltage regulator market is depends upon the quality of electricity supply,
since the quality of power in India has not improved much; voltage regulator still have a
bright future in India. But the market is affected by voltage- stabilizer free appliances and
low-priced UPS market. Nowadays few appliance companies are introducing appliances
featuring voltage-stabilizer free operations, which have given negative growth in a few
segments of voltage stabilizer. The growth of low-priced UPS market has influenced the
sales of voltage regulators in India. Approximately every part of India is facing the
problem of unstable power problem, which has given rise to a wide market for voltage
regulators.
In last five years the growth rate of voltage regulators has come down due to the
low cost UPS which has inbuilt voltage regulators.
1.3 OBJECTIVE OF THE PROJECT
To find out that Power saver and Voltage Stabilizer beneficial Product or not.
To analyses of scenario about power saver product market
To analyses of market potential & Target Market
To find out that what parameter Customer while purchasing the power saver
product and voltage stabilizer
1.4 SCOPE OF THE STUDY
It provides suggestions to the Company to improve their Product efficiency
& quality.
It gives information about the place where the power saver & voltage
stabilizer product is needed.
It gives information about that what should necessary for companies
marketing department & production department.
It gives information about Customer thinking about Power Saver Product &
Voltage stabilizer.
1.5LIMITATION OF THE PROJECT
The data analysis is based on respondent given by domestic customer & industrial
customer
The survey was conducted in selected area in Nasik city.
Responded may be replied with personal bies.
Awareness findings are limited to current time.
The study is carried out for overview of Customer about power saver product and
voltage stabilizer

CHAPTER 2
ORGANISATION PROFILE
CHAPTER 2 : ORGANISATION PROFILE
2.1 Corporate Profile
About Us
Welcome to Jhaveri Labs Jhaveri Labs was founded with the intent to make each and
every one of us to be socially responsible with electricity. Inquire about our POWEReasy
brand of energy savings products.
Electricity & Us:-
Electricity is a critical resource for us. Every single instrument around us, that
demonstrates our progress as humans is supported by electricity.
However, there can be no argument, that our society is rather wasteful of this appreciable
resource.
Jhaveri Labs was founded with the intent to make each and every one of us to be socially
responsible with electricity.

India's Electricity Crisis
An electricity crisis looms in India. For most Indians its a necessity but for many Indians
its a dream; a promise of a better life.
Yes, the scary truth is that electricity is not always available in India.
When available the quality is questionable. Availability and quality has certainly
improved, it is still not at par with developed countries.
Vision
"To ensure every last Indian gets reliable electricity"
Mission
At Jhaveri Labs it is our mission to indigenously develop products that socially and
economically motivate consumers to achieve energy efficiency and environmentally
friendly practices without a change in lifestyles.
We build our products from the ground up, inspired by our philosophy of 'Creative
Engineering' and we hope that when these products reach our end users it is to 'Enrich
lives through Technology'.
About the Founder
Dr. Tejas K. Jhaveri has been an researcher, innovator, and entrepreneur in the U.S. over
a decade. After moving back to India he has founded Jhaveri Labs with an unique vision
to engineer solutions for critical socio-economic problems in India. His technical
expertise covers the areas of optics, electromagnetics, power electronics and
semiconductors. He was co-founder at FabbrixInc (acquired by PDF Solutions),
executive director at DPMPL and has had held positions with PDF Solutions, Photronics
and Texas Instruments. His academic contributions includes a Special Faculty position at
Carnegie Mellon University, the A. G. Milnes award (for the research work that will have
the biggest impact in the the field of electrical and computer engineering). He appears in
Marquis Who is Who in America, Science and Engineering Edition 2011-2012. He has
numerous publications, 2 US patents granted and several others patents in application.
Dr. Jhaveri has a B.S in Microelectronics from Rochester Institute of Technology and
M.S and Ph.D in Electrical and Computer Engineering from Carnegie Mellon University.
Product Design Philosophy
Our in-house R&D team builds products on three core principals
• Transforming revolutionary concepts to practical products: May it be optics,
electromagnetics, robotics or material science we explore the depths of science in search
of novel concepts and convert them into practical products.
• Easy to use: We believe technology should simplify life; not complicate it. Our
products are built with the motto "install and forget". User are welcome to understand the
technology but should not have to.
• Commercially viable: Our products are designed to demonstrate commercial
benefits immediately. A great product is not a necessity, it eliminates necessity. And such
a product cannot be a luxury.
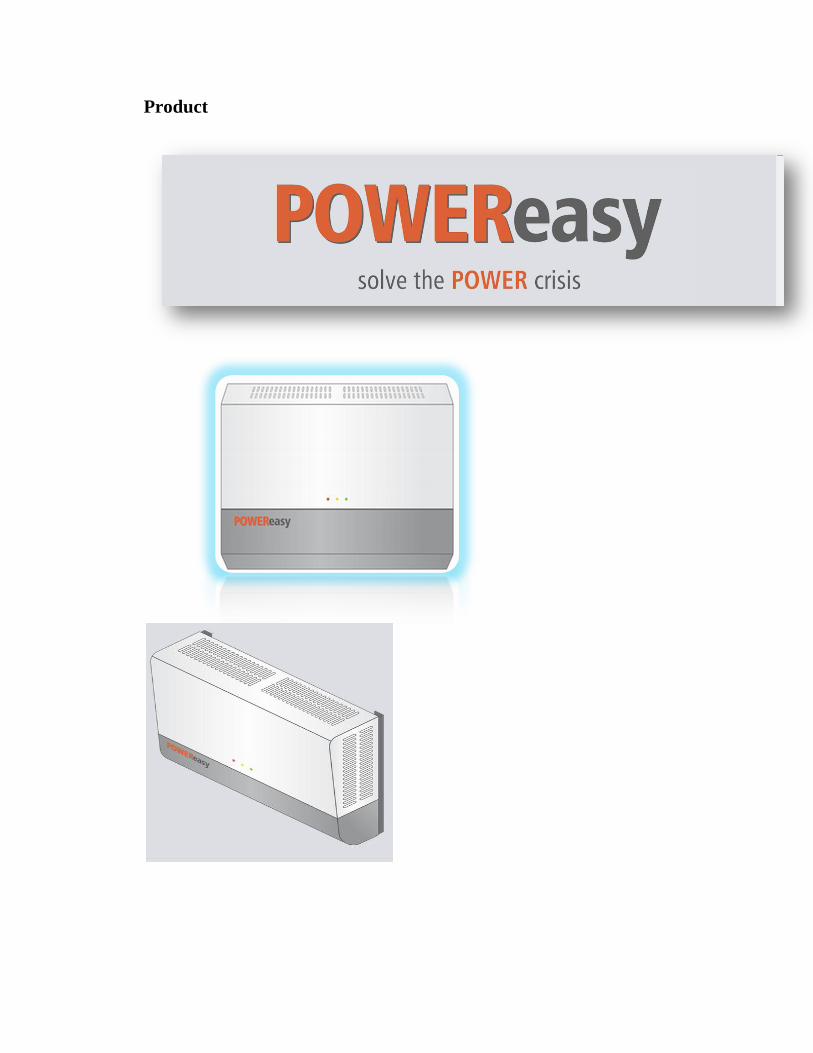
Product
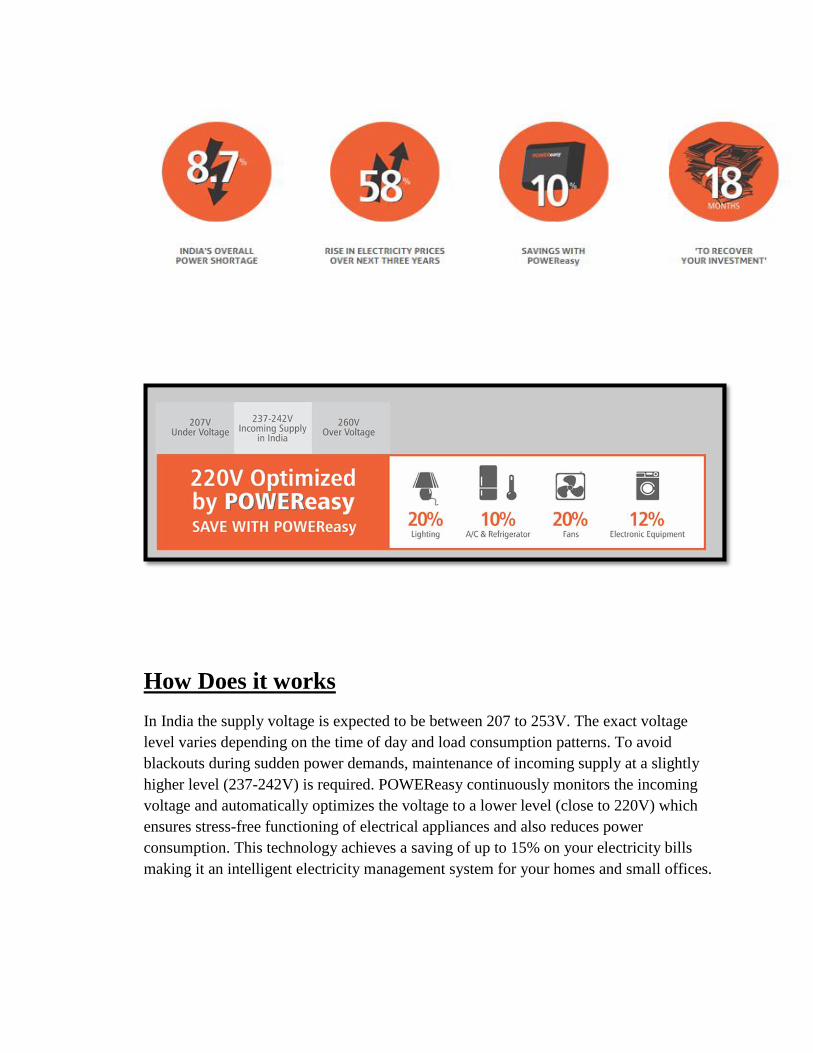
How Does it works
In India the supply voltage is expected to be between 207 to 253V. The exact voltage
level varies depending on the time of day and load consumption patterns. To avoid
blackouts during sudden power demands, maintenance of incoming supply at a slightly
higher level (237-242V) is required. POWEReasy continuously monitors the incoming
voltage and automatically optimizes the voltage to a lower level (close to 220V) which
ensures stress-free functioning of electrical appliances and also reduces power
consumption. This technology achieves a saving of up to 15% on your electricity bills
making it an intelligent electricity management system for your homes and small offices.
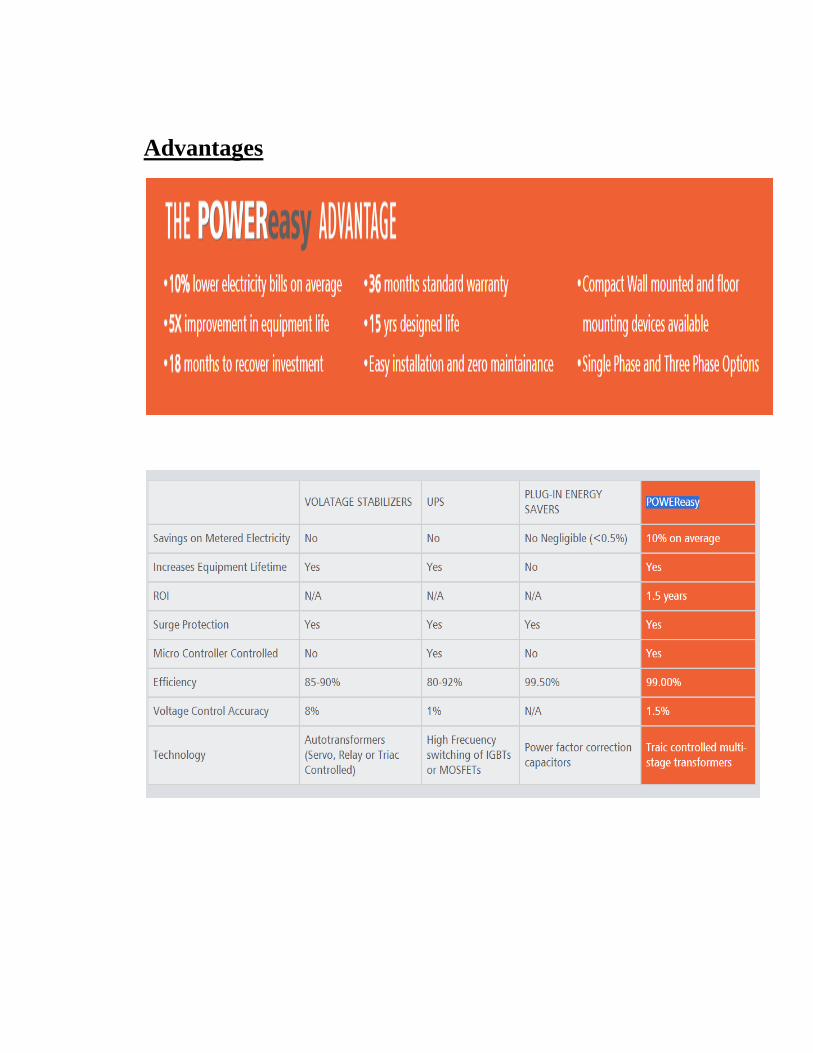
Advantages
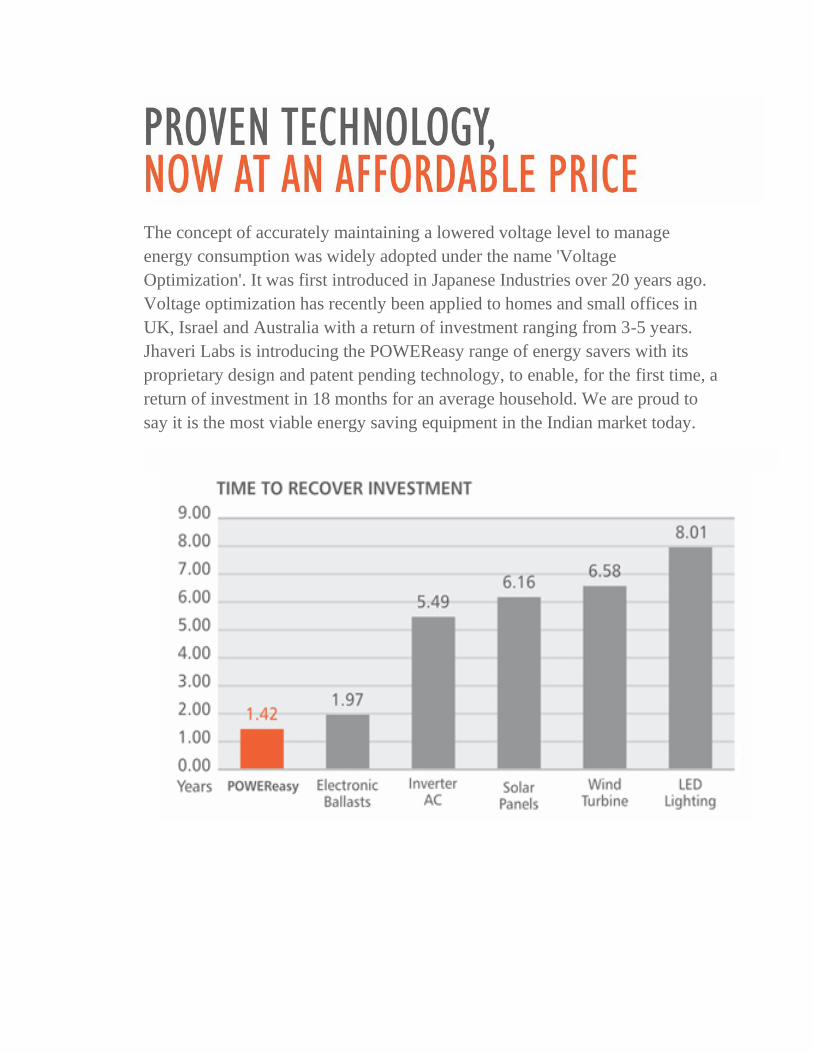
The concept of accurately maintaining a lowered voltage level to manage
energy consumption was widely adopted under the name 'Voltage
Optimization'. It was first introduced in Japanese Industries over 20 years ago.
Voltage optimization has recently been applied to homes and small offices in
UK, Israel and Australia with a return of investment ranging from 3-5 years.
Jhaveri Labs is introducing the POWEReasy range of energy savers with its
proprietary design and patent pending technology, to enable, for the first time, a
return of investment in 18 months for an average household. We are proud to
say it is the most viable energy saving equipment in the Indian market today.
CHAPTER 3
RESEARCH METHODOLOGY
RESEARCH METHODOLOGY
Definition
“Research Methodology “-
‘’ The systematic and objective analysis and recording of controlled
observe may that lead to development of generalization, principles, theories,
resulting in predication and possibly ultimate control of events.’’
Meaning:
Methodology is the method adopted by the researcher for the collection of the data.
The research is conducted with the help of various method of data collection which are
depending on the nature and scope of research work.
There are two sources of data collection that is
Primary data collection
Secondary data collection
Primary data collections are also sub-sources they are as follows
Observation
Interview
Questionnaire
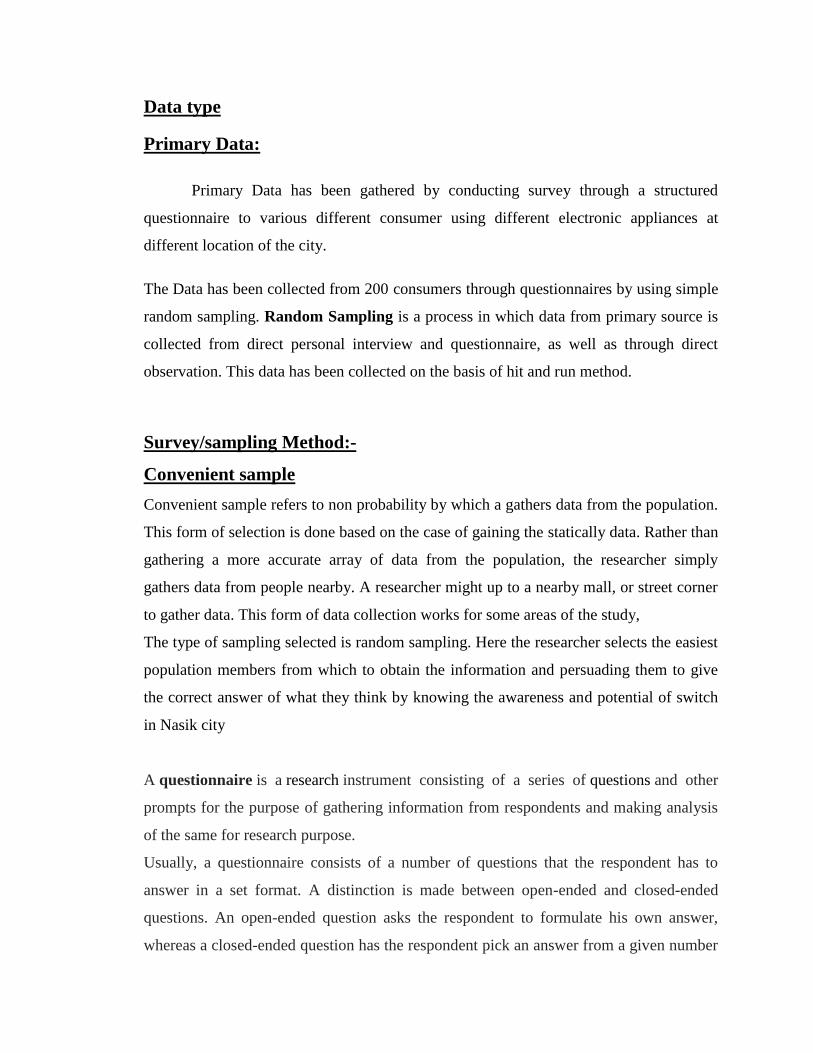
Data type
Primary Data:
Primary Data has been gathered by conducting survey through a structured
questionnaire to various different consumer using different electronic appliances at
different location of the city.
The Data has been collected from 200 consumers through questionnaires by using simple
random sampling. Random Sampling is a process in which data from primary source is
collected from direct personal interview and questionnaire, as well as through direct
observation. This data has been collected on the basis of hit and run method.
Survey/sampling Method:-
Convenient sample
Convenient sample refers to non probability by which a gathers data from the population.
This form of selection is done based on the case of gaining the statically data. Rather than
gathering a more accurate array of data from the population, the researcher simply
gathers data from people nearby. A researcher might up to a nearby mall, or street corner
to gather data. This form of data collection works for some areas of the study,
The type of sampling selected is random sampling. Here the researcher selects the easiest
population members from which to obtain the information and persuading them to give
the correct answer of what they think by knowing the awareness and potential of switch
in Nasik city
A questionnaire is a research instrument consisting of a series of questions and other
prompts for the purpose of gathering information from respondents and making analysis
of the same for research purpose.
Usually, a questionnaire consists of a number of questions that the respondent has to
answer in a set format. A distinction is made between open-ended and closed-ended
questions. An open-ended question asks the respondent to formulate his own answer,
whereas a closed-ended question has the respondent pick an answer from a given number
of options. The response options for a closed-ended question should be exhaustive and
mutually exclusive.
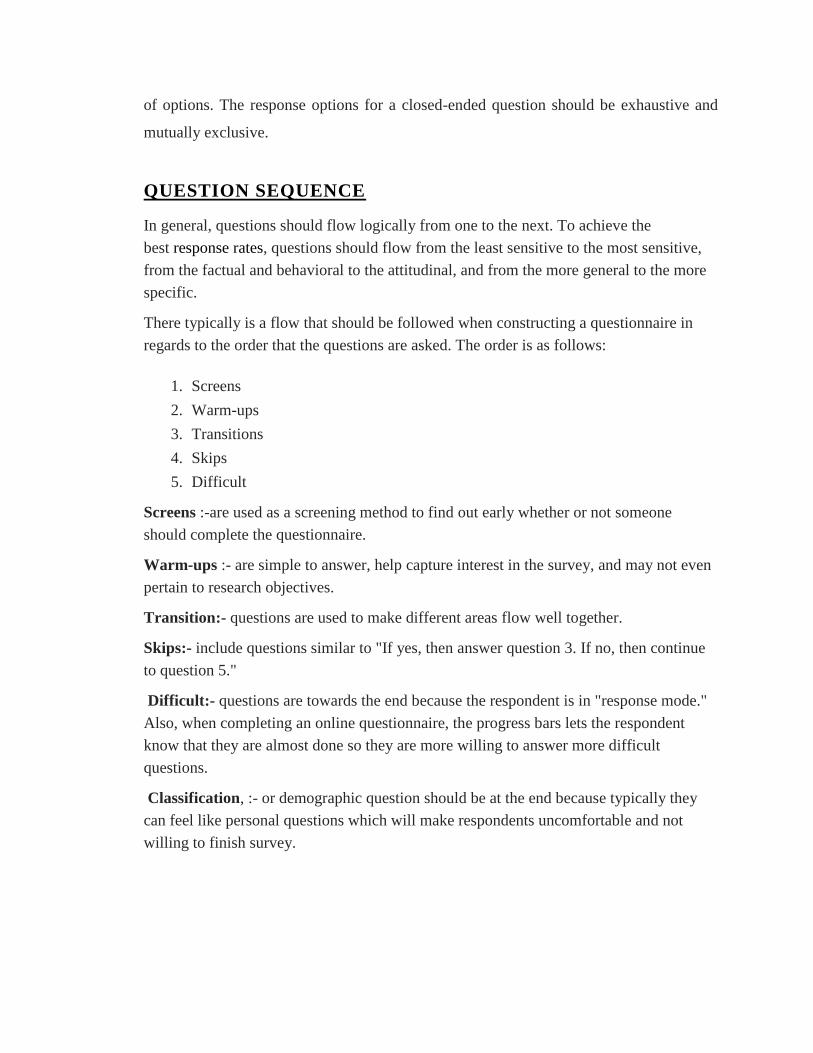
QUESTION SEQUENCE
In general, questions should flow logically from one to the next. To achieve the
best response rates, questions should flow from the least sensitive to the most sensitive,
from the factual and behavioral to the attitudinal, and from the more general to the more
specific.
There typically is a flow that should be followed when constructing a questionnaire in
regards to the order that the questions are asked. The order is as follows:
1. Screens
2. Warm-ups
3. Transitions
4. Skips
5. Difficult
Screens :-are used as a screening method to find out early whether or not someone
should complete the questionnaire.
Warm-ups :- are simple to answer, help capture interest in the survey, and may not even
pertain to research objectives.
Transition:- questions are used to make different areas flow well together.
Skips:- include questions similar to "If yes, then answer question 3. If no, then continue
to question 5."
Difficult:- questions are towards the end because the respondent is in "response mode."
Also, when completing an online questionnaire, the progress bars lets the respondent
know that they are almost done so they are more willing to answer more difficult
questions.
Classification, :- or demographic question should be at the end because typically they
can feel like personal questions which will make respondents uncomfortable and not
willing to finish survey.
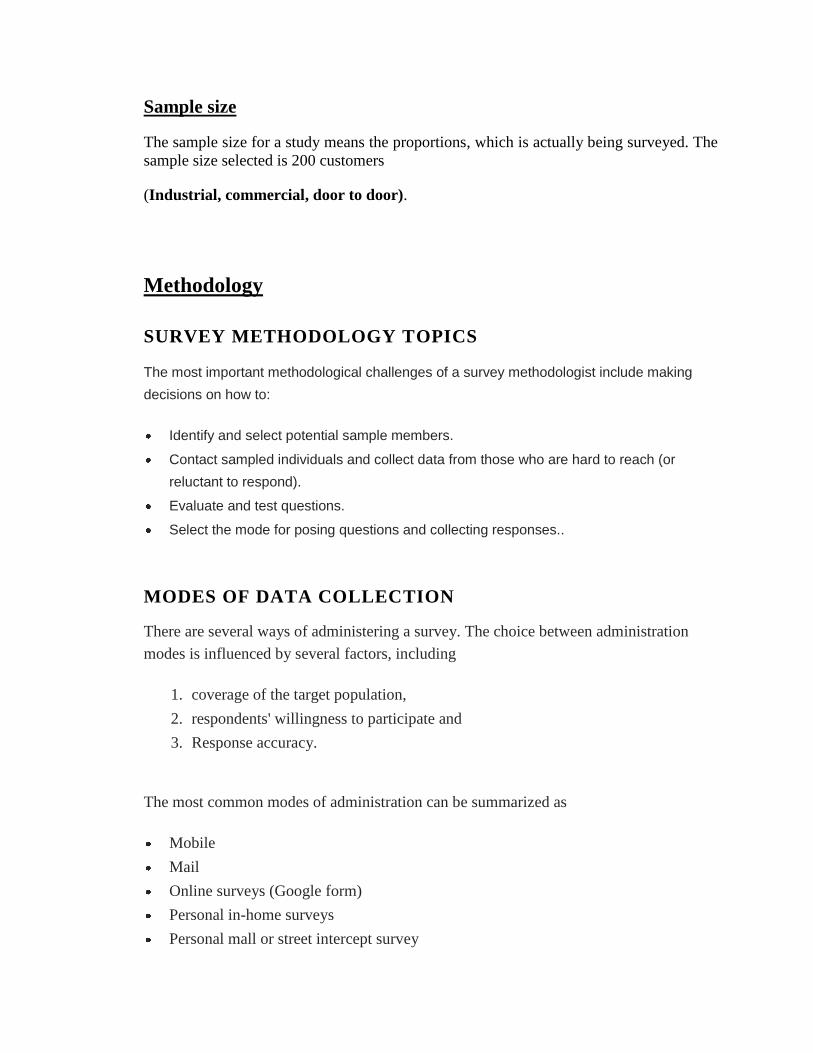
Sample size
The sample size for a study means the proportions, which is actually being surveyed. The
sample size selected is 200 customers
(Industrial, commercial, door to door).
Methodology
SURVEY METHODOLOGY TOPICS
The most important methodological challenges of a survey methodologist include making
decisions on how to:
Identify and select potential sample members.
Contact sampled individuals and collect data from those who are hard to reach (or
reluctant to respond).
Evaluate and test questions.
Select the mode for posing questions and collecting responses..
MODES OF DATA COLLECTION
There are several ways of administering a survey. The choice between administration
modes is influenced by several factors, including
1. coverage of the target population,
2. respondents' willingness to participate and
3. Response accuracy.
The most common modes of administration can be summarized as
Mobile
Online surveys (Google form)
Personal in-home surveys
Personal mall or street intercept survey
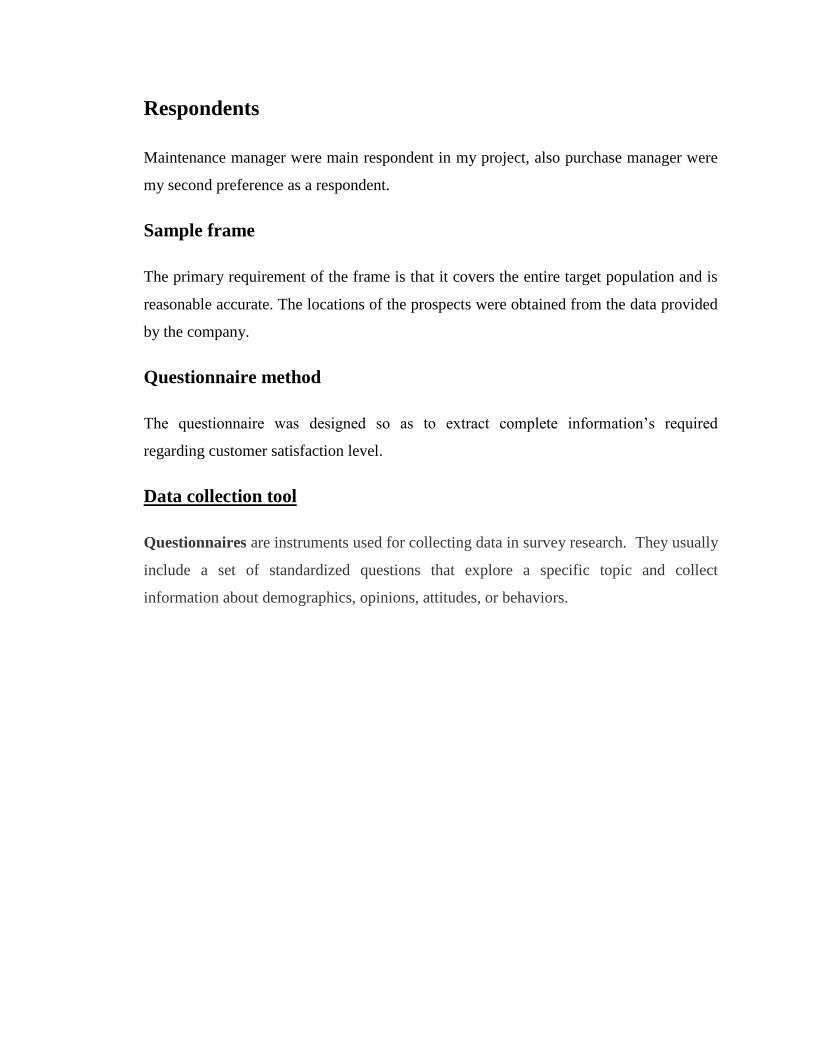
Respondents
Maintenance manager were main respondent in my project, also purchase manager were
my second preference as a respondent.
Sample frame
The primary requirement of the frame is that it covers the entire target population and is
reasonable accurate. The locations of the prospects were obtained from the data provided
by the company.
Questionnaire method
The questionnaire was designed so as to extract complete information’s required
regarding customer satisfaction level.
Data collection tool
Questionnaires are instruments used for collecting data in survey research. They usually
include a set of standardized questions that explore a specific topic and collect
information about demographics, opinions, attitudes, or behaviors.
CHAPTER 4
DATA ANALYSIS &
INTERPRETATION
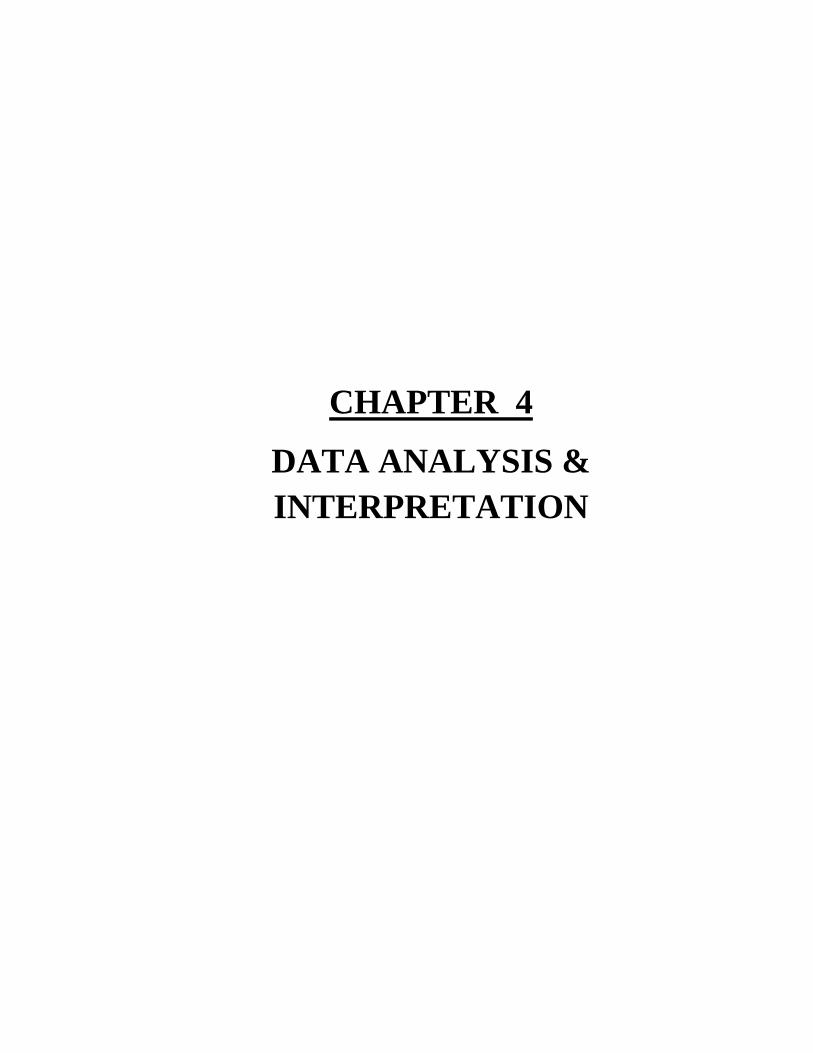
Q.1) Do you want to save Electricity?
Chart
Options Remark
Yes 200
No 0
Graph
0
20
40
60
80
100
120
140
160
180
200
Yes No
Series1 200 0
200
0
Q.1) Do you want to save Electricity?
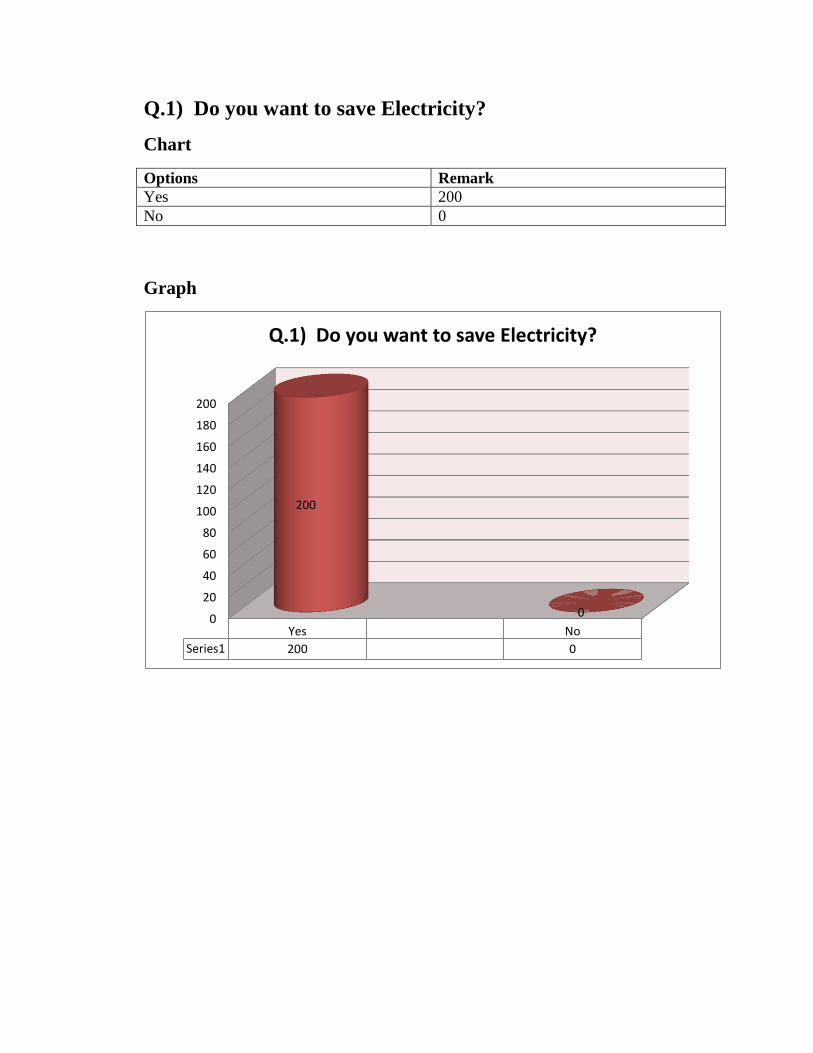
Q.2) Do you want to save Electricity Bill?
Chart
Options Remark
Yes 200
No 0
Graph
0
20
40
60
80
100
120
140
160
180
200
Yes No
Series1 200 0
200
0
Q.2) Do you want to save Electricity Bill?

Q.3) Do you agree that your electricity bill is more than
expectation?
Chart
Options Remark
Yes 200
No 0
Graph
0
20
40
60
80
100
120
140
160
180
Yes No
Series1 174 26
174
26
Q.3) Do you agree that your electricity bill is more than expectation?
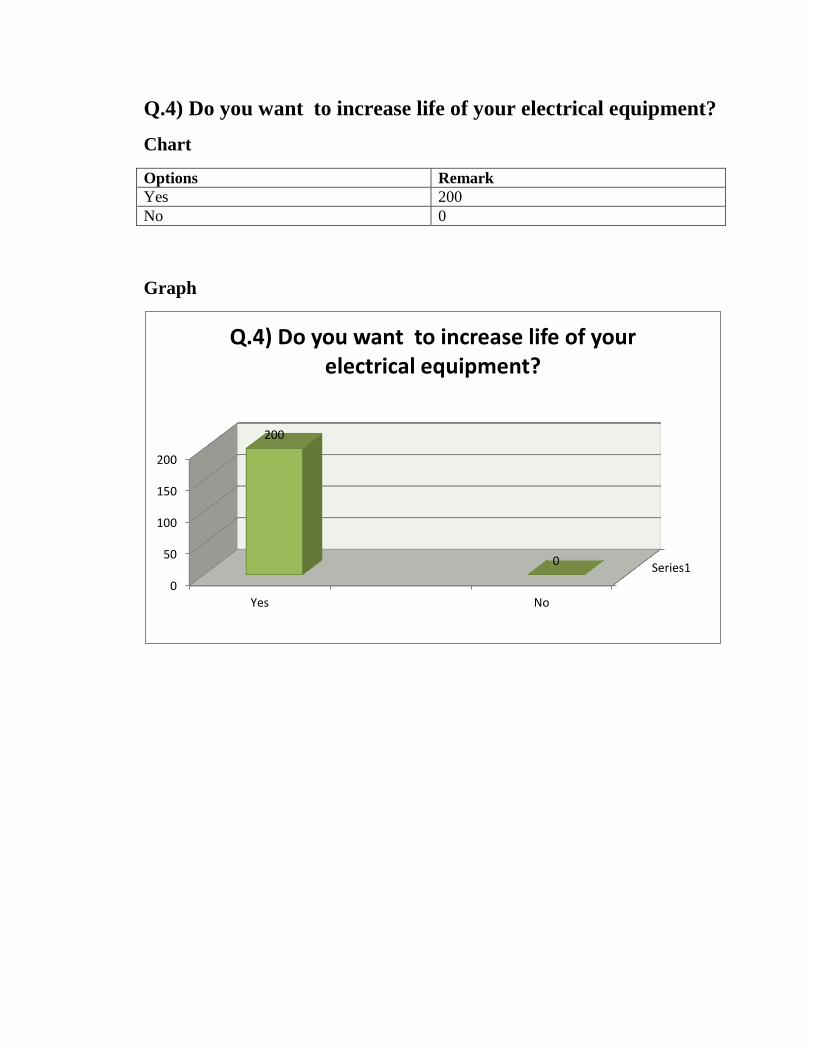
Q.4) Do you want to increase life of your electrical equipment?
Chart
Options Remark
Yes 200
No 0
Graph
Series1
0
50
100
150
200
Yes No
200
0
Q.4) Do you want to increase life of your electrical equipment?
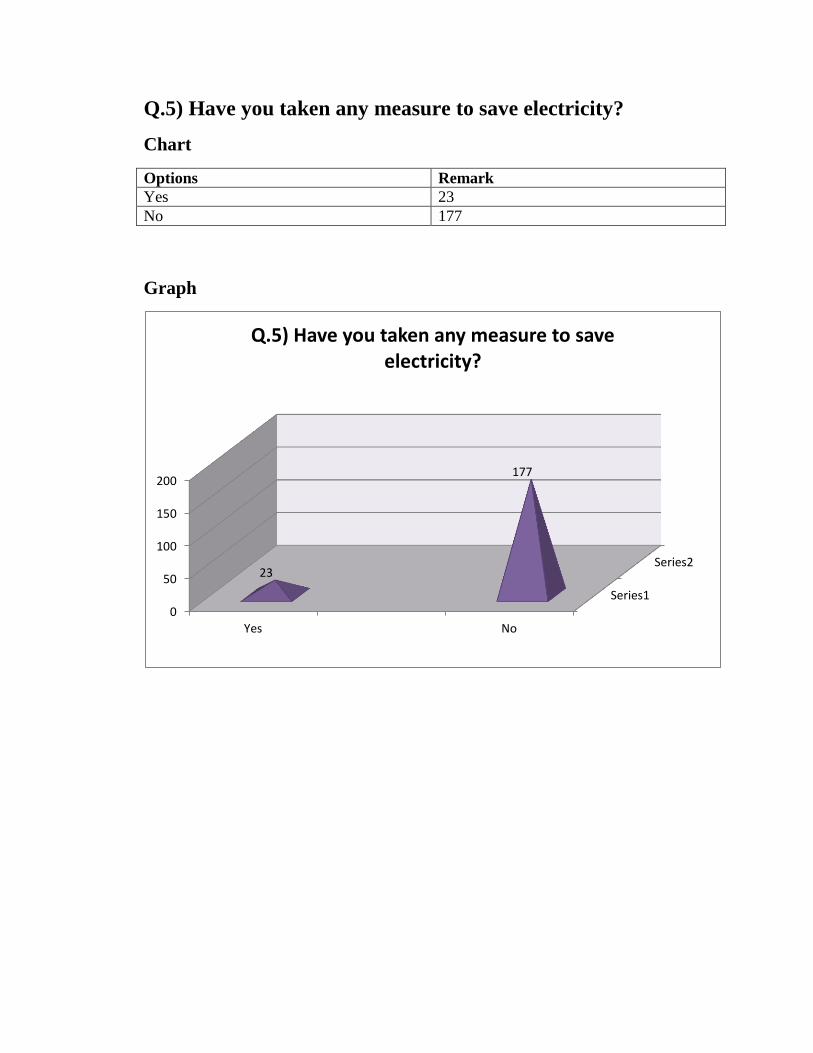
Q.5) Have you taken any measure to save electricity?
Chart
Options Remark
Yes 23
No 177
Graph
Series1
Series2
0
50
100
150
200
Yes No
23
177
Q.5) Have you taken any measure to save electricity?

Q.6) If yes For Q.5) then what?
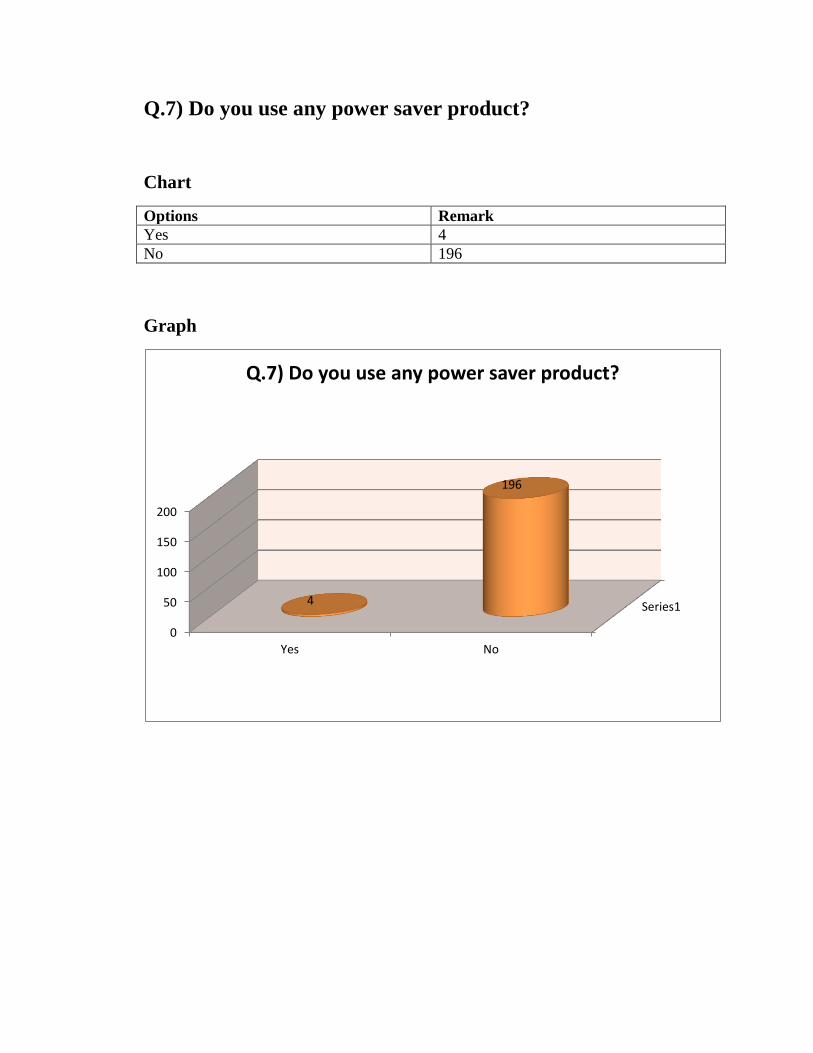
Q.7) Do you use any power saver product?
Chart
Options Remark
Yes 4
No 196
Graph
Series1
0
50
100
150
200
Yes No
4
196
Q.7) Do you use any power saver product?

Q.8) If yes For Q.7) Please specify?
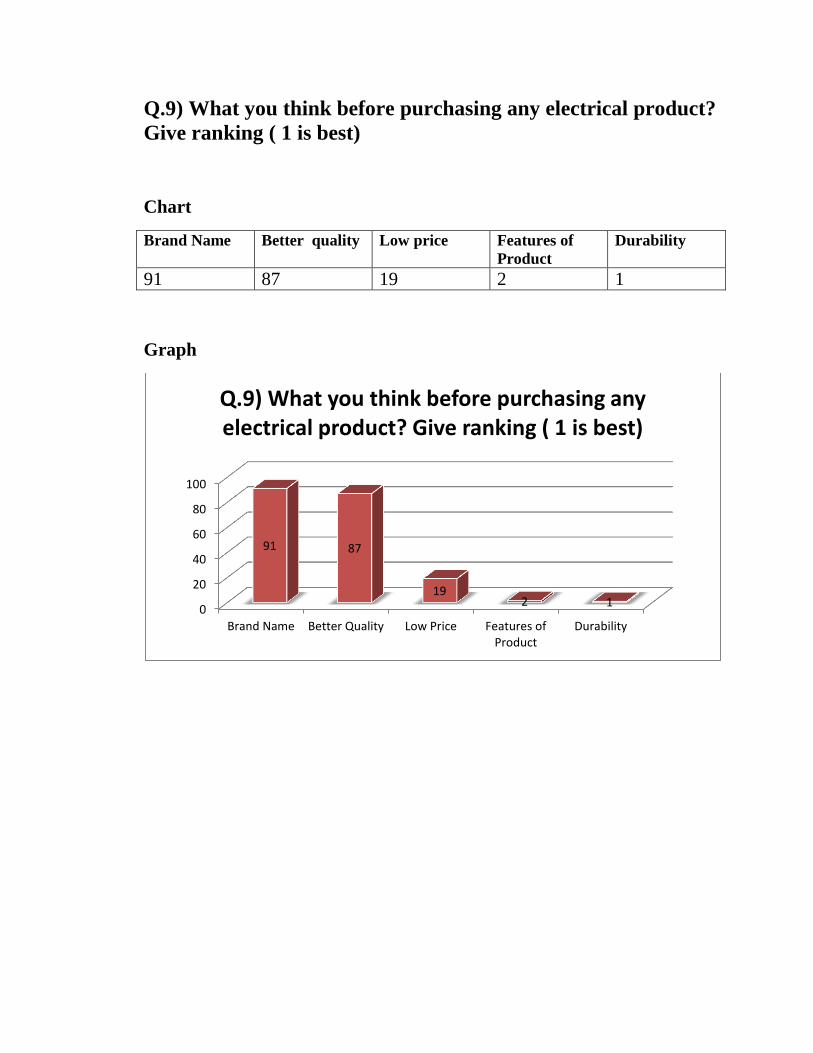
Q.9) What you think before purchasing any electrical product?
Give ranking ( 1 is best)
Chart
Brand Name Better quality Low price Features of
Product
Durability
91 87 19 2 1
Graph
0
20
40
60
80
100
Brand Name Better Quality Low Price Features ofProduct
Durability
91 87
19 2 1
Q.9) What you think before purchasing any electrical product? Give ranking ( 1 is best)
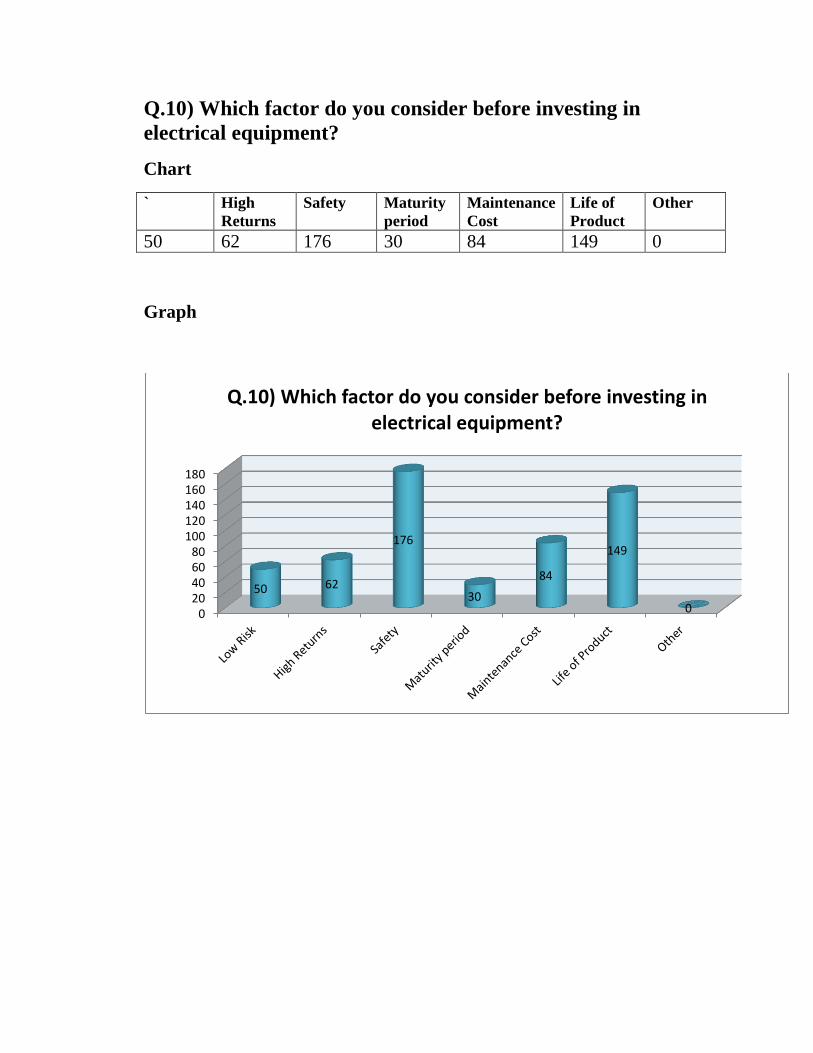
Q.10) Which factor do you consider before investing in
electrical equipment?
Chart
` High
Returns
Safety Maturity
period
Maintenance
Cost
Life of
Product
Other
50 62 176 30 84 149 0
Graph
020406080
100120140160180
50 62
176
30
84
149
0
Q.10) Which factor do you consider before investing in electrical equipment?
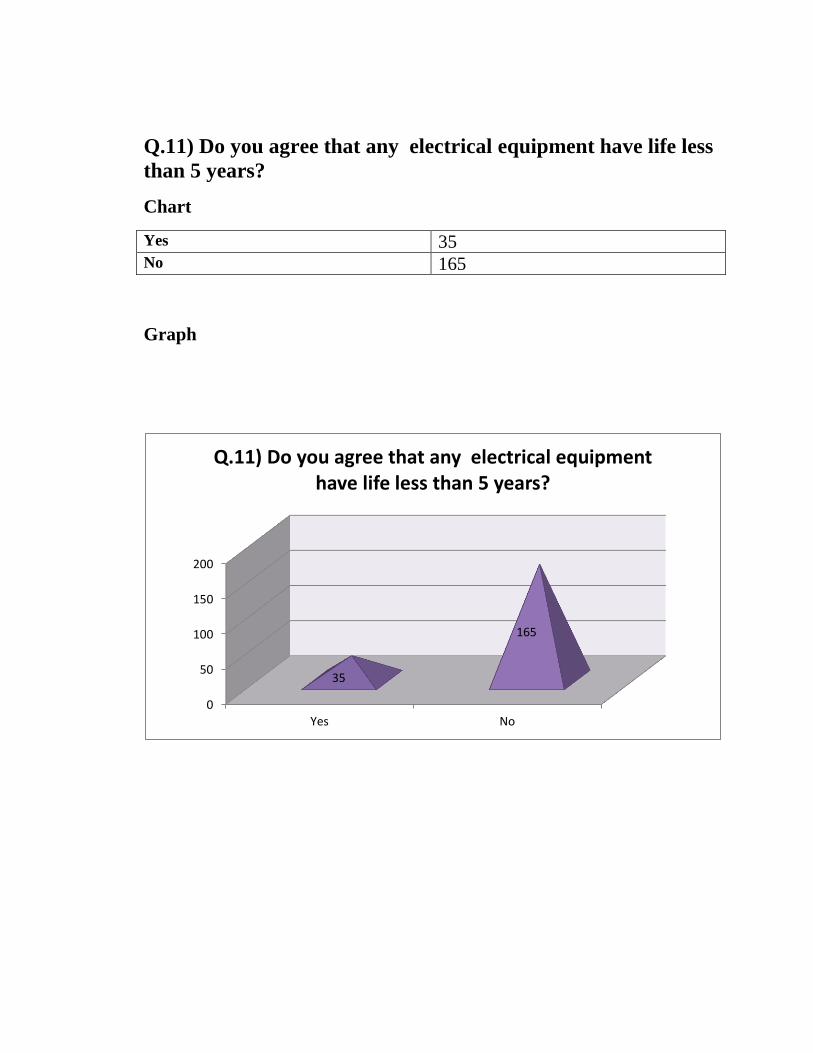
Q.11) Do you agree that any electrical equipment have life less
than 5 years?
Chart
Yes 35 No 165
Graph
0
50
100
150
200
Yes No
35
165
Q.11) Do you agree that any electrical equipment have life less than 5 years?
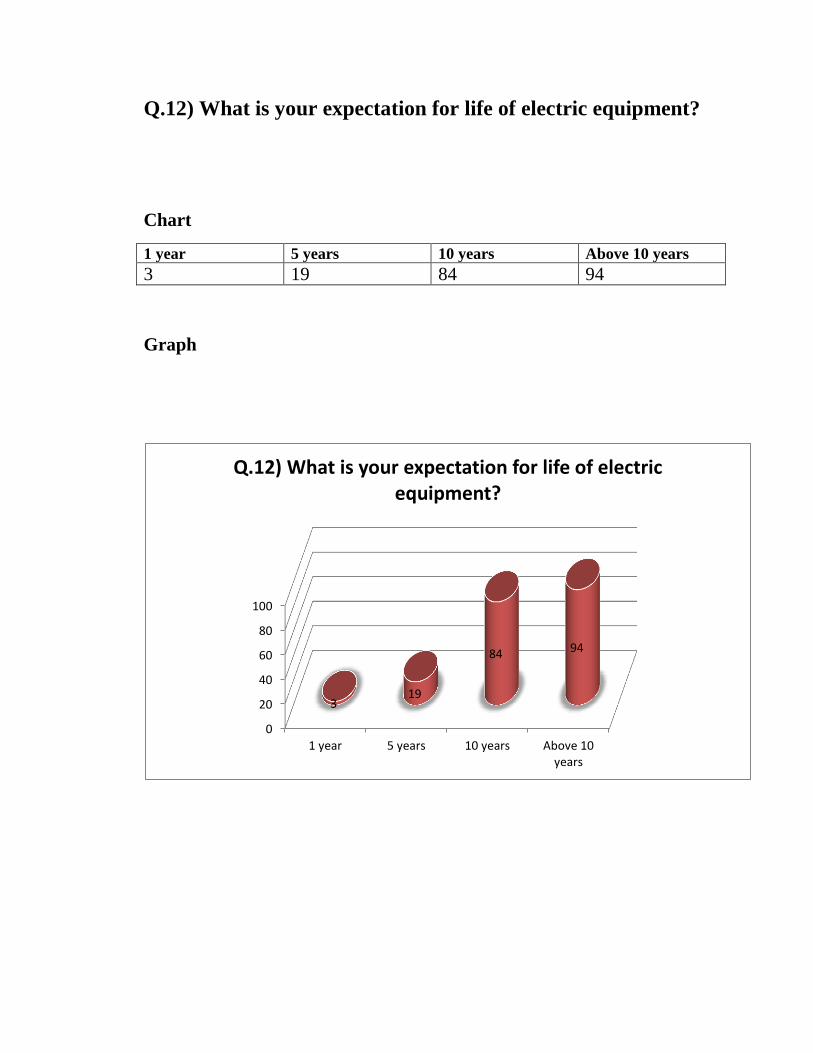
Q.12) What is your expectation for life of electric equipment?
Chart
1 year 5 years 10 years Above 10 years
3 19 84 94
Graph
0
20
40
60
80
100
1 year 5 years 10 years Above 10years
3 19
84 94
Q.12) What is your expectation for life of electric equipment?
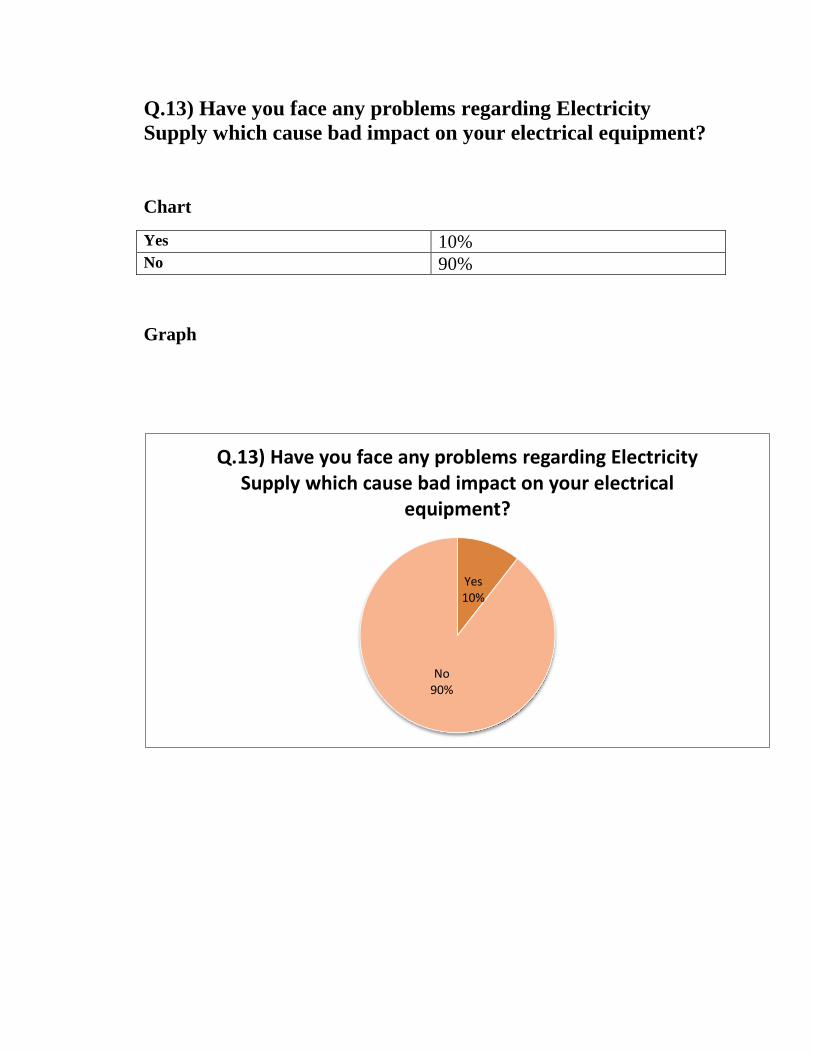
Q.13) Have you face any problems regarding Electricity
Supply which cause bad impact on your electrical equipment?
Chart
Yes 10% No 90%
Graph
Yes 10%
No 90%
Q.13) Have you face any problems regarding Electricity Supply which cause bad impact on your electrical
equipment?

Q.14) If yes for Q.13) Please specify.
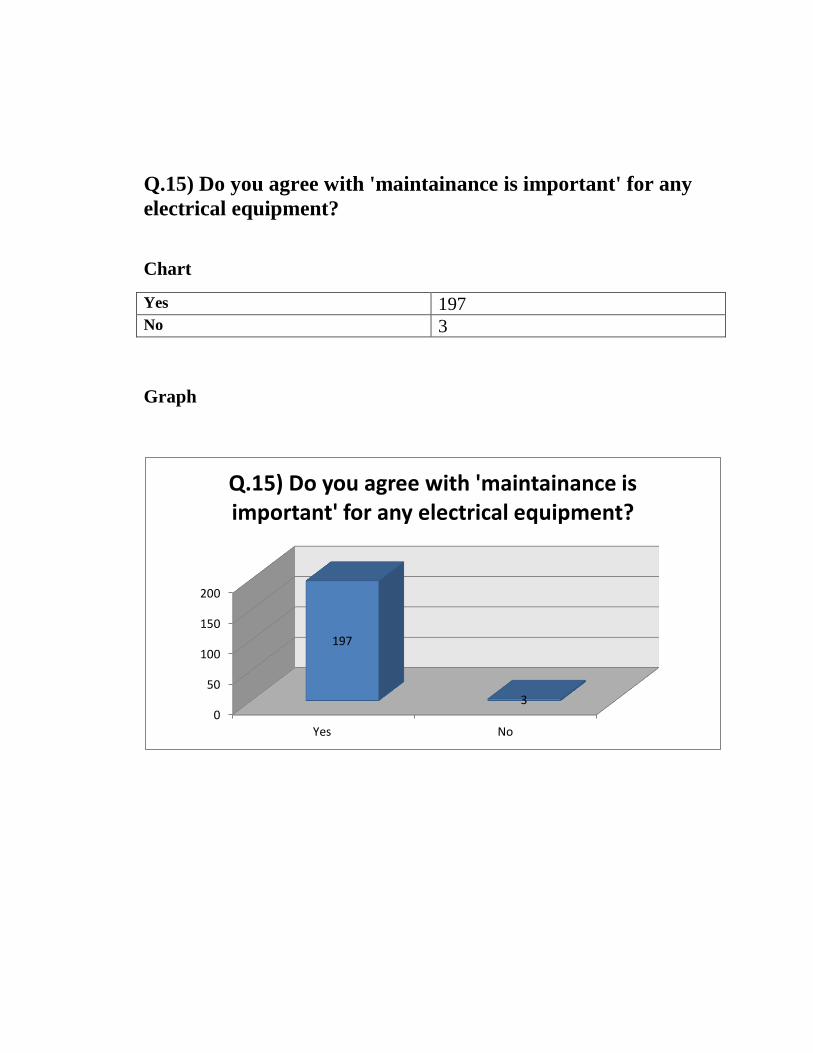
Q.15) Do you agree with 'maintainance is important' for any
electrical equipment?
Chart
Yes 197 No 3
Graph
0
50
100
150
200
Yes No
197
3
Q.15) Do you agree with 'maintainance is important' for any electrical equipment?
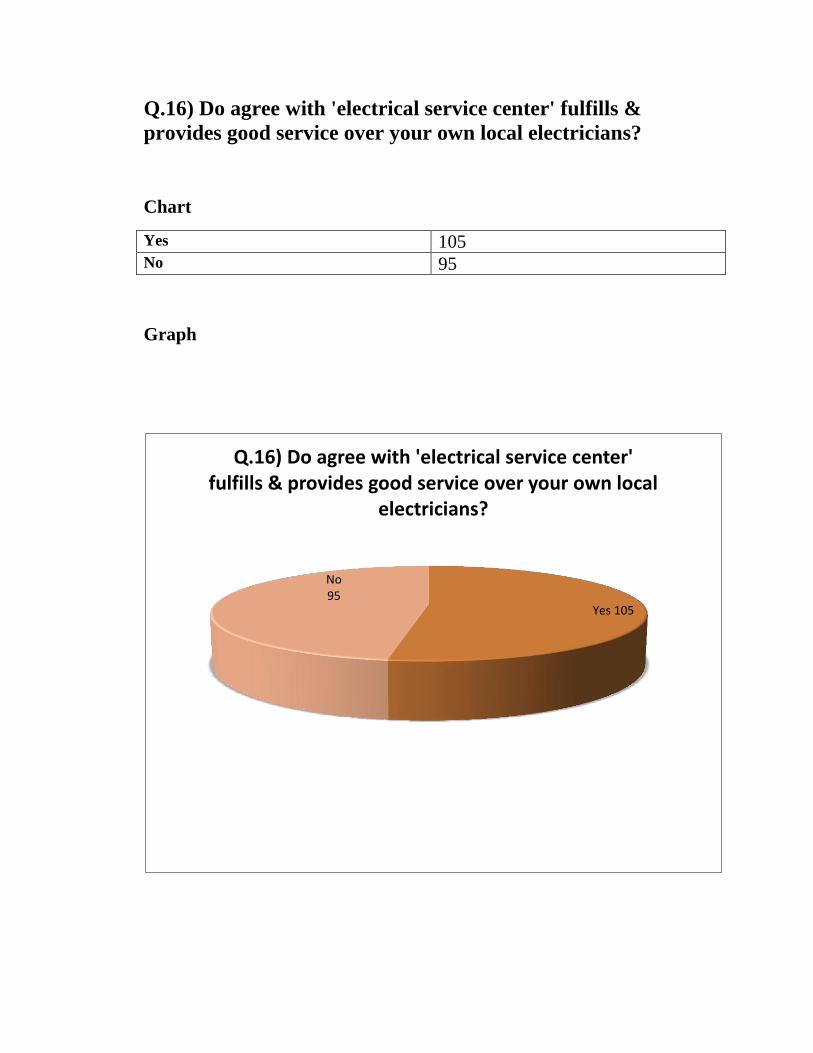
Q.16) Do agree with 'electrical service center' fulfills &
provides good service over your own local electricians?
Chart
Yes 105 No 95
Graph
Yes 105
No 95
Q.16) Do agree with 'electrical service center' fulfills & provides good service over your own local
electricians?
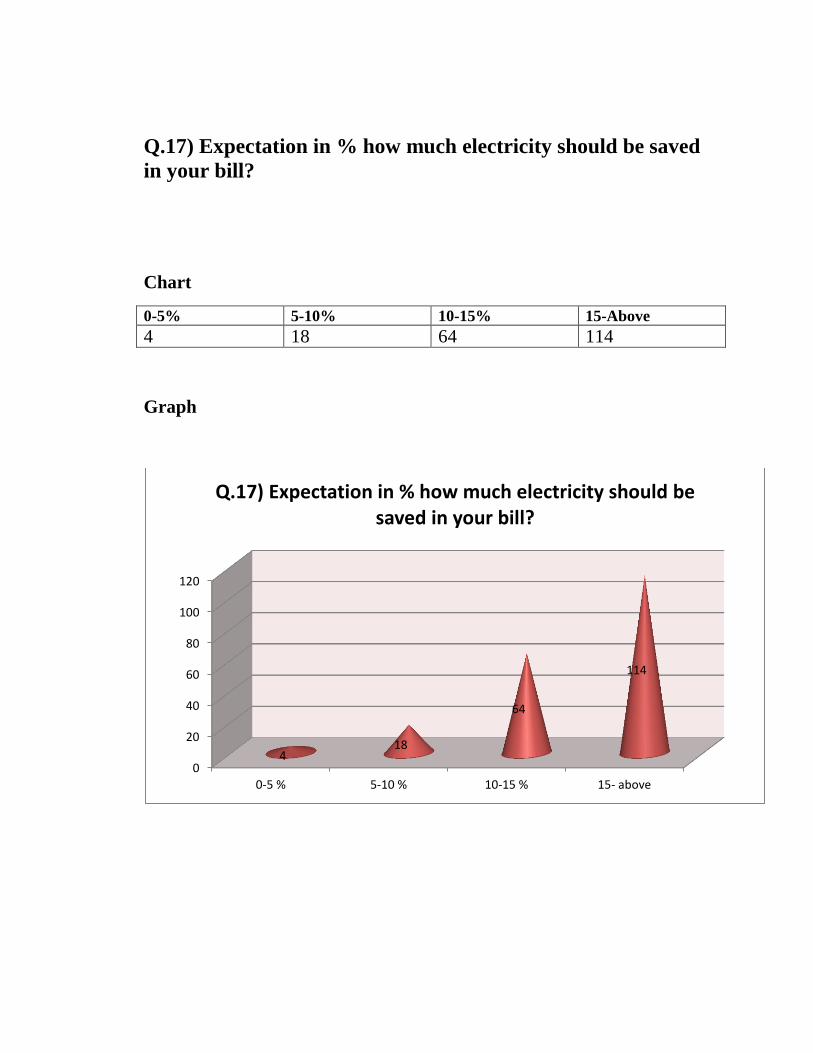
Q.17) Expectation in % how much electricity should be saved
in your bill?
Chart
0-5% 5-10% 10-15% 15-Above
4 18 64 114
Graph
0
20
40
60
80
100
120
0-5 % 5-10 % 10-15 % 15- above
4 18
64
114
Q.17) Expectation in % how much electricity should be saved in your bill?
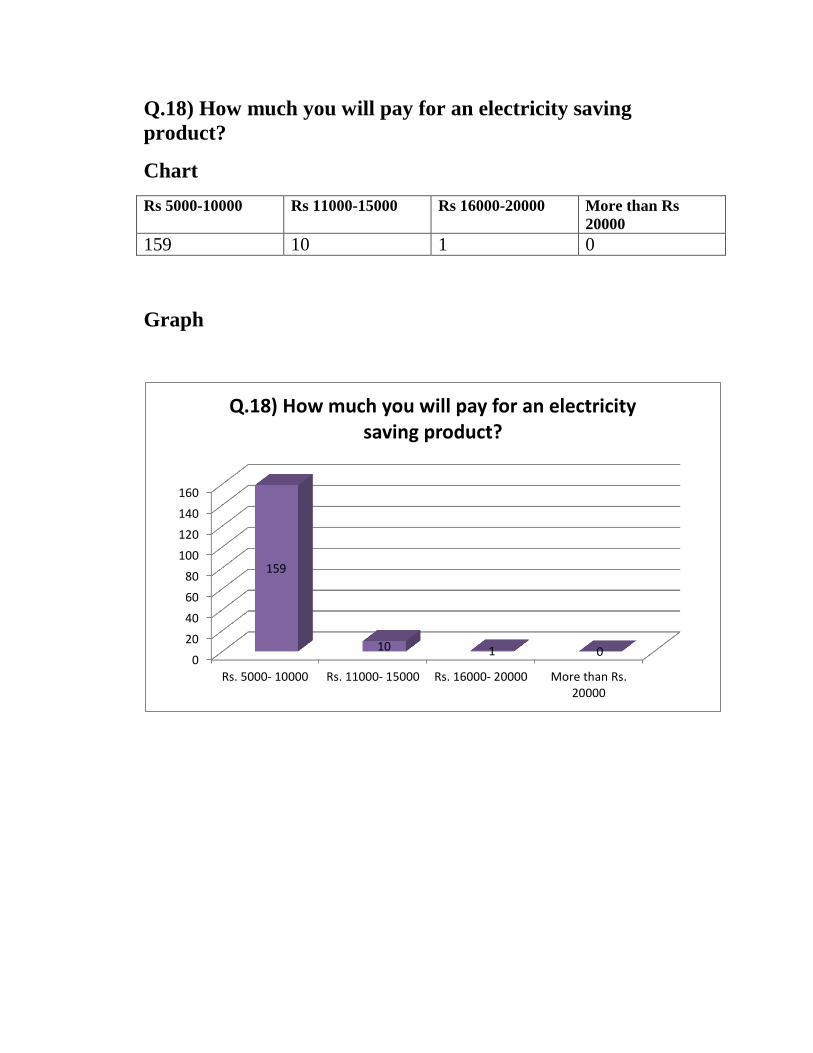
Q.18) How much you will pay for an electricity saving
product?
Chart
Rs 5000-10000 Rs 11000-15000 Rs 16000-20000 More than Rs
20000
159 10 1 0
Graph
0
20
40
60
80
100
120
140
160
Rs. 5000- 10000 Rs. 11000- 15000 Rs. 16000- 20000 More than Rs.20000
159
10 1 0
Q.18) How much you will pay for an electricity saving product?
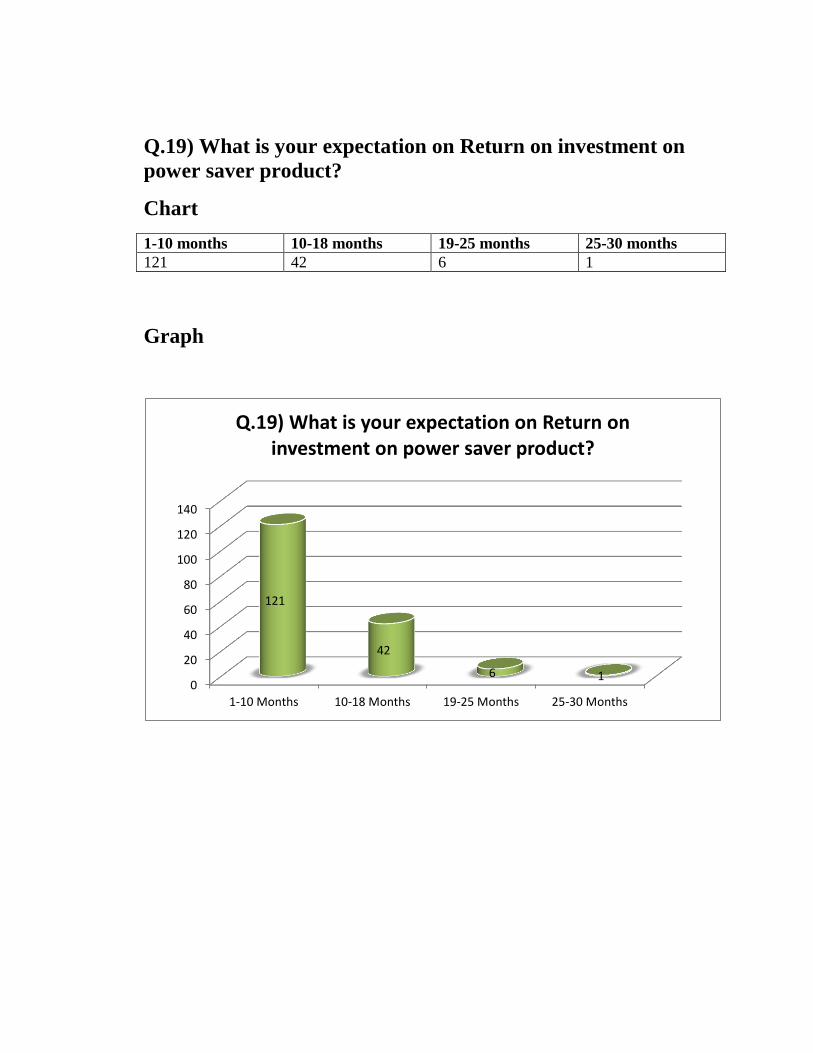
Q.19) What is your expectation on Return on investment on
power saver product?
Chart
1-10 months 10-18 months 19-25 months 25-30 months
121 42 6 1
Graph
0
20
40
60
80
100
120
140
1-10 Months 10-18 Months 19-25 Months 25-30 Months
121
42
6 1
Q.19) What is your expectation on Return on investment on power saver product?
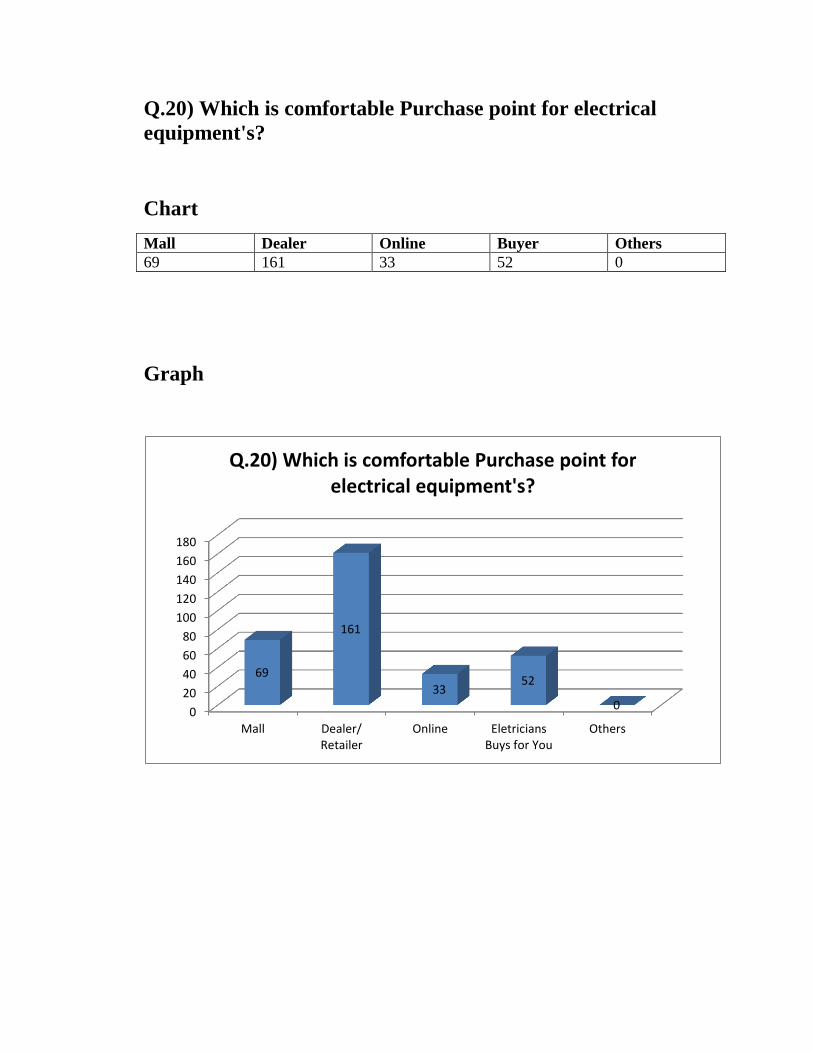
Q.20) Which is comfortable Purchase point for electrical
equipment's?
Chart
Mall Dealer Online Buyer Others
69 161 33 52 0
Graph
0
20
40
60
80
100
120
140
160
180
Mall Dealer/Retailer
Online EletriciansBuys for You
Others
69
161
33 52
0
Q.20) Which is comfortable Purchase point for electrical equipment's?
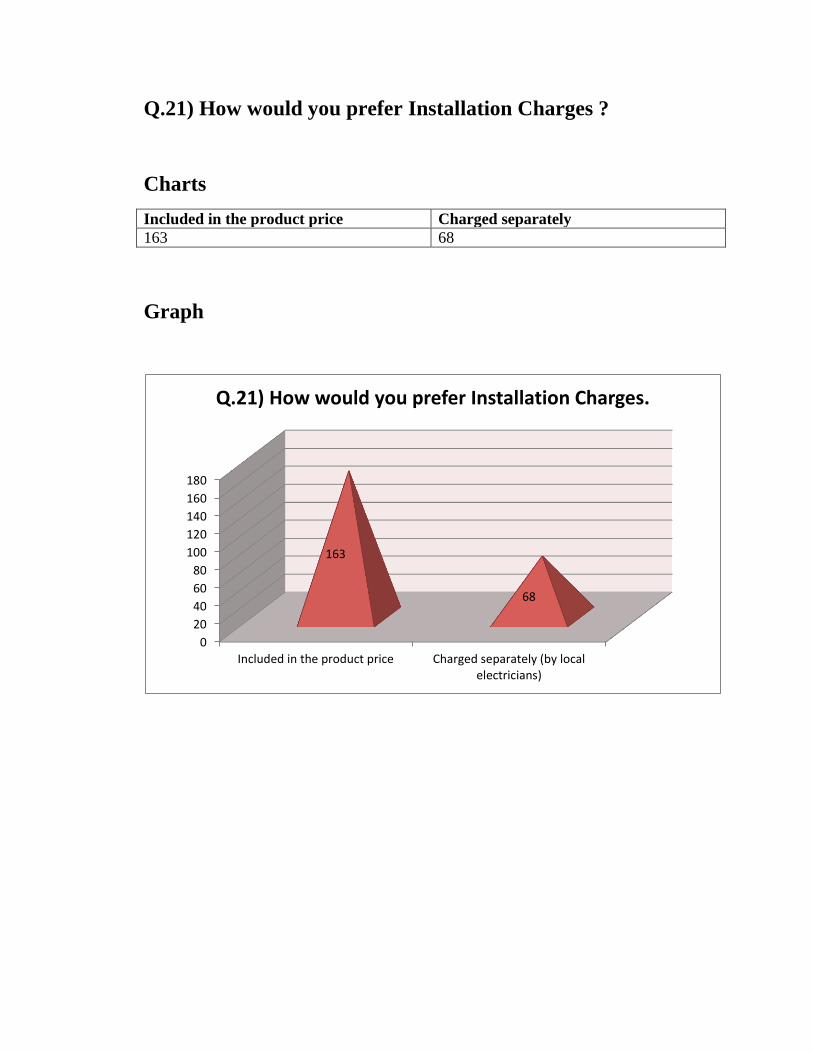
Q.21) How would you prefer Installation Charges ?
Charts
Included in the product price Charged separately
163 68
Graph
0
20
40
60
80
100
120
140
160
180
Included in the product price Charged separately (by localelectricians)
163
68
Q.21) How would you prefer Installation Charges.

Q.22) Which type of advertisement media attracts you for an
electrical product?
Charts
Television Newspaper Radio Local
Electricians
Relatives online Other
30% 24% 9% 15% 8% 14% 0
Graph
30%
24% 9%
15%
8%
14%
0%
Q.22) Which type of advertisement media attracts you for an electrical product?
Television
Newspaper
Radio
Local electricians
Relatives
Online (facebook, twitter)
Other