ase event slides major trauma sepsis qipp 114 june 2010
Post on 20-Dec-2015
217 views
TRANSCRIPT

ASE Event Slides
Major TraumaSepsisQIPP
114 June 2010
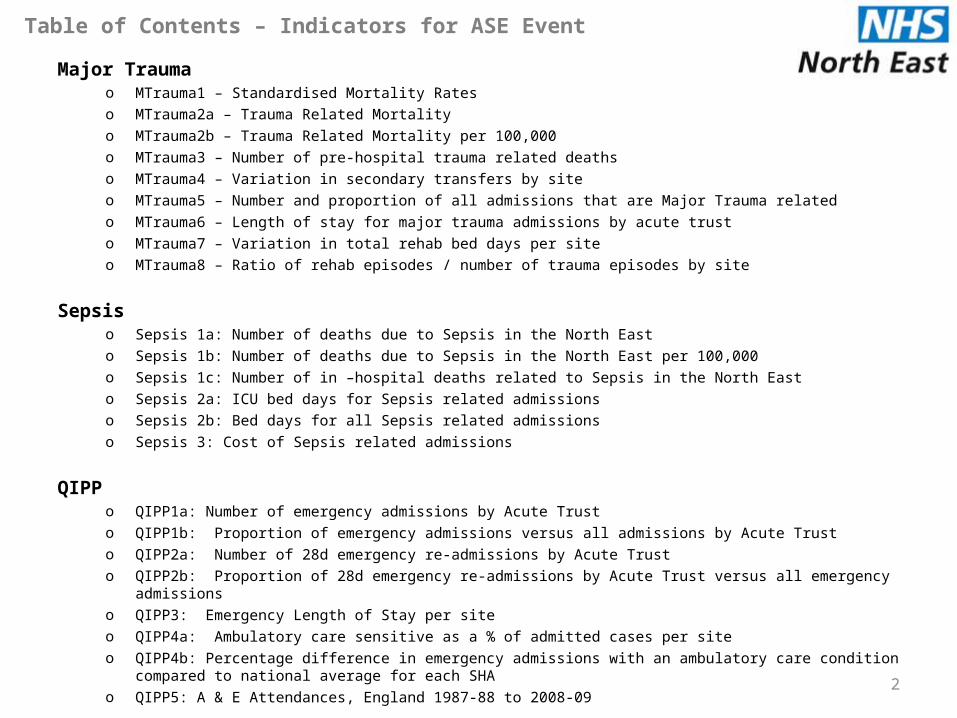
Table of Contents – Indicators for ASE Event
Major Traumao MTrauma1 – Standardised Mortality Rateso MTrauma2a – Trauma Related Mortalityo MTrauma2b – Trauma Related Mortality per 100,000o MTrauma3 – Number of pre-hospital trauma related deathso MTrauma4 – Variation in secondary transfers by siteo MTrauma5 – Number and proportion of all admissions that are Major Trauma relatedo MTrauma6 – Length of stay for major trauma admissions by acute trusto MTrauma7 – Variation in total rehab bed days per siteo MTrauma8 – Ratio of rehab episodes / number of trauma episodes by site
Sepsiso Sepsis 1a: Number of deaths due to Sepsis in the North Easto Sepsis 1b: Number of deaths due to Sepsis in the North East per 100,000o Sepsis 1c: Number of in –hospital deaths related to Sepsis in the North Easto Sepsis 2a: ICU bed days for Sepsis related admissions o Sepsis 2b: Bed days for all Sepsis related admissionso Sepsis 3: Cost of Sepsis related admissions
QIPPo QIPP1a: Number of emergency admissions by Acute Trusto QIPP1b: Proportion of emergency admissions versus all admissions by Acute Trusto QIPP2a: Number of 28d emergency re-admissions by Acute Trusto QIPP2b: Proportion of 28d emergency re-admissions by Acute Trust versus all emergency admissionso QIPP3: Emergency Length of Stay per siteo QIPP4a: Ambulatory care sensitive as a % of admitted cases per siteo QIPP4b: Percentage difference in emergency admissions with an ambulatory care condition compared to national average for
each SHAo QIPP5: A & E Attendances, England 1987-88 to 2008-09 2

MTrauma1 – Standardised Mortality Rates
Table 1: Data
3
Data obtained from TARN, January 1st 2006 and December 31st 2010
Provider
# additional survivals/ every 100 patients
CITY HOSPITALS SUNDERLAND NHS FOUNDATION TRUST
2
COUNTY DURHAM AND DARLINGTON NHS FOUNDATION TRUST
GATESHEAD HEALTH NHS FOUNDATION TRUST 2
NORTH TEES AND HARTLEPOOL NHS FOUNDATION TRUST
NORTHUMBRIA HEALTHCARE NHS FOUNDATION TRUST
SOUTH TEES HOSPITALS NHS FOUNDATION TRUST 5
SOUTH TYNESIDE NHS FOUNDATION TRUST
THE NEWCASTLE UPON TYNE HOSPITALS NHS FOUNDATION TRUST
5
Rate of Survival
NOTE –CDDFT, NTHFT, NHFT and STFT either do not submit to TARN or have low case counts and are not displayed

MTrauma2a – Trauma Related Mortality
Table 1: Data
4
Provider 2005 2006 2007 2008
County Durham PCT 157 127 131 181
Darlington PCT 39 35 28 36
Gateshead PCT 58 61 73 69
Hartlepool PCT 28 20 24 25
Middlesbrough PCT 51 58 46 40
Newcastle PCT 0 0 0 97
North Tyneside PCT 0 0 0 93
Northumberland Care Trust 122 140 132 126
Redcar And Cleveland PCT 45 39 57 40
South Tyneside PCT 0 0 0 48
Stockton-on-Tees 56 67 52 56
Sunderland Teaching PCT 0 0 0 91
NHS North East 556 547 543 902
NHS National 16411 17509 17420 18048
Data obtained from ONS: 2005, 2006, 2007, 2008, using ICD U50.9,V01-Y89 (External causes of morbidity)
NOTE – ALL external causes of morbidity are included, which is a proxy measure for Trauma related deaths.

MTrauma2a – Trauma Related Mortality
Chart 1: Time Series
5
0
20
40
60
80
100
120
140
160
180
200N
um
be
r o
f d
ea
ths
du
e t
o e
xte
rna
l c
au
se
s
Data obtained from ONS: 2005, 2006, 2007, 2008, using ICD U50.9,V01-Y89 (External causes of morbidity)
NOTE – ALL external causes of morbidity are included, which is a proxy measure for Trauma related deaths.

MTrauma2b – Trauma Related Mortality per 100,000 resident population
Table 1: Data
6
Data obtained from ONS: 2005, 2006, 2007, 2008, using ICD U50.9,V01-Y89 (External causes of morbidity)
Provider 2005 2006 2007 2008
County Durham PCT 31.501 25.364 25.946 35.842
Darlington PCT 39.474 35.247 28.000 35.964
Gateshead PCT 30.462 32.021 38.320 36.335
Hartlepool PCT 30.803 21.954 26.258 27.533
Middlesbrough PCT 36.823 41.908 33.165 28.551
Newcastle PCT 34.917
North Tyneside PCT 47.449
Northumberland Care Trust 39.380 45.176 42.498 40.528
Redcar And Cleveland PCT 32.235 27.957 40.890 29.028
South Tyneside PCT 0.000 0.000 0.000 31.704
Stockton-on-Tees 29.835 35.431 27.340 29.505
Sunderland Teaching PCT 32.396
NHS North East 21.806 21.403 21.174 35.089
NHS National 32.519 34.492 34.095 35.069

MTrauma2b – Trauma Related Mortality per 100,000 resident population
Chart 1: Time Series
7
Data obtained from ONS: 2005, 2006, 2007, 2008, using ICD U50.9,V01-Y89 (External causes of morbidity)
0
5
10
15
20
25
30
35
40
45
50N
um
be
r o
f d
ea
ths
du
e t
o e
xte
rna
l c
au
se
s p
er
10
0k

MTrauma3 – Number of pre-hospital trauma related deaths
Table 1: Data
8
Data obtained from
Not able to complete within current timescales

MTrauma3 – Number of pre-hospital trauma related deaths
Chart 1: Time Series
9
Data obtained from
Not able to complete within current timescales

MTrauma4 – Variation in secondary transfers by site
Table 1: Data
10
Data obtained from
Not able to complete within current timescales

MTrauma4 – Variation in secondary transfers by site
Chart 1: Time Series
11
Data obtained from
Not able to complete within current timescales

MTrauma5 – Number and proportion of all admissions that are Major Trauma related
12
Table 1: Data (% of all admissions that are trauma episodes)
12
Data obtained from HES 2009/10
Provider October November December January February March FY0910
CITY HOSPITALS SUNDERLAND NHS FOUNDATION TRUST 2.4% 2.8% 4.1% 3.4% 2.8% 0.0% 3.4%
COUNTY DURHAM AND DARLINGTON NHS FOUNDATION TRUST 2.9% 2.2% 3.6% 3.4% 2.9% 2.3% 3.1%
GATESHEAD HEALTH NHS FOUNDATION TRUST 2.5% 2.4% 4.2% 2.8% 2.5% 2.6% 2.9%
NORTH TEES AND HARTLEPOOL NHS FOUNDATION TRUST 2.5% 2.2% 2.8% 2.8% 2.4% 2.2% 2.8%
NORTHUMBRIA HEALTHCARE NHS FOUNDATION TRUST 3.3% 3.2% 4.6% 3.7% 3.2% 3.5% 3.6%
SOUTH TEES HOSPITALS NHS FOUNDATION TRUST 2.4% 2.5% 3.4% 2.9% 2.2% 2.2% 3.0%
SOUTH TYNESIDE NHS FOUNDATION TRUST 2.2% 2.4% 3.8% 3.3% 2.7% 2.6% 2.8%
THE NEWCASTLE UPON TYNE HOSPITALS NHS FOUNDATION TRUST 2.4% 2.3% 3.4% 2.9% 2.3% 2.1% 2.7%
NHS North East 2.6% 2.5% 3.7% 3.1% 2.6% 2.4% 3.0%
NHS National 2.9% 2.6% 3.5% 3.4% 2.5% 2.4% 3.1%
Provider October November December January February March FY0910
CITY HOSPITALS SUNDERLAND NHS FOUNDATION TRUST 123 136 202 155 108 0 1762
COUNTY DURHAM AND DARLINGTON NHS FOUNDATION TRUST 218 161 253 240 191 151 2610
GATESHEAD HEALTH NHS FOUNDATION TRUST 80 72 125 84 67 70 1025
NORTH TEES AND HARTLEPOOL NHS FOUNDATION TRUST 125 107 138 131 112 96 1584
NORTHUMBRIA HEALTHCARE NHS FOUNDATION TRUST 211 198 294 217 177 199 2630
SOUTH TEES HOSPITALS NHS FOUNDATION TRUST 189 195 273 234 164 166 2733
SOUTH TYNESIDE NHS FOUNDATION TRUST 44 46 72 62 46 44 615
THE NEWCASTLE UPON TYNE HOSPITALS NHS FOUNDATION TRUST 218 219 315 264 199 186 2949
NHS North East 1208 1134 1672 1387 1064 912 15908
NHS National 21402 18860 25191 23951 16897 15553 258585
Table 1b: Data (number of trauma episodes)

MTrauma5 – Proportion of all admissions that are Major Trauma related
Chart 1: Time Series
13
Data obtained from HES 2009/10
0.0%
0.5%
1.0%
1.5%
2.0%
2.5%
3.0%
3.5%
4.0%
4.5%
5.0%%
of
maj
or
trau
ma
adm
issi
on
s

MTrauma6 – Length of stay (days) for major trauma admissions by acute trust
Table 1: Data
14
Data obtained from HES 2009/10
Provider 0 1 2 >2
CITY HOSPITALS SUNDERLAND NHS FOUNDATION TRUST 258 530 337 637
COUNTY DURHAM AND DARLINGTON NHS FOUNDATION TRUST 545 675 389 1001
GATESHEAD HEALTH NHS FOUNDATION TRUST 114 250 176 485
NORTH TEES AND HARTLEPOOL NHS FOUNDATION TRUST 253 474 240 617
NORTHUMBRIA HEALTHCARE NHS FOUNDATION TRUST 953 530 311 836
SOUTH TEES HOSPITALS NHS FOUNDATION TRUST 377 826 474 1056
SOUTH TYNESIDE NHS FOUNDATION TRUST 78 138 68 331
THE NEWCASTLE UPON TYNE HOSPITALS NHS FOUNDATION TRUST 696 695 449 1109
NHS North East 3274 4118 2444 6072
NHS National 57680 71845 34594 96908
ProviderTotal
EpisodesAverage
LOSMin LOS
25% Quartile
Median LOS
75% Quartile
Max LOS Total LOS
CITY HOSPITALS SUNDERLAND NHS FOUNDATION TRUST 1762 4.34 0 1 2 4 133 7643
COUNTY DURHAM AND DARLINGTON NHS FOUNDATION TRUST 2610 5.14 0 1 2 4 182 13412
GATESHEAD HEALTH NHS FOUNDATION TRUST 1025 6.32 0 1 2 6 131 6475
NORTH TEES AND HARTLEPOOL NHS FOUNDATION TRUST 1584 4.71 0 1 2 4 83 7465
NORTHUMBRIA HEALTHCARE NHS FOUNDATION TRUST 2630 5.33 0 0 1 4 180 14016
SOUTH TEES HOSPITALS NHS FOUNDATION TRUST 2733 5.42 0 1 2 5 324 14824
SOUTH TYNESIDE NHS FOUNDATION TRUST 615 9.38 0 1 3 10 112 5767
THE NEWCASTLE UPON TYNE HOSPITALS NHS FOUNDATION TRUST 2949 5.25 0 1 2 5 169 15478
NHS North East 15908 5.35 0 1 2 5 324 85080
NHS National 266951 5.67 0 1 2 5 324 1513418

MTrauma6 – Length of stay (days) for major trauma admissions by acute trust
Chart 1: Stacked Bar Chart
15
Data obtained from HES 2009/10
0%
10%
20%
30%
40%
50%
60%
70%
80%
90%
100%
LoS
(day
s) f
or m
ajor
tra
uma
adm
issi
ons
>2
2
1
0

MTrauma6 – Length of stay (days) for major trauma admissions by acute trust
Chart 2: Box whisker plot
16
Data obtained from HES 2009/10
0.0000
1.0000
2.0000
3.0000
4.0000
5.0000
6.0000
7.0000
8.0000
9.0000
10.0000
CHSFT CDDFT GHFT NTHFT NHFT STHFT STFT NUTHFT
0
1
2
3
4
5
6
7
8
9
10
Med
ian
bed
days
rela
ted
to M
ajor
Tra
uma
1st quartile to 3rd quartile
Median bed days
Regional Median
MTrauma7 – Variation in total rehab bed days per site
Table 1: Data
17
Data obtained from
Not able to complete within current timescales

MTrauma7 – Variation in total rehab bed days per site
Chart 1: Time Series
18
Data obtained from
Not able to complete within current timescales

MTrauma8 – Ratio of rehab episodes / number of trauma episodes by site
Table 1: Data
19
Data obtained from
Not able to complete within current timescales

MTrauma8 – Ratio of rehab episodes / number of trauma episodes by site
Chart 1: Time Series
20
Data obtained from
Not able to complete within current timescales

Sepsis 1a: Number of deaths due to Sepsis in the North East
Table 1: Data
Data obtained from ONS: 2005, 2006, 2007, 2008, using ICD A40-A41 (Septicaemia )
21
Provider 2005 2006 2007 2008
County Durham PCT 30 26 26 27
Darlington PCT 3 7 8 6
Gateshead PCT 10 15 9 10
Hartlepool PCT 10 2 4 6
Middlesbrough PCT 6 4 2 13
Newcastle PCT 32 35 30 20
North Tyneside PCT 0 0 0 15
Northumberland Care Trust 16 20 20 18
Redcar And Cleveland PCT 4 4 8 10
South Tyneside PCT 0 0 0 6
Stockton-on-Tees 6 2 12 13
Sunderland Teaching PCT 0 0 0 20
NHS North East 117 115 119 164
NHS National 2342 2377 2315 2154
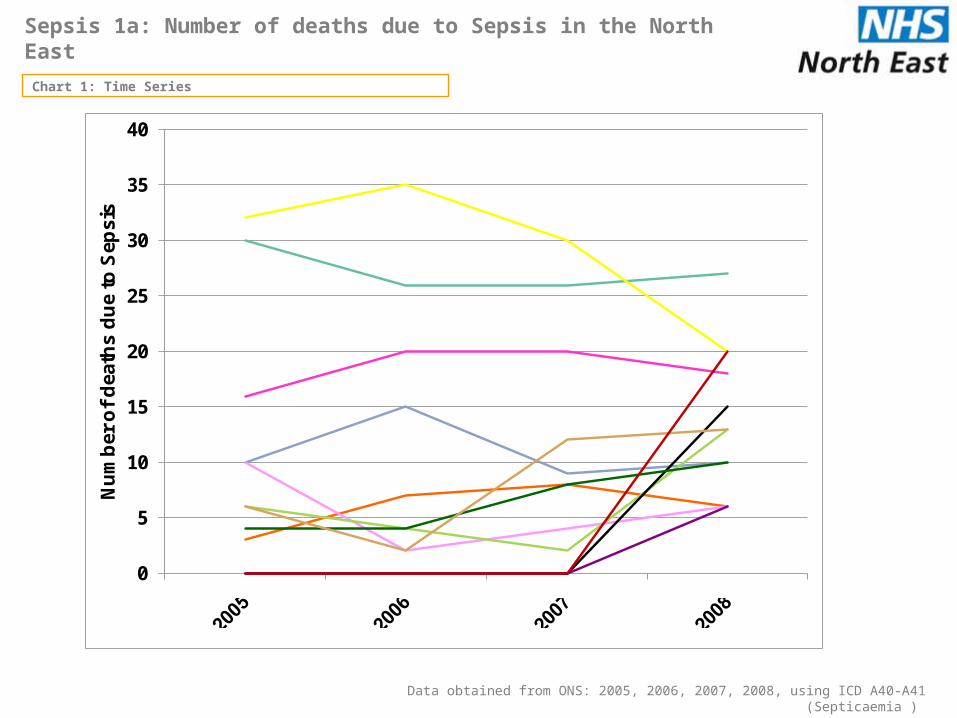
Sepsis 1a: Number of deaths due to Sepsis in the North East
Chart 1: Time Series
22
0
5
10
15
20
25
30
35
40N
um
ber
of
dea
ths
du
e to
Sep
sis
Data obtained from ONS: 2005, 2006, 2007, 2008, using ICD A40-A41 (Septicaemia )

Sepsis 1b: Number of deaths due to Sepsis in the North East per 100,000 resident population
Table 1: Data
Data obtained from ONS: 2005, 2006, 2007, 2008. Mid year Primary Care Organisation population estimates from ONS, 2005, 2006, 2007, 2008
23
Provider 2005 2006 2007 2008
County Durham PCT 6.019 5.193 5.150 5.347
Darlington PCT 3.036 7.049 8.000 5.994
Gateshead PCT 5.252 7.874 4.724 5.266
Hartlepool PCT 11.001 2.195 4.376 6.608
Middlesbrough PCT 4.332 2.890 1.442 9.279
Newcastle PCT 11.869 12.939 11.046 7.199
North Tyneside PCT 0.000 0.000 0.000 7.653
Northumberland Care Trust 5.165 6.454 6.439 5.790
Redcar And Cleveland PCT 2.865 2.867 5.739 7.257
South Tyneside PCT 0.000 0.000 0.000 3.963
Stockton-on-Tees 3.197 1.058 6.309 6.849
Sunderland Teaching PCT 0.000 0.000 0.000 7.120
NHS North East 4.589 4.500 4.640 6.380
NHS National 4.641 4.683 4.531 4.185

Sepsis 1b: Number of deaths due to Sepsis in the North East per 100,000 resident population
Chart 1: Time Series
24
Data obtained from ONS: 2005, 2006, 2007, 2008. Mid year Primary Care Organisation population estimates from ONS, 2005, 2006, 2007, 2008
0
2
4
6
8
10
12
14N
um
ber
of
dea
ths
du
e to
Sep
sis
per
100
k

Sepsis 1c: Number of in hospital deaths related to Sepsis in the North East
Table 1: Data
Data obtained from HES: 2009/10, Diagnosis in any position for A40-A41
25
Provider April
May June
July
August
Septem
Octob
Novem
Decem
Januar
Februa
March
FY0910CITY HOSPITALS SUNDERLAND NHS FOUNDATION TRUST 0 3 1 0 1 0 2 1 0 2 0 0 10
COUNTY DURHAM AND DARLINGTON NHS FOUNDATION TRUST 1 1 0 3 0 0 1 1 1 3 2 0 13
GATESHEAD HEALTH NHS FOUNDATION TRUST 1 1 0 2 0 0 1 1 1 2 0 0 9
NORTH TEES AND HARTLEPOOL NHS FOUNDATION TRUST 0 3 0 0 1 1 3 5 1 0 0 1 15
NORTHUMBRIA HEALTHCARE NHS FOUNDATION TRUST 3 0 0 0 1 1 2 1 2 0 0 1 11
SOUTH TEES HOSPITALS NHS FOUNDATION TRUST 4 2 2 4 3 7 4 5 3 5 6 0 45
SOUTH TYNESIDE NHS FOUNDATION TRUST 0 1 0 0 0 1 0 0 0 0 0 0 2
THE NEWCASTLE UPON TYNE HOSPITALS NHS FOUNDATION TRUST 2 2 3 2 6 2 2 2 3 1 2 0 27
NHS North East 11 13 6 11 12 12 15 16 11 13 10 2 132
NHS National 181 177 185 174 188 182 201 180 238 218 149 70 2143
NOTE – Most recent year of data available from ONS is 2008. Table above based on HES 2009/10

Sepsis 1c: Number of in hospital deaths related to Sepsis in the North East
Chart 1: Time Series
26
Data obtained from HES: 2009/10
0
1
2
3
4
5
6
7
8N
um
ber
of
dea
ths
rela
ted
to
Sep
sis

Sepsis 2a: ICU bed days for Sepsis related admissions
Chart 1: Data
Data obtained from ONS 2005, 2006, 2007, 2008
27
ProviderTotal
EpisodesAverage
LOSMin LOS
25% Quartile
Median LOS
75% Quartile
Max LOS Total LOS
CITY HOSPITALS SUNDERLAND NHS FOUNDATION TRUST 7 26.14 4 18 24 36 47 183
COUNTY DURHAM AND DARLINGTON NHS FOUNDATION TRUST 25 17.96 2 7 12 20 74 449
GATESHEAD HEALTH NHS FOUNDATION TRUST 8 35.50 1 9 18 51 97 284
NORTH TEES AND HARTLEPOOL NHS FOUNDATION TRUST 14 8.57 1 4 7 11 27 120
NORTHUMBRIA HEALTHCARE NHS FOUNDATION TRUST 14 25.14 3 7 12 25 85 352
SOUTH TEES HOSPITALS NHS FOUNDATION TRUST 24 14.25 2 4 8 18 60 342
SOUTH TYNESIDE NHS FOUNDATION TRUST 3 16.33 9 10 10 20 30 49
THE NEWCASTLE UPON TYNE HOSPITALS NHS FOUNDATION TRUST 14 21.43 1 6 10 26 74 300
NHS North East 109 19 1 6 10 24 97 2079
NHS National 2189 18 0 6 12 22 245 38735

Sepsis 2a: ICU bed days for Sepsis related admissions
Chart 1: Time Series
28
Data obtained from HES: 2009/10NOTE – Max for GHFT, STHFT and NUTHFT is beyond scale of y-axis
0.0000
10.0000
20.0000
30.0000
40.0000
50.0000
60.0000
70.0000
80.0000
90.0000
100.0000
CHSFT CDDFT GHFT NTHFT NHFT STHFT STFT NUTHFT
0
10
20
30
40
50
60
70
80
90
100M
edia
n be
d da
ys re
late
d to
Sep
sis
1st quartile to 3rd quartile
Median bed days
LOS range
Regional Median

Sepsis 2b: Bed days for all Sepsis related admissions
Table 1: Data
29
Data obtained from HES: 2009/10
Provider
Total Episodes
Average LOS
Min LOS
25% Quartil
e
Median LOS
75% Quartil
e
Max LOS
Total LOS
CITY HOSPITALS SUNDERLAND NHS FOUNDATION TRUST 29 27.48 2 9 21 31 99 797
COUNTY DURHAM AND DARLINGTON NHS FOUNDATION TRUST 48 19.31 0 5 13 24 87 927
GATESHEAD HEALTH NHS FOUNDATION TRUST 33 29.03 1 7 16 37 106 958
NORTH TEES AND HARTLEPOOL NHS FOUNDATION TRUST 51 11.18 0 4 7 16 50 570
NORTHUMBRIA HEALTHCARE NHS FOUNDATION TRUST 31 19.74 0 7 11 19 85 612
SOUTH TEES HOSPITALS NHS FOUNDATION TRUST 162 24.67 0 7 17 34 233 3996
SOUTH TYNESIDE NHS FOUNDATION TRUST 13 14.69 0 4 8 15 86 191
THE NEWCASTLE UPON TYNE HOSPITALS NHS FOUNDATION TRUST 114 27.23 0 8 16 36 187 3104
NHS North East 481 23.19 0 6 14 30 233 11155
NHS National 9257 21.45 0 6 14 28 269 198598

Sepsis 2b: Bed days for all Sepsis related admissions
Chart 1: Time Series
30
Data obtained from HES: 2009/10
NOTE – Max for GHFT, STHFT and NUTHFT is beyond scale of y-axis
1 2 3 4 5 6 7 8
0.0000
10.0000
20.0000
30.0000
40.0000
50.0000
60.0000
70.0000
80.0000
90.0000
100.0000
0
10
20
30
40
50
60
70
80
90
100M
edia
n be
d da
ys re
late
d to
Sep
sis
1st quartile to 3rd quartile
Median bed days
LOS range
Regional Mean

Sepsis 3: Cost of Sepsis related admissions
Table 1: Data
Data obtained from HES : 2009/10
31
Provider Total Cost
CITY HOSPITALS SUNDERLAND NHS FOUNDATION TRUST £80,731
COUNTY DURHAM AND DARLINGTON NHS FOUNDATION TRUST £150,662
GATESHEAD HEALTH NHS FOUNDATION TRUST £102,414
NORTH TEES AND HARTLEPOOL NHS FOUNDATION TRUST £138,404
NORTHUMBRIA HEALTHCARE NHS FOUNDATION TRUST £78,957
SOUTH TEES HOSPITALS NHS FOUNDATION TRUST £460,313
SOUTH TYNESIDE NHS FOUNDATION TRUST £32,430
THE NEWCASTLE UPON TYNE HOSPITALS NHS FOUNDATION TRUST £420,128

QIPP1a: Number of emergency admissions by Acute Trust
Table 1: Data
Data obtained from HES: 2009/10
32
Note: Q4 2009/10 data from HES may not be complete. Numbers for City Hospitals Sunderland Foundation Trust are low.
Provider Q1 Q2 Q3 Q4 FY0910
CITY HOSPITALS SUNDERLAND NHS FOUNDATION TRUST 9,266 9,000 9,636 5,129 33,031
COUNTY DURHAM AND DARLINGTON NHS FOUNDATION TRUST 13,212 12,942 14,020 12,527 52,701
GATESHEAD HEALTH NHS FOUNDATION TRUST 6,100 5,679 6,471 5,939 24,189
NORTH TEES AND HARTLEPOOL NHS FOUNDATION TRUST 9,608 9,539 10,127 9,520 38,794
NORTHUMBRIA HEALTHCARE NHS FOUNDATION TRUST 13,384 13,364 13,876 12,791 53,415
SOUTH TEES HOSPITALS NHS FOUNDATION TRUST 12,800 12,426 13,222 12,155 50,603
SOUTH TYNESIDE NHS FOUNDATION TRUST 3,680 3,749 4,337 3,851 15,617
THE NEWCASTLE UPON TYNE HOSPITALS NHS FOUNDATION TRUST 12,481 12,082 13,355 12,921 50,839
NHS North East 80,531 78,781 85,044 74,833 319,189
NHS National 1,132,064 1,110,143 1,193,661 1,073,398 4,509,266

QIPP1a: Number of emergency admissions by Acute Trust
Chart 1: Time Series
33
Data obtained from HES: 2009/10
0
1,000
2,000
3,000
4,000
5,000
6,000
Nu
mb
er o
f em
erg
ency
ad
mis
sio
ns
Note: Q4 2009/10 data from HES may not be complete.

QIPP1b: Proportion of emergency admissions versus all admissions by Acute Trust
Table 1: Data
34
Data obtained from HES: 2009/10
Provider October November December January February March FY0910
CITY HOSPITALS SUNDERLAND NHS FOUNDATION TRUST 63.9% 63.5% 66.8% 62.5% 58.4% 15.2% 63.2%
COUNTY DURHAM AND DARLINGTON NHS FOUNDATION TRUST 63.9% 62.5% 65.1% 62.2% 62.6% 62.0% 63.0%
GATESHEAD HEALTH NHS FOUNDATION TRUST 69.8% 70.0% 73.0% 69.6% 71.4% 69.8% 69.3%
NORTH TEES AND HARTLEPOOL NHS FOUNDATION TRUST 67.4% 67.2% 71.9% 70.6% 68.9% 68.2% 67.9%
NORTHUMBRIA HEALTHCARE NHS FOUNDATION TRUST 73.6% 73.1% 74.5% 74.7% 74.4% 74.9% 73.8%
SOUTH TEES HOSPITALS NHS FOUNDATION TRUST 54.5% 54.3% 56.8% 54.5% 52.4% 51.5% 55.0%
SOUTH TYNESIDE NHS FOUNDATION TRUST 72.0% 74.5% 76.1% 71.6% 73.1% 72.9% 71.8%
THE NEWCASTLE UPON TYNE HOSPITALS NHS FOUNDATION TRUST 45.5% 47.3% 51.5% 48.6% 47.4% 48.9% 46.8%
NHS North East 61.1% 61.0% 64.1% 61.5% 60.5% 60.4% 61.1%
NHS National 52.0% 51.6% 54.3% 52.8% 51.6% 50.2% 51.7%
Note: Q4 2009/10 data from HES may not be complete.
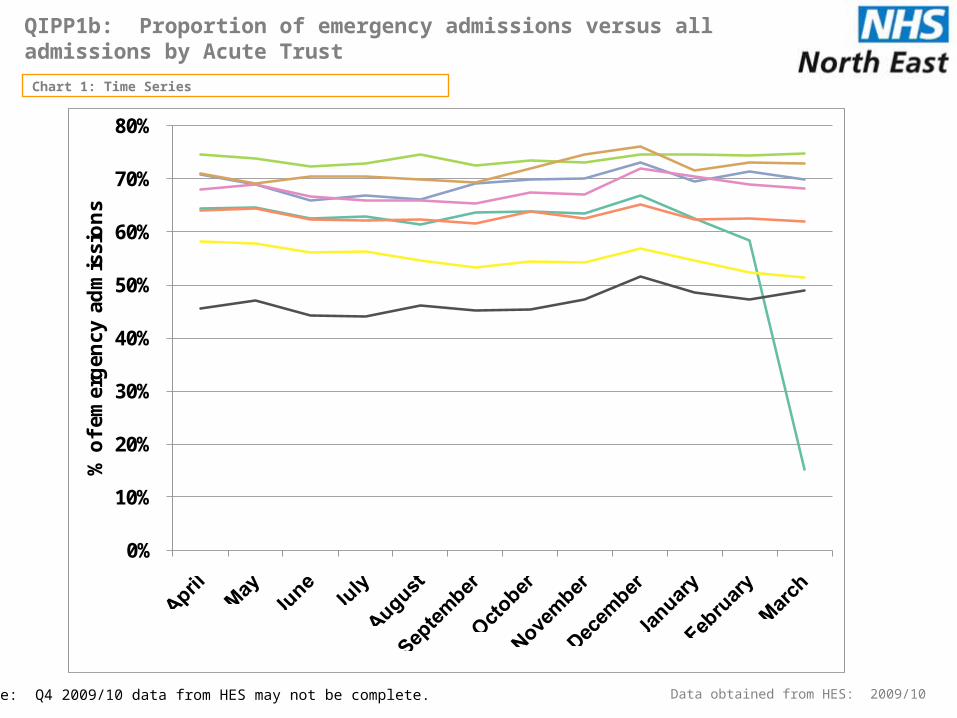
QIPP1b: Proportion of emergency admissions versus all admissions by Acute Trust
Chart 1: Time Series
35
Data obtained from HES: 2009/10
0%
10%
20%
30%
40%
50%
60%
70%
80%
% o
f em
erg
ency
ad
mis
sio
ns
Note: Q4 2009/10 data from HES may not be complete.
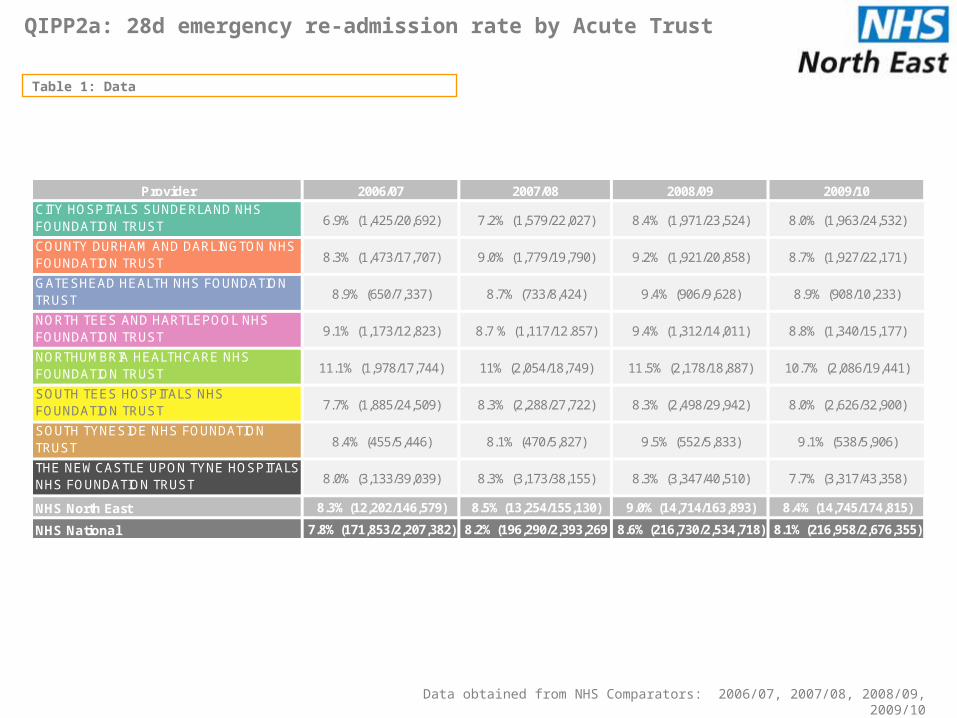
QIPP2a: 28d emergency re-admission rate by Acute Trust
Table 1: Data
36
Data obtained from NHS Comparators: 2006/07, 2007/08, 2008/09, 2009/10
Provider 2006/07 2007/08 2008/09 2009/10CITY HOSPITALS SUNDERLAND NHS FOUNDATION TRUST 6.9% (1,425/20,692) 7.2% (1,579/22,027) 8.4% (1,971/23,524) 8.0% (1,963/24,532)
COUNTY DURHAM AND DARLINGTON NHS FOUNDATION TRUST 8.3% (1,473/17,707) 9.0% (1,779/19,790) 9.2% (1,921/20,858) 8.7% (1,927/22,171)
GATESHEAD HEALTH NHS FOUNDATION TRUST 8.9% (650/7,337) 8.7% (733/8,424) 9.4% (906/9,628) 8.9% (908/10,233)
NORTH TEES AND HARTLEPOOL NHS FOUNDATION TRUST 9.1% (1,173/12,823) 8.7 % (1,117/12.857) 9.4% (1,312/14,011) 8.8% (1,340/15,177)
NORTHUMBRIA HEALTHCARE NHS FOUNDATION TRUST 11.1% (1,978/17,744) 11% (2,054/18,749) 11.5% (2,178/18,887) 10.7% (2,086/19,441)
SOUTH TEES HOSPITALS NHS FOUNDATION TRUST 7.7% (1,885/24,509) 8.3% (2,288/27,722) 8.3% (2,498/29,942) 8.0% (2,626/32,900)
SOUTH TYNESIDE NHS FOUNDATION TRUST 8.4% (455/5,446) 8.1% (470/5,827) 9.5% (552/5,833) 9.1% (538/5,906)
THE NEWCASTLE UPON TYNE HOSPITALS NHS FOUNDATION TRUST 8.0% (3,133/39,039) 8.3% (3,173/38,155) 8.3% (3,347/40,510) 7.7% (3,317/43,358)
NHS North East 8.3% (12,202/146,579) 8.5% (13,254/155,130) 9.0% (14,714/163,893) 8.4% (14,745/174,815)
NHS National 7.8% (171,853/2,207,382) 8.2% (196,290/2,393,269 8.6% (216,730/2,534,718) 8.1% (216,958/2,676,355)

QIPP2a: 28d emergency re-admission rate by Acute Trust
Chart 1: Time Series
37
Data obtained from NHS Comparators: 2006/07, 2007/08, 2008/09, 2009/10
6%
7%
8%
9%
10%
11%
12%P
erce
nta
ge
of
emer
gen
cy r
ead
mis
sio
ns

QIPP2b: Proportion of 28d emergency re-admissions by Acute Trust versus all emergency admissions
Table 1: Data
38
Data obtained from HES: 2009/10
Not able to complete within current timescales

QIPP2b: Proportion of 28d emergency re-admissions by Acute Trust versus all emergency admissions
Chart 1: Time Series
39
Data obtained from HES: 2009/10
Not able to complete within current timescales

QIPP3: Emergency Length of Stay (days) per site
Table 1: Data
40
Data obtained from HES: 2009/10
Provider 0 1 2 >2
CITY HOSPITALS SUNDERLAND NHS FOUNDATION TRUST 5914 7781 3921 15415
COUNTY DURHAM AND DARLINGTON NHS FOUNDATION TRUST 15759 12807 5263 18872
GATESHEAD HEALTH NHS FOUNDATION TRUST 6615 5595 2358 9621
NORTH TEES AND HARTLEPOOL NHS FOUNDATION TRUST 10943 9560 4179 14112
NORTHUMBRIA HEALTHCARE NHS FOUNDATION TRUST 22934 8305 3701 18475
SOUTH TEES HOSPITALS NHS FOUNDATION TRUST 13749 12469 5766 18619
SOUTH TYNESIDE NHS FOUNDATION TRUST 3583 3711 1447 6876
THE NEWCASTLE UPON TYNE HOSPITALS NHS FOUNDATION TRUST 17636 9812 5246 18145
NHS North East 97133 70040 31881 120135
NHS National 1247848 980753 460824 1782152
ProviderTotal
EpisodesAverage
LOSMin LOS
25% Quartile
Median LOS
75% Quartile
Max LOS Total LOS
CITY HOSPITALS SUNDERLAND NHS FOUNDATION TRUST 33031 5.69 0 1 2 7 183 188111
COUNTY DURHAM AND DARLINGTON NHS FOUNDATION TRUST 52701 4.32 0 0 1 4 182 227616
GATESHEAD HEALTH NHS FOUNDATION TRUST 24189 5.51 0 0 1 5 246 133243
NORTH TEES AND HARTLEPOOL NHS FOUNDATION TRUST 38794 4.20 0 0 1 4 170 162974
NORTHUMBRIA HEALTHCARE NHS FOUNDATION TRUST 53415 4.88 0 0 1 5 204 260700
SOUTH TEES HOSPITALS NHS FOUNDATION TRUST 50603 4.37 0 0 1 5 199 221051
SOUTH TYNESIDE NHS FOUNDATION TRUST 15617 6.28 0 1 2 7 158 98095
THE NEWCASTLE UPON TYNE HOSPITALS NHS FOUNDATION TRUST 50839 4.92 0 0 1 5 221 250096
NHS North East 319189 4.83 0 0 1 5 246 1541886

QIPP3: Emergency Length of Stay (days) per site
Chart 1: Time Series
41
Data obtained from HES: 2009/10
0%
10%
20%
30%
40%
50%
60%
70%
80%
90%
100%
LoS
(day
s) f
or e
mer
genc
y ad
mis
sion
s
>2
2
1
0

QIPP3: Emergency Length of Stay (days) per site
Chart 2: Box and whisker
42
Data obtained from HES: 2009/10
0.0000
1.0000
2.0000
3.0000
4.0000
5.0000
6.0000
7.0000
8.0000
9.0000
10.0000
CHSFT CDDFT GHFT NTHFT NHFT STHFT STFT NUTHFT
0
1
2
3
4
5
6
7
8
9
10
Med
ian
emer
genc
y be
d da
ys
1st quartile to 3rd quartile
Median bed days
Regional Median

QIPP4a: Ambulatory Care Sensitive Cases that are admitted as a proportion of admitted cases per Trust
Table 1: Data
43
Data obtained from HES: 2009/10
Provider October November December January February March FY0910
CITY HOSPITALS SUNDERLAND NHS FOUNDATION TRUST 6.7% 7.0% 6.9% 5.9% 6.0% 0.0% 6.3%
COUNTY DURHAM AND DARLINGTON NHS FOUNDATION TRUST 5.4% 5.2% 5.4% 5.1% 5.3% 4.4% 5.1%
GATESHEAD HEALTH NHS FOUNDATION TRUST 6.3% 6.5% 7.0% 5.8% 5.8% 5.5% 5.8%
NORTH TEES AND HARTLEPOOL NHS FOUNDATION TRUST 5.9% 6.1% 6.6% 6.7% 6.6% 5.5% 6.1%
NORTHUMBRIA HEALTHCARE NHS FOUNDATION TRUST 6.5% 6.8% 6.4% 6.7% 6.1% 6.1% 6.2%
SOUTH TEES HOSPITALS NHS FOUNDATION TRUST 4.7% 4.1% 4.4% 4.4% 3.7% 3.4% 3.9%
SOUTH TYNESIDE NHS FOUNDATION TRUST 8.1% 9.3% 8.2% 7.3% 5.9% 7.2% 7.4%
THE NEWCASTLE UPON TYNE HOSPITALS NHS FOUNDATION TRUST 3.4% 3.3% 3.4% 3.0% 3.2% 2.8% 3.0%
NHS North East 5.4% 5.4% 5.5% 5.1% 4.9% 4.4% 5.0%
NHS National 4.7% 4.6% 4.9% 4.7% 4.4% 4.0% 4.4%

QIPP4a: Ambulatory Care Sensitive Cases that are admitted as a proportion of admitted cases per Trust
Chart 1: Time Series
44
Data obtained from HES: 2009/10
0%
1%
2%
3%
4%
5%
6%
7%
8%
9%
10%
% o
f AC
S a
dm
issi
on
s
Note: Q4 2009/10 data from HES may not be complete.

QIPP4b: - Percentage difference in emergency admissions with an ambulatory care condition compared to national average for each SHAChart 1: Bar Graph
45
-30
-20
-10
0
10
20
30
40
East of England
SHA
South West SHA
South Central SHA
South East Coast SHA
London SHA
East Midlands
SHA
West Midlands
SHA
Yorkshire and the Humber
SHA
North West SHA
North East SHA
Per
cen
tag
e d
iffe
ren
ce
SHA
% Difference 05-06
% Difference 06-07
% Difference 07-08
% Difference 08-09
Data obtained from NHS Comparators Emergency Admission Data

QIPP5: - A & E Attendances, England 1987-88 to 2008-09
Chart 3: Time Series Analysis Data obtained from NHS Comparators Emergency Admission Data
46
1987-88
1988-89
1989-90
1990-91
1991-92
1992-93
1993-94
1994-95
1995-96
1996-97
1997-98
1998-99
1999-00
2000-01
2001-02
2002-03
2003-04
2004-05
2005-06
2006-07
2007-08
2008-090
5000000
10000000
15000000
20000000
25000000
Follow-up AttendencesNew Attendences

47
Anna doing today

DATA SPECIFICATIONSHIGH LEVEL NOTES
Major Trauma
14 June 2010 48
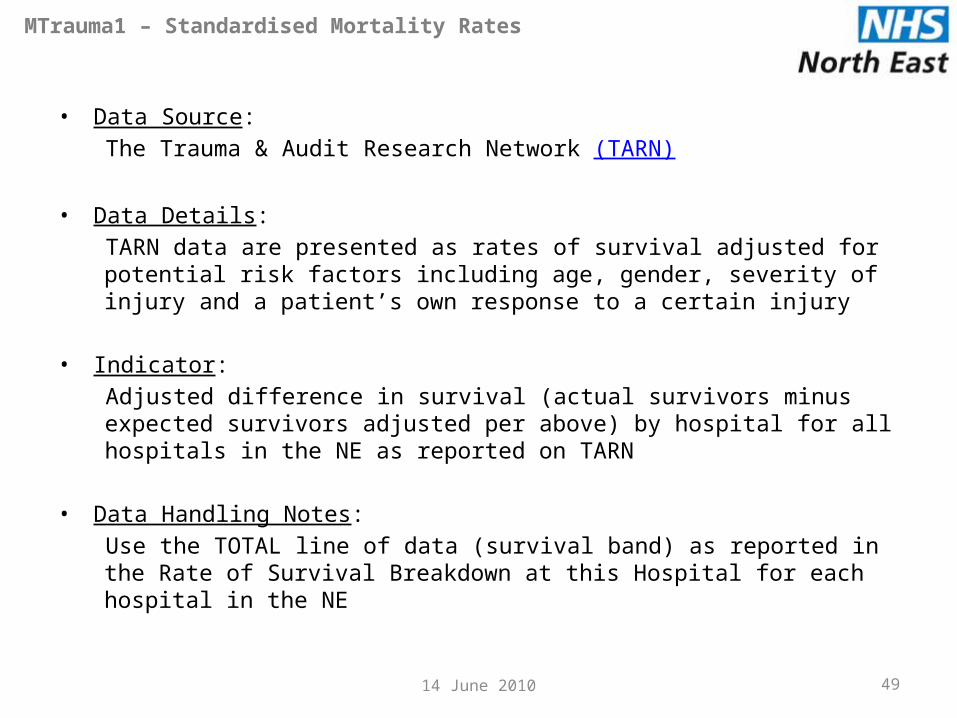
MTrauma1 – Standardised Mortality Rates
• Data Source:The Trauma & Audit Research Network (TARN)
• Data Details:TARN data are presented as rates of survival adjusted for potential risk factors including age, gender, severity of injury and a patient’s own response to a certain injury
• Indicator:Adjusted difference in survival (actual survivors minus expected survivors adjusted per above) by hospital for all hospitals in the NE as reported on TARN
• Data Handling Notes:Use the TOTAL line of data (survival band) as reported in the Rate of Survival Breakdown at this Hospital for each hospital in the NE
4914 June 2010
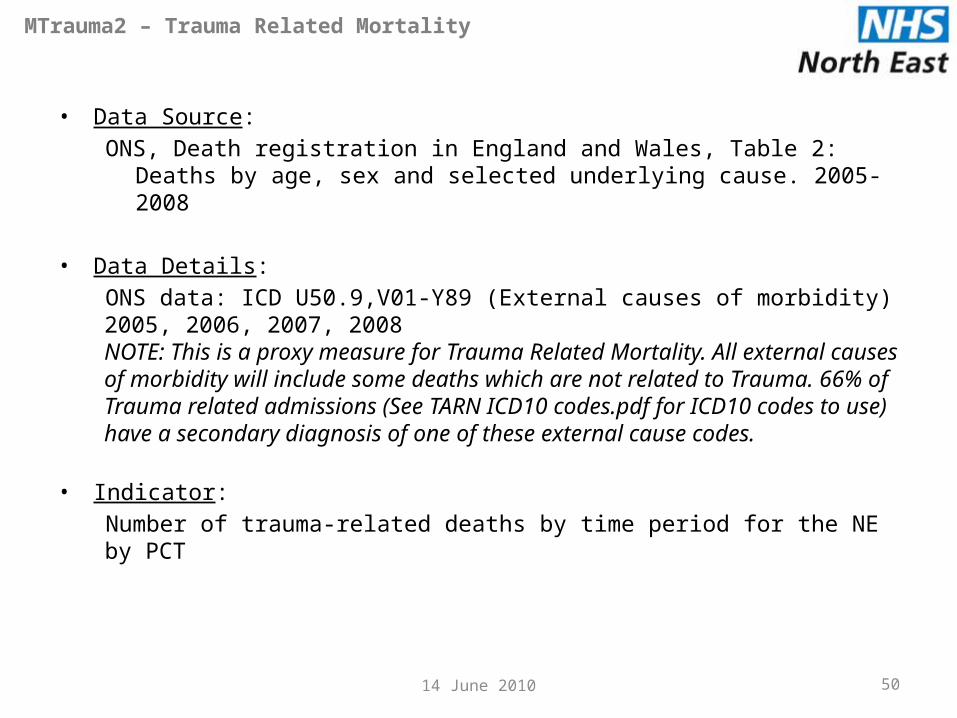
MTrauma2 – Trauma Related Mortality
• Data Source:ONS, Death registration in England and Wales, Table 2: Deaths by age, sex and
selected underlying cause. 2005-2008
• Data Details:ONS data: ICD U50.9,V01-Y89 (External causes of morbidity) 2005, 2006, 2007, 2008NOTE: This is a proxy measure for Trauma Related Mortality. All external causes of morbidity will include some deaths which are not related to Trauma. 66% of Trauma related admissions (See TARN ICD10 codes.pdf for ICD10 codes to use) have a secondary diagnosis of one of these external cause codes.
• Indicator:Number of trauma-related deaths by time period for the NE by PCT
5014 June 2010

MTrauma3 – Number of pre-hospital trauma related deaths
• Data Source:ONS, Death registration in England and Wales, Table 2: Deaths by age, sex and selected underlying cause. 2005-2008HES for deaths in hospital for agreed trauma-related ICD10 codes
• Data Details:a) ONS data for number of trauma-related deathsb) Number of HES episodes with discharge method (dismeth) = 4 (died), Primary diagnosis (diag01) in list (See TARN ICD10 codes.pdf for ICD10 codes to use)
• Indicator:Number of pre-hospital trauma-related deaths
• Data Handling Notes:Number of pre-hospital trauma-related deaths calculated by subtracting trauma-related in-hospital deaths from total number of trauma-related deaths per ONS
5114 June 2010

MTrauma4 – Variation in secondary transfers by site
• Data Source:HES 2009/10
• Data Details:Link episodes where:o end date of discharge episode = start date of next admission episode (transfer)
linked by pseudo HES IDo admimeth of next episode = 81 (transfer of any admitted patient from another
hospital provider other than in an emergency)o Dismeth of first episode not equal to 4 (died)o Primary diagnosis (diag01) and first secondary diagnosis code (diag02), if required,
for both episodes in the list of trauma-related ICD10 codes
• Indicator:Number of trauma-related episodes with admission method equal to transfer from another hospital divided by Number of trauma-related episodes for all admission methods by acute trust (or hospital site if the data support)
• Data Handling Notes:5214 June 2010

MTrauma5 – Percent of trauma episodes per acute trust
• Data Source:HES 2009/10
• Data Details:Number of episodes by month by site where primary diagnosis (diag01) in list of trauma-related ICD10 codes (and first secondary diagnosis code (diag02), as required)
• Indicator:Number of trauma episodes per acute trust (or acute trust as the data support) divided by all episodes
• Data Handling Notes:
5314 June 2010

MTrauma6 – Length of stay for major trauma admissions by acute trust
• Data Source:HES 2009/10
• Data Details:Compute bed days (discharge date minus admission date) for all episodes by month by site where primary diagnosis (diag01) and first secondary diagnosis (diag02), as required, in list of trauma-related ICD10 codes
• Indicator:LoS classification (0d, 1d, 2d, and >2d) – show total number of episodes by classification value for HES year 2009/10
5414 June 2010

MTrauma7 – Variation in total rehab bed days per site
• Data Source:HES for agreed trauma-related ICD10 codes
• Data Details:Compute rehab (identified by HRG codes) bed days (discharge date minus admission date) for all episodes by month by site where primary diagnosis (diag01) in list of trauma-related ICD10 codes
• Indicator:Mean (or median) rehab bed days by site (or acute trust as data support) for all episodes with trauma-related ICD10 codes by month
• Data Handling Notes: Compute national mean (or median) for benchmarking purposes
5514 June 2010

MTrauma8 – Ratio of rehab episodes / number of trauma episodes by site
• Data Source:HES for agreed trauma-related ICD10 codes
• Data Details:Number of episodes by month by site where primary diagnosis (diag01) in list of trauma-related ICD10 codesNumber of rehabilitation episodes (identified by HRG codes) by month by site where primary diagnosis (diag01) in list of trauma-related ICD10 codes
• Indicator:Ratio of rehab trauma episodes to total number of trauma episodes
• Data Handling Notes:
5614 June 2010

DATA SPECIFICATIONSHIGH LEVEL NOTES
Sepsis
14 June 2010 57

Sepsis1a: Number of deaths due to Sepsis in the North East
• Data Source:ONS, Death registration in England and Wales, Table 2: Deaths by age, sex and
selected underlying cause. 2005-2008
• Indicator:Number of Deaths relating to Septicaemia – ICD10 codes: A40-A41
• Data Handling Notes:Data is available at the local authority level, mapped to Acute Trust using “Mapping
tool - Local Authority (Single Tier & District, 354) to Acute Trust (152)” Ver 3 (07/04/2009). Jon White, Office of the Chief Analyst, Department of Health.
58
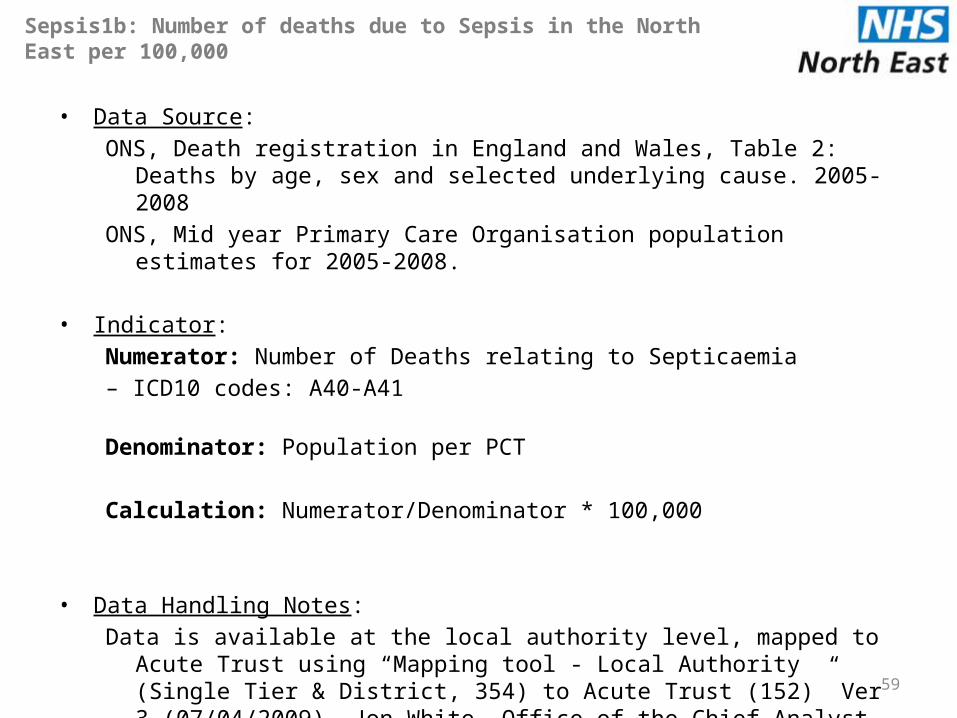
Sepsis1b: Number of deaths due to Sepsis in the North East per 100,000
• Data Source:ONS, Death registration in England and Wales, Table 2: Deaths by age, sex and
selected underlying cause. 2005-2008ONS, Mid year Primary Care Organisation population estimates for 2005-2008.
• Indicator:Numerator: Number of Deaths relating to Septicaemia – ICD10 codes: A40-A41
Denominator: Population per PCT
Calculation: Numerator/Denominator * 100,000
• Data Handling Notes:Data is available at the local authority level, mapped to Acute Trust using “Mapping
tool - Local Authority (Single Tier & District, 354) to Acute Trust (152)” Ver 3 (07/04/2009). Jon White, Office of the Chief Analyst, Department of Health.
59

Sepsis1c: Number of in hospital deaths related to Sepsis in the North East
• Data Source:Hospital Episode Statistics (HES) 2009/10
• Indicator:Number of in-hospital deaths relating to Septicaemia – Any Diagnosis = Septicaemia (in ICD10 codes: A40-A41)– Method of discharge = died : (dismeth = 4)
60

Sepsis2a: Number of ICU bed days for Sepsis related admissions
• Data Source:Hospital Episode Statistics (HES) 2009/10
• Indicator:Number of ICU bed days relating to Septicaemia – HRG code = WA03V (Septicaemia with Major CC) or WA03X (Septicaemia with Intermediate CC)
• Data Handling Notes:Compute bed days (discharge date minus admission date) for all episodes by Trust where HRG is WA03V or WA03X
61

Sepsis2b: Number of bed days for all Sepsis related admissions
• Data Source:Hospital Episode Statistics (HES) 2009/10
• Indicator:Number of in-hospital deaths relating to Septicaemia – Any Diagnosis = Septicaemia (in ICD10 codes: A40-A41)
• Data Handling Notes:Compute bed days (discharge date minus admission date) for all episodes by Trust where any diagnosis is Septicaemia
62

Sepsis3: Cost of Sepsis related admissions
• Data Source:Hospital Episode Statistics (HES) 2009/10
• Indicator:Number of in-hospital deaths relating to Septicaemia – Any Diagnosis = Septicaemia (in ICD10 codes: A40-A41)
• Data Handling Notes:???
63

DATA SPECIFICATIONSHIGH LEVEL NOTES
QIPP
14 June 2010 64

QIPP1a – Number of emergency admissions per Acute Trust
• Data Source:HES 2009/10
• Data Details:ADMIMETH = 21, 22, 23, 24 or 28 (emergency admission method), and CLASSPAT = 1 (patient classification)
• Indicator:a) Number of episodes resulting from emergency admissions by Acute Trustb) Proportion of emergency admissions versus all admissions by Acute Trust
6514 June 2010

QIPP1b – Proportion of emergency admissions versus all admission by Acute Trust
• Data Source:HES 2009/10
• Data Details:ADMIMETH = 21, 22, 23, 24 or 28 (emergency admission method), and CLASSPAT = 1 (patient classification)
• Indicator:a) Number of episodes resulting from emergency admissions by Acute Trustb) Proportion of emergency admissions versus all admissions by Acute Trust
6614 June 2010

QIPP2a – 28d emergency re-admission rate per Acute Trust
• Data Source:NHS Comparators
• Data Details:Data is taken from NHS Comparators, Provider View – Across Secondary Care – Emergency Readmissions within 28 Days of Discharge
See https://www.nhscomparators.nhs.uk/NHSComparators/ProviderResults.aspx for more detailed indicator definition
6714 June 2010
QIPP2b – Proportion of 28d emergency re-admissions per Acute Trust vs all emergency admissions
• Data Source:NHS ComparatorsHES 2009/10
• Data Details:NHS Comparator Data is taken from NHS Comparators, Provider View – Across Secondary Care – Emergency Readmissions within 28 Days of Discharge
See https://www.nhscomparators.nhs.uk/NHSComparators/ProviderResults.aspx for more detailed indicator definition
6814 June 2010

QIPP3 – Emergency Length of Stay per site
• Data Source:HES 2009/10
• Data Details:ADMIMETH = 21, 22, 23, 24 or 28 (emergency admission method), and CLASSPAT = 1 (patient classification)Compute LoS = discharge date – admission date for each episode
• Indicator:Frequency counts of 1d, 2d, and >2d LoS by Acute Trust
• Data Handling Notes:Create Los categories of 1d, 2d, and >2d
6914 June 2010

QIPP4 – Ambulatory care sensitive as a % of admitted cases per site
• Data Source:HES 2009/10
• Data Details:CLASSPAT = 1Primary diagnosis (diag01) in agreed list of ICD10 codes
• Indicator:Number of ACS admissions (based on diag01) divided by total admissions by Acute Trust
• Data Handling Notes:
7014 June 2010

DATA SPECIFICATIONSDETAILED NOTES
71