ascade icrotech, nc. 2005 annual report€¦ · officer, the carlson group of companies raymond a....
TRANSCRIPT

Cascade Microtech, Inc.2430 NW 206th AvenueBeaverton, Oregon 97006, USA Phone: 503-601-1000 Fax: 503-601-1002Europe: +44 1295-812828 Japan: +81 3-5478-6100Singapore: +65 6873 7482China: +8621 6340 4183
Email: [email protected] www.cascademicrotech.com
CMI-AR-0406
Copyright © 2006 Cascade Microtech, Inc. MicroChamber,
FemtoGuard, AttoGuard, Air Coplanar, EZ Probe, Eye-Pass,
Infinity Probe and the Cascade Microtech logo are trade-
marks of Cascade Microtech, Inc. All other trademarks are
the property of their respective owners.
Cascade Microtech, Inc.
2005 Annual Report
603675a1.indd 3-4603675a1.indd 3-4 4/4/06 8:37:51 PM4/4/06 8:37:51 PM

To Our Shareholders:
In 2005, our first full year as a public company, we are pleased to report that we achieved record revenue and profitability. Highlights for 2005 include:
• Revenues of $73.6 million, up 14% year over year• Engineering Products Division revenue grew 9% year over year • Production Probes Division revenue grew 69% year over year • Strong profitability with EPS of $0.70 per diluted share • Cash and investments at the end of the year were $51.9 million, up $5.4 million
from the end of last year
For the year, production probe card revenues were a record $10.1 million, up 69% over $5.9 million in 2004. We experienced strong demand from our customers in all geographical regions and expect the strong growth in production cards to continue during 2006.
The value propositions driving our Pyramid Probe growth are several unique advantages that reduce the cost of production testing, including unmatched parallelism for wirebonded chips, consistent electrical contact with less chip damage, long production lifetimes, and about ten times the electrical performance of any other production probe card. Many of our Pyramid cards are enabling known-good die measurements for system-in package and RF module applications.
We have invested heavily in our Pyramid Probe technology, and we expect to add significant Pyramid manufacturing capacity during 2006. To meet our customers’ emerging requirements, we are also pursuing an exciting Pyramid product roadmap, and we have increased R&D spending to address these requirements.
In our Engineering Products Division, revenues were $63.6 million in 2005, up 9% over $58.5 million in 2004. Our engineering probing tools continue to be the performance leader in the industry, which has helped us to grow our already high market share. These electrical metrology systems are used for process characterization, device characterization and modeling, reliability studies, and yield and failure analyses. Our customers continue to create new processes that shrink transistors and their interconnect wiring, increasingly requiring new materials. We see this increasing chip complexity as a continuing positive trend driving our engineering business.
Among other new product introductions in 2005, we introduced our first standard product offering for the life sciences research market, the L-Series Microfluidics Metrology System, which received a Product of the Year award from Electronics Products magazine.
In summary, we had a very good 2005. We achieved record earnings for the year and record revenues overall. We continued to serve a very broad and well-diversified customer list (over 800 customers during 2005). We continued to strengthen our management team and our sales channels. We have increased the portion of revenue from consumables, and we have shown financial leverage as we’ve grown probe card revenues.
I would like to personally thank our customers, partners, employees and board for helping to achieve these results. And finally, on behalf of your board and Cascade’s employees we would like to thank you for your support. We are optimistic about our prospects for 2006 and we look forward to your continued support.
Eric W. StridChairman, President and Chief Executive Officer
Executive ManagementEric W. StridCo-founder, Chairman, President and Chief Executive Officer
K. Reed GleasonCo-founder, Vice President, Advanced Development
Bruce A. McFaddenVice President, General Manager, Pyramid Probe Division
John E. PenceVice President, General Manager, Engineering Products Division
Steven SipowiczVice President, Finance and Chief Financial Officer
Board of Directors Eric W. StridCo-founder, Chairman, President and Chief Executive Officer
K. Reed GleasonCo-founder, Vice President, Advanced Development
Keith L. BarnesChairman, Chief Executive Officer, Electroglas, Inc.
F. Paul CarlsonPresident and Chief Executive Officer, The Carlson Group of Companies
Raymond A. LinkExecutive Vice President and Chief Financial Officer, FEI Company
George P. O’LearyFormer President and Chief Operating Officer, Floating Point Systems
William R. SpiveyRetired President and Chief Executive Officer, Luminent, Inc.
Transfer Agent and RegistrarMellon Investor Services LLC480 Washington BoulevardJersey City, New Jersey 07310-1900800-522-6645
Independent AuditorKPMG LLP1300 SW Fifth Avenue, Suite 3800Portland, Oregon 97201
Annual Meeting of Stockholders3 p.m., Friday, May 19, 2006Corporate Headquarters2430 NW 206th AvenueBeaverton, Oregon 97006
Corporate HeadquartersCascade Microtech, Inc.2430 NW 206th AvenueBeaverton, Oregon 97006503-601-1000www.cascademicrotech.com
Stock ListingNasdaq Stock ExchangeSymbol: CSCD
603675a1.indd 1-2603675a1.indd 1-2 4/4/06 8:37:49 PM4/4/06 8:37:49 PM

UNITED STATES SECURITIES AND EXCHANGE COMMISSION
WASHINGTON, D. C. 20549 FORM 10-K
____________________ [X] ANNUAL REPORT PURSUANT TO SECTION 13 OR 15(d) OF THE
SECURITIES EXCHANGE ACT OF 1934 For the Fiscal Year Ended: December 31, 2005
OR
[ ] TRANSITION REPORT PURSUANT TO SECTION 13 OR 15(d) OF THE SECURITIES EXCHANGE ACT OF 1934
Commission File Number: 000-51072
CASCADE MICROTECH, INC. (Exact name of registrant as specified in its charter)
Oregon 93-0856709
(State or other jurisdiction of incorporation or organization) (I.R.S. Employer Identification No.)
2430 N.W. 206th Avenue Beaverton, Oregon
97006
(Address of principal executive offices) (Zip Code)
Registrant's telephone number, including area code: (503) 601-1000
Securities registered pursuant to Section 12(b) of the Act: None Securities registered pursuant to Section 12(g) of the Act: Common Stock, $0.01 par value
____________________ Indicate by check mark if the Registrant is a well-known seasoned issuer, as defined in Rule 405 of the Securities Act. Yes [ ] No [X] Indicate by check mark if the Registrant is not required to file reports pursuant to Section 13 or Section 15(d) of the Act. Yes [ ] No [X] Indicate by check mark whether the registrant (1) has filed all reports required to be filed by Section 13 or 15(d) of the Securities Exchange Act of 1934 during the preceding 12 months (or for such shorter period that the registrant was required to file such reports), and (2) has been subject to such filing requirements for the past 90 days: Yes [X] No [ ] Indicate by check mark if disclosure of delinquent filers pursuant to Item 405 of Regulation S-K is not contained herein, and will not be contained, to the best of registrant's knowledge, in definitive proxy or information statements incorporated by reference in Part III of this Form 10-K, or any amendment to this Form 10-K. [X] Indicate by check mark whether the registrant is a large accelerated filer, an accelerated filer or a non-accelerated filer. See definition of “accelerated filer” and “large accelerated filer” in Rule 12b-2 of the Exchange Act. Large accelerated filer [ ] Accelerated filer [X] Non-accelerated filer [ ] Indicate by check mark whether the registrant is a shell company (as defined in Rule 12b-2 of the Act). Yes [ ] No [ X] The aggregate market value of the voting and non-voting common equity held by non-affiliates of the registrant was $77,669,883, computed by reference to the last sales price ($14.60) as reported by the Nasdaq SmallCap System, as of the last business day of the Registrant’s most recently completed second fiscal quarter (June 30, 2005). The number of shares outstanding of the registrant's common stock as of March 9, 2006 was 11,406,549 shares.
Documents Incorporated by Reference
Portions of the registrant’s definitive Proxy Statement for the 2006 Annual Shareholders’ Meeting are incorporated by reference into Part III.

CASCADE MICROTECH, INC. 2005 FORM 10-K ANNUAL REPORT
TABLE OF CONTENTS
Page PART I Item 1. Business 2 Item 1A. Risk Factors 11 Item 1B. Unresolved Staff Comments 24 Item 2. Properties 24 Item 3. Legal Proceedings 25 Item 4. Submission of Matters to a Vote of Security Holders 25 PART II Item 5. Market for Registrant’s Common Equity, Related Stockholder Matters and Issuer Purchases
of Equity Securities
25 Item 6. Selected Consolidated Financial Data 26 Item 7. Management’s Discussion and Analysis of Financial Condition and Results of Operations 27 Item 7A. Quantitative and Qualitative Disclosures About Market Risk 38 Item 8. Consolidated Financial Statements and Supplementary Data 39 Item 9. Changes in and Disagreements With Accountants on Accounting and Financial Disclosure 39 Item 9A. Controls and Procedures 39 Item 9B. Other Information 41 PART III Item 10. Directors and Executive Officers of the Registrant 41 Item 11. Executive Compensation 42 Item 12. Security Ownership of Certain Beneficial Owners and Management and Related Stockholder
Matters
42 Item 13. Certain Relationships and Related Transactions 42 Item 14. Principal Accountant Fees and Services 42 PART IV Item 15. Exhibits and Financial Statement Schedules 42 Signatures 44
1

PART I ITEM 1. BUSINESS Forward-Looking Statements This Annual Report on Form 10-K and the documents incorporated herein by reference contain forward-looking statements within the meaning of the Private Securities Litigation Reform Act of 1995. All statements other than statements of historical fact made in this Annual Report on Form 10-K are forward-looking, including, but not limited to, statements regarding industry prospects; future results of operations or financial position; our expectations and beliefs regarding future revenue growth; the future capabilities and functionality of our products and services, our strategies and intentions regarding acquisitions; the outcome of any litigation to which we are a party; our accounting and tax policies; our future strategies regarding investments, product offerings, research and development, market share, and strategic relationships and collaboration; our dividend policies; and our future capital requirements. These statements relate to future events or our future financial performance. In some cases, you can identify forward-looking statements by terminology, including “intend,” “could,” “may,” “will,” “should,” “expect,” “plan,” “anticipate,” “believe,” “estimate” “predict,” “potential,” “future,” or “continue,” the negative of these terms or other comparable terminology. These statements are only predictions. Actual events or results may differ materially from those expressed or implied in such forward-looking statements. In evaluating these statements, you should specifically consider various factors, including the risks listed in Item 1A below. We do not guarantee future results, levels of activity, performance or achievements. We do not intend to update any of the forward-looking statements after the date of this document to conform them to actual results or to changes in our expectations. Overview We design, develop and manufacture advanced wafer probing solutions for the electrical measurement of high performance chips. We design, manufacture and assemble our products in Beaverton, Oregon, with global sales, service and support centers in North America, Europe, Japan and Singapore. We were incorporated and introduced our first commercial products in 1984. Our products include engineering probe stations, analytical probes, production probe cards, application software and services. Engineering probe stations address the need for precise and accurate measurement of semiconductor electrical characteristics during chip design or when optimizing the chip fabrication process. Our engineering probe stations are highly configurable and are typically sold with various accessories, including our analytical probes and application software, as well as accessories from third parties. In addition, we design and build custom engineering probe stations to address the specific requirements of our customers. Analytical probes are used as consumable components of our engineering probe stations. Our production probe cards are designed and sold for production test applications, ranging from very low current parametric testing to sophisticated, high speed radio frequency testing. We refer to analytical probes and production probe cards as consumables, as they are routinely replaced during the testing process. We also generate revenue through the sale of service contracts to our customers. To date, we have derived the majority of our revenue from the sale of our engineering probe stations, and we expect to continue to do so for the next few years. Our production probe card revenue, however, has increased as a percentage of total revenues in 2005 and we expect that trend to continue in 2006. Where You Can Find More Information We file annual, quarterly and current reports, proxy statements and other information with the Securities and Exchange Commission (“SEC”) under the Securities Exchange Act of 1934 as amended (the “Exchange Act”). You can inspect and copy our reports, proxy statements, and other information filed with the SEC at the SEC’s Public Reference Room in Washington, D.C. Please call the SEC at 1-800-SEC-0330 for further information on the Public Reference Room. The SEC
2

maintains an Internet Web site at http://www.sec.gov/ where you can obtain some of our SEC filings. In addition, you can inspect our reports, proxy materials and other information at the offices of the Nasdaq Stock Market at 1735 K Street NW, Washington D.C. 20006. We also make available free of charge on our website at www.cascademicrotech.com our annual report on Form 10-K, quarterly reports on Form 10-Q, current reports on Form 8-K, and amendments to those reports filed or furnished pursuant to Section 13(a) or 15(d) of the Exchange Act as soon as reasonably practicable after they are filed electronically with the SEC. You can also obtain copies of these reports by contacting Investor Relations at 503-601-1000. Industry Background During the last decade, growth in the computer, telecommunications, consumer and industrial electronics markets has increased demand for chips. The Semiconductor Industry Association estimates that worldwide semiconductor sales totaled $227 billion in 2005 and are expected to grow to $309 billion in 2008. To reduce the cost and increase the performance of electronic products, chips have become smaller and faster and incorporate greater levels of functionality at a lower price. Advancements in manufacturing technologies, such as smaller chip elements, new materials, and larger wafer sizes have permitted manufacturers to meet these requirements. However, these advancements in chip manufacturing technologies have led to increasing challenges in the design, manufacturing and testing of chips. Chips are measured and tested multiple times throughout the design and manufacturing process to ensure the integrity of the chip design and the quality of the manufacturing process. Chip testing that occurs during design or in support of production is referred to as engineering test. Chip testing that occurs during manufacturing is referred to as production test. Engineering test involves performing a wide variety of highly precise measurements during chip research and development activities on a low volume of chips. Production test, in contrast, involves performing a targeted set of tests at a rapid rate on a high volume of chips. Our engineering products business and operating results depend in significant part on the level of capital expenditures related to semiconductor research and development, which, in turn, depends upon current and anticipated market demand for chips. Historically, the semiconductor industry has been highly cyclical with recurring periods of over-supply, which has often resulted in a reduction in demand for our products. While our financial results are impacted by cycles within the semiconductor industry, we believe our business cycles are typically less pronounced than those of other semiconductor equipment companies. We believe this is due to our greater reliance on our customers’ research and development capital spending and usage of test consumables rather than on our customers’ spending to increase production capacity. Capital spending aimed at increasing production capacity is one of the first areas in which most semiconductor manufacturers reduce spending in an industry downturn. Products We design, manufacture and sell multiple product lines, including engineering probe stations, analytical probes, production probe cards, application software, and various services. An engineering probe station is used in conjunction with our application software and analytical probes to test chips in wafer form, together forming an engineering probing system. Analytical probes electrically connect test equipment to the chips under test and are sold as consumable components of, and are mounted into, engineering probe stations. Engineering probing systems are required in the development of new generations of chip processes and designs, and we expect that the demand for engineering probing systems will continue to grow approximately at the rate of worldwide semiconductor revenues. The process development complexities and costs have continually increased as each generation of semiconductor process has required the integration of more layers of smaller chip elements incorporating a longer list of new materials. Engineering probing systems are a basic tool for characterizing and verifying the electrical performance, reliability, and repeatability of the new chip elements.
3

Engineering Probe Stations. We offer engineering probe stations for 300mm, 200mm and 150mm or smaller wafer sizes. Engineering probe stations are highly configurable depending upon the size and type of wafer, the particular characteristics of the chip that the customer is testing, the required measurements, the temperatures at which the chip is tested and the test equipment that the customer is using. Our engineering probe stations are available in either manual or semiautomatic versions. We also offer many probe station accessories, including thermal control systems, special cables and connectors, microscopes, lasers, cameras and other items.
300mm wafer technology more than doubles the available area on a wafer, increasing the number of chips per wafer and reducing per unit manufacturing costs compared to 200mm wafers. While many industry players continue to ramp up 300mm wafer volumes, high conversion costs combined with continued process developments on 200mm wafers continue to make sales of our non-300mm probing systems an important component of our revenue stream for the foreseeable future.
In early 2005 we introduced the Pureline option for our 200mm and 300mm probe stations. Pureline extends the low-current and low-voltage measurement capabilities of these stations, thus extending our performance and technology lead vs. competitive stations. In mid-2005 we introduced a new microscope product for our 300mm and 200mm probe station families we call the eVue microscope. This is a high-performance digital microscope with advanced and unique navigation and probing-specific features. eVue enables us to address and differentiate our offerings in new application segments within engineering wafer probing. One of our stated growth strategies is to work with strategic partners to deliver new solutions, and the eVue microscope is the result of one such relationship. Another of our stated growth strategies is to expand our end-market opportunities. In mid-2005 we announced the L-Series platform, our first standard products for life sciences applications. For several years biological researchers have been one of the niche groups using our engineering probe stations. These customers require sophisticated microscopy, sample environment control, electrical probing and mechanical manipulators. The L-Series adds to these capabilities microfluidic ports for delivery of precise quantities of liquids for microfluidics research.
Analytical Probes. We offer over 50 different analytical probe models primarily for engineering
test. The newer Infinity series probes are designed with unique probe tips derived from our proprietary lithographic manufacturing technology, and offer exceptional electrical contact on aluminum and copper pads. While our analytical probes are used primarily for engineering test, several of our analytical probes are also used in production testing of some high-frequency devices. In 2005 we continued to add new models of analytical probes that address higher frequency and higher complexity measurements.
Application Software. Our proprietary WinCal software is specifically designed to facilitate and improve the user’s productivity during set-up, calibration and data-logging to perform sophisticated high frequency measurements accurately and reliably. During 2005 we introduced and began shipping our new platform, WinCal2006, which significantly enhances WinCal’s measurement capabilities and improves user productivity in making complex measurements.
Services. In addition to routine installation services at the time of sale, we offer services to enable our customers to maintain and more effectively utilize our equipment, probes and software and to enhance our customer relationships. Production Probe Cards. The fastest growing segment of our business is our production probe cards, also known as Pyramid probe cards. A probe card temporarily connects one or more chips on a wafer under test to a production tester. Probe cards are customized for each new chip type and physically wear out during usage in production testing. Depending upon the test environment, production probe cards may last for several hundred thousand to roughly 1 to 2 million contact cycles. Production card sales are driven by production unit volumes of the IC’s being tested.
4

One of our stated growth strategies is to grow the sales of consumables. In 2005, our probe card revenues were up 69% over 2004, comprising approximately 14% of total 2005 revenue. We achieved growth in demand from our customers in all geographical regions and expect the growth in production cards to continue during 2006. As chip makers continue to decrease the cost of fabricating chip elements by about 25-30% per year, production test departments must similarly reduce chip test costs. A common strategy today is to increase the number of chips tested simultaneously, or parallel test. At the production wafer probe stage memory chips are typically tested 64 to 200 at a time. Comparatively, logic and mixed-signal chips are typically tested 2 to 8 at a time due to the higher number of connections per chip, increased test complexities, and in many cases, lower unit volumes. We focus our production probe card applications exclusively on logic and mixed-signal chip testing.
The value propositions driving our Pyramid Probe growth are several unique advantages that reduce the cost of production testing. First, Pyramid Probes provide a solid solution for decreased test costs through increased parallelism in logic test, an application that has become increasingly problematic for conventional cantilever probe cards on wirebonded chips. Second, for smaller and thinner chip pads Pyramid provides consistent electrical contact with less pad damage, especially for chips with low-k dielectrics or requiring higher reliability. Third, the cost of ownership of Pyramid cards is often lower than for conventional cards. Fourth, for RF or wireless chip applications Pyramid technology allows test speeds ranging to well above 20 GHz, which is many times the electrical performance of any other production probe card. Other benefits include superior electrical contact, less probe card maintenance, and less tester downtime for probe cleaning or repair.
The chips tested by Pyramid Probe cards were originally limited to mostly high-speed communications chips and wireless chips, where testing benefited from the unique electrical performance. Pyramid sales for chips used in wireless and RF applications, such as cellular phones, wireless LAN, or Bluetooth products, continue to increase strongly due to the growth of those end applications as well as the trend to more thoroughly test these chips at the wafer level before assembling them into more expensive modules. The other major Pyramid application today is parallel test of wirebonded logic chips for a wide range of end applications. Such chips include various microcontrollers, digital signal processors, data converters, power management chips, application-specific standard products (“ASSPs”) and others. Customers and Geographic Revenue Our products are used by semiconductor manufacturers, test subcontractors, research organizations and designers. Fabless semiconductor suppliers do not manufacture their own semiconductors but they purchase our analytical probes and engineering probe stations for research and development and purchase, or direct their foundries to purchase, our Pyramid Probe cards to test chips manufactured for them. We have built strong relationships with our customers through frequent interactions over the past 20 years. To foster stronger customer relationships, we conduct analyses for the needs of our customers’ new labs or products, seminars on topics such as measurement techniques, and proactive service calls. This close interaction has helped us build a consistently loyal customer base. More than 800 customers purchased our products in 2005. Our top 20 end-user customers during 2005 were: Agilent, Broadcom, Chartered Semiconductor, Freescale, Fujitsu, Hitachi, Hynix Semiconductor, IBM, Infineon, Intel, Micron Technology, NEC, Raytheon, RF Micro Devices, Samsung, Sony, Spansion, ST Microelectronics, Taiwan Semiconductor Manufacturing Company and Texas Instruments. We believe our customers consider timely customer service and support to be an important aspect of our relationship. Our engineering probe stations are installed at customer sites either by us, our manufacturers’ representatives or our distributors, depending on the complexity of the installation and the customer’s geographic location. We assist our customers in the selection, integration and use of our products by providing engineering application support. We also provide worldwide on-site training, seminars and telephone support. Our manufacturers’ representatives and distributors provide additional service and support.
5

In 2005 and 2004, no single customer accounted for 10% or more of our total revenues. In 2003, sales of our products to IBM represented 11% of our total revenue. Our top 10 customers accounted for approximately 33%, 34%, and 34% of our total revenue in each of 2005, 2004 and 2003, respectively. International sales accounted for more than 50% of our total revenue in each of 2005, 2004 and 2003. Two foreign countries, Japan and Taiwan, had revenues that totaled 10% or more of our total revenues in 2005, 2004 or 2003. Geographic revenue was as follows (in thousands):
Year Ended December 31, 2005 2004 2003 United States $ 23,877 $ 24,762 $ 24,708 Japan 15,085 14,909 11,838 Taiwan 7,612 6,853 3,631 Other 27,063 17,891 10,379 $ 73,637 $ 64,415 $ 50,556 Segments The segment data below is presented in the same manner that management organizes the segments for assessing certain performance trends. Our Chief Operating Decision Maker monitors the revenue streams of engineering products and Pyramid probe products. The following table summarizes revenue for each of our business segments. We do not track our operating income or assets on a segment level, and, accordingly, that information is not provided (in thousands): Year Ended December 31, Revenue from sales to external customers 2005 2004 2003 EPD (Engineering Products Division) $ 63,566 $ 58,467 $ 47,345 PPD (Pyramid Probe Division) 10,071 5,948 3,211 $ 73,637 $ 64,415 $ 50,556
We are not able to provide revenue by product line or group of similar products within a division as it would be impracticable to do so. Technology We are a leading innovator in developing electrical measurement, or metrology, and production test tools. One of our stated growth strategies is to continue to develop next-generation technologies. We have focused our research and development efforts on enabling our customers to take more precise electrical measurements in less time, on smaller and more dense devices, and with more robustness. Our core technologies include:
• Broadband/High-Frequency/High Speed Interconnects and Probing. In 1983, our founders created the first microwave analytical probes that enabled the first on-wafer 18 GHz measurements and accelerated the commercialization of gallium arsenide chips. We use and maintain a wide variety of design, verification, fabrication and calibration technologies for high-frequency probes and interconnections. For example, we have developed a complete library of high-frequency circuit elements for our Pyramid probe layouts, similar to passive element libraries for chip foundries. We believe that these technologies provide a competitive advantage by allowing us to more effectively design and commercialize production probe cards and analytical probes.
• Precise Low-Level Measurements. In 1993, we were first to commercialize a shielded probe station utilizing our patented MicroChamber technology that increased thermal measurement productivity by 10 times and current measurement resolutions by 1,000 times. Many of our engineering probe stations feature MicroChambers, which ensure a dark, electrically noise-free measurement environment to enable low-current measurements over a wide thermal
6

range. Our engineering probe stations also incorporate our proprietary low-noise thermal chuck technologies that increase measurement integrity and reduce the time required to take precise measurements. These features, in turn, increase the number of chips that can be tested or measured in a given amount of time. During 2005 we introduced our Pureline option, which implements our latest probe station technologies for improved low-current and low-voltage measurements.
• Microfabrication. Since 1990, we have shipped products that utilize our proprietary lithographic manufacturing processes for depositing, lithographic patterning, etching and plating probe structures on flexible substrates that are similar to the processes used in making chips. Our proprietary Pyramid technology has been under development since 1992 and continues to evolve and improve. At the center of a Pyramid probe card, tester connections converge on the chips under test through our unique, lithographically defined microscopic probe tips and electrical interconnection wiring. We print the patented probe tips and interconnects on a flexible substrate in much the same manner as chips or circuit boards are printed, but with our unique materials and probe designs. Our processing continues to mature and evolve, enabling faster delivery times, larger probe areas, smaller tip dimensions and interconnects, and wider test temperature ranges. As chip elements continue to shrink, we expect to be able to scale and evolve our lithographic processes to continue to meet our customers’ requirements.
Sales and Marketing We sell our engineering probe stations, analytical probes and production probe cards through a combination of manufacturers’ representatives, distributors and direct sales people. Manufacturers’ representatives are independent third parties that agree to sell our products at our prices and on terms set by us, in return for a commission based on sales. We typically use manufacturers’ representatives in areas that we believe require greater levels of customer support than we can deliver from our sales offices. Distributors purchase our products and resell them at prices and upon terms set by the particular distributor. We typically use distributors where local regulations or business customs require local stocking of service parts, more immediate service support or other local services. Finally, our direct sales force is made up of our salaried employees. In North America and Asia, excluding Japan, Singapore and Malaysia, we sell our products through manufacturers’ representatives and a direct sales force. In Japan, we sell through Cascade Microtech Japan, K.K., our direct sales and service subsidiary. In Singapore and Malaysia, we sell through our branch office, Cascade Microtech Singapore. We are currently in the process of establishing a distribution sales office in China and a direct sales office in Taiwan. In Europe, we primarily sell through distributors and manufacturers’ representatives managed by Cascade Microtech Europe, Ltd., our direct sales and service subsidiary in the United Kingdom. We also sell certain products directly in Germany, Austria, Switzerland France, the Benelux countries, Italy and Spain. In other countries, we typically sell through manufacturers representatives or distributors. Our sales managers oversee and manage these worldwide sales activities. We work closely with our customers to select the most appropriate product or to configure a custom solution to best fit their applications. Sales of our engineering test solutions require significant interaction with our customers’ engineering labs and knowledge of their product development schedules and systems, as well as on-site demonstration capability. We also may assist our customers in the design requirements for their products to enhance testability. Sales of our production test solutions require significant interaction with customer production test managers, knowledge of their specific product details and hands-on application support, particularly for new customers. Our production customers generally undertake an extensive evaluation of new probe technology before adoption. Our sales managers are experienced sales professionals with in-depth technical training, customer knowledge and industry expertise. The technical sophistication of our products requires substantial training for our manufacturers’ representatives, distributors and sales staff. We devote considerable effort and resources to developing a highly trained sales force that is responsive to our customers’ changing needs.
7

We focus our marketing efforts on building awareness of our products among designers and manufacturers of complex semiconductors. We market our products and capabilities by participating in trade shows, providing product and technical information in print and on our website, hosting technical and product seminars, advertising in trade publications and using direct mailings. In addition, our marketing staff performs market research and product planning. We also participate in joint sales and marketing activities with complementary equipment and software vendors to offer our customers complete test solutions. These relationships benefit us because they can lead to broader awareness and increased sales of our products. Research and Development Our industry is subject to rapid technological change and new product introductions and improvements. Our continued investment in research and development and timely introduction of new products and services is critical to maintaining and improving our competitive position. Our growth depends upon our ability to rapidly develop new products that enable customers to improve their electrical, optical and mechanical measurements and increase their productivity. As a result, we expect to continue to devote substantial resources to research and development. Our research and development expenses were $7.0 million in 2005, $5.7 million in 2004 and $5.4 million in 2003. These amounts are net of customer reimbursements of $0, $94,000 and $248,000, respectively, in 2005, 2004 and 2003 for work on a joint project. We did not expend material amounts on customer-sponsored research and development in 2005, 2004 or 2003. In addition, we do not currently have any agreements with third parties for joint research and development projects. We are currently devoting substantial resources to projects such as releasing new Pyramid Probe products and manufacturing processes, developing faster, higher accuracy analytical probes and enhancing the functionality of our 300mm engineering probe stations. At December 31, 2005, we employed 45 research and development engineers. We conduct research and development for all of our product lines at our Beaverton, Oregon facilities. Manufacturing and Assembly Our manufacturing and assembly operations consist of the production of highly complex and sophisticated components and assemblies, some of which are customized to meet customers’ needs and specifications. We perform nearly all of our manufacturing and assembly in Beaverton, Oregon at our manufacturing facility within our headquarters building, at our Pyramid Probe microfabrication and assembly facility and at our machine shop. Our microfabrication facility includes a 10,000 square foot clean room. Our manufacturing strategy is to purchase components from vendors to the extent possible. However, we manufacture key components that we deem to be proprietary or that provide us with a competitive advantage. We depend on limited source suppliers for some materials, components and subassemblies used in our products. Our product design and manufacturing process activities emphasize accurate electrical measurements, precise and reliable mechanical components and assemblies, and compliance with industry and governmental safety requirements. We prototype and test our new standard product designs and components to ensure high electrical signal integrity, mechanical accuracy and safety. In our manufacturing operations, we perform electrical, mechanical and chemical tests and use statistical process control methods, internally developed manufacturing information systems and inspections of purchased components and products to monitor our product quality throughout the various stages of our manufacturing process. When fully equipped and staffed, the capacity of our probe card microfabrication facility is estimated to be about $40 million annually with our current probe card product mix. We are currently using less than one third of the facility’s capacity. In the near term, our probe card growth rate, therefore, relies on our ability to recruit and train enough top-quality people for product fulfillment and field support. We have stepped up our recruiting efforts and we expect to make further investments in equipment to expand production run rates during 2006.
8

Competition The markets for engineering probe stations, analytical probes and production probe cards are highly competitive. We anticipate that the markets for our products will continually evolve and be subject to rapid technological change.
Engineering Probe Stations. Our primary competitor in the engineering probe station market is Suss MicroTec AG (Karl Suss), but we also compete with Bekutasemikon K.K., Lucas/Signatone Corporation, The Micromanipulator Company Inc. and Wentworth Laboratories Inc., among others. We believe that the primary competitive factors in the engineering probe station market are measurement accuracy and versatility, measurement speed, automation features, completeness of the measurement solutions, applications support, delivery time and price. We compete favorably with respect to these factors, except in small niche markets where customers seek solutions that provide highly specialized testing environments.
Analytical Probes. Our primary competitor in the analytical probe market is GGB Industries. We believe that the primary competitive factors in this market are breadth of probe types, probe frequency and electrical signal integrity, contact integrity and the related cleaning required, calibration support, applications support, delivery time and price. We compete favorably with respect to these factors, except in small niche markets where customers seek solutions that provide highly specialized testing environments.
Production Probe Cards. Competition in the production probe card market is fragmented and characterized by many suppliers offering products based on differing technologies. Our Pyramid Probe cards compete with product offerings of other probe card vendors including Feinmetall GmbH, FormFactor Inc., GGB Industries Inc., Japan Electronic Materials Corporation, Mesatronics S.A., Micronics Japan Company, Ltd., MicroProbe Inc., Micro Square Technology Inc., PHICOM Corporation, SV Probe Inc., Technoprobe S.r.l., Tokyo Cathode Laboratory Company Ltd., Wentworth Laboratories Inc. and others. At least three probe card vendors, FormFactor Inc., Mesatronics S.A. and PHICOM Corporation, are also offering probe cards built using types of lithographic patterning. The high capital investment and other costs associated with the development of lithographically defined probe cards and the time and high cost of customer evaluation, represent a significant barrier to entry for this type of technology. We believe that the primary competitive factors in the production probe market depend upon the type of chip being tested, but include customer service, delivery time, price, probe card lifetime, chip damage, application support, probe tip touch-down accuracy, speed and frequency of the probe card, number of chips contacted in parallel, number of probe tips and their layout, signal integrity, and frequency and effectiveness of cleaning required. We believe that we generally compete favorably in probe cards for high frequencies and high-speed signals, and in probe cards for parallel testing of chips with densely-packed bond pads. We generally do not compete in applications that require very large probe areas, such as memory test, or that require delivery times of less than two weeks, or that require very high currents, such as some microprocessors. Intellectual Property Our success in large part depends on our proprietary technology. We do not depend on any one individual patent, instead relying on intellectual property, including patents and trade secrets, covering electrical measurement reliability and integrity, electrical shielding and the Pyramid Probe contact structure and production process. As of December 31, 2005, we had 88 issued patents and 50 pending patent applications in the U.S. and 55 issued foreign patents and 74 pending foreign patent applications. In addition, we regard certain of our processes, information and know-how that we have developed and used to design and manufacture our products as proprietary trade secrets. One important group of our patents claims technology relating to electrical shielding and other inventions required to measure extremely small signals on wafers. Most of these U.S. patents will expire between 2012 and 2015. Another important group of our patents claims designs and construction methods for probe tips on Pyramid probes. These patents will expire beginning in 2016.
9

Our policy is to seek patents where appropriate on inventions involving new products and improvements to existing products as part of our ongoing engineering and research and development activities. We cannot assure you that any of our pending patent applications will be approved, that we will develop additional proprietary technology that is patentable, that any patents owned by or issued to us will provide us with competitive advantages or that these patents will not be challenged by third parties. Furthermore, there can be no assurance that third parties will not design around our patents. We also use certain patented technology of third parties in the manufacture of our products pursuant to license agreements. Pursuant to an agreement with Micronics Japan Company Ltd. and Hewlett-Packard Japan Ltd. (now Agilent Technologies), our subsidiary, Cascade Microtech Japan, Inc. and its affiliates, have been granted a non-exclusive worldwide license to make, have made, use, lease, sell, or otherwise transfer certain products that make use of patented technology relating to electric circuit measurement apparatuses. In exchange for the rights granted under the license, we pay royalties to Micronics Japan Company Ltd. and Agilent Technologies based on the number of products sold or leased. Our license will expire upon the expiration of the patent covering the licensed technology, which will occur in June 2013. Seasonality In the past, our business has experienced seasonality. Typically, our revenue has been lower in our fiscal first quarter than in our fiscal fourth quarter preceding it. However, revenue in the first quarter of 2005 was greater than the revenue in the fourth quarter of 2004 as strength in the Asian market outweighed the seasonality factors. We also expect our revenue in the first quarter of 2006 to be greater than our revenue in the fourth quarter of 2005 due to delays in closing certain orders in the fourth quarter of 2005. In addition, as is typical in our industry, we recognize a large percentage of our quarterly revenue in the last month of the quarter. Employees As of December 31, 2005, we had a total of 287 employees: 45 in engineering and research and development; 159 in manufacturing; and 83 in selling, general and administrative functions. Of these employees, 252 were located in the U.S., 17 were in Japan, 8 were in Great Britain, 7 were in Singapore, 1 was in Canada and 2 were in Taiwan. Many of our employees are highly skilled and our future performance depends largely on our ability to continue to attract, train and retain qualified technical, sales, service, marketing and managerial personnel. None of our employees is subject to a collective bargaining agreement. We have not experienced any work stoppages and consider our relations with our employees to be good. Environmental Matters As part of our manufacturing operations, we have handled and continue to handle materials that are considered hazardous or toxic under federal, state and local laws and regulations, and we are subject to environmental laws and regulations related to the use, storage, discharge, disposal and human exposure to such materials. We believe we are in material compliance with the environmental laws and regulations applicable to the conduct of our business and operations. However, there can be no assurance that violations of environmental laws or regulations will not occur in the future as a result of human error, equipment failure or other causes. The risk of a release of hazardous or toxic materials cannot be completely eliminated, and if such a release occurs, we could be held financially responsible for the cleanup or other consequences of the release. We are not aware of any releases at any of our facilities that could reasonably be expected to result in any material liabilities to us. In addition, the European Parliament has finalized the Restriction on Use of Hazardous Substances Directive, or RoHS Directive, which restricts the sale of new electrical and electronic equipment containing certain hazardous substances, including lead, which is currently used in some of the products we manufacture. We are working to modify our manufacturing processes to eliminate lead from products we put on the market by July 1, 2006 as required by the RoHS Directive. This may require us to make additional capital expenditures. In addition the costs associated with compliance may negatively impact our earning and competitive position. We are also working with our suppliers to redesign or reformulate their components containing lead to reduce or eliminate lead in our
10

products. Further, we are working with selected customers who specify and/or provide specific components used in some of our products to choose components that comply with the RoHS Directive. Based upon current information available to us, we believe that we will be able to comply with RoHS Directive within the applicable time period. However, if we do not comply with this Directive, we may suffer a loss of revenue, be unable to sell in certain markets or countries and suffer competitive disadvantage. The European Parliament has also recently finalized the Waste Electrical and Electronic Equipment Directive, or WEEE Directive, which makes producers of electrical and electronic equipment financially responsible for specified collection, recycling, treatment and disposal of past and future covered products. As a producer of industrial electronic equipment, we may incur financial responsibility for the collection, recycling, treatment or disposal of products covered under the WEEE Directive. Our products have been labeled in accordance with the WEEE Directive since before August 13, 2005, the WEEE implementation date. We determined the products we presently produce are exempt because they either meet the definition of “Large Scale Industrial Equipment,” or are passive or non-electrical accessories that do not function on their own. We have not incurred any costs or fees or penalties associated with non-compliance through March 3, 2006. Therefore, we have some confidence that we are interpreting the rules correctly. However, because the EU member states have not fully implemented the WEEE Directive, the nature and extent of the costs to comply and fees or penalties associated with non-compliance are still unknown at this time. Costs to comply with the WEEE Directive and similar future legislation, if applicable, may also include legal and regulatory costs and insurance costs. We may also be required to take reserves for costs associated with compliance with these regulations. We are subject to potentially conflicting and changing regulatory agendas of political, business and environmental groups and governmental priorities concerning environmental laws and regulations. We may be required to incur substantial costs to comply with current or future environmental laws or regulations, and our operations, business or financial condition could be adversely affected by such requirements. Backlog Our backlog consists of purchase orders we have received for products and services with scheduled delivery dates that we expect to ship and deliver or perform within the next 12 months. At December 31, 2005 our backlog was $10.7 million compared with $12.1 million at December 31, 2004. We generally ship our products within two months of receipt of a customer’s purchase order. Accordingly, we expect to deliver nearly all of our December 31, 2005 backlog in 2006. Customers may cancel or delay delivery on previously placed orders, although our standard terms and conditions include penalties for cancellations made close to the scheduled delivery date. As a result, the timing of the receipt of orders or the shipment of products could have a significant impact on our backlog at any date. In addition, a significant portion of our revenue is generated from orders received and products shipped within a quarter. For this and other reasons, the amount of backlog at any date is not necessarily indicative of revenue in future periods. ITEM 1A. RISK FACTORS Our operating results have fluctuated in the past and are likely to fluctuate in the future, which could cause us to miss analyst expectations about these results and cause the trading price of our common stock to decline. Our operating results have fluctuated in the past and are likely to continue to fluctuate. As a result, we believe that you should not rely on period-to-period comparisons of our financial results as an indication of our future performance. Factors that are likely to cause our revenue and operating results to fluctuate include:
• our geographic sales mix, product sales mix and average selling prices; • timing, cancellation or delay of customer orders;
11

• seasonality, which has caused our first quarter revenue typically to decline compared to our fourth quarter revenue of the previous year;
• customer demand, which is influenced, in part, by conditions in the electronics and semiconductor industry, demand for products that use semiconductors and market acceptance of our products and those of our customers;
• fluctuations in foreign currency exchange rates; • competition, such as competitive pressures on the price, performance and reliability of our
products, the introduction or announcement of new products by us or our competitors and our competitors' intellectual property rights, which could prevent us from introducing products that compete effectively with their products;
• our production capacity and availability and cost of materials, components and subassemblies;
• our ability to deliver reliable products in a timely manner, including as a result of fluctuations in yield on some of our product lines;
• our customers’ decisions regarding the level and timing of research and development spending;
• our product development costs, including research and development and sales and marketing expenses associated with new products or product enhancements and the costs of transitioning to new or enhanced products; and
• economic conditions in the United States and the worldwide markets we serve. For example, a large majority of our revenue in the last five years was derived from the research and development equipment spending of companies in the semiconductor industry or, to a much lesser extent, various research organizations, including universities, that conduct research that benefits the semiconductor industry. Our customers’ spending on research and development is roughly proportional to the customers’ overall revenues. Historically, semiconductor industry revenues have been highly cyclical. According to industry data, the semiconductor industry has experienced four significant cyclical downturns in the 22 years from 1983 through 2005. For example, our revenue increased approximately 37% from 1999 to 2000. In contrast our revenue decreased approximately 29% from 2001 to 2002 and increased approximately 27% and 14% from 2003 to 2004 and 2004 to 2005, respectively. Given this history, there is no reason to expect that our customers’ business and, therefore, their demand for our products, will be less cyclical in the future. If our revenue or operating results fall below the expectations of analysts or investors, the market price of our common stock could decline substantially. The cyclicality of the semiconductor industry affects our financial results, and, as a result, we may experience reduced sales or operating losses in a semiconductor industry downturn. The semiconductor industry is highly cyclical with recurring periods of wide fluctuations in product supply and demand. From time to time, this industry has experienced significant downturns, often in connection with, or in anticipation of, periods of oversupply, maturing product and technology cycles, excess inventories and declines in general economic conditions. Our customers’ purchase behavior in response to these cycles has been generally unpredictable. In the past, our operating results have been adversely affected by the cyclical downturns in the semiconductor industry. Our business is heavily dependent on the level of research and development spending of our customers, the volume of semiconductor production by semiconductor manufacturers, the development of new semiconductors and semiconductor designs and the overall financial strength of our customers, which, in turn, depend upon the current and anticipated market demand for semiconductors and the products incorporating them. Semiconductor manufacturers in particular are known to sharply curtail their capital expenditures when confronted with an industry downturn, such as the downturns experienced from 1996 through 1998 and from 2001 through the first six months of 2003. We expect that the markets for future generations of semiconductors will also be subject to similar fluctuations. Furthermore, some segments of the semiconductor industry may experience greater fluctuations than others. We may not achieve or maintain our current or prior levels of
12

revenue growth. Any factor adversely affecting the semiconductor industry in general, or the particular segments, regions or major customers of the industry that our products target, will adversely affect our ability to generate revenue and could cause us to experience operating losses. As is the case with other companies in our industry, many of our customers defer purchasing decisions until late each quarter. As a result, we are significantly dependent upon the sale of our products in the third month of each quarter, and, if we do not generate enough revenue in the third month of each quarter to meet the earnings expectations of analysts or investors, the price of our common stock could decline. As is the case with other companies in our industry, we have historically recognized a substantial portion of our revenue in the last month of each quarter because many of our customers defer purchasing decisions until late each quarter. Historically, we have often recognized more than 50% of our quarterly revenue in the third month of the quarter. We expect this trend to continue for the foreseeable future. As a result, our ability to meet the earnings expectations of analysts depends on our ability to not only generate customer orders in the third month of each quarter but also satisfy each of the various accounting requirements for recognizing the revenue generated by such sales prior to the end of the quarter. Moreover, our engineering probe stations typically range in price from $30,000 to $350,000 for a single unit, so a delay in the shipment of even one engineering probe station and the corresponding delay in recognition of revenue for the sale of probe stations, can have a very large impact on our quarterly results. If we are unable to generate a sufficient amount of sales during the last month of the quarter or if we are unable to recognize the revenue generated by sales made during this period, we could miss the earnings expectations of analysts or investors, which could cause the price of our common stock to decline. Because we generally do not have a sufficient backlog of unfilled orders to meet our quarterly revenue targets, revenue in any quarter is substantially dependent upon customer orders received and fulfilled in that quarter. Our revenue is difficult to forecast because we generally do not have a sufficient backlog of unfilled orders for our engineering probe stations, analytical probes and production probe cards to meet our quarterly revenue targets at the beginning of a quarter. Historically, a significant portion of our revenue in any quarter depends upon customer orders that we receive and fulfill in that quarter. Furthermore, because our expense levels are based in part on our expectations as to future revenue and, to a large extent, are fixed in the short term, we might be unable to adjust spending in time to compensate for any unexpected shortfall in revenue. Accordingly, any significant shortfall in revenue in relation to our expectations and the expectations of analysts or investors could hurt our operating results and result in a decline in the price of our common stock. For example, in the fourth quarter of 2005, several large orders related to sales of our S300 systems were delayed, which resulted in a decline in our fourth quarter 2005 revenue below our expectations and a consequent decline in our operating profit for the quarter. We continue to devote significant effort and resources to the growth and development of our Pyramid Probe products, which has had, and could continue to have, an adverse effect on our operating margins. Our future growth depends, in part, on continued market adoption of, and growing demand for, our production probe cards. Large-scale market adoption of these products will depend on our ability to demonstrate the superior reliability and cost effectiveness of these products to potential customers and on the continued growth of the market for high-speed or complex chips. Production customers are generally very risk-averse when adopting new technologies that could affect their production output, especially a sole source supplier such as we are in the case of Pyramid Probes. We have devoted significant resources to the development and growth of these products in the past, and expect to devote significantly more investment in the form of people and equipment during 2006. If our production probe cards are not adopted in the market at a rate that is sufficient to offset the costs
13

and resources that we devote to the development and promotion of these products, the future growth of our overall business and our operating margins would be adversely affected. If we do not keep pace with technological developments in the semiconductor industry, especially the trend toward faster, smaller and lower cost chips, our revenue and operating results could suffer as potential customers decide to adopt our competitors’ products. We must continue to invest in research and development and certain manufacturing capabilities to improve our competitive position and to meet the testing needs of our customers. Our future growth depends, in significant part, on our ability to work effectively with and anticipate the testing needs of our customers and on our ability to develop and support new products and product enhancements to meet these needs on a timely and cost-effective basis. Our customers’ testing needs are becoming more challenging as the semiconductor industry continues to experience rapid technological change driven by the demand for complex chips that have smaller element sizes and at the same time are increasing in speed and functionality and becoming less expensive to produce. Our customers expect that they will be able to integrate our wafer probing products into their design and production processes as soon as they are deployed. Therefore, to meet these expectations and remain competitive, we must continually design, develop and introduce on a timely basis new products and product enhancements with improved features. Successful product development and introduction on a timely basis require that we:
• design innovative and performance-enhancing features that differentiate our products from those of our competitors;
• identify emerging technological trends in our target markets, including new engineering and production test strategies;
• respond effectively to technological changes or product announcements by others; and • adjust to changing market conditions quickly and cost-effectively.
If we are unable to timely predict industry changes, or if we are unable to modify our products on a timely basis, we might lose customers or market share, and our operating results could suffer. We cannot assure you that we will successfully develop and bring new products to market in a timely and cost-effective manner, that any product enhancement or new product developed by us will gain market acceptance or that products or technologies developed by others will not render our products or technologies obsolete or uncompetitive. There is no assurance that products recently introduced for micro-fluidics research for the life sciences industry will generate revenues and profits. We have recently introduced new products for micro-fluidics research for the life sciences industry. To date there has been no significant revenue from these products and there can be no assurance that significant revenues will be achieved by this product line in the future. In addition, we cannot assure you that we shall bring new products for this industry to market in a timely and cost-effective manner and that any new product will gain market acceptance. Intense competition in the semiconductor wafer probing business may reduce demand for our products and reduce our sales. The markets for our products are highly competitive, and we expect competition to continue in the future. We believe that our principal competitors are the major providers of probe stations, production probe cards and analytical probes. Our primary competitor in the probe station market is Suss MicroTec AG (Karl Suss), but we also compete with Bekutasemikon, K.K., Lucas/Signatone Corporation, The Micromanipulator Company Inc., and Wentworth Laboratories Inc., among others. Our Pyramid Probe cards compete with product offerings of other probe card vendors including Feinmetall GmbH, FormFactor Inc., GGB Industries Inc., Japan Electronic Materials Corporation, Mesatronics S.A., Micronics Japan Company, Ltd., MicroProbe, Inc., Micro Square Technology Inc., PHICOM Corporation, SV Probe, Technoprobe S.r.l., Tokyo Cathode Laboratory Company, Ltd., Wentworth Laboratories Inc. and others. At least three probe card vendors, FormFactor Inc.,
14
Mesatronics S.A. and PHICOM Corporation, are also offering probe cards built using types of lithographic patterning. Our primary competitor in the analytical probe market is GGB Industries. These competitors or other potential competitors may have developed or may be developing technology of which we are unaware that may render our products uncompetitive. Some of our competitors have significantly greater financial, technical and marketing resources than we do. As a result, these competitors may be able to respond more quickly to new or emerging technologies and changes in customer requirements, to devote greater resources to the development, promotion and sale of their products or to deliver competitive products at lower prices. We cannot assure you that we will maintain our current competitive position or that our production probe cards will achieve widespread acceptance in the market. Finally, increased competition could result in pricing pressures, reduced sales, reduced margins or failure to achieve or maintain widespread market acceptance for our products, any of which could prevent us from growing our business. We obtain some of the materials, components and subassemblies used in our products from a single source or a limited group of suppliers. If these suppliers are unable to provide us with these materials, components or subassemblies in adequate quantities and on a timely basis, we may be unable to manufacture our products or meet our customers’ needs. We obtain some of the materials, components and subassemblies used in our products from a single source or a limited group of suppliers. Certain of our product purchases for 2005 were from sole source suppliers. Although we were not forced to delay shipment of any product due to delays in 2005 related to such suppliers, from time to time, we may experience difficulties in obtaining these materials, components and subassemblies from some suppliers, especially during periods of high demand for semiconductor capital equipment. The manufacture of some of the materials, components and subassemblies that we use in our products, such as thermal chucks and microscopes, is a complex process, and in the event that we cannot obtain an adequate supply of these components, it would be difficult and time-consuming to identify and qualify new suppliers. If some of the materials used in our lithographic probe manufacturing process become unavailable, it would be costly and time consuming to identify and qualify new suppliers. Moreover, many of these suppliers are small companies that may be more susceptible to downturns in general economic conditions, thereby increasing the risks of product and shipment delays, increased costs or loss of suppliers. Finally, we do not have written agreements with any of these suppliers to guarantee the supply of these products. The delay in shipments from, or complete loss of, any one of these suppliers could prevent us from producing and shipping our products, resulting in delayed or lost orders for our products and damage to our customer relationships, which would harm our results of operations. Furthermore, a significant increase in the price of one or more of these materials, components or subassemblies could materially adversely affect our results of operations. We depend upon the sale of our engineering probe stations for a significant portion of our revenue, and a decline in demand for our engineering probe stations would have a more significant impact on our revenue than a downturn in demand for our analytical probes or production probe cards. Historically, we have derived a large majority of our revenue from the sale of our engineering probe stations. We anticipate that sales of our engineering probe stations will continue to represent a large majority of our revenue for the next few years. Our business depends in large part upon continued demand in current markets for, and adoption in new markets of, current and future generations of our engineering probe stations. In addition, while our analytical probes are sometimes sold to serve as components of test equipment manufactured by third parties, they are most often sold for use with our engineering probe stations. Continued market adoption depends upon our ability to increase customer awareness of the benefits of our engineering probe stations and to prove their reliability and cost effectiveness.
15

We may be unable to sell our engineering probe stations to existing and potential customers if those customers change their chip test strategies, change their capital equipment buying strategies or chose not to change or upgrade their existing test equipment. We might not be able to sustain or increase our revenue from sales of our engineering probe stations, particularly if conditions in the semiconductor market deteriorate or if the market enters into another downturn. In addition, sales of our engineering probe stations depend in part upon the level of research and development spending in the semiconductor industry. Historically, the level of research and development spending in the semiconductor industry has followed the overall cycles of the semiconductor industry but at a reduced rate of growth or decline, as the case may be. If our customers reduce their research and development spending or if the overall level of research and development spending in the semiconductor industry does not continue to follow the growth rate of the overall semiconductor industry, consistent with historical patterns, our revenue would decline, which could result in a decline in the price of our common stock. We believe that we currently have a significant market share in the engineering probe station market. As a result, it may be difficult for us to both maintain our current level of market share and capture opportunities for growing our market share, especially if the market for engineering probe stations does not continue to grow as we expect. If the market for engineering probe stations does not continue to grow, our business may not expand, even if we are successful in increasing our market share. We may make future acquisitions, which may be costly, difficult to integrate with our operations, divert management resources and dilute shareholder value. As part of our business strategy, we may make acquisitions of, or investments in, companies, products or technologies that complement our current product offerings, enhance our technical capabilities, expand our operations into new markets or offer other growth opportunities. If we fail to successfully integrate any acquired businesses, products or technologies, we would not achieve anticipated revenue and cost benefits. We may acquire companies, products or technologies in the future, which could pose risks to our operations including:
• difficulties assimilating the acquired operations, personnel, technologies or products into our company;
• diversion of management's attention from our existing business; and • adverse effects on relationships with our existing suppliers, customers or partners.
We face economic, political and other risks associated with our international sales and operations, which could materially harm our operating results. Since 1997, we have derived more than 50% of our annual revenue from sales outside North America, primarily in Japan, other Asian countries and Europe. No individual country within Asia, except Japan and Taiwan, and no individual country within Europe represented 10% or more of total revenue in 2005, 2004 or 2003. Geographic revenue was as follows (in thousands):
Year Ended December 31, 2005 2004 2003 United States $ 23,877 $ 24,762 $ 24,708 Japan 15,085 14,909 11,838 Taiwan 7,612 6,853 3,631 Other 27,063 17,891 10,379 $ 73,637 $ 64,415 $ 50,556
We expect international sales to continue to represent a substantial portion of our revenue for the foreseeable future. In the past, the economic climate in some foreign markets, particularly in Asia, has quickly and dramatically changed, resulting in a negative effect on our operating results. For example, during the Asian economic crisis that began in 1998, we saw a 34% decline in revenue in
16

1998 compared to 1997 from Asia not including Japan. We saw a 41% decrease in revenue from the same region in 2003 compared to 2001. Currently, we maintain international offices in Europe and Asia, and we may establish new international offices in the future. If our gross margin from international operations does not exceed the expense of establishing and maintaining our international operations, our operating margins would be adversely affected. Additional risks we face in conducting business internationally include:
• difficulties and costs of staffing and managing international operations across different geographic areas;
• the possible lack of financial and political stability in foreign countries, preventing overseas sales growth;
• changes in domestic or foreign law or policy resulting in the need to comply with potentially burdensome government controls, regulations, tariffs, embargoes or export license requirements;
• longer payment cycles; • differing and more burdensome labor regulations and practices in Europe; • the aftermath of the war in Iraq or other armed conflicts in the Middle East; • the effects of sudden outbreaks of epidemics in Asia and other parts of the world; and • the effects of terrorist attacks in the United States and any related conflicts or similar events
worldwide. The different cultures in countries where we do business often challenge us to meet or manage local expectations about how employees are hired, managed, compensated, or terminated. For example, most employees in Japan expect an organization wherein a manager's direct reports are younger than the manager. In Europe, governments force the severance costs of a reduction in force action to be generally much higher than in the U.S. Finally, there have been significant fluctuations in the exchange rates between the dollar and the currencies of countries in which we do business. While most of our international sales have been denominated in U.S. dollars, our international operating expenses have been denominated in foreign currencies. As a result, a decrease in the value of the U.S. dollar relative to the foreign currencies could increase the relative costs of our overseas operations, which could reduce our operating margins. Significant unfavorable fluctuations in the exchange rates between the U.S. dollar and foreign currencies could cause us to lower our prices and thus reduce our profitability. In addition, fluctuations in exchange rates could cause customers to delay or cancel orders because of the increased cost of our products relative to those of our competitors who manufacture in other countries. Other income (expense), net in 2005, 2004 and 2003 includes the following currency related gains and losses (in thousands):
Year Ended December 31, 2005 2004 2003 Gains related to foreign currency hedges $ 151,000 $ 74,000 $ 49,000 Remeasurement related foreign currency gains (losses) (34,000) 132,000 318,000 $ 117,000 $ 206,000 $ 367,000
We rely on independent manufacturers’ representatives and distributors for a significant portion of our revenue, and a disruption in our relationship with our manufacturers’ representatives or distributors would have a material adverse effect on our revenue. Approximately 72% of our revenue for 2005 was generated through independent manufacturers’ representatives and distributors, whose activities are not within our direct control. In addition, in some locations, our manufacturers’ representatives and distributors provide field service to our customers. A reduction in the sales efforts or financial viability of these manufacturers’ representatives or distributors, or a termination of our relationship with these representatives or distributors, would have a material adverse effect on our sales, financial results and ability to support our customers. Our manufacturers representatives and distributors are not obligated to continue selling our products, and
17

they may terminate their arrangements with us at any time with limited or no prior notice. If we make the business decision to terminate or modify our relationships with one or more of our independent manufacturers’ representatives, or if a manufacturers’ representative decides to disengage from us, and we do not effectively and efficiently manage such a change, we could lose sales to existing customers and fail to obtain new customers. Establishing alternative sales channels would consume substantial time and resources, decrease our revenue and increase our expenses. If semiconductor manufacturers do not convert to 300mm wafers, or do not convert at the rate we anticipate, our growth and profitability could be harmed. The 2001 to 2003 downturn in the semiconductor industry caused various chip manufacturers to readdress their respective strategies for converting existing 200mm wafer fabrication facilities to 300mm wafer fabrication or for building new 300mm wafer fabrication facilities. Some manufacturers, including some of our customers such as Texas Instruments, Motorola and ST Microelectronics delayed, cancelled or postponed previously announced plans to convert to 300mm wafer fabrication. While we have since then seen an increase in these conversion efforts, these delays have impacted demand for our 300mm probe stations. We believe that the decision to convert to a 300mm wafer fabrication facility is made by each manufacturer based upon both internal and external factors, such as:
• current and projected prices for semiconductors; • projected price erosion for the manufacturer's particular semiconductors; • supply and demand levels for semiconductors; • overall manufacturing capacity within the manufacturer’s target market(s); • the availability of funds to the manufacturer; • the technology roadmap of the manufacturer; and • the price and availability of equipment needed within the 300mm fabrication facility.
One or more of these internal and external factors, as well as other factors, including factors that a manufacturer may choose not to disclose publicly, could impact the decision to maintain a 300mm conversion schedule, to delay the conversion schedule for a period of time or to cancel the conversion. We have invested significant resources to develop technology that addresses the market for 300mm wafers. Beginning in 2003 and continuing into early 2005, we saw an acceleration in the transition from 200mm to 300mm technology but since then the rate of acceleration has declined. If manufacturers delay or discontinue the transition to 300mm wafers, or make the transition more slowly than we currently expect, our growth and profitability could be affected. Failure to retain key managerial, technical, and sales and marketing personnel or to attract new key personnel could harm our business. Our success depends on the continued services of our executive officers and other key management, technical, and sales and marketing personnel and on our ability to continue to attract, retain and motivate qualified personnel. Currently, our key personnel include Eric Strid, our Chairman, President and Chief Executive Officer, Bruce McFadden, our Vice President and General Manager, Pyramid Probe Division, Steven Sipowicz, our Chief Financial Officer, John Pence, our Vice President and General Manager, Engineering Products Division and K. Reed Gleason, our Vice President of Advanced Technology. Our executive officers and other key employees are able to exercise stock options and sell the underlying stock, which may reduce their incentive to continue their employment with us. The loss of key personnel could limit our ability to develop new products and adapt existing products to our customers’ evolving requirements and may result in lost sales and a diversion of management resources. Furthermore, much of our competitive advantage and intellectual property is based on the expertise, experience and know-how of our key personnel. We do not have employment agreements or non-competition agreements with any of our employees except for an employment agreement with our Chief Financial Officer. To support our future growth, we will need to attract and retain additional qualified management, technical, and sales and marketing employees. Competition for such personnel in our industry is intense, and we cannot assure you that we will be successful in attracting and retaining such personnel.
18

Our customers’ evaluation processes can lead to lengthy sales cycles, during which we may incur significant costs that may not result in sales. Our customers typically expend significant efforts in evaluating and qualifying our products prior to placing an order, particularly for orders of engineering probe stations and production probe cards. This evaluation and qualification process frequently results in a lengthy sales cycle, typically ranging from three to 12 months and sometimes longer. During the period in which our customers are evaluating our products, we incur substantial sales, marketing, research and development expenses and expend significant management efforts. After completing this evaluation process, a potential customer may elect not to purchase our products. In addition, product purchases are frequently subject to unplanned processing and other delays, particularly with respect to larger customers for which our products represent a very small percentage of their overall purchase activity. Additional factors, some of which are partially or completely outside our control, that affect the length of time it takes us to complete a sale, include:
• the efforts of our sales force; • the history of previous sales to the customer; • the complexity of the customer’s engineering or production processes; • the internal technical capabilities and sophistication of the customer; and • the capital expenditure budgets of the customer.
The lengthy and unpredictable nature of our sales cycle could result in fluctuations in our operating results, which could fall below the expectations of analysts and investors for any particular period of time, and result in a decline in the price of our common stock. If our products contain defects, our reputation would be damaged, and we could lose customers and revenue and incur warranty expenses. The complexity and ongoing development of our products, as well as the inclusion in our products of components purchased from third parties, could lead to design, manufacturing or performance problems. Our products may contain defects which could cause our sales to decline, our reputation to be significantly damaged and our customers to be reluctant to buy our products, any or all of which could result in a decline in revenue, an increase in product returns, higher field service costs, the loss of existing customers or the failure to attract new customers. Our warranty expense totaled $624,000, $639,000 and $679,000, for 2005, 2004 and 2003, respectively. Although we are not currently seeking reimbursement from any vendors related to our warranty expense, we have in the past, and may again in the future, seek reimbursement from certain vendors. To the extent that we experience additional failures of purchased components that increase our warranty expenses that are not reimbursed by the vendor, our results of operations will be adversely affected. If we fail to protect our proprietary technology and rights, competitors may be able to use our technologies, which would weaken our competitive position and could reduce our sales. Our success and competitive position depend in significant part on the technically innovative features of our products, and, if we fail to protect our proprietary rights, our competitors might gain access to our technology. Although we rely in part on patent, trade secret and trademark laws to protect the proprietary technology used in our products, our patents may be challenged by third parties and held invalid, and any of our pending patent applications may not be approved. Additionally, we may not be able to develop additional proprietary technology that is patentable. Policing unauthorized use of our products is difficult, and we may not be able to prevent the misappropriation and unauthorized use of our technologies. Furthermore, our existing and future patents may not be sufficiently broad to protect our proprietary technologies, may not provide us with competitive advantages and may be circumvented by the designs of third parties.
19

Unauthorized parties may attempt to copy aspects of our products or to obtain and use information that we regard as proprietary. Others may independently develop or otherwise acquire similar or competing technologies or methods or design around our patents. Additionally, some of our proprietary technology cannot be effectively protected by patents. In these cases, we rely on trade secret laws and confidentiality agreements to protect our confidential and proprietary information, processes and technology. However, our confidential and proprietary information, processes and technology could be independently developed by, or otherwise become known to, third parties, which would weaken our competitive position and might reduce our sales. Since 1997, we have derived more than 50% of our annual revenue from products sold to customers outside of North America. The laws of some foreign countries do not protect our proprietary rights to the same extent as the laws of the United States, and many companies have encountered substantial problems in protecting their proprietary rights against infringement in such countries. The manner in which we protect our proprietary rights may not be adequate in some foreign countries. Our failure to adequately protect our intellectual property in foreign countries would make it easier for competitors to copy or circumvent our product designs and sell competing products in those countries, which could adversely affect our revenue and cause us to lose customers. Intellectual property infringement claims by or against us may result in litigation, the cost of which could be substantial and could prevent us from selling our products. The semiconductor industry is characterized by uncertain and conflicting intellectual property claims, frequent litigation regarding patent and other intellectual property rights and vigorous protection and pursuit of these rights. Questions of infringement in the semiconductor industry involve highly technical and subjective analyses. Litigation may be necessary to determine the validity and scope of our proprietary rights or to defend against claims of infringement or invalidity by third parties, and we may not prevail in any litigation. Any such litigation, whether or not determined in our favor or settled, might be costly, could harm our reputation, could cause product shipment delays and could divert the efforts and attention of our management and technical personnel from our normal business operations. We are not currently involved in any such litigation. However, an adverse outcome in any intellectual property litigation might result in the loss of our proprietary rights, subject us to significant liabilities, require us to spend significant resources to develop non-infringing technology, require us to seek licenses from third parties, prevent us from manufacturing and selling our products or require us to discontinue the use of certain technology in our products, any of which could have an adverse effect on our business, financial condition and results of operations. License agreements, if required, might not be available on terms acceptable to us or at all. Our growth could strain our personnel and infrastructure resources, and, if we are unable to implement appropriate controls and procedures to manage our growth, we may not be able to successfully implement our business plan. Our growth has placed and will continue to place significant demands on our management, operational, financial and technical resources and on our internal control, management information and reporting systems. Our success will depend, in part, upon the ability of our senior management to manage this growth effectively. To manage the expected growth of our operations and personnel, we will need to:
• continue to improve our operational, financial and management controls and our reporting systems and procedures;
• manage the growth of different product lines with different cost structures; and • recruit, train, manage and motivate our employees to support our expanded operations.
20

Our success depends on our continued investment in research and development, the level and effectiveness of which could reduce our profitability. We will continue to make investments in research and development to sustain and improve our competitive position and meet our customers’ needs. These investments currently include refining Pyramid Probe fabrication processes, developing higher performance Pyramid Probe cards and enhancing engineering probe stations for both 300mm and sub-300mm wafers. To maintain our competitive position, we may need to increase our research and development investment, which could reduce our profitability. In addition, we cannot assure you that we will achieve a return on these investments, nor can we assure you that these investments will improve our competitive position and meet our customers’ needs. We manufacture nearly all of our products at our Oregon facilities, and any disruption in the operations of these facilities could harm our business. We manufacture almost all of our products in our facilities located in Beaverton, Oregon. Our manufacturing processes are complex and require sophisticated and costly equipment and specially designed facilities. As a result, any prolonged disruption in the operations of our facilities, whether due to technical or labor difficulties or destruction of or damage to the facilities as a result of an earthquake, fire or any other reason, could materially and adversely affect our business, financial condition and results of operations. A disruption in our strategic relationship with Agilent Technologies could have a negative effect on our ability to market our products and could result in a decline in the price of our common stock. We have a longstanding relationship with Agilent Technologies in which we jointly market selected probing solutions, comprised of products from both companies. Consequently, our relationship with Agilent is an important factor in our ability to market our products. Our joint marketing relationship with Agilent is not governed by a contract. Therefore, Agilent could terminate its relationship with us or announce a strategic relationship with one of our competitors at any time. While we do not track the portion of our revenue that is attributable to our joint marketing relationship with Agilent, we believe that a termination of our relationship with Agilent could harm our ability to market our products and could result in a decline in the price of our common stock. Furthermore, in those situations in which a customer purchases our products alongside Agilent’s products, we depend on Agilent’s ability to timely deliver its products to complete the installation of our product. To the extent that there is a delay in the shipment of Agilent’s products, the timing of our revenue could be adversely affected, which could cause us to miss the earnings expectations of analysts and investors and result in a decline in the price of our common stock. We may fail to comply with environmental regulations, which could result in significant costs and harm our business. We are subject to a variety of federal, state and local laws, rules and regulations relating to the storage, use, discharge, disposal and human exposure to hazardous and toxic materials used in our thin-film fabrication facility and other manufacturing operations. The risk of a release of hazardous or toxic materials cannot be completely eliminated, and if such a release occurs, we could be held financially responsible for the cleanup or other consequences of the release. We are not aware of any releases at any of our facilities that could reasonably be expected to result in any material liabilities to us. Our past, present or future failure to comply with environmental laws and regulations could result in enforcement actions, substantial liabilities and suspension of production or cessation of operations in extreme situations. Compliance with current or future environmental laws and regulations could restrict our ability to expand our facilities or build new facilities or require us to acquire additional expensive equipment, modify our manufacturing processes, or incur other substantial expenses which could harm our business, financial condition and results of operation. For
21

example, the European Parliament has finalized the Restriction on Use of Hazardous Substances Directive, or RoHS Directive, which restricts the sale of new electrical and electronic equipment containing certain hazardous substances, including lead, which is currently used in some of the products we manufacture. We are working to modify our manufacturing processes to eliminate lead from products we put on the market by July 1, 2006 as required by the RoHS Directive. We are working with our suppliers to redesign or reformulate their components containing lead to reduce or eliminate lead in our products. Further, we are working with selected customers who specify and/or provide specific components used in some of our products to choose components that comply with the RoHS Directive. For some of our products, substitutions of lead-free components or processes may be difficult or costly, or redesign efforts could result in production delays. The European Parliament has also recently finalized the Waste Electrical and Electronic Equipment Directive, or WEEE Directive, which makes producers of electrical and electronic equipment financially responsible for specified collection, recycling, treatment and disposal of past and future covered products. As a producer of industrial electronic equipment, we may incur financial responsibility for the collection, recycling, treatment or disposal of products covered under the WEEE Directive. These environmental laws and regulations could become more stringent over time, imposing even greater compliance costs and increasing risks and penalties associated with violations, which could seriously harm our business, financial condition and results of operation. There can be no assurance that violations of environmental laws or regulations will not occur in the future as a result of the inability to obtain permits, human error, equipment failure or other causes. Product liability claims may be asserted against us, resulting in costly litigation for which we may not have sufficient liability insurance. Our customers may use our products in the testing of high reliability semiconductors for critical applications such as telecommunications infrastructure, military, medical and aerospace equipment. Defects or other problems with the performance of our products could result in financial or other damages to our customers. In addition, some of our engineering probe stations that use high powered lasers or operate at high voltage or extreme temperatures may cause death or injury to persons utilizing such equipment due to undetected design or manufacturing defects or due to improper use or maintenance by our customers. Although our product invoices and sales contracts generally contain provisions designed to limit our exposure to product liability claims, existing or future laws or unfavorable judicial decisions could negate these provisions. Product liability litigation against us, even if it were unsuccessful, could be time consuming and costly to defend. Additionally, although we carry product liability insurance, in some circumstances it may not cover certain claims or be adequate to cover all claims. We rely on a small number of customers for a significant portion of our revenue, and the termination of any of these relationships would adversely affect our business. Our top four customers accounted for 16% and 18% of our revenue in 2005 and 2004, respectively. Our customers are not obligated by long-term contracts to purchase our products and may discontinue purchasing our products at any time. The semiconductor industry is highly concentrated and a small number of semiconductor manufacturers generally account for a substantial portion of the purchases of semiconductor test equipment, including our products. Consequently, our business and operating results would be materially, adversely affected by the loss of any of our significant customers. In addition, our ability to increase our revenue will depend in part upon our ability to obtain orders from new customers, particularly customers of our production probe cards. Obtaining orders from new customers is difficult because semiconductor manufacturers typically select one vendor's products for testing a particular new generation of chips. Once a manufacturer has selected a vendor, that manufacturer is more likely to continue to purchase products from that vendor for that generation of chips, as well as subsequent generations of chips. We therefore place great emphasis on relationships with our current customers because these customers are difficult to replace. In addition, we focus on leveraging our relationships with current customers to sell into additional engineering
22
labs and production lines in the same company and similar groups in other companies. If we are unable to maintain our relationships with our existing significant customers or to obtain new customers that adopt and implement our products and technology, we will not be able to meet our revenue and growth targets, which could result in a decline in the price of our common stock. Our employment costs in the short-term are, to a large extent, fixed, and therefore, any shortfall in sales would harm our operating results. Our operating expense levels are based, in significant part, on our headcount. For a variety of reasons, particularly the high cost and disruption of layoffs, the costs of recruiting and training new personnel and product delivery and service commitments to our customers, our headcount in the short-term is, to a large extent, fixed. Accordingly, we may be unable to reduce employment costs in a timely manner to compensate for any shortfall in our sales or gross margins, which could materially harm our operating results. The additional costs that we incur as a result of being a public company will affect our operating results. We incurred incremental costs as a public company for additional expenses such as increased auditing and legal fees and director and officer liability insurance, which increased our operating expenses and make it more difficult for us to offset any future revenue shortfalls by offsetting expense reductions in the short-term. In addition, the Sarbanes-Oxley Act of 2002, as well as new rules and regulations subsequently enacted by the Securities and Exchange Commission, or the SEC, and the Nasdaq National Market have imposed new corporate governance requirements for listed companies. We expect these rules to increase our legal and financial compliance costs and to make some activities more difficult, time consuming and costly. We also expect these new rules and regulations to make it more difficult and more expensive for us to obtain director and officer liability insurance, and we may be required to accept reduced coverage or incur substantially higher costs to obtain coverage. These new rules and regulations could also make it more difficult for us to attract and retain qualified members of our board of directors and qualified executive officers. Unanticipated changes in our tax rates or exposure to additional income tax liabilities could affect our profitability. We are subject to income taxes in both the United States and various foreign jurisdictions, and our domestic and international tax liabilities are subject to the allocation of expenses in different jurisdictions. Our effective tax rate could be adversely affected by changes in the mix of earnings in countries with different statutory tax rates, changes in the valuation of deferred tax assets and liabilities, changes in tax laws, including pending tax law changes, such as the benefit from export sales and the research and development credit by material audit assessments. In particular, the carrying value of deferred tax assets, which are predominantly in the United States, is dependent on our ability to generate future taxable income in the United States. In addition, the amount of income taxes we pay could be subject to ongoing audits in various jurisdictions and a material assessment by a governing tax authority could affect our profitability. Our officers and directors and their affiliates will control the outcome of matters requiring shareholder approval. Our executive officers and directors and their affiliates beneficially own approximately 32% of our outstanding shares of common stock. Consequently, these shareholders will have substantial influence over the election of our directors and the outcome of corporate actions requiring shareholder approval, such as a merger or a sale of our company or a sale of all or substantially all of our assets. This concentration of voting power and control could have a significant effect in delaying, deferring or preventing an action that might otherwise be beneficial to our other shareholders and be disadvantageous to our shareholders with interests different from those of our officers, directors and affiliates. These shareholders will also have significant control over our business, policies and affairs.
23

Additionally, this significant concentration of share ownership may adversely affect the trading price for our common stock because investors often perceive disadvantages in owning stock in companies with controlling shareholders. The anti-takeover provisions of our charter documents and Oregon law may inhibit a takeover or change in our control that shareholders may consider beneficial. Provisions of our articles of incorporation and bylaws and provisions of Oregon law may have the effect of delaying or preventing a merger or acquisition of us, making a merger or acquisition of us less desirable to a potential acquirer or preventing a change in our management, even if the shareholders consider the merger or acquisition favorable or if doing so would benefit our shareholders. In addition, these provisions could limit the price that investors would be willing to pay in the future for shares of our common stock. The following are examples of such provisions in our articles of incorporation or bylaws:
• We have a staggered board of directors, which will make it more difficult for a group of shareholders to quickly change the composition of our board.
• Our board of directors is authorized, without prior shareholder approval, to create and issue preferred stock with voting or other rights or preferences that could impede the success of any attempt to acquire us or change our control, commonly referred to as “blank check” preferred stock.
• Members of our board of directors can only be removed for cause. • The board of directors may alter our bylaws without obtaining shareholder approval. • Shareholders are required to provide advance notice for nominations for election to the board
of directors or for proposing matters to be acted upon at a shareholder meeting. • Any action that is taken by written consent of shareholders must be unanimous.
We are also subject to the provisions of the Oregon Control Share Act and the Oregon Business Combination Act, each of which may have certain anti-takeover effects. If our stock price is volatile, securities class action litigation may be brought against us, which could result in substantial costs. In the past, securities class action litigation has often been brought against a company following periods of volatility in the market price of its securities, and newly public companies tend to experience more volatility in their stock price. We may be the target of such litigation in the future. Securities litigation may result in substantial costs and divert management’s attention and resources, which may seriously harm our business. ITEM 1B. UNRESOLVED STAFF COMMENTS None. ITEM 2. PROPERTIES We maintain our corporate headquarters in Beaverton, Oregon. Our primary site contains corporate administration, sales and marketing, design, test, light manufacturing and assembly and various support functions in leased space totaling 102,438 square feet in three adjacent buildings. The space we lease in an adjoining building, totaling 23,000 square feet, is available for sub-lease. This lease expires in June 2008. The lease on the remaining space in a third building expires at the end of January 2007. Under the terms of the lease, current rent on the primary site is approximately $115,000 per month. Our Pyramid Probe manufacturing is conducted in a 10,000 square foot clean room within a 58,817 square foot facility that we lease at a separate site in Beaverton, Oregon. Our lease of this facility expires in August 2009 and current rent is approximately $67,500 per month. Approximately 10,000 square feet of this facility is available for sub-lease. We lease small sales and service offices in Tokyo, Japan, Banbury, England and Singapore.
24

ITEM 3. LEGAL PROCEEDINGS As of the date of filing this Form 10-K, we are not a party to any material legal proceedings. However, the semiconductor test industry is characterized by vigorous protection and pursuit of intellectual property rights and positions. To protect our intellectual property from infringement, we have from time to time initiated litigation against third parties and may be required to do so in the future. We cannot assure you that we will be successful in future intellectual property litigation and this litigation often is protracted and expensive; however, until now we have successfully defended our intellectual property in three lawsuits and successfully defended ourselves in one case of alleged infringement. ITEM 4. SUBMISSION OF MATTERS TO A VOTE OF SECURITY HOLDERS No matters were submitted to a vote of security holders during the fourth quarter of 2005.
PART II ITEM 5. MARKET FOR THE REGISTRANT’S COMMON EQUITY, RELATED STOCKHOLDER
MATTERS AND ISSUER PURCHASES OF EQUITY SECURITIES Our common stock began trading on the Nasdaq National Market System under the symbol “CSCD” on December 15, 2004. The high and low closing sale price of our common stock by quarter from December 14, 2004 through December 31, 2005 was as follows: 2004 High Low Quarter 4 $ 14.14 $ 13.29 2005 High Low Quarter 1 $ 14.03 $ 9.55 Quarter 2 14.60 8.40 Quarter 3 16.00 12.42 Quarter 4 14.72 11.35 As of March 9, 2006, there were 74 shareholders of record. Many shareholders hold their shares in street name. We believe we currently have approximately 1,400 beneficial shareholders. We have not declared or paid any cash dividends on our common stock in the past two years. We currently expect to retain any future earnings to fund the operation and expansion of our business, and therefore, we do not currently expect to pay cash dividends in the foreseeable future. We filed a registration statement on Form S-1, File No. 333-113256 for an initial public offering of common stock, which was declared effective by the Securities and Exchange Commission on December 15, 2004. In that offering, we sold an aggregate of 3.3 million shares of our common stock with net offering proceeds of $41.6 million. As of December 31, 2005, we had used approximately $5.5 million of those proceeds for the repayment of indebtedness. No payments were made to our directors or officers or their associates, holders of 10% or more of any class of our equity securities or to any affiliates. See Item 12. for Equity Compensation Plan Information.
25

ITEM 6. SELECTED CONSOLIDATED FINANCIAL DATA The consolidated statement of operations and balance sheet data set forth below have been derived from our consolidated financial statements. The selected consolidated financial data set forth below should be read in conjunction with “Management's Discussion and Analysis of Financial Condition and Results of Operations” and with the consolidated financial statements and notes thereto included elsewhere in this Form 10-K. For the Year Ended December 31, IN THOUSANDS (except per share amounts)
2005
2004
2003
2002
2001
Statement of Operations Data Revenue $ 73,637 $ 64,415 $ 50,556 $ 51,107 $ 72,296 Cost of sales 39,351 35,625 30,433 33,357 42,055 Stock-based compensation 39 67 19 6 19 Gross profit 34,247 28,723 20,104 17,744 30,222 Operating expenses: Research and development 6,951 5,651 5,407 6,265 7,801 Selling, general and administrative 19,712 16,602 15,293 16,180 17,894 Stock-based compensation 83 259 158 (14) 115 Total operating expenses 26,746 22,512 20,858 22,431 25,810 Income (loss) from operations 7,501 6,211 (754) (4,687) 4,412 Other income (expense), net 1,991 (117) 553 385 429 Income (loss) before income taxes 9,492 6,094 (201) (4,302) 4,841 Provision (benefit) for income taxes 1,173 1,387 248 (2,244) 950 Net income (loss) 8,319 4,707 (449) (2,058) 3,891 Accretion of redeemable stock and loss on redemption
-
113
583
362
358
Net income (loss) attributed to common shareholders
$
8,319
$ 4,594
$
(1,032)
$ (2,420)
$
3,533
Basic net income (loss) per share attributed to common shareholders
$
0.75
$
0.84
$
(0.20)
$ (0.48)
$
0.70
Diluted net income (loss) per share attributed to common shareholders
$
0.70
$
0.56
$
(0.20)
$ (0.48)
$
0.41
Shares used in basic per share calculations
11,055
5,439
5,089
5,015
5,015
Shares used in diluted per share calculations
11,816
8,452
5,089
5,015
9,482
December 31, Balance Sheet Data 2005 2004 2003 2002 2001 Cash, cash equivalents and short-term marketable securities
$
50,346
$
43,747
$
10,717
$
8,632
$
10,950
Working capital 74,601 63,333 24,228 25,573 26,846 Total assets 90,120 79,016 37,766 40,815 43,775 Current portion of long-term debt and capital lease obligations
8
21
2,043
21
122
Long-term debt and capital lease obligations, less current portion
-
14
5,038
25
43
Other long-term liabilities 1,100 1,449 1,398 1,622 1,045 Redeemable stock - - 584 10,152 10,864 Shareholders’ equity 81,505 70,188 22,960 23,848 25,432
26

ITEM 7. MANAGEMENT’S DISCUSSION AND ANALYSIS OF FINANCIAL CONDITION AND RESULTS OF OPERATIONS
You should read the following discussion in conjunction with our consolidated financial statements and notes thereto appearing elsewhere in this Form 10-K. In addition to historical consolidated financial information, the following discussion and analysis contains forward-looking statements that involve risks, uncertainties and assumptions. Our actual results could differ materially from those anticipated by these forward-looking statements as a result of many factors, including those discussed under Item 1A, Part I, “Risk Factors,” and elsewhere in this Form 10-K. We do not guarantee future results, levels of activity, performance or achievements. We do not intend to update any of the forward-looking statements after the date of this document to conform them to actual results or to changes in our expectations. Overview We design, develop and manufacture advanced wafer probing solutions for the electrical measurement of high performance chips. We design, manufacture and assemble our products in Beaverton, Oregon, with global sales, service and support centers in North America, Europe, Japan and Singapore. We were incorporated and introduced our first commercial products in 1984. Our products include engineering probe stations, analytical probes, production probe cards, application software and services. Engineering probe stations address the need for precise and accurate measurement of semiconductor electrical characteristics during chip design or when optimizing the chip fabrication process. Our engineering probe stations are highly configurable and are typically sold with various accessories, including our analytical probes and application software, as well as accessories from third parties. In addition, we design and build custom engineering probe stations to address the specific requirements of our customers. Analytical probes are sold to serve as components of our engineering probe stations, or less often, to serve as components of test equipment manufactured by third parties. Our production probe cards are designed and sold for production test applications, ranging from very low current parametric testing to sophisticated, high speed radio frequency testing. We refer to analytical probes and production probe cards as consumables, as they are routinely replaced during the testing process. We also generate revenue through the sale of service contracts to our customers. To date, we have derived the majority of our revenue from the sale of our engineering probe stations, and we expect to continue to do so for the next few years. Our production probe card revenue, however, has increased as a percentage of total revenues in 2005 and we expect that trend to continue in 2006. Our engineering probe stations, analytical probes, probing accessories and application software are sold through our Engineering Products Division. Our production probe cards are sold through our Pyramid Probe Division. As of January 2005, we collect only revenue information for each division because we believe that the segment data previously collected was not useful for understanding our business and was not useful information on which to base operating decisions. Accordingly, beginning in the first quarter of 2005, the segment reporting financial statement footnote only presents revenue data for each segment. Our engineering products business and operating results depend in significant part on the level of capital expenditures related to semiconductor research and development, which, in turn, depends upon current and anticipated market demand for chips. Historically, the semiconductor industry has been highly cyclical with recurring periods of over-supply, which has often resulted in a reduction in demand for our products. While our financial results are impacted by cycles within the semiconductor industry, we believe our business cycles are typically less pronounced than those of other semiconductor equipment companies. We believe this is due to our greater reliance on our customers' research and development capital spending and usage of test consumables rather than on our customers' spending to increase production capacity. Capital spending aimed at increasing
27

production capacity is one of the first areas in which most semiconductor manufacturers reduce spending in an industry downturn. While the conversion to 300mm technology continues, high conversion costs combined with continued process developments on 200mm wafers continue to make sales of our sub-300mm probing systems an important component of our revenue stream for the foreseeable future. 300mm technology more than doubles the available area on a wafer, significantly increasing the number of chips per wafer and reducing per unit manufacturing costs. Revenue from our 300mm engineering probe stations, including all probes, accessories and other items sold therewith, represented 33.0%, 32.2% and 26.1% of our total Engineering Products Division revenue in 2005, 2004 and 2003, respectively. We sell our products both directly through our own sales force and indirectly through a combination of manufacturers’ representatives and distributors. In North America and Asia, excluding Japan, Singapore and Malaysia, we sell most of our products through manufacturers’ representatives. We sell certain products in these regions directly. In Japan, Singapore and Malaysia, we sell through Cascade Microtech Japan, K.K. and Cascade Microtech Singapore, our direct sales and service subsidiary and branch office, respectively. In Europe, we sell primarily through distributors and manufacturers’ representatives, except in the U.K., where we sell through our direct sales subsidiary, Cascade Microtech Europe, Ltd. We also sell certain products directly in Germany, Austria and Switzerland. In the rest of the world, we typically sell through manufacturers’ representatives or distributors. We are currently in the process of establishing a distribution sales office in China and a direct sales office in Taiwan. Our distributors normally place orders with us once they have received an order from an end-user customer, and, therefore, the total amount of inventory held by our distributors at any given date is not material. In the past, our business has experienced seasonality. Typically, our revenue has been lower in our fiscal first quarter than in our fiscal fourth quarter preceding it. However, revenue in the first quarter of 2005 was greater than the revenue in the fourth quarter of 2004 as strength in the Asian market outweighed the seasonality factors. Also, we expect our revenue in the first quarter of 2006 to be greater than our revenue in the fourth quarter of 2005 due to delays in closing certain orders in the fourth quarter of 2005. In addition, as is typical in our industry, we recognize a large percentage of our quarterly revenue in the last month of the quarter. We sell our solutions to most segments of the semiconductor industry, including manufacturers of communications, wireless, microprocessors and other logic and memory chips. A substantial portion of our revenue is generated from sales of our engineering probe stations and analytical probes to research and development laboratories of semiconductor manufacturers as well as to fabless semiconductor companies and academic institutions. As a result, we sell to a geographically diversified customer base, with more than 50% of our revenue in 2005, 2004 and 2003 generated outside of North America, primarily in Japan, other Asian countries and, to a lesser extent, Europe. Cost of sales includes purchased materials, fabrication, assembly, test and installation labor and overhead, customer-specific engineering costs, warranty costs, royalties and provision for inventory valuation reserves. Fluctuations in gross profit as a percentage of revenue, or gross margin, primarily result from changes in geographic mix, product mix, general pricing dynamics and yields in some of our production lines. Sales in Europe typically have a lower margin than sales in North America and Japan due to our use of third-party distributors in Europe. We typically achieve higher margins on our consumables than on our engineering probe stations. Gross margin will also vary depending on our revenue levels, the level of overhead absorption, and, to a lesser extent, the success of our ongoing productivity improvements and component prices. In addition, as we add production related personnel and equipment and third-party costs to improve lead times, this will cause gross margins to decline if this does not result in additional revenue in the same quarter.
28

Research and development costs are expensed as incurred and include compensation and related expenses for personnel, materials, consultants and overhead. From time to time, we enter into arrangements that provide for the reimbursement of research and development expenses. Such reimbursements are netted against gross research and development expenses. In addition, our research and development expenses fluctuate from quarter to quarter depending on the usage level of our production probe fab for research and development activity. Research and development expenses do not include costs to obtain patents or defend our intellectual property rights, consisting of patents and trademarks, or amortization of capitalized patents and trademarks. Such expenses are included with selling, general and administrative. Research and development expenses also do not include expenses for design work on custom orders that do not result in reusable technology. Such expenses are included as a component of cost of sales. Selling, general and administrative, or SG&A, expenses include compensation and related expenses for personnel, travel, outside services, manufacturers' representative commissions, patent and trademark amortization and overhead incurred in our sales, marketing, customer support, management, legal and other professional and administrative support functions, as well as costs to operate as a public company. Stock-based compensation includes the amortization of value attributed to stock options granted during the one-year period prior to filing our registration statement for our initial public offering in 2004, as well as amortization of deferred stock-based compensation related to option grants at the time we filed a registration statement for our planned initial public offering in 2000. The stock options granted during these periods were granted at the fair market value of our common stock on the date of grant, as determined by our Board of Directors, and are accounted for using the intrinsic value method as prescribed by Accounting Principles Board Opinion No. 25, “Accounting for Stock Issued to Employees.” Given the lack of an active public market for our outstanding common stock at the time, our Board of Directors established estimates of fair value for our common stock, as well as for options to purchase our common stock, based on factors such as recent negotiated transactions, our financial condition and recent operating results, our competitive position and future prospects and analysis of financial data of comparable public companies. Although we believed that the exercise price of the options granted prior to our 2004 initial public offering reflected the fair market value of our common stock on each grant date, in anticipation of our initial public offering in 2004, we re-evaluated the fair market value of our common stock for the three-year period immediately preceding the filing of the registration statement. Based on such re-evaluation we determined that the fair market value of our common stock during the one-year period prior to the filing of the registration statement exceeded the exercise price of options granted during such period. We therefore recorded deferred compensation totaling the amount by which the re-assessed fair market value of our common stock exceeded the exercise price of the options granted during the period. The balance of the deferred stock-based compensation was $142,000 as of December 31, 2005. Other income (expense) typically includes interest income, interest expense, gains and losses on sales of investments and transaction and remeasurement related foreign currency gains and losses. Other income (expense) can also include other miscellaneous non-operating gains and losses. Transaction related foreign currency gains and losses result from gains and losses recognized on foreign exchange forward contracts and on certain of our accounts receivable that are denominated in Japanese yen. Remeasurement related foreign currency gains result from the remeasurement of foreign currency denominated accounting records into U.S. dollars. Accretion of redeemable stock and loss on redemption includes the accretion of certain costs related to the issuance of our Series C convertible preferred stock and the cost of redeeming certain shares of our common stock. In December 2003, we redeemed our Series C convertible preferred stock for cash and a three-year note and, accordingly, we recognized the remaining unaccreted costs of $219,000 as a loss upon the redemption.
29

Results of Operations The following table sets forth our consolidated statement of operations data for the periods indicated as a percentage of revenue.(1) For the Year Ended December 31, IN THOUSANDS (except per share amounts)
2005
2004
2003
Statement of Operations Data Revenue 100.0% 100.0% 100.0% Cost of sales and stock-based compensation 53.5 55.4 60.2 Gross profit 46.5 44.6 39.8 Operating expenses: Research and development 9.4 8.8 10.7 Selling, general and administrative 26.8 25.8 30.2 Stock-based compensation 0.1 0.4 0.3 Total operating expenses 36.3 34.9 41.3 Income (loss) from operations 10.2 9.6 (1.5) Other income (expense), net 2.7 (0.2) 1.1 Income (loss) before income taxes 12.9 9.5 (0.4) Provision for income taxes 1.6 2.2 0.5 Net income (loss) 11.3 7.3 (0.9) Accretion of redeemable stock and loss on redemption - 0.2 1.1 Net income (loss) attributed to common shareholders 11.3% 7.1% (2.0)% (1) Percentages may not add due to rounding. Revenue Revenue increased $9.2 million, or 14.3%, to $73.6 million in 2005 compared to $64.4 million in 2004 and increased $13.9 million, or 27.4%, in 2004 compared to $50.6 million in 2003. Revenue in the Engineering Products Division increased $5.1 million, or 8.7%, to $63.5 million in 2005 compared to $58.5 million in 2004 and increased $11.2 million, or 23.5%, in 2004 compared to $47.3 million in 2003. The increase in Engineering Products revenue in 2005 compared to 2004 was primarily due to a 31.6% increase in unit sales of our engineering probe stations in 2005 compared to 2004. The increase related to improved unit sales was partially offset by an overall decrease in average order total of 14.9% in 2005 compared to 2004. Average order total includes the sales price of all analytical probes, probe cards and other accessories purchased with an engineering probe station. The decrease in the overall average order total included decreases for both 300mm and non-300mm stations in 2005 compared to 2004. The 300mm station average order total decreased 1.9% in 2005 compared to 2004, while the non-300mm station average order total decreased 18.4% in the same time period. The decrease in average order total for our 300mm stations was primarily due to a high average order total comparison from the second half of 2004 due to the sale of units with additional accessories in that period. The decrease in the non-300mm station average order total was due primarily to the sale of a new, lower cost version of one of our preexisting 200mm stations. While we currently sell a larger number of non-300mm engineering probe stations than 300mm engineering probe stations, we expect the trend of increased unit sales of 300mm probe stations to continue into 2006 as the industry continues to shift to 300mm fabrication facilities and as chip structures continually become increasingly complex. The increase in revenue in the Engineering Products Division in 2004 compared to 2003 was primarily due to an increase in the average order total, as well an overall increase in unit volume. Average order total in the Engineering Products Division increased 26.9% in 2004 compared to 2003,
30

primarily due to a 40.4% increase in the unit volume of sales of our 300mm engineering probe stations, which have a higher average selling price than our 200mm engineering probe stations. Offsetting the increase in 300mm unit volume, was a 4.2% decrease in unit volume sales of our 200mm engineering probe stations in 2004 compared to 2003, for an overall increase in total unit volume sales of 4.6%. The increase in average order total was also attributable to an increase in sales of accessories and options ordered by customers with their engineering probe stations in 2004 compared to 2003. Revenue in the Pyramid Probe Division increased $4.2 million, or 69.3%, to $10.1 million in 2005 compared to $5.9 million in 2004 and increased $2.7 million, or 85.2%, in 2004 compared to $3.2 million in 2003. The increases in revenue in the Pyramid Probe Division in 2005 compared to 2004 and in 2004 compared to 2003 were due to increases in the number of production probe cards sold. While our Pyramid probes still represent a small portion of our customers’ total probe card purchases, many of our large customers are now ordering our Pyramid probes for numerous, mainstream, high-volume logic test applications, displacing their historical purchases of cantilever and vertical probe cards. We continue to have a significant share of the market in probe cards for wireless devices. We also expect to continue to increase our non-wireless production probe card applications for a variety of wirebonded chip types. We have been adding probe card capabilities in the form of headcount and equipment over the past several quarters. However, the strong demand has caused our lead times to increase. We expect to continue to add headcount and equipment in the coming quarters in order to shorten the lead times. When fully utilized, the capacity of our probe card microfabrication facility is about $40 million annually with our current product mix. We are currently using less than one third of the facility’s capacity. Our growth rate, therefore, relies on our ability to recruit and train enough top-quality people for product fulfillment and field support. Cost of Sales Cost of sales increased $3.8 million, or 10.5%, to $39.4 million in 2005 compared to $35.6 million in 2004 and increased $5.2 million, or 17.1%, in 2004 compared to $30.4 million in 2003. The increase in cost of sales in 2005 compared to 2004 was primarily due to the increase in revenue discussed above, partially offset by an improvement in gross profit as a percentage of revenue discussed below. The increase in cost of sales in 2004 compared to 2003 was primarily due to the increase in unit volume sales of our engineering probe stations discussed above, partially offset by production improvements made during 2003 primarily related to our probe station product platforms. Gross Profit Our gross profit increased $5.5 million, or 19.2%, to $34.2 million in 2005 compared to $28.7 million in 2004 and increased $8.6 million, or 42.9%, in 2004 compared to $20.1 million in 2003. The increase in our gross profit in 2005 compared to 2004 was primarily attributable to the increased demand and production volumes of our products, as well as an improved product mix for a higher gross profit as a percentage of revenue in 2005 compared to 2004. In 2005, the product mix included more Pyramid probe revenue, and, since the fixed costs of the Pyramid microfabrication facility are relatively high, this revenue increase resulted in margin leverage for those products.
The increase in our gross profit in 2004 compared to 2003 was primarily due to production improvements, efficiencies gained as production volumes increased, approximately $166,000 of savings due to improved component pricing with certain vendors, a $172,000 decrease in inventory write-downs and a $40,000 decrease in warranty expense. The decrease in inventory write-downs
31

was due to $180,000 of write-downs in 2003 related to the poor adoption of one of our product lines that was discontinued compared to only $9,000 of such write-downs in 2004. Gross profit as a percentage of revenue increased to 46.5% in 2005 compared to 44.6% in 2004 and 39.8% in 2003. The increase in our gross profit as a percentage of revenue in 2005 compared to 2004 was primarily due to absorption of fixed costs as sales volumes increased, particularly in the Pyramid microfabrication facility, partially offset by a shift in mix to more non-300mm systems as compared to 300mm systems in 2005 compared to 2004. We achieve lower gross profit as a percentage of revenue on our non-300mm systems than we do on our 300mm systems. The increase in our gross profit as a percentage of revenue in 2004 compared to 2003 was due to production improvements, efficiencies gained as a result of an increase in production volumes, improved component pricing and decreases in inventory write-downs. Research and Development Research and development expenses increased $1.3 million, or 23.0%, to $7.0 million in 2005 compared to $5.7 million in 2004 and increased $244,000, or 4.5%, in 2004 compared to $5.4 million in 2003. The increase in research and development expenses in 2005 compared to 2004 was primarily due to a $329,000 increase in contractor fees for new product development efforts, a $587,000 increase in employee wages and related costs due to headcount increases and salary adjustments in the latter half of 2004 and a $207,000 increase in project supplies. The increase in research and development expenses in 2004 compared to 2003 was due primarily to only $94,000 of reimbursement of our research and development expenses on a joint project in 2004 compared to $248,000 of such reimbursements in 2003. The remainder of the increase resulted from contract labor related to development of reusable technology from customer specific orders. Selling, General and Administrative SG&A expense increased $3.1 million, or 18.7%, to $19.7 million in 2005 compared to $16.6 million in 2004 and increased $1.3 million, or 8.6%, in 2004 compared to $15.3 million in 2003. The increase in SG&A in 2005 compared to 2004 was primarily due to an increase in representative commissions, due to both the increase in revenues as well as an increase in the commission rate in 2005 compared to 2004, an increase in employee wages and related costs due to headcount increases and salary adjustments in the latter half of 2004 and 2005, an increase in media advertising, an increase in legal and patent costs and an increase in other costs related to being a public company, including director and officer insurance, accounting fees and Sarbanes-Oxley Act compliance consultants as detailed below: Amount of increase due to: Representative commissions $ 610,000 Employee wages and related costs 650,000 Media Advertising 188,000 Legal and patent costs 287,000 Public company costs 1,296,000 This increase in 2005 was partially offset by $180,000 of severance in 2004, which was not repeated in 2005. The increase in SG&A in 2004 compared to 2003 was primarily due to $180,000 of severance related to the termination of our former Chief Financial Officer in the second quarter of 2004 compared to $98,000 of severance in 2003. Representative commissions and employee commissions increased $661,000, which was in line with the revenue increase of 27.4%. Employee compensation and related
32

benefits increased $526,000 in 2004 compared to 2003, resulting from 2004 salary increases and headcount increases. Unfavorable changes in the exchange rate between the U.S. dollar and the Japanese yen in 2004 compared to 2003 contributed $236,000 to the increase in 2004. Stock-Based Compensation Total stock-based compensation was $122,000 in 2005 compared to $326,000 in 2004 and $177,000 in 2003. The decrease in 2005 compared to 2004 was due to our accelerated amortization method, wherein more expense is amortized in the early periods. In addition, the reversal of $265,000 of stock-based compensation in 2004, which included a reversal of $117,000 related to the termination of our former Chief Financial Officer in the second quarter of 2004, lowered our future amortization. In addition to normal amortization, stock-based compensation in 2004 included $86,000 due to accelerated vesting of stock options related to the termination of our former Chief Financial Officer and is net of reversals for employee terminations of $265,000 and $32,000 in 2004 and 2003, respectively. Stock-based compensation in 2004 included the amortization of value attributed to stock options issued in the one-year period prior to filing the registration statement related to our 2004 initial public offering, whereas deferred stock compensation in 2003 included amortization of deferred costs related to the grant of stock options at the time we filed a registration statement for our planned initial public offering in 2000. Other Income (Expense) Interest income represents interest earned on cash and cash equivalents and investments in marketable securities and totaled $1.1 million, $133,000 and $164,000, respectively, in 2005, 2004 and 2003. The increase in 2005 compared to 2004 was primarily due to the increase in our invested balances as a result of proceeds received from our initial public offering in December 2004. The decrease in 2004 compared to 2003 was primarily due to lower interest rates in 2004 compared to 2003 and lower invested cash balances due to the payment of $3.0 million in the fourth quarter of 2003 for the conversion of our Series C preferred stock and the repayment of $7.0 million of a note payable in 2004. Interest expense was $18,000 in 2005, of which $16,000 was related to interest on our $7.0 million note payable for the portion of the 30-day prepayment notice period that occurred in January 2005. We gave notice of prepayment and prepaid the remainder of our $7.0 million note payable and related interest in late December 2004. Interest expense of $465,000 in 2004 represented interest on the $7.0 million note payable, which resulted from the conversion of our Series C preferred stock in the fourth quarter of 2003. Other, net totaled $948,000 in 2005 compared to $215,000 in 2004 and $390,000 in 2003. Other, net was comprised of the following (in thousands):
Year Ended December 31, 2005 2004 2003 Foreign currency remeasurement gain (loss) $ (34) $ 132 $ 318 Foreign currency transaction gain 151 74 49 Settlement income from a service provider 700 - - Other 131 9 23 $ 948 $ 215 $ 390
The settlement income from a service provider was fully recognized in the second quarter of 2005 and we do not anticipate any additional settlement income in future periods. Income Taxes Our provision for income taxes totaled $1.2 million, or 12.4%, of income before income taxes, in 2005 compared to $1.4 million, or 22.8% of income before income taxes, in 2004 and $248,000, or 123.4%, of loss before income taxes in 2003.
33

Our 2005 tax rate differed from federal statutory tax rates primarily due to higher non-taxable income for both federal and state income tax purposes, utilization of tax credits and the release of prior year valuation allowances since management believes the benefit of these credits is more likely than not to be utilized in future years. Deferred tax assets arise from the tax benefit of amounts expensed for financial reporting purposes but not yet realized for tax purposes and from unutilized tax credits and net operating loss carry forwards. We evaluate our deferred tax assets on a regular basis to determine if a valuation allowance is required. To the extent it is determined that it is more likely than not that we will not realize the benefit of our deferred tax assets, we record a valuation allowance against deferred tax assets. In 2005, we released $28,000 of valuation allowance related to the future realization of foreign tax credits and foreign net operating losses. We now believe it is more likely than not that the benefit of these credits and losses will be realized in future periods based on anticipated future profits. The valuation allowance was $1.8 million as of both December 31, 2005 and 2004. Our 2004 tax provision included the reversal of $726,000 of previously recorded valuation allowance based on our 2004 performance. The reversal primarily related to U.S. research and engineering credits and state net operating loss carryforwards, which were utilized during 2004. In addition, in 2004, we increased the valuation allowance by $761,000 for excess foreign tax credits and State of Oregon research and engineering credits, which we believe are more likely than not to not be utilized in the future. The net result was an increase in valuation allowance in 2004 of $35,000. Tax expense, net of associated tax credits for taxes paid in Japan, of $41,000 was recognized on the declaration of a $1.5 million dividend from our Japanese subsidiary and is reflected in the tax provision for 2004. We have not provided for United States income taxes on the remaining undistributed earnings of foreign subsidiaries because they are considered permanently invested outside of the United States. Upon repatriation, some of these earnings would generate foreign tax credits which may reduce the United States tax liability associated with any future foreign dividend. At December 31, 2005, we had net deferred tax assets on our balance sheet totaling $2.0 million, primarily related to timing differences in the recognition of certain reserves and accruals. Accretion of Redeemable Stock Accretion of redeemable stock totaled $113,000 in 2004 compared to $583,000 in 2003. Upon completion of our initial public offering in December 2004, all outstanding redeemable stock converted to common stock and, therefore, we did not have any accretion of redeemable stock in 2005. The decrease in accretion of redeemable stock in 2004 compared to 2003 was due to the conversion of our Series C convertible preferred stock in the fourth quarter of 2003. Accordingly, the 2004 amount only included accretion of the redeemable common stock, whereas the 2003 amount included accretion of both the redeemable common and preferred stock. In addition, the 2003 amount included the remaining $219,000 of unaccreted costs related to the Series C convertible preferred stock as a loss on redemption, which occurred in the fourth quarter of 2003. Liquidity and Capital Resources We anticipate meeting our cash requirements for the next 12 months and for the foreseeable future from existing cash and short-term marketable securities, which totaled $50.3 million at December 31, 2005, as well as from cash expected to be generated from operations. Net cash provided by operating activities in 2005 was $5.9 million and consisted of net income of $8.3 million and non-cash expenses of $2.0 million, offset by net changes in our operating assets and liabilities. These changes are described below. Accounts receivable, net increased to $16.2 million at December 31, 2005 compared to $13.6 million at December 31, 2004, primarily due to increased sales, as well as a larger dollar amount of sales in
34

the last month of the fourth quarter of 2005 compared to the last month of the fourth quarter of 2004. Our days sales outstanding was approximately 83 days at December 31, 2005 compared to 68 days at December 31, 2004. Inventories increased to $10.9 million at December 31, 2005 compared to $10.2 million at December 31, 2004, primarily due to an increase in our demonstration inventory as we sold off some of our demonstration inventory in the fourth quarter of 2004 and replaced it in 2005. This increase was partially offset by decreases in our work-in-process and finished goods inventories. We believe that our inventory levels at December 31, 2005 are adequate given our revenue projections for the first quarter of 2006. Prepaid expenses and other current assets increased to $3.0 million at December 31, 2005 compared to $1.6 million at December 31, 2004 primarily due to increases in investment interest receivable and the value of foreign exchange contracts related to Japanese yen receivables. Accrued liabilities increased to $3.1 million at December 31, 2005 compared to $2.8 million at December 31, 2004, primarily due to increased employees stock purchase withholdings. Net cash used in investing activities of $7.8 million in 2005 resulted from $5.2 million used for the net purchase of marketable securities, $2.0 million used for the purchase of fixed assets and $0.5 million used for investment in patents and other assets. Net cash provided by financing activities of $2.1 million in 2005 resulted from $2.2 million of proceeds from the exercise of employee stock options, partially being offset by $99,000 of additional costs related to our December 2004 initial public offering and $27,000 used for payments on capital lease obligations. At December 31, 2005, we had an unused $150,000 standby letter of credit to be utilized in the event a customer requires certain guarantees. This letter of credit is collateralized by $150,000 of our cash and cash equivalents and expires August 14, 2006. Contractual Commitments The following is a summary of our contractual commitments and obligations as of December 31, 2005 (in thousands):
Payments Due By Period Contractual Obligation
Total
2006
2007 and 2008
2009 and 2010
2011 and beyond
Capital Leases $ 8 $ 8 $ - $ - $ - Operating Leases 6,645 2,410 3,645 590 - Purchase Order
Commitments
9,066
9,066
-
-
-
$ 15,719 $ 11,484 $ 3,645 $ 590 $ -
Purchase order commitments primarily represent open orders for inventory. Critical Accounting Policies and the Use of Estimates The preparation of financial statements in conformity with U.S. generally accepted accounting principles requires management to make estimates and assumptions. These estimates and assumptions affect the reported amounts of assets and liabilities and disclosure of contingent assets and liabilities at the date of the financial statements and the reported amount of revenue and expenses during the reporting period. It is possible that the estimates we make may change in the future.
35

Revenue Recognition Revenue from product sales to customers that do not have acceptance criteria, including product sales to distributors, is recognized when a written purchase order has been obtained, the product is shipped, title has transferred, no obligations remain and collectibility is reasonably assured. Generally, we ship our products FOB shipping point. For any shipments with FOB destination terms, we defer revenue until delivery to the customer. Revenue from customers who have acceptance criteria beyond our standard terms and conditions is deferred until all acceptance criteria are satisfied. Revenue for installation services, consisting of assembly and testing, and for systems shipped to integrators is also deferred. Deferred revenue related to service contracts is recognized over the life of the contract, typically one to two years. Deferred revenue for systems shipped to integrators is recognized upon shipment to the final customer. Our transactions may involve the sale of systems and services under multiple element arrangements. Revenue under multiple element arrangements is allocated based on the fair value of each element. A typical multiple element arrangement may include some or all of the following components: product shipments, accessories, installation services and extended warranty contracts. The total sales price is allocated based on the relative fair value of each component when sold separately. Allowance for Doubtful Accounts The allowance for doubtful accounts is estimated based on past collection history and known trends with current customers. Our estimates for allowance for doubtful accounts are reviewed and updated on a quarterly basis. Changes to the reserve occur based upon changes in revenue levels, associated balances in accounts receivable and estimated changes in credit quality. Our allowance for doubtful accounts totaled $97,000 and $86,000, respectively, at December 31, 2005 and 2004 and our bad debt expense totaled $15,000, $15,000 and $6,000, respectively, in 2005, 2004 and 2003. Valuation of Excess and Obsolete Inventory We regularly analyze the value of our inventory based on a combination of factors including, but not limited to, the following: forecasted sales or usage, historical usage rates, estimated service period, product end-of-life dates, estimated current and future market values, service inventory requirements and new product introductions. Inventories are stated at the lower of standard cost, which approximates cost computed on a first-in, first-out basis, or market and include materials, labor and manufacturing overhead. Inventory is reviewed for obsolescence and excess quantities on a quarterly basis, based on estimated future use of quantities on hand, which is determined based on past usage, planned changes to products and known trends in markets and technology. Because of the long-lived nature of many of our products, we maintain a supply of parts for possible use in future repairs and customer field service. As these service parts become older, we apply a higher write-down against the recorded balance, recognizing that the older the part, the less likely it will be used. If circumstances related to our inventories change, our estimates of the value of inventory could materially change. Inventory write-downs are recorded quarterly as a component of cost of sales. Total write-downs to inventory were $125,000, $159,000 and $377,000, respectively, in 2005, 2004 and 2003. The write-downs include $73,000, $9,000 and $180,000, respectively, related to inventory write-downs due to poor adoption of one of our product lines, which was discontinued. The inventory related to the discontinued product line was either transferred to service inventory, discarded or donated to universities or other organizations. Lives and Recoverability of Equipment and Other Long-Lived Assets We evaluate the remaining lives and recoverability of equipment and other assets, including intangible assets, whenever events or changes in circumstances indicate that the carrying amount of the asset may not be recoverable in accordance with SFAS No. 144 “Accounting for the Impairment or Disposal of Long-Lived Assets.” If there is an indication of impairment, we prepare an estimate of future, undiscounted cash flows expected to result from the use of the asset and its eventual disposition. If these cash flows are less than the carrying value of the asset, we adjust the carrying amount of the asset to its estimated fair value. We have not recorded any impairment charges for long-lived assets during the years ended 2005, 2004 or 2003.
36
Warranty Liabilities Warranty costs include labor to repair the system and replacement parts for defective items, as well as other costs incidental to warranty repairs. Any cost recoveries from warranties offered to us by our suppliers covering defective components are also netted against the warranty expense. We estimate a liability for costs to repair or replace products under warranties ranging from 90 days to one-year and technical support costs when the related product revenue is recognized. The products are sold without a right of return or price protection rights. The liability for product warranties is calculated as a percentage of sales. The percentage is based on historical actual product repair costs. Our estimated warranty costs are reviewed and updated on a quarterly basis. We anticipate our future warranty reserve accrual rate to be approximately 1% of revenue. Changes to the reserve occur as volume, product mix and actual warranty costs fluctuate. Our warranty reserve totaled $488,000 and $365,000, respectively, at December 31, 2005 and 2004. These amounts are estimates of warranty costs for our installed base during the 12-month period. Warranty expense totaled $624,000, $639,000 and $679,000, respectively, during 2005, 2004 and 2003. Deferred Tax Asset Valuation Allowance We record deferred tax assets for the estimated future benefit of research and development tax credits, foreign tax credits, net operating loss carryforwards and other temporary differences to the extent management believes these assets will be realized. A valuation allowance is recorded when management can not reach the conclusion that it is more likely than not that the deferred tax assets will be realized. During 2005 and 2004, we reversed $28,000 and $726,000, respectively, of a previously recorded valuation allowance against our deferred tax assets based on our 2005 and 2004 performance. The reversal in 2005 related primarily to foreign tax credits and foreign net operating losses. The reversal in 2004 primarily related to research and engineering credits and state net operating loss carryforwards that were utilized based on 2004 income. During 2004, we recorded a valuation allowance against our deferred tax assets totaling $761,000 as a result of management’s conclusion that certain of our foreign tax credits and state research and development credits may expire before we are able to recognize them. At December 31, 2005, we had a net deferred tax asset on our balance sheet totaling $2.0 million, primarily related to timing differences in the recognition of certain reserves and accruals, as well as state research tax credits which can be carried forward. We believe it is more likely than not that the benefits of these assets will be realized. We may record additional valuation allowances in the future. New Accounting Pronouncements SFAS No. 123R In December 2004, the Financial Accounting Standards Board (“FASB”) issued SFAS No. 123 (Revised 2004), “Share-Based Payment” (“SFAS No. 123R”), which replaces SFAS No. 123, “Accounting for Stock-Based Compensation,” and supersedes APB Opinion No. 25, “Accounting for Stock Issued to Employees.” We adopted SFAS No. 123R effective January 1, 2006. SFAS No. 123R requires all share-based payments to employees, including grants of employee stock options, to be recognized in the financial statements based on their fair values. We are currently evaluating the provisions of SFAS No. 123R and expect that the adoption will have a material impact on our consolidated results of operations and earnings per share, as the stock-based compensation expense will be charged directly against our reported earnings. The adoption of SFAS No. 123R will not have any effect on our cash flows or liquidity as stock-based compensation is a non-cash expense. The pro forma disclosures previously permitted under SFAS No. 123 are no longer an alternative to financial statement recognition. See Note 1 of Notes to Consolidated Financial Statements, Summary of Significant Accounting Policies – Stock-Based Compensation, for the pro forma effects of applying SFAS No. 123 in 2005, 2004 and 2003. SFAS No. 151 In November 2004, the FASB issued SFAS No. 151, “Inventory Costs: an amendment of ARB No. 43, Chapter 4,” to clarify the accounting for abnormal amounts of idle facility expense, freight, handling
37

costs and wasted material. SFAS No. 151 is effective for inventory costs incurred during fiscal years beginning after June 15, 2005. Accordingly, we adopted SFAS No. 151 effective January 1, 2006. While we have not completed our analysis of the impact of SFAS No. 151, we do not currently believe the provisions of SFAS No. 151, when applied, will have a material impact on our financial position, results of operations or cash flows. SFAS No. 154 In May 2005, the FASB issued SFAS No. 154, “Accounting Changes and Error Corrections: a replacement of APB Opinion No. 20 and FASB Statement No. 3,” which requires companies to apply most voluntary accounting changes retrospectively to prior financial statements. We adopted SFAS No. 154 effective January 1, 2006 and, accordingly, any future voluntary accounting changes made by us will be accounted for under SFAS No. 154. Off-Balance Sheet Arrangements We do not have any off-balance sheet arrangements that have or are reasonably likely to have a material current or future effect on our financial condition, changes in financial condition, revenue or expenses, results of operations, liquidity, capital expenditures or capital resources. ITEM 7A. QUANTITATIVE AND QUALITATIVE DISCLOSURES ABOUT MARKET RISK Foreign Currency Exchange Risk We sometimes attempt to mitigate our currency exposures for recorded transactions by using forward exchange contracts. The purpose of these activities is to reduce the risk that future cash flows of the underlying assets and liabilities will be adversely affected by changes in exchange rates. In some cases, we enter into forward sale or purchase contracts for foreign currencies, primarily the Japanese yen, to hedge specific receivables and bookings positions. As of December 31, 2005, we had contracts outstanding for the purchase of Japanese yen totaling approximately $2.2 million, which mature through March 2006. Historically, we have not attempted to mitigate the impact of foreign currency fluctuations on the remeasurement of our subsidiaries’ net assets and results of operations, nor do we enter into derivative financial instruments for speculative purposes. Our forward exchange contracts do not qualify for hedge accounting treatment in accordance with SFAS No. 138, “Accounting for Certain Derivative Instruments and Certain Hedging Activities – an amendment of FASB Statement No. 133,” and, accordingly, gains and losses on our forward exchange contracts are recognized currently as a component of other income (expense). Interest Rate Risk Our exposure to market risk from changes in interest rates relates primarily to our investments. Because we have no variable interest rate debt outstanding at December 31, 2005, we would not experience a material impact on our results of operations, financial position or cash flows as the result of a one percent increase in interest rates. The primary objective of our investment activities is to preserve principal while maximizing yields without significantly increasing risk. This is accomplished by investing in diversified investments, consisting only of investment grade securities. As of December 31, 2005, we held cash, cash equivalents and short-term marketable securities of $50.3 million. Declines of interest rates over time would reduce our interest income from our highly liquid short-term investments. A decrease in interest rates of one percent would cause a corresponding decrease in our annual interest income related to our cash, cash equivalents and marketable securities of approximately $503,000, assuming our December 31, 2005 balances remained constant. Due to the nature of our highly liquid cash equivalents, a change in interest rates would not materially affect the fair market value of our cash and cash equivalents.
38

As of December 31, 2005, we held long-term fixed rate investments of $1.5 million that consisted of municipal and corporate notes. An increase or decrease in interest rates would not have a material impact on our results of operations, financial position or cash flows, as we have classified our securities as available-for-sale and, therefore, may choose to sell or hold them as changes in the market occur. Declines in interest rates over time would reduce our interest income from our long-term investments, as funds are re-invested at current market interest rates. ITEM 8. CONSOLIDATED FINANCIAL STATEMENTS AND SUPPLEMENTARY DATA The financial statements and notes thereto required by this item begin on page F-1 of this document, as listed in Item 15 of Part IV. Unaudited quarterly financial data for each of the eight quarters in the two-year period ended December 31, 2005 is as follows (unaudited): In thousands, except per share data 1st Quarter 2nd Quarter 3rd Quarter 4th Quarter 2004 Revenue $ 13,834 $ 15,120 $ 17,059 $ 18,402 Gross profit 5,880 6,547 7,640 8,656 Net income 373 1,239 1,428 1,667 Accretion of redeemable stock 38 37 38 - Net income attributed to common shareholders
335
1,202
1,390
1,667
Basic net income per share 0.07 0.23 0.27 0.27 Diluted net income per share 0.05 0.15 0.17 0.19 2005 Revenue $ 18,661 $ 18,311 $ 18,987 $ 17,678 Gross profit 9,159 8,650 8,866 7,572 Net income attributed to common shareholders
2,495
2,231
2,148
1,445
Basic net income per share 0.23 0.20 0.19 0.13 Diluted net income per share 0.21 0.19 0.18 0.12 ITEM 9. CHANGES IN AND DISAGREEMENTS WITH ACCOUNTANTS ON ACCOUNTING AND
FINANCIAL DISCLOSURE None. ITEM 9A. CONTROLS AND PROCEDURES Management’s Report on Internal Control Over Financial Reporting Our management is responsible for establishing and maintaining adequate internal control over financial reporting, as such term is defined in Exchange Act Rules 13a –15(f). Under the supervision and with the participation of our management, including our principal executive officer and principal financial officer, we conducted an evaluation of the effectiveness of our internal control over financial reporting based on the framework in Internal Control – Integrated Framework issued by the Committee of Sponsoring Organizations of the Treadway Commission (COSO). Based on our evaluation under the framework in Internal Control – Integrated Framework issued by the Committee of Sponsoring Organizations of the Treadway Commission (COSO), our management concluded that our internal control over financial reporting was effective as of December 31, 2005. Management’s assessment of the effectiveness of our internal control over financial reporting as of December 31, 2005 has been audited by KPMG LLP, an independent registered public accounting firm, as stated in their report, which is included below.
39

Changes in Internal Controls There has been no change in our internal control over financial reporting that occurred during our last fiscal quarter that has materially affected, or is reasonably likely to materially affect, our internal control over financial reporting. Disclosure Controls and Procedures Our management has evaluated, under the supervision and with the participation of our Chief Executive Officer and Chief Financial Officer, the effectiveness of our disclosure controls and procedures as of the end of the period covered by this report pursuant to Rule 13a-15(b) under the Securities Exchange Act of 1934 (the “Exchange Act”). Based on that evaluation, our Chief Executive Officer and Chief Financial Officer have concluded that, as of the end of the period covered by this report, our disclosure controls and procedures are effective in ensuring that information required to be disclosed in our Exchange Act reports is (1) recorded, processed, summarized and reported in a timely manner, and (2) accumulated and communicated to our management, including our Chief Executive Officer and Chief Financial Officer, as appropriate to allow timely decisions regarding required disclosure. Limitation on Effectiveness of Controls Our management, including our Chief Executive Officer and Chief Financial Officer, do not expect that our disclosure controls and procedures or our internal control over financial reporting will prevent or detect all errors and all occurrences of fraud. A control system, no matter how well designed and operated, can provide only reasonable, not absolute, assurance that the objectives of the control systems are met. Further, the design of a control system must reflect the fact that there are resource constraints, and the benefits of all controls must be considered relative to their costs. Control systems can be circumvented by the individual acts of some persons, by collusion of two or more people, or by management override of the control. In addition, over time, controls may become inadequate because of changes in conditions, or the degree of compliance with the policies or procedures may deteriorate. Because of the inherent limitations in all control systems, no evaluation of controls can provide absolute assurance that the control systems will detect all control issues, including instances of fraud, if any. Report of Independent Registered Public Accounting Firm The Board of Directors and Shareholders Cascade Microtech, Inc.: We have audited management’s assessment, included in the accompanying Management’s Report on Internal Control Over Financial Reporting, that Cascade Microtech, Inc. maintained effective internal control over financial reporting as of December 31, 2005 based on criteria established in Internal Control—Integrated Framework issued by the Committee of Sponsoring Organizations of the Treadway Commission (COSO). Cascade Microtech Inc’s management is responsible for maintaining effective internal control over financial reporting and for its assessment of the effectiveness of internal control over financial reporting. Our responsibility is to express an opinion on management’s assessment and an opinion on the effectiveness of the Company’s internal control over financial reporting based on our audit. We conducted our audit in accordance with the standards of the Public Company Accounting Oversight Board (United States). Those standards require that we plan and perform the audit to obtain reasonable assurance about whether effective internal control over financial reporting was maintained in all material respects. Our audit included obtaining an understanding of internal control over financial reporting, evaluating management’s assessment, testing and evaluating the design and operating effectiveness of internal control, and performing such other procedures as we considered necessary in the circumstances. We believe that our audit provides a reasonable basis for our opinion.
40

A company’s internal control over financial reporting is a process designed to provide reasonable assurance regarding the reliability of financial reporting and the preparation of financial statements for external purposes in accordance with generally accepted accounting principles. A company’s internal control over financial reporting includes those policies and procedures that (1) pertain to the maintenance of records that, in reasonable detail, accurately and fairly reflect the transactions and dispositions of the assets of the company; (2) provide reasonable assurance that transactions are recorded as necessary to permit preparation of financial statements in accordance with generally accepted accounting principles, and that receipts and expenditures of the company are being made only in accordance with authorizations of management and directors of the company; and (3) provide reasonable assurance regarding prevention or timely detection of unauthorized acquisition, use, or disposition of the company’s assets that could have a material effect on the financial statements. Because of its inherent limitations, internal control over financial reporting may not prevent or detect misstatements. Also, projections of any evaluation of effectiveness to future periods are subject to the risk that controls may become inadequate because of changes in conditions, or that the degree of compliance with the policies or procedures may deteriorate. In our opinion, management’s assessment that Cascade Microtech, Inc. maintained effective internal control over financial reporting as of December 31, 2005 is fairly stated, in all material respects, based on criteria established in Internal Control—Integrated Framework issued by the Committee of Sponsoring Organizations of the Treadway Commission (COSO). Also, in our opinion, Cascade Microtech, Inc. maintained, in all material respects, effective internal control over financial reporting as of December 31, 2005, based on criteria established in Internal Control—Integrated Framework issued by the Committee of Sponsoring Organizations of the Treadway Commission (COSO). We also have audited, in accordance with the standards of the Public Company Accounting Oversight Board (United States), the consolidated balance sheets of Cascade Microtech, Inc. and subsidiaries as of December 31, 2005 and 2004 and the related consolidated statements of operations, redeemable stock, shareholders’ equity and comprehensive income (loss), and cash flows for each of the years in the three-year period ended December 31, 2005, and our report dated March 15, 2006 expressed an unqualified opinion on those consolidated financial statements. /s/ KPMG LLP Portland, Oregon March 15, 2006 ITEM 9B. OTHER INFORMATION None.
PART III We have omitted from Part III the information that will appear in our definitive proxy statement for our 2006 Annual Meeting of Shareholders (the “Proxy Statement”), which will be filed within 120 days after the end of our year ended December 31, 2005 pursuant to Regulation 14A. ITEM 10. DIRECTORS AND EXECUTIVE OFFICERS OF THE REGISTRANT Information with respect to directors and executive officers is included under “Election of Directors,” “Executive Officers,” “Section 16(a) Beneficial Ownership Reporting Compliance,” “Audit Committee Financial Expert,” “Audit Committee Report” and “Code of Ethics” in our definitive proxy statement for our 2006 Annual Meeting of Shareholders and is incorporated herein by reference.
41

ITEM 11. EXECUTIVE COMPENSATION Information with respect to executive compensation is included under “Director Compensation,” “Executive Compensation” “Employment Contracts and Termination of Employment and Change-in-Control Arrangements” and “Compensation Committee Interlocks and Insider Participation” in our definitive proxy statement for our 2006 Annual Meeting of Shareholders and is incorporated herein by reference. ITEM 12. SECURITY OWNERSHIP OF CERTAIN BENEFICIAL OWNERS AND MANAGEMENT
AND RELATED STOCKHOLDER MATTERS The information required by this item is included under “Security Ownership of Certain Beneficial Owners and Management” and “Equity Compensation Plan Information” in our definitive proxy statement for our 2006 Annual Meeting of Shareholders and is incorporated herein by reference. ITEM 13. CERTAIN RELATIONSHIPS AND RELATED TRANSACTIONS The information required by this item is included under “Certain Relationships and Related Transactions” in our definitive proxy statement for our 2006 Annual Meeting of Shareholders and is incorporated herein by reference. ITEM 14. PRINCIPAL ACCOUNTANT FEES AND SERVICES The information required by this item is included under “Ratification of Appointment of Independent Auditors” in our Proxy Statement for our 2006 Annual Meeting of Shareholders and is incorporated herein by reference.
PART IV
ITEM 15. EXHIBITS AND FINANCIAL STATEMENT SCHEDULES Financial Statements and Schedules The Consolidated Financial Statements, together with the report thereon of KPMG LLP, are included on the pages indicated below:
Page Report of Independent Registered Public Accounting Firm F-1 Consolidated Balance Sheets as of December 31, 2005 and 2004 F-2 Consolidated Statements of Operations for the years ended December 31, 2005, 2004 and 2003 F-3 Consolidated Statements of Redeemable Stock, Shareholders’ Equity and Comprehensive Income
(Loss) for the years ended December 31, 2005, 2004 and 2003 F-4
Consolidated Statements of Cash Flows for the years ended December 31, 2005, 2004 and 2003 F-5 Notes to Consolidated Financial Statements F-6 Schedule II – Valuation and Qualifying Accounts F-23
42

Exhibits The following exhibits are filed herewith and this list is intended to constitute the exhibit index. Exhibit numbers marked with an asterisk (*) represent management or compensatory arrangements.
Exhibit No. Description 3.1 Third Amended and Restated Articles of Incorporation of Cascade Microtech, Inc. Incorporated
by reference to Exhibit 3.1 to our Form 8-K filed December 23, 2004. 3.2 Restated Bylaws of Cascade Microtech, Inc. Incorporated by reference to Exhibit 3.4 to our
Registration Statement on Form S-1, File No. 333-47100. 3.3 Form of Second Amended and Restated Bylaws of Cascade Microtech, Inc. Incorporated by
reference to Exhibit 3.5 to our Registration Statement on Form S-1, File No. 333-113256. 4.1 Reference is made to Exhibit 3.1
10.1* Form of Indemnity Agreement between Cascade Microtech, Inc. and each of its Officers and Directors. Incorporated by reference to Exhibit 10.1 to our Registration Statement on Form S-1, File No. 333-47100.
10.2* Cascade Microtech, Inc. 1993 Stock Incentive Plan, as amended. Incorporated by reference to Exhibit 10.2 to our Registration Statement on Form S-1, File No. 333-47100.
10.3* Cascade Microtech, Inc. 2000 Stock Incentive Plan, as amended. Incorporated by reference to Exhibit 10.3 to our Registration Statement on Form S-1, File No. 333-113256.
10.4* Cascade Microtech, Inc. 2004 Employee Stock Purchase Plan. Incorporated by reference to Exhibit 10.4 to our Registration Statement on Form S-1, File No. 333-113256.
10.5* Employment Agreement of Steven Sipowicz. Incorporated by reference to Exhibit 10.12 to our Registration Statement on Form S-1, File No. 333-113256.
10.6* First Amendment to Executive Employment Agreement of Steven Sipowicz dated October 27, 2005. Incorporated by reference to Exhibit 10.2 to our Form 10-Q for the quarterly period ended September 30, 2005 and filed November 14, 2005.
10.7 Lease Agreements I and II between Amberjack, Ltd. And Cascade Microtech, Inc. dated August 20, 1997, and Amendment No. 2 to Lease Agreement I dated July 23, 1998, and Amendment No. 2 to Lease Agreement II dated April 12, 1999. Incorporated by reference to Exhibit 10.9 to our Registration Statement on Form S-1, File No. 333-47100.
10.8 Lease Agreement between Bermuda Trust (Singapore) Limited and Cascade Microtech, Inc. commencing December 12, 2003. Incorporated by reference to Exhibit 10.6 to our Registration Statement on Form S-1, File No. 333-113256.
10.9 Patent License Agreement between Micronics Japan Co., Ltd, Hewlett Packard Japan, Ltd., and Cascade Microtech Japan, Inc. dated July 28, 1997. Incorporated by reference to Exhibit 10.14 to our Registration Statement on Form S-1, File No. 333-47100.
10.10 Senior Unsecured Note due December 29, 2006. Incorporated by reference to Exhibit 10.10 to our Registration Statement on Form S-1, File No. 333-113256.
10.11 Purchase Agreement between Intel Corporation and Cascade Microtech, Inc., dated April 12, 2003. Incorporated by reference to Exhibit 10.11 to our Registration Statement on Form S-1, File No. 333-113256.
10.12* Cascade Microtech, Inc. 2005 Executive Compensation Plan for the Six-Month Period Ending December 31, 2005. Incorporated by reference to Exhibit 10.2 to our Form 10-Q for the quarterly period ended September 30, 2005 and filed November 14, 2005.
10.13* Cascade Microtech, Inc. 2006 Executive Compensation Plan for the Six-Month Period Ending June 30, 2006. Incorporated by reference to Item 1.01 to our Form 8-K filed February 14, 2006.
10.14 Summary of Non-Employee Director Compensation. Incorporated by reference to Exhibit 10.1 to Form 8-K filed December 13, 2005.
14 Code of Ethics. Incorporated by reference to Exhibit 14 to our Form 10-K for the year ended December 31, 2004 and filed March 29, 2005.
21 List of Subsidiaries. Incorporated by reference to Exhibit 21.1 to our Registration Statement on Form S-1, File No. 333-113256.
23 Consent of KPMG LLP 31.1 Certification of Chief Executive Officer pursuant to Rule 13a-14(a) or Rule 15d-14(a) of the
Securities Exchange Act of 1934. 31.2 Certification of Chief Financial Officer pursuant to Rule 13a-14(a) or Rule 15d-14(a) of the
Securities Exchange Act of 1934. 32.1 Certification of Chief Executive Officer pursuant to Rule 13a-14(b) or Rule 15d-14(b) of the
Securities Exchange Act of 1934 and 18 U.S.C. Section 1350. 32.2 Certification of Chief Financial Officer pursuant to Rule 13a-14(b) or Rule 15d-14(b) of the
Securities Exchange Act of 1934 and 18 U.S.C. Section 1350.
43

SIGNATURES Pursuant to the requirements of Section 13 or 15(d) of the Securities Exchange Act of 1934, Cascade Microtech, Inc. has duly caused this report to be signed on its behalf by the undersigned, thereunto duly authorized on March 15, 2006:
CASCADE MICROTECH, INC. (Registrant)
By: /s/ ERIC W. STRID Eric W. Strid Chairman of the Board, President and Chief Executive Officer (Principal Executive Officer)
Pursuant to the request of the Securities Exchange Act of 1934, this report has been signed below on behalf of the Registrant and in the capacities indicated on March 15, 2006. SIGNATURE TITLE /s/ ERIC W. STRID Chairman of the Board, President Eric W. Strid and Chief Executive Officer (Principal Executive Officer) /s/ STEVEN SIPOWICZ Chief Financial Officer and Treasurer Steven Sipowicz (Principal Financial and Accounting Officer) /s/ K. REED GLEASON Vice President of Advanced Development and K. Reed Gleason Director /s/ KEITH BARNES Director Keith Barnes /s/ F. PAUL CARLSON Director F. Paul Carlson /s/ GEORGE P. O’LEARY Director George P. O’Leary /s/ WILLIAM R. SPIVEY Director William R. Spivey
/s/ RAYMOND A. LINK Director Raymond A. Link
44

F-1
Report of Independent Registered Public Accounting Firm
The Board of Directors and Shareholders Cascade Microtech, Inc.:
We have audited the accompanying consolidated balance sheets of Cascade Microtech Inc., and subsidiaries as of December 31, 2005 and 2004, and the related consolidated statements of operations, redeemable stock, shareholders’ equity and comprehensive income (loss), and cash flows for each of the years in the three-year period ended December 31, 2005. In connection with our audits of the consolidated financial statements, we also have audited the accompanying financial statement schedule. These consolidated financial statements and financial statement schedule are the responsibility of the Company’s management. Our responsibility is to express an opinion on these consolidated financial statements and financial statement schedule based on our audits.
We conducted our audits in accordance with the standards of the Public Company Accounting Oversight Board (United States). Those standards require that we plan and perform the audit to obtain reasonable assurance about whether the financial statements are free of material misstatement. An audit includes examining, on a test basis, evidence supporting the amounts and disclosures in the financial statements. An audit also includes assessing the accounting principles used and significant estimates made by management, as well as evaluating the overall financial statement presentation. We believe that our audits provide a reasonable basis for our opinion.
In our opinion, the consolidated financial statements referred to above present fairly, in all material respects, the financial position of Cascade Microtech, Inc. and subsidiaries as of December 31, 2005 and 2004 and the results of their operations and their cash flows for each of the years in the three-year period ended December 31, 2005, in conformity with U.S. generally accepted accounting principles. Also, in our opinion, the related financial statement schedule, when considered in relation to the basic consolidated financial statements taken as a whole, present fairly, in all material respects, the information set forth therein.
We also have audited, in accordance with the standards of the Public Company Accounting Oversight Board (United States), the effectiveness of Cascade Microtech Inc.’s internal control over financial reporting as of December 31, 2005 based on criteria established in Internal Control—Integrated Framework issued by the Committee of Sponsoring Organizations of the Treadway Commission (COSO), and our report dated March 15, 2006 expressed an unqualified opinion on management’s assessment of, and the effective operation of, internal control over financial reporting. KPMG LLP Portland, Oregon March 15, 2006

Cascade Microtech, Inc.Consolidated Balance Sheets
(In thousands, except share par value)
December 31,2005 2004
AssetsCurrent Assets: Cash and cash equivalents $ 2,224 $ 2,033 Short-term marketable securities 48,122 41,714 Accounts receivable, net of allowances of $97 and $86 16,182 13,640 Inventories, net 10,889 10,180 Prepaid expenses and other 3,000 1,579 Deferred income taxes 1,699 1,552 Total Current Assets 82,116 70,698
Long-term marketable securities 1,549 2,779 Fixed assets, net 4,422 4,008 Deferred income taxes 336 65 Other assets, net 1,697 1,466 Total Assets $ 90,120 $ 79,016
Liabilities and Shareholders' EquityCurrent Liabilities: Current portion of capital leases $ 8 $ 21 Accounts payable 3,904 3,951 Deferred revenue 516 579 Accrued liabilities 3,087 2,814 Total Current Liabilities 7,515 7,365
Capital leases - 14 Deferred revenue 255 282 Other long-term liabilities 845 1,167 Total Liabilities 8,615 8,828
Commitments and Contingencies (Note 15)
Shareholders' Equity: Common stock, $0.01 par value. Authorized 100,000 shares; issued and outstanding: 11,328 and 10,864 113 109 Additional paid-in capital 58,287 55,402 Deferred stock-based compensation (142) (310) Accumulated other comprehensive loss - unrealized holding losses on investments (76) (17) Retained earnings 23,323 15,004 Total Shareholders' Equity 81,505 70,188 Total Liabilities and Shareholders' Equity $ 90,120 $ 79,016
See accompanying Notes to Consolidated Financial Statements.
F-2

Cascade Microtech, Inc.Consolidated Statements of Operations
(In thousands, except per share amounts)
For the Year Ended December 31,2005 2004 2003
Revenue $ 73,637 $ 64,415 $ 50,556
Cost of sales 39,351 35,625 30,433 Stock-based compensation 39 67 19 Gross profit 34,247 28,723 20,104
Operating expenses: Research and development (excludes $17, $30 and $15, respectively, of amortization of stock- based compensation) 6,951 5,651 5,407 Selling, general and administrative (excludes $66, $229 and $143, respectively, of amortization of stock-based compensation) 19,712 16,602 15,293 Stock-based compensation 83 259 158
26,746 22,512 20,858
Income (loss) from operations 7,501 6,211 (754)
Other income (expense): Interest income 1,061 133 164 Interest expense (18) (465) (1) Other, net 948 215 390
1,991 (117) 553
Income (loss) before income taxes 9,492 6,094 (201) Provision for income taxes 1,173 1,387 248 Net income (loss) 8,319 4,707 (449) Accretion of redeemable stock and loss on redemption - 113 583 Net income (loss) attributed to common shareholders $ 8,319 $ 4,594 $ (1,032)
Basic net income (loss) per share attributed to common shareholders $ 0.75 $ 0.84 $ (0.20)
Diluted net income (loss) per share attributed to common shareholders $ 0.70 $ 0.56 $ (0.20)
Shares used in per share calculations: Basic 11,055 5,439 5,089 Diluted 11,816 8,452 5,089
See accompanying Notes to Consolidated Financial Statements.
F-3
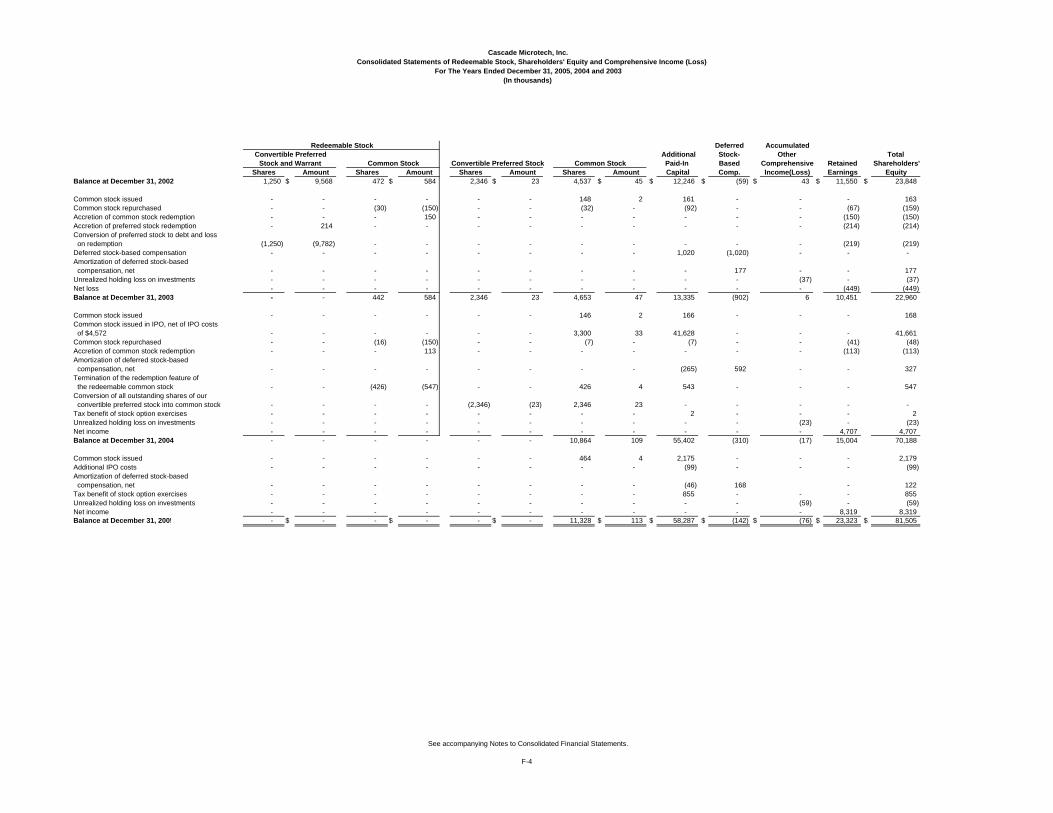
Cascade Microtech, Inc.Consolidated Statements of Redeemable Stock, Shareholders' Equity and Comprehensive Income (Loss)
For The Years Ended December 31, 2005, 2004 and 2003(In thousands)
Redeemable Stock Deferred AccumulatedConvertible Preferred Additional Stock- Other Total
Stock and Warrant Common Stock Convertible Preferred Stock Common Stock Paid-In Based Comprehensive Retained Shareholders'Shares Amount Shares Amount Shares Amount Shares Amount Capital Comp. Income(Loss) Earnings Equity
Balance at December 31, 2002 1,250 $ 9,568 472 $ 584 2,346 $ 23 4,537 $ 45 $ 12,246 $ (59) $ 43 $ 11,550 $ 23,848
Common stock issued - - - - - - 148 2 161 - - - 163 Common stock repurchased - - (30) (150) - - (32) - (92) - - (67) (159) Accretion of common stock redemption - - - 150 - - - - - - - (150) (150) Accretion of preferred stock redemption - 214 - - - - - - - - - (214) (214) Conversion of preferred stock to debt and loss on redemption (1,250) (9,782) - - - - - - - - - (219) (219) Deferred stock-based compensation - - - - - - - - 1,020 (1,020) - - - Amortization of deferred stock-based compensation, net - - - - - - - - - 177 - - 177 Unrealized holding loss on investments - - - - - - - - - - (37) - (37) Net loss - - - - - - - - - - - (449) (449) Balance at December 31, 2003 - - 442 584 2,346 23 4,653 47 13,335 (902) 6 10,451 22,960
Common stock issued - - - - - - 146 2 166 - - - 168 Common stock issued in IPO, net of IPO costs of $4,572 - - - - - - 3,300 33 41,628 - - - 41,661 Common stock repurchased - - (16) (150) - - (7) - (7) - - (41) (48) Accretion of common stock redemption - - - 113 - - - - - - - (113) (113) Amortization of deferred stock-based compensation, net - - - - - - - - (265) 592 - - 327 Termination of the redemption feature of the redeemable common stock - - (426) (547) - - 426 4 543 - - - 547 Conversion of all outstanding shares of our convertible preferred stock into common stock - - - - (2,346) (23) 2,346 23 - - - - - Tax benefit of stock option exercises - - - - - - - - 2 - - - 2 Unrealized holding loss on investments - - - - - - - - - - (23) - (23) Net income - - - - - - - - - - - 4,707 4,707 Balance at December 31, 2004 - - - - - - 10,864 109 55,402 (310) (17) 15,004 70,188
Common stock issued - - - - - - 464 4 2,175 - - - 2,179 Additional IPO costs - - - - - - - - (99) - - - (99) Amortization of deferred stock-based compensation, net - - - - - - - - (46) 168 - 122 Tax benefit of stock option exercises - - - - - - - - 855 - - - 855 Unrealized holding loss on investments - - - - - - - - - - (59) - (59) Net income - - - - - - - - - - - 8,319 8,319 Balance at December 31, 2005 - $ - - $ - - $ - 11,328 $ 113 $ 58,287 $ (142) $ (76) $ 23,323 $ 81,505
See accompanying Notes to Consolidated Financial Statements.
F-4

Cascade Microtech, Inc.Consolidated Statements of Cash Flows
(In thousands)
For the Year Ended December 31, 2005 2004 2003
Cash flows from operating activities: Net income (loss) $ 8,319 $ 4,707 $ (449) Adjustments to reconcile net income (loss) to net cash flows provided by operating activities: Depreciation and amortization 1,859 2,031 2,230 Amortization of deferred stock-based compensation, net 122 326 177 Loss on disposal of fixed assets 27 9 11 Gain on marketable securities - - (3) Deferred income taxes (418) (160) (295) Tax benefit from stock options exercised 855 2 - (Increase) decrease in: Accounts receivable, net (2,542) (3,037) (1,284) Inventories (709) (2,115) 1,343 Prepaid expenses and other (1,421) (814) 1,464 Increase (decrease) in: Accounts payable (47) 1,129 (88) Deferred revenue (90) 174 287 Accrued and other long-term liabilities (49) 349 192 Net cash provided by operating activities 5,906 2,601 3,585
Cash flows from investing activities: Purchase of marketable securities (46,814) (46,583) (7,911) Proceeds from sale of marketable securities 41,577 9,379 9,513 Purchase of fixed assets (2,018) (926) (759) Proceeds from disposal of fixed assets 29 - 7 Investment in patents and other assets (542) (484) (342) Net cash provided by (used in) investing activities (7,768) (38,614) 508
Cash flows from financing activities: Principal payments on capital lease obligations (27) (46) (24) Principal payments on long-term debt - (7,000) - Cash paid upon redemption of Series C preferred stock - - (3,000) Proceeds from issuance of common stock, net of offering costs of $4,572 - 41,661 - Additional offering costs (99) - - Proceeds from other issuances of common stock, net 2,179 168 163 Payments to repurchase common stock - (198) (309) Net cash provided by (used in) financing activities 2,053 34,585 (3,170)
Increase (decrease) in cash and cash equivalents 191 (1,428) 923
Cash and cash equivalents: Beginning of year 2,033 3,461 2,538 End of year $ 2,224 $ 2,033 $ 3,461
Supplemental disclosure of cash flow information: Cash paid for interest $ 2 $ 480 $ 1 Cash paid for income taxes, net 2,127 2,893 99
Noncash investing and financing activities: Reversal of deferred stock compensation $ 46 $ 265 $ 21 Equipment acquired under capital lease - - 59 Note issued upon redemption of Series C preferred stock - - 7,000 Termination of redemption feature on redeemable common stock - 547 - Conversion of convertible preferred stock to common stock - 23 -
See accompanying Notes to Consolidated Financial Statements.
F-5

F-6
Cascade Microtech, Inc. Notes to Consolidated Financial Statements
NOTE 1. SUMMARY OF SIGNIFICANT ACCOUNTING POLICIES Nature of Business We are involved in the development, manufacturing and selling of wafer probing solutions for the electrical measurement and test of integrated circuits, or ICs. We design, manufacture and assemble products in Beaverton, Oregon, with global sales, service and support centers in North America, Europe, Japan and Singapore. Principles of Consolidation The consolidated financial statements include the accounts of Cascade Microtech, Inc. and its wholly owned subsidiaries, Cascade Microtech Foreign Sales Inc., Cascade Microtech Japan, K.K. and Cascade Microtech Europe, Ltd. All significant intercompany accounts and transactions have been eliminated. The functional currency of our foreign subsidiaries is the U.S. dollar. Nonmonetary balance sheet items are remeasured at historical rates and monetary balance sheet items are remeasured at current rates. Exchange gains and losses from remeasurement of monetary assets and liabilities are recognized currently in our consolidated statements of operations. Use of Estimates in Financial Reporting The preparation of financial statements in conformity with U.S. generally accepted accounting principles requires management to make estimates and assumptions that affect the reported amounts of assets and liabilities and disclosure of contingent assets and liabilities at the date of the financial statements, as well as revenues and expenses reported for the periods presented. Significant estimates include allowances for doubtful accounts, inventory valuation, the lives and recoverability of equipment and other long-lived assets, warranty reserves and deferred tax asset valuation allowances. We regularly assess these estimates and, while actual results may differ, management believes that the estimates are reasonable. Cash and Cash Equivalents Included in cash and cash equivalents were cash equivalents of $213,000 and $1.0 million at December 31, 2005 and 2004, respectively, which consisted of money market funds, and are stated at cost, which approximates market value. We consider all highly liquid investments with an original maturity of three months or less to be cash equivalents. Letter of Credit At December 31, 2005, we had an unused $150,000 standby letter of credit to be utilized in the event a customer requires certain guarantees. This letter of credit is collateralized by $150,000 of our cash and cash equivalents and expires August 14, 2006. Marketable Securities We classify our marketable securities as available-for-sale and, accordingly, record them at current market value. Unrealized holding gains and losses are excluded from earnings and are reported as a separate component of shareholders’ equity until realized. Dividend and interest income is recognized when earned. Realized gains and losses are included in earnings and are derived using the specific identification method for determining the cost of securities sold. We periodically evaluate whether declines in fair values of our investments below their cost are “other-than-temporary.” This evaluation consists of qualitative and quantitative factors regarding the severity and duration of the unrealized loss, as well as our ability and intent to hold the investment until a forecasted recovery occurs.

F-7
Trade Accounts Receivable Trade accounts receivable are recorded at their invoiced amount and do not bear interest. The allowance for doubtful accounts is our best estimate of the amount of probable credit losses in our existing accounts receivable. We determine our allowance for doubtful accounts utilizing historical collection percentages considering the aging of the accounts and known trends with current customers, including recent significant changes in their financial position. The provision for doubtful accounts totaled $15,000, $15,000 and $6,000, respectively, in 2005, 2004 and 2003. The allowance for doubtful accounts totaled $97,000 and $86,000, respectively, at December 31, 2005 and 2004. Historically, write-offs have been insignificant. Inventories Inventories are stated at the lower of standard cost, which approximates cost computed on a first-in, first-out basis, or market, and include materials, labor and manufacturing overhead. Demonstration goods represent inventory that is used for customer demonstration purposes. This inventory is typically sold after 12 to 18 months. We analyze the carrying value of our inventory quarterly, considering a combination of factors including, but not limited to, the following: forecasted sales or usage, historical usage rates, estimated service period, product end-of-life dates, estimated current and future market values, service inventory requirements and new product introductions. We estimate market value based on factors including, but not limited to, replacement cost and estimated resale value. Write-downs of inventory totaled $125,000, $159,000 and $377,000, respectively, in 2005, 2004 and 2003. Fair Value of Financial Instruments The carrying value of cash and cash equivalents, marketable securities, accounts receivable, accounts payable and accrued liabilities approximate fair value due to their short maturities. The fair value of our capital lease obligations approximate carrying value as such instruments’ stated interest rates do not differ significantly from current market rates. Fixed Assets Equipment and leasehold improvements are stated at cost. Equipment under capital lease is recorded at the net present value of the future minimum lease payments at the inception of the lease. Maintenance and repairs are expensed as incurred. Depreciation of owned equipment is primarily provided using the straight-line method over the estimated useful lives of the assets, ranging from two to seven years. Amortization of equipment under capital leases and leasehold improvements is provided using the straight-line method over the life of the lease or the useful life of the asset, whichever is shorter. Other Assets Other assets, which consist primarily of patents and trademarks, are stated at historical cost less accumulated amortization and reserves. Capitalized patent costs relate to legal fees incurred to obtain the patents. Costs incurred for patent related litigation are expensed as incurred. The intangible assets are amortized using the straight-line method over estimated useful lives of five to seven years. Accounting for the Impairment of Long-Lived Assets Long-lived assets held and used by us and intangible assets with determinable lives are reviewed for impairment whenever events or circumstances indicate that the carrying amount of assets may not be recoverable in accordance with SFAS No. 144 “Accounting for the Impairment or Disposal of Long-Lived Assets” We evaluate recoverability of assets to be held and used by comparing the carrying amount of an asset to future net undiscounted cash flows to be generated by the asset. If such assets are considered to be impaired, the impairment to be recognized is measured as the amount by which the carrying amount of the assets exceeds the fair value of the assets. Such reviews assess the fair value of the assets based upon estimates of discounted future cash flows that the assets are expected to generate. We did not record any impairment charges against our long-lived assets during 2005, 2004 or 2003.

F-8
Revenue Recognition We sell or deliver our products to the end-user through distributors, manufacturers’ representatives and integrators:
• distributors purchase our products directly from us and pay us directly according to our standard terms and conditions. They then resell the products to end users at prices and terms set by them;
• manufacturers’ representatives are independent companies that agree to sell our products at our prices and on our terms and they are paid a commission based on a percentage of their sales of our products; and
• integrators design and assemble application specific measurement solutions consisting of products from two or more companies. They typically do not purchase our products directly from us. The end user is billed directly and is liable to us for the purchase of the products. The integrator is paid a fee by the end user.
Revenue from product sales to customers that do not have special acceptance criteria, including product sales to distributors and manufacturers’ representatives, is recognized when a written purchase order has been obtained, the price is fixed and determinable, the product is shipped, title has transferred and collectibility is reasonably assured. Generally, we ship our products FOB shipping point. For any shipments with FOB destination terms, we defer revenue until delivery to the customer. Revenue from customers who have special acceptance criteria is not recognized until all acceptance criteria are satisfied. Revenue for installation services, consisting of assembly and testing, is recognized when the services are performed. Our transactions may involve the sale of systems and services under multiple element arrangements. A typical multiple element arrangement may include some or all of the following: product shipments, accessories, installation services or extended warranty contracts. For any arrangements with multiple elements, we recognize revenue only after we have determined that elements with stand alone value have been delivered to customers and any undelivered elements have objective and reliable evidence of fair value. We record deferred revenue for service contracts and for custom engineering probe stations and other systems requiring special acceptance criteria from the customer. Deferred revenue related to service contracts is recognized over the life of the contract, typically one to two years. For systems shipped to integrators, no revenue is recognized until shipment to the end user. Deferred revenue related to shipped systems requiring acceptance by the customer is recognized upon receipt of such acceptance. Significant Customers No customers in 2005 or 2004 accounted for 10% or more of our total sales. In 2003, one customer accounted for approximately 11.0% of our total sales. No customers accounted for 5% or more of our gross accounts receivable balance at December 31, 2005 or 2004. Product Warranty We estimate a liability for costs to repair or replace products under warranties for a period of approximately six months and technical support costs when the related product revenue is recognized. The products are sold without a right of return or price protection rights. The liability for product warranties is calculated as a percentage of sales. The percentage is based on historical actual product repair costs. The liability for product warranties is included in accrued liabilities on our consolidated balance sheet.

F-9
Product warranty activity was as follows (in thousands): Warranty accrual, December 31, 2002 $ 189 Reductions for warranty charges (690) Additions to warranty reserve 679 Warranty accrual, December 31, 2003 178 Reductions for warranty charges (452) Additions to warranty reserve 639 Warranty accrual, December 31, 2004 365 Reductions for warranty charges (501) Additions to warranty reserve 624 Warranty accrual, December 31, 2005 $ 488 Advertising Advertising costs are expensed as incurred and amounted to $196,000, $7,000 and $32,000 in 2005, 2004 and 2003, respectively. Research and Development Research and development costs are expensed as incurred. See Note 9. Forward Exchange Contracts We account for forward exchange contracts in accordance with SFAS No. 138, “Accounting for Certain Derivative Instruments and Certain Hedging Activities - an amendment of FASB Statement No. 133” and SFAS No. 137, “Accounting for Derivative Instruments and Hedging Activities.” SFAS No. 137 is an amendment to SFAS No. 133, “Accounting for Derivative Instruments and Hedging Activities.” SFAS Nos. 133, 137 and 138 establish accounting and reporting standards requiring that every derivative instrument (including certain derivative instruments embedded in other contracts) be recorded on the balance sheet as either an asset or liability measured at its fair value. SFAS Nos. 137 and 138 require that changes in the derivative’s fair value be recognized currently in earnings unless specific hedge accounting criteria are met. Special accounting for qualifying hedges allows a derivative’s gains and losses to offset related results on the hedged item in the income statement, and requires that a company must formally document, designate and assess the effectiveness of transactions that receive hedge accounting. At times, we enter into forward foreign currency exchange contracts, which typically expire within six months, to manage our exposure against foreign currency fluctuations on sales denominated in Japanese yen. These foreign exchange contracts are not considered hedges under SFAS No. 138, and as such are recorded at fair value on the balance sheet with any changes in fair value included as other income (expense), net on our statements of operations. At December 31, 2005 and 2004, we had $2.2 million and $4.7 million, respectively, of forward exchange contracts outstanding. The estimated fair value of the contracts outstanding at December 31, 2005 and 2004 was $2.1 million and $4.9 million, respectively. Income Taxes We account for income taxes in accordance with SFAS No. 109 “Accounting for Income Taxes.” Accordingly, deferred income taxes are established for the difference between the financial reporting and income tax basis of assets and liabilities as well as operating loss and tax credit carryforwards. Deferred tax assets are reduced by a valuation allowance when, in the opinion of management, it is more likely than not that some portion of the deferred tax assets will not be realized. Deferred tax assets and liabilities are measured using enacted tax rates expected to apply to taxable income in the years in which those temporary differences are expected to be recovered or settled. The effect on deferred taxes of a change in tax rates is recognized in income in the period that includes the enactment date.

F-10
Net Income (Loss) Per Share We compute net income (loss) per share in accordance with SFAS No. 128, “Earnings Per Share.” Under the provisions of SFAS No. 128, basic net income (loss) per share is computed by dividing the net income (loss) attributed to common shareholders for the period by the weighted average number of shares of common stock outstanding during the period. Diluted net income (loss) per share incorporates the incremental shares issuable upon the assumed exercise of stock options and warrants using the treasury stock method and assumed conversions of preferred stock, if dilutive. In addition, upon assumed conversion of the preferred stock, the accretion of redeemable stock is added back to net income. Accordingly, the net income used for calculating net income per share for 2004 was $4.7 million. The following table reconciles the shares used in calculating basic earnings per share to the shares used in calculating diluted earnings per share (in thousands):
Year Ended December 31, 2005 2004 2003 Shares used to calculate basic earnings per share 11,055 5,439 5,089 Dilutive effect of:
Outstanding stock options 761 776 - Outstanding warrants - - - Redeemable and convertible preferred stock - 2,237 -
Shares used to calculate diluted earnings per share 11,816 8,452 5,089 Dilutive securities not considered as they would have been antidilutive:
Outstanding stock options 296 273 1,773 Outstanding warrants - - - Redeemable and convertible preferred stock - - 2,346 296 273 4,119
Stock-Based Compensation Beginning January 1, 2006, we account for stock options using SFAS No. 123R, “Share-Based Payment: an amendment of FASB Statements No. 123 and 95,” which requires companies to recognize in their statement of operations the grant-date fair value of stock options and other equity-based compensation issued to employees (see Note 2). Prior to January 1, 2006, we accounted for stock options issued to employees using the intrinsic value method as prescribed by Accounting Principles Board (APB) Opinion No. 25, “Accounting for Stock Issued to Employees.” Pursuant to Statement of Financial Accounting Standards (SFAS) No. 148 “Accounting for Stock-Based Compensation—Transition and Disclosure,” we have computed, for pro forma disclosure purposes, the impact on net income (loss) and net income (loss) per share as if we had accounted for our stock-based compensation plans in accordance with the fair value method prescribed by SFAS No. 123 “Accounting for Stock-Based Compensation” as follows (in thousands, except per share amounts): Year Ended December 31, 2005 2004 2003 Net income (loss) attributed to common shareholders, as reported
$
8,319
$
4,594
$
(1,032)
Add stock-based compensation included in reported net income (loss), net of tax
107
252
105
Fair value of stock-based employee compensation, net of tax
(1,849)
(1,585)
(657)
Net income (loss), pro forma $ 6,577 $ 3,261 $ (1,584) Net income (loss) per share – basic, as reported $ 0.75 $ 0.84 $ (0.20) Net income (loss) per share – basic, pro forma $ 0.59 $ 0.60 $ (0.31) Net income (loss) per share – diluted, as reported $ 0.70 $ 0.56 $ (0.20) Net income (loss) per share – diluted, pro forma $ 0.56 $ 0.40 $ (0.31)

F-11
To determine stock-based compensation included in reported net income (loss), net of tax, we used a tax rate approximating our effective tax rate of 12.4% for 2005 and 22.8% for 2004. For 2003, we used a statutory tax rate of 40% due to the significant variance in our effective tax rate from the statutory tax rate. Expense associated with stock-based compensation is amortized on an accelerated basis over the vesting period of the individual award, consistent with the method described in Financial Accounting Standards Board Interpretation No. 28 “Accounting for Stock Appreciation Rights and Other Variable Stock Option Award Plans, an Interpretation of APB Opinion No. 15 and 25” (“FIN 28”). Using the Black-Scholes methodology, the total value of stock awards and options granted during 2005, 2004 and 2003 was $2.5 million, $3.0 million and $1.1 million, respectively, which would be amortized on a pro forma basis over the vesting period of the options, typically five years. The per share weighted average fair value of stock options granted during the years ended December 31, 2005, 2004 and 2003 was $8.55, $7.39 and $3.40, respectively, using the Black-Scholes option-pricing model with the following weighted average assumptions:
Year Ended December 31, 2005 2004 2003 Stock Option Plan Risk-free interest rate 3.77% - 4.39% 3.6% 3.27% Expected dividend yield 0.0% 0.0% 0.0% Expected lives 6 years 6 years 6 years Expected volatility 67.4% - 68.9% 68.4% 70.0% Employee Stock Purchase Plan Risk-free interest rate 2.85% - 3.79% - - Expected dividend yield 0.0% - - Expected lives 6 months - - Expected volatility 43.7% - 56.0% - -
We account for stock options issued to consultants and other service providers pursuant to SFAS No. 123 and EITF 96-18, “Accounting for Equity Instruments that are Issued to Other Than Employees for Acquiring, or in Conjunction With, Selling Goods or Services.” Accordingly, the value of the stock options is determined based on the fair value of the services or other consideration received or the fair value of the stock options issued, whichever is more reliably measurable. The value is recognized as expense over the period the service is provided or upon receipt of the other consideration. There were no stock options granted to consultants or other service providers during 2005, 2004 or 2003. Comprehensive Income We have adopted the provisions of SFAS No. 130, “Reporting Comprehensive Income.” Comprehensive income is defined as changes in shareholders’ equity exclusive of transactions with owners, such as capital contributions and dividends. Unrealized holding gains and losses on our available-for-sale marketable securities are included as a separate component of shareholders’ equity until realized. The differences between net income (loss) and comprehensive income (loss) for the periods presented are not material. Reclassifications Certain reclassifications have been made to the prior year balance sheet to conform to the current year presentation.

F-12
Certain Risks and Uncertainties Our future operating results and financial condition are subject to influences driven by rapid technological changes, a highly competitive industry, a lengthy sales cycle, and the cyclical nature of general economic conditions. Future operating results will depend on many factors, including demand for our products, the introduction and industry acceptance of new products and the level and timing of available shippable orders and backlog. In addition, we rely on several suppliers to provide certain key components used in our products. Some of these items are available from only one supplier or a limited group of suppliers. Any disruption in the availability and delivery of these items could materially adversely affect our revenues. Segment Reporting Based upon the requirements of SFAS No. 131, “Disclosures about Segments of an Enterprise and Related Information,” we have determined that we operate in two business segments: the Engineering Products Division (“EPD”) and the Pyramid Probe Division (“PPD”). Our engineering probe stations, analytical probes, probing accessories and application software are sold through EPD. Our production probe cards are sold through PPD. NOTE 2. NEW ACCOUNTING PRONOUNCEMENTS SFAS No. 123R In December 2004, the FASB issued SFAS No. 123R, “Share-Based Payment: an amendment of FASB Statements No. 123 and 95,” which requires companies to recognize in their statement of operations the grant-date fair value of stock options and other equity-based compensation issued to employees. SFAS No. 123R is effective for annual periods beginning after June 15, 2005. Accordingly, we adopted SFAS No. 123R effective January 1, 2006. See Note 1 Summary of Significant Accounting Policies - Stock-Based Compensation above for an estimate of how SFAS No. 123R would have affected results of operations in 2005, 2004 and 2003. We are currently evaluating the provisions of SFAS No. 123R and expect that the adoption will have a material impact on our consolidated results of operations and earnings per share, as the stock-based compensation expense will be charged directly against our reported earnings. The adoption of SFAS No. 123R will not have any effect on our cash flows or liquidity as stock-based compensation is a non-cash expense. SFAS No. 151 In November 2004, the FASB issued SFAS No. 151, “Inventory Costs: an amendment of ARB No. 43, Chapter 4,” to clarify the accounting for abnormal amounts of idle facility expense, freight, handling costs and wasted material. SFAS No. 151 is effective for inventory costs incurred during fiscal years beginning after June 15, 2005. Accordingly, we adopted SFAS No. 151 effective January 1, 2006. While we have not completed our analysis of the impact of SFAS No. 151, we do not currently believe the provisions of SFAS No. 151, when applied, will have a material impact on our financial position, results of operations or cash flows. SFAS No. 154 In May 2005, the FASB issued SFAS No. 154, “Accounting Changes and Error Corrections: a replacement of APB Opinion No. 20 and FASB Statement No. 3,” which requires companies to apply most voluntary accounting changes retrospectively to prior financial statements. SFAS No. 154 is effective for accounting changes and corrections of errors made in fiscal years beginning after December 15, 2005. Any future voluntary accounting changes made by us will be accounted for under SFAS No. 154 and will be applied retrospectively.

F-13
NOTE 3. MARKETABLE SECURITIES We account for our marketable securities in accordance with SFAS No. 115, “Accounting for Certain Investments in Debt and Equity Securities.” Accordingly, we have classified our marketable securities as available for sale securities and have recorded them at fair value with unrealized gains and losses reported as a separate component of shareholders’ equity. Certain information regarding our marketable securities was as follows (in thousands): December 31, 2005 2004 Fair market value: Municipal obligations $ 48,474 $ 38,325 Agency discount notes - 4,960 Government securities 1,197 1,208 $ 49,671 $ 44,493 Cost: Municipal obligations $ 48,542 $ 38,327 Agency discount notes - 4,967 Government securities 1,205 1,216 $ 49,747 $ 44,510 Fair market value by maturity: Within one year $ 48,122 $ 41,714 One to two years 1,549 2,779 $ 49,671 $ 44,493 Gross unrealized holding losses: Municipal obligations $ (68) $ (2) Agency discount notes - (7) Government securities (8) (8) $ (76) $ (17) Year Ended December 31, 2005 2004 2003 Proceeds from sales $ 41,577 $ 9,379 $ 9,513 Gross realized gains on sales $ - $ - $ 3 Gross realized losses on sales $ - $ - $ - There we no unrealized holding gains at December 31, 2005 or 2004. We use the specific identification method for determining gains and losses on our marketable securities. At December 31, 2005 and 2004, we determined that unrealized losses on our marketable securities were temporary based on the duration of the unrealized losses and on our ability to hold the marketable securities until maturity. NOTE 4. INVENTORIES
Inventories consisted of the following (in thousands): December 31, 2005 2004 Raw materials $ 4,747 $ 4,665 Work-in-process 1,138 1,548 Finished goods 5,004 3,967 $ 10,889 $ 10,180
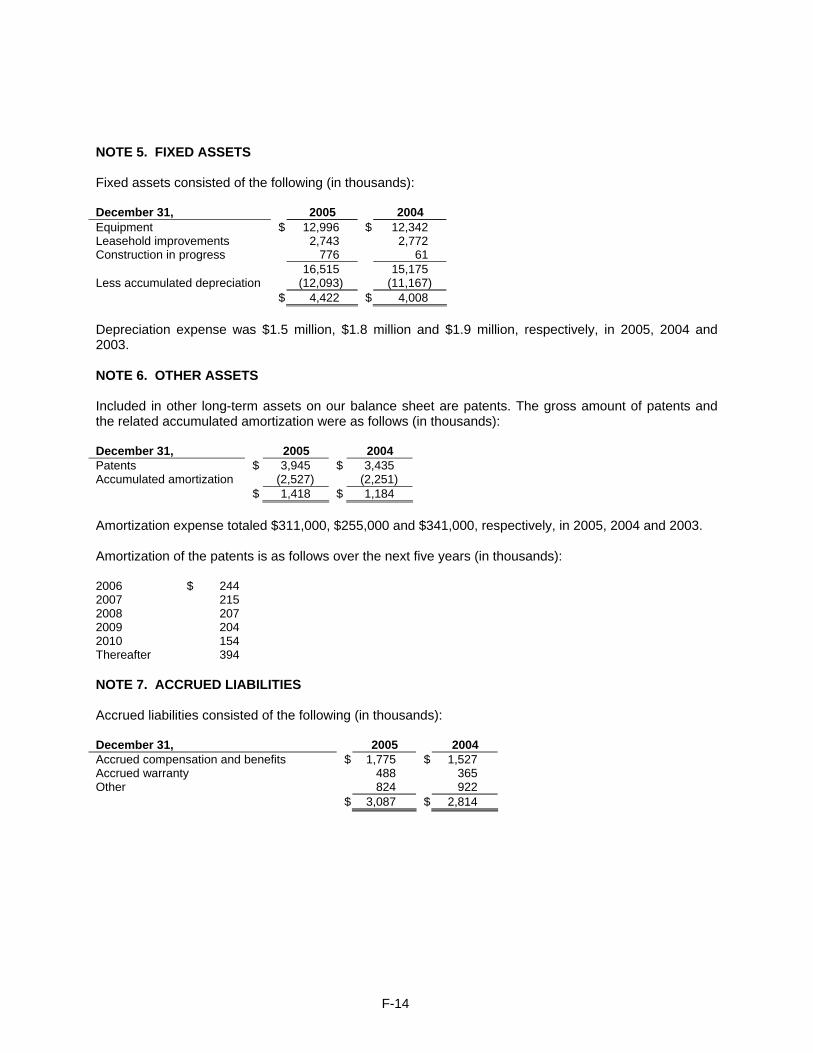
F-14
NOTE 5. FIXED ASSETS Fixed assets consisted of the following (in thousands): December 31, 2005 2004 Equipment $ 12,996 $ 12,342 Leasehold improvements 2,743 2,772 Construction in progress 776 61 16,515 15,175 Less accumulated depreciation (12,093) (11,167) $ 4,422 $ 4,008 Depreciation expense was $1.5 million, $1.8 million and $1.9 million, respectively, in 2005, 2004 and 2003. NOTE 6. OTHER ASSETS Included in other long-term assets on our balance sheet are patents. The gross amount of patents and the related accumulated amortization were as follows (in thousands): December 31, 2005 2004 Patents $ 3,945 $ 3,435 Accumulated amortization (2,527) (2,251) $ 1,418 $ 1,184 Amortization expense totaled $311,000, $255,000 and $341,000, respectively, in 2005, 2004 and 2003. Amortization of the patents is as follows over the next five years (in thousands): 2006 $ 244 2007 215 2008 207 2009 204 2010 154 Thereafter 394 NOTE 7. ACCRUED LIABILITIES
Accrued liabilities consisted of the following (in thousands): December 31, 2005 2004 Accrued compensation and benefits $ 1,775 $ 1,527 Accrued warranty 488 365 Other 824 922 $ 3,087 $ 2,814

F-15
NOTE 8. INCOME TAXES
Domestic and foreign pre-tax income (loss) was as follows (in thousands):
Year ended December 31, 2005 2004 2003 Domestic $ 9,215 $ 6,161 $ (1,126) Foreign 277 (67) 925
$ 9,492 $ 6,094 $ (201) The provision (benefit) for income taxes consisted of the following (in thousands): Year ended December 31, 2005 2004 2003 Current: Federal $ 1,443 $ 1,318 $ 147 State 130 90 11 Foreign 5 139 385 Total current 1,578 1,547 543 Deferred: Federal (373) (188) (463) State (23) 17 291 Foreign (9) 11 (123) Total deferred (405) (160) (295) Provision (benefit) for income taxes $ 1,173 $ 1,387 $ 248
The provision (benefit) for income taxes varies from the amounts computed by applying the Federal statutory rate of 34% to income (loss) before income taxes as follows (in thousands): Year ended December 31, 2005 2004 2003 Federal income tax (benefit) computed at statutory rates $ 3,228 $ 2,072 $ (68) Extraterritorial income exclusion tax benefit (286) (340) (95) Difference in foreign tax rate - 34 (40) State income taxes, net of federal benefit 209 172 (48) Deferred stock-based compensation (30) 92 46 Tax credits (R&D and foreign tax credit) (1,289) (848) (467) Changes in valuation allowance (107) 35 781 Tax exempt interest income (338) - - State net operating loss utilized (38) - - Other (176) 170 139 Provision (benefit) for income taxes $ 1,173 $ 1,387 $ 248

F-16
Significant components of deferred income tax assets and liabilities were as follows (in thousands): December 31, 2005 2004 Current deferred tax assets: Reserves and allowances $ 310 $ 314 Inventory reserves 672 650 Accrued vacation 291 252 Deferred intercompany profit 384 159 Other current deferred tax assets 42 177 Total current deferred tax assets 1,699 1,552 Non-current deferred tax assets: Retirement allowance 153 211 State net operating loss carryforwards 1 139 State research tax credits 1,766 1,275 Foreign tax credits 244 377 Other non-current deferred tax assets 512 335 Gross non-current deferred tax assets 2,676 2,337 Valuation allowance (1,766) (1,794) Total net non-current deferred tax assets 910 543 Non-current deferred tax liabilities: Patents 574 478 Net deferred tax assets $ 2,035 $ 1,617
Deferred tax assets arise from the tax benefit of amounts expensed for financial reporting purposes but not yet realized for tax purposes and from unutilized tax credits and net operating loss carry forwards. We evaluate our deferred tax assets on a regular basis to determine if a valuation allowance is required. To the extent it is determined that it is more likely than not that we will not realize the benefit of our deferred tax assets, we record a valuation allowance against deferred tax assets. In 2005, we released $28,000 of valuation allowance related to the future realization of foreign tax credits and foreign net operating losses. We now believe it is more likely than not that the benefit of these credits and losses will be realized in future periods based on anticipated future profits. Our 2004 tax provision included the reversal of $726,000 of previously recorded valuation allowance based on our 2004 performance. The reversal primarily related to U.S. research and engineering credits and state net operating loss carryforwards, which were utilized during 2004. In addition, in 2004, we increased the valuation allowance by $761,000 for excess foreign tax credits and State of Oregon research and engineering credits, which we believe are more likely than not to not be utilized in the future. The net result was an increase in valuation allowance in 2004 of $35,000. The net increase (decrease) in the total valuation allowance was $28,000, $35,000 and $781,000, respectively, in 2005, 2004 and 2003. The valuation allowance as of December 31, 2005 and 2004 was $1.8 million and $1.8 million, respectively. The portion of valuation allowance for deferred tax assets for which subsequently recognized tax benefits will be applied directly to contributed capital is approximately $78,000. In 2005, 2004 and 2003, income tax benefits attributable to employee stock option transactions of $855,000, $2,000 and $0, respectively, were allocated to shareholders’ equity. We had state and foreign net operating loss carryforwards, foreign tax credits and state research and experimentation credit carryforwards of approximately $11,000, $244,000 and $1.8 million, respectively, at December 31, 2005 to offset against future taxable income. These carryforwards expire beginning 2006 through 2025.

F-17
We did not provide for U.S. income taxes on the remaining undistributed earnings of foreign subsidiaries because they were considered permanently invested outside of the U.S. Upon repatriation, some of these earnings would generate foreign tax credits, which may reduce the U.S. tax liability associated with any future foreign dividend. At December 31, 2005, the cumulative amount of earnings upon which U.S. income taxes have not been provided is approximately $2.9 million. A provision of the Internal Revenue Code requires the utilization of net operating losses and research and experimentation credits be limited when we a change in ownership of more than 50% occurs. We believe that such a change occurred with the issuance of common stock in our initial public offering (“IPO”) in December 2004. Accordingly, the utilization of the net operating loss and credit carryforwards generated from periods prior to December 2004 may be limited in the timing of their utilization. NOTE 9. RESEARCH AND DEVELOMENT AGREEMENT WITH KEY CUSTOMER In 2002, we entered into a cooperative research and development agreement with a key customer. Pursuant to the terms of the agreement, this customer reimburses us for certain research and development work performed in relation to the development of certain probes. Accordingly, in 2005, 2004 and 2003, we received zero, $94,000 and $248,000, respectively, which was netted with research and development expense on our consolidated statements of operations. NOTE 10. OTHER INCOME (EXPENSE), NET
Other income (expense), net consisted of the following (in thousands): Year ended December 31, 2005 2004 2003 Gain on investments, net $ - $ - $ 3 Gains related to foreign currency hedges 151 74 49 Remeasurement related foreign currency gains (losses) (34) 132 318 Settlement income from a service provider 700 - - Other 131 9 20 $ 948 $ 215 $ 390
NOTE 11. CONVERSION OF REDEEMABLE CONVERTIBLE PREFERRED STOCK
In 1999, we designated 1.5 million shares of authorized preferred stock as Series C redeemable convertible preferred stock (“Series C”). In December 2003, all of the Series C was redeemed at a price of $8.00 per share in exchange for a $7.0 million note and $3.0 million of cash. Upon redemption of the Series C, the related unaccreted costs of $219,000 were recorded as a loss on redemption. The $7.0 million note was paid in full in December 2004 with proceeds from our IPO. NOTE 12. SHAREHOLDERS’ EQUITY Public Sale of Common Stock We completed our IPO of 3.3 million shares of our common stock in December 2004 for net proceeds of $41.6 million. Offering costs of $4.7 million were offset against the proceeds. Upon completion of the IPO, all of the then outstanding shares of our Series A redeemable convertible preferred stock (“Series A”) and Series B redeemable convertible preferred stock (“Series B”) automatically converted to a total of 2,346,486 shares of our common stock, and the common stock put agreement with one of our founders expired. Accordingly, the remaining $547,000 related to the put agreement was reclassified to common stock. In addition, our authorized common stock increased from 12 million shares to 100 million shares.

F-18
Registration Rights Upon completion of our IPO, certain holders of shares of common stock have registration rights, including the right to require us to register the sale of their shares and the right to include their shares in public offerings we undertake in the future. We registered all shares of common stock that are issuable under our stock option plans and employee stock purchase plan, and they may be freely sold in the public market, subject to certain lock-up restrictions. Repurchase Option We or our designee had the option to repurchase all shares held by any shareholder that such shareholder proposed to sell, assign, pledge, encumber, transfer, or otherwise dispose of for value to a competitor. Such repurchases were at the same terms and conditions specified in a bona fide third party offer for any or all of such securities. The repurchase option lapsed upon our IPO. We repurchased the following shares pursuant to this repurchase option during the periods indicated (including shares repurchased pursuant to the Stock Put Agreement described below): Year Ended December 31, 2004 2003 Number of shares repurchased 23,562 61,776 Weighted average per share purchase price $8.40 $5.00
Stock Put Agreement We had a common stock put agreement with one of our original founders, which expired upon our IPO in December 2004. As part of the agreement, at the founder’s annual option on or before July 1, we were required to purchase common shares valued at up to $150,000 based on our last annual valuation. Additional common shares could be purchased at our discretion if so agreed to by the founder. In 2004, we purchased 15,790 shares at $9.50 per share and in 2003, we repurchased 30,000 shares at $5.00 per share. Common Stock Warrant In 1998, we issued a warrant for the purchase of 15,000 shares of our common stock at $3.80 per share. The warrant entitled the holder to additional shares upon the satisfaction of certain conditions, as defined in the agreement. During 1999, one such condition was satisfied, increasing the number of shares eligible for purchase under the warrant to 25,000. In December 2003, we issued 18,091 shares of our common stock upon the exercise of a portion of the warrants in exchange for $57,000 of cash and the surrender of the remaining warrants to purchase 6,909 shares of our common stock. The fair value of the initial 15,000 shares and the additional 10,000 shares under the warrant was determined using the Black-Scholes valuation model with the following assumptions: no dividend yield; risk-free interest rates of 4.45% and 6.19%, respectively; expected volatility of 81%; and contractual lives of 5.0 and 4.5 years, respectively. The fair value of these warrants was not material to the financial statements. Stock Option Plans Our stock incentive plans include our 1993 Stock Incentive Plan (the “1993 Plan”) and our 2000 Stock Incentive Plan (the “2000 Plan”) (together, the “Plans”) and provide for the granting to employees of either incentive stock options or nonqualified stock options. Incentive stock options must be granted at an exercise price not less than 100% of the fair market value per share at the grant date. Nonqualified stock options granted or shares sold under the Plans cannot be granted or sold at a price less than 85% of the fair market value per share at the date of grant or sale. The terms of options granted under the Plans is 10 years, and the right to exercise options granted generally vests 20% each year, with varying initial holding periods. The 1993 Plan expired during 2003 and any remaining unissued options were canceled. The 2000 Plan expires October 15, 2010. In addition, options currently outstanding under the 1993 Plan will not be available for reissuance upon cancellation. We have authorized a total of 1.8 million shares of common stock for issuance under the 2000 Plan.

F-19
At December 31, 2005, 386,500 shares were available for future grants, and we had 2,107,938 shares of our common stock reserved for future issuance under the Plans. Stock option activity for each of the years in the three-year period ended December 31, 2005 was as follows:
Options
Outstanding
Weighted Average
Exercise Price Outstanding at December 31, 2002 1,825,665 $3.98
Granted 380,450 5.26 Exercised (130,397) (0.81) Forfeited (302,223) (3.82)
Outstanding at December 31, 2003 1,773,495 4.52 Granted 496,250 11.71 Exercised (145,668) (1.38) Forfeited (185,989) (3.82)
Outstanding at December 31, 2004 1,938,088 6.65 Granted 288,550 13.83 Exercised (433,234) (4.39) Forfeited (71,966) (8.08)
Outstanding at December 31, 2005 1,721,438 $8.37 The following information relates to options outstanding and exercisable under the Plans at December 31, 2005:
Options Outstanding Options Exercisable
Range of exercise
price Number of
options
Weighted average
remaining contractual life (years)
Weighted average exercise
price Number of
options
Weighted average exercise
price $ 3.10 – 3.80 332,093 1.94 $ 3.33 332,093 $ 3.33 5.00 – 5.50 325,868 7.27 5.24 175,308 5.17 7.00 – 9.50 524,858 6.72 8.04 341,278 7.61 11.15 – 12.25 37,500 6.75 11.30 17,400 11.15 13.52 – 14.38 501,119 7.98 13.86 161,474 13.71 $ 3.10 – 14.38 1,721,438 6.27 $ 8.37 1,027,553 $ 6.83
At December 31, 2004 and 2003, 1,113,562 and 1,028,825 options, respectively, were exercisable at weighted average exercise prices of $5.03 per share and $3.65 per share, respectively. Deferred Stock-Based Compensation During 2003, we issued 380,450 options to employees and non-employee directors. Due to the difference between the exercise price and the estimated fair value of common stock, approximately $1.0 million of compensation expense is being amortized over the vesting period of five years. We recognized compensation expense of $122,000 in 2005, $326,000 in 2004 and $139,000 in 2003 related to these options. Additionally, in 2003, we recognized the remaining $38,000 in deferred stock-based compensation related to options issued to employees and non-employee directors prior to our attempted public offering in 2000. Previously recognized compensation expense related to unvested options that are forfeited is reversed in the quarter that the options are forfeited and no future amortization related to the forfeited options is recognized. Reversals of compensation expense totaled $46,000, $265,000 and $32,000 in 2005, 2004 and 2003, respectively.

F-20
Employee Stock Purchase Plan In February 2004, our board of directors approved the 2004 Employee Share Purchase Plan (the “2004 ESPP”) and the reservation of 400,000 shares of our common stock thereunder. The 2004 ESPP consists of two-year offering periods with four consecutive, overlapping six-month purchase periods commencing on the first trading day on or after February 1 and August 1 each year (the “Enrollment Date”). Based on the effective date of our IPO, the first offering period commenced on February 1, 2005 and ended on July 31, 2005. Any eligible employee may participate in the 2004 ESPP by completing a subscription agreement which allows participants to purchase up to 5,000 shares per six-month purchase period, at a purchase price of 85% of the fair market value of a share of common stock on the Enrollment Date or on the exercise date, whichever is lower. The exercise date is the last trading day of each offering period. If the purchase price is lower on the exercise date than on the Enrollment Date, the two-year offering period will terminate and a new two-year offering period will begin. Participating employees are automatically enrolled in the new offering period. During 2005, we issued 31,000 shares pursuant to the 2004 ESPP at a price of $8.93 per share and 369,000 shares remained available for purchase. NOTE 13. RELATED PARTY TRANSACTIONS Agilent Technologies Prior to our IPO, Agilent Technologies held all of the outstanding shares of Series A and 87,500 shares of the Series B. Upon our IPO, the Series A and Series B were converted into a total of 1,424,819 shares of our common stock and, as of December 31, 2005, Agilent held 798,957 shares of our common stock, which represented approximately 7.1% of our outstanding common stock. Certain other financial information related to Agilent was as follows: Year Ended December 31, 2005 2004 2003 Sales to Agilent $2.5 million $2.0 million $1.3 millionPurchases from Agilent $548,000 $327,000 $268,000Royalties paid to Agilent for non-exclusive license to
use certain patented technology relating to electrical measurement apparatuses $11,000 $9,000 $22,000
December 31, 2005 2004 Receivable from Agilent $171,000 $328,000 Payable to Agilent $35,000 $79,000
NOTE 14. EMPLOYEE BENEFIT PLAN We sponsor a 401(k) savings plan which allows eligible employees to contribute a certain percentage of their salary. We match 40% of eligible employees’ contributions, up to a maximum of 2% of the employees’ earnings. Our matching contribution for the savings plan was $230,000, $194,000 and $180,000, respectively, in 2005, 2004 and 2003.

F-21
NOTE 15. COMMITMENTS AND CONTINGENCIES Operating Leases and Subleases We lease office and manufacturing space under operating leases that expire at various dates through 2009. In addition to lease expense, we pay real property taxes, insurance and repair and maintenance expenses for our corporate office and manufacturing facility. We recognize rent expense related to our operating leases based on a straight-line basis over the life of the lease. Future minimum lease payments under noncancelable operating leases with initial or remaining terms in excess of one year are as follows (in thousands): Year Ending December 31, 2006 $ 2,410 2007 2,127 2008 1,518 2009 590 2010 - Thereafter - $ 6,645
Lease expense was $2.5 million, $2.5 million and $2.4 million, respectively, in 2005, 2004 and 2003. We plan to sublease certain office space to a third party. For this office space, during May 2002, we expensed the rental payments for the period of time the building would remain unoccupied and the difference between the expected rental sublease payments and our obligation under the lease. The total amount expensed was $628,000 and was not included in the total lease expense, but is included in the five-year payout table. The balance of the accrual at December 31, 2005 and 2004 was $30,000 and $102,000, respectively, and was included in accrued liabilities and other long-term liabilities on our consolidated balance sheets. Legal Proceedings We are involved in various claims and legal actions arising in the ordinary course of business. In the opinion of management, the ultimate disposition of these matters will not have a material adverse effect on our financial position, results of operations or liquidity. NOTE 16. SEGMENT REPORTING AND ENTERPRISE-WIDE DISCLOSURES The segment data below is presented in the same manner that management organizes the segments for assessing certain performance trends. Our Chief Operating Decision Maker monitors the revenue streams of engineering products and pyramid products. The Chief Operating Decision Maker has determined that the additional information previously prepared was arbitrary and did not provide useful information upon which to base operating decisions. As of January 2005, we only collect revenue data for each segment. Accordingly, the data for 2004 and 2003 has been reclassified to conform to the current period presentation. The following table summarizes revenue for each of our business segments. We do not track our operating income or assets on a segment level, and, accordingly, that information is not provided (in thousands): Year Ended December 31, 2005 2004 2003 External revenue from EPD $ 63,566 $ 58,467 $ 47,345 External revenue from PPD 10,071 5,948 3,211 $ 73,637 $ 64,415 $ 50,556

F-22
We are not able to provide revenue by product line or group of similar products as it would be impracticable to do so. Our revenues by geographic area were as follows (in thousands):
Year Ended December 31, 2005 2004 2003 United States $ 23,877 $ 24,762 $ 24,708Japan 15,085 14,909 11,838Taiwan 7,612 6,853 3,631Other 27,063 17,891 10,379
$ 73,637 $ 64,415 $ 50,556 Long-lived assets, exclusive of long-term investments and deferred income taxes, by geographic area were as follows (in thousands): December 31, 2005 2004 United States $ 5,993 $ 5,230 Japan 108 225 Other 18 19
$ 6,119 $ 5,474
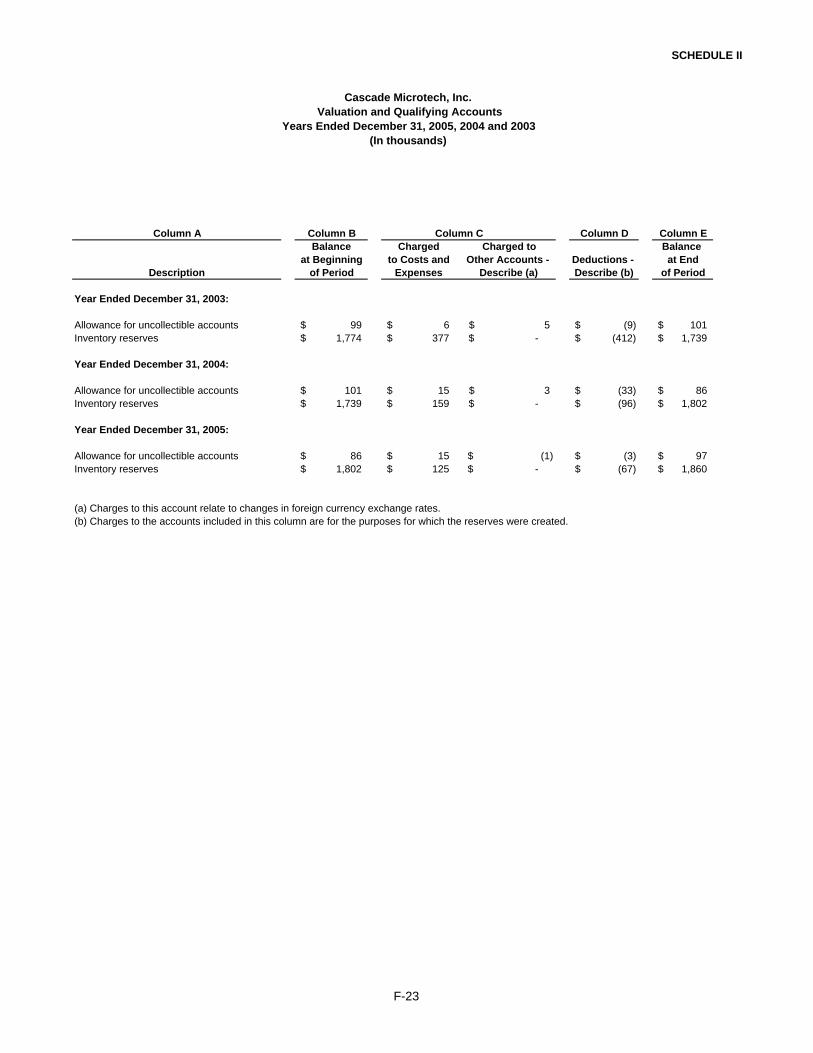
Cascade Microtech, Inc.Valuation and Qualifying Accounts
Years Ended December 31, 2005, 2004 and 2003(In thousands)
SCHEDULE II
Column A Column B Column C Column D Column EBalance Charged Charged to Balance
at Beginning to Costs and Other Accounts - Deductions - at EndDescription of Period Expenses Describe (a) Describe (b) of Period
Year Ended December 31, 2003:
Allowance for uncollectible accounts 99$ 6$ 5$ (9)$ 101$ Inventory reserves 1,774$ 377$ -$ (412)$ 1,739$
Year Ended December 31, 2004:
Allowance for uncollectible accounts 101$ 15$ 3$ (33)$ 86$ Inventory reserves 1,739$ 159$ -$ (96)$ 1,802$
Year Ended December 31, 2005:
Allowance for uncollectible accounts 86$ 15$ (1)$ (3)$ 97$ Inventory reserves 1,802$ 125$ -$ (67)$ 1,860$
(a) Charges to this account relate to changes in foreign currency exchange rates.(b) Charges to the accounts included in this column are for the purposes for which the reserves were created.
F-23

To Our Shareholders:
In 2005, our first full year as a public company, we are pleased to report that we achieved record revenue and profitability. Highlights for 2005 include:
• Revenues of $73.6 million, up 14% year over year• Engineering Products Division revenue grew 9% year over year • Production Probes Division revenue grew 69% year over year • Strong profitability with EPS of $0.70 per diluted share • Cash and investments at the end of the year were $51.9 million, up $5.4 million
from the end of last year
For the year, production probe card revenues were a record $10.1 million, up 69% over $5.9 million in 2004. We experienced strong demand from our customers in all geographical regions and expect the strong growth in production cards to continue during 2006.
The value propositions driving our Pyramid Probe growth are several unique advantages that reduce the cost of production testing, including unmatched parallelism for wirebonded chips, consistent electrical contact with less chip damage, long production lifetimes, and about ten times the electrical performance of any other production probe card. Many of our Pyramid cards are enabling known-good die measurements for system-in package and RF module applications.
We have invested heavily in our Pyramid Probe technology, and we expect to add significant Pyramid manufacturing capacity during 2006. To meet our customers’ emerging requirements, we are also pursuing an exciting Pyramid product roadmap, and we have increased R&D spending to address these requirements.
In our Engineering Products Division, revenues were $63.6 million in 2005, up 9% over $58.5 million in 2004. Our engineering probing tools continue to be the performance leader in the industry, which has helped us to grow our already high market share. These electrical metrology systems are used for process characterization, device characterization and modeling, reliability studies, and yield and failure analyses. Our customers continue to create new processes that shrink transistors and their interconnect wiring, increasingly requiring new materials. We see this increasing chip complexity as a continuing positive trend driving our engineering business.
Among other new product introductions in 2005, we introduced our first standard product offering for the life sciences research market, the L-Series Microfluidics Metrology System, which received a Product of the Year award from Electronics Products magazine.
In summary, we had a very good 2005. We achieved record earnings for the year and record revenues overall. We continued to serve a very broad and well-diversified customer list (over 800 customers during 2005). We continued to strengthen our management team and our sales channels. We have increased the portion of revenue from consumables, and we have shown financial leverage as we’ve grown probe card revenues.
I would like to personally thank our customers, partners, employees and board for helping to achieve these results. And finally, on behalf of your board and Cascade’s employees we would like to thank you for your support. We are optimistic about our prospects for 2006 and we look forward to your continued support.
Eric W. StridChairman, President and Chief Executive Officer
Executive ManagementEric W. StridCo-founder, Chairman, President and Chief Executive Officer
K. Reed GleasonCo-founder, Vice President, Advanced Development
Bruce A. McFaddenVice President, General Manager, Pyramid Probe Division
John E. PenceVice President, General Manager, Engineering Products Division
Steven SipowiczVice President, Finance and Chief Financial Officer
Board of Directors Eric W. StridCo-founder, Chairman, President and Chief Executive Officer
K. Reed GleasonCo-founder, Vice President, Advanced Development
Keith L. BarnesChairman, Chief Executive Officer, Electroglas, Inc.
F. Paul CarlsonPresident and Chief Executive Officer, The Carlson Group of Companies
Raymond A. LinkExecutive Vice President and Chief Financial Officer, FEI Company
George P. O’LearyFormer President and Chief Operating Officer, Floating Point Systems
William R. SpiveyRetired President and Chief Executive Officer, Luminent, Inc.
Transfer Agent and RegistrarMellon Investor Services LLC480 Washington BoulevardJersey City, New Jersey 07310-1900800-522-6645
Independent AuditorKPMG LLP1300 SW Fifth Avenue, Suite 3800Portland, Oregon 97201
Annual Meeting of Stockholders3 p.m., Friday, May 19, 2006Corporate Headquarters2430 NW 206th AvenueBeaverton, Oregon 97006
Corporate HeadquartersCascade Microtech, Inc.2430 NW 206th AvenueBeaverton, Oregon 97006503-601-1000www.cascademicrotech.com
Stock ListingNasdaq Stock ExchangeSymbol: CSCD
603675a1.indd 1-2603675a1.indd 1-2 4/4/06 8:37:49 PM4/4/06 8:37:49 PM

Cascade Microtech, Inc.2430 NW 206th AvenueBeaverton, Oregon 97006, USA Phone: 503-601-1000 Fax: 503-601-1002Europe: +44 1295-812828 Japan: +81 3-5478-6100Singapore: +65 6873 7482China: +8621 6340 4183
Email: [email protected] www.cascademicrotech.com
CMI-AR-0406
Copyright © 2006 Cascade Microtech, Inc. MicroChamber,
FemtoGuard, AttoGuard, Air Coplanar, EZ Probe, Eye-Pass,
Infinity Probe and the Cascade Microtech logo are trade-
marks of Cascade Microtech, Inc. All other trademarks are
the property of their respective owners.
Cascade Microtech, Inc.
2005 Annual Report
603675a1.indd 3-4603675a1.indd 3-4 4/4/06 8:37:51 PM4/4/06 8:37:51 PM