asa s12.13 tr hearing conservation
TRANSCRIPT
ANSI S12.13 TR–2002
ANSI TECHNICAL REPORT
Evaluating the Effectiveness of Hearing ConservationPrograms through Audiometric Data Base Analysis
Accredited Standards Committee S12, Noise
Acoustical Society of AmericaStandards Secretariat35 Pinelawn Road, Suite 114EMelville, New York 11747-3177
AN
SI S
12.1
3 T
R–2
002
The American National Standards Institute, Inc. (ANSI) is thenational coordinator of voluntary standards development and theclearinghouse in the U.S.A. for information on national and inter-national standards.
The Acoustical Society of America (ASA) is an organization of scien-tists and engineers formed in 1929 to increase and diffuse the knowl-edge of acoustics and to promote its practical applications.
ANSI Technical Report
Evaluating the Effectiveness ofHearing Conservation Programs
through Audiometric Data Base Analysis
Secretariat
Acoustical Society of America
ANSI Technical Report Registered: 26 August 2002
American National Standards Institute, Inc.
ABSTRACT
This ANSI Technical Report describes methods for evaluating the effectiveness of hearing conservationprograms in preventing occupational noise-induced hearing loss by using techniques for audiometric database analysis. The rationale is given for using the variability of threshold measurements in annual monitoringaudiograms as the basis for judging effectiveness. Guidelines are discussed concerning how to select arestricted data base to which the analysis procedures will be applied. Specific procedures for data analysisare defined, and criterion ranges are given for classifying program effectiveness as acceptable, marginal, orunacceptable. Sample results for industrial audiometric data bases contributed to Working GroupS12/WG12 are included as an annex for reference and illustration.
ANSI S12.13 TR - 2002
AMERICAN NATIONAL STANDARDS ON ACOUSTICS
The Acoustical Society of America (ASA) provides the Secretariat for AccreditedStandards Committees S1 on Acoustics, S2 on Mechanical Vibration and Shock, S3 onBioacoustics, and S12 on Noise. These committees have wide representation from thetechnical community (manufacturers, consumers, trade associations, general-interestand government representatives). The standards are published by the AcousticalSociety of America through the American Institute of Physics as American NationalStandards after approval by their respective standards committees and the AmericanNational Standards Institute.
These standards are developed and published as a public service to provide standardsuseful to the public, industry, and consumers, and to federal, state and local govern-ments.
Each of the Accredited Standards Committees [operating in accordance with proce-dures approved by American National Standards Institute (ANSI)] is responsible fordeveloping, voting upon, and maintaining or revising its own standards. The ASAStandards Secretariat administers committee organization and activity, and providesliaison between the Accredited Standards Committees and ANSI. After the standardshave been produced and adopted by the Accredited Standards Committees, andapproved as American National Standards by ANSI, the ASA Standards Secretariatarranges for their publication and distribution.
An American National Standard implies a consensus of those substantially concernedwith its scope and provisions. Consensus is established when, in the judgment of theANSI Board of Standards Review, substantial agreement has been reached by directlyand materially affected interests. Substantial agreement means much more than a sim-ple majority, but not necessarily unanimity. Consensus requires that all views andobjections be considered, and that a concerted effort be made toward their resolution.
The use of an American National Standard is completely voluntary. Their existencedoes not in any respect preclude anyone, whether he has approved the standards ornot, from manufacturing, marketing, purchasing, or using products, processes, or pro-cedures not conforming to the standards.
NOTICE: This Technical Report may be revised or withdrawn at any time. The proce-dures of the American National Standards Institute require that action be taken peri-odically to reaffirm, revise, or withdraw a standard.
Standards SecretariatAcoustical Society of America35 Pinelawn Road, Suite 114EMelville, New York 11747-3177Telephone 631-390-0215FAX 631-390-0217E-mail [email protected]
© 2002 by the Acoustical Society of America. This technical report may not be repro-duced in whole or in part in any form for sale, promotion, or any commercial purpose,or any purpose not falling within the provisions of the Copyright Act of 1976, withoutprior written permission of the publisher. For permission, address a request to theStandards Secretariat of the Acoustical Society of America.
i
ContentsPage
Foreword . . . . . . . . . . . . . . . . . . . . . . . . . . . . . . . . . . . . . . . . . . . . . . . . . . . . . . . . . . . . . . . . . . . . . . . . . . . . .iv0 Introduction . . . . . . . . . . . . . . . . . . . . . . . . . . . . . . . . . . . . . . . . . . . . . . . . . . . . . . . . . . . . . . . . . . . . . . . . .1
0.1 Need . . . . . . . . . . . . . . . . . . . . . . . . . . . . . . . . . . . . . . . . . . . . . . . . . . . . . . . . . . . . . . . . . . . . . . . . .10.2 Rationale . . . . . . . . . . . . . . . . . . . . . . . . . . . . . . . . . . . . . . . . . . . . . . . . . . . . . . . . . . . . . . . . . . . . . .10.3 Alternative Approaches . . . . . . . . . . . . . . . . . . . . . . . . . . . . . . . . . . . . . . . . . . . . . . . . . . . . . . . . . . . .10.4 Brief Historical Review . . . . . . . . . . . . . . . . . . . . . . . . . . . . . . . . . . . . . . . . . . . . . . . . . . . . . . . . . . . .20.5 Report Development Process . . . . . . . . . . . . . . . . . . . . . . . . . . . . . . . . . . . . . . . . . . . . . . . . . . . . . . .20.6 Benefits of ADBA . . . . . . . . . . . . . . . . . . . . . . . . . . . . . . . . . . . . . . . . . . . . . . . . . . . . . . . . . . . . . . . .2
0.6.1 Enhancing Prevention of Noise-Induced Hearing Loss . . . . . . . . . . . . . . . . . . . . . . . . . . . . . . .20.6.2 Providing Cost-Effective Data for Regulatory Compliance . . . . . . . . . . . . . . . . . . . . . . . . . . . . .30.6.3 Guiding Internal Management Decisions . . . . . . . . . . . . . . . . . . . . . . . . . . . . . . . . . . . . . . . . .30.6.4 Motivating Workers and Supervisors . . . . . . . . . . . . . . . . . . . . . . . . . . . . . . . . . . . . . . . . . . . . .4
1 Scope, purpose and applications . . . . . . . . . . . . . . . . . . . . . . . . . . . . . . . . . . . . . . . . . . . . . . . . . . . . . . . . .41.1 Scope . . . . . . . . . . . . . . . . . . . . . . . . . . . . . . . . . . . . . . . . . . . . . . . . . . . . . . . . . . . . . . . . . . . . . . . . .41.2 Purpose . . . . . . . . . . . . . . . . . . . . . . . . . . . . . . . . . . . . . . . . . . . . . . . . . . . . . . . . . . . . . . . . . . . . . . .41.3 Applications . . . . . . . . . . . . . . . . . . . . . . . . . . . . . . . . . . . . . . . . . . . . . . . . . . . . . . . . . . . . . . . . . . . .4
1.3.1 Assumptions . . . . . . . . . . . . . . . . . . . . . . . . . . . . . . . . . . . . . . . . . . . . . . . . . . . . . . . . . . . . . .41.3.1.1 Effective Hearing Conservation Program . . . . . . . . . . . . . . . . . . . . . . . . . . . . . . . . . .41.3.1.2 Audiometric Variability as an Indicator . . . . . . . . . . . . . . . . . . . . . . . . . . . . . . . . . . .41.3.1.3 Analysis of a Restricted Data Base . . . . . . . . . . . . . . . . . . . . . . . . . . . . . . . . . . . . . . .51.3.1.4 Reliance on ADBA Results . . . . . . . . . . . . . . . . . . . . . . . . . . . . . . . . . . . . . . . . . . . .51.3.1.5 Interpretation of Undesirable Results . . . . . . . . . . . . . . . . . . . . . . . . . . . . . . . . . . . . .5
1.3.2 Data Requirements . . . . . . . . . . . . . . . . . . . . . . . . . . . . . . . . . . . . . . . . . . . . . . . . . . . . . . . . .51.3.2.1 Annual Audiometry . . . . . . . . . . . . . . . . . . . . . . . . . . . . . . . . . . . . . . . . . . . . . . . . . .51.3.2.2 Constant Restricted Population . . . . . . . . . . . . . . . . . . . . . . . . . . . . . . . . . . . . . . . . .51.3.2.3 Minimum Number of Audiograms . . . . . . . . . . . . . . . . . . . . . . . . . . . . . . . . . . . . . . .51.3.2.4 Representative Restricted Population . . . . . . . . . . . . . . . . . . . . . . . . . . . . . . . . . . . . .51.3.2.5 Minimum Size of Restricted Population . . . . . . . . . . . . . . . . . . . . . . . . . . . . . . . . . . .51.3.2.6 Identification of Obvious Contaminants in the Data . . . . . . . . . . . . . . . . . . . . . . . . .51.3.2.7 Audiometric Testing During Workshifts . . . . . . . . . . . . . . . . . . . . . . . . . . . . . . . . . . .6
2 References . . . . . . . . . . . . . . . . . . . . . . . . . . . . . . . . . . . . . . . . . . . . . . . . . . . . . . . . . . . . . . . . . . . . . . . . . .63 Definitions . . . . . . . . . . . . . . . . . . . . . . . . . . . . . . . . . . . . . . . . . . . . . . . . . . . . . . . . . . . . . . . . . . . . . . . . . .74 Recommended ADBA Statistics . . . . . . . . . . . . . . . . . . . . . . . . . . . . . . . . . . . . . . . . . . . . . . . . . . . . . . . . . .7
4.1 Procedures . . . . . . . . . . . . . . . . . . . . . . . . . . . . . . . . . . . . . . . . . . . . . . . . . . . . . . . . . . . . . . . . . . . . .74.2 Criterion Ranges . . . . . . . . . . . . . . . . . . . . . . . . . . . . . . . . . . . . . . . . . . . . . . . . . . . . . . . . . . . . . . . . .7
5 Implementing the Procedures . . . . . . . . . . . . . . . . . . . . . . . . . . . . . . . . . . . . . . . . . . . . . . . . . . . . . . . . . . . .75.1 Selecting the Restricted Data Base . . . . . . . . . . . . . . . . . . . . . . . . . . . . . . . . . . . . . . . . . . . . . . . . . . .7
5.1.1 Early Tests . . . . . . . . . . . . . . . . . . . . . . . . . . . . . . . . . . . . . . . . . . . . . . . . . . . . . . . . . . . . . . . .85.1.2 Later Tests . . . . . . . . . . . . . . . . . . . . . . . . . . . . . . . . . . . . . . . . . . . . . . . . . . . . . . . . . . . . . . . .8
5.2 Examining the Data for Contamination . . . . . . . . . . . . . . . . . . . . . . . . . . . . . . . . . . . . . . . . . . . . . . . .85.3 Applying the ADBA Procedures . . . . . . . . . . . . . . . . . . . . . . . . . . . . . . . . . . . . . . . . . . . . . . . . . . . . .8
5.3.1 Percent Worse Sequential (%Ws) . . . . . . . . . . . . . . . . . . . . . . . . . . . . . . . . . . . . . . . . . . . . . . .85.3.2 Percent Better or Worse Sequential (%BWs) . . . . . . . . . . . . . . . . . . . . . . . . . . . . . . . . . . . . . . .8
6 Interpreting the Results . . . . . . . . . . . . . . . . . . . . . . . . . . . . . . . . . . . . . . . . . . . . . . . . . . . . . . . . . . . . . . . . .96.1 Classifying HCP Effectiveness . . . . . . . . . . . . . . . . . . . . . . . . . . . . . . . . . . . . . . . . . . . . . . . . . . . . . . .96.2 Identifying Sources of High Variability . . . . . . . . . . . . . . . . . . . . . . . . . . . . . . . . . . . . . . . . . . . . . . . .9
ii
AnnexesA Population Comparison ADBA Techniques . . . . . . . . . . . . . . . . . . . . . . . . . . . . . . . . . . . . . . . . . . . . . . . . . .9
A.1 Comparisons at One Point in Time . . . . . . . . . . . . . . . . . . . . . . . . . . . . . . . . . . . . . . . . . . . . . . . . . . .9A.2 Comparisons of Longitudinal Hearing Level Trends . . . . . . . . . . . . . . . . . . . . . . . . . . . . . . . . . . . . . .10A.3 References . . . . . . . . . . . . . . . . . . . . . . . . . . . . . . . . . . . . . . . . . . . . . . . . . . . . . . . . . . . . . . . . . . . .10
B Rates of OSHA STS as an Indicator . . . . . . . . . . . . . . . . . . . . . . . . . . . . . . . . . . . . . . . . . . . . . . . . . . . . . . .10B.1 Common Use of STS Rates . . . . . . . . . . . . . . . . . . . . . . . . . . . . . . . . . . . . . . . . . . . . . . . . . . . . . . . .10B.2 Reasons for Excluding STS Rates from this Report . . . . . . . . . . . . . . . . . . . . . . . . . . . . . . . . . . . . . .10B.3 References . . . . . . . . . . . . . . . . . . . . . . . . . . . . . . . . . . . . . . . . . . . . . . . . . . . . . . . . . . . . . . . . . . . .10
C Research Performed by S12/WG12 . . . . . . . . . . . . . . . . . . . . . . . . . . . . . . . . . . . . . . . . . . . . . . . . . . . . . . .11C.1 Data Tape Availability . . . . . . . . . . . . . . . . . . . . . . . . . . . . . . . . . . . . . . . . . . . . . . . . . . . . . . . . . . . .11C.2 Procedures Evaluated . . . . . . . . . . . . . . . . . . . . . . . . . . . . . . . . . . . . . . . . . . . . . . . . . . . . . . . . . . . .11C.3 Recommended Procedures . . . . . . . . . . . . . . . . . . . . . . . . . . . . . . . . . . . . . . . . . . . . . . . . . . . . . . . .12C.4 Data Base Comparisons Used to Define Criterion Ranges . . . . . . . . . . . . . . . . . . . . . . . . . . . . . . . . .12C.5 Defining the Criterion Ranges . . . . . . . . . . . . . . . . . . . . . . . . . . . . . . . . . . . . . . . . . . . . . . . . . . . . . .13C.6 Conclusions and Recommendations . . . . . . . . . . . . . . . . . . . . . . . . . . . . . . . . . . . . . . . . . . . . . . . . .13C.7 References . . . . . . . . . . . . . . . . . . . . . . . . . . . . . . . . . . . . . . . . . . . . . . . . . . . . . . . . . . . . . . . . . . . .13
D Analysis Example . . . . . . . . . . . . . . . . . . . . . . . . . . . . . . . . . . . . . . . . . . . . . . . . . . . . . . . . . . . . . . . . . . . .17
Tables Table 1 Criterion ranges (in percent) for rating HCP performance using the values of the statistics Percent
Worse Sequential (%Ws) and Percent Better or Worse Sequential (%BWs) . . . . . . . . . . . . . . . . . . . . . .7Table D1 Steps in implementing ADBA . . . . . . . . . . . . . . . . . . . . . . . . . . . . . . . . . . . . . . . . . . . . . . . . . . . . . .17Table D2 Example of determining whether an individual employee will be included in the Percent Worse
sequential (%Ws) and Percent Better or Worse sequential (%BWs) statistics in each of three sequential test comparisons . . . . . . . . . . . . . . . . . . . . . . . . . . . . . . . . . . . . . . . . . . . . . . . . . . . . . . .17
iii
Figures Fig. 1 Sequence of events in a worker’s noise exposure history showing how ADBA indicates an
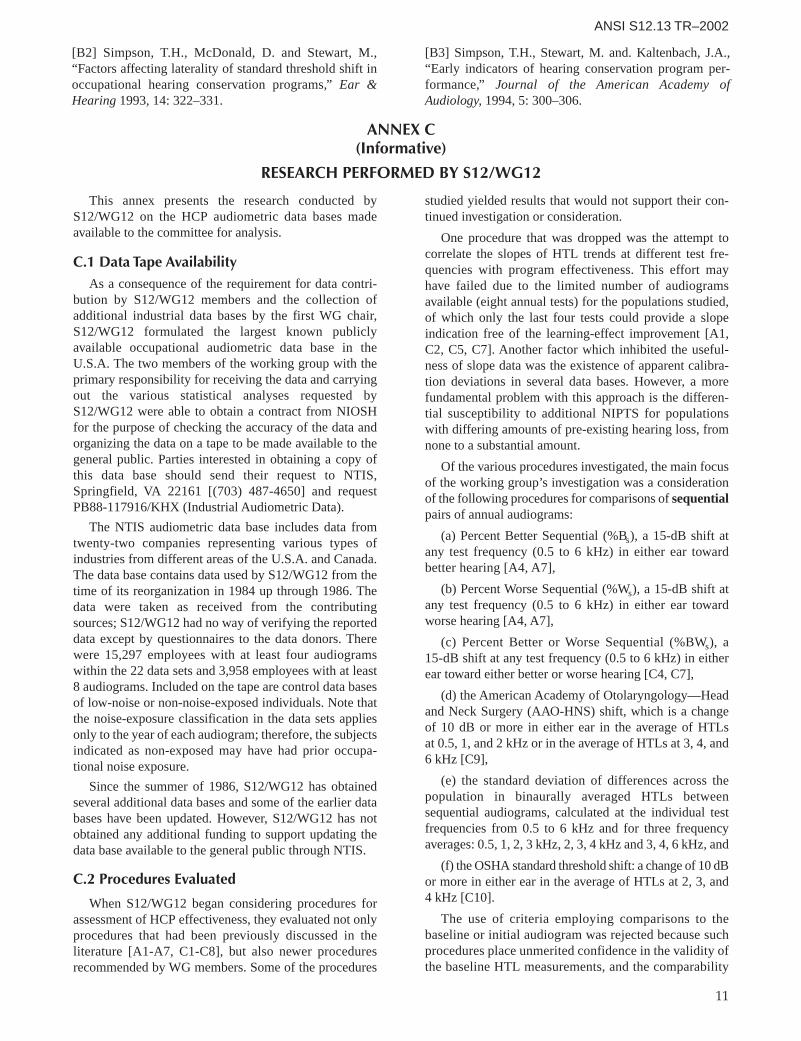
inadequate degree of employee protection before a confirmed OSHA STS develops . . . . . . . . . . . . . .3Fig. C1 Distribution of %Ws values in sequential comparisons of tests 1-4 . . . . . . . . . . . . . . . . . . . . . . . . . .14Fig. C2 Distribution of %Ws values in sequential comparisons of tests 5-8 . . . . . . . . . . . . . . . . . . . . . . . . . .14Fig. C3 Distribution of %BWs values in sequential comparisons of tests 5-8 . . . . . . . . . . . . . . . . . . . . . . . . .14Fig. C4 Distribution of percent AAO-HNS shifts in sequential comparisons of tests 1-4 . . . . . . . . . . . . . . . . .14Fig. C5 Distribution of percent AAO-HNS shifts in sequential comparisons of tests 5-8 . . . . . . . . . . . . . . . . .14Fig. C6 Distribution of standard deviations of differences in HTLs at single audiometric test
frequencies in sequential comparisons of tests 1-4 for control data bases . . . . . . . . . . . . . . . . . . . . .14Fig. C7 Distribution of standard deviations of differences in HTLs at single audiometric test
frequencies in sequential comparisons of tests 5-8 for control data bases . . . . . . . . . . . . . . . . . . . . .15Fig. C8 Distribution of standard deviations of differences in HTLs at single audiometric test
frequencies in sequential comparisons of tests 1-4 for non-control data bases . . . . . . . . . . . . . . . . .15Fig. C9 Distribution of standard deviations of differences in HTLs at single audiometric test
frequencies in sequential comparisons of tests 5-8 for non-control data bases . . . . . . . . . . . . . . . . .15Fig. C10 Distribution of standard deviations of differences in HTLs at averaged audiometric test
frequencies in sequential comparisons of tests 1-4 for control data bases . . . . . . . . . . . . . . . . . . . . .15Fig. C11 Distribution of standard deviations of differences in HTLs at averaged audiometric test
frequencies in sequential comparisons of tests 5-8 for control data bases . . . . . . . . . . . . . . . . . . . . .16Fig. C12 Distribution of standard deviations of differences in HTLs at averaged audiometric test
frequencies in sequential comparisons of tests 1-4 for non-control data bases . . . . . . . . . . . . . . . . .16Fig. C13 Distribution of standard deviations of differences in HTLs at averaged audiometric test
frequencies in sequential comparisons of tests 5-8 for non-control data bases . . . . . . . . . . . . . . . . .16Fig. D1 Mean hearing levels on the latest audiogram for noise exposure groups subdivided by race . . . . . . .18Fig. D2 Mean hearing levels at 2-6 kHz on the most recent five approximately annual audiograms
for noise-exposed subjects, as a function of mean age at the time of each test . . . . . . . . . . . . . . . . .19Fig. D3 Mean hearing levels at 2-6 kHz on the most recent five approximately annual audiograms for
non-noise-exposed subjects, as a function of mean age at the time of each test . . . . . . . . . . . . . . . .19Fig. D4 Percent Worse sequential results over the most recent four test comparisons for noise-exposed
and non-noise-exposed groups . . . . . . . . . . . . . . . . . . . . . . . . . . . . . . . . . . . . . . . . . . . . . . . . . . . . .20Fig. D5 Percent Better or Worse sequential results over the most recent four test comparisons for
noise-exposed and non-noise-exposed groups . . . . . . . . . . . . . . . . . . . . . . . . . . . . . . . . . . . . . . . . .20

iv
FOREWORD
[This foreword is for information only and is not an integral part of ANSI S12.13 TR - 2002 ANSI TechnicalReport Evaluating the Effectiveness of Hearing Conservation Programs through Audiometric Data BaseAnalysis]
This ANSI Technical Report is a revision of Draft American National StandardS12.13-1991, which was published for a period of trial use and comment regardingthe validity and usefulness of the recommended procedures for evaluating the effec-tiveness of hearing conservation programs (HCPs) through audiometric data baseanalysis (ADBA), and later unsuccessfully balloted for approval as a full standard.The ADBA procedures described are those recommended by the members of S12Working Group 12 (S12/WG12) based on the results from their original research inapplying suggested procedures to actual audiometric data bases (see Annex C), aswell as the additional experience and feedback obtained from S12/WG12 membersand other interested users following publication of the draft standard.
In spite of the unsuccessful ballot to convert the draft standard to a full standard, S12deemed the contents of the document of substantial value for the hearing conserva-tion community, and hence decided to publish them for guidance as an ANSITechnical Report. The substantive negative comments during the balloting involvedthe following issues:
a) the possibility that gradual hearing loss in excess of that due to aging mayoccur in subgroups of the population evaluated in spite of acceptable ADBAcriteria results on a year-to-year basis,
b) objections to the year-to-year nature of ADBA evaluations, which inten-tionally provide a set of indicators with values that vary annually to reflectcurrent HCP status changes to alert personnel to incipient problems (incontrast to a single overall indicator across a long period of time),
c) concern that an inadequate selection of restricted groups for analysis by theevaluator might lead to failure to detect that different subgroups of the HCPpopulation may show lesser degrees of protection from noise than the groupselected for analysis,
d) the derivation of the numerical ranges for the criteria, e) the fact that this results-oriented method does not address failures of
omission by the HCP (such as failure to identify and include all noise-exposed individuals in the program) or failures of implementation by theHCP (such as failure to provide annual educational programs).
The Working Group chair did not elect to pursue reversal of the negative votesbecause the scope of changes desired by negative voters would have fundamentallyaltered the nature of the document. The ADBA method was developed as a tool forevaluating HCP effectiveness in terms of audiometric data variability from year toyear. Other types of methods that reflect cumulative hearing loss over time arebriefly described in Annexes A and B, but the intent of this document was to describeonly the ADBA method.
v
Publication of this ANSI Technical Report has been approved by the Acoustical Societyof America. This document is registered as a Technical Report in a series of publicationsaccording to the Procedures for the Registration of ANSI Technical Reports. This documentis not an American National Standard and the material contained herein is not normativein nature. Comments on the content of this document should be sent to the followingaddress:
Acoustical Society of AmericaStandards Secretariat35 Pinelawn Road, Suite 114EMelville, New York 11747-3177Tel: 631-390-0215Fax: 631-390-0217E-Mail: [email protected]
This ANSI Technical Report was developed under the jurisdiction of AccreditedStandards Committee S12, Noise, which has the following scope:
Standards, specifications, and terminology in the field of acoustical noisepertaining to methods of measurement, evaluation, and control, includingbiological safety, tolerance, and comfort, and physical acoustics as relatedto environmental and occupational noise.
At the time this ANSI Technical Report was submitted to Accredited StandardsCommittee S12, Noise, for final approval, the membership was as follows:
P.D. Schomer, ChairR.D. Hellweg, Vice Chair
S. Blaeser, Secretary
Abbott Labs . . . . . . . . . . . . . . . . . . . . . . . . . . . . . . . . . . . . . . . . . . . . . . . . . . . . . . . . . . . .D. Walton, B.Muto (Alt.)Acoustical Society of America (ASA) . . . . . . . . . . . . . . . . . . . . . . . . . . . . . . . . . . .B.M. Brooks, W.J. Galloway (Alt.)Air-conditioning & Refrigeration Institute . . . . . . . . . . . . . . . . . . . . . . . . . . . . . . . . . . . . .R. Seel, M. Darbeau (Alt.)Aluminum Company of America (ALCOA) . . . . . . . . . . . . . . . . . . . . . . . . . . . . . . . . . . . . . . . . . . . .W.D. GallagherAmerican Academy of Otolaryngology–Head & Neck Surgery, Inc. (AAO–HNS) . . .R.A. Dobie, L.A. Michael (Alt.)American Industrial Hygiene Association (AIHA) . . . . . . . . . . . . . . . . . . . . . . . . . . . . . .D. Driscoll, J. Banach (Alt.)American Otological Society (AOS) . . . . . . . . . . . . . . . . . . . . . . . . . . . . . . . . . . . . . . . . . . . . . . . . . . .R.F. NauntonAmerican Speech-Language-Hearing Assoc. (ASHA) . . . . . . . . . . . . . . . . . . . . . . . . . . . .G. Linn, R. Levinson (Alt.)Audio Engineering Society, Inc. (AES) . . . . . . . . . . . . . . . . . . . . . . . . . . . . . . . . . . . . . . .M.R. Chial, D. Queen (Alt.)Brüel & Kjaer Instruments, Inc. . . . . . . . . . . . . . . . . . . . . . . . . . . . . . . . . . . . . . . . . . . . .M. Alexander, J. Chou (Alt.)Caterpillar, Inc. . . . . . . . . . . . . . . . . . . . . . . . . . . . . . . . . . . . . . . . . . . . . . . . . . . . . . . . . .K.G. Meitl, D. Roley (Alt.)Compressed Air and Gas Institute . . . . . . . . . . . . . . . . . . . . . . . . . . . . . . . . . . .J.H. Addington, D.R. Bookshar (Alt.)Council for Accreditation in Occupational Hearing Conservation (CAOHC) . . . . . . . .R.D. Bruce, E.H. Berger (Alt.)E-A-R/Aearo Company . . . . . . . . . . . . . . . . . . . . . . . . . . . . . . . . . . . . . . . . . . . . . . . . . . . . . . . . . . . . . .E.H. BergerHoward Leight Industries . . . . . . . . . . . . . . . . . . . . . . . . . . . . . . . . . . . . . . . . . . . . . . . . . . .V. Larson, E. Woo (Alt.)Information Technology Industry Council (ITI) . . . . . . . . . . . . . . . . . . . . . . . . . . .R.D. Hellweg, W.H. Johnson (Alt.)Institute of Noise Control Engineering (INCE) . . . . . . . . . . . . . . . . . . . . . . . . . . . . . . . . .B. Tinianov, M. Lucas (Alt.)International Safety Equipment Association (ISEA) . . . . . . . . . . . . . . . . . . . . . . . . . . . . .J. Birkner, J.C. Bradley (Alt.)James, Anderson & Associates (JAA) . . . . . . . . . . . . . . . . . . . . . . . . . . . . . . . . . . . .L.D. Hager, R.R. Anderson (Alt.)Larson·Davis, Inc. . . . . . . . . . . . . . . . . . . . . . . . . . . . . . . . . . . . . . . . . . . . . . . . . . . . . . .L. Davis, L. Harbaugh (Alt.)National Council of Acoustical Consultants (NCAC) . . . . . . . . . . . . . . . . . . . . . . . . . . . . . . . . . . . . . . . . .J. ErdreichNational Hearing Conservation Association (NHCA) . . . . . . . . . . . . . . . . . . . . . . . . . . . . . . . . . . . . . . . .K. MichaelNoise Pollution Clearinghouse . . . . . . . . . . . . . . . . . . . . . . . . . . . . . . . . . . . . . . . . . . . . . . . . . . . . . . .L. BlombergNorth American Insulation Manufacturers Association . . . . . . . . . . . . . . . . . . . . . . . . .R. Godfrey, R. Moulder (Alt.)Power Tool Institute, Inc. . . . . . . . . . . . . . . . . . . . . . . . . . . . . . . . . . . . . . . . . . . . . . . . .S. Broadbent, J. Nosko (Alt.)
vi
Working Group S12/WG12, Evaluation of Hearing Conservation Programs, which assisted Accredited StandardsCommittee S12, Noise, in the preparation of this ANSI Technical Report, had the following membership:
J.D. Royster, ChairE.H. Berger, Vice-Chair
U.S. Air Force . . . . . . . . . . . . . . . . . . . . . . . . . . . . . . . . . . . . . . . . . . . . . . . . . . . . . . . . . . . . . . . . . . . .R. McKinleyU.S. Army Aeromedical Research Lab . . . . . . . . . . . . . . . . . . . . . . . . . . . . . . . . . . . . . . .W. Ahroon, D. Ostler (Alt.)U.S. Army Center For Health Promotional and Preventative Medicine . . . . . . . . . . . . .G.A. Luz, W.A. Russell (Alt.)U.S. Army Construction Engineering Lab (USCERL) . . . . . . . . . . . . . . . . . . . . . . . . . . . . . . . . . . . . . . . . . . . L. Pater U.S. Army Human Research & Engineering Directorate (HRED) . . . . . . . . . . . . . . . . . . . .J. Kalb, T.R. Letowski (Alt.)U.S. Department of Transportation . . . . . . . . . . . . . . . . . . . . . . . . . . . . . . . . . . . . . . . . . . . . . . . . . . . . .A. KonheimU.S. Naval Surface Warfare Center (NSWC) . . . . . . . . . . . . . . . . . . . . . . . . . . . . . . . . . .S.A. Fisher, J. Niemiec (Alt.)
Individual Experts of Accredited Standards Committee S12, Noise, were:
P.K. BaadeR.W. BensonL. BeranekE.H. BergerS.H.P. BlyB.M. BrooksK.M. EldredL.S. FinegoldW.J. Galloway
R.D. HellwigR.K. HillquistD.L. JohnsonW.W. LangG.C. MalingA.H. MarshR.J. PeppinJ. PopeL.H. Royster
P.D. SchomerJ.P. SeilerL.C. SutherlandW.R. ThorntonH.E. von GierkeL.A. WilberG.E. WinzerG.S.K. WongR.W. Young
A. Behar C. Dixon-ErnstJ.R. FranksJ.W. JabaraD.L. Johnson
M.M. McDaniel S.C. Megerson W. MelnickM. RobertsL.H. Royster
T.Y. SchulzA.P. StewartA. SuterE. Toothman
When preparation of this ANSI Technical Report was begun, Larry H. Royster was WG chair.
Suggestions for improvement will be welcomed. Send suggestions for improvement to Accredited StandardsCommittee S12, Noise, in care of the ASA Standards Secretariat, 35 Pinelawn Road, Suite 114E, Melville, New York11747-3177. Telephone: +1 631-390-0215; FAX: +1 631-390-0217.

1
ANSI S12.13 TR–2002
ANSI TECHNICAL REPORT
Evaluating the Effectiveness ofHearing Conservation Programsthrough Audiometric Data BaseAnalysis
0 INTRODUCTION
0.1 Need
Hearing conservation programs (HCPs) have beenimplemented in occupational, military, and other settingsto protect noise-exposed populations from developingoccupational hearing loss, which negatively affects indi-viduals’ quality of life. For industry in the U.S.A., theOccupational Safety and Health Administration (OSHA)has promulgated regulations defining minimum standardswhich the employer must follow in implementing anHCP. Similar requirements also exist for the miningindustry (regulated by the Mine Safety and HealthAdministration) and HCPs in the military. However, theseregulations currently give no guidance for determiningprogram effectiveness.
Without evaluation procedures based on objective data,it is difficult for the personnel responsible for administer-ing the HCP to determine whether the program is actuallypreventing occupational noise-induced hearing loss.Several authors [5–13] have discussed the need for systematic procedures to assess whether noise-exposedpopulations are being adequately protected and to identifyany inadequacies in the HCP. The goal of standardizingprocedures for audiometric data base analysis (ADBA) isto give objective data concerning HCP effectiveness tomanagement, to the key individual responsible for theentire HCP, and to other personnel involved in implement-ing the program (safety professionals, industrial hygienists,noise control engineers, audiometric technicians, fitters ofhearing protectors, audiologists, medical directors, anddepartmental supervisors who enforce hearing protectorutilization). HCP personnel need information about theprogram’s performance to make decisions about HCP policies, to achieve and maintain adequate employee protection, to justify resource allocations, and to motivatesupervisors and employees [11,12]. In addition, a methodfor using audiometric data to judge HCP effectivenesscould be useful to regulatory compliance officers.
0.2 Rationale
Because the purpose of HCPs is to prevent occupa-tional hearing loss, the results of monitoring audiometryfor noise-exposed personnel provide the obvious test ofwhether the HCP has been successful. However, audio-gram results cannot alert the audiologist or physician
reviewer to incipient hearing loss if the thresholdmeasurements are so variable that beginning hearingshifts cannot be identified. Likewise, unreliable datainvalidate attempts to assess long-term population hearinglevel trends. Even if the noise-exposed population is notdeveloping occupational hearing loss, poor quality audio-metric monitoring data render the HCP ineffectivebecause professional audiogram reviewers cannot dis-criminate spurious threshold shifts from real hearingchanges. The employer is penalized by having to dealwith follow-up actions for shift rates which are inflated bypoor quality data.
This report provides procedures for evaluating HCPeffectiveness based on the variability in serial monitoringaudiometry for the noise-exposed population. Year-to-year audiometric variability is selected as the basis for theADBA procedures specified in this report because itprovides an immediate indication of data problems. Theevaluator is alerted by the high variability to investigatewhether it results from inadequate protection fromoccupational noise, or from poor control of audiometrictesting factors. Either way, corrective actions can be takenbefore many individual employees develop significantthreshold shifts.
0.3 Alternative Approaches
Other valid approaches using population audiometricdata to judge HCP effectiveness exist, but they are notamenable to standardization because their use requires theevaluator to make case-by-case judgments rather thanapplying a fixed set of criterion ranges to the results. Forthe reader’s convenience, some of these techniques aresummarized in Annex A.
Annual rates of OSHA standard threshold shifts(STSs) are frequently used as a measure of HCP effec-tiveness, but these rates cannot be interpreted in a mean-ingful way without knowing relevant characteristics ofboth the noise-exposed population and the audiometricdata. Therefore, OSHA STS rates do not provide an indi-cator which is amenable to standardization. Furtherdetails are provided for the reader in Annex B.
Checklist or audit approaches to evaluating HCPs arealso in common use, but these approaches usually merelytally the observed completeness of a program, or its nom-inal regulatory compliance, without assessing the qualityof the program elements that are present. Sample check-lists are available which attempt to address qualitative fac-tors [14,15]. However, the usefulness of such auditsdepends on the expertise of the evaluator in recognizingthe difference between cursory lip service to programrequirements versus meaningful implementation.
Task-based statistics regarding HCP implementation(such as the percentage of audiograms administered ontime, the percentage of retests obtained promptly, the per-centage of employees observed to be wearing hearing
2
ANSI S12.13 TR–2002
protectors, etc.) provide information that is useful toadministrators, but these data do not indicate how wellemployees were actually protected from noise. Likewise,exposure statistics (such as the percent of the workforce inpotentially hazardous noise, or reductions in daily noiseexposures) are also useful, but they do not address theeffectiveness of the HCP in preventing noise-inducedhearing damage for those workers who are exposed.
0.4 Brief Historical Review
Summaries of research to analyze industrial hearingdata have been published [5,12,13]. The first known useof audiometric data by a regulatory agency occurred in1971, when the North Carolina OSHA program reservedthe option not to issue a noise citation to a company whereworkers’ OSHA time-weighted average noise exposures(TWAs) exceeded 90 dBA if the company had a goodsafety record, had implemented a complete HCP, andwould make available the company’s audiometric recordsfor analysis [16]. Governmental evaluation of group audio-metric data is currently practiced in British Columbia,Canada, where the Worker’s Compensation Board ofBritish Columbia receives audiometric results annuallyfrom each employer, processes the records, and reports tothe employer various statistics concerning the data whichallow different employers’ HCPs to be compared [17].
0.5 Report Development Process
The S12 Working Group 12 (S12/WG12) was reorgan-ized during the spring of 1984 with a strong emphasis onparticipation by representatives of industries and organi-zations that would be the most likely users of any recom-mendations made by the committee. Working groupmembers were selected for their experience and involve-ment with HCPs. To create a large data base whichS12/WG12 could use for its research, all working groupmembers with access to HCP audiometric data bases wererequired to make them available for study purposes. It wasstipulated that only the chair and the member ofS12/WG12 primarily responsible for data analysis wouldknow the sources of the data.
As a result of the requirement for data contribution byworking group members and the collection of additionalindustrial data bases by L.H. Royster, S12/WG12 formu-lated the largest known industrial audiometric data baseavailable for research purposes in the USA. All proce-dures suggested by members as potentially useful analysistechniques were tested by applying them to the con-tributed data bases. The results from these analyses per-formed on behalf of the working group enabled the mem-bers to compare different techniques and develop criterionranges for selected procedures.
S12/WG12 recommendations were published as DraftANSI S12.13-1991, which included criterion ranges forthree procedures. The research undertaken by S12/WG12
in developing their draft standard is described as Annex C,which includes summary analysis results.
Further experience with the procedures, as well ascomments received from other users, led S12/WG12 toeliminate one of the draft standard procedures (standarddeviation of differences in hearing threshold levels) fromthe current report because it proved less sensitive to dataquality than the two remaining procedures, which are alsosimpler to use.
0.6 Benefits of ADBA
0.6.1 Enhancing Prevention of Noise-Induced HearingLoss In occupational HCPs in the U.S.A. today, audiome-try is typically conducted only for the purpose of deter-mining if any employees have developed a standardthreshold shift (STS), defined by OSHA’s HearingConservation Amendment [18] as a change of 10 dB ormore in the average of hearing levels at 2, 3, and 4 kHz ineither ear from baseline values (usually with optional agecorrections applied). In the U.S. military services, audio-grams are reviewed to detect both OSHA STSs andanother defined shift [19]. Few HCPs review audiogramsto detect and follow up on other non-regulated significanthearing shifts in individuals, and very few analyze groupdata to evaluate program performance except by annualSTS rates (see Annex A). Therefore, the potential of theaudiometric data base to indicate HCP effectiveness islargely untapped.
Annual audiometry has been criticized in the literature[20–22] based on the high variability of hearing thresholdmeasurements and the resulting difficulty in reliablydetecting the small hearing shifts expected in sensitiveindividuals with typical daily exposures (most OSHATWAs are less than 90 dBA). However, this criticism ofaudiometry is invalid if audiometric data are used todetect increased variability from temporary thresholdshift in the population before the assumed related perma-nent hearing loss becomes detectable. In addition, ifADBA is used to identify and correct excess variabilityrelated to testing factors, then smaller shifts can be recog-nized. The concept of detecting high variability in thehearing threshold level measurements before permanenthearing loss develops is fundamental to ADBA.
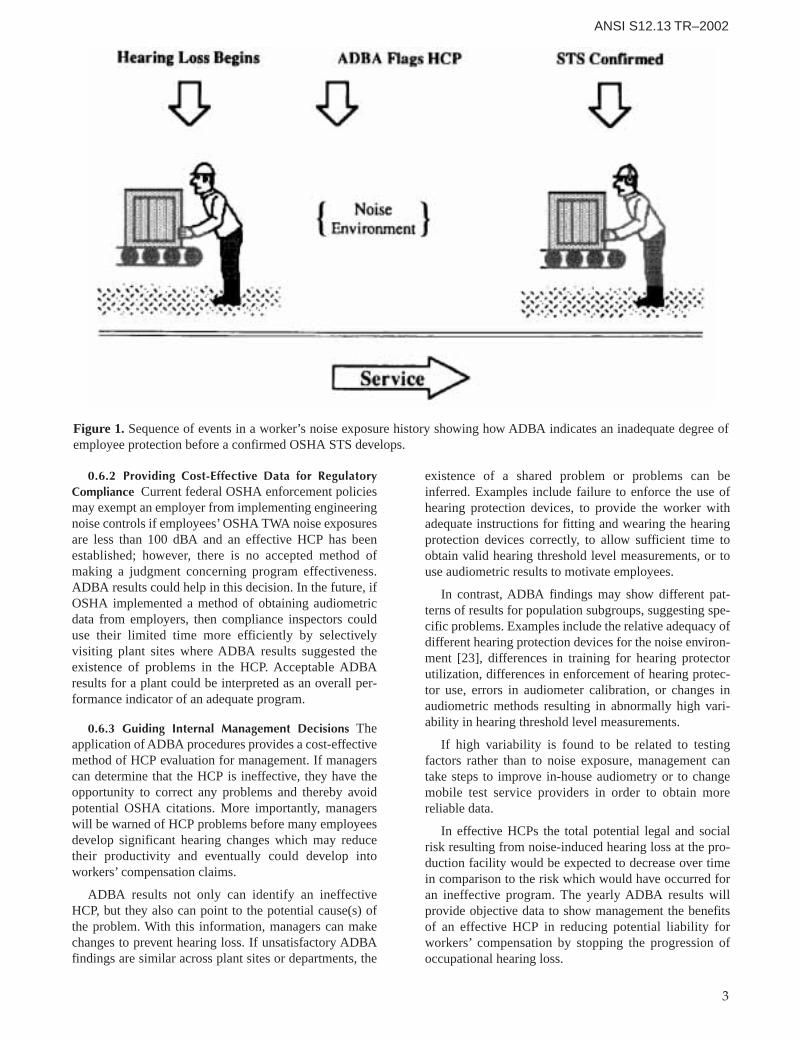
Consider a worker who is hired and placed in thecompany’s HCP, as shown in Figure 1. He or she may ormay not be provided hearing protection devices based on the daily time-weighted average noise exposure. If the worker must develop an OSHA STS or another sig-nificant shift before we get an indication of possible HCP ineffectiveness, then it is difficult to justify the cost of audiometry which merely documents the occur-rence of hearing loss. However, if ADBA procedures areused to detect and correct HCP problems early in theworker’s noise exposure history, then audiometry be-comes a powerful tool in preventing significant noise-induced hearing loss.
3
ANSI S12.13 TR–2002
0.6.2 Providing Cost-Effective Data for RegulatoryCompliance Current federal OSHA enforcement policiesmay exempt an employer from implementing engineeringnoise controls if employees’ OSHA TWA noise exposuresare less than 100 dBA and an effective HCP has beenestablished; however, there is no accepted method ofmaking a judgment concerning program effectiveness.ADBA results could help in this decision. In the future, ifOSHA implemented a method of obtaining audiometricdata from employers, then compliance inspectors coulduse their limited time more efficiently by selectivelyvisiting plant sites where ADBA results suggested theexistence of problems in the HCP. Acceptable ADBAresults for a plant could be interpreted as an overall per-formance indicator of an adequate program.
0.6.3 Guiding Internal Management Decisions Theapplication of ADBA procedures provides a cost-effectivemethod of HCP evaluation for management. If managerscan determine that the HCP is ineffective, they have theopportunity to correct any problems and thereby avoidpotential OSHA citations. More importantly, managerswill be warned of HCP problems before many employeesdevelop significant hearing changes which may reducetheir productivity and eventually could develop intoworkers’ compensation claims.
ADBA results not only can identify an ineffectiveHCP, but they also can point to the potential cause(s) ofthe problem. With this information, managers can makechanges to prevent hearing loss. If unsatisfactory ADBAfindings are similar across plant sites or departments, the
existence of a shared problem or problems can beinferred. Examples include failure to enforce the use ofhearing protection devices, to provide the worker withadequate instructions for fitting and wearing the hearingprotection devices correctly, to allow sufficient time toobtain valid hearing threshold level measurements, or touse audiometric results to motivate employees.
In contrast, ADBA findings may show different pat-terns of results for population subgroups, suggesting spe-cific problems. Examples include the relative adequacy ofdifferent hearing protection devices for the noise environ-ment [23], differences in training for hearing protectorutilization, differences in enforcement of hearing protec-tor use, errors in audiometer calibration, or changes inaudiometric methods resulting in abnormally high vari-ability in hearing threshold level measurements.
If high variability is found to be related to testingfactors rather than to noise exposure, management cantake steps to improve in-house audiometry or to changemobile test service providers in order to obtain morereliable data.
In effective HCPs the total potential legal and socialrisk resulting from noise-induced hearing loss at the pro-duction facility would be expected to decrease over timein comparison to the risk which would have occurred foran ineffective program. The yearly ADBA results willprovide objective data to show management the benefitsof an effective HCP in reducing potential liability forworkers’ compensation by stopping the progression ofoccupational hearing loss.
Figure 1. Sequence of events in a worker’s noise exposure history showing how ADBA indicates an inadequate degree ofemployee protection before a confirmed OSHA STS develops.
4
ANSI S12.13 TR–2002
With respect to workers’ compensation claims, toooften the records of companies with ineffective HCPssimply document the progression of significant hearingloss over time. If management uses ADBA procedures toguide improvement of the HCP, then records could docu-ment the overall effectiveness of the program as well asthe preventive actions taken for individuals. ADBA resultscould provide management with information to supportthe quality of the company’s efforts in contested compen-sation claims for occupational hearing loss.
0.6.4 Motivating Workers and Supervisors Some work-ers are more motivated by concrete data than they are bypersuasive communications from management or otherHCP personnel. Posting simplified summaries fromyearly applications of ADBA procedures across differentplant sites and/or production areas may enhance workers’interest in the HCP. If management takes the next step anduses the findings in evaluating supervisors of productionareas during periodic performance appraisals, then astrong incentive is created to achieve consistent, correctuse of hearing protection devices.
1 SCOPE, PURPOSE AND APPLICATIONS
1.1 Scope
This report specifies procedures for systematicallyassessing the effectiveness of hearing conservationprograms (HCPs) in preventing noise-induced hearingloss based on the variability of regular monitoringaudiometry results for noise-exposed personnel. Test-to-test variability in hearing thresholds measured in suc-cessive audiograms is used as the basis of two statisticalindicators. Criterion ranges are given for the results ofthese indicators as applied to populations of noise-exposed personnel followed over time.
The application of the procedures specified in thisreport is one facet of audiometric data base analysis(ADBA), which also includes related techniques describedin Annex A.
1.2 PurposeThe goal of ADBA—to evaluate the degree of protec-
tion for populations in hearing conservation programs—iscomplementary to the purpose of detecting hearingchanges in individual noise-exposed employees. In audio-gram review the records for a person are examined todetect significant cumulative hearing change from the ini-tial or baseline audiogram and to trigger any follow-upactions needed to increase the degree of protection for thatparticular person. In contrast, ADBA is a separate processof evaluating group audiometric data to monitor thedegree of protection provided to the noise-exposed popu-lation as a whole, or in selected subgroups such as depart-ments or noise exposure groups. If ADBA results showundesirable trends, the follow-up action involves changesin overall HCP policies or procedures rather than changesin the treatment of individual employees [10–12].
The purpose of this report is to define objective proce-dures for evaluating HCP effectiveness in preventingoccupational noise-induced hearing loss in a noise-exposed population through ADBA procedures whichevaluate the variability of the serial audiometric data forthe noise-exposed population as a whole or for selectedsubgroups.
The intended users of these procedures include indus-trial or military personnel directly responsible for HCPs,as well as related professionals providing consulting serv-ices in support of HCPs, and public health or regulatoryagency personnel interested in evaluating HCP effective-ness. These personnel can use information about HCPeffectiveness to reinforce good HCP implementation, orto identify deficiencies and justify program improve-ments, thereby increasing the degree of protection for thenoise-exposed population before many individuals showsignificant hearing changes.
1.3 Applications
The fundamental assumptions underlying the ADBAapproach to evaluating HCP effectiveness are describedbelow. In addition, certain requirements are described thatthe audiometric data must meet before the approach canvalidly be applied.
1.3.1 Assumptions
1.3.1.1 Effective Hearing Conservation Program Aneffective HCP provides the noise-exposed populationwith adequate protection from on-the-job noise exposuresso that changes in their hearing threshold levels over timeare not different from those found in a properly matchedcontrol population which exhibits all of the relevant char-acteristics of the occupational noise-exposed populationexcept on-the-job noise exposure. Characteristics whichshould be accounted for in a matched control populationinclude age, sex, race, the incidence of ear disease, andnon-occupational noise exposure.
1.3.1.2 Audiometric Variability as an Indicator Theyear-to-year variability in the population’s hearingthreshold levels as measured during approximately annualHCP audiometric evaluations is a valid indicator of theeffectiveness of the HCP. For a population of noise-exposed workers who are properly protected from on-the-job noise, the year-to-year variability in their hearingthreshold levels will be no larger than that for a similarpopulation without significant occupational noise expo-sure. It is implied that the only way to achieve a satis-factorily low level of variability in the data base is toestablish an effective HCP that prevents both temporarythreshold shift and permanent occupational hearing loss [10].
The recommended ADBA procedures are based on thevariability of hearing threshold level measurementsbetween sequential pairs of audiograms, not comparison
5
ANSI S12.13 TR–2002
of later audiograms back to the initial test or to a revisedbaseline audiogram. The use of criteria involving baselinecomparisons was rejected for two reasons:
1) such procedures place unmerited confidence in thevalidity of the baseline hearing level measurements andthe comparability of baseline and later tests, and
2) after several years, comparisons to baseline hearingthreshold levels require consideration of corrections forage-related hearing loss, which may be inappropriatefor individuals with substantial pre-existing hearingloss on the baseline test (see ANSI S3.44-1996[R2001]) [4], and which require selection of appropri-ate reference age-effects data.
1.3.1.3 Analysis of a Restricted Data Base If the ADBAresults for a representative sample data base from theexposed population indicate the HCP to be effective, thenit is assumed that the HCP is also effective in protectingall other workers included in the HCP but who were notincluded in the restricted data base (such as recently hiredworkers). If the workers included in the restricted database are being properly protected from the noise, it isunlikely that on a year-to-year basis the workers notincluded in the analyzed data base would have receiveddifferent treatment resulting in a different degree of pro-tection. However, if there are small groups of employeeswith substantially higher noise exposures than the rest ofthe population, the evaluator may choose to analyze theirdata separately for a group-specific test of adequate pro-tection from noise.
1.3.1.4 Reliance on ADBA Results ADBA techniquesassess an HCP for adequacy, not for perfection. As long asthe results of ADBA procedures indicate that an HCP iseffective, then even if some undesirable characteristics areobserved (such as inconsistent use of hearing protectiondevices), the overall program should still be judged asadequate in preventing noise-induced hearing loss. It istrue that superior HCP implementation will be necessaryto adequately protect young, previously non-noise-exposed personnel working in a high OSHA TWA, com-pared to those required to adequately protect olderemployees with pre-existing hearing loss working in a low-noise-exposure environment. In each case ADBA techniques assess the adequacy of the HCP in itsown context.
1.3.1.5 Interpretation of Undesirable Results If theresults from applying ADBA procedures indicate that theeffectiveness of the HCP is marginal or unacceptable, theevaluator must be careful in interpreting the findings.High variability does not necessarily mean that the noise-exposed population has received inadequate protectionand is developing noise-induced hearing loss. High vari-ability may result from inadequate control of the acousticenvironment for audiometry, audiometer calibration, oraudiometric testing techniques. Such factors do preventthe HCP from being effective because true hearing thresh-old shifts for individuals cannot be detected if the
audiometric data are unreliable. Therefore, it is necessaryto control audiometric testing factors in order to achievereliable data. To identify potential problems in audiomet-ric testing the evaluator needs to examine the HCP’s doc-umentation regarding whether OSHA requirements [18]have been met, as well as to determine whether the audio-metric practices have been consistent with more stringentANSI standards (see section 2).
1.3.2 Data Requirements
Before the procedures for ADBA recommended in thisreport may be used to evaluate the degree of protectionfrom noise exposure for a population, the data must meetcertain requirements.
1.3.2.1 Annual Audiometry The audiograms must beadministered approximately annually. If the average inter-vals between sequential audiograms are greater than 24months, the criterion ranges defined in this report mightnot be appropriate.
1.3.2.2 Constant Restricted Population The user mustrestrict the population to a constant group for analysis.That is, for each year during the time period to be ana-lyzed, the group membership must consist of the sameindividuals.
1.3.2.3 Minimum Number of Audiograms All membersof the restricted population must have received a specifiedminimum number of audiograms, with this minimumnumber (two or more) being selected by the evaluator.
1.3.2.4 Representative Restricted Population Ideallythe restricted population will include all availableemployees who have received the minimum number ofaudiograms. However, if it is necessary in a very largepopulation to reduce the size of the group for analysis,then the selected group should be representative of thetotal. For example, employees from certain job categories(such as maintenance workers) should not be excludedbecause their compliance with requirements for utiliza-tion of hearing protection devices is more difficult tomonitor.
1.3.2.5 Minimum Size of Restricted Population Aminimum of 30 people per restricted group is suggested.Although ADBA procedures have been applied success-fully to smaller groups, the percentage values of the statis-tics will be more reliable if the groups include at least 30.
1.3.2.6 Identification of Obvious Contaminants in theData The user should examine the mean hearing thresh-old levels at each audiometric test frequency for therestricted group over the time period to be analyzed inorder to identify any abrupt shifts which might indicateartifacts from equipment malfunction or calibrationchanges. Discrete calibration deviations will affect theADBA statistics for the involved tests, but the data maystill be usable if the problem is accounted for. However, ifthe data are completely unreliable, then they can not beused for ADBA or for hearing trend analysis.
6
ANSI S12.13 TR–2002
1.3.2.7 Audiometric Testing During Workshifts BecauseADBA procedures utilize the variability of annual hearingthreshold level measurements as an indication of the adequacy of a population’s degree of protection fromnoise exposure, it is essential that audiograms be obtainedwhen there is an opportunity to observe any temporarythreshold shift which might be present. Therefore, theaudiometric data to which ADBA techniques are appliedmust be obtained at varying times during the normalcourse of the workshift (not prior to the beginning of theemployee’s workshift) except for the baseline audiogram,which should be conducted without prior noise exposureto avoid TTS. For annual audiograms, employees shouldwear their customary hearing protection devices in theirusual manner on the day of the audiogram, not take special precautions to avoid temporary threshold shift(such as by wearing earmuffs, for example).
2 REFERENCES
At the time of approval of this ANSI Technical Reportby the American National Standards Institute, the stand-ards referenced below were valid. All standards aresubject to revision, and parties to agreements based onthis Technical Report are encouraged to investigate thepossibility of applying the most recent editions of thestandards listed below.
[1] ANSI S1.1-1994 (R1999), American NationalStandard—Acoustical Terminology.
[2] ANSI S3.20-1995 (R1999), American NationalStandard—Bioacoustical Terminology.
[3] ANSI S3.21-1978 (R1997), American NationalStandard Method for Manual Pure-Tone ThresholdAudiometry.
[4] ANSI S3.44-1996 (R2001), American NationalStandard—Determination of Occupational Noise Exposureand Estimation of Noise-Induced Hearing Impairment.
[5] Melnick, W., “Evaluation of industrial hearing conser-vation programs: A review and analysis,” AmericanIndustrial Hygiene Association Journal, 1984, 45:459–467.
[6] Royster, L.H. and Royster, J.D., “Making the most outof the audiometric data base,” Sound and Vibration, 1984,18(5): 18–24.
[7] Royster, J.D. and Royster, L.H., “Using audiometricdata base analysis,” Journal of Occupational Medicine,1986, 28(10): 1055–1068.
[8] Suter, A.H., “The need for and benefits of audiometricdata base analysis,” Sound and Vibration, 1989, 23(12):14–16.
[9] Stewart, A.P., “The comprehensive hearing conser-vation program,” in Hearing Conservation in Industry,Schools, and the Military, edited by D.M. Lipscomb.Boston, MA: College-Hill Publications, 1988.
[10] Royster, L.H. and Royster, J.D., “Important elementsand characteristics of hearing conservation programs anddetermination of their effectiveness,” EnvironmentInternational, 1990, 16: 339–352.
[11] Royster, L.H. and Royster, J.D., “Getting started inaudiometric data base analysis,” Seminars in Hearing,1988, 9: 325–338.
[12] Royster, J.D. and Royster, L.H., “Evaluating hearingconservation program effectiveness,” in The NoiseManual, 5th edition, edited by E.H. Berger, L.H. Royster,J.D. Royster, D.P. Driscoll, and M.E. Layne. Fairfax, VA:American Industrial Hygiene Association, 2000.
[13] Dobie, R.A., “Prevention of noise-induced hearingloss,” Archives of Otolaryngology Head and NeckSurgery, 1995, 121: 385–391.
[14] Royster, J.D. and Royster, L.H., Hearing Conser-vation Programs: Practical Guidelines for Success,Chelsea, MI: Lewis Publishers, 1990.
[15] Franks, J.R., Stephenson, M.R. and Merry, C.J.,Preventing Occupational Hearing Loss — A PracticalGuide, U.S. Department of Health and Human Services(NIOSH) Publication No. 96–110.
[16] Royster, L.H. and Creel, W.C., A RecommendedCompliance Plan for Evaluation by Industry inDeveloping an Effective Hearing Conservation Program,Raleigh, NC: North Carolina Department of Labor, 1972.
[17] Roberts, M., “Hearing conservation: the BritishColumbia experience,” Spectrum (the National HearingConservation Association Newsletter), 1989, 6(1), 10–13.
[18] Occupational Safety and Health Administration,“Occupational noise exposure; hearing conservationamendment; final rule,” Federal Register, 1983: 48,9738–9785.
[19] Department of Defense. DoD Instruction 6055.12Hearing Conservation Program, dated April 22, 1996.Available at this website:http://web7.whs.osd.mil/text/i605512p.txt
[20] Hetu, R., “Critical analysis of the effectiveness ofsecondary prevention of occupational hearing loss,”Journal of Occupational Medicine, 1979, 21: 251–254.
[21] Atherley, G. and Johnston, N., “Audiometry — theultimate test of success?,” Annals of OccupationalHygiene, 1981, 27: 427–447.
[22] Macrae, J.H., “Improved detection of hearing thresh-old impairment caused by occupational noise exposure,”Australian Journal of Audiology, 1994, 16: 25–35.
[23] Royster, L.H., Royster, J.D. and Cecich, T.F., “Anevaluation of the effectiveness of three hearing protec-tion devices at an industrial facility with a TWA of 107 dB(A),” Journal of the Acoustical Society of America,1984, 76: 485–497.
NOTE — With regard to ANSI Standards, "R" stands forreaffirmed, as in [1].
7
ANSI S12.13 TR–2002
3 DEFINITIONSThroughout this ANSI Technical Report the terms and
definitions given in ANSI S1.1-1994 (R2001) [1] andANSI S3.20-1995 (R 1999) [2], as well as the definitionsgiven below, apply.
baseline audiogram. Audiogram against which theresults of later audiograms are compared during thereview of the audiometric records for an individual in ahearing conservation program. This is usually the firstaudiogram obtained from the individual. However, arevised baseline may be established by the audiologist orphysician reviewing the audiometric records if revision isneeded to reflect persistent significant improvement inhearing thresholds or persistent worsening of hearingthresholds comprising an OSHA STS or other shiftdefined by regulatory agencies.
hearing level for pure tones. Hearing threshold of agiven ear at a specified frequency and for a specified typeof transducer when measured with an audiometer cali-brated to reference equivalent threshold levels for air orbone conduction. Abbreviation HL.
hearing threshold. For a specified signal, the minimumsound pressure level (or vibratory force level for boneconducted stimuli) that is capable of evoking an auditorysensation in a specified fraction of trials. A pure-tonethreshold measurement procedure is described in ANSIS3.21-1978 (R 1997) [3] which recommends definingthreshold as the lowest signal level at which responsesoccur in at least 50% of a series of ascending trials.
NOTES
1 The characteristics of the signal, the way it is pre-sented to the subject, and the method by which thesound pressure level or force level is measured mustbe specified.
2 Sound pressure levels and force levels are relative tothe standard reference of 20 µPa and 1 µN, respectively.
reference equivalent threshold level. At a specified fre-quency, for a specified type of transducer, and for a spec-ified type of coupler or artificial ear or artificial mastoid,is the modal value, at that frequency, of the equivalentthreshold levels of an adequately large number of ears ofotologically normal subjects within the inclusive age lim-its 18 to 30 years.
temporary threshold shift. A temporary increase in the measured hearing level for an ear at a specifiedfrequency. Temporary threshold shift is by definitionreversible and does not imply destruction of inner ear hair cells but only fatigue or reversible injury. When theshift is due to noise exposure to sounds with peak sound pressure levels less than 140 dB, recovery fromtemporary threshold shift is usually complete within 16 hours. Temporary threshold shift may be superim-posed on a permanent or persistent threshold shift.Abbreviation TTS.
4 RECOMMENDED ADBA STATISTICS
4.1 Procedures
Two indicators of variability in measured hearinglevels are recommended which are based on comparisonsof sequential approximately annual audiograms, such astest 1 to test 2, test 2 to test 3, test 3 to test 4, etc., exclud-ing retest audiograms (see 5.1). The two statistics aredefined as follows:
Percent Worse Sequential (%Ws): the percent of thepopulation which shows a shift of 15 dB or more towardworse hearing at any test frequency (0.5 to 6 kHz) ineither ear between two sequential audiograms.
Percent Better or Worse Sequential (%BWs): the per-cent of the population which shows a shift of 15 dB ormore either toward better hearing or toward worse hearingat any test frequency (0.5 to 6 kHz) in either ear betweentwo sequential audiograms.
4.2 Criterion Ranges
The criterion ranges for the %Ws and %BWs statisticsare shown as Table 1. Criterion ranges for evaluating theresults of the recommended ADBA statistics are givenseparately for sequential comparisons of the first fouraudiograms (comparisons of tests 1-2, 2-3 and 3-4) andfor sequential comparisons of later audiograms (compar-isons of tests 4-5, 5-6, 6-7 and higher). There are no crite-rion ranges shown for the %BWs procedure over tests 1-4 because the influence of learning-effect improvementin measured hearing levels [11,12] complicates interpre-tation of this statistic during early tests.
Table 1. Criterion ranges (in percent) for rating HCP performance using the values of the statisticsPercent Worse Sequential and Percent Better or WorseSequential.
HCP Sequential comparisons of Sequential comparisonsRating any of the first four tests of any later tests
(1-2, 2-3, or 3-4) (4-5, 5-6, 6-7, etc.)
%Ws %Ws BWs
Acceptable < 20 < 17 < 26Marginal 20 to 30 17 to 27 26 to 40Unacceptable > 30 > 27 > 40
5 IMPLEMENTING THE PROCEDURES
5.1 Selecting the Restricted Data Base
Since the criterion ranges for interpreting ADBAresults differ for the first three sequential comparisonsversus for later audiograms, the evaluator must considerthe number of available audiograms when selecting therestricted data base. In order to be able to detect potentialaudiometric calibration problems, the evaluator must keepaudiograms from the same years together, restricting the
8
ANSI S12.13 TR–2002
data base to those employees whose desired audiograms(such as test 1, test 5, etc.) occurred in the same year.
The restricted data base must have constant groupmembership over the time period selected for analysis.That is, the same employees must be included in therestricted data base from beginning to end, with nodropouts and no new employees added.
For ADBA purposes, only one audiogram per year peremployee should be included in the restricted data base.Therefore, if an employee received one or more retests ina single year, one audiogram should be selected for inclu-sion in the data base for ADBA. If retesting was per-formed due to threshold shifts consistent with temporarythreshold shift on the first audiogram in that year, then thefirst audiogram should be included in the data base forADBA. If retesting was performed due to non-noise-related factors, then the most valid audiogram should beincluded.
5.1.1 Early Tests For a HCP which has not yet accu-mulated many years of annual audiometric data, evalua-tion of the first two to four audiograms is the only choice.The data base should be restricted to the largest possible number of employees who have received the maximumnumber of annual audiograms all beginning in the samecalendar year, and with the latest audiogram includedoccurring during the most recent year of testing.
For example, if an analysis is to be conducted in 1990for a HCP which began audiometric testing in 1988, theevaluator might restrict the data base to all employeeswho have received three annual audiograms, with the firsttest in 1988 and the third test in 1990.
5.1.2 Later Tests For an HCP which has many years ofaudiometric data available, the evaluator can decide whattype of restricted data base would yield the desired infor-mation. It might be appropriate to restrict the data to thefirst N tests for all employees with at least N annual tests(8 or 10, for example) and whose first test was in a selected year (such as the first year the HCP was implemented).
For an HCP with a very large number of annual audio-grams, the evaluator might want to consider only the mostrecent few years of data for all employees with at least Ntests, providing the first of the most recent few tests is testnumber 4 or higher. Because the criterion ranges for theresults of ADBA procedures are the same for sequentialcomparisons of test numbers 4-5 and all later tests (seeTable 1), it is acceptable to evaluate the year-to-year vari-ability for employees with different numbers of audio-grams as long as the restricted data base includes onlyaudiograms which are test number 4 or higher. For exam-ple, the evaluator might restrict the data to all employeeswho received annual audiograms in 1986, 1987, 1988,and 1989 as long as the 1986 test was number 4 or higher.The advantage of this approach is that a larger number ofemployees can be included in the restricted data base than
if only employees who all have had exactly the same num-ber of audiograms were selected.
5.2 Examining the Data for Contamination
Once the restricted data base has been formed, themean (average) hearing levels at each audiometric testfrequency are calculated for each year of testing includedin the data base. These mean hearing levels are plotted inorder to look for aberrations in the data which affect vari-ability and which might make the data unusable for ana-lyzing hearing trends. The most common type of datacontamination is abnormal shifts in hearing levels due toinadequately controlled audiometric calibration proce-dures [7,11] or differences between test paradigms for dif-ferent audiometers (such as self-recording versus micro-processor audiometers, or two different microprocessoraudiometers).
ADBA statistics can still be applied even if this type ofsystematic hearing level aberration is found. The ADBAstatistics will be skewed in the year of the aberration, butthe impact will depend on whether the systematic changeraised or lowered measured hearing levels. For example, asystematic shift toward increased hearing level values willcause increases in both %Ws and %BWs. However, a sys-tematic shift toward decreased hearing level values willcause a decrease in %Ws and an increase in %BWs.
ADBA statistics correctly identify these aberrations ascausing increased variability in hearing levels. In contrast,such systematic aberrations (especially those causingdecreased hearing level measurements) may not be obvi-ous from examination of annual STS rates, even thoughthe aberrations do affect these rates. Long-term hearinglevel trend analyses are invalidated by such aberrationsunless adjustments can be made (see Annex A).
5.3 Applying the ADBA Procedures
In addition to the instructions given below, an illus-tration for sample data is provided as Annex D to assistusers in making sure they are correctly interpreting theprocedures.
5.3.1 Percent Worse Sequential (%Ws) For each of thedesired sequential test comparisons (such as test 1 to test2 or test 5 to test 6), count the number of individuals in therestricted data base who showed a shift of 15 dB or moretoward worse hearing at any audiometric frequency from0.5 to 6 kHz in either ear. Divide this count by the totalnumber of individuals in the restricted data base and mul-tiply by 100% to obtain the percentage.
5.3.2 Percent Better or Worse Sequential (%BWs) Foreach of the desired sequential test compari-sons, count the number of individuals in the restricteddata base who showed a shift of 15 dB or more eithertoward better hearing or toward worse hearing at anyaudiometric frequency from 0.5 to 6 kHz in either ear.Divide this count by the total number of individuals in
9
ANSI S12.13 TR–2002
the restricted data base and multiply by 100% to obtainthe percentage.
6 INTERPRETING THE RESULTS
6.1 Classifying HCP Effectiveness
After the values for the two recommended ADBA sta-tistics have been obtained for the restricted populationbeing evaluated, the results for each sequential compari-son are compared to the criterion ranges given in Table 1.For any given sequential comparison (such as test 2 to test3), if the values obtained for both statistics fall into onerange, then the effectiveness of the HCP may be classifiedas acceptable, marginal, or unacceptable for the year rep-resented by that sequential comparison. However, if theresults obtained for the two ADBA statistics in a givensequential test comparison do not fall within a singlerange, then the effectiveness of the HCP must be inter-preted as spanning the criterion ranges involved (forexample, marginal to unacceptable).
Over multiple years, the criterion ranges into which theADBA statistic results fall may vary from one year to thenext, reflecting changes in audiometric data variability.For example, an HCP might be rated as acceptable forseveral years, then marginal in the following year due tosome change (such as the relaxation of HPD use require-ments, or a change in audiometric testing procedures).
Identification of audiometric variability changes is anadvantage of ADBA compared to historical hearing leveltrend analyses over many years. The ADBA statisticsallow changes in data quality to be detected immediately,enabling HCP personnel to look for the causes and correctthose problems identified.
6.2 Identifying Sources of High Variability
If the effectiveness of the HCP is indicated as marginalor unacceptable in any sequential test comparison, then
the evaluator must determine whether the high variabilityfor that comparison is due to:
a) poor control of the audiometric phase of the HCP(acoustic environment for testing, audiometercalibration consistency, earphone placement,testing methods, and subject instructions andmotivation),
b) an inadequate degree of protection from occupa-tional noise exposure due to deficiencies in HCPelements (employee education and motivation;hearing protection device selection, fitting, or uti-lization; or engineering and administrative noisecontrol efforts), or
c) some other factor.
In interpreting ADBA results, it is highly desirable toacquire audiometric data for an internal control group ofnon-noise-exposed employees tested annually under thesame conditions as the personnel in the HCP. Excessaudiometric variability for this control group clearlyimplies causes unrelated to occupational noise, such asaudiometric testing factors. Differences in ADBA resultsbetween the control group and noise-exposed groupsimplicate occupational noise as a cause.
For a detailed analysis, the evaluator may want to com-pare the results for separate departments or noise expo-sure categories, groups of employees wearing differenthearing protectors, groups of employees tested by differ-ent technicians or using different audiometric equipment,or other appropriate subgroups in order to identify the rea-sons for the high data variability. If problems in HCPimplementation are identified, the evaluator can use theADBA results to demonstrate the need for programimprovements in order to increase the degree of protec-tion from noise exposure for the population.
ANNEX A(Informative)
POPULATION COMPARISON ADBA TECHNIQUES
Hearing level data for noise-exposed populations maybe compared to reference age-effect hearing level dataeither at a single point in time, or longitudinally in termsof hearing level changes. However, because noise-induced permanent threshold shift (NIPTS) developsgradually, especially at moderate noise exposures, thepassage of considerable time is required before HCP suc-cess or failure can be assessed by such comparisons. Inaddition, the comparison may be misleading if an inappropriate reference data base is selected. For furtherdiscussion, see reference [A1] and S3.44-1996 [4].
A.1 Comparisons at One Point in Time
In this approach the median hearing levels for a noise-exposed group in the HCP are compared to the expectedage-effect reference data for a population without occu-pational noise exposure. If the two populations are com-parable in all respects except for occupational noise, thenthe difference in their hearing levels represents the typicalamount of NIPTS present.
This approach is useful in estimating the reduction inNIPTS for employees who were hired after the initiation
10
ANSI S12.13 TR–2002
of an HCP, compared to employees of the same age groupwho worked for a given number of years prior to HCPimplementation.
Examples of this type of population comparison maybe found in references [A2–A7].
A.2 Comparisons of Longitudinal Hearing Level Trends
Longitudinal changes in hearing for a noise-exposedpopulation in an effective HCP should be no greater thanage-effect reference population trends. However, the rateof change in hearing is affected by the amount of pre-existing hearing loss present, as described in ANSI S3.44-1996 (R2001). Therefore, hearing change rates for HCPgroups with pre-existing loss exceeding reference age-effect hearing levels cannot validly be compared to changerates for reference age-effect data bases without occupa-tional NIPTS. Furthermore, the comparison depends uponwhether an appropriate age-effect reference population hasbeen selected to be comparable to the HCP population in allimportant factors other than occupational noise exposure.
For further discussion, see reference [A1].
A.3 References
[A1] Royster, J.D. and Royster, L.H., “Evaluating hearingconservation program effectiveness,” in The Noise
Manual, 5th edition, edited by E.H. Berger, L.H. Royster,J.D. Royster, D.P. Driscoll, and M.E. Layne. Fairfax, VA:American Industrial Hygiene Association, 2000.
[A2] Pelausa, E.O., Abel, S.M., Simard, J. and Dempsey, I.,“Prevention of noise-induced hearing loss in the Canadianmilitary,” Journal of Otolaryngology, 1995, 24: 271–280.
[A3] Roberts, M., “Has the hearing conservation programworked?,” in the proceedings of the 22nd annual conferenceof the National Hearing Conservation Association. Denver,CO: National Hearing Conservation Association, 1997.
[A4] Rosler, G., “Progression of hearing loss caused byoccupational noise,” Scandinavian Audiology, 1994, 23:13–37.
[A5] Savell, J.F. and Toothman, E.H., “Group mean hear-ing threshold changes in a noise-exposed industrial popu-lation using personal hearing protectors,” AmericanIndustrial Hygiene Association Journal, 1987, 48: 23–27.
[A6] Schulz, T.Y., “Alternative methods to evaluate hear-ing conservation program effectiveness,” in the proceed-ings of the 21st annual conference of the NationalHearing Conservation Association. Denver, CO: NationalHearing Conservation Association, 1996.
[A7] Wolgemuth, K.S., Luttrell, W.E., Kamhi, A.G., andWark, D.J., “The effectiveness of the Navy’s hearing con-servation program,” Military Medicine 1995, 160: 219–22.
ANNEX B(Informative)
RATES OF OSHA STS AS AN INDICATOR
B.1 Common Use of STS Rates
OSHA requires employers under its jurisdiction to per-form follow-up actions to increase the degree of protectionfor employees whose audiometric records exhibit STSfrom baseline values. Therefore, the purpose of OSHASTS (to react to a defined cumulative indiv-idual hearingchange) is fundamentally different from the purpose ofADBA to evaluate overall HCP effectiveness. Never-theless, because annual rates of new OSHA STSs are avail-able to employers and are relevant to the follow-up effortrequired of the employer, management often attempts touse STS rates as a measure of HCP performance.
B.2 Reasons for Excluding STS Rates from this Report
S12/WG12 rejected STS rates as a potentially stand-ardizable indicator because such rates depend on factorsincluding the following:
1. Whether the baseline audiogram and subsequentaudiograms are obtained under comparable testingprocedures (i.e., using the same test methods, types ofaudiometer, etc.),
2. Whether OSHA-allowed age corrections are used,
3. The amount of pre-existing hearing loss in the popula-tion at the time of the baseline audiogram,
4. The average age and years of service of the popula-tion,
5. The degree of employment turnover in the population,
6. The baseline revision practices of the audiologist orphysician who reviews individual audiometric records,
7. Whether baselines have already been revised for per-sistent STS in a substantial percentage of employees(greatly reducing the probability of an additional STS).
In general, although high STS rates indicate problemswith audiometric data and/or an ineffective HCP, low STSrates do not necessarily indicate that the HCP is effective,due to the factors listed above.
B.3 References
If the reader is interested in other research concerningSTS rates, several references are provided below.
[B1] Royster, J.D. and Stewart, A.P., “What affects STSrates?,” in the proceedings of the 22nd annual conferenceof the National Hearing Conservation Association. Denver,CO: National Hearing Conservation Association, 1997.
11
ANSI S12.13 TR–2002
[B2] Simpson, T.H., McDonald, D. and Stewart, M.,“Factors affecting laterality of standard threshold shift inoccupational hearing conservation programs,” Ear &Hearing 1993, 14: 322–331.
[B3] Simpson, T.H., Stewart, M. and. Kaltenbach, J.A.,“Early indicators of hearing conservation program per-formance,” Journal of the American Academy ofAudiology, 1994, 5: 300–306.
ANNEX C(Informative)
RESEARCH PERFORMED BY S12/WG12
This annex presents the research conducted byS12/WG12 on the HCP audiometric data bases madeavailable to the committee for analysis.
C.1 Data Tape AvailabilityAs a consequence of the requirement for data contri-
bution by S12/WG12 members and the collection of additional industrial data bases by the first WG chair,S12/WG12 formulated the largest known publicly available occupational audiometric data base in theU.S.A. The two members of the working group with theprimary responsibility for receiving the data and carryingout the various statistical analyses requested byS12/WG12 were able to obtain a contract from NIOSHfor the purpose of checking the accuracy of the data andorganizing the data on a tape to be made available to thegeneral public. Parties interested in obtaining a copy ofthis data base should send their request to NTIS,Springfield, VA 22161 [(703) 487-4650] and requestPB88-117916/KHX (Industrial Audiometric Data).
The NTIS audiometric data base includes data fromtwenty-two companies representing various types ofindustries from different areas of the U.S.A. and Canada.The data base contains data used by S12/WG12 from thetime of its reorganization in 1984 up through 1986. Thedata were taken as received from the contributingsources; S12/WG12 had no way of verifying the reporteddata except by questionnaires to the data donors. Therewere 15,297 employees with at least four audiogramswithin the 22 data sets and 3,958 employees with at least8 audiograms. Included on the tape are control data basesof low-noise or non-noise-exposed individuals. Note thatthe noise-exposure classification in the data sets appliesonly to the year of each audiogram; therefore, the subjectsindicated as non-exposed may have had prior occupa-tional noise exposure.
Since the summer of 1986, S12/WG12 has obtainedseveral additional data bases and some of the earlier databases have been updated. However, S12/WG12 has notobtained any additional funding to support updating thedata base available to the general public through NTIS.
C.2 Procedures Evaluated
When S12/WG12 began considering procedures forassessment of HCP effectiveness, they evaluated not onlyprocedures that had been previously discussed in theliterature [A1-A7, C1-C8], but also newer proceduresrecommended by WG members. Some of the procedures
studied yielded results that would not support their con-tinued investigation or consideration.
One procedure that was dropped was the attempt tocorrelate the slopes of HTL trends at different test fre-quencies with program effectiveness. This effort mayhave failed due to the limited number of audiogramsavailable (eight annual tests) for the populations studied,of which only the last four tests could provide a slopeindication free of the learning-effect improvement [A1,C2, C5, C7]. Another factor which inhibited the useful-ness of slope data was the existence of apparent calibra-tion deviations in several data bases. However, a morefundamental problem with this approach is the differen-tial susceptibility to additional NIPTS for populationswith differing amounts of pre-existing hearing loss, fromnone to a substantial amount.
Of the various procedures investigated, the main focusof the working group’s investigation was a considerationof the following procedures for comparisons of sequentialpairs of annual audiograms:
(a) Percent Better Sequential (%Bs), a 15-dB shift atany test frequency (0.5 to 6 kHz) in either ear towardbetter hearing [A4, A7],
(b) Percent Worse Sequential (%Ws), a 15-dB shift atany test frequency (0.5 to 6 kHz) in either ear towardworse hearing [A4, A7],
(c) Percent Better or Worse Sequential (%BWs), a 15-dB shift at any test frequency (0.5 to 6 kHz) in eitherear toward either better or worse hearing [C4, C7],
(d) the American Academy of Otolaryngology—Headand Neck Surgery (AAO-HNS) shift, which is a change of 10 dB or more in either ear in the average of HTLs at 0.5, 1, and 2 kHz or in the average of HTLs at 3, 4, and6 kHz [C9],
(e) the standard deviation of differences across thepopulation in binaurally averaged HTLs betweensequential audiograms, calculated at the individual testfrequencies from 0.5 to 6 kHz and for three frequencyaverages: 0.5, 1, 2, 3 kHz, 2, 3, 4 kHz and 3, 4, 6 kHz, and
(f) the OSHA standard threshold shift: a change of 10 dBor more in either ear in the average of HTLs at 2, 3, and 4 kHz [C10].
The use of criteria employing comparisons to thebaseline or initial audiogram was rejected because suchprocedures place unmerited confidence in the validity ofthe baseline HTL measurements, and the comparability
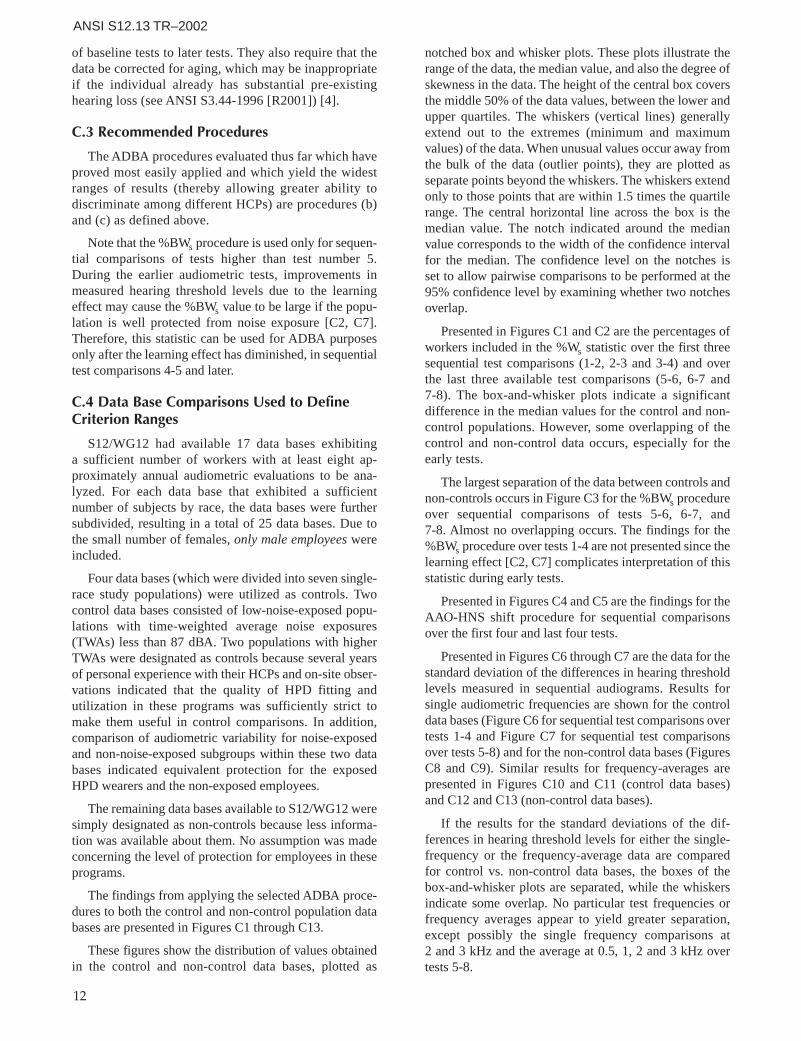
12
ANSI S12.13 TR–2002
of baseline tests to later tests. They also require that thedata be corrected for aging, which may be inappropriateif the individual already has substantial pre-existinghearing loss (see ANSI S3.44-1996 [R2001]) [4].
C.3 Recommended Procedures
The ADBA procedures evaluated thus far which haveproved most easily applied and which yield the widestranges of results (thereby allowing greater ability to discriminate among different HCPs) are procedures (b)and (c) as defined above.
Note that the %BWs procedure is used only for sequen-tial comparisons of tests higher than test number 5.During the earlier audiometric tests, improvements inmeasured hearing threshold levels due to the learningeffect may cause the %BWs value to be large if the popu-lation is well protected from noise exposure [C2, C7].Therefore, this statistic can be used for ADBA purposesonly after the learning effect has diminished, in sequentialtest comparisons 4-5 and later.
C.4 Data Base Comparisons Used to DefineCriterion Ranges
S12/WG12 had available 17 data bases exhibiting a sufficient number of workers with at least eight ap-proximately annual audiometric evaluations to be ana-lyzed. For each data base that exhibited a sufficientnumber of subjects by race, the data bases were furthersubdivided, resulting in a total of 25 data bases. Due tothe small number of females, only male employees wereincluded.
Four data bases (which were divided into seven single-race study populations) were utilized as controls. Twocontrol data bases consisted of low-noise-exposed popu-lations with time-weighted average noise exposures(TWAs) less than 87 dBA. Two populations with higherTWAs were designated as controls because several yearsof personal experience with their HCPs and on-site obser-vations indicated that the quality of HPD fitting and utilization in these programs was sufficiently strict tomake them useful in control comparisons. In addition,comparison of audiometric variability for noise-exposedand non-noise-exposed subgroups within these two databases indicated equivalent protection for the exposedHPD wearers and the non-exposed employees.
The remaining data bases available to S12/WG12 weresimply designated as non-controls because less informa-tion was available about them. No assumption was madeconcerning the level of protection for employees in theseprograms.
The findings from applying the selected ADBA proce-dures to both the control and non-control population databases are presented in Figures C1 through C13.
These figures show the distribution of values obtainedin the control and non-control data bases, plotted as
notched box and whisker plots. These plots illustrate therange of the data, the median value, and also the degree ofskewness in the data. The height of the central box coversthe middle 50% of the data values, between the lower andupper quartiles. The whiskers (vertical lines) generallyextend out to the extremes (minimum and maximumvalues) of the data. When unusual values occur away fromthe bulk of the data (outlier points), they are plotted asseparate points beyond the whiskers. The whiskers extendonly to those points that are within 1.5 times the quartilerange. The central horizontal line across the box is themedian value. The notch indicated around the medianvalue corresponds to the width of the confidence intervalfor the median. The confidence level on the notches is set to allow pairwise comparisons to be performed at the95% confidence level by examining whether two notchesoverlap.
Presented in Figures C1 and C2 are the percentages ofworkers included in the %Ws statistic over the first threesequential test comparisons (1-2, 2-3 and 3-4) and overthe last three available test comparisons (5-6, 6-7 and 7-8). The box-and-whisker plots indicate a significantdifference in the median values for the control and non-control populations. However, some overlapping of thecontrol and non-control data occurs, especially for theearly tests.
The largest separation of the data between controls andnon-controls occurs in Figure C3 for the %BWs procedureover sequential comparisons of tests 5-6, 6-7, and 7-8. Almost no overlapping occurs. The findings for the%BWs procedure over tests 1-4 are not presented since thelearning effect [C2, C7] complicates interpretation of thisstatistic during early tests.
Presented in Figures C4 and C5 are the findings for theAAO-HNS shift procedure for sequential comparisonsover the first four and last four tests.
Presented in Figures C6 through C7 are the data for thestandard deviation of the differences in hearing thresholdlevels measured in sequential audiograms. Results for single audiometric frequencies are shown for the controldata bases (Figure C6 for sequential test comparisons overtests 1-4 and Figure C7 for sequential test comparisonsover tests 5-8) and for the non-control data bases (FiguresC8 and C9). Similar results for frequency-averages arepresented in Figures C10 and C11 (control data bases)and C12 and C13 (non-control data bases).
If the results for the standard deviations of the dif-ferences in hearing threshold levels for either the single-frequency or the frequency-average data are compared for control vs. non-control data bases, the boxes of thebox-and-whisker plots are separated, while the whiskers indicate some overlap. No particular test frequencies orfrequency averages appear to yield greater separation,except possibly the single frequency comparisons at 2 and 3 kHz and the average at 0.5, 1, 2 and 3 kHz overtests 5-8.
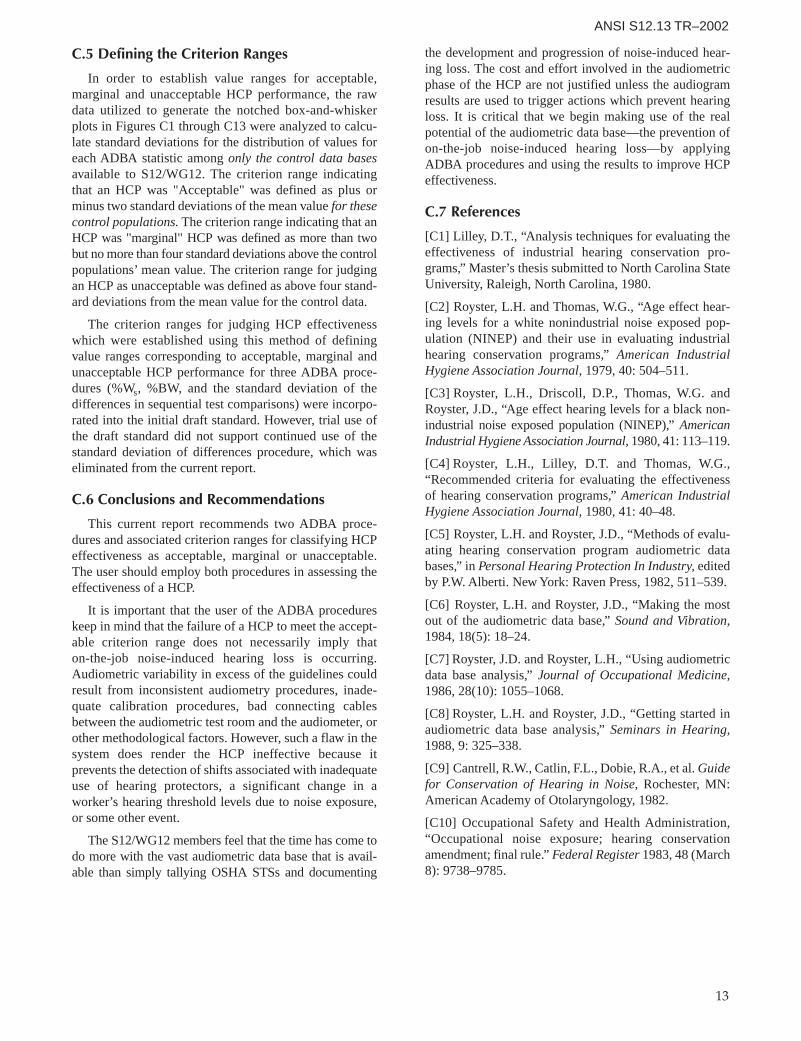
13
ANSI S12.13 TR–2002
C.5 Defining the Criterion Ranges
In order to establish value ranges for acceptable,marginal and unacceptable HCP performance, the rawdata utilized to generate the notched box-and-whiskerplots in Figures C1 through C13 were analyzed to calcu-late standard deviations for the distribution of values foreach ADBA statistic among only the control data basesavailable to S12/WG12. The criterion range indicatingthat an HCP was "Acceptable" was defined as plus orminus two standard deviations of the mean value for thesecontrol populations. The criterion range indicating that anHCP was "marginal" HCP was defined as more than twobut no more than four standard deviations above the controlpopulations’ mean value. The criterion range for judgingan HCP as unacceptable was defined as above four stand-ard deviations from the mean value for the control data.
The criterion ranges for judging HCP effectivenesswhich were established using this method of definingvalue ranges corresponding to acceptable, marginal andunacceptable HCP performance for three ADBA proce-dures (%Ws, %BW, and the standard deviation of the differences in sequential test comparisons) were incorpo-rated into the initial draft standard. However, trial use ofthe draft standard did not support continued use of thestandard deviation of differences procedure, which waseliminated from the current report.
C.6 Conclusions and Recommendations
This current report recommends two ADBA proce-dures and associated criterion ranges for classifying HCPeffectiveness as acceptable, marginal or unacceptable.The user should employ both procedures in assessing theeffectiveness of a HCP.
It is important that the user of the ADBA procedureskeep in mind that the failure of a HCP to meet the accept-able criterion range does not necessarily imply that on-the-job noise-induced hearing loss is occurring.Audiometric variability in excess of the guidelines couldresult from inconsistent audiometry procedures, inade-quate calibration procedures, bad connecting cablesbetween the audiometric test room and the audiometer, orother methodological factors. However, such a flaw in thesystem does render the HCP ineffective because it prevents the detection of shifts associated with inadequateuse of hearing protectors, a significant change in aworker’s hearing threshold levels due to noise exposure,or some other event.
The S12/WG12 members feel that the time has come todo more with the vast audiometric data base that is avail-able than simply tallying OSHA STSs and documenting
the development and progression of noise-induced hear-ing loss. The cost and effort involved in the audiometricphase of the HCP are not justified unless the audiogramresults are used to trigger actions which prevent hearingloss. It is critical that we begin making use of the realpotential of the audiometric data base—the prevention ofon-the-job noise-induced hearing loss—by applyingADBA procedures and using the results to improve HCPeffectiveness.
C.7 References
[C1] Lilley, D.T., “Analysis techniques for evaluating theeffectiveness of industrial hearing conservation pro-grams,” Master’s thesis submitted to North Carolina StateUniversity, Raleigh, North Carolina, 1980.
[C2] Royster, L.H. and Thomas, W.G., “Age effect hear-ing levels for a white nonindustrial noise exposed pop-ulation (NINEP) and their use in evaluating industrialhearing conservation programs,” American IndustrialHygiene Association Journal, 1979, 40: 504–511.
[C3] Royster, L.H., Driscoll, D.P., Thomas, W.G. andRoyster, J.D., “Age effect hearing levels for a black non-industrial noise exposed population (NINEP),” AmericanIndustrial Hygiene Association Journal, 1980, 41: 113–119.
[C4] Royster, L.H., Lilley, D.T. and Thomas, W.G.,“Recommended criteria for evaluating the effectivenessof hearing conservation programs,” American IndustrialHygiene Association Journal, 1980, 41: 40–48.
[C5] Royster, L.H. and Royster, J.D., “Methods of evalu-ating hearing conservation program audiometric databases,” in Personal Hearing Protection In Industry, editedby P.W. Alberti. New York: Raven Press, 1982, 511–539.
[C6] Royster, L.H. and Royster, J.D., “Making the mostout of the audiometric data base,” Sound and Vibration,1984, 18(5): 18–24.
[C7] Royster, J.D. and Royster, L.H., “Using audiometricdata base analysis,” Journal of Occupational Medicine,1986, 28(10): 1055–1068.
[C8] Royster, L.H. and Royster, J.D., “Getting started inaudiometric data base analysis,” Seminars in Hearing,1988, 9: 325–338.
[C9] Cantrell, R.W., Catlin, F.L., Dobie, R.A., et al. Guidefor Conservation of Hearing in Noise, Rochester, MN:American Academy of Otolaryngology, 1982.
[C10] Occupational Safety and Health Administration,“Occupational noise exposure; hearing conservationamendment; final rule.” Federal Register 1983, 48 (March8): 9738–9785.
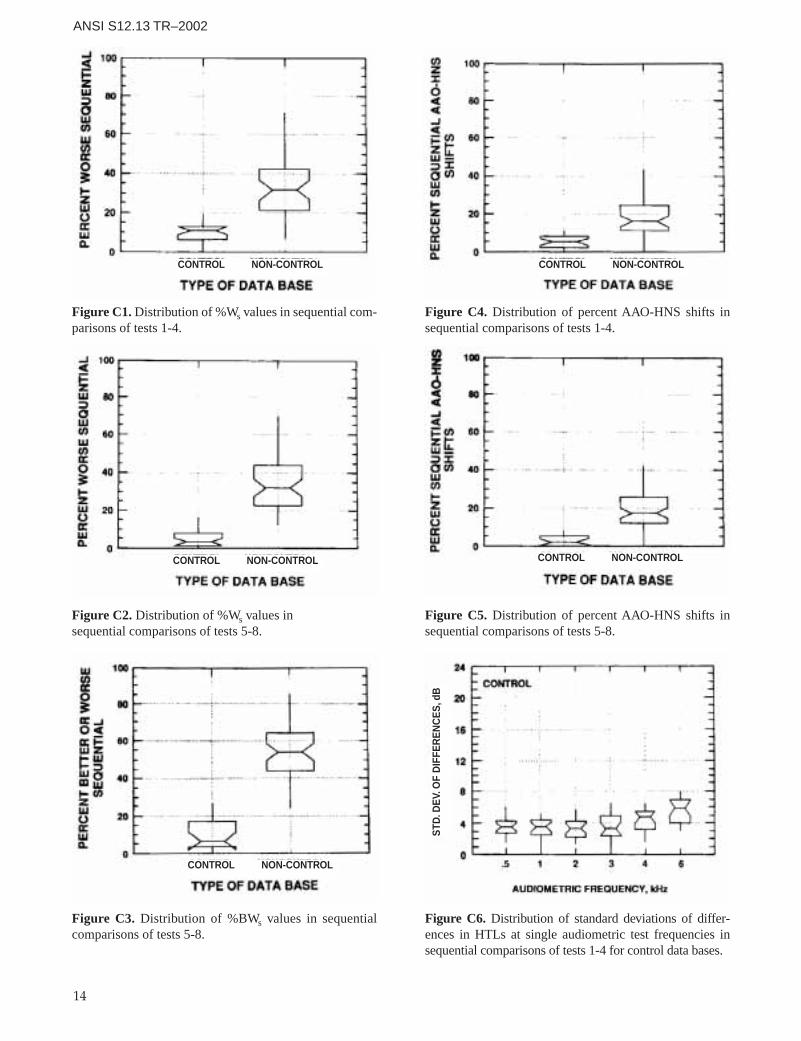
14
ANSI S12.13 TR–2002
Figure C1. Distribution of %Ws values in sequential com-parisons of tests 1-4.
Figure C2. Distribution of %Ws values insequential comparisons of tests 5-8.
Figure C3. Distribution of %BWs values in sequentialcomparisons of tests 5-8.
Figure C4. Distribution of percent AAO-HNS shifts insequential comparisons of tests 1-4.
Figure C5. Distribution of percent AAO-HNS shifts insequential comparisons of tests 5-8.
Figure C6. Distribution of standard deviations of differ-ences in HTLs at single audiometric test frequencies insequential comparisons of tests 1-4 for control data bases.
CONTROL NON-CONTROL CONTROL NON-CONTROL
CONTROL NON-CONTROLCONTROL NON-CONTROL
CONTROL NON-CONTROL
STD
.DE
V.O
FD
IFFE
RE
NC
ES
,dB
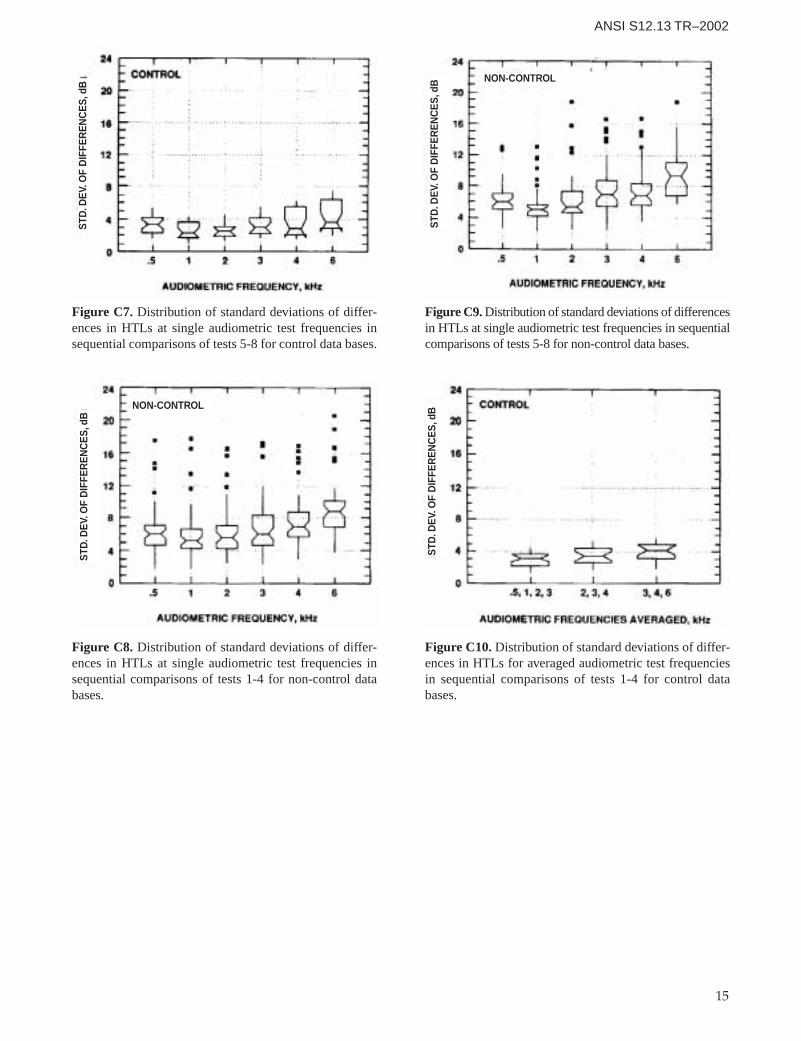
15
ANSI S12.13 TR–2002
Figure C7. Distribution of standard deviations of differ-ences in HTLs at single audiometric test frequencies insequential comparisons of tests 5-8 for control data bases.
Figure C8. Distribution of standard deviations of differ-ences in HTLs at single audiometric test frequencies insequential comparisons of tests 1-4 for non-control databases.
Figure C9. Distribution of standard deviations of differencesin HTLs at single audiometric test frequencies in sequentialcomparisons of tests 5-8 for non-control data bases.
Figure C10. Distribution of standard deviations of differ-ences in HTLs for averaged audiometric test frequenciesin sequential comparisons of tests 1-4 for control databases.
NON-CONTROL
NON-CONTROL
STD
.DE
V.O
FD
IFFE
RE
NC
ES
,dB
STD
.DE
V.O
FD
IFFE
RE
NC
ES
,dB
STD
.DE
V.O
FD
IFFE
RE
NC
ES
,dB
STD
.DE
V.O
FD
IFFE
RE
NC
ES
,dB
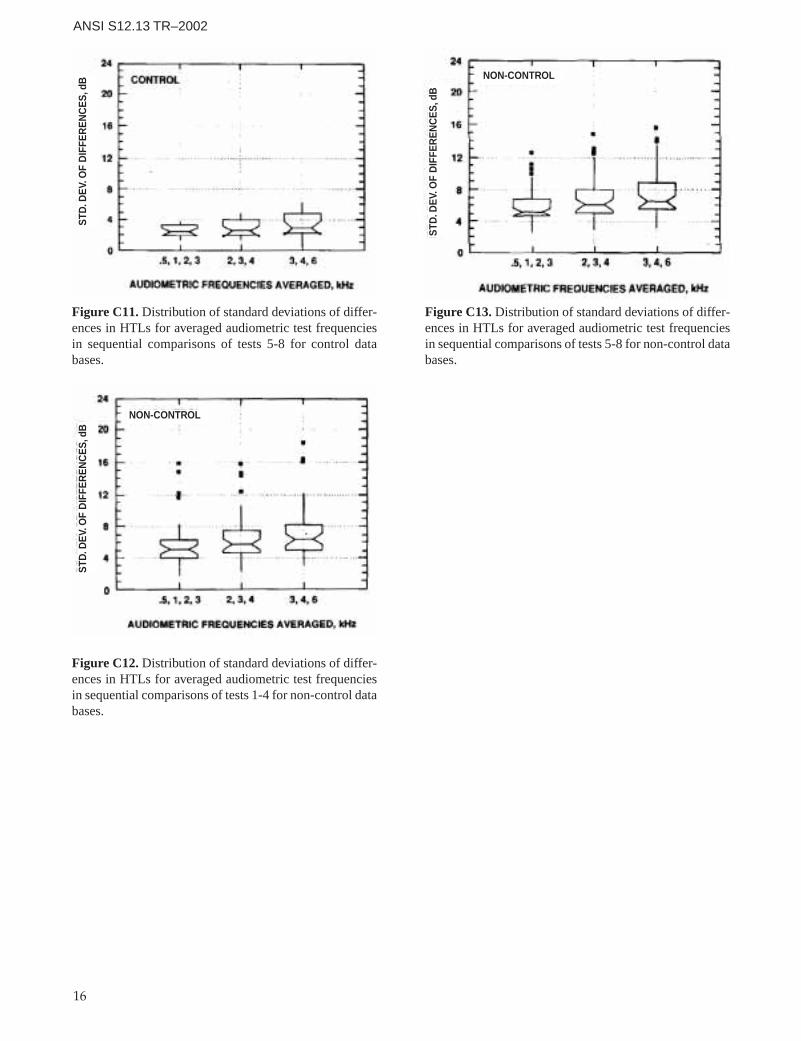
16
ANSI S12.13 TR–2002
Figure C11. Distribution of standard deviations of differ-ences in HTLs for averaged audiometric test frequenciesin sequential comparisons of tests 5-8 for control databases.
Figure C12. Distribution of standard deviations of differ-ences in HTLs for averaged audiometric test frequenciesin sequential comparisons of tests 1-4 for non-control databases.
Figure C13. Distribution of standard deviations of differ-ences in HTLs for averaged audiometric test frequenciesin sequential comparisons of tests 5-8 for non-control databases.
NON-CONTROL
NON-CONTROL
STD
.DE
V.O
FD
IFFE
RE
NC
ES
,dB
STD
.DE
V.O
FD
IFFE
RE
NC
ES
,dB
STD
.DE
V.O
FD
IFFE
RE
NC
ES
,dB
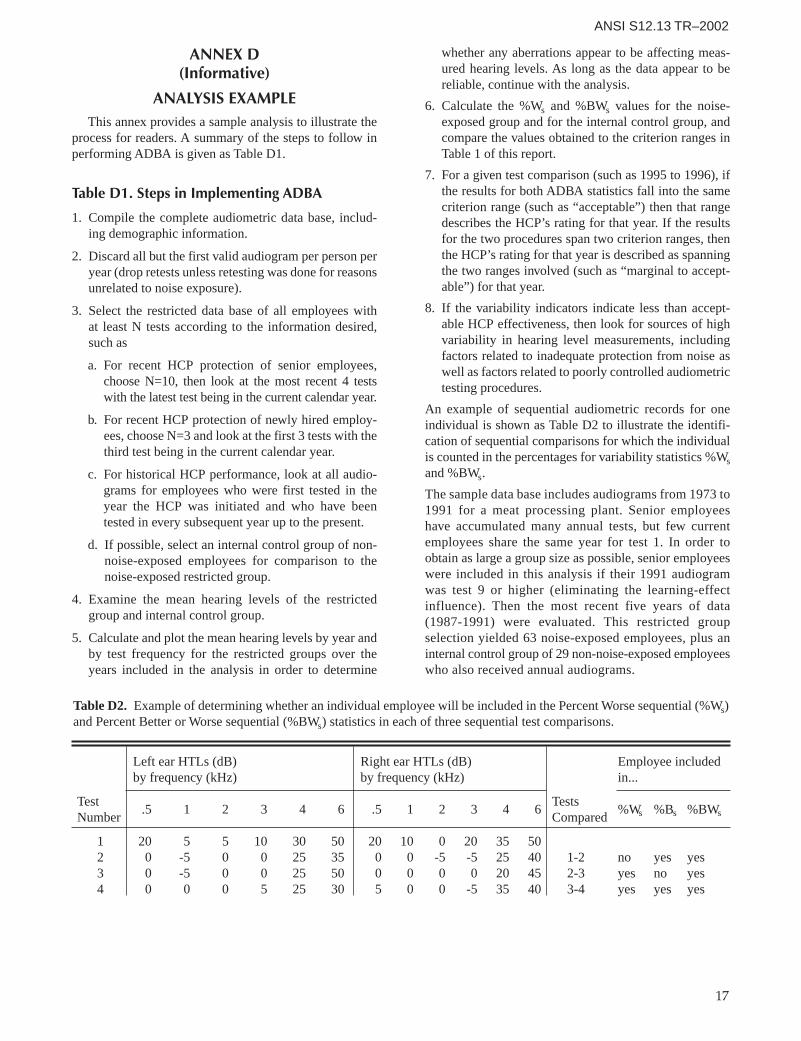
17
ANSI S12.13 TR–2002
ANNEX D(Informative)
ANALYSIS EXAMPLEThis annex provides a sample analysis to illustrate the
process for readers. A summary of the steps to follow inperforming ADBA is given as Table D1.
Table D1. Steps in Implementing ADBA
1. Compile the complete audiometric data base, includ-ing demographic information.
2. Discard all but the first valid audiogram per person peryear (drop retests unless retesting was done for reasonsunrelated to noise exposure).
3. Select the restricted data base of all employees with at least N tests according to the information desired,such as
a. For recent HCP protection of senior employees,choose N=10, then look at the most recent 4 testswith the latest test being in the current calendar year.
b. For recent HCP protection of newly hired employ-ees, choose N=3 and look at the first 3 tests with thethird test being in the current calendar year.
c. For historical HCP performance, look at all audio-grams for employees who were first tested in theyear the HCP was initiated and who have beentested in every subsequent year up to the present.
d. If possible, select an internal control group of non-noise-exposed employees for comparison to thenoise-exposed restricted group.
4. Examine the mean hearing levels of the restrictedgroup and internal control group.
5. Calculate and plot the mean hearing levels by year andby test frequency for the restricted groups over theyears included in the analysis in order to determine
whether any aberrations appear to be affecting meas-ured hearing levels. As long as the data appear to bereliable, continue with the analysis.
6. Calculate the %Ws and %BWs values for the noise-exposed group and for the internal control group, andcompare the values obtained to the criterion ranges inTable 1 of this report.
7. For a given test comparison (such as 1995 to 1996), ifthe results for both ADBA statistics fall into the samecriterion range (such as “acceptable”) then that rangedescribes the HCP’s rating for that year. If the resultsfor the two procedures span two criterion ranges, thenthe HCP’s rating for that year is described as spanningthe two ranges involved (such as “marginal to accept-able”) for that year.
8. If the variability indicators indicate less than accept-able HCP effectiveness, then look for sources of highvariability in hearing level measurements, includingfactors related to inadequate protection from noise aswell as factors related to poorly controlled audiometrictesting procedures.
An example of sequential audiometric records for oneindividual is shown as Table D2 to illustrate the identifi-cation of sequential comparisons for which the individualis counted in the percentages for variability statistics %Wsand %BWs.
The sample data base includes audiograms from 1973 to1991 for a meat processing plant. Senior employeeshave accumulated many annual tests, but few currentemployees share the same year for test 1. In order toobtain as large a group size as possible, senior employeeswere included in this analysis if their 1991 audiogramwas test 9 or higher (eliminating the learning-effectinfluence). Then the most recent five years of data(1987-1991) were evaluated. This restricted groupselection yielded 63 noise-exposed employees, plus aninternal control group of 29 non-noise-exposed employeeswho also received annual audiograms.
Table D2. Example of determining whether an individual employee will be included in the Percent Worse sequential (%Ws)and Percent Better or Worse sequential (%BWs) statistics in each of three sequential test comparisons.
Left ear HTLs (dB) Right ear HTLs (dB) Employee includedby frequency (kHz) by frequency (kHz) in...
Test TestsNumber
.5 1 2 3 4 6 .5 1 2 3 4 6Compared
%Ws %Bs %BWs
1 20 5 5 10 30 50 20 10 0 20 35 502 0 -5 0 0 25 35 0 0 -5 -5 25 40 1-2 no yes yes3 0 -5 0 0 25 50 0 0 0 0 20 45 2-3 yes no yes4 0 0 0 5 25 30 5 0 0 -5 35 40 3-4 yes yes yes
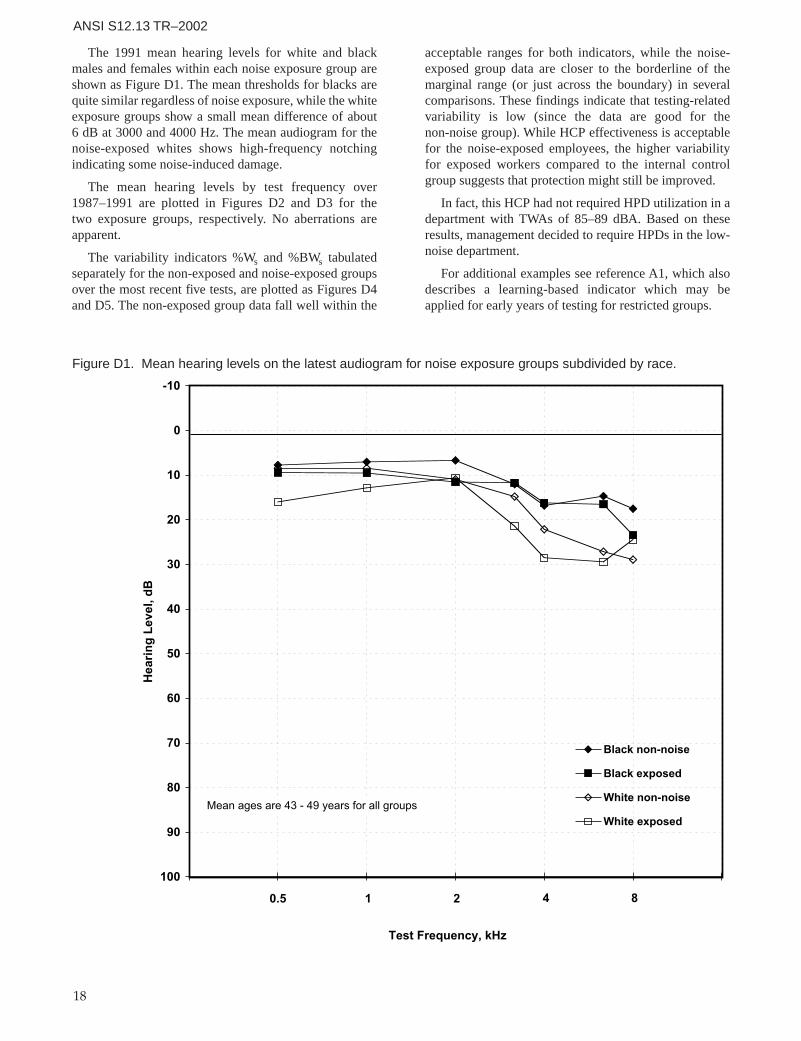
18
ANSI S12.13 TR–2002
The 1991 mean hearing levels for white and blackmales and females within each noise exposure group areshown as Figure D1. The mean thresholds for blacks arequite similar regardless of noise exposure, while the whiteexposure groups show a small mean difference of about 6 dB at 3000 and 4000 Hz. The mean audiogram for thenoise-exposed whites shows high-frequency notchingindicating some noise-induced damage.
The mean hearing levels by test frequency over 1987–1991 are plotted in Figures D2 and D3 for the two exposure groups, respectively. No aberrations areapparent.
The variability indicators %Ws and %BWs tabulatedseparately for the non-exposed and noise-exposed groupsover the most recent five tests, are plotted as Figures D4and D5. The non-exposed group data fall well within the
acceptable ranges for both indicators, while the noise-exposed group data are closer to the borderline of themarginal range (or just across the boundary) in severalcomparisons. These findings indicate that testing-relatedvariability is low (since the data are good for the non-noise group). While HCP effectiveness is acceptablefor the noise-exposed employees, the higher variabilityfor exposed workers compared to the internal controlgroup suggests that protection might still be improved.
In fact, this HCP had not required HPD utilization in adepartment with TWAs of 85–89 dBA. Based on theseresults, management decided to require HPDs in the low-noise department.
For additional examples see reference A1, which alsodescribes a learning-based indicator which may beapplied for early years of testing for restricted groups.
Figure D1. Mean hearing levels on the latest audiogram for noise exposure groups subdivided by race.
-10
0
10
20
30
40
50
60
70
80
90
100
Test Frequency, kHz
Hea
rin
g L
evel
, dB
Black non-noise
Black exposed
White non-noise
White exposed
0.5 1 2 84
Mean ages are 43 - 49 years for all groups
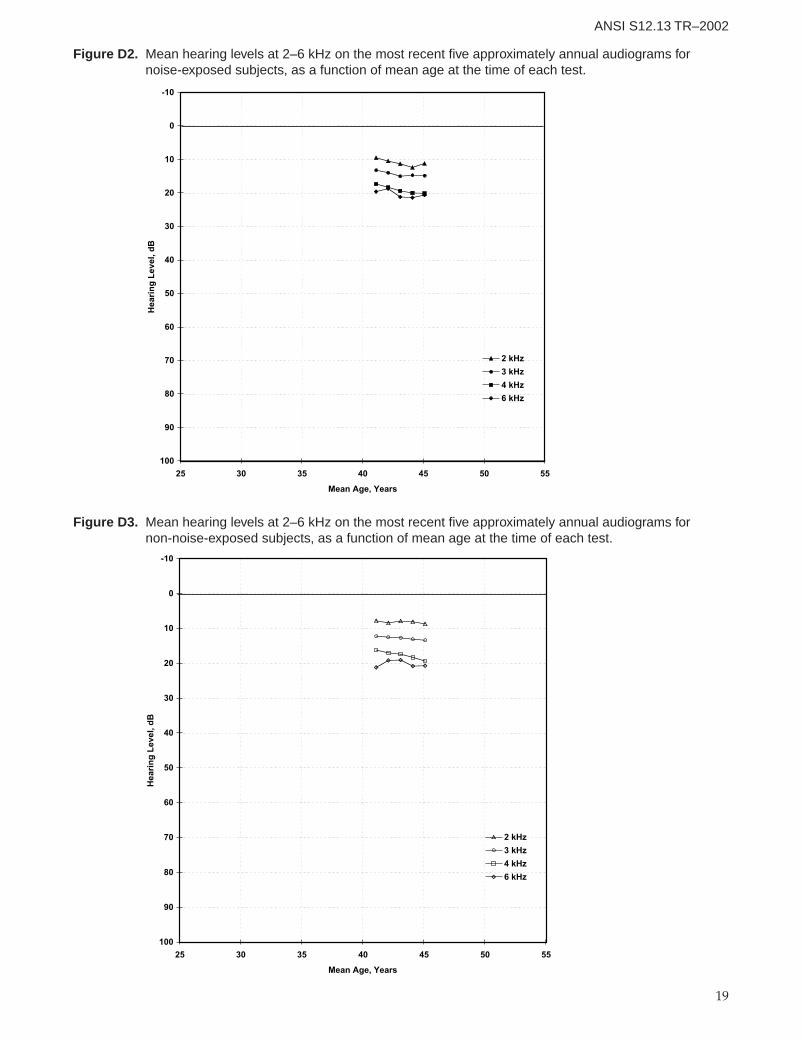
19
ANSI S12.13 TR–2002
-10
0
10
20
30
40
50
60
70
80
90
100
25 30 35 40 45 50 55
Mean Age, Years
Hea
rin
g L
evel
, dB
2 kHz
3 kHz
4 kHz
6 kHz
Figure D2. Mean hearing levels at 2–6 kHz on the most recent five approximately annual audiograms for noise-exposed subjects, as a function of mean age at the time of each test.
-10
0
10
20
30
40
50
60
70
80
90
100
25 30 35 40 45 50 55
Mean Age, Years
Hea
rin
g L
evel
, dB
2 kHz
3 kHz
4 kHz
6 kHz
Figure D3. Mean hearing levels at 2–6 kHz on the most recent five approximately annual audiograms for non-noise-exposed subjects, as a function of mean age at the time of each test.
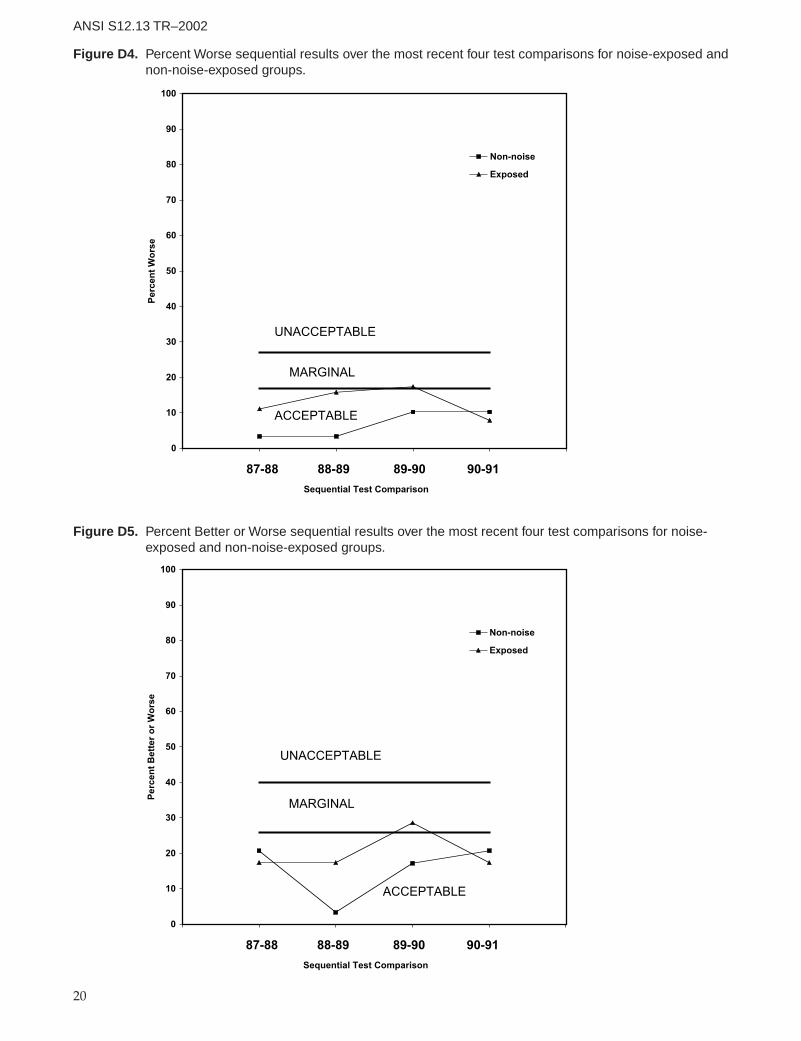
20
ANSI S12.13 TR–2002
0
10
20
30
40
50
60
70
80
90
100
Sequential Test Comparison
Per
cen
t W
ors
eNon-noise
Exposed
87-88 88-89 89-90 90-91
UNACCEPTABLE
ACCEPTABLE
MARGINAL
Figure D4. Percent Worse sequential results over the most recent four test comparisons for noise-exposed andnon-noise-exposed groups.
0
10
20
30
40
50
60
70
80
90
100
Sequential Test Comparison
Per
cen
t B
ette
r o
r W
ors
e
Non-noise
Exposed
87-88 88-89 89-90 90-91
UNACCEPTABLE
ACCEPTABLE
MARGINAL
Figure D5. Percent Better or Worse sequential results over the most recent four test comparisons for noise-exposed and non-noise-exposed groups.
