as statistics data representation. histogram formulae 1. frequency density = frequency /class width...
TRANSCRIPT

AS Statistics
Data Representation

HISTOGRAM

Formulae
1. Frequency density = frequency /class width
2. Class width = upper class boundary - lower class boundary

Exam Tips
• They frequently give you questions that require the use of frequency density.
• Some questions give you histograms with frequency density and ask you to find the height of the histogram bars for a particular class so be pre-pared.
Exam question (1)
9709/06/M/J/06 Q5

Step by step guide(i) Mode=the group/class that has the highest frequency density Since the age group of 30-35yrs is the ‘tallest’, it is the modal class.
(ii) 25-30yrs group has the frequency density of 4.8. Using the formula
for frequency density; f.d.=frequency/class width 4.8=f/(30-25) =f/5 f=4.8x5 =24 (iii) Basically, you are repeating the procedure in (ii) for every single
age group in the histogram f=0.8x5+3.6x5+4.8x5+5.6x5+5.2x5+0.4x25 =4+18+24+28+26+10 =110

Now on your own
9709/06/M/J/08 Q5(i)

STEM AND LEAF PLOTS

Formulae
1. Median : i) odd number of data exact middle number e.g. 15 data ; median=8th datum ii) even number of data ‘mean’ of two middle numbers of the entire data e.g. 8 data ; median=(4th+5th)/22. Quartiles : i) upper quartile (UQ)=1/4 th from the largest datum or =3/4 th from the smallest datum ii) lower quartile (LQ)=1/4 th from the smallest datum3. Inter-quartile range (IQ) =UQ - IQ

Exam Tips
• There is no particular formula for stem and leaf diagrams so just keep in mind that you need the main/major numbers in the stem and remaining numbers on the leaf part.
e.g. if you have 0.98, 0.77, 0.53 place 9, 7 and 5 in your stem and put the remaining 8, 7 and 3 in the leaf.
• IT IS VERY IMPORTANT TO WRITE THE KEY BELOW YOUR DIAGRAM
e.g. key : l 9 l 8 = 0.98cm

• In addition, you may get back to back stem and leaf diagram to compare two sets of data dealing with the same measurements.
e.g. time taken in seconds for year 12 girls and boys to run 50m race.
girls : 9.8, 8.6, 8.2, 10.3 boys : 7.5, 8.5, 9.3, 8.8• In this case you need to write down ‘girls’ and
‘boys’ above the leaf where you put all the data.• TO WRITE THE KEY – YOU MIGHT THINK THAT
YOU’LL BE FINE WITH JUST THE ONE THAT I WROTE IN THE PREVIOUS SLIDE but it’s NOT
e.g. l 10 l 3 = 10.3s for the girls, and 8 l 8 l = 8.8s for the boys

Exam question
9709/06/M/J/08 Q1

Step by step guide(i) First thing you do is to find out how many data you have; total no.=4+6+9+7+5 =31 thus odd number. median=16th (split 31 into 15, 1, 15) =24(ii) Split 15, 1, 15 into 7,1,7, 1, 7,1,7 IQ=UQ – LQ UQ=8th from the largest datum LQ=8th from the smallest datum 19=UQ – 16 UQ=19+16 =35 !!!!!! This is not the final answer !!!!!! this is a question that has a little trap; due to the characteristic of stem and leaf diagrams, 3x=35 so x=5, NOT 35

CUMULATIVE FREQUENCY

Formulae
• Class : < upper class• Cumulative frequency = frequency of a class + frequency
of the previous class
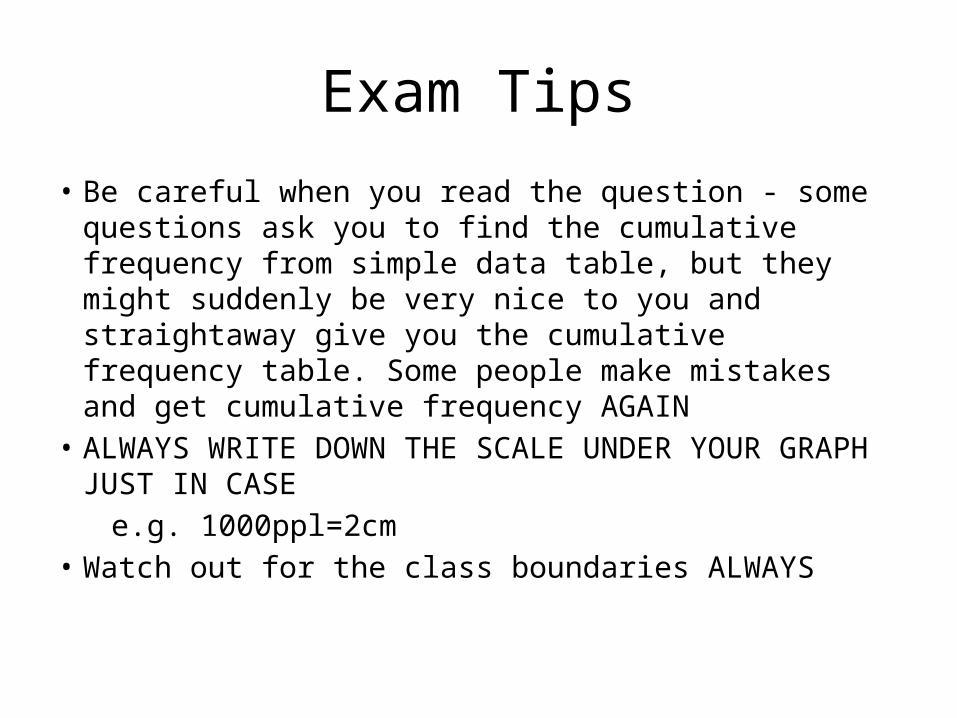
Exam Tips
• Be careful when you read the question - some questions ask you to find the cumulative frequency from simple data table, but they might suddenly be very nice to you and straightaway give you the cumulative frequency table. Some people make mistakes and get cumulative frequency AGAIN
• ALWAYS WRITE DOWN THE SCALE UNDER YOUR GRAPH JUST IN CASE
e.g. 1000ppl=2cm• Watch out for the class boundaries ALWAYS

Exam question
9709/06/M/J/04 Q2

Step by step guide(i) The right end of a cumulative frequency graph is always the total number of the
quantity you are dealing with, in this case, number of people. The maximum number on your y-axis would therefore be 640. x-axis should be labeled ‘time/hrs’. Median is half of the entire ppl so there are 640/2=320 ppl who watch TV for 20hrs. LQ=1/4 x 640 =160 ppl from the origin, 15hrs. UQ=3/4 x 640 =480 ppl from the origin, 35hrs. Minimum time spent=3hrs (3, 0) Maximum time spent=60hrs (thus maximum number on your x-axis) (60, 640) Plot all of these points and connect them with straight lines point by point with a
ruler. (apparently, cambridge accepts straight lines for cumulative frequency graphs)
(ii) Draw a dotted line along 50hrs, and when you meet your graph, draw a horizontal line to obtain the number of people.
Then, since you are to find how many ppl watched MORE THAN 50hrs, you should subtract the number obtained from 640.

Now on your own
9709/06/M/J/02 Q2
MEDIAN AND MEANMeasures of location, central tendency

Formulae
1. Mean = sum of all values /number of val-
ues2. Cumulative frequency or histogram
mean = Σ(mid-class value x frequency) /

Exam Tips
• Questions that ask you to obtain mean can seem very easy but you must be careful not to make mistakes – especially for cumulative frequency, watch out for the class boundaries for these are critical in getting the mid-class values which you use to find the estimate mean.
• p.s. they say ‘estimate’ mean because you are not using the exact data but the mid-class values to get the mean.

Exam question
9709/06/M/J/08 Q5(ii)

Step by step guide
(ii) If you look at the class boundaries, you’ll see that they are all of different values. In this case, you need to obtain the ‘middle’ value.
e.g. 0.5 and 0.6; use (0.5+0.6)/2 as a new class boundary between the first two classes.
Then, find the mid-class values using these ‘mid-bound-ary’ values you found above.
Then use the formula to find the mean time; mean=(0.325x11+0.8x15+1.55x18+2.55x30+ 3.775x21)/5 =(3.575+12+27.9+76.5+79.275)/5 =199.25/5 =39.85 hrs.

Now on your own
9709/06/M/J/05 Q2(i)