as speech recognition and speech synthesis technology ...steveng/prosody/thesis.doc · web viewas...
TRANSCRIPT
Acoustic Properties of Vocalic Nuclei Associated with Prosodic Stress in
Spontaneous American English Discourse
By Leah Hitchcock
Introduction and Background
As speech recognition and speech synthesis technology continue to improve, it
becomes increasingly important in the field of linguistics to understand all the details of
speech such as the cues in the sound wave that signal accent in stress-accent languages
like English. Until very recently, it was generally accepted that f0 variation, or pitch
change, was the main factor involved in English stress. However, recent research has
shown that in fact f0 variation is not the only indicator of prosodic stress-accent, or even
the primary cue (Silipo and Greenberg, 1999 & 2000, Beckman 1986). Even as early as
1955 there was evidence that duration and amplitude are cues for perceived stress (Fry,
1955). Stress-accent languages, like English, differ from pitch-accent languages like
Japanese in that they use other features in addition to pitch change to denote phrasal
accent. (Beckman, 1986) While there is much evidence that f0 change is an important
cue of stress, research on automatic stress labeling systems shows that automatic stress
labeling algorithms are most accurate when using a combination of duration and
amplitude rather than pitch change to label stress. (Silipo and Greenberg, 2000 & 1999,
Van Kuijk & Boves, 1999)
This suggests that while stressed syllables do tend to have pitch variation, it may
not be the most important cue of stress in English, and that the most important cue is
actually duration, or a combination of duration and amplitude. (Silipo and Greenberg,
1999 and 2000, Beckman, 1986, Van Kuijk and Boves, 1999). Further, it has been
1

suggested that some of the pitch differences exhibited in stressed syllables are an artifact
of duration: longer segments have more time for variation of features like f0 (Silipo and
Greenberg 1999). This is not to say that f0 variation isn’t an important cue of stress-
accent; it is. However, it is clear that vowel duration and amplitude also play a role in
determining which vowels are perceived as stressed, and automatic speech recognition
systems could benefit greatly from an understanding of exactly how different factors
affect the realization of stress-accent in spontaneous speech.
Many studies have looked into the phenomenon of reduction of unstressed vowels
(i.e. Lindblom, 1963, van Bergem, 1993, Koopmans-van Beinum, 1987, Fourakis, 1991,
Engstrand, 1988). Typically, vowels that become reduced in speech are short and
unstressed. Vowel reduction is not necessarily a trend toward centralization of the vowel
(see Lindblom, 1963), as other factors, such as consonantal context also seem to play a
role in the shape of the formant trajectories of unstressed vowels. An increased
knowledge of the acoustics of stressed and unstressed vowels could be very useful in the
study of vowel reduction in spontaneous speech, which in turn should aid the fields of
speech recognition and speech synthesis.
This paper explores the roles of duration and amplitude in determining whether
specific vowels are perceived as stressed in spontaneous American English dialogues.
Based on previous research, we would expect duration to play the clearest role in
determining perceived stress-accent, and that amplitude would play a secondary role for
most vowels (Silipo and Greenberg, 1999 and 2000, Van Kuijk and Boves, 1999,
Beckman, 1986, Fry, 1955). However, most previous research has been done on lab-
speech, so a major purpose of this study is to determine general patterns related to stress-
2

accent in spontaneous speech, and to determine to what extent these patterns support the
results of past research on lab speech.
The concept of stress is difficult to define. Many different definitions exist (see
Asher, 1994 and Crystal, 1992), so it is important to clarify what type of stress this paper
deals with. Lexical, or word stress, is the type most commonly referred to. Lexical stress
is canonical, and is what is marked in pronunciation guides in dictionaries. Phrasal stress
refers to which syllables are accented within an utterance. “While this might often be
related to the grammatical structure of the utterance, on cannot predict when the
grammatical structure will be reflected phonetically. The speaker may decide to
recognize a syntactic unit or to overlook it,” (Asher, 1994:4357). Semantics, syntax, and
other factors affect which syllables actually end up as being accented in an utterance (see
Vanderslice and Ladefoged, 1972). This paper deals with phrasal stress-accent rather
than lexical stress. In other words, rather than the dictionary’s markings of lexical stress,
the stress patterns that are realized phonetically in dialogues are what are being studied.
This encompasses many different types of stress; sometimes a syllable that is expected,
according to canonical lexical stress, to be accented is in fact accented in an utterance,
and sometimes a syllable is accented for other reasons, such as emphasis. Because there
are not definitive rules that determine the conditions under which a person will stress a
certain syllable, the data are based on perceived stress.
Methods and Corpus Data
The data for this paper are from the Switchboard corpus. The Switchboard corpus
contains over 140 hours worth of short telephone conversations on various topics. For
this paper, approximately 54 minutes worth of utterances were transcribed at the phonetic
3
segment level by University of California, Berkeley, linguistics students. Level of stress-
accent was also manually labeled by an independent set of transcribers for syllabic nuclei.
Of the 54 minutes of speech, 45.43 minutes was analyzable and the remainder being
filled pauses, stutters, and other non-speech. (The usable 45.43 minutes consisting of
9,922 words, 13,446 syllables, and 33,370 phones, comprising 674 utterances). The
average length of an utterance was 4.76 seconds, the average number of words per
utterance was 18.5 and the average number of syllables was 23.25. (Only utterances
between 2 and 17 seconds were used, and about 60% of these were between 4 and 8
seconds. The number of words ranged from 2 to 64, and the number of syllables from 5
to 81.) The corpus includes 581 speakers, of whom 288 were female and 293 were male.
Most speakers were represented by only a single utterance in the data set; a few had
multiple utterances that were used. Speakers were asked for the region they lived in
during their formative years in order to ascertain what dialect of American English they
speak. The number of speakers for each dialect region are in table 1.
# of speakers by dialect regionNew England 37New York 41North 88North Mid 89South 65South Mid 147West 72Mixed 42
Table 1. Total number of speakers from each of the seven dialect regions, as well as mixed dialect. Mixed speakers are people who moved around a lot during their formative years.
Of the actual speech data, 769 syllables from the utterances were not used because
they had syllabic consonants (such as “el”) for their nucleus rather than a vocalic nucleus.
4
631 filled pauses (“um,” “uh,” etc.) were also excluded from analysis because of the
drastically different patterns exhibited in filled pauses compared to all other words in the
data set.
The data were phonetically transcribed by three individuals using a variant of
Arapet (which was originally used to label the TIMIT corpus) (Greenberg 1997). The
interlabeler agreement was approximately 74%. When transcribers disagreed on the
identity of a vocalic segment, it was generally only a slight disagreement, i.e. one level of
frontness or height. It was rare for transcribers to disagree on whether a segment was a
diphthong or a monophthong.
Two different individuals marked the corpus material for stress-accent. I was one
of the transcribers, but I was hired to do the transcription work long before the idea for
this paper came about, so the fact that half of the labeling was done by me should not
create a bias in the data. The material was marked for three levels of accent: fully
accented, completely unaccented, and an intermediate level. The intermediate level
includes all syllables judged to be not primary stress, but not completely lacking stress
either. Fully unaccented vowels were not necessarily reduced, but most of the
occurrences of [ix] and [ax], which are both types of schwa, fell into the fully unaccented
category (see Table 2). Many of these were probably reduced forms of other vowels;
since the corpus was transcribed phonetically rather than canonically the proportion of
reduced vowels is not known. The nuclei were labeled based on perceptually based stress
accent, not based on knowledge of canonical (dictionary based) lexcial stress. The
transcribers and a supervisor met weekly to insure that the proper criteria were being used
for labeling. Other research has relied on modifications of canonical lexical stress
5
patterns when studying prosody, (i.e. Van Kuijk & Boves, 1999, Beckman, 1986) but
since spontaneous speech differs greatly from canonical speech, perceived stress-accent
should be more a more accurate representation of the way people speak. When speaking,
people place more emphasis on words or ideas that are most important to the message
they are trying to express. Labeling perceived stress-accent therefore enables someone
reading a transcription to see what the speaker intended to stress in his or her speech,
something that lexical stress does not convey.
All material used was labeled by both transcribers, and the stress-accent markings
were averaged. As with the phonetic transcription, the transcribers generally agreed.
Interlabeler agreement was 85% for unstressed nuclei, 78% for fully stressed nuclei, and
95% for any level of accent (both transcribers attributed some amount of stress to the
nucleus). When the transcribers disagreed, it was usually by only one step (i.e. fully
stressed vs. intermediate, not fully stressed vs. fully unstressed). Generally when the
transcribers disagreed, a third observer attested to the ambiguity of the level of accent of
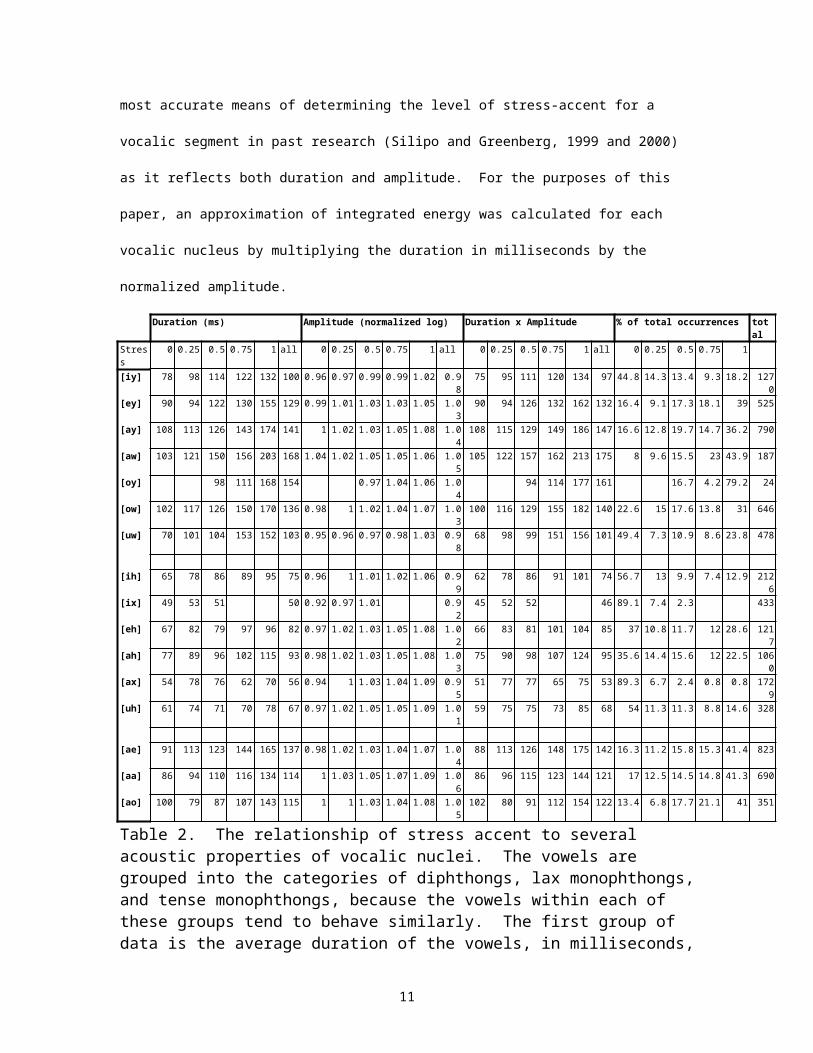
the syllable in question. Table 2 includes the averaged duration and amplitude data for
each level of stress accent, with 0 referring to completely unaccented nuclei, 0.5 to the
intermediate level, and 1 referring to fully accented nuclei. Levels 0.25 and 0.75 are the
result of the averaging of the two transcriptions.
The duration of the segments was computed from the hand-labeled material. About a third of the
material was hand-segmented by transcribers and the remainder was automatically segmented using 72
minutes of hand segmented material to train the automatic labeler (Greenberg, Chang, and Hollenback,
2000). The amplitude, expressed in terms of log base e, of each segment’s pressure waveform was
computed and normalized relative to the mean of the entire utterance (Greenberg, Chang and Hollenback,
2000). Integrated energy has been shown to be the most accurate means of determining the level of stress-
accent for a vocalic segment in past research (Silipo and Greenberg, 1999 and 2000) as it reflects both
6

duration and amplitude. For the purposes of this paper, an approximation of integrated energy was
calculated for each vocalic nucleus by multiplying the duration in milliseconds by the normalized
amplitude.
Duration (ms) Amplitude (normalized log) Duration x Amplitude % of total occurrences total
Stress 0 0.25 0.5 0.75 1 all 0 0.25 0.5 0.75 1 all 0 0.25 0.5 0.75 1 all 0 0.25 0.5 0.75 1
[iy] 78 98 114 122 132 100 0.96 0.97 0.99 0.99 1.02 0.98 75 95 111 120 134 97 44.8 14.3 13.4 9.3 18.2 1270[ey] 90 94 122 130 155 129 0.99 1.01 1.03 1.03 1.05 1.03 90 94 126 132 162 132 16.4 9.1 17.3 18.1 39 525[ay] 108 113 126 143 174 141 1 1.02 1.03 1.05 1.08 1.04 108 115 129 149 186 147 16.6 12.8 19.7 14.7 36.2 790[aw] 103 121 150 156 203 168 1.04 1.02 1.05 1.05 1.06 1.05 105 122 157 162 213 175 8 9.6 15.5 23 43.9 187[oy] 98 111 168 154 0.97 1.04 1.06 1.04 94 114 177 161 16.7 4.2 79.2 24[ow] 102 117 126 150 170 136 0.98 1 1.02 1.04 1.07 1.03 100 116 129 155 182 140 22.6 15 17.6 13.8 31 646[uw] 70 101 104 153 152 103 0.95 0.96 0.97 0.98 1.03 0.98 68 98 99 151 156 101 49.4 7.3 10.9 8.6 23.8 478
[ih] 65 78 86 89 95 75 0.96 1 1.01 1.02 1.06 0.99 62 78 86 91 101 74 56.7 13 9.9 7.4 12.9 2126[ix] 49 53 51 50 0.92 0.97 1.01 0.92 45 52 52 46 89.1 7.4 2.3 433[eh] 67 82 79 97 96 82 0.97 1.02 1.03 1.05 1.08 1.02 66 83 81 101 104 85 37 10.8 11.7 12 28.6 1217[ah] 77 89 96 102 115 93 0.98 1.02 1.03 1.05 1.08 1.03 75 90 98 107 124 95 35.6 14.4 15.6 12 22.5 1060[ax] 54 78 76 62 70 56 0.94 1 1.03 1.04 1.09 0.95 51 77 77 65 75 53 89.3 6.7 2.4 0.8 0.8 1729[uh] 61 74 71 70 78 67 0.97 1.02 1.05 1.05 1.09 1.01 59 75 75 73 85 68 54 11.3 11.3 8.8 14.6 328
[ae] 91 113 123 144 165 137 0.98 1.02 1.03 1.04 1.07 1.04 88 113 126 148 175 142 16.3 11.2 15.8 15.3 41.4 823[aa] 86 94 110 116 134 114 1 1.03 1.05 1.07 1.09 1.06 86 96 115 123 144 121 17 12.5 14.5 14.8 41.3 690[ao] 100 79 87 107 143 115 1 1 1.03 1.04 1.08 1.05 102 80 91 112 154 122 13.4 6.8 17.7 21.1 41 351
Table 2. The relationship of stress accent to several acoustic properties of vocalic nuclei. The vowels are grouped into the categories of diphthongs, lax monophthongs, and tense monophthongs, because the vowels within each of these groups tend to behave similarly. The first group of data is the average duration of the vowels, in milliseconds, for each stress level and the intrinsic duration of the vowel. The second group of data is the normalized amplitude for each stress level as well as the intrinsic amplitude. The amplitude for each vocalic segment was normalized (log base e) with respect to the entire utterance within which it occurred. The third group is the simple product of duration times amplitude. The duration and amplitude of each vowel were multiplied together, and then the average of the products was calculated. The final group of data is the percentage of the time each vowel appears at each level of stress accent, along with a column denoting the total number of occurrences of each vowel. Blank cells in the table indicate less than four occurrences of the vowel for that stress level.
Results
The data reveal several patterns about stress-accent in English. First, duration and
amplitude clearly play a large role in determining whether a vowel is perceived as
stressed. Second, high vowels, which are intrinsically shorter and quieter than low
vowels, (see also Lehiste and Peterson, 1959 and 1960, Beckman, 1986, Black 1949) also
tend not to be perceived as stressed nearly as often as their lower counterparts (Hitchcock
7
& Greenberg, 2001). Third, the shortest vowels, i.e. the lax monophthongs, tend to
exhibit greater amplitude differences than the intrinsically longer tense monophthongs
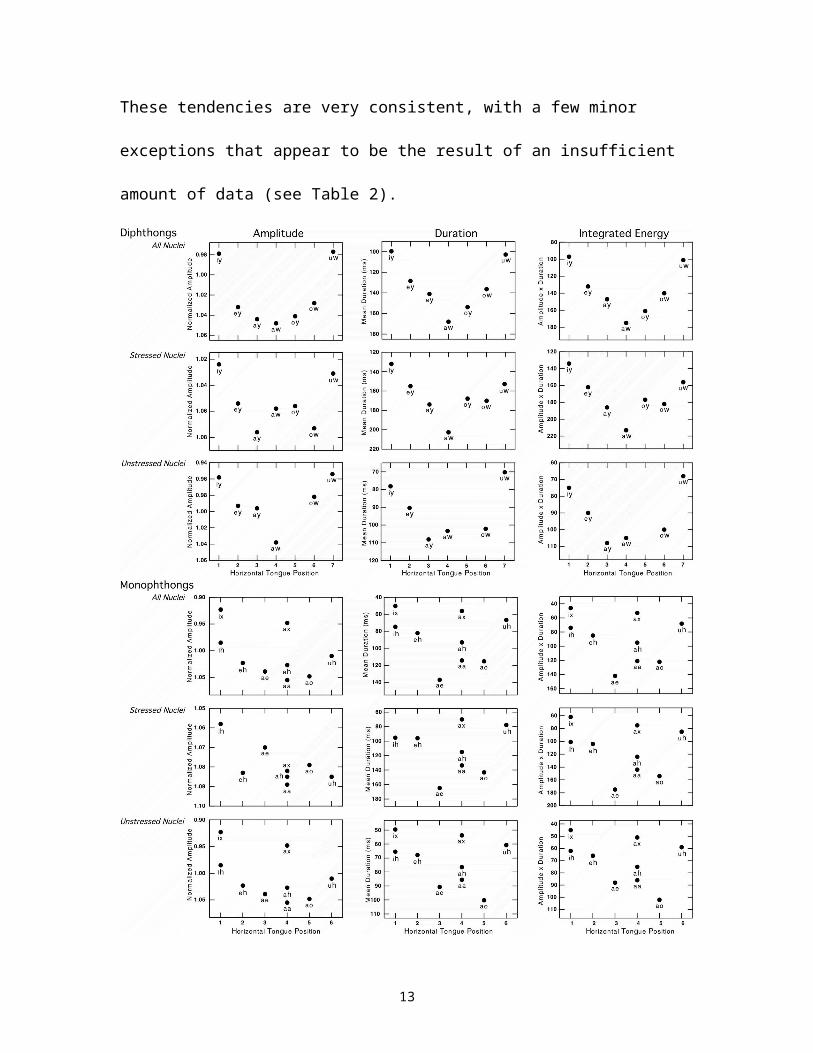
and diphthongs. These tendencies are very consistent, with a few minor exceptions that
appear to be the result of an insufficient amount of data (see Table 2).
8
Figure 1. (reprinted from Hitchcock and Greenberg, 2001)The graphs above show the relationship between the position of the tongue and
factors associated with prosodic stress-accent. The Y-axis shows the factor (duration, amplitude, or duration x amplitude) being measured for each graph. The Y-axes were inverted in order to show the relationship of vowel height to the factor in question. The graphs in the first column show normalized amplitude, log base e, which was calculated with respect to the average amplitude of the entire utterance in which the vowel occurs. The graphs in the second column show the duration of the vowels in milliseconds. The graphs in the third column show the product of duration times amplitude. The X-axis of all of the graphs shows the vowels, either diphthongs or monophthongs, arranged approximately by the horizontal tongue position of the vowel. The resulting shape of the graphs is strikingly similar to that of a vowel space chart, suggesting that there is a very close relationship between place of articulation and factors such as vowel duration and amplitude.
Figure 2. Reprinted from Hitchcock and Greenberg, 2001.The proportion of fully accented and fully unaccented monophthongs and diphthongs. Along the X-axis are the vowels arranged approximately by horizontal position of the tongue. The Y-axis shows the proportion in terms of percentage of the total number of occurrences of the vowel. The Y-axis is inverted for the graphs showing proportion of fully stressed nuclei to better show the relationship of vowel height to stress-accent.
9
There is a clear relationship between vowel height and stress accent. High vowels
tend to be accented much less often than low vowels. This is true of both the diphthongs
and monophthongs. This tendency is consistent with the hypothesis that vowel duration
is one of the main cues of stress accent in English because the low vowels, which tend to
be longer, also tend to be accented more often. Vowel height, duration and stress-accent
appear to be closely tied together. It is clear from looking at the figures and tables that
there is a correlation between these three factors. To a lesser degree, vowel amplitude is
also associated with vowel height and stress-accent, but the correlation between duration
and stress-accent is clearer and more consistent. What is not entirely clear about the
relationship between stress-accent and vowel height, duration and amplitude is whether
the correlation is due to the fact that low vowels tend to be intrinsically longer and louder
than high vowels, and therefore are perceived as stressed more often, or vice versa. We
know that long, loud vowels tend to be perceived as stressed, and that low vowels are
longer and louder than high vowels, and more often stressed than high vowels, but which
tendency is responsible for the other is not clear.
Problems
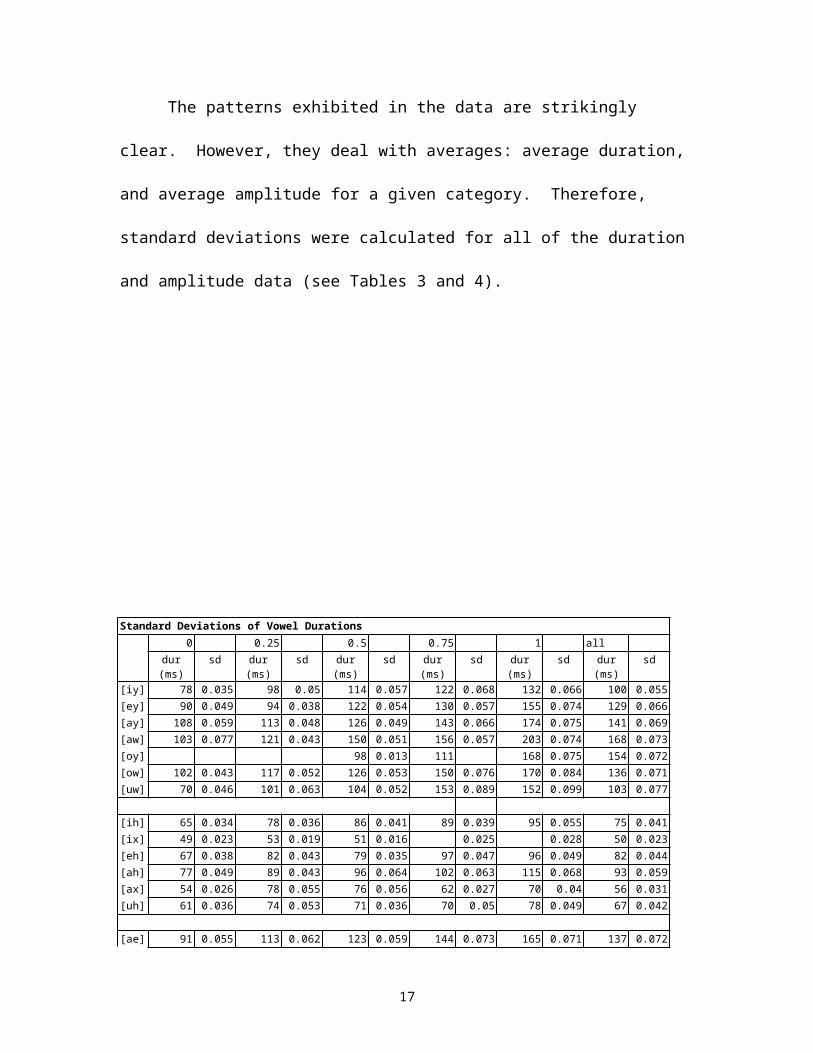
The patterns exhibited in the data are strikingly clear. However, they deal with
averages: average duration, and average amplitude for a given category. Therefore,
standard deviations were calculated for all of the duration and amplitude data (see Tables
3 and 4).
10
Standard Deviations of Vowel Durations0 0.25 0.5 0.75 1 all
dur (ms) sd dur (ms) sd dur (ms) sd dur (ms) sd dur (ms) sd dur (ms) sd[iy] 78 0.035 98 0.05 114 0.057 122 0.068 132 0.066 100 0.055[ey] 90 0.049 94 0.038 122 0.054 130 0.057 155 0.074 129 0.066[ay] 108 0.059 113 0.048 126 0.049 143 0.066 174 0.075 141 0.069[aw] 103 0.077 121 0.043 150 0.051 156 0.057 203 0.074 168 0.073[oy] 98 0.013 111 168 0.075 154 0.072[ow] 102 0.043 117 0.052 126 0.053 150 0.076 170 0.084 136 0.071[uw] 70 0.046 101 0.063 104 0.052 153 0.089 152 0.099 103 0.077
[ih] 65 0.034 78 0.036 86 0.041 89 0.039 95 0.055 75 0.041[ix] 49 0.023 53 0.019 51 0.016 0.025 0.028 50 0.023[eh] 67 0.038 82 0.043 79 0.035 97 0.047 96 0.049 82 0.044[ah] 77 0.049 89 0.043 96 0.064 102 0.063 115 0.068 93 0.059[ax] 54 0.026 78 0.055 76 0.056 62 0.027 70 0.04 56 0.031[uh] 61 0.036 74 0.053 71 0.036 70 0.05 78 0.049 67 0.042
[ae] 91 0.055 113 0.062 123 0.059 144 0.073 165 0.071 137 0.072[aa] 86 0.043 94 0.038 110 0.047 116 0.044 134 0.059 114 0.054[ao] 100 0.058 79 0.047 87 0.05 107 0.057 143 0.072 115 0.066
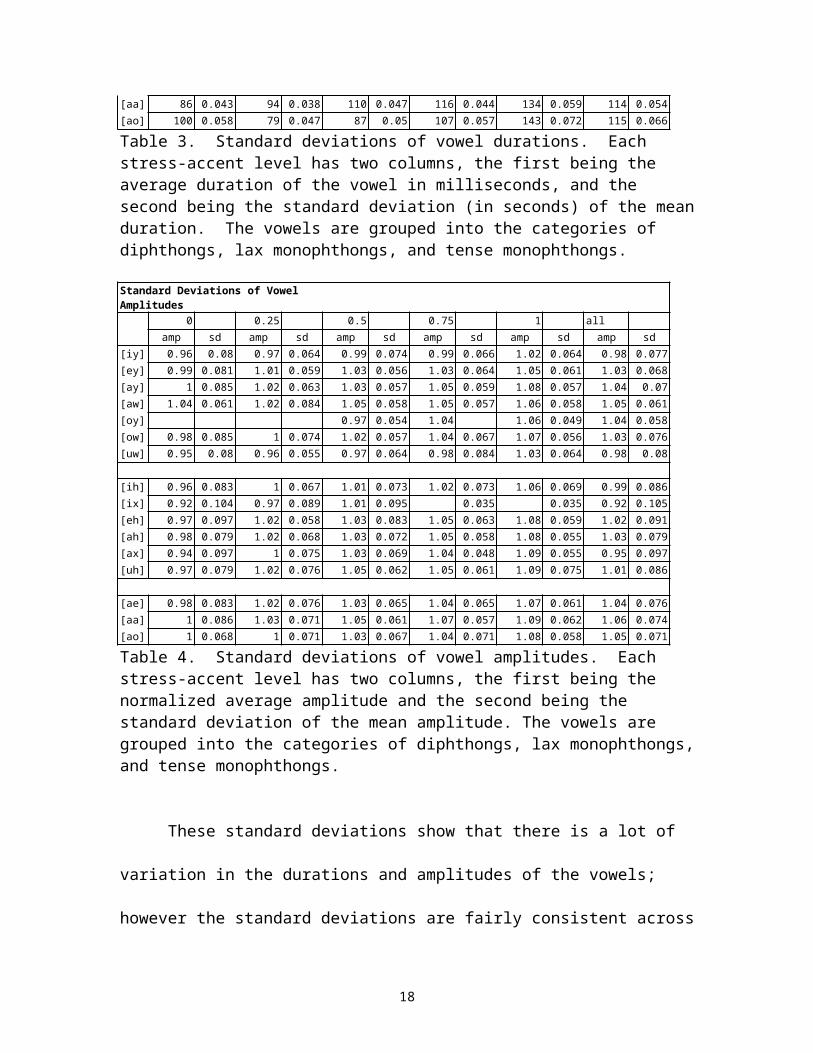
Table 3. Standard deviations of vowel durations. Each stress-accent level has two columns, the first being the average duration of the vowel in milliseconds, and the second being the standard deviation (in seconds) of the mean duration. The vowels are grouped into the categories of diphthongs, lax monophthongs, and tense monophthongs.
Standard Deviations of Vowel Amplitudes0 0.25 0.5 0.75 1 all
amp sd amp sd amp sd amp sd amp sd amp sd[iy] 0.96 0.08 0.97 0.064 0.99 0.074 0.99 0.066 1.02 0.064 0.98 0.077[ey] 0.99 0.081 1.01 0.059 1.03 0.056 1.03 0.064 1.05 0.061 1.03 0.068[ay] 1 0.085 1.02 0.063 1.03 0.057 1.05 0.059 1.08 0.057 1.04 0.07[aw] 1.04 0.061 1.02 0.084 1.05 0.058 1.05 0.057 1.06 0.058 1.05 0.061[oy] 0.97 0.054 1.04 1.06 0.049 1.04 0.058[ow] 0.98 0.085 1 0.074 1.02 0.057 1.04 0.067 1.07 0.056 1.03 0.076[uw] 0.95 0.08 0.96 0.055 0.97 0.064 0.98 0.084 1.03 0.064 0.98 0.08
[ih] 0.96 0.083 1 0.067 1.01 0.073 1.02 0.073 1.06 0.069 0.99 0.086[ix] 0.92 0.104 0.97 0.089 1.01 0.095 0.035 0.035 0.92 0.105[eh] 0.97 0.097 1.02 0.058 1.03 0.083 1.05 0.063 1.08 0.059 1.02 0.091[ah] 0.98 0.079 1.02 0.068 1.03 0.072 1.05 0.058 1.08 0.055 1.03 0.079[ax] 0.94 0.097 1 0.075 1.03 0.069 1.04 0.048 1.09 0.055 0.95 0.097
11

[uh] 0.97 0.079 1.02 0.076 1.05 0.062 1.05 0.061 1.09 0.075 1.01 0.086
[ae] 0.98 0.083 1.02 0.076 1.03 0.065 1.04 0.065 1.07 0.061 1.04 0.076[aa] 1 0.086 1.03 0.071 1.05 0.061 1.07 0.057 1.09 0.062 1.06 0.074[ao] 1 0.068 1 0.071 1.03 0.067 1.04 0.071 1.08 0.058 1.05 0.071
Table 4. Standard deviations of vowel amplitudes. Each stress-accent level has two columns, the first being the normalized average amplitude and the second being the standard deviation of the mean amplitude. The vowels are grouped into the categories of diphthongs, lax monophthongs, and tense monophthongs.
These standard deviations show that there is a lot of variation in the durations and
amplitudes of the vowels; however the standard deviations are fairly consistent across
categories, and vowels with higher intrinsic durations and amplitudes tended to have
higher standard deviations. There are many possible reasons for the amount of variance
in the data. An obvious contribution to the variance is the fact that the speakers of the
corpus were of both genders and were from all over the United States, and therefore their
speech can be expected to exhibit gender differences as well as dialect differences.
Additionally, there may have been a slight dialect-bias among the phonetic segment
transcribers for segments such as [ao], which differ according to dialect regions of the
US.
Analysis of the data for the different genders shows only very slight differences in
the vowels of female versus male speakers. The vowels of female speakers were on
average 9 milliseconds longer than the vowels of male speakers, with intrinsically short
vowels exhibiting a smaller gender difference and intrinsically long vowels exhibiting a
greater gender difference. Male speakers tended to have a slightly larger dynamic range
of amplitude between accented and unaccented occurrences of each vowel than female
speakers. These two tendencies suggest that female speakers may speak at a slightly
slower rate than male speakers, and that male speakers might utilize amplitude
12
differences a little more to convey accent. However, since these differences are very
slight, more research would need to be done to substantiate these findings. Overall, the
patterns of female and male speakers did not differ significantly from the patterns for all
speakers (see figures 1 and 3-6).
Figure 3. Duration in seconds, male vs. female speakers, diphthongs. The Y-axis is the average duration, in seconds. The vowels are arranged along the X-axis approximately according to horizontal tongue position. The Y-axis was inverted to show the relationship between vowel height and duration.
Figure 4. Duration in seconds, male vs. female speakers, monophthongs. The Y-axis is the average duration, in seconds. The vowels are arranged along the X-axis approximately according to horizontal tongue position. The Y-axis was inverted to show the relationship between vowel height and duration.
13

Figure 5. Amplitude range for male and female speakers for the diphthongs. Range is defined as the normalized average energy of the stressed occurrences of the vowel minus the normalized average energy of the unstressed occurrences. The Y-axis shows the range, and the vowels are arranged approximately according to horizontal tongue position along the X-axis.
Figure 6. Amplitude range for male and female speakers for the monophthongs. Amplitude range is defined as the normalized average amplitude of the stressed occurrences of the vowel minus the normalized average amplitude of the unstressed occurrences. The Y-axis shows the range, and the vowels are arranged approximately according to horizontal tongue position along the X-axis.
Unfortunately, there was an insufficient amount of data from each dialect region
to obtain information about the general patterns associated with each region. The
expectation, had there been more data, is that speakers from certain regions would tend
to, on average, have longer vowels than speakers from other dialect regions, and that
some regions would exhibit a more pronounced amplitude difference between accented
and unaccented vowels than other regions. Theoretically, this would account for some of
the variance.
Most likely, however, the variance among the duration data is due to different
speaking rates among different speakers, and the variance in amplitude data, similarly, is
due to that fact that individual speakers vary the volume of their voices differently. What
is important in this research is not that there is variance among the data; in fact, with the
high number of factors, such as different speakers, genders, and dialects, which
14

contribute to variance in spontaneous speech, a relatively large amount of variance in the
data is expected. What is interesting about the data is that despite the variance, the
patterns came out so clearly. The study of spontaneous speech is a fairly new area of
linguistics, made possible by extensive improvements to computer technology in recent
years, and the fact that such clear patterns exist is very encouraging to the field of speech
technology, particularly for speech recognition. Understanding the patterns that exist in
actual speech should make possible much more accurate recognition systems than those
that currently exist.
Future research projects could attempt to correct for factors like gender, dialect
and speaking rate in order to understand even better how stress-accent is exhibited in
spontaneous speech, but it is doubtful that the results of such research would contradict
the general patterns shown in this paper. However, an understanding of the factors that
contribute variety to spontaneous speech should have a profound affect on the field of
speech recognition, and therefore deserve attention. This paper is a first look at general
patterns in spontaneous speech; hopefully these patterns will be studied much more
closely in the future.
Conclusions
The data in this paper clearly show a relationship between stress-accent and vowel
height, duration and amplitude in American English. This supports the results of much
recent research on stress accent (Beckman, 1986, Van Kuijk and Boves, 1999, Silipo and
Greenberg, 1999 and 2000) which has shown this relationship in both lab speech and
spontaneous speech to a certain extent. The data on vowel duration and amplitude
support Lehiste and Peterson’s research (1959 &1960) on intrinsic duration and
15

amplitude of vowels. While their intrinsic durations, which were based on lab speech, are
much longer than what was shown in spontaneous speech, the overall patterns are the
same. Low vowels and diphthongs tend to be louder and longer than high vowels and
monophthongs. The prosodic data clearly show a close relationship between vowel
duration and stress-accent, as well as amplitude and stress-accent. Additionally, duration
and amplitude are clearly related to vowel height, which is also related to stress-accent.
Longer, louder vowels tend to be perceived as accented; low vowels tend to be longer and
louder than high vowels; therefore low vowels tend to be perceived as accented more
often than high vowels.
There are a couple of theories as to why low vowels are longer and louder than
high vowels (there is a good summary of some of these in Beckman, 1986). One
explanation for the durational differences is that physically it takes longer to transition
from a low vowel to a surrounding consonantal environment because the constrictions
made to produce consonants are high in the mouth, and the tongue is low in the mouth
when producing low vowels. The traditional explanation for the amplitude differences is
also based on physics. Basically, to produce a high vowel that is equal in loudness to a
low vowel, a different amount of effort is required of the speaker depending on the
constriction in the vocal tract, which has a different shape for low vowels than high
vowels. (see Beckman, 1986, Lehiste and Peterson, 1959 and 1960).
For the purposes of this study, the physical reason for the different intrinsic
amplitudes and durations of vowels is not as important as the effect that these differences
have on stress-accent. A very short vowel, like [ix], probably will be perceived as
stressed at a shorter duration than a very long vowel, like [aw]. It has been shown in
16
several languages that intrinsic duration differences affect phonemic length contrasts (see
Beckman, 1986, chapter 5). This is consistent with the findings of the current study.
Table 2 shows the varying average length and amplitude of vowels, and clearly some
vowels are perceived as stressed at much shorter durations than others.
However, despite different length requirements for different vowels, it is also true
that vowels that are intrinsically longer and louder tend to be perceived as stressed much
more frequently than their shorter, quieter counterparts. Apparently, the actual duration
and amplitude of a vowel relative to other vowels affect perceived stress-accent, as do the
proportional duration and amplitude of a vowel to its intrinsic duration and amplitude.
Vowels with high intrinsic durations and amplitudes (i.e. the low vowels) are perceived
as stressed much more frequently than those with lower intrinsic durations and
amplitudes. However, even those vowels that are typically very long and loud are
sometimes unstressed, generally when the duration and amplitude of the vowel are much
lower than usual.
This finding is consistent with the theory of prosody proposed by Vanderslice and
Ladefoged (1972) that separates syllables into heavy versus light and accented versus
unaccented. According to this theory, light syllables are typically reduced, or in any case
unstressed, while heavy syllables tend to not be reduced, even when they are unaccented.
Light syllables can only “one of the vowels , I [], o (the monophthongal reduction of
ou) or u [] or a syllabic consonant. To these we would add [r] and, occasionally in final
open syllables, [i] as in northern US city, and [u] as in Hindu,” (p.823). This list
corresponds very closely with the high vowels, both monophthongs and diphthongs,
which the data from this paper clearly show are the vowels most likely to appear in
17
unaccented syllables. Vanderslice and Ladefoged’s paper suggests that all other vowels
(i.e. the low vowels) appear in heavy, (i.e. likely to be accented and unreduced) syllables.
This paper makes a high versus low distinction between the two classes of vowels, but
the result is similar: some vowels are much more likely to be accented than others are.
The difference is that their theory is a theory on how to label prosodic features, while this
study shows concretely the patterns that exist in spontaneous discourse.
The extent to which the data collected for this study support various research
projects done on lab speech is encouraging. The finding that low vowels are intrinsically
longer and louder than high vowels has been shown by Lehiste and Peterson (1959 and
1960, Lehiste, 1996) in studies done on lab speech. Fox (1955) first showed with
synthesized speech that duration and amplitude are important cues of perceived stress-
accent in English. Now that technology has made it possible to conduct in-depth research
on spontaneous speech, many studies done previously on lab speech will be questioned;
the results of this study show that some patterns exhibited in lab speech are very similar
to spontaneous speech.
Acknowledgements
I would like to thank Steve Greenberg and John Ohala for their advice and
assistance, Joy Hollenback and Shawn Chang for their help with the research and
compiling data, Jeff Good for prosodically transcribing the data, and Candace Cardinal,
Rachel Coulston and Colleen Richey for phonetically transcribing the corpus.
18