as: isrm suggested method for the determination of mode...
TRANSCRIPT
Originally published as:
Backers, T., Stephansson, O. (2012): ISRM Suggested Method for the Determination of Mode II
Fracture Toughness. ‐ Rock Mechanics and Rock Engineering, 45, 6, 1011‐1022
DOI: 10.1007/s00603‐012‐0271‐9
� Please send all written comments on these ISRM Suggested Methods to Prof R. Ulusay, President of the ISRM Commission on Testing Methods, Hacettepe Univeristy, Geological Engineering Department, 06800 Beytepe, Ankara, Turkey at [email protected]. # Corresponding author: Tobias Backers, August-Bebel-Strasse 27. 14482 Potsdam. Germany. [email protected]. s
ISRM Suggested Method for the Determination of Mode II Fracture Toughness*
Tobias Backers1) and Ove Stephansson1) 2)
1) geomecon GmbH. August-Bebel-Strasse 27. 14482 Potsdam. Germany. [email protected].
2) Helmholtz-Zentrum Potsdam GFZ German Research Centre for Geosciences. Telegrafenberg. 14473 Potsdam.
Germany.
1. Introduction
Fracture is a failure mechanism of brittle materials that is of great importance for the performance of structures. Rapid
and violent failures of large-scale geotechnical, mining or civil engineering structures cause significant safety hazards,
material damage, and interruption to or even cessation of mining or building activities. Ability to recognise pre-failure rock
mass behaviour may result in predicting or averting the potential for geotechnical and geological failures (Szewdzicki
2003). Rock fracture mechanics is one approach to resolve this task.
Rock fracture mechanics can be employed not only to improve safety, but also enhance the performance and profitability
of rock engineering structures. Examples are the geological disposal of radioactive waste, terrestrial sequestration of
carbon dioxide to ease prejudicial effects on the environment, efficient underground storage of oil, gas or air, enhanced
recovery of hydrocarbons, geothermal energy extraction, and underground constructions at increasing overburden
pressure for infrastructure or transport. For these geomechanical applications the stress states are mostly compressive,
therefore, shearing is an important failure mechanism in rock materials.
The stress and displacement field around a crack tip during shearing results from the application of uniform shear
loadings at infinity. In this so-called Mode II loading in fracture mechanics, the crack faces slide relative to each other
and displacements of the crack surfaces are in the crack plane and perpendicular to the crack front. The crack initiation
takes place when the crack tip stress intensity factor KII reaches a critical value, called the Mode II plain strain fracture
toughness KIIC. The value of KII depends on the external loading, the geometry of the specimen and crack dimension.
The fracture toughness KIIC, sometimes called critical stress intensity factor, is a material parameter depending on the
type of rock material and its physical boundary conditions, such as confining pressure and temperature.
Whittaker et al. (1992) have presented an overview of different methods for determination of Mode II fracture toughness.
Some more recent methods have been proposed by e.g. (Chang et al. 2002; Hakami and Stephansson 1990; Ko and
Kemeny 2006; Rao et al. 2003). Only Rao et al. (2003) performed experiments on Short Beam Compression specimens
with application of confining pressure that is independent of the vertical load, but the method is under discussion as it
frequently delivers KIC > KIIC (Whittaker et al. 1992; Watkins and Liu 1985).
The important influence of confining pressure on Mode II fracture toughness can only be determined by methods that
can independently apply a normal load to the fracture plane. It has been stated by several researchers that under
conditions of overall compression Mode II fracture propagation is most likely (Melin 1986; Lawn 1993). This was
experimentally confirmed by Bobet and Einstein (1998) who demonstrated that macroscopic wing fractures (Mode I) can
be suppressed by applying confining pressure, i.e. normal stress. Confining pressure had to be applicable to the
specimen to be able to suppress macroscopic tensile fracturing. The Punch-Through Shear with Confining Pressure
(PTS/CP) experiment (Backers 2005; Backers et al 2002; Backers et al. 2004) allows measuring KIIC at different
confining pressures. A modified version of PTS/CP test of rectangular samples under biaxial loading was presented by
Lee (2007).

page (2) of (18)
In Mode I loading the crack is subjected to a normal stress, the crack surfaces separate symmetrically and the crack
front propagates in direction of the crack plane. Three ISRM Suggested Methods for determining Mode I fracture
toughness KIC have been presented (Ouchterlony 1988; Fowell et al 1995). Fracturing in rock structures commonly
occurs under mixed mode I-II loading where crack faces undergo both opening and sliding displacements and where
pure Mode I stress and pure Mode II stress intensity are the limiting cases of mixed mode I-II loading. To solve common
rock engineering problems with a fracture mechanics approach both fracture toughnesses KIC and KIIC are needed.
The Suggested Method for KIIC fracture toughness determination makes use of the Punch-Through Shear with Confining
Pressure (PTS/CP) experiment, where specimens from KIC testing (Chevron Bend test (Ouchterlony 1988)) can be used
to obtain fracture toughness data for both Mode I and Mode II analysis.
It may be discussed if the concept of mode of fracturing is applicable to rock material. Rock is, in general, a multi-
component material. Hence, when a fracture propagates through the material, it may not follow a straight trace but is
influenced by grain boundaries, cracks, flaws and other discontinuities. From a mathematical point of view, in which the
concept of the mode of fracturing was developed, a pure mode of fracture can only be achieved if the fracture
propagates in a straight continuous plane within a given homogeneous stress field. Therefore, any deviation of the
propagation direction of the fracture within the applied stress field introduces some mixed mode kind of fracturing.
Moreover, the fracture follows the given fabric and the fabric itself will introduce stress fluctuations that superimposes to
the applied stress field (Dyskin 1999). In addition, the fracture generated will itself introduce cracks in its surrounding and
build up a zone of mixed mode microcracking, the so called fracture process zone. Hence, for a granular material the
differentiation into the mode of fracturing is not possible on the microscale.
From analysis of acoustic emission recording in laboratory experiments it has been clearly shown that at Mode I and
Mode II loading conditions, where the macroscopic fracture follows the direction of Mode I and Mode II respectively, the
micromechanical breakdown involves both tensile as well as shear cracking (e.g. Backers et al. 2005; Stanchits et al.
2003). Therefore, neither under pure Mode I nor Mode II loading conditions is the crack propagation pure tensile or pure
shear; fracturing in rock material always involves a mixed mode on the microscale.
In the context of laboratory based fracture toughness testing the mode of fracturing is here understood from a
macroscopic point of view, at which the fracture propagation is in the direction of Mode I or Mode II. Further, as fracture
toughness depends on boundary conditions, the term material property is not applicable.
3. Scope
The laboratory experiment is intended to directly measure the Mode II (in-plane shear) fracture toughness of rock
material. The geometry of the test specimen is designed to use standard core material (NX size or 50 mm diameter) and
to deploy the remaining halves from Mode I (tensile) fracture toughness testing by the Chevron Bend method (ISRM
Suggested Method (Ouchterlony 1988)). The experimental set-up allows the Mode II fracture toughness to be measured
at different levels of confining pressure. The test is called the Punch-Through Shear with Confining Pressure PTS/CP
experiment.
4. Specimen Preparation
4.1. For any specimen preparation treatment appropriate high precision (preferably diamond stud) tools should be used.
During specimen preparation, caution has to be taken to limit the micromechanical damage of the specimen.
Micromechanical damage may influence the fracture propagation and cause reduced magnitude of fracture toughness.
Cautious specimen preparation should involve slow drilling, cutting and grinding operations to limit vibrations and heat
generation. If no cooling agent can be used in the process of specimen preparation, special caution has to be taken to
limit the temperature increase due to specimen preparation.

page (3) of (18)
4.2. The specimens should be right circular cylinders having a height L to diameter D ratio of 1:1 and a diameter D equal
to 50 mm (Figure 1). The end surfaces should be flat to 0.01 mm and shall not depart from perpendicularity to the
longitudinal axis of the specimen by more than 0.5 degrees.
4.3. The mantle surface of the specimen cylinder should be smooth, free of abrupt irregularities and straight to within
0.5 mm over the full length of the specimen. Such irregularities might act as stress concentrators.
4.4. A circular notch of diameter ID = 0.5·D = 25 ± 0.2 mm and depth a = 0.1·D = 5 ± 0.2 mm is to be inserted into one
end surface of the cylindrical specimen and a circular notch of diameter ID = 0.5·D = 25 ± 0.2 mm and depth b = 0.6·D =
30 ± 0.2 mm shall be manufactured into the other end surface (Figure 1). Hence, the intact rock portion is of length IP = L
- a - b = 15 mm. The axis of the circular notches has to be aligned with the cylinder axis of the specimen. The sinking of
the notches may be performed preferably by a CNC (Computerised Numerical Control) milling machine or alternatively
an appropriate hollow drill bit. The width of the notches shall be t = 1.5 ± 0.2 mm. The bottom of the notches should have
a small curvature.
4.5. The dimensions of the specimen should be measured to the nearest 0.1 mm. The specimen diameter should be
measured by averaging two diameters measured at right angles at at-least two levels. The notch depths should be
reported by averaging three measurements at angles of 120 degrees. The specimen height should be determined by
averaging three measurements at angles of 120 degrees.
4.6. The specimen should be stored after specimen preparation for an appropriate time interval at sufficient conditions to
achieve the desired moisture condition and history. The conditions of storage, moisture adjustment or drying shall be
reported.
4.7. The minimum information on each specimen shall include dimensions, specimen preparation routines, special
observations made during specimen preparation, moisture content, and macroscopic description of the surface.
5. Experimental set-up
5.1. The specimen is placed on top of a bottom support that has a central cut out CO of diameter ID + 2·t < CO < ID +
5 mm and depth CD ≈ 0.1·D (Figure 2). The specimen end surface with the notch of length b faces downwards.
5.2. A load stamp assembly is placed on top of the specimen that should contain a load piston of diameter LO = ID and
shall provide a sealing of the specimen from a possible confining pressure liquid (Figure 2).
5.3. The whole assembly may be covered by a jacket that seals the specimen from the confining pressure medium.
5.4. The assembly consisting of specimen, loading devices and jacket is placed into a loading frame of sufficient capacity
and equipped with a system to apply a confining pressure that can be independently controlled. The load piston of the
system should be travelled into contact with the load stamp of the installed assembly; no axial load should be applied at
this stage. Thereafter the confining pressure system should be filled with confining pressure medium.
No guidelines on how to insert the specimen assembly into the loading frame or confining pressure device are given in
detail, as very different systems are available. It must be assured that the workflow can be followed with the used loading
equipment.
6. Testing Procedure
6.1. The minimum information collected during experiment is the applied confining pressure PC and peak load Fmax.
However, it is advisable to continuously record the axial deformation δ (accuracy Δδ = 0.001 mm), the axial load Fax
(accuracy ΔFax = 0.05 kN) and the confining pressure (accuracy ΔPc = 0.05MPa) during the experiment. The rate of data
acquisition should be appropriate to detect the maximum load achieved; a rate of four data sets per second (s) may be
found sufficient for the suggested axial displacement rate.
page (4) of (18)
6.2. A small pre-load Fpre is applied to the experimental set-up. The pre-load Fpre should be large enough to firmly
stabilise the assembly, but sufficiently small as to not introduce any damage to the specimen (Figure 3a).
6.3. The confining pressure PC is applied subsequently (Figure 3b). The confining pressure will act on the mantle surface
and on the top surface of the specimen. On reaching the desired level of confining pressure, PC should be kept constant.
A servo-controlled system is recommended.
6.4. The axial displacement is increased at a constant rate of dδ = 0.2 mm/min (3.3·10-6 m/s) (Figure 3c) resulting in an
increase of the axial load. The other boundary conditions are kept constant.
6.5. At peak load a fracture propagates between the notches (Figure 3d). The experiment may be terminated after
driving the test to the post-peak.
6.6. The number of specimens per sample tested should be determined by practical considerations, but a minimum of
five specimens is recommended. A sample in the sense of experiments consists of all specimens tested at the same
boundary conditions.
7. Calculations
The Mode II fracture toughness may be evaluated from the peak load Fmax achieved during testing by
KIIC = 7.74·10-2 Fmax - 1.80·10-3 PC (1)
where KIIC is in (MPa√m), Fmax is given in (kN), and PC is given in (MPa). The formula is valid for the suggested geometry
only, i.e. L = D = 50 mm, ID = 25 mm, a = 5 mm and b = 30mm.
8. Reporting of Results
The report of each experiment should at least include the following:
8.1. Source of specimen as precisely as possible; location and orientation.
8.2. Lithological description of the rock type including grain size.
8.3. Details of the methods used for specimen preparation, dimensions of the prepared specimen, special observations
made during specimen preparation, and macroscopic description of the specimen surface.
8.4. Orientation of the loading axis with respect to the specimen anisotropy, bedding planes, etc.
8.5. History and environment of test specimen storage or treatment (temperature, drying, saturation, etc.).
8.6. Specimen condition at time of test (saturation degree, fluid / gas content, temperature, etc.).
8.7. Details of experiment including history, confining pressure, loading rate, etc.
8.8. A record of the peak load.
8.9. Individual test plots showing confining pressure, axial stress and axial displacement vs. time. If there is major stress
drops during loading, the test should be considered invalid.
8.10. The calculated value of the Mode II fracture toughness; if known, along with the Mode I fracture toughness and the
ratio of KIIC / KIC.
8.11. Description of the specimen after testing, especially description of the macroscopic visible fractures. If there are
fractures other than the vertical connection of the notches on stopping the test at peak load, the test may be discarded.
The report of a series of samples should contain the following:

page (5) of (18)
8.12. The average value of each sample of experiments including a representative measure of the scatter.
8.13. A plot showing the Mode II fracture toughness of each sample as a function of confining pressure.
8.14. The ratio of KIIC / KIC if the Mode I fracture toughness was determined, e.g. by the Chevron Bend experiment (ISRM
Suggested Method (Ouchterlony 1988)).
9. Typical values
Table 1 gives some examples of Mode I and Mode II fracture toughness values for different rocks. The Mode I fracture
toughness was determined using the ISRM Suggested Method Chevron Bend Method (Ouchterlony 1988) and the Mode
II fracture toughness was determined by to the above procedure.
10. Notes and Recommendations
The following notes and recommendations shall support and explain the details of the suggested method. For further
details on the reported results and information, please refer to the given references.
10.1 Evaluation procedure
It is suggested that KIIC is estimated by a technique based on a displacement extrapolation technique (DET) as
frequently used in literature, e.g. Lim et al. (1993). The displacement formulations are based on Irwin’s crack tip
displacement equations (Whittaker et al. 1992). In Cartesian coordinates, the displacements are given by
(2)
(3)
where u is the displacement in shear direction, v is the displacement perpendicular to u, G is the shear modulus, k = 3-
4, with being Poisson’s ratio, r is the distance from the crack tip, and θ is the angle from the shear direction. In the
case of θ = ± 180°, i.e. on the notch faces, equations (2) and (3) become
(4)
v KI
4G
r
22k 2 (5).
Thus KI and KII can be determined separately by the x- and y- direction displacements. In the case of KII, u is measured
at the nodal points of the upper and lower notch faces, i.e. θ = ± 180°, thus
, at θ = + 180° (6)
, at θ = - 180°. (7)
The relative y-direction displacement of the corresponding nodes is
(8)
and consequently KiII is defined by
u u
i u
i
KIIi
G
ri
2 k 1
u
i
KIIi
2G
ri
2 k 1
u
i
KIIi
2G
ri
2 k 1
v
KI
4G
r
2 2k 1 sin
2 sin
32
KII
4G
r
2 2k 3 cos
2 cos
32
u
KI
4G
r
2 2k 1 cos
2 cos
32
KII
4G
r
2 2k 3 sin
2 sin
32
page (6) of (18)
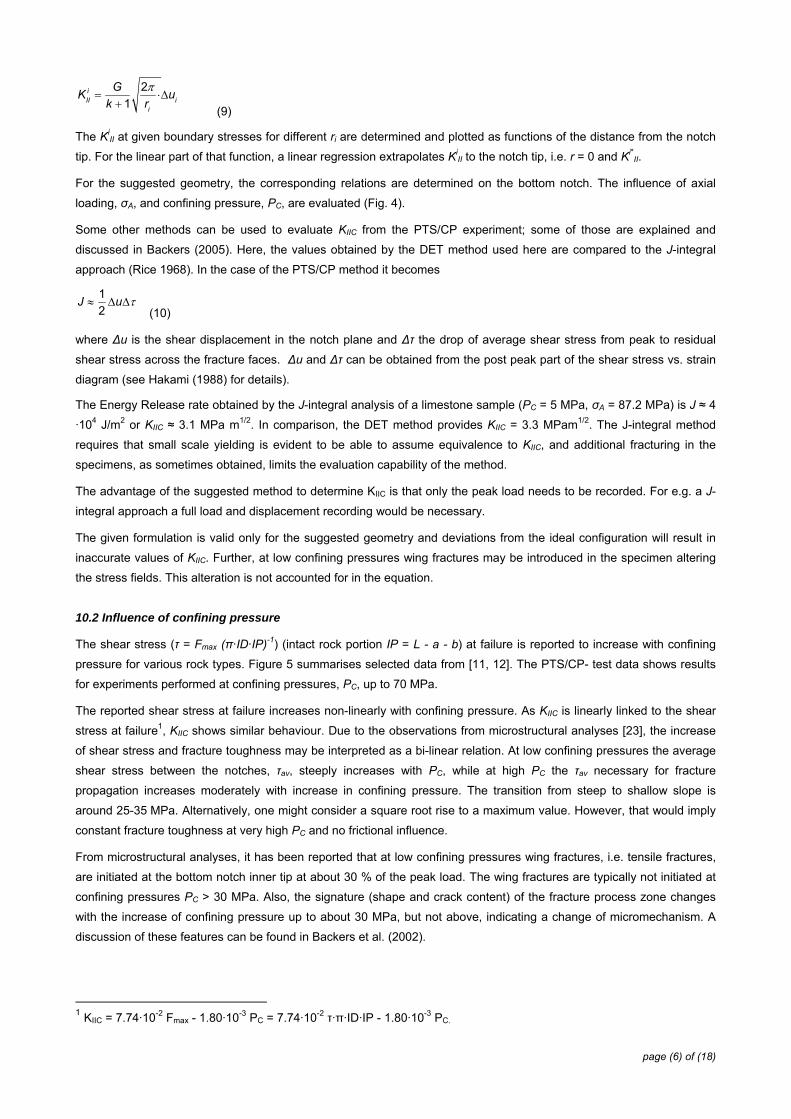
(9)
The KiII at given boundary stresses for different ri are determined and plotted as functions of the distance from the notch
tip. For the linear part of that function, a linear regression extrapolates KiII to the notch tip, i.e. r = 0 and Ki*
II.
For the suggested geometry, the corresponding relations are determined on the bottom notch. The influence of axial
loading, σA, and confining pressure, PC, are evaluated (Fig. 4).
Some other methods can be used to evaluate KIIC from the PTS/CP experiment; some of those are explained and
discussed in Backers (2005). Here, the values obtained by the DET method used here are compared to the J-integral
approach (Rice 1968). In the case of the PTS/CP method it becomes
(10)
where Δu is the shear displacement in the notch plane and Δτ the drop of average shear stress from peak to residual
shear stress across the fracture faces. Δu and Δτ can be obtained from the post peak part of the shear stress vs. strain
diagram (see Hakami (1988) for details).
The Energy Release rate obtained by the J-integral analysis of a limestone sample (PC = 5 MPa, σA = 87.2 MPa) is J ≈ 4
·104 J/m2 or KIIC ≈ 3.1 MPa m1/2. In comparison, the DET method provides KIIC = 3.3 MPam1/2. The J-integral method
requires that small scale yielding is evident to be able to assume equivalence to KIIC, and additional fracturing in the
specimens, as sometimes obtained, limits the evaluation capability of the method.
The advantage of the suggested method to determine KIIC is that only the peak load needs to be recorded. For e.g. a J-
integral approach a full load and displacement recording would be necessary.
The given formulation is valid only for the suggested geometry and deviations from the ideal configuration will result in
inaccurate values of KIIC. Further, at low confining pressures wing fractures may be introduced in the specimen altering
the stress fields. This alteration is not accounted for in the equation.
10.2 Influence of confining pressure
The shear stress (τ = Fmax (π·ID·IP)-1) (intact rock portion IP = L - a - b) at failure is reported to increase with confining
pressure for various rock types. Figure 5 summarises selected data from [11, 12]. The PTS/CP- test data shows results
for experiments performed at confining pressures, PC, up to 70 MPa.
The reported shear stress at failure increases non-linearly with confining pressure. As KIIC is linearly linked to the shear
stress at failure1, KIIC shows similar behaviour. Due to the observations from microstructural analyses [23], the increase
of shear stress and fracture toughness may be interpreted as a bi-linear relation. At low confining pressures the average
shear stress between the notches, τav, steeply increases with PC, while at high PC the τav necessary for fracture
propagation increases moderately with increase in confining pressure. The transition from steep to shallow slope is
around 25-35 MPa. Alternatively, one might consider a square root rise to a maximum value. However, that would imply
constant fracture toughness at very high PC and no frictional influence.
From microstructural analyses, it has been reported that at low confining pressures wing fractures, i.e. tensile fractures,
are initiated at the bottom notch inner tip at about 30 % of the peak load. The wing fractures are typically not initiated at
confining pressures PC > 30 MPa. Also, the signature (shape and crack content) of the fracture process zone changes
with the increase of confining pressure up to about 30 MPa, but not above, indicating a change of micromechanism. A
discussion of these features can be found in Backers et al. (2002).
1 KIIC = 7.74·10-2 Fmax - 1.80·10-3 PC = 7.74·10-2 τ·π·ID·IP - 1.80·10-3 PC.
J
1
2u
KIIi
G
k 1
2ri
ui
page (7) of (18)
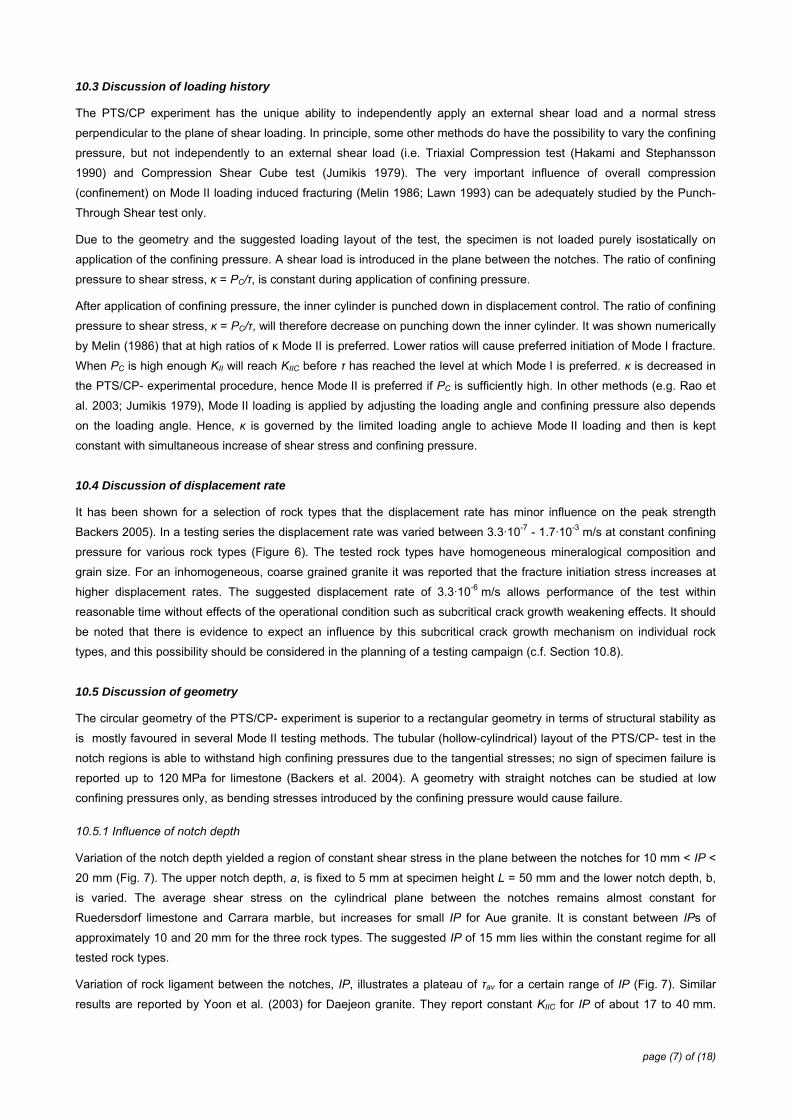
10.3 Discussion of loading history
The PTS/CP experiment has the unique ability to independently apply an external shear load and a normal stress
perpendicular to the plane of shear loading. In principle, some other methods do have the possibility to vary the confining
pressure, but not independently to an external shear load (i.e. Triaxial Compression test (Hakami and Stephansson
1990) and Compression Shear Cube test (Jumikis 1979). The very important influence of overall compression
(confinement) on Mode II loading induced fracturing (Melin 1986; Lawn 1993) can be adequately studied by the Punch-
Through Shear test only.
Due to the geometry and the suggested loading layout of the test, the specimen is not loaded purely isostatically on
application of the confining pressure. A shear load is introduced in the plane between the notches. The ratio of confining
pressure to shear stress, κ = PC/τ, is constant during application of confining pressure.
After application of confining pressure, the inner cylinder is punched down in displacement control. The ratio of confining
pressure to shear stress, κ = PC/τ, will therefore decrease on punching down the inner cylinder. It was shown numerically
by Melin (1986) that at high ratios of κ Mode II is preferred. Lower ratios will cause preferred initiation of Mode I fracture.
When PC is high enough KII will reach KIIC before τ has reached the level at which Mode I is preferred. κ is decreased in
the PTS/CP- experimental procedure, hence Mode II is preferred if PC is sufficiently high. In other methods (e.g. Rao et
al. 2003; Jumikis 1979), Mode II loading is applied by adjusting the loading angle and confining pressure also depends
on the loading angle. Hence, κ is governed by the limited loading angle to achieve Mode II loading and then is kept
constant with simultaneous increase of shear stress and confining pressure.
10.4 Discussion of displacement rate
It has been shown for a selection of rock types that the displacement rate has minor influence on the peak strength
Backers 2005). In a testing series the displacement rate was varied between 3.3·10-7 - 1.7·10-3 m/s at constant confining
pressure for various rock types (Figure 6). The tested rock types have homogeneous mineralogical composition and
grain size. For an inhomogeneous, coarse grained granite it was reported that the fracture initiation stress increases at
higher displacement rates. The suggested displacement rate of 3.3·10-6 m/s allows performance of the test within
reasonable time without effects of the operational condition such as subcritical crack growth weakening effects. It should
be noted that there is evidence to expect an influence by this subcritical crack growth mechanism on individual rock
types, and this possibility should be considered in the planning of a testing campaign (c.f. Section 10.8).
10.5 Discussion of geometry
The circular geometry of the PTS/CP- experiment is superior to a rectangular geometry in terms of structural stability as
is mostly favoured in several Mode II testing methods. The tubular (hollow-cylindrical) layout of the PTS/CP- test in the
notch regions is able to withstand high confining pressures due to the tangential stresses; no sign of specimen failure is
reported up to 120 MPa for limestone (Backers et al. 2004). A geometry with straight notches can be studied at low
confining pressures only, as bending stresses introduced by the confining pressure would cause failure.
10.5.1 Influence of notch depth
Variation of the notch depth yielded a region of constant shear stress in the plane between the notches for 10 mm < IP <
20 mm (Fig. 7). The upper notch depth, a, is fixed to 5 mm at specimen height L = 50 mm and the lower notch depth, b,
is varied. The average shear stress on the cylindrical plane between the notches remains almost constant for
Ruedersdorf limestone and Carrara marble, but increases for small IP for Aue granite. It is constant between IPs of
approximately 10 and 20 mm for the three rock types. The suggested IP of 15 mm lies within the constant regime for all
tested rock types.
Variation of rock ligament between the notches, IP, illustrates a plateau of τav for a certain range of IP (Fig. 7). Similar
results are reported by Yoon et al. (2003) for Daejeon granite. They report constant KIIC for IP of about 17 to 40 mm.

page (8) of (18)
Numerical analyses performed by Watkins (1983) on samples with similar, but cubic geometry give evidence of constant
stress intensity factor in Mode II for IP/L ratios of 0.3-0.5 (IP = 15 - 25 mm in case of PTS/CP- geometry) for
experimental Mode II fracture toughness determination of mortar without confining pressure.
For small ligament lengths the notches are expected to influence each other by coalescence and interaction of the initial
process zones before actual fracture propagation takes place at peak load; a decrease of shear stress necessary for
fracture propagation is expected at small IP. The initial fracture process zone was shown by means of acoustic emission
to be few millimetres in length (~ 2-3 mm for Mizunami granite; (Backers 2005; Stanchits et al. 2003)). If the process
zones of the top and bottom notches interact at low IP, as is suggested by acoustic emission, coalescence/overlap of the
fracture process zones should result in a magnified loss of strength. This is only vaguely supported by the shape of the
stress vs. IP plot at low IP in Figure 7 for Ruedersdorf limestone and Carrara marble. The elevated average shear stress
necessary for fracture growth in Aue granite (Fig. 7) might be explained by the comparably large grains (average is
1 mm, but up to 5 mm are included). At small IP only few grains are located between the notches and hence
coalescence might be aggravated by inter- as well as intragranular crack propagation accompanied by interlocking and
crack arrest.
10.5.2 Influence of asymmetric specimen geometry
The proposed depth of the notches is non-symmetrical; this is to avoid compressive failure of the upper part of the inner
cylinder during axial loading.
To verify an influence of the asymmetry on the test results, tests on samples of L = 25 mm with a = b = 5 mm, that is,
with a similar length of IP as for the suggested geometry, are performed. τav is the same within sample-to-sample scatter
for both the suggested (L = 50 mm) and short (L = 25 mm) geometries (Fig. 8). This also suggests that samples of L = 25
mm may be used if sample material is slender. Nevertheless, larger specimens are easier to handle and specimen
preparation is more secure.
To investigate the influence of notch length, tests were performed with a = 30 mm and b = 5 mm, i.e. with the
(suggested) specimen turned upside down, and compared to testing of samples with suggested set-up (Fig. 8). No
evidence for a noteworthy influence of the notch depth on τav is reported (Backers 2005). During this series of testing,
compressive failure of the top of the inner cylinder was frequently observed for specimens with a = 30 mm.
An unsymmetrical shape of the sample, i.e. notch depth a ≠ b, and sample height, L, is shown to have a minor influence
on the obtained τav. Hence, the contribution of bending of the unsupported outer ring to the Mode II fracture process is
either negligible or non-existing.
10.5.3 Influence of notch diameter and sample diameter
It should be noted that the Mode II fracture toughness as derived from the PTS/CP experiment may be sensitive to the
sample diameter D and notch diameter ID (Backers 2005). It was reported that τav decreases with increasing ID at
constant D for one large grained rock type. In addition, from selected experiments it is suggested that an increase of D
increases τav at given ID. The effect appears to depend on grain size, but has only been studied at low confining
pressure up to PC = 5 MPa.
10.5.4 Influence of notch width
Experiments with notch widths, t, of 0.8, 1.5 and 3.0 mm were carried out on Carrara marble (Backers 2005). The
0.8 mm notch was manufactured using a CNC milling machine, the 1.5 mm notch was prepared using a standard drill bit,
and the 3.0 mm notch was created by two drill bits with overlapping diameters. Results from this series of experiments
are given in Figure 9. The differences in τav show no clear trend for the tested t. Slight variation of τav may apply due to
the different methods to introduce the notches. Further, in a wider notch more grains are intersected at the bottommost

page (9) of (18)
of the notch, and hence more grain boundaries might be preferably oriented for local failure. The notch width (t = 1.5mm)
for the method was recommended as it may be produced with conventional hollow drill bits.
10.6 Discussion of fracture generation
The fracture generation was studied on a variety of specimens and rock types and under varying boundary conditions.
Fracture development and characteristics were described using macroscopic observations, thin section analysis, SEM,
and analysis of acoustic emission recordings.
Figure 10 summarises the typical fracture characteristics as observed in several studies. At low confining pressures,
typically PC < 30 MPa, at about 30 % of the peak load a wing shaped fracture develops from the bottom notch inner tip
(Fig. 10a). During propagation it turns towards the centre of the specimen until it is oriented almost vertically and then
stops. Frequently, it stops even before aligning itself parallel to the displacement direction. The length of the wing
fracture decreases with increasing confining pressure. At about 60 % of the peak load at the top notch a fracture was
frequently observed propagating from the dilatant tip of the notch to the mantle surface of the specimen (Fig. 10b). Upon
further loading these fractures remain stable. At peak load a fracture starts from the bottom notch and propagates to
connect to the top notch (Fig. 10c). At fracture propagation the load vs displacement data shows negative slope
indicating disintegration.
The reported formation of the bottom wing fracture (~30 % peak load) and upper horizontal fracture (~60 % peak load)
are not detectable in the stress vs. displacement data, hence the energy consumption of those is assumed to be minor.
Increased confining pressure, typically PC > 30 MPa, the wing shaped fractures are not initiated. The negative stress
intensity at the level of loading is sufficient to suppress tensile macroscopic fracture. Only the fracture connecting the
notches develops at increased confining pressures.
In contrast to the wing shaped fracture, which is usually a very distinct feature highlighting only a single crack line
separating mostly grains boundaries, the fracture that develops at peak load shows a wide fracture process zone. In a
study of the influence of the confining pressure on the characteristic of the process zone of the shear fracture it was
observed that the width of the zone is considerably reduced with increase of confining pressure [23]. The applied normal
load to the fracture trace alters the local stress redistribution and the fractures initiated in the process zone rotate to align
with the main fracture trace. Further, less crack surface is initiated leading to a smaller fracture process zone width.
These changes in characteristics were most prominent at PC < 30 MPa. Above this confining pressure the reported
changes were minor.
The changes in appearance of the fracture evolution and its characteristics with confining pressure may be related to a
change in slope in the shear strength / Mode II fracture toughness vs confining pressure data, c.f. Fig. 5.
Application of confining pressure superimposes a negative2 KI and this results in shorter wing fractures that stop before
being aligned with the major principle stress. No wing fractures are initiated at the notches in samples subjected to
confining pressures > 30 MPa. According to Melin (1986) pure macroscopic shear fracture growth occurs if the level of
confining pressure is high enough so that all tensile stresses at the fracture tips vanish or even become compressive.
The stresses at the bottom notch in PTS/CP- testing at higher confining pressures are consequently below a critical level
to allow macroscopic wing fracture initiation. Suppression of Mode I fracturing above a certain level of confining pressure
was experimentally proven by Bobet and Einstein (1998) and is consistent with the observations for the PTS/CP
experiment.
2 A negative KI describes a state of compression.

page (10) of (18)
10.7 Influence of temperature
In a series of experiments on a Korean granite the influence of temperature on Mode II fracture toughness was studied
Meier et al. (2009). 53 specimens were tested at temperatures ranging from -75°C to 250°C and using the Punch-
Through Shear with Confining Pressure experiment (Fig. 11). Variation of temperature has an impact upon the average
shear strength granite within the applied temperature range. The shear stress at failure shows elevated values at sub-
zero temperatures; it is anticipated that the water phase of the air dry specimens forms ice and the toughness of the ice
adds to the toughness of the rock. As the water is frozen below 0°C and the properties do not vary significantly, and τav
remains constant for that interval, the hypothesis of the superposition of rock and ice toughness is assumed valid.
Around the freezing point the values drop down to remain constant for up to 100°C. Presumably above temperatures of
100°C τav is slightly increasing again; the increase is due to crack propagation into newly formed arrester positions (i.e.
microcracks in orthogonal directions to the main travel direction).
10.8 Subcritical crack growth
The PTS/CP experiment was also employed to determine the subcritical crack growth parameters as defined in Charles‘
law (Backers et al. 2006). The study applied static loading at different fractions of the peak load and measured the time-
to-failure. From a weakest link theory (Wilkins 1987; Wilkins 1980) the subcritical parameters may be derived.
11. Acknowledgements
Erik Rybacki, Georg Dresen (both Helmholtz-Centre Potsdam - GFZ German Research Centre for Geosciences,
Germany) and Tobias Meier (then geomecon GmbH) were involved in certain aspects of the development of the testing
procedure, the discussion of results, and the review of this contribution. John Napier, John Kemeny, Chulwhan Park, Resat
Ulusay and an anonymous reviewer gave valuable comments, which helped improve the manuscript. The early versions
of the method were developed in collaboration with Technical University of Berlin, Germany, and Royal Institute of
Technology KTH Stockholm, Sweden. The main body of work was conducted at Helmholtz-Centre Potsdam - GFZ
German Research Centre for Geosciences, Germany. The work on some aspects as reported in the appendix was
carried out partly in the context of a GeoFrames GmbH (now geomecon GmbH) research and development project
supported by the European Union, European Fund for Regional Development, program ‘Investment to Future’, Period
2007-2013. Calvin Seward (geomecon GmbH) gave the manuscript a final language reading. The contributions of the
different individuals and institutions are greatly acknowledged.
References
1. Szwedzicki, T., Quality assurance in mine ground control management. International Journal of Rock
Mechanics and Mining Sciences, 2003. 40(4): p. 565-572.
2. Whittaker, B.N., R.N. Singh, and G. Sun, Rock Fracture Mechanics - Principles, Design and Applications. 1992,
Amsterdam: Elsevier Science Publisher.
3. Chang, S.H., C.I. Lee, and S. Jeon, Measurement of rock fracture toughness under modes I and II and mixed-
mode conditions by using disc-type specimens. Engineering Geology, 2002. 66(1-2): p. 79-97.
4. Hakami, H. and O. Stephansson, Shear fracture energy of Stripa granite - results of controlled triaxial testing.
Engineering Fracture Mechanics, 1990. 35: p. 855-865.
5. Rao, Q.H., et al., Shear fracture (Mode II) of brittle rock. International Journal of Rock Mechanics and Mining
Sciences, 2003. 40(3): p. 355-375.
page (11) of (18)
6. Ko, T.Y. and J. Kemeny, Determination of Mode II stress intensity factor using short beam compression test., in
4th Asian Rock Mechanics Symposium. 2006: Singapore.
7. Watkins, J. and K.L.W. Liu, A finite element study of the short beam test specimen under mode II loading.
International Journal of Cement Composites and Lightweight Concrete, 1985. 7(1): p. 39-47.
8. Melin, S., When does a crack grow under mode II conditions? International Journal of Fracture, 1986. 30: p.
103-114.
9. Lawn, B.R., Fracture of Brittle Solids. 1993: Cambridge Univiversity Press.
10. Bobet, A. and H.H. Einstein, Fracture coalescence in rock-type materials under uniaxial and biaxial
compression. International Journal of Rock Mechanics and Mining Sciences, 1998. 35(7): p. 863-888.
11. Backers, T., Fracture Toughness Determination and Micromechanics of Rock Under Mode I and Mode II
Loading. 2005, University of Potsdam: Potsdam.
12. Backers, T., O. Stephansson, and E. Rybacki, Rock fracture toughness testing in Mode II - punch-through shear
test. International Journal of Rock Mechanics and Mining Sciences, 2002. 39(6): p. 755-769.
13. Backers, T., et al., New data on Mode II fracture toughness of rock from the punch-through shear test.
International Journal of Rock Mechanics and Mining Sciences, 2004. 41(3): p. 351-352.
14. Lee, J.S., Time -dependent crack growth in brittle rocks and field applictions to geological hazards. 2007, The
University of Arizona, USA.
15. Ouchterlony, F., Suggested Methods for Determining the Fracture Toughness of Rock. International Journal of
Rock Mechanics and Mining Science & Geomechanics Abstracts, 1988. 25(2): p. 71-96.
16. Fowell, R.J., et al., Suggested Method for Determining Mode-I Fracture-Toughness Using Cracked Chevron-
Notched Brazilian Disc (Ccnbd) Specimens. International Journal of Rock Mechanics and Mining Sciences &
Geomechanics Abstracts, 1995. 32(1): p. 57-64.
17. Dyskin, A.V., On the role of stress fluctuations in brittle fracture. International Journal of Fracture, 1999. 100(1):
p. 29-53.
18. Backers, T., S. Stanchits, and G. Dresen, Tensile fracture propagation and acoustic emission activity in
sandstone: The effect of loading rate. International Journal of Rock Mechanics and Mining Sciences, 2005.
42(7-8): p. 1094-1101.
19. Stanchits, S., et al., Comparison of acoustic emission events and micromechanics of granite under Mode I and
Mode II loading., in EUROConference on Rock Physics and Geomechanics - Micromechanics, Flow and
Chemical Reactions, A. Makurat and P. Curri, Editors. 2003: Delft, The Netherlands.
20. Lim, I.L., I.W. Johnston, and S.K. Choi, Stress Intensity Factors for Semicircular Specimens under 3-Point
Bending. Engineering Fracture Mechanics, 1993. 44(3): p. 363-382.
21. Rice, J.R., A PATH INDEPENDENT INTEGRAL AND THE APPROXIMATE ANALYSIS OF STRAIN
CONCENTRATION BY NOTCHES AND CRACKS. Journal of Applied Mechanics-Transactions of the Asme,
1968.
22. Hakami, H., Post-failure behaviour of brittle rock., in Division of Rock Mechanics. 1988, Lulea University of
Technology, Sweden.
23. Backers, T., et al., Fractography of rock from the new Punch-Through Shear Test, in Structural Integrity and
Fracture – The International Conference on Structural Integrity and Fracture, A.V. Dyskin, X. Hu, and E.
Sahouryeh, Editors. 2002: Perth, Australia.
24. Jumikis, A.R., Rock Mechanics. 1979. p. 216-219.
page (12) of (18)
25. Yoon, J. and S. Jeon, An experimental study on Mode II fracture toughness determination of rock. Journal of
Korean Society for Rock Mechanics, 2003. 13(1): p. 64-75.
26. Watkins, J., Fracture toughness test for soll-cement samples in mode II. International Journal of Fracture, 1983.
23(4): p. R135-R138.
27. Meier, T., T. Backers, and O. Stephansson, The influence of temperature on Mode II fracture toughness using
the Punch-Through Shear with Confining Pressure experiment, in ROCKENG09: Proceedings of the 3rd
CANUS Rock Mechanics Symposium, M. Diederichs and G. Grasselli, Editors. 2009: Toronto, Canada.
28. Backers, T., J. Antikainen, and M. Rinne. Time dependent fracture growth in intact crystalline rock: laboratory
procedures and results. in GeoProc2006 - 2nd International Conference on Coupled T-H-M-C Processes in
Geosystems: Fundamentals, Modelling, Experiments, Applications. 2006. Nanjing, China.
29. Wilkins, B.J.S., The long-term strength of plutonic rock. International Journal of Rock Mechanics and Mining
Science & Geomechanics Abstracts, 1987. 24(6): p. 379-380.
30. Wilkins, B.J.S., Slow crack growth and delayed failure of granite. International Journal of Rock Mechanics and
Mining Science & Geomechanics Abstracts, 1980. 17(6): p. 365-369.
Figures and Table
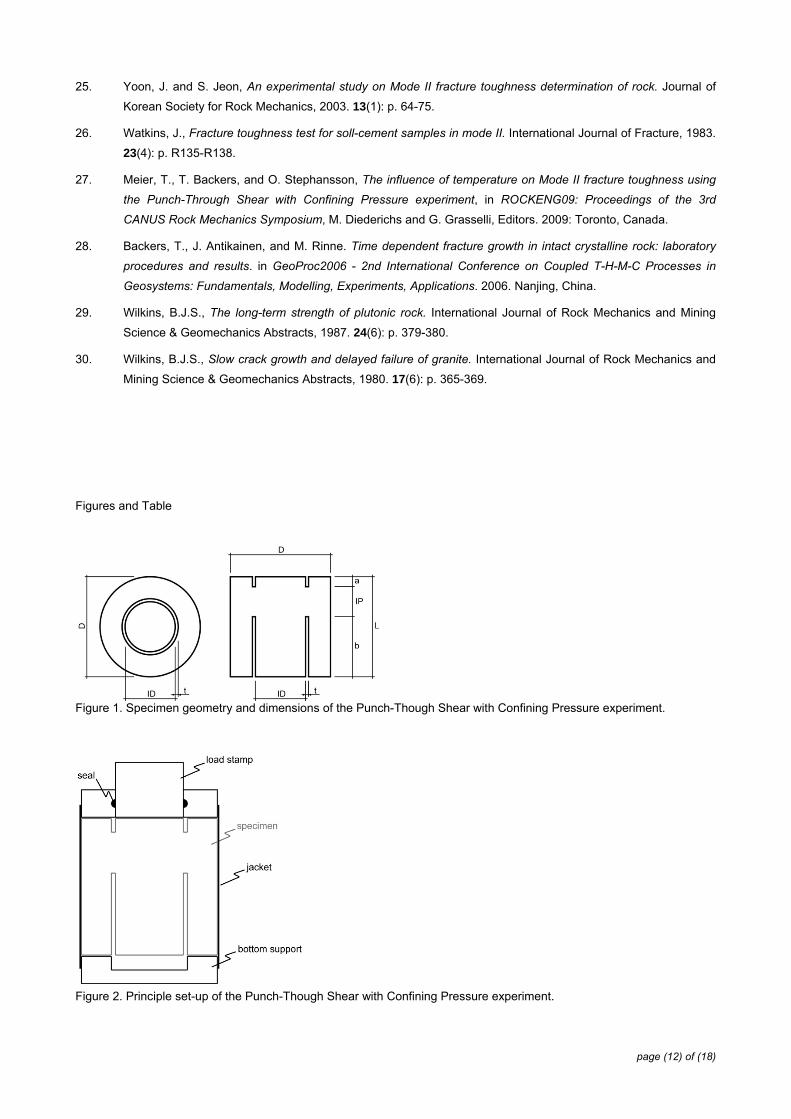
Figure 1. Specimen geometry and dimensions of the Punch-Though Shear with Confining Pressure experiment.
Figure 2. Principle set-up of the Punch-Though Shear with Confining Pressure experiment.

page (13) of (18)
Figure 3. Loading scheme and response of the Punch- Through Shear with Confining Pressure PTS/CP experiment.
Figure 4. Displacement Extrapolation Technique. The displacements for the calculation of Ki
II were determined by 2D
FEM using the standard PTS/CP geometry. (top left) From a KiII vs. ri plot the curve is extrapolated to the Ki
II axis
providing a linear correlation between axial stress σA and axis intercept K*iII (top right). (bottom) The same procedure
provides a correlation between confining pressure P and KiII).

page (14) of (18)
Figure 5. Influence of confining pressure, PC, on and τav
3, τ = Fmax (π·ID·IP)-1, for different rock types. (Recalculated data
after [11, 12]).
3 The shear stress is not an interpreted value and therefore presented here. KIIC and τav are linked by a factor only and
hence the trends are the same.

page (15) of (18)
Figure 6. Shear stress on notch plane at fracture initiation vs. displacement rate at constant confining pressure of 5 MPa
for a selection of rock types (The shear stress at fracture initiation is normalised with the shear stress at 0.2 mm/min.
(top) Carrara marble; (middle) Flechtingen sandstone; (bottom) Ruedersdorf limestone).
Figure 7. Shear stress on notch plane at fracture initiation vs. intact rock portion IP (The average shear stress on the
cylindrical plane between the notches remains almost constant for Ruedersdorf limestone and Carrara marble, but
increases for small IP for Aue granite. It is constant between IPs of approximately 10 and 20 mm for the three rock types.
(L=50mm, D=50mm, a≈5mm, Pc=5MPa). (top) Aue granite; (middle) Ruedersdorf limestone; (bottom) Carrara marble.
Recalculated data from [11]).
page (16) of (18)
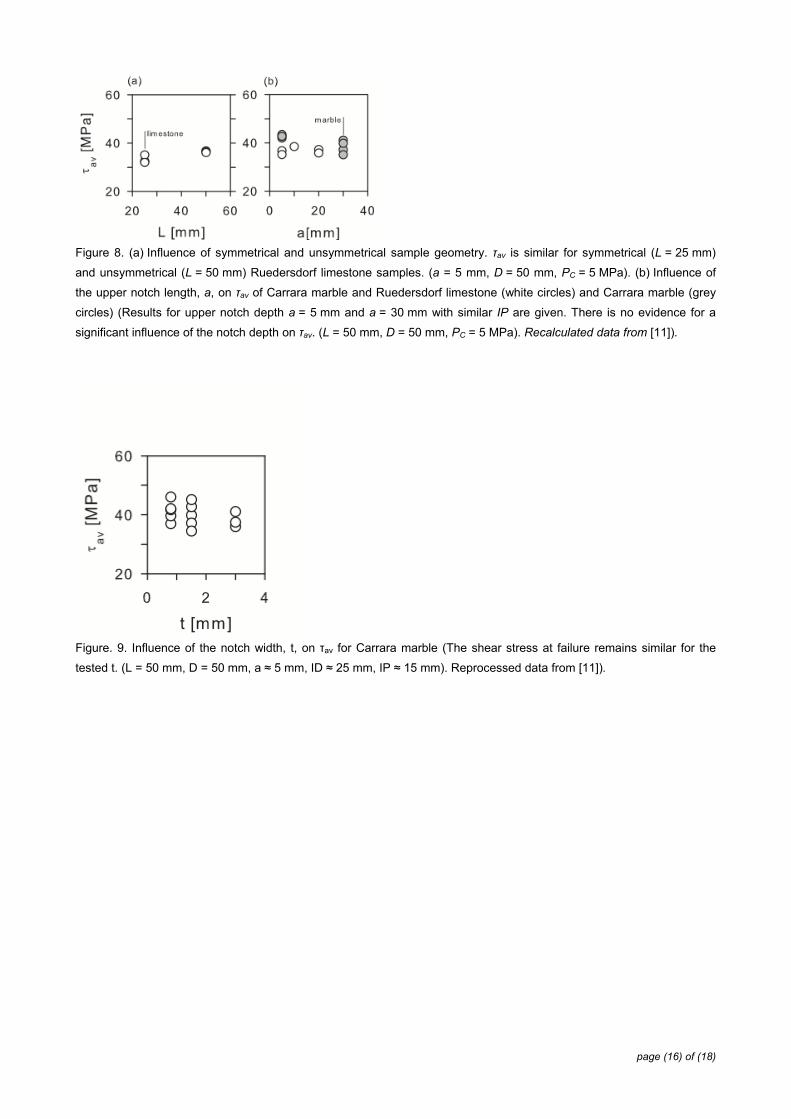
Figure 8. (a) Influence of symmetrical and unsymmetrical sample geometry. τav is similar for symmetrical (L = 25 mm)
and unsymmetrical (L = 50 mm) Ruedersdorf limestone samples. (a = 5 mm, D = 50 mm, PC = 5 MPa). (b) Influence of
the upper notch length, a, on τav of Carrara marble and Ruedersdorf limestone (white circles) and Carrara marble (grey
circles) (Results for upper notch depth a = 5 mm and a = 30 mm with similar IP are given. There is no evidence for a
significant influence of the notch depth on τav. (L = 50 mm, D = 50 mm, PC = 5 MPa). Recalculated data from [11]).
Figure. 9. Influence of the notch width, t, on τav for Carrara marble (The shear stress at failure remains similar for the
tested t. (L = 50 mm, D = 50 mm, a ≈ 5 mm, ID ≈ 25 mm, IP ≈ 15 mm). Reprocessed data from [11]).

page (17) of (18)
Figure 10. Fracture evolution in the PTS/CP experiment. (top) fracture evolution for PC = 0.1 MPa (left side of individual
sketch) and PC > 30 MPa (right side of individual sketch). (The axial force vs. displacement data is given at the (bottom)
and displays the position of the top drawings in the loading path. (a) 30% of peak load, (b) 60% of peak load, (c) peak
load).
Figure 11. τav at different temperatures at ambient pressure conditions (PC = 0.1MPa) for a Korean granite.
Table 1. Values for Mode I and Mode II fracture toughness of various rocks.
Rock KIC KIIC (low P) KIIC (high P) KIIC/KIC
Ävrö granite, medium grained Sweden 3.8 4.7 11.5 1.2 | 3.0
Aue granite, corse grained Germany 1.6 4.2 10.5 2.6 | 6.6
Mizunami granite, medium grained Japan 2.4 4.2 10.9 1.5 | 3.8
Seoul granite, finegrained Korea 1.6 4.0 -- 2.5 | --
Carrara marble Italy 2.4 3.1 6.7 1.3 | 2.8
Flechtingen sandstone, finegrained Germany 1.2 2.1 5.3 1.8 | 4.4
Bentheim sandstone, finegrained Germany 0.9 -- -- -- | --
Ruedersdorf limestone, mudstone Germany 1.1 3.1 4.2 2.8 | 3.8

page (18) of (18)