as-built to design comparison case study - wood … · as-built to design comparison case study ......
TRANSCRIPT

AS-BUILT to DESIGN Comparison Case Study
Page 1 of 15
This case study will describe the process in comparing the differences between AS-BUILT and AS-
DEFINED location data of Export pipeline Crossing Supports and Protection Mattresses. This
workflow will demonstrate on how to use the available SD2 PODS GIS tools to view and extract data
for assessment and help make informed decisions about future pipelay work in the area.
A summary outline of the steps is shown below:
1. Moving to the Crossing-Supports
2. Setting up User Bookmarks
3. Altering Layer Visibility
4. Measuring Offsets
5. Accessing PODS AS-BUILT and DESIGN Asset data
6. Results Window
7. Exporting PODS Data to Excel
1. Moving to the Crossing-Supports
On opening the SD2 PODS GIS an overview of the Shah Deniz 2 (SD2) pipeline system is displayed.
The first task is to zoom into the Export Crossings which are found at the coordinate (409,125
Easting, 4,438,540 Northing), and indicated by the red arrow in Figure 1 below.
Fig 1. Project Overview
There are numerous ways of navigating around the SD2 PODS GIS map data, two of which are
outlined below.
AS-BUILT to DESIGN Comparison Case Study
SHAH DENIZ STAGE 2 PROJECT
Page 2 of 15
Zoom using the mouse
One of the simplest ways is by using the mouse.
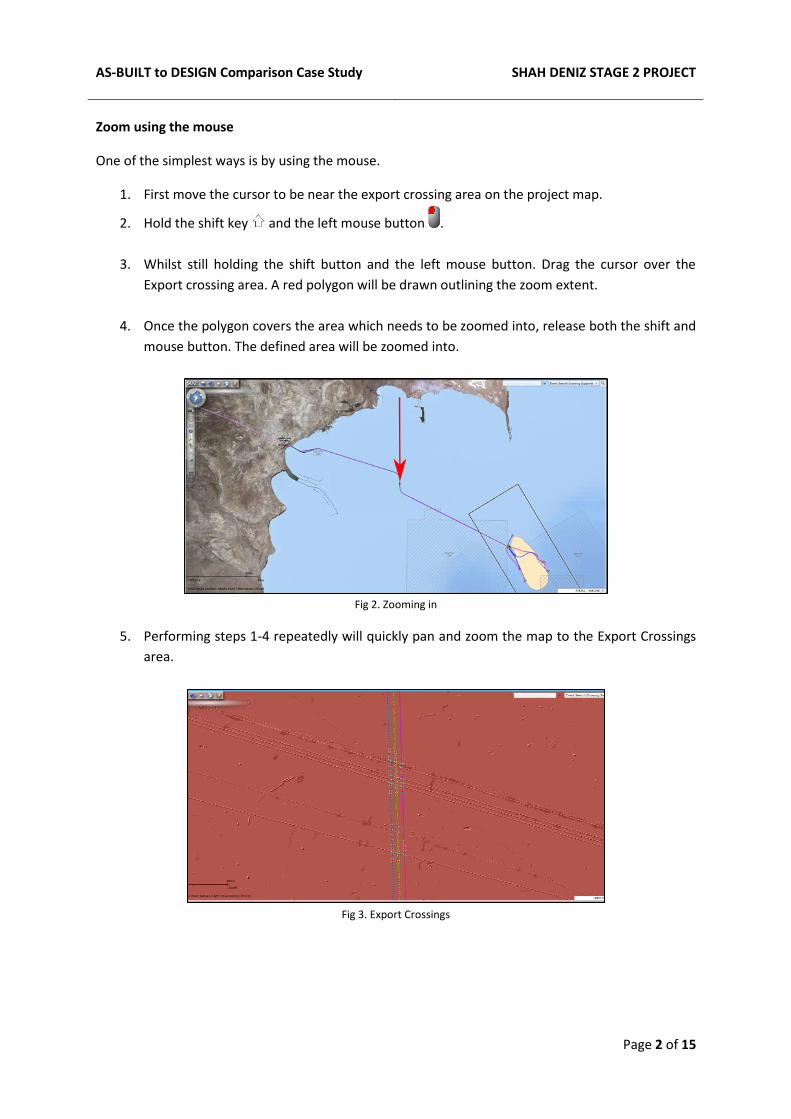
1. First move the cursor to be near the export crossing area on the project map.
2. Hold the shift key and the left mouse button .
3. Whilst still holding the shift button and the left mouse button. Drag the cursor over the
Export crossing area. A red polygon will be drawn outlining the zoom extent.
4. Once the polygon covers the area which needs to be zoomed into, release both the shift and
mouse button. The defined area will be zoomed into.
Fig 2. Zooming in
5. Performing steps 1-4 repeatedly will quickly pan and zoom the map to the Export Crossings
area.
Fig 3. Export Crossings

AS-BUILT to DESIGN Comparison Case Study
SHAH DENIZ STAGE 2 PROJECT
Page 3 of 15
Zoom to Coordinates
Alternatively, if the coordinates of the area are known,
the Zoom to Coordinates tool can be used.
1. Click on the Zoom to Coordinates button on the
toolbar. This will open the zoom to Coordinates
window.
2. Make sure ‘Pulkovo 1942 / Gauss-Kruger 9N’ is selected as the coordinate type.
3. Enter Easting ‘409125’ and Northing ‘4438540’.
4. Click ‘Zoom to Coordinates’. The map will pan
and zoom to the Export Crossing Area.
Fig 5. Export Crossings
2. Setting up User Bookmarks
Bookmarks allow users to quickly return to frequently visited areas of the map. It may be useful to bookmark this location for quick access in future. The following steps explain how to do this.
1. Ensure the map is zoomed to location of interest
2. Click the left toolbar Bookmark button to view the bookmarks window. The Global tab
for pre-defined bookmarks is shown by default.
Fig 4. Zoom to Coordinates

AS-BUILT to DESIGN Comparison Case Study
SHAH DENIZ STAGE 2 PROJECT
Page 4 of 15
Fig 6. Bookmark Window
3. Click on the ‘User’ tab at the bottom of the window to define a new user bookmark
Fig 7. User Bookmarks
4. Click the ‘New…’ button at the bottom of the Bookmark window to enter the name
of the new bookmark.
Fig 8. Creating new bookmark

AS-BUILT to DESIGN Comparison Case Study
SHAH DENIZ STAGE 2 PROJECT
Page 5 of 15
5. Click ‘OK’ button to save the bookmark. This bookmark will now appear in the list of User
Bookmarks.
Fig 9. New Bookmark
6. Test the saved bookmark by either double clicking the bookmark name or selecting it and
clicking the ‘Go to’ button. The map should zoom to the area defined by the
bookmark.
7. Close the bookmark window by clicking the cross at the top right of the window.
3. Altering Layer Visibility
By default the AS-BUILT positions are displayed on top of the DESIGN locations and thus can make it
hard to compare. But there are several ways to make a visual comparison easier.
Adjusting the AS-BUILT layer transparency
1. Open the layer viewer by clicking the left hand toolbar ‘Display Map Layers’ button . to
open the Layers window.
Fig 10. Layers window

AS-BUILT to DESIGN Comparison Case Study
SHAH DENIZ STAGE 2 PROJECT
Page 6 of 15
A transparency “slider” tool is available against each of the top level branch names
(Construction, Design and Background). This alters the transparency ratio for the selected top
level branch and all sub level layers.
2. Click on the Slider next to the Construction header and move it to the left to increase the
transparency of the AS-BUILT layers.
Fig 11. Setting Layer Transparency
This will allow the DESIGN positions of the Crossing Supports to be compared with the slightly
transparent AS-BUILT positions above them.
Fig 12. Transparency Comparison
Changing the layers being displayed
By default the detailed view for AS-BUILT structures is displayed. Users can alter this so only a hollow outline of the AS-BUILT structure is shown, enabling easy comparison between the two. To do this the Construction – Subsea Structures - Structure Outlines layer must be turned off.
1. Open the layer viewer by clicking the left hand toolbar ‘Display Map Layers’ button to open the Layers window.

AS-BUILT to DESIGN Comparison Case Study
SHAH DENIZ STAGE 2 PROJECT
Page 7 of 15
Fig 13. Layers window
2. The AS-BUILT outlines are held within the Construction layers. The Construction layers menu
can be expanded by clicking the small arrow to the left of ‘Construction’.
Fig 14. Construction Expanded
3. Expand the ‘Subsea Structures’ menu in the same way as outlined in Step 2.
Fig 15. Subsea Structure Expanded
AS-BUILT to DESIGN Comparison Case Study
SHAH DENIZ STAGE 2 PROJECT
Page 8 of 15
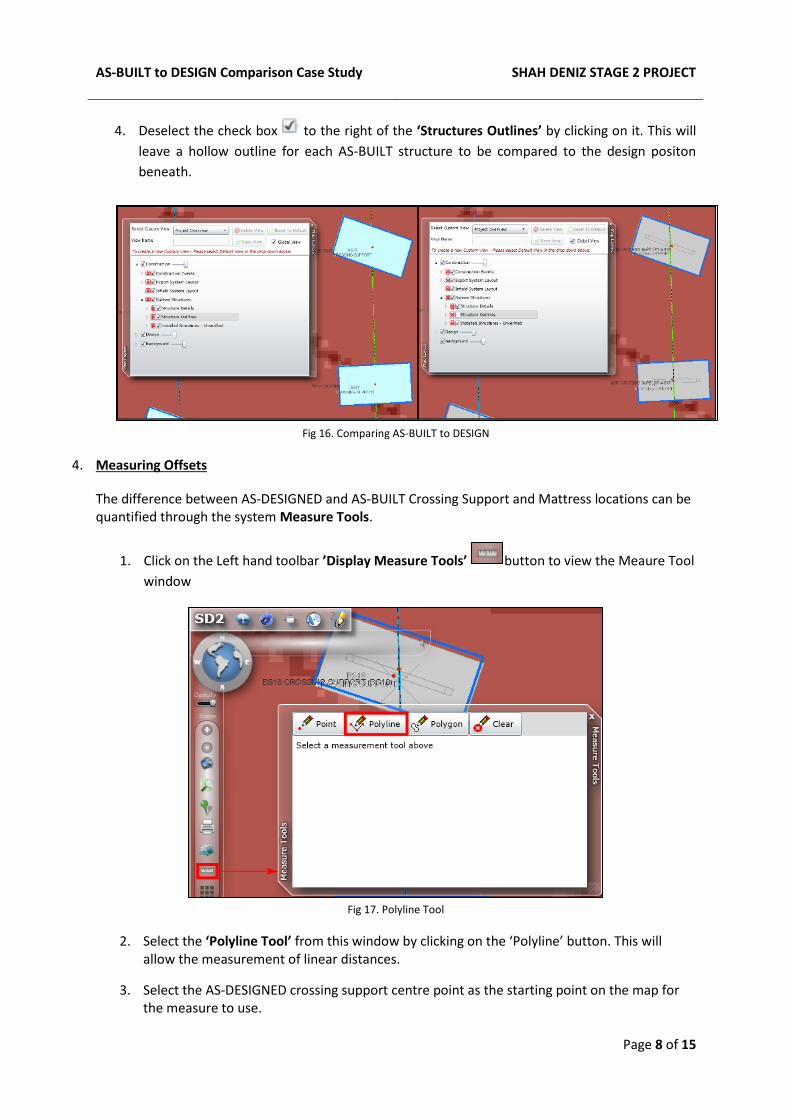
4. Deselect the check box to the right of the ‘Structures Outlines’ by clicking on it. This will
leave a hollow outline for each AS-BUILT structure to be compared to the design positon
beneath.
Fig 16. Comparing AS-BUILT to DESIGN
4. Measuring Offsets
The difference between AS-DESIGNED and AS-BUILT Crossing Support and Mattress locations can be quantified through the system Measure Tools.
1. Click on the Left hand toolbar ’Display Measure Tools’ button to view the Meaure Tool
window
Fig 17. Polyline Tool
2. Select the ‘Polyline Tool’ from this window by clicking on the ‘Polyline’ button. This will allow the measurement of linear distances.
3. Select the AS-DESIGNED crossing support centre point as the starting point on the map for the measure to use.

AS-BUILT to DESIGN Comparison Case Study
SHAH DENIZ STAGE 2 PROJECT
Page 9 of 15
Fig 18. Measuring
Select other coordinates to define a measure path if necessary.
4. Complete the measure path by double clicking on the final coordinate which should be the centre point of the AS-BUILT crossing support location.
Fig 19. Complete Measuring
When the end point is placed the black line will change to a red one, as shown in Fig 19 above.
5. The measurement results are shown in the Measure window where the units can be changed
from the default KM to alternative units. This will be dependent on the given length value.

AS-BUILT to DESIGN Comparison Case Study
SHAH DENIZ STAGE 2 PROJECT
Page 10 of 15
Fig 20. Measure Value
6. Once the measurements have been taken click the ‘Clear’ button to remove them from the
map.
5. Accessing PODS AS-BUILT and DESIGN Asset data
The SD2 PODS GIS can be queried to provide key asset information at different phases of a project by using the search tool.
In the case of crossing supports it is possible to assess the significance of the deviation of heading values between AS-DEGINED and AS-BUILT locations. This information coupled with other data including survey and geotechnical will help form a decision on what action may need to be taken.
Map Search
There are different options for searching and these are available through the dropdown list at the top right of screen. The spatial search option which will be used will retrieve results for assets and/or events which occur within a user-selected area.
1. Click on the right dropdown search menu .
Fig 21. Map Search
2. Expand the Map Search menu by clicking the small arrow to the left of ‘Map Search’.
AS-BUILT to DESIGN Comparison Case Study
SHAH DENIZ STAGE 2 PROJECT
Page 11 of 15
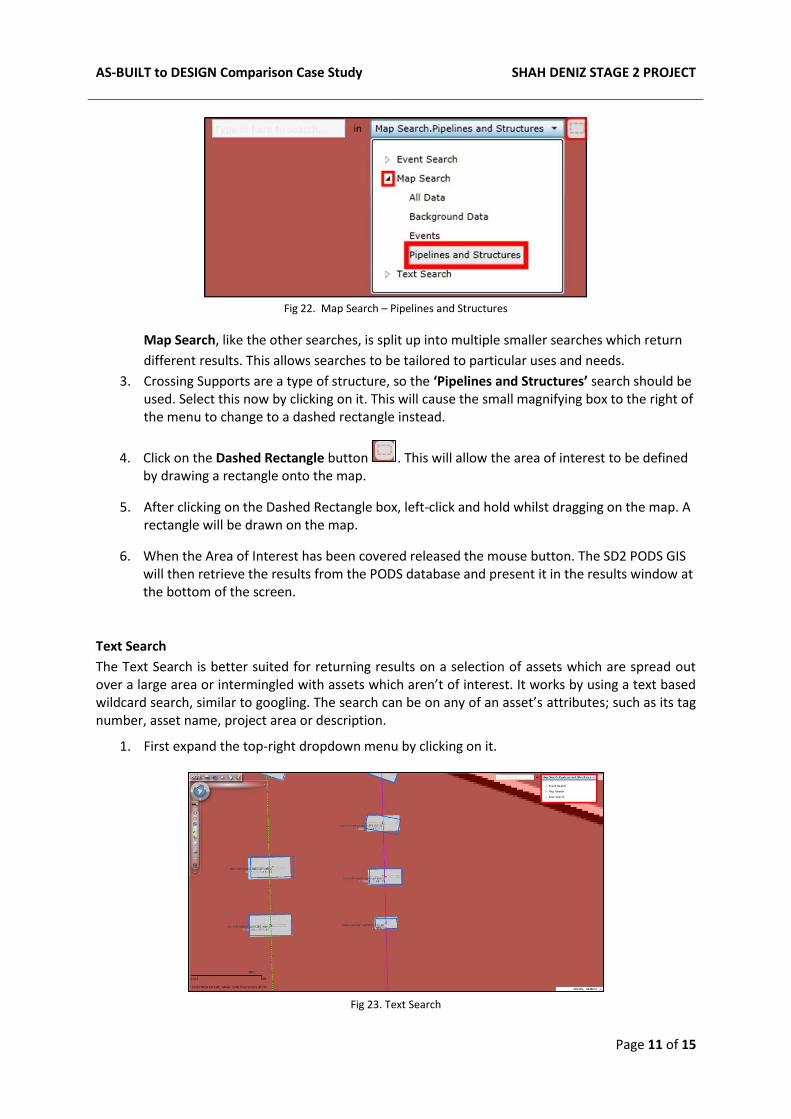
Fig 22. Map Search – Pipelines and Structures
Map Search, like the other searches, is split up into multiple smaller searches which return
different results. This allows searches to be tailored to particular uses and needs.
3. Crossing Supports are a type of structure, so the ‘Pipelines and Structures’ search should be used. Select this now by clicking on it. This will cause the small magnifying box to the right of the menu to change to a dashed rectangle instead.
4. Click on the Dashed Rectangle button . This will allow the area of interest to be defined by drawing a rectangle onto the map.
5. After clicking on the Dashed Rectangle box, left-click and hold whilst dragging on the map. A rectangle will be drawn on the map.
6. When the Area of Interest has been covered released the mouse button. The SD2 PODS GIS will then retrieve the results from the PODS database and present it in the results window at the bottom of the screen.
Text Search
The Text Search is better suited for returning results on a selection of assets which are spread out over a large area or intermingled with assets which aren’t of interest. It works by using a text based wildcard search, similar to googling. The search can be on any of an asset’s attributes; such as its tag number, asset name, project area or description.
1. First expand the top-right dropdown menu by clicking on it.
Fig 23. Text Search

AS-BUILT to DESIGN Comparison Case Study
SHAH DENIZ STAGE 2 PROJECT
Page 12 of 15
2. Expand the Text Search menu by clicking the small arrow to the left of ‘Text Search’.
Fig 24. Text Search - Structures
Text Search, like the other searches, is split up into multiple smaller searches which return different results. This allows searches to be tailored to particular uses and needs.
3. Crossing Supports are a type of structure, so the ‘Structures’ search should be used. Select this now by clicking on it. When selected, ‘Structures’ will be highlighted in a light grey.
4. Click in the Search box to the left of the Search dropdown menu and enter ‘CS’. This will
return all the crossing supports located along the 16” Condensate Export line as it is the first
two letters of their names and tag numbers.
Fig 25. Text Search – Search Value
5. Left click the Magnifier Button to the right of the Search drop down menu to perform
the search.
6. The results of the search will be displayed in the Result window which will appear at the
bottom of the screen.
6. Results Window
The searches in the SD2 PODS GIS will display query results in the Results Panel at the bottom of the screen. Depending on the search performed a large amount of data can be retrieved. The Results window has several functions which can help organise and display the data which is required.
Hiding/Showing Columns
By default all the columns which contain data for an Asset will be displayed in the Results window.
However, columns can be hidden or displayed depending on particular preferences and needs.
1. To Hide/Display a column first right click on the Results window headers bar. This will open a
drop down menu.

AS-BUILT to DESIGN Comparison Case Study
SHAH DENIZ STAGE 2 PROJECT
Page 13 of 15
Fig 26. Hide/Display Columns
2. Mouse-over ‘Displayed Columns’ from the menu. A new menu will open.
Fig 27. Column list
3. By checking or unchecking the tick boxes to the right of the listed columns, columns can be hidden or displayed.
Sorting
The results can be sorted by a particular attribute.
1. First left-click on the header of the column to be sorted, such as ‘Asset Name’.
Fig 28. Column sorting
2. The first click will sort the records by smallest to largest whilst the second click will sort them
largest to smallest. A small arrow will appear in the header ( / ) denoting which way the
column is being sorted by.

AS-BUILT to DESIGN Comparison Case Study
SHAH DENIZ STAGE 2 PROJECT
Page 14 of 15
Fig 29. Column sorting - Ascending
By sorting the results in either Ascending or Descending fashion the AS-BUILT and DESIGN
records will be found next to each other, allowing easy comparison of DESGIN to AS-BUILT
headings.
7. Exporting PODS Data to Excel
As well as viewing the PODS data within the SD2 PODS GIS it can also be exported as an Excel XML file which can be opened in MS Excel to allow further analysis and formatting.
1. Select the records to be exported by left-clicking on them. To select multiple records first
select one record, then whilst holding shift key select another record. This will select both
of the records along with all the records between them.
Fig 30. Highlighting Records
Alternatively, select the records individually whilst holding Ctrl key to add them to the
current selection, when selected a record will be highlighted light-blue.
2. With the records selected right click on them. This will display a drop down menu.
Fig 31. Exporting Records
3. From the menu select ‘Export . . . to Excel’. A browser window will open.
4. Select a save location and give the file a name. Click Save.

AS-BUILT to DESIGN Comparison Case Study
SHAH DENIZ STAGE 2 PROJECT
Page 15 of 15
Fig 32. Exported Records
5. Navigate to where the file was saved and double-click, the file will automatically open in MS
Excel unless otherwise set by the user.