arvind limited - new.arvind.comnew.arvind.com/sites/default/files/field_quarterly_reports_file/...4...
TRANSCRIPT
04 August 2016 | Ahmedabad
Arvind LimitedQ1 Performance Review Note
2
Contents
• Q1 FY 2017 performance
• Business analysis

3
In line with the IndAS, business segments have been redefined
Earlier Reporting Segments New Segments
1. Textiles
– Fabrics
– Garments
2. Brands & Retail
– Branded garments
– Specialty retail
– Fabric retail (The Arvind Stores)
3. Others
– Technical textiles
– Agricultural produce
– EPABX and One to Many radio
– Engineering
– Water treatment
– Creyate
– Internet
– Others (incl. newly commenced businesses)
1. Textiles
– Fabrics
– Garments
– Fabric retail (The Arvind Stores)
2. Branded Apparel
– Branded garments
– Specialty retail
3. Arvind Internet
– Internet
– Creyate
– Online private label business
4. Others
– Technical textiles
– Agricultural produce
– EPABX and One to Many radio
– Engineering
– Water treatment
– Others (incl. newly commenced businesses)Re-categorized | new/renamed

4
Key differences between IGAAP & IndAS for Arvind
1. Revenue, Expenses, EBIDTA and PBT of Joint Venture Companies where Arvind has joint control will now not get added to those of other businesses/companies. Only PAT will be added in consolidated PAT of the Company
– Arvind Tommy Hilfiger, Premium Wholesale Garments (CK), Arya Omnitalk (one to many radio and GPS business) and Smart Value (JV with Tata for township development) are the four businesses where Arvind does not have controlling interest.
– In view of this, revenue and EBIDTA figures Arvind Tommy Hilfiger which were hitherto were being shown as part of Power Brands will no longer be included. Power Brands figures given in this document and future similar documents will contain figures of USPA, FM & Arrow.
2. Sales made on Sale or Return basis where dealers had a right to return unsold inventory have been reversed to the extent of unsold inventory at the end of the period. Similarly, margin on such sales has been reduced from the EBIDTA. Revenue now will be based on goods actually sold to the customers.

5
2,104
1,787
500
1,000
1,500
2,000
2,500
Rev, Rs Cr
18%
Q1 16’17Q1 15’16
241208
0
100
200
30016%
Q1 16’17
EBITDA, Rs Cr
Q1 15’16
7458
0
50
100
Q1 15’16
PAT*, Rs Cr
27%
Q1 16’17
Q1 2016-17: A Strong Quarter
Robust revenue growth …….. And profitability
*PAT before exceptional items

6
Q1 FY2017 Result Highlights : Robust growth in Revenues and Margins
Key highlights
Revenue growth of 18%• 26% growth in Branded Apparels• 14% growth in Textiles
Weighted EBIDTA margin almost flat• business mix change in favour of
Branded Apparels
• Other Comprehensive Income mainly includes MTM gain/losses on financial assets
All Figures in INR Crs Q1 FY17 Q1 FY16 Change
Revenue from Operations 2,104 1,787 18%
Raw Materials 975 748
Project Expenses 3 1
Employees' Emoluments 266 217
Others 696 595
Stock (Increase) / Decrease -74 16
Forex (Gain) / Loss -3 2
EBIDTA 241 208 16%
Margin 11.5% 11.6%
Other Income 20 27
Interest & Finance Cost 89 96
Cash Accruals 172 139 24%
Depreciation 69 59
Profit Before Taxes 103 80 28%
Tax 32 23
Minority Interest 0 -2
Share of Profit / Loss in JV 2 0
Profit After Tax 74 58 27%
Less : Exceptional Item 0 3
Net Profit 73 55 33%
Other Comprehensive Income (net of tax) 40 5
Total Comprehensive Income after Tax 113 60
7
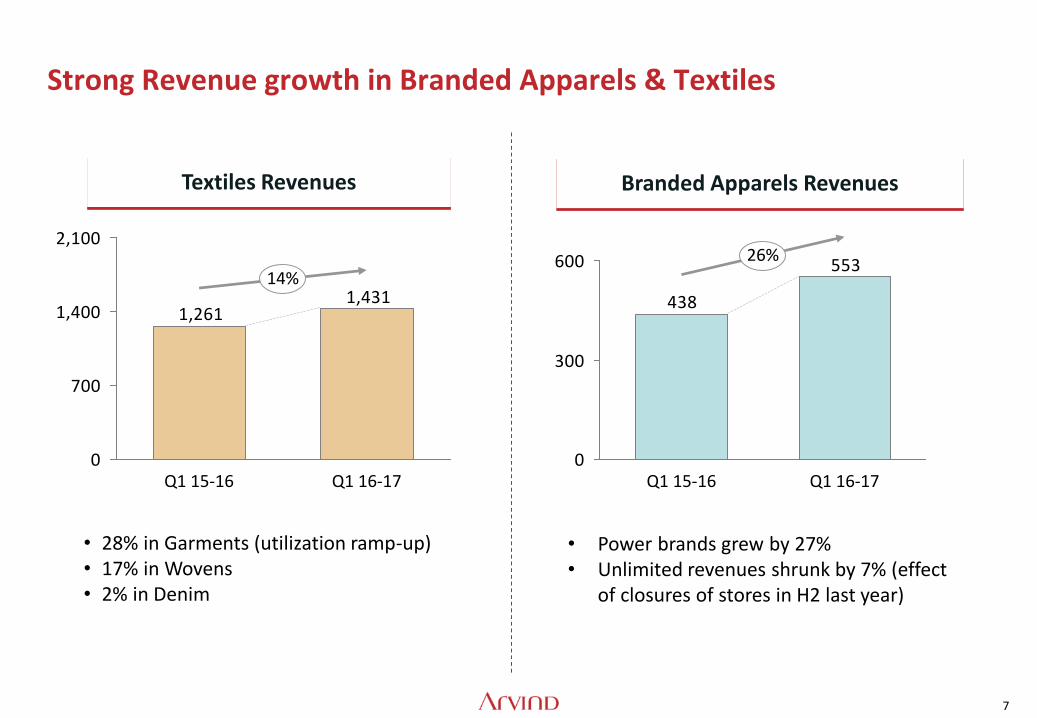
Strong Revenue growth in Branded Apparels & Textiles
Textiles Revenues Branded Apparels Revenues
1,4311,261
0
700
1,400
2,100
14%
Q1 16-17Q1 15-16
553
438
0
300
600
Q1 15-16
26%
Q1 16-17
• 28% in Garments (utilization ramp-up)• 17% in Wovens• 2% in Denim
• Power brands grew by 27%• Unlimited revenues shrunk by 7% (effect
of closures of stores in H2 last year)
8
10
15
20
16.2%
EBITDA %
Q1 16-17
17.8%
Q1 15-16
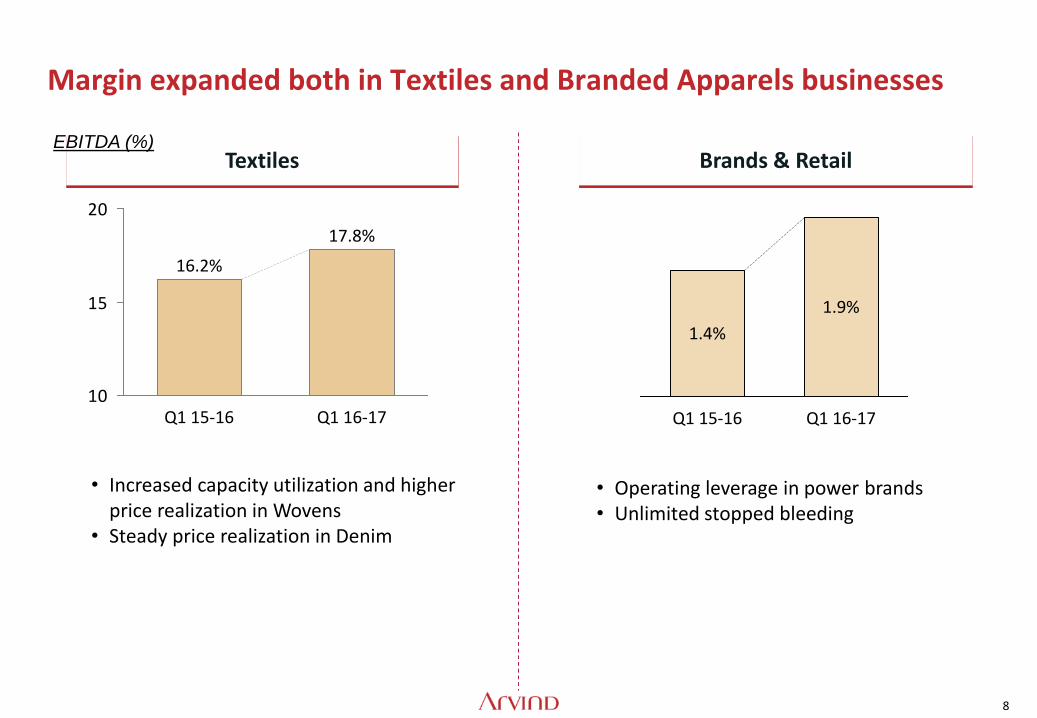
Margin expanded both in Textiles and Branded Apparels businesses
Textiles Brands & Retail
• Increased capacity utilization and higher price realization in Wovens
• Steady price realization in Denim
• Operating leverage in power brands• Unlimited stopped bleeding
EBITDA (%)
Q1 15-16 Q1 16-17
1.9%
1.4%

9
Key financial ratios showed clear improvement
EPS
2.8
2.3
Q1 16-17Q1 15-16
Debt / Equity
1.31.5
Q1 15-16 Q1 16-17
Debt / EBIDTA
3.53.9
Q1 15-16 Q1 16-17
11.5%
Q1 16-17Q1 15-16
11.9%
ROCE
Q1 15-16
10.5%
Q1 16-17
9.5%
ROE
10
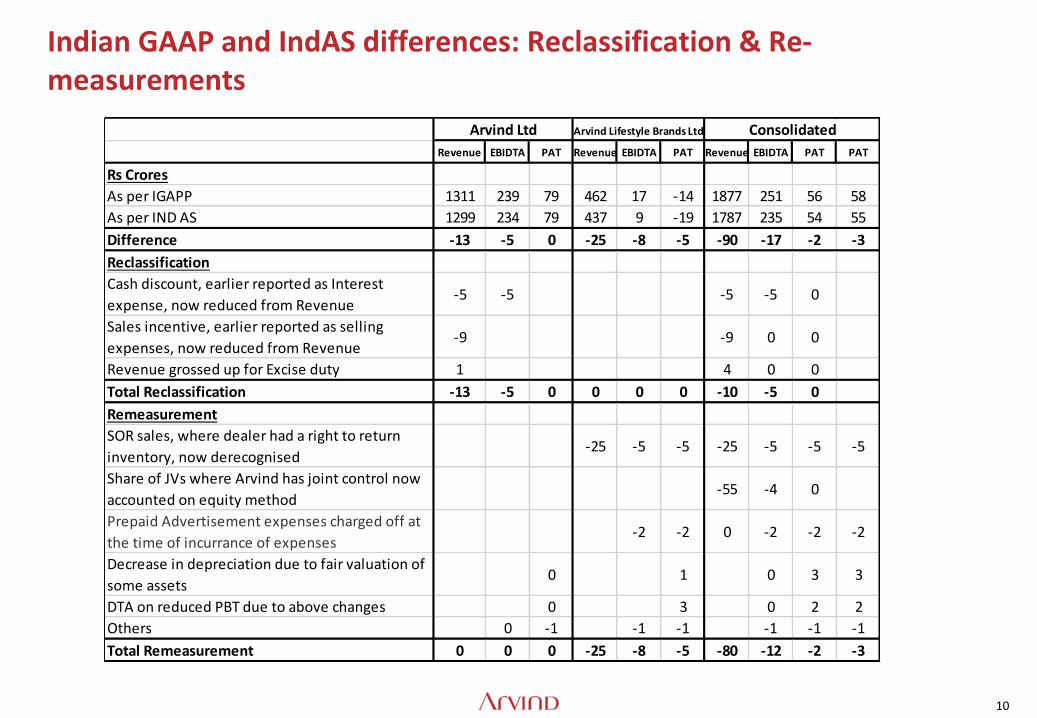
Indian GAAP and IndAS differences: Reclassification & Re-measurements
Revenue EBIDTA PAT Revenue EBIDTA PAT Revenue EBIDTA PAT PAT
Rs Crores
As per IGAPP 1311 239 79 462 17 -14 1877 251 56 58
As per IND AS 1299 234 79 437 9 -19 1787 235 54 55
Difference -13 -5 0 -25 -8 -5 -90 -17 -2 -3
Reclassification
Cash discount, earlier reported as Interest
expense, now reduced from Revenue-5 -5 -5 -5 0
Sales incentive, earlier reported as selling
expenses, now reduced from Revenue-9 -9 0 0
Revenue grossed up for Excise duty 1 4 0 0
Total Reclassification -13 -5 0 0 0 0 -10 -5 0
Remeasurement
SOR sales, where dealer had a right to return
inventory, now derecognised-25 -5 -5 -25 -5 -5 -5
Share of JVs where Arvind has joint control now
accounted on equity method-55 -4 0
Prepaid Advertisement expenses charged off at
the time of incurrance of expenses-2 -2 0 -2 -2 -2
Decrease in depreciation due to fair valuation of
some assets0 1 0 3 3
DTA on reduced PBT due to above changes 0 3 0 2 2
Others 0 -1 -1 -1 -1 -1 -1
Total Remeasurement 0 0 0 -25 -8 -5 -80 -12 -2 -3
Arvind Ltd Arvind Lifestyle Brands Ltd Consolidated

11
Arvind Limited –Stanalone Financial Performance Q1 16’17
All Figures in INR Crs Q1 FY17 Q1 FY16 Change
Revenue from Operations 1,466 1,299 13%
Raw Materials 589 535
Project Expenses 3 1
Employees' Emoluments 187 156
Others 458 410
(Increase) / Decrease in Stock 13 -9
Foreign Exchange Loss /(Gain) -3 1
EBIDTA 218 204 7%
Margin 14.9% 15.7%
Other Income 24 30
Interest & Finance Cost 71 80
Cash Accruals 171 154 11%
Depreciation 44 37
Profit Before Taxes 128 117 9%
Tax 40 36
Profit After Tax 88 81 8%
Less : Exceptional Item 0 3
Net Profit 87 79 11%
Other Comprehensive Income (net of tax) 33 4.1
Total Comprehensive Income after Tax 121 83
12
Contents
• Q1 FY 2017 performance
• Business analysis

13
Textile revenue grew by 14%
Textiles Business: Revenues stable in denim, 17% grew in wovens, 28% growth in garments
486 497
470551
-77-81
251
197
99
88
-200
0
200
400
600
800
1,000
1,200
1,400
1,600
27
14%
Rev, Rs Cr
Knock Off
Denim
38
Q1 15-16
1,261
Wovens
Garments
Voiles
Q1 16-17
Fabric Retail1,431
74
73 Knits
• Led by 28% growth in Garments
• 17% growth in Wovens
• 2% growth in Denim
• 13% growth in Voiles
-2%
13%
28%
17%
2%
Rev. Growth %

14
Wovens volumes grew by 15%; Denim by 2%
31.527.4
0
10
20
30
40
Q1 16’17
15%
Q1 15’16
Volume, Mn Mtrs
27.026.4
0
5
10
15
20
25
30
Q1 16’17Q1 15’16
+2%Volume, Mn Mtrs
DenimWovens (Shirting & Khaki)
15
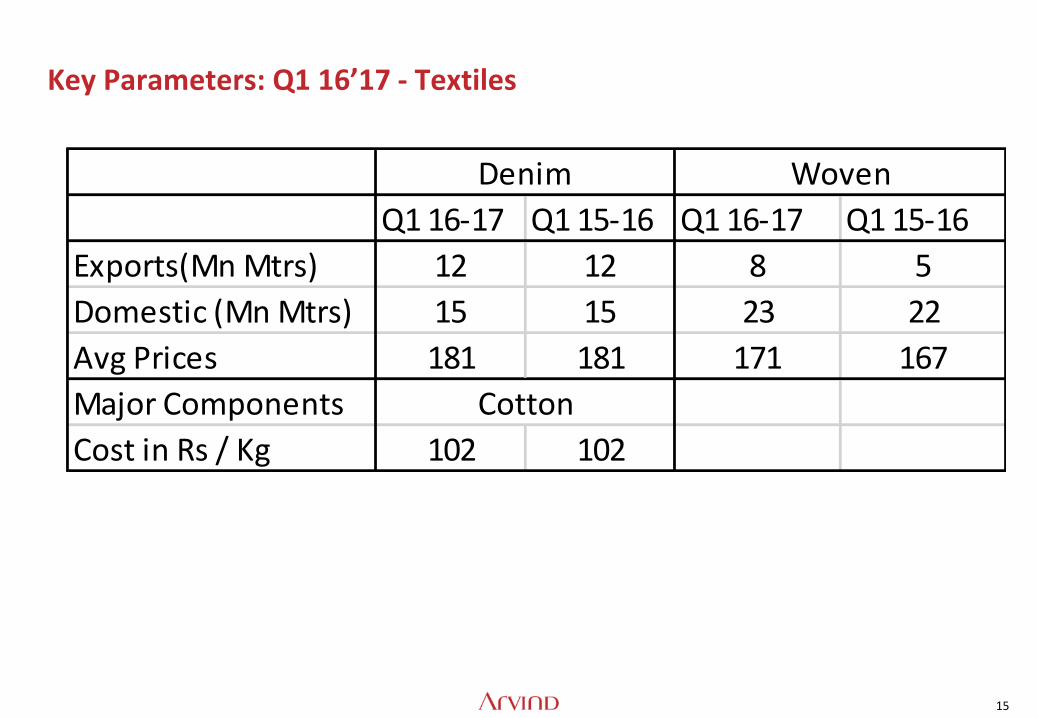
Key Parameters: Q1 16’17 - Textiles
Q1 16-17 Q1 15-16 Q1 16-17 Q1 15-16
Exports(Mn Mtrs) 12 12 8 5
Domestic (Mn Mtrs) 15 15 23 22
Avg Prices 181 181 171 167
Major Components
Cost in Rs / Kg 102 102
Denim Woven
Cotton
16
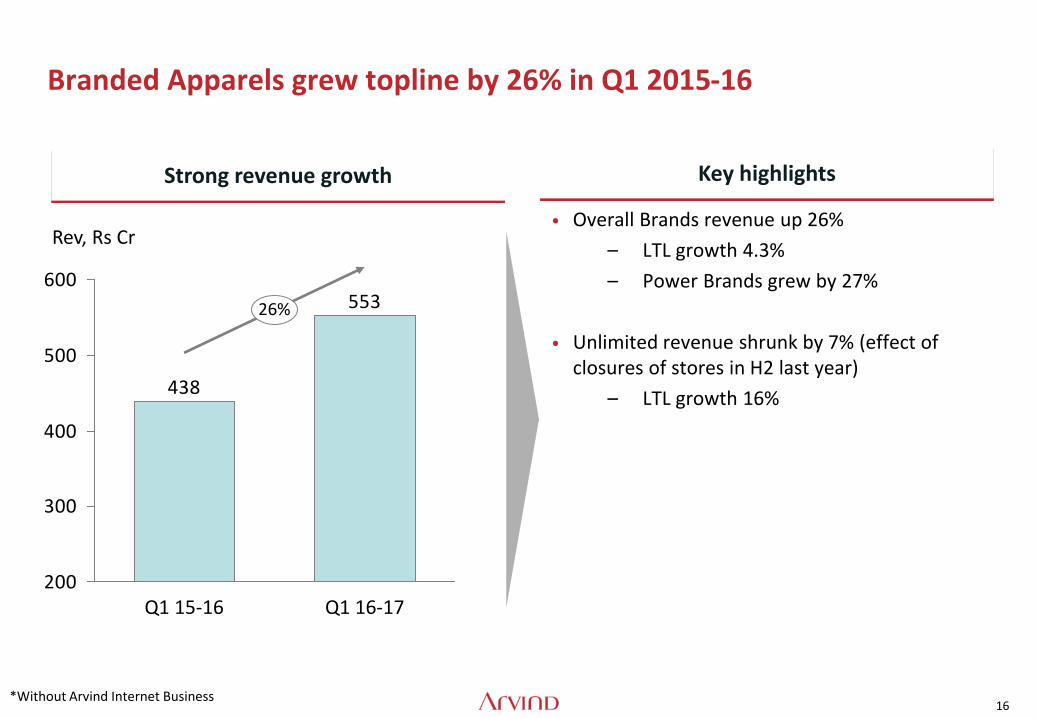
Branded Apparels grew topline by 26% in Q1 2015-16
553
438
200
300
400
500
600
Rev, Rs Cr
26%
Q1 16-17Q1 15-16
Strong revenue growth Key highlights
• Overall Brands revenue up 26%
– LTL growth 4.3%
– Power Brands grew by 27%
• Unlimited revenue shrunk by 7% (effect of closures of stores in H2 last year)
– LTL growth 16%
*Without Arvind Internet Business

17
Power Brands delivered strong Revenue growth and EBITDA margins
23
30
0
20
40
0
5
10
EBITDA %EBITDA Rs Cr
Q1 16’17
10.0%
Q1 15’16
9.6%
300
237
0
150
300
450
Revenues Rs Cr
+27%
Q1 16’17Q1 15’16
Power brands
Revenue Rs CrEBITDA Rs CrEBITDA %

18
Branded Apparels business – Distribution
Particulars Stores Sq Ft Stores Sq Ft Stores Sq Ft
Unlimited 126 779,268 92 719,526 91 686,641
Others 726 630,421 857 828,647 898 889,683
Total 852 1,409,689 949 1,548,173 989 1,576,324
Q1 2015-16 Q4 2015-16 Q1 2016-17
• Sales Growth with Key Account Counters – 23.3%
19
Arvind Internet Limited – highlights
• NNNow.com launched in May 2016, scaling up quickly
– Monthly revenue run-rate crossed Rs 2 cr mark in July
– 200+ stores digitized; plan to onboard 100 stores per month on the Omni platform
• Unit economics for both internet and store businesses better than expected
• ATL marketing including online advertising initiated
• Discussions with several 3rd party brands to join the platform in advanced stages
20
Outlook
• Revenue Growth likely to be between 15-16% primarily driven by volume growth in brands & retail business and Garments manufacturing :
– Revenue Growth in Textiles 8-9%
– Revenue Growth in Brands & Retail at about 24%
• Weighted Margins likely to be marginally lower due to mix change in favour of Brand & Retail business
– B & R Margin likely to increase by 0.75-1%
Thank You!