arunachal pradesh-sdr-initial pages
TRANSCRIPT


The Core Committee
ARUN
ACH
AL PR
ADESH
Constitution of the Core Committee for preparation of State Development Report,
Arunachal Pradesh (2003)
1 Dr. S.P. Gupta Chairman
Member, Planning Commission
2 Shri Lalit Sharma Member
Chief Secretary, Government of Arunachal Pradesh
3 Smt. Adarsh Mishra Member
Secretary, Department of Development of North Eastern Region
4 Representatives of Partner Institute Member
5 Mrs. Reva Nayyar Member Secretary
Adviser(NE), Planning Commission
Chairmen and Members of the Core Committee underwent change over a period of
time as per the following details:
Chairmen
1 Shri B.N. Yugandhar Chairman
Member, Planning Commission
2 Shri B.K. Chaturvedi Chairman (present)
Member, Planning Commission

Members:
1 Smt. Suman Swaroop Member Secretary
Pr. Adviser (NE), Planning Commission
2 Shri A.N.P. Sinha Member Secretary
Pr. Adviser (NE), Planning Commission
3 Smt. Jayati Chandra Member Secretary
Pr. Adviser (NE), Planning Commission (present)
4 Shri Lakshmi Chand Member
Secretary, Ministry of Development of North Eastern Region
5 Smt. Gauri Chatterjee Member
Secretary, Ministry of Development of North Eastern Region
6 Smt. Sushma Singh Member
Secretary, Ministry of Development of North Eastern Region
7 Smt. Veena Sreeram Rao Member
Secretary, Ministry of Development of North Eastern Region
8 Shri Jarnail Singh Member (present)
Secretary, Ministry of Development of North Eastern Region
9 Shri Ashok Kumar Member
Chief Secretary, Government of Arunachal Pradesh
10 Shri Tabom Bam Member (present)
Chief Secretary, Government of Arunachal Pradesh

mik/;{k;kstuk vk;ksx
Hkkjr
DEPUTY CHAIRMANPLANNING COMMISSIONINDIA
,e. ,l. vkgyqokfy;k
MONTEK SINGH AHLUWALIA
;k stuk H kou] l aln ekx Z ] ub Z fnYyh & 110001 n w j H k ki % 23096677 ] 23096688 Q SDl % 23096699Yojana Bhawan, Par l iament St reet , New Delh i : 110001 Phones: 23096677, 23096688 Fax : 23096699E-mail : [email protected]
Foreword
India’s growth in the recent years has made it an important player
in the global economy. In terms of the size of the economy,
measured in PPP terms India ranks 4th in the world after the US,
Japan and China. However, in the recent years there is evidence
that the gap between rich and poor states is increasing and there
is a substantial disparity in social indicators between these states.
One of the important initiatives of the Planning Commission
in the Tenth Plan was to sponsor the prepartion of State
Development Reports with much of the work being done by
reputed national level institutes. This exercise was undertaken in
recognition of the fact that economic circumstances and
performance in individual States varied considerably and it was
necessary to examine development challenges for individual
states in light of state specific constraints and circumstances. The
basic idea was to produce quality reference documents on
development profiles of individual States and the possible
strategies for accelerating growth and reducing poverty and
inequality.
The State Development Report for Arunachal Pradesh
reviews its experience and highlights issues critical for the State’s
development in the years ahead. I am sure its publication will
stimulate debate on growth strategies appropriate for Arunachal
Pradesh. I hope the road map indicated in the report will generate
a broader awareness of the range of policies issues facing the
State and will assist the State to move to a higher growth path
and to achieve all round human and economic development.
(Montek Singh Ahluwalia)

ARUNACHAL PRADESHPhone : (O) 0360-2212456
2212173(R) 0360-2214306
Fax : 0360-2212579Delhi : 011-23013915
23012152
DORJEE KHANDU
CHIEF MINISTER
MESSAGE
I am happy to learn that the State Development Report of Arunachal
Pradesh is being published and feel that the publication of this Report
is most opportune and timely.
Arunachal Pradesh, which is a frontier and tribal State, is at
crossroads. It is endowed with plenty of natural resouces, which, if
properly developed can make Arunachal Pradesh a prosperous State.
Prosperity alone cannot make people happy. We need to have
sustainable development based on the principles of equity and justice
and with due regards to environment.
Not too distant in the past, our horizon was our own belief. But
in last few decades our horizon has expanded considerably. While
transition of our tribal society has taken place at a fast pace, I for one,
proudly observe that we have retained our culture and lifestyles and
a bit sad that we have also not been spared by the bane of
materialism introduced to us by modern world. We need to have a
paradigm shift in our development schemes to address this challenge
by incorporating the principles of development enunciated by Pandit
Jawaharlal Nehru, our first Prime Minister, who identified himself so
closely with us, the tribal people.
Of late, the Central Government has addressed the crying need
of improving connectivity to close infrastructure gaps particularly
relating to communication through Prime Minister’s development
package. A number of development schemes are in the pipeline.
Undoubtedly, these schemes on completion will bring socio-economic
development in remote villages. The State Development Report of
Arunachal Pradesh being a comprehensive document that provides an
objective assessment of present socio-economic development

scenario in Arunachal Pradesh will certainly help the State Government
in calibrating its development schemes for their effective
implementation. I am sure, it would also provide us with relevant
information and data to focus on target areas and population for
proper development as also to improve the quality of development
works.
I am happy to note that the State Development Report of
Arunachal Pradesh has been prepared by the Rajiv Gandhi University
in collaboration with the Planning Commission of India. On behalf of
the State Government and, of couse, on my own behalf I would like
to appreciate the efforts of the Research Team headed by Prof. Atul
Sarma, Member, 13th Finance Commission and former Vice-
Chancellor of Rajiv Gandhi University and thank them for bringing out
this much needed Report. I would also like to express my gratitude to
Shri B.K. Chaturvedi, Member, Planning Commission, Smt. Jayati
Chandra, Principal Adviser, Planning Commission and Shri Brahmo
Choudhury, Adviser, Planning Commission, New Delhi for their insights
and valuable guidance. My sincere appreciation also goes to Prof.
K.C. Belliappa, Vice-Chancellor, Dr. S.K. Nayak, Co-ordinator of Rajiv
Gandhi University and all those including the officials of the State
Planning Department, especially Shri Prashant Lokhande, IAS,
Secretary, who have been associated with the task of prepartion of this
excellent Report.
I have no doubt that this State Development Report will immensely
help the State Government in formulating its policy and strategies taking
into consideration the ground realities reflected in the Report to meet
the challenges of development and will serve as a valuable reference
book for the policy makers, planners and research scholars.
I am hopeful, this Report will have a significant role in realising
the mission of my Government “People First”.
(Dorjee Khandu)

lnL;;kstuk vk;ksx
;kstuk Hkou
ubZ fnYyh&110 001Member
PLANNING COMMISSIONYOJANA BHAWAN
NEW DELHI-110 001TEL.: 23096594
e-mail: [email protected]
ch- ds- prqosZnh
B.K. CHATURVEDI
MESSAGE
The Planning Commission initiated the preparation of State
Development Reports (SDR) in coordination with the States
concerned. The objective of the SDR is to provide a quality
reference document on the development profile, to identify critical
development issues of the States concerned. The report prepared
largely by the experts and specialised institutes with the
cooperation of the State Government would be of immense value
to the Centre and State Governments and would assist in the
setting of the agenda for higher and more equitable growth of the
State.
A Core Committee under the Chairpersonship of Dr. S.P.
Gupta, former Member, Planning Commission, was constituted in
October 2003. The Core Committee worked out the modalities for
preparing the State Development Report for Arunachal Pradesh
and decided to assign the job to Rajiv Gandhi University (former
Arunachal University), Itanagar and The Energy and Research
Institute (TERI), New Delhi.
The report has taken into account the social and economic
transitions, structural changes in the State’s economy, level of
human development, fiscal management, critical gaps in the basic
minimum services, poor connectivity, underdeveloped infrastructure,
need for capacity building, potential areas of resource based
development and the role of Government in the development
process while suggesting policy options for the development of the

State. I am confident that the directions and strategies proposed in
the report will go a long way in achieving both a higher growth rate
and improved level of human development indicators.
I would like to record my appreciation of the work done by
Rajiv Gandhi University and The Energy and Research Institute
(TERI) in the preparation of the report. I am thankful to the
Government of Arunachal Pradesh for rendering full cooperation
and support to both the agencies in the prepartion of the report.
The role of the Pr. Adviser (NE) and Adviser (NE) in liaising with
Rajiv Gandhi University, TERI and State Government Departments
is noteworthy. I would like to appreciate the work done by the
officers of the State Plan Division in providing all necessary help to
the Core Committee.
(B.K. Chaturvedi)

AR
UNACHAL PRADESH
Contents
The Core Committee. . . . . . . . . . . . . . . . . . . . . . . . . . . . . . . . . . . . . . . . . . . 5
Foreword by Deputy Chairman, Planning Commission . . . . . . . . . . . . . . . . . 7
Message from Chief Minister, Arunachal Pradesh. . . . . . . . . . . . . . . . . . . . . 9
Message by Member, Planning Commission. . . . . . . . . . . . . . . . . . . . . . . . . 11
List of Tables, Figures and Annexures . . . . . . . . . . . . . . . . . . . . . . . . . . . . 19
Acknowledgements. . . . . . . . . . . . . . . . . . . . . . . . . . . . . . . . . . . . . . . . . . . 25Research Team. . . . . . . . . . . . . . . . . . . . . . . . . . . . . . . . . . . . . . . . . . . . . . 27
Executive Summary. . . . . . . . . . . . . . . . . . . . . . . . . . . . . . . . . . . . . . . . . . 29
1. Transformation. . . . . . . . . . . . . . . . . . . . . . . . . . . . . . . . . . . . . . . 45IntroductionPrehistoric ScenarioEarly Historical Period and Cultural InteractionIntroductionAgents of ChangeDemocratic InstitutionsChanging Traditional Village EconomyChanging Socio-political RealitiesContesting Religious IdeologiesConclusionsIntroductionChanging Consumption StructureChanging Employment StructureLand and ForestRental MarketLabourCredit MarketConclusion
2. Demographic Transition. . . . . . . . . . . . . . . . . . . . . . . . . . . . . . . 55IntroductionSize and Density of PopulationDistribution of PopulationInter-district DistributionRural-Urban Distribution

ARUNACHAL PRADESH DEVELOPMENT REPORT14
Population CompositionLiteracy in Arunachal PradeshMigrationPopulation GrowthFertility and Mortality RatesThe Empirical EstimationPopulation ProjectionConclusion and Policy Implications
3. Economic Growth, Structural Changeand Workforce Participation. . . . . . . . . . . . . . . . . . . . . . . . . . . 67
IntroductionPer Capita IncomeGrowth of NSDP: 1970-71 to 2004-05Changes in Sectoral Composition of NSDP: 1970-71 to 2004-05Growth of Various Sectors: 1970-71 to 2004-05Sectoral Contributions to the Growth of NSDPInter-District Variations in Level of IncomeGrowth of Income in the Districts: 1993-94 to 2003-04Composition of District Domestic ProductSectoral Distribution of WorkersOccupational Structure of Workers at District LevelTrends in Workforce Participation: 1971-2001Conclusion
4. Labour and Employment. . . . . . . . . . . . . . . . . . . . . . . . . . . . . . 81IntroductionWorkforce Participation RatesComposition of EmploymentDistribution of Workers across IndustriesGrowth of Employment: 1993-94 to 2004-05Unemployment in Arunachal PradeshStrategy for Employment Generation: Sectoral IssuesEmployment in the Urban Informal SectorEmployment Prospects in the Rural Non-farm SectorConclusion and Policy Implications
5. Poverty. . . . . . . . . . . . . . . . . . . . . . . . . . . . . . . . . . . . . . . . . . . . . 111IntroductionPoverty and UndernutritionPoverty and Incidence of Hunger among Districts in Arunachal PradeshConclusions and Policy Issues
6. Human Development . . . . . . . . . . . . . . . . . . . . . . . . . . . . . . 117IntroductionHuman Development in Arunachal Pradesh and its DistrictsHealthEducational AttainmentsEnrolmentDropout RatesEducational InfrastructureSocial DevelopmentConclusions

CONTENTS 15
7. Natural Resources and Sustainable Development. . . . . . . . 135Mineral ResourcesBuilding MaterialHydro ResourcesProblems in Utilisation of Mineral ResourcesPolicy Options
8. Development of Forest Resources. . . . . . . . . . . . . . . . . . . . . 145IntroductionBiological DiversityFloraFaunaForest Resources and ForestryLegal Status of the ForestsManagement and Conservation/Protection of ForestsOngoing Schemes/ProgrammesForest-based IndustryJoint Forest ManagementDevelopment of Non-timber Forest ProductsManagement of Wildlife and BiodiversityWildlife Development SchemesForest ResearchMajor Forestry, Wildlife and Biodiversity Related IssuesForest LawsFuture VisionConclusion
9. Land Use and Potentials. . . . . . . . . . . . . . . . . . . . . . . . . . . . . 155IntroductionAltitudeSlopeRainfallSoilNDVILand CoverLand Potential
10. Rural Development. . . . . . . . . . . . . . . . . . . . . . . . . . . . . . . . . . 169IntroductionRural InfrastructureAccess to Basic ServicesRural Assets in Arunachal PradeshStatus of Asset-accumulationFinancial AssetsLand OwnershipRural LivelihoodRural TechnologyRural Development ProgrammesPolicy Options

ARUNACHAL PRADESH DEVELOPMENT REPORT16
11. Urban Development. . . . . . . . . . . . . . . . . . . . . . . . . . . . . . . . . . 179IntroductionTrends in Urbanisation across the DistrictsSize Class of TownsSlow Internalisation of Externally Grafted Urban CentresSocio-economic Aspects of UrbanisationUrban Infrastructure and Basic Services: A PerspectiveIssues of Urban Administration and PlanningPolicy Implications
12. Development of Agriculture and Allied Sector . . . . . . . . . 191IntroductionChanging Property Rights StructuresLand Use PatternsTrends in Agrarian StructureSize-Class Distribution of Operational Holdings: 1970-71 to 2000-01Tenancy: Extent and TypesCropping Pattern and DiversificationGrowth of Area, Production and Yield of Major Crops: 1970-71 to 2004-05Agricultural Production at the District LevelInstability in Agricultural ProductionTrends in Input-use and Technological ChangeDevelopment of Horticultural CropsCentral and State Sponsored Schemes for Development of HorticultureAnimal HusbandryFisheriesConclusion
13. Indigenous Industries. . . . . . . . . . . . . . . . . . . . . . . . . . . . . . . . 213IntroductionStatus of Indigenous Industrial ActivitiesSalient Features of Indigenous IndustriesNature of Demand for Traditional ManufacturingChanging Nature of Indigenous IndustriesFindings of the Field SurveyPotentials and PrioritisationPolicy Options
14. Development of Resource-basedand Modern Industries. . . . . . . . . . . . . . . . . . . . . . . . . . . . . . . 219
IntroductionThe Status of Manufacturing Industries in Arunachal PradeshStrengths and Weaknesses of Arunachal Pradesh as Location of Resource-based and Modern Industries in the Existing EnvironmentGovernment Policy IncentivesResource-based and Modern Industries in the Dynamics forEconomic Development of Arunachal PradeshPolicy Suggestions
CONTENTS 17
15. Environment. . . . . . . . . . . . . . . . . . . . . . . . . . . . . . . . . . . . . . . . 227IntroductionPressures on the EnvironmentEconomic ActivityUse of Traditional Fuels for Domestic Use in Rural AreasNatural FactorsState of the EnvironmentInitiatives to Address Environmental ConcernsConcerns and Recommendations
16. Border Trade and its Prospects . . . . . . . . . . . . . . . . . . . . . 235IntroductionRecent Developments in Regional Cooperation (both Bilateral & Multilateral)and Prospects of Border Trade for North-Eastern States of IndiaIndo-Bangladesh Cooperation and TradeBorder Trade of Arunachal Pradesh through Various Trade Routes in RetrospectThe Present Status of Arunachal Pradesh’s EconomyProspects of Trade with Neighbouring Countries—Exploring New FrontiersEconomic Mineral Resources of Arunachal PradeshTourism ProductsTea, Coffee, Rubber and Black PepperHydro-electric PowerStrategyConclusion
17. Tourism. . . . . . . . . . . . . . . . . . . . . . . . . . . . . . . . . . . . . . . . . 245IntroductionConstraints to Tourism DevelopmentStructure of Tourist’s Demand and its Sectoral LinkagesPolicy Implications
18. Power Sector Development. . . . . . . . . . . . . . . . . . . . . . . . . . . 255IntroductionCurrent Scenario and Performance of Power Sector in Arunachal PradeshPower Policy of the State and Sectoral ReformChallenges Ahead and Policy SuggestionsConclusion
19. Transport and Infrastructural Development. . . . . . . . . . . . . 273IntroductionTransportationTelecommunicationsPostal CommunicationPolicy Implications
20. Science and Technology. . . . . . . . . . . . . . . . . . . . . . . . . . . . 285IntroductionBiotechnology

ARUNACHAL PRADESH DEVELOPMENT REPORT18
21. Fiscal and Financial Issues. . . . . . . . . . . . . . . . . . . . . . . . . . . . 295IntroductionBroad Budgetary TrendRevenuePublic ExpenditureDebt ProblemPolicy OptionsConclusion
22. Looking Ahead: Strategy for Development. . . . . . . . . . . . . . 305IntroductionReview of Past StrategiesImplementation and OutcomesDeconstructionConclusion
References. . . . . . . . . . . . . . . . . . . . . . . . . . . . . . . . . . . . . . . . . . . . . . . . 315

CONTENTS 19
List of Tables, Figuresand Annexures
Tables
1.1 Per Capita Consumption Expenditure(Inflation and Inequality Adjusted) . . . . . . . . . . . . . . . . . . . 51
1.2 Composition of Per Capita ConsumptionExpenditure . . . . . . . . . . . . . . . . . . . . . . . . . . . . . . . . . . . . . 52
1.3 Employment (Principal and Subsidiary Status)(per 1000) . . . . . . . . . . . . . . . . . . . . . . . . . . . . . . . . . . . . . . 52
2.1 Density of Population: Arunachal Pradeshvis-a-vis the Country . . . . . . . . . . . . . . . . . . . . . . . . . . . . . . . 55
2.2 Changes in Population Composition inArunachal Pradesh . . . . . . . . . . . . . . . . . . . . . . . . . . . . . . . . 56
2.3 Sex Ratio in Arunachal Pradesh: A Comparison withthe Selected States and the Country’s Sex Ratio . . . . . . . . 57
2.4 Literacy Rate in Arunachal Pradesh: AComparison with the National Rate . . . . . . . . . . . . . . . . . . 57
2.5 Population Growth in Arunachal Pradesh:A Comparison with the National Average . . . . . . . . . . . . . 59
3.1 Growth Rate of Arunachal’s NSDP . . . . . . . . . . . . . . . . . . . 68
3.2 Sectoral Composition of NSDP ofArunachal Pradesh . . . . . . . . . . . . . . . . . . . . . . . . . . . . . . . . 68
3.3 Growth Rate of Industries in ArunachalPradesh: 1971-2005 . . . . . . . . . . . . . . . . . . . . . . . . . . . . . . . 69
3.4 Sectoral Contribution to NSDP Growthin Arunachal Pradesh . . . . . . . . . . . . . . . . . . . . . . . . . . . . . . 70
3.5 District-wise Growth Rate of Net DistrictDomestic Product: 1993-94 to 2003-2004 . . . . . . . . . . . . . 70
3.6 Sectoral Distribution of Workers by Industriesin Arunachal Pradesh: 1971-2001 . . . . . . . . . . . . . . . . . . . . 72
3.7 Changes in Sectoral Distribution of Workersin Arunachal Pradesh . . . . . . . . . . . . . . . . . . . . . . . . . . . . . . 73
3.8 Work Participation Rates in Arunachal Pradeshand India: 1971-2001 . . . . . . . . . . . . . . . . . . . . . . . . . . . . . . 74
4.1 Workforce Participation Rates (WFPR) inArunachal Pradesh: 1993-94 to 2004-05 . . . . . . . . . . . . . . . 81
4.2 Composition of Employment in ArunachalPradesh: 1993-94 (UPSS basis) . . . . . . . . . . . . . . . . . . . . . . 82
4.3 Composition of Employment in ArunachalPradesh: 1999-2000 (UPSS basis) . . . . . . . . . . . . . . . . . . . . 83
4.4 Composition of Employment in ArunachalPradesh: 2004-05 (UPSS basis) . . . . . . . . . . . . . . . . . . . . . . 83
AR
UNACHAL PRADESH
4.5 Industry Group-wise Distribution of Workersin Arunachal Pradesh: 1993-94 . . . . . . . . . . . . . . . . . . . . . . 84
4.6 Industry Group-wise Distribution of Workersin Arunachal Pradesh: 1999-2000 . . . . . . . . . . . . . . . . . . . . 85
4.7 Industry Group-wise Distribution of Workersin Arunachal Pradesh: 2004-05 . . . . . . . . . . . . . . . . . . . . . . 86
4.8 Industry Group-wise Growth of Employmentin Arunachal Pradesh: 1993-94 to 1999-2000 . . . . . . . . . . . 87
4.9 Industry-Group wise Growth of Employmentin Arunachal Pradesh: 1999-2000 to 2004-05 . . . . . . . . . . . 88
4.10 Unemployment Rate (Arunachal Pradesh):1993-94, 1999-2000 and 2004-05 . . . . . . . . . . . . . . . . . . . . 89
4.11 Registered Unemployed in Arunachal Pradesh . . . . . . . . . . 90
4.12 Growth Rates of Labour Force and Unemployment:1993-94 to 1999-2000 and 1993-94 to 2004-05 . . . . . . . . . 91
5.1 Poverty Incidence in Arunachal Pradesh and OtherStates in NER (1993-94 and 2004-05) . . . . . . . . . . . . . . . 112
5.1A HCR for NER States in 2004-05: URP and MRP . . . . . . . 112
5.2 State-wise Average Normative Calorie Requirement:Based on National Classification of Occupation Codeand Declining Requirement with Age . . . . . . . . . . . . . . . . 113
5.3 State-wise Proportion of Calorie Deficient Households . . 113
5.4 Poverty in the Districts in Arunachal Pradesh . . . . . . . . . 114
5.5 District Level Poverty in Arunachal Pradesh . . . . . . . . . . . 114
5.6 District Level Poverty in Arunachal Pradeshin 2004-05 . . . . . . . . . . . . . . . . . . . . . . . . . . . . . . . . . . . . . 114
5.7 District Level Poverty and Hunger Incidencein Arunachal Pradesh . . . . . . . . . . . . . . . . . . . . . . . . . . . . . 115
6.1 HDI of Districts of Arunachal Pradesh: 2001 . . . . . . . . . . 118
6.2 Life Expectancy at Birth in Districts ofArunachal Pradesh: 2000-01 . . . . . . . . . . . . . . . . . . . . . . . 119
6.3 Infant Mortality Rate in the Districts ofArunachal Pradesh . . . . . . . . . . . . . . . . . . . . . . . . . . . . . . . 120
6.4 Literacy Rate in Districts of Arunachal Pradesh:2001 (All Areas) (Percentage) . . . . . . . . . . . . . . . . . . . . . . 121
6.5 Female Literacy Rate: Arunachal Pradesh 2001 . . . . . . . . 122
6.6 Gender Gap in Literacy in Districts ofArunachal Pradesh: 1991-2001 . . . . . . . . . . . . . . . . . . . . . 123
7.1 Minerals and their Locations in the State . . . . . . . . . . . . . 136

ARUNACHAL PRADESH DEVELOPMENT REPORT20
7.2 Chemical Composition of the Limestoneat Different Places . . . . . . . . . . . . . . . . . . . . . . . . . . . . . . . 137
7.3 River Basins of Arunachal Pradesh . . . . . . . . . . . . . . . . . 139
7.4 Small Hydro-power Stations Under Operation . . . . . . . . . 140
7.5 Ongoing Hydro Electric Projects under State Sector . . . . 141
7.6 Identified Sites for Hydro Power Potentialin Arunachal Pradesh . . . . . . . . . . . . . . . . . . . . . . . . . . . . . 142
7.7 District-wise Groundwater Resources Availabilityand Stage of Development in Arunachal Pradesh(in ham) . . . . . . . . . . . . . . . . . . . . . . . . . . . . . . . . . . . . . . . 144
8.1 Various Forest Types with Important Plant Species . . . . . 146
8.2 Land-use Classification in Arunachal Pradesh . . . . . . . . . 146
8.3 Legal Status of Forests . . . . . . . . . . . . . . . . . . . . . . . . . . . . 146
8.4 Status of the Timber-based Industries inArunachal Pradesh . . . . . . . . . . . . . . . . . . . . . . . . . . . . . . . 150
8.5 Protected Areas in Arunachal Pradesh . . . . . . . . . . . . . . . 152
9.1 District-wise Altitude Class . . . . . . . . . . . . . . . . . . . . . . . 156
9.2 District-wise Slope Category . . . . . . . . . . . . . . . . . . . . . . . 159
9.3 District-wise Land Potential Area . . . . . . . . . . . . . . . . . . . 163
9.4 Potential Area (in km2) for Agriculturefor Specific Crops . . . . . . . . . . . . . . . . . . . . . . . . . . . . . . . . 167
9.5 Maximum Area available at District Level forDevelopment Planning Altitude and SlopeClasses Explained in Tables 9.1 and 9.2 . . . . . . . . . . . . . . 167
10.1 Percentage of Villages with Bus Stop Facilities onthe Basis of Distance Covered, 1991 . . . . . . . . . . . . . . . . . 169
10.2 Road Connectivity Status of Villages, 1997 . . . . . . . . . . . 170
10.3 Road Connectivity Status on the Basisof Population, 1997 . . . . . . . . . . . . . . . . . . . . . . . . . . . . . . 170
10.4 Percentage of Rural Households having Accessto Electricity and Other Sources of Lighting . . . . . . . . . . . 171
10.5 Percentage of Rural Households having DifferentSources of Water . . . . . . . . . . . . . . . . . . . . . . . . . . . . . . . . 171
10.6 Percentage of Rural Households havingDifferent Types of Sanitation . . . . . . . . . . . . . . . . . . . . . . . 171
10.7 Percentage of Rural Households having DifferentTypes of Drainage . . . . . . . . . . . . . . . . . . . . . . . . . . . . . . . . 172
10.8 Access to Immunisation and School Enrolment . . . . . . . 172
10.9 Household Assets in Arunachal Pradesh:A Comparison with the National Average . . . . . . . . . . . . 173
10.10 Percentage of Households Availing Banking Servicesand having each of the Specified Assets inArunachal Pradesh . . . . . . . . . . . . . . . . . . . . . . . . . . . . . . . 175
10.11 Assets Ownership in ST Households inArunachal Pradesh: 2001 . . . . . . . . . . . . . . . . . . . . . . . . . . 176
10.12 Net Sown Area (hectare) Per Rural ST Household . . . . . . 177
10.13 Performance of Rural Development Programmes . . . . . . 178
11.1 Class-wise Distribution of Towns and theirPopulation: 2001 . . . . . . . . . . . . . . . . . . . . . . . . . . . . . . . . 181
11.2 State Plan Outlay in Urban Development Sector(in Rs. lakh) . . . . . . . . . . . . . . . . . . . . . . . . . . . . . . . . . . . . 184
12.1 Changing Land Use Pattern in ArunachalPradesh: 1970-71 to 2000-01 . . . . . . . . . . . . . . . . . . . . . . . 192
12.2 Extent of Jhum and Settled Cultivation inArunachal Pradesh: 1970-71 to 1995-96 . . . . . . . . . . . . . . 193
12.3 Size Class-wise Distribution of Operational Holdings(Arunachal Pradesh): 1970-71 to 2000-01 . . . . . . . . . . . . 193
12.4 Changing Cropping Pattern in ArunachalPradesh: 1980-81 to 2002-03 . . . . . . . . . . . . . . . . . . . . . . . 196
12.5 Growth Rate of Area, Production and Yield Rate ofCrops (Arunachal Pradesh): 1980-81 to 2004-05 . . . . . . . 196
12.6 Growth Rate of Area, Production and Yield Rate ofOilseeds (Arunachal Pradesh): 1980-81 to 2000-01 . . . . . 197
12.7 Growth Rate of Area, Production and Yield Rateof Cereals in the Districts of Arunachal Pradesh:1980-81 to 2003-04 . . . . . . . . . . . . . . . . . . . . . . . . . . . . . . 198
12.8 Use of Modern Inputs in Agriculture . . . . . . . . . . . . . . . . 199
12.9 Growth Rates of Modern Inputs in ArunachalPradesh: 1980-81 to 2004-05 . . . . . . . . . . . . . . . . . . . . . . . 199
12.10 Area, Production and Yield Rate of HorticulturalCrops in Arunachal Pradesh: TE 1999-2000 . . . . . . . . . . . 200
13.1 Indigenous Manufacturing Activities amongVarious Tribes . . . . . . . . . . . . . . . . . . . . . . . . . . . . . . . . . . . 213
13.2 Classification of Industries in Arunachal Pradesh . . . . . . 215
13.3 Rural-Urban Characteristics ofSmall-Scale Industries . . . . . . . . . . . . . . . . . . . . . . . . . . . . 216
14.1 Position of Manufacturing in the Economyof Arunachal Pradesh . . . . . . . . . . . . . . . . . . . . . . . . . . . . . 220
14.2 District-wise Wood-based industries inArunachal Pradesh (as in 1985) . . . . . . . . . . . . . . . . . . . . 220
14.3 Some Details of the Small Scale Industrial Unitsin Arunachal Pradesh as in 2003-04 . . . . . . . . . . . . . . . . . 221
14.4 Type and Sector-wise Number of Enterprises inArunachal Pradesh in 1998 . . . . . . . . . . . . . . . . . . . . . . . . 225
15.1 Land Use by Districts in Arunachal Pradesh(1995 Area in Hectares) . . . . . . . . . . . . . . . . . . . . . . . . . . 229
15.2 Percentage Distribution of Households basedon Fuel Consumption for Cooking . . . . . . . . . . . . . . . . . . 229
15.3 Number of River Basins and Area underDifferent Soil Loss Categories . . . . . . . . . . . . . . . . . . . . . . 231
16.1 List of India’s Exports (with value) havingPotentials for Arunachal Pradesh . . . . . . . . . . . . . . . . . . . 240
18.1 Category-wise Power Consumption in ArunachalPradesh over the Years . . . . . . . . . . . . . . . . . . . . . . . . . . . . 256
18.2 Total Installed Capacity (MW) of the Sstate . . . . . . . . . . . 258
18.2A Key Timeline: Ongoing Small Hydel Projects(42 projects) . . . . . . . . . . . . . . . . . . . . . . . . . . . . . . . . . . . . 258
18.3 Power Sector Allotment by the State Government . . . . . . 258
18.4 State's Share in the Central Sector GeneratingStations: 2004-05 . . . . . . . . . . . . . . . . . . . . . . . . . . . . . . . . 258
18.4A Key Timelines for Dibang Power Project . . . . . . . . . . . . . . 259
18.5 Energy Availability: 2001-02 to 2006-07 . . . . . . . . . . . . . . 259
18.5A Key Time Lines for Para H.E Project . . . . . . . . . . . . . . . . . 259

LIST OF TABLES, FIGURES AND ANNEXURES 21
18.6 MOUs Singed by Private Developers & CPUsin Arunachal’s Power Sector . . . . . . . . . . . . . . . . . . . . . . . 262
18.7 Capacity Addition Targets with Respect toHydro Generation . . . . . . . . . . . . . . . . . . . . . . . . . . . . . . . 263
18.8 MoU between State Government and CPUs . . . . . . . . . . . 263
18.9 Exploitation of Power Potential by Basins . . . . . . . . . . . . . 264
18.10 Transmission and Distribution Losses inArunachal Pradesh . . . . . . . . . . . . . . . . . . . . . . . . . . . . . . . 264
18.11 Moratorium Period and Concessional Rateof Free Power . . . . . . . . . . . . . . . . . . . . . . . . . . . . . . . . . . . 266
18.12 Reform Status in Arunachal Pradesh withRespect to the MoA . . . . . . . . . . . . . . . . . . . . . . . . . . . . . . 267
18.13 List of 42 Schemes in Arunachal Pradesh Underthe Prime Minister’s Initiative, 2003 . . . . . . . . . . . . . . . . 268
19.1 Category-wise Length of Roads in ArunachalPradesh from 1998-2002 . . . . . . . . . . . . . . . . . . . . . . . . . . 273
19.2 Growth of National Highways in Arunachal Pradeshand other North-eastern states (km) . . . . . . . . . . . . . . . . 274
19.3 Growth of Total and Surfaced Roads in ArunachalPradesh and Other North-eastern States (km) . . . . . . . . . 274
19.4 Total Numbers of Vehicles in Arunachal Pradeshas on 31.03.2003 . . . . . . . . . . . . . . . . . . . . . . . . . . . . . . . . 276
19.5 Total Road Accidents in Arunachal Pradesh . . . . . . . . . . . 276
19.6 Number of Persons Killed and Injured byMotor Vehicles in Arunachal Pradesh . . . . . . . . . . . . . . . . 276
19.7 Statistics on the State Transport Departmentof Arunachal Pradesh . . . . . . . . . . . . . . . . . . . . . . . . . . . . . 278
19.8 Railways in North-eastern Region—State-wiseDisposition (km) . . . . . . . . . . . . . . . . . . . . . . . . . . . . . . . . 279
19.9 Arunachal Pradesh-Annual Plan allocations(lakh Rs.) . . . . . . . . . . . . . . . . . . . . . . . . . . . . . . . . . . . . . . 280
19.10 A Summary of the Current Status of theTelecom Sector in Arunachal Pradesh . . . . . . . . . . . . . . . . 281
19.11 Internet Service in North-east India . . . . . . . . . . . . . . . . . 281
19.12 Growth of Post Offices in Arunachal Pradesh . . . . . . . . . . 282
21.1 Different Deficit Indicators . . . . . . . . . . . . . . . . . . . . . . . . 296
21.2 Composition of Aggregate Revenue . . . . . . . . . . . . . . . . . 296
21.3 Gowth Rate of Different Revenue Aggregates . . . . . . . . . 297
21.4 Major Components of Own Tax Revenue . . . . . . . . . . . . . 297
21.5 Growth Rate of Different Fiscal Aggregates . . . . . . . . . . . 298
21.6 Broad Expenditure as a Percentage of GSDP(Average of the Period) . . . . . . . . . . . . . . . . . . . . . . . . . . . 298
21.7 Average Expenditure in Social Services at ConstantPrice (1999-2000 =100), (Rupees in Crore) . . . . . . . . . . . 299
21.8 Average Expenditure in Economic Service at ConstantPrice (1999-2000 =100), (Rupees in Crore) . . . . . . . . . . . 299
21.9 Average Expenditure in General Services at ConstantPrice 1999-2000 =100), (Rupees in Crore) . . . . . . . . . . . 300
21.10 State-wise Outstanding Liabilities (As a % of GSDP) . . . 300
21.11 Impact of Public Debt on Developmental CapitalExpenditure . . . . . . . . . . . . . . . . . . . . . . . . . . . . . . . . . . . . 301
21.12 Outstanding Debt Position . . . . . . . . . . . . . . . . . . . . . . . . 302
21.13 Composition of Total Debt . . . . . . . . . . . . . . . . . . . . . . . . 302
21.14 Interest Paid and Outstanding Debt . . . . . . . . . . . . . . . . . 302
22.1 Inflow of Central Funds, Government Expenditure(Ratio in Arunachal Pradesh) . . . . . . . . . . . . . . . . . . . . . . 308
22.2 Gross District Domestic Product (GDDP) in ArunachalPradesh at Constant Prices of 1993-94 . . . . . . . . . . . . . . . 309
22.3 Sectoral Employment Elasticity inArunachal Pradesh . . . . . . . . . . . . . . . . . . . . . . . . . . . . . . . 310
22.4 NSDP of Arunachal Pradesh: A Comparison withHimachal Pradesh . . . . . . . . . . . . . . . . . . . . . . . . . . . . . . . 312
Figures
3.1 Changing Sectoral Composition of NSDP inArunachal Pradesh: 1970-71 to 2004-05 . . . . . . . . . . . . . . . 68
3.2 Work Participation Rates in ArunachalPradesh: 1971-2001 . . . . . . . . . . . . . . . . . . . . . . . . . . . . . . . 73
8.1 Forest Cover of Arunachal Pradesh . . . . . . . . . . . . . . . . . . 147
9.1 Altitude Zones . . . . . . . . . . . . . . . . . . . . . . . . . . . . . . . . . . 157
9.2 Rainfall . . . . . . . . . . . . . . . . . . . . . . . . . . . . . . . . . . . . . . . . 157
9.3 Soil . . . . . . . . . . . . . . . . . . . . . . . . . . . . . . . . . . . . . . . . . . . 161
9.4 NDVI Class versus Area . . . . . . . . . . . . . . . . . . . . . . . . . . . 160
9.5 NDVI . . . . . . . . . . . . . . . . . . . . . . . . . . . . . . . . . . . . . . . . . 161
9.6 Landuse versus Area . . . . . . . . . . . . . . . . . . . . . . . . . . . . . . 163
9.7 Landcover . . . . . . . . . . . . . . . . . . . . . . . . . . . . . . . . . . . . . . 165
9.8 Agriculture Potential Area . . . . . . . . . . . . . . . . . . . . . . . . . 165
9.9 Cropped Area—Important Crops . . . . . . . . . . . . . . . . . . . 164
10.1 Road Connectivity Status, 1997 . . . . . . . . . . . . . . . . . . . . 170
11.1 Location of Urban Centres in Arunachal Pradesh . . . . . . . 179
11.2 Level of Urbanisation in Different Districts, 2001 . . . . . . 180
11.3 Percentages of Households having Accessto Electricity . . . . . . . . . . . . . . . . . . . . . . . . . . . . . . . . . . . . 182
11.4 Percentage of Urban Households with Sourcesof Drinking Water . . . . . . . . . . . . . . . . . . . . . . . . . . . . . . . 183
11.5 Percentage of Urban Households with DifferentTypes of Drainage . . . . . . . . . . . . . . . . . . . . . . . . . . . . . . . . 183
12.1 Share of Jhum and Settled Cultivation in TotalOperated Area in Arunachal Pradesh:1970-71 to 1995-96 . . . . . . . . . . . . . . . . . . . . . . . . . . . . . . 193
12.2 Share of Small and Marginal Holdings inArunachal Pradesh: 1970-71 to 2000-01 . . . . . . . . . . . . . . 194
12.3 Area under Different Types of Tenancy inArunachal Pradesh: 2000-01 . . . . . . . . . . . . . . . . . . . . . . . 195
12.4 Area under HYV Seeds, Chemical Fertilisers andPlant Protection Chemicals in Arunachal Pradesh:1980-81 to 2004-05 . . . . . . . . . . . . . . . . . . . . . . . . . . . . . . 199
12.5 Fish Production in Arunachal Pradesh:1990-91 to 2003-04 . . . . . . . . . . . . . . . . . . . . . . . . . . . . . . 202
18.1 Power Potential by Basins and Probable InstalledCapacity under the MOAs Signed . . . . . . . . . . . . . . . . . . . 263

ARUNACHAL PRADESH DEVELOPMENT REPORT22
Annexures
A-2.1 Distribution of Population inArunachal Pradesh: 2001 . . . . . . . . . . . . . . . . . . . . . . . . . . . 61
A-2.2 Rural-Urban Distribution of Population inArunachal Pradesh: 2001 . . . . . . . . . . . . . . . . . . . . . . . . . . . 61
A-2.3 Migration in Arunachal Pradesh: 1991 . . . . . . . . . . . . . . . . 61
A-2.4 Population Composition of ArunachalPradesh, 2001 . . . . . . . . . . . . . . . . . . . . . . . . . . . . . . . . . . . . 62
A-2.5 Trend of CBR, CDR and Population Growth in ArunachalPradesh: A Comparison with the Country, 2001 . . . . . . . . 62
A-2.6 Population Projection . . . . . . . . . . . . . . . . . . . . . . . . . . . . . . 62
A-3.1 Per Capita Net Domestic Products in Districtsof Arunachal Pradesh: 1993-94 to 2003-04 . . . . . . . . . . . . . 76
A-3.2 Growth Rates of District Domestic Product inArunachal Pradesh: 1993-94 to 2003-04 . . . . . . . . . . . . . . . 76
A-3.3 Structure of District Domestic Product inArunachal Pradesh: Average for the Period1993-94 to 2000-01 . . . . . . . . . . . . . . . . . . . . . . . . . . . . . . . 77
A-3.4 Industry-wise Distribution of Workers in Districtsof Arunachal Pradesh: 1981 . . . . . . . . . . . . . . . . . . . . . . . . . 78
A-3.5 Industry-wise Distribution of Workers in Districtsof Arunachal Pradesh: 1991 . . . . . . . . . . . . . . . . . . . . . . . . . 79
A-3.6 Industry-wise Distribution of Total Workers inDistricts of Arunachal Pradesh: 2001 . . . . . . . . . . . . . . . . . 80
A-3.7 Rural Work Participation Rates in ArunachalPradesh: 1991-2001 . . . . . . . . . . . . . . . . . . . . . . . . . . . . . . . 80
A-3.8 Urban Work Participation Rates in ArunachalPradesh: 1991-2001 . . . . . . . . . . . . . . . . . . . . . . . . . . . . . . . 80
A-3.9 Combined Work Participation Rates in ArunachalPradesh (Rural + Urban): 1991-2001 . . . . . . . . . . . . . . . . . 80
A-4.1 Age Group-wise Workforce ParticipationRate in Arunachal Pradesh: 1993-94, 1999-2000 and 2004-05 . . . . . . . . . . . . . . . . . . . . . . . . . . . . . . . . 94
A-4.2 Age Group-wise Labour Force ParticipationRate in Arunachal Pradesh: 1993-94, 1999-2000 and 2004-05 . . . . . . . . . . . . . . . . . . . . . . . . . . . . . . . . 95
A-4.3 Unemployment Rate by Educational Standardsin Arunachal Pradesh (as a Proportion ofLabour Force): 1993-94 . . . . . . . . . . . . . . . . . . . . . . . . . . . . 96
A-4.4 Unemployment Rate by Educational Standardsin Arunachal Pradesh (as a Proportion ofLabour Force): 1999-2000 . . . . . . . . . . . . . . . . . . . . . . . . . . 97
A-4.5 Unemployment Rate by Educational Standardsin Arunachal Pradesh (as a Proportion ofLabour Force): 2004-05 . . . . . . . . . . . . . . . . . . . . . . . . . . . . 98
A-4.6 Unemployment Rate by Educational Standardsin Arunachal Pradesh (as a Proportion ofPopulation): 1993-94 . . . . . . . . . . . . . . . . . . . . . . . . . . . . . . 99
A-4.7 Unemployment Rate by Educational Standardsin Arunachal Pradesh (as a Proportion ofPopulation): 1999-2000 . . . . . . . . . . . . . . . . . . . . . . . . . . . 100
A-4.8 Unemployment Rate by Educational Standardsin Arunachal Pradesh (as a Proportion ofPopulation): 2004-05 . . . . . . . . . . . . . . . . . . . . . . . . . . . . . 101
A-4.9 Unemployment Rate by Age Group inArunachal Pradesh (as a Proportion ofLabour Force): 1993-94 . . . . . . . . . . . . . . . . . . . . . . . . . . . 102
A-4.10 Unemployment Rate by Age Group inArunachal Pradesh (as Proportion ofLabour Force): 1999-2000 . . . . . . . . . . . . . . . . . . . . . . . . . 103
A-4.11 Unemployment Rate by Age Group inArunachal Pradesh (as Proportion ofLabour Force): 2004-05 . . . . . . . . . . . . . . . . . . . . . . . . . . . 104
A-4.12 Unemployment Rate by Age Group inArunachal Pradesh (as a Proportion ofPopulation): 1993-94 . . . . . . . . . . . . . . . . . . . . . . . . . . . . . 105
A-4.13 Unemployment Rate by Age Group inArunachal Pradesh (as a Proportion ofPopulation): 1999-2000 . . . . . . . . . . . . . . . . . . . . . . . . . . . 106
A-4.14 Unemployment Rate by Age Group inArunachal Pradesh (as a Proportion ofPopulation): 2004-05 . . . . . . . . . . . . . . . . . . . . . . . . . . . . . 107
A-4.15 Percentage Share of Informal Sector Enterprises andEmployment in Arunachal Pradesh: 1990-1998 . . . . . . . . 108
A-4.16 Rural Non-farm Labour Force in North-east India . . . . . . 108
A-4.17 Changing Composition of RNFE inArunachal Pradesh: 1971-1991 . . . . . . . . . . . . . . . . . . . . . 109
A-4.18 Inter-district Variations in the Share ofRural Non-farm Employment inArunachal Pradesh: 2001 . . . . . . . . . . . . . . . . . . . . . . . . . . 109
A-6.1 Human Development Index (HDI) of States ofIndia: 2000 . . . . . . . . . . . . . . . . . . . . . . . . . . . . . . . . . . . . . 128
A-6.2 Educational Attainments in Arunachal Pradeshand Other North-eastern States . . . . . . . . . . . . . . . . . . . . 128
A-6.3 Health Status of the Population: Arunachal Pradeshand Other North-eastern States . . . . . . . . . . . . . . . . . . . . 129
A-6.4 Social Sector Expenditure as Percentage ofTotal Government Expenditure . . . . . . . . . . . . . . . . . . . . . 129
A-6.5 Life Expectancy in Different States of India:2000 (Adjusted) . . . . . . . . . . . . . . . . . . . . . . . . . . . . . . . . . 130
A-6.6 Growth of Health Services in Arunachal Pradeshand in the Country . . . . . . . . . . . . . . . . . . . . . . . . . . . . . . . 130
A-6.7 Rural Urban Distribution of Allopathic MedicalInstitutions in Arunachal Pradesh, 2001 . . . . . . . . . . . . . . 130
A-6.8 Literacy Rate in Districts of Arunachal Pradesh: 1991 . . . 131
A-6.9 Gender Gap in Literacy: Arunachal Pradesh andNorth-eastern States 1981-2001 . . . . . . . . . . . . . . . . . . . . 131
A-6.10 Gross Enrolment Ratio (2000-01) . . . . . . . . . . . . . . . . . . . 132
A-6.11 Dropout Rates in Arunachal Pradesh andIndia: 2004-05 . . . . . . . . . . . . . . . . . . . . . . . . . . . . . . . . . . 132
A-6.12 Gender Parity Index in Enrolment: 2004-05 . . . . . . . . . . . 133
A-6.13 Index of Social Development among SmallStates: 1991 . . . . . . . . . . . . . . . . . . . . . . . . . . . . . . . . . . . . 133
A-6.14 Index of Social Development among SmallStates: 2001 . . . . . . . . . . . . . . . . . . . . . . . . . . . . . . . . . . . . 134
A-11.1 Year of Opening of Administrative Centres and EarlyAdministrative Status of the Towns in ArunachalPradesh, 1991 . . . . . . . . . . . . . . . . . . . . . . . . . . . . . . . . . . . 186

LIST OF TABLES, FIGURES AND ANNEXURES 23
A-11.2 Number of Towns and Percentage of Urban Populationin North-east India, 2001 . . . . . . . . . . . . . . . . . . . . . . . . . 186
A-11.3 Trends in Urbanisation of Arunachal Pradesh,1971-2001 . . . . . . . . . . . . . . . . . . . . . . . . . . . . . . . . . . . . . 186
A-11.4 Distribution of Scheduled Tribe Population inUrban Centres of Arunachal Pradesh, 2001 . . . . . . . . . . . 186
A-11.5 Percentage Distribution of Birth Place UrbanMigrants in Arunachal Pradesh, 1991 . . . . . . . . . . . . . . . . 186
A-11.6 Interdependence between Urbanisation andIndicators of Socio-economic Development atDistrict Level in Arunachal Pradesh . . . . . . . . . . . . . . . . . 187
A-11.7 Percentage of Urban Households having Accessto Electricity . . . . . . . . . . . . . . . . . . . . . . . . . . . . . . . . . . . . 188
A-11.8 Percentage of Urban Households having Bankingand Telephone Facilities . . . . . . . . . . . . . . . . . . . . . . . . . . . 188
A-11.9 Percentage of Households having DifferentSources of Water . . . . . . . . . . . . . . . . . . . . . . . . . . . . . . . . 188
A-11.10 Percentage of Urban Households havingDifferent Types of Drainage . . . . . . . . . . . . . . . . . . . . . . . . 188
A-11.11 Percentages of Households having DifferentTypes of Sanitation . . . . . . . . . . . . . . . . . . . . . . . . . . . . . . . 189
A-11.12 Interdependence between Level of Urbanisationand Selected Indicators of Basic Urban Amenities . . . . . . 189
A-11.13 Annual Expenditure on Urban Developmentin Arunachal Pradesh . . . . . . . . . . . . . . . . . . . . . . . . . . . . . 189
A-12.1 Index of Inter-class Concentration Ratioand Gini Ratio . . . . . . . . . . . . . . . . . . . . . . . . . . . . . . . . . . 205
A-12.2 Size Class-wise Distribution of Operational Holdingsin Districts of Arunachal Pradesh: 1995-96 . . . . . . . . . . . 205
A-12.3 Share of ST Operated Holdings in Total Holdingsand Area in Arunacahl Pradesh: 1980-81 to 1995-96 . . . . 205
A-12.4 Size Class-wise Distribution of Operational Holdingsamong Scheduled Tribes (Arunachal Pradesh):1970-71 to 1995-96 . . . . . . . . . . . . . . . . . . . . . . . . . . . . . . 206
A-12.5 Average Size of Holdings in Arunachal Pradesh:1970-71 to 1995-96 . . . . . . . . . . . . . . . . . . . . . . . . . . . . . . 206
A-12.6 Extent of Tenancy across Size Classes of OperationalHoldings (Arunachal Pradesh): 1970-71 to 2000-01 . . . . 206
A-12.7 Extent of Tenancy in Arunachal Pradesh:1970-71 to 1995-96 . . . . . . . . . . . . . . . . . . . . . . . . . . . . . . 207
A-12.8 Coefficient of Variations in Area, Productionand Yield of Crops in Arunachal Pradesh:1980-81 to 2004-05 . . . . . . . . . . . . . . . . . . . . . . . . . . . . . . 207
A-12.9 Distance Covered by Farmers for Inputs inArunachal Pradesh: 2003 . . . . . . . . . . . . . . . . . . . . . . . . . . 208
A-12.10 Educational Levels of Farmers in Arunachal Pradesh . . . . 208
A-12.11 District-wise Crop Area and Production ofHorticulture Fruits and Spices during 2004-05 . . . . . . . . . 209
A-12.12 Present Area and Production of Horticulture Cropsand Percentage Increase over Pre-Mission Period . . . . . . . 210
A-12.13 Targeted Area and Production of DifferentHorticulture Crops up to 2010 . . . . . . . . . . . . . . . . . . . . . 210
A-12.14 Livestock in Arunachal Pradesh:1978-79 to 1997-98 . . . . . . . . . . . . . . . . . . . . . . . . . . . . . . 211
A-17.1 Identified Tourist Spots in Arunachal Pradesh . . . . . . . . . 250
A-17.2 Interesting Trek Routes in Arunachal Pradesh . . . . . . . . . 250
A-17.3 Accommodation Capacity of Different Hotels/GuestHouses, etc., in Tourist Spots of Arunachal Pradesh . . . . 250
A-17.4 Annual Allocation of Tourism Sector in StateAnnual Plan (Rs. in lakh) . . . . . . . . . . . . . . . . . . . . . . . . . 251
A-17.5 Allocation of Eleventh Finance Commission (EFC)Upgradation Grant during 2000-01 to 2001-05(Rs. in lakh) . . . . . . . . . . . . . . . . . . . . . . . . . . . . . . . . . . . . 252
A-17.6 Sanction Received For Projects under Centrally SponsoredSchemes, 2000-01 to 2005-06 (Rs. in lakh) . . . . . . . . . . . 252

Rajiv Gandhi University was entrusted with the
responsibility of preparing the Arunachal Pradesh
Development Report by the Planning Commission,
Government of India in August 2005. This is for the first
time that any University in the country undertook such a
task. Incidentally, this is the second milestone achieved by
the University. It also prepared the Human Development
Report in 2005. Both these initiatives were the result of
my predecessors, Professors Kamal Kant Dwivedi and Atul
Sarma. My special thanks are due to Prof. Atul Sarma,
Member, 13th Finance Commission, who was the main
architect of this undertaking and who supervised and
monitored the project from its inception to its completion.
I take this opportunity to warmly congratulate Dr. S.K.
Nayak, Coordinator, his colleagues in the Department of
Economics and other departments of Rajiv Gandhi
University, and all the other resource persons from all
over the country who were involved in this Herculean
task.
The Human Development Report of Arunachal Pradesh
was not able to cover certain issues, given the nature of
its terms and reference. However, the report has been
able to deal with new areas like border trade, indigenous
industries and demographic transition.
Arunachal Pradesh started its developmental efforts
just after Independence, with only three primary schools
and virtually zero literacy. Within a span of 50 years, the
State has registered an impressive growth in literacy rate,
the highest in India. The per-capita income of the State
was 56.14 per cent of the national average in 1970-71,
which went up to 110 per cent in 1995-96. In the post-
reform period, due to the slowing down of the growth
rate, it decreased to 84.64 per cent in 1999-2000.
However, due to some recovery in growth, it has become
95 per cent of the national average in 2004-2006. Despite
all these, achievements in the human development front
Acknowledgements
ARUN
ACH
AL PR
ADESH
are really commendable. However, the liberalisation
process which started in the 1990s poses many challenges
to the development efforts of the state which needs
thorough scrutiny.
Nearly 61 per cent of the population is dependent on
agriculture and the practices followed by the farmers are
still primitive untouched by modern technology. Even at
present, the state is dependent on migrant workers, the
highest in the North-east, to meet its increasing demand
for labour. It is a state with abundant land but only 5 per
cent of the land is suitable for cultivation. As a result,
shifting cultivation is largely practiced to meet the
livelihood of the people.
Further, with the rise in literacy rate and growth of
modern education, young people are in search for white
collar jobs, which has resulted in pressure on the
government to create more jobs. In a situation of low
private investment, the government is compelled to curtail
capital expenditure to create more jobs. And as a result
the creation of capital goods in the state has suffered.
It is well known that all the North-eastern states are
poor in infrastructure. For example, road density is low
and there is a strong demand to improve the road
connectivity. When new roads are constructed, there is
always a threat to the environment. Cost of construction
is also high. The state is dependent on the Centre for 90
per cent of its developmental efforts. When it is trying to
enhance its resources from hydroelectric power potential,
there is simultaneously a danger to its rich culture and
bio-diversity. Hence, there is a greater need to balance the
two without sacrificing one for the other.
Despite the paradoxes and intricacies of the issues
involved, the Report has tried to prescribe certain sets of
solutions. However, we are open to healthy criticism and
constructive suggestions. These will go a long way in the
ARUNACHAL PRADESH DEVELOPMENT REPORT26
final implementation of the report by the state. I hope and
trust that this report will serve the interests of the people
of the State and put Arunachal Pradesh on the fast track
of progress.
I must remember to acknowledge on this occasion the
magnificent support and help that the University has
received from various individuals. I offer my sincere
gratitude to Prof. S.P. Gupta, former Member of the
Planning Commission, Sri. B.K. Chaturvedi, Member,
Planning Commision, Smt. Jayati Chandra, Advisor,
Planning Commision, Sri. S.N. Brahmachowdhuri,
Director, Planning Commission, Sri. Tabom Bam, Chief
Secretary, Arunachal Pradesh, Sri. Ashok Acharya, former
Secretary, Planning, Arunachal Pradesh and Sri. P.S.
Lokhande, Secretary, Planning, Arunachal Pradesh.
K.C.Belliappa
Vice Chancellor
Rajiv Gandhi University

Research Team
ARUN
ACH
AL PR
ADESH
Prof. Atul Sarma Former Vice Chancellor, Rajiv Gandhi University
Prof. A.C. Bhagabati Former Vice Chancellor, Rajiv Gandhi University
Prof. Tamo Mibang Former Pro-Vice Chancellor, Rajiv Gandhi University
Prof. H. Goswamy Professor, Dibrugarh University
Prof. S. Dutta Department of History, Rajiv Gandhi University
Prof. J.K. Gogoi Professor, Dibrugarh University
Prof. M.P. Bezbaruah Professor, Gauhati University
Prof. Amaresh Dubey Jawaharlal Nehru University, New Delhi
Dr. Trilochan Singh Scientist In-charge (Retd.), Wadia Institute of Himalayan Geology
Dr. D.C. Goswamy Scientist E, RRL Jorhat
Dr. S.N. Hegde Former Director, State Forest Resarch Institute, Itanagar
Prof. A. Mitra Department of Economics, Rajiv Gandhi University
Prof. N.C. Roy Department of Economics, Rajiv Gandhi University
Dr. S.K. Nayak Department of Economics, Rajiv Gandhi University
Dr. Vandana Upadhaya Department of Economics, Rajiv Gandhi University
Dr. D.K. Mishra Jawaharlal Nehru University, New Delhi
Dr. B. Tripathy Department of Histort, Rajiv Gandhi University
Dr. M.C. Behera Arunachal Institute of Tribal Studies, Rajiv Gandhi University
Prof. S.K. Pattnaik Department of Geography, Rajiv Gandhi University. Presently atAdikabi Nannaya University, Rajmundry
Dr. S.K. Choudhury Arunachal Institute of Tribal Studies, Rajiv Gandhi University
TERI, New Delhi The Energy and Resources Institute, New Delhi
Dr. Veronica Pala North Eastern Hill University, Shillong

UTTARAKHAND DEVELOPMENT REPORT28
Peer Reviewers
Prof. Amitabh Kundu Jawaharlal Nehru University, New Delhi
Prof. M.R. Saluja Retd. Professor, Indian Statistical Institute, New Delhi
Prof. Tapas Sen National Institute of Public Finance and Policy, New Delhi
Prof. Manoj Panda IGIDR, Mumbai
Prof. B.C. Bhowmick Professor, Agriculture University, Jorhat
Prof. Dilip Nath Gauhati University
Dr. S.N. Hegde Former Director, State Forest Research Institute, Itanagar
Sri M.P. Bezbaruah Retired IAS, New Delhi
Dr. P.K. Mehta University of Delhi
Dr. Sudhansu S. Rath Sambalpur University
Dr. P.K. Kuri Burdwan University
Dr. Tana Showren Rajiv Gandhi University, Itanagar
Dr. S.P.Shukla Rajiv Gandhi University, Itanagar
Dr. Kalyan Das OKD Institute of Social Change and Development, Guwahati
Mr. Sunit Patel Geological Survey of India, Bhubaneswar
Dr. A. Arunachalam NERIST, Nirjuli, Itanagar
Prof. J.L. Dawar Mizoram University, Aizawl

The report is structured in 22 chapters. The initial chapter
scheme was finalised by the Core Committee constituted
by the Planning Commission. However, considering the
special characteristics of the State some new chapters like,
Transformation, Demographic Transition, Border Trade,
Indigenous Industries and Infrastructure are added. The
chapters have been organised in a sequential manner
keeping in view an analytical framework of development
study. The report has highlighted the broader findings of
the study and policy options emerging there from.
Transformation
• Earlier known as NEFA, Arunachal Pradesh came
into the picture in 1972 as a Union Territory. Full
fledged statehood was granted in 1987.
• Over time social and economic transformation has
taken place in the State. Individual ownership in
cultivable land is gaining importance over
community ownership. Land possession is now
considered as a social status. With the introduction
of money, economy has resulted in institutional
transformation in land, labour and capital markets.
Therefore, various contradictions have emerged in
the economy of the State.
• The traditional consumption pattern of the people
has changed, as new products have entered into
their consumption basket, which has resulted in an
increase in demand for cash. The traditional land
ownership system and other economic institutions
have become non-compatible with market system.
Therefore, serious contradictions have arisen due to
non-compatibility of traditional production system
and institutions with those which are in conformity
with market system.
Executive Summary
ARUN
ACH
AL PR
ADESH
• Due to monetisation, slow or no technological
change in agriculture and semi-stagnant industrial
sector, there is tremendous pressure on the
government sector for employment and the
government has expanded, which has resulted in a
distorted growth of the tertiary sector.
Demographic Transition
• With an area of 83,743 sq km and a population of
10,97,968 (as per 2001 Census), the State has a
very low density of population. It is only 13 persons
per sq km, the lowest among all the states in the
country.
• The inter-district distribution of population is
highly skewed; density is relatively high in the
districts with some plains and extremely low in the
districts situated in the upper reaches of the State.
• The ST population constituted 64.22 per cent and
non-ST 35.78 per cent of the total in 2001.
• The sex ratio of the ST population declined from
1013 in 1961 to 998 in 1991 but increased to 1003
in 2001.
• The growth of population in Arunachal Pradesh is
much higher than that in the country. However,
during the 1990s the population growth rate
declined in the State due to the falling rate of in-
migration from the rest of the country and falling
rate of fertility.
• The fertility rate in the State is falling but the rate
of fall is still very low. The mortality rate is,
however, on a decline. Because of this, the natural
rate of growth of population in the State is still
higher than the national average.

ARUNACHAL PRADESH DEVELOPMENT REPORT30
• In spite of a clear falling mortality, the health status
of the population in the State is worse than that in
the rest of the country. Especially, in the remote
region of the State, the health conditions remain
one of the worst not only in the country but also in
the world.
• The cost of providing health service per head in this
hilly state is more than two and a half times that
for the states situated in the plains.
Policy Measures
• Expansion of the health services in the remote areas
of the State.
• Public distribution system should be strengthened
to cover all people living below the poverty line.
• Family planning services should be more
meaningfully integrated with the health services in
the State.
• Precautionary/preventive measures against AIDS
should be strengthened.
Economic Growth, Structural Changesand Work Force Participation
• In 1970-71, per capita NSDP of the State was
around 56.14 per cent of the national average. Due
to better growth performance of the State in the
1970s and 1980s, the difference between Arunachal
Pradesh and national per capita income declined till
the period of 1990-91. From 1991-92 to 1995-96,
per capita income of the State remained higher than
that of the country. After 1995-96, the per capita
income of the State fell below the national average
and the State’s per capita income relative to the
national income had since been getting lower and
lower and became 84.64 per cent of the national
average in 1999-2000. However in recent times, it
has recovered and stood at 95 per cent of the
national average in 2004-2006.
• Arunachal’s NSDP growth rate was higher than that
of the national income in the 1970s and 1980s. In
the 1990s the rate was reversed; Arunachal’s
growth rate was 4.84 per cent in contrast to the
national average of 5.93 per cent per annum. In per
capita terms, there was a negative growth during
1994-2003 in the State.
• There is also a change in the sectoral composition
of NSDP over time. A sharp declining tendency is
observed in the share of primary sector in NSDP
(46.19 per cent in 1990-91 to 31.09 per cent in
2004-05). This decline is mainly due to decline in
the share of agriculture (35.09 per cent in 1990-91
to 24.37 per cent in 2004-05), and forestry and
logging (9.58 per cent in 1990-91 to 4.30 per cent
in 2004-05) in NSDP.
• There has been a moderate rise in the share of
secondary sector in NSDP. It went up from 21.56
per cent in 1990-91 to 25.42 per cent in 2004-05.
Within the secondary sector, manufacturing sector’s
share has declined from 6.04 per cent to 2.27 per
cent. Share of construction has gone up from 17.98
per cent to 22.51 per cent during the same time.
Electricity, gas and water supply sectors’ share has
improved from -2.47 per cent to 0.64 per cent
during the same period.
• The tertiary sector’s share in NSDP went up from
32.25 per cent in 1990-91 to 43.50 per cent in
2004-05. The share of transport, storage and
communication went up from 0.65 per cent in
1990-91 to 8.19 per cent in 2004-05. Trade, hotel
and restaurants’ share has gone down from 4.95 to
3.86 per cent, banking and insurances has gone up
from 1.49 per cent to 2.61 per cent, share of real
estate etc., has declined from 5.29 per cent to 2.09
per cent. However, there has been a sharp increase
in the share of public administration from 8.17 per
cent to 14.99 per cent during the same period.
• During 1990-91 to 2004-05 the primary sector
contributed 8.90 per cent to NSDP growth in
contrast to a contribution of 36.79 and 54.36 per
cent in 1970s and 1980s. This decline is mainly due
to decline in the contribution of agriculture (41.95
per cent in 1980s to 12.03 per cent in 1990s) and
forestry and logging sector (5.45 per cent in 1980s
to -6.85 per cent in 1990s). There is also a decline
in the contribution by mining and quarrying (5.66
per cent in 1980s to 1.60 per cent in 1990s) to total
growth of NSDP in the State.
• Secondary sector’s contribution to growth has
increased from 23.92 per cent in the 1970s and
18.44 per cent in 1980s to 26.41 per cent in the
1990s. The better performance of this sector is
mainly due to better performance of construction.
However, contribution of electricity has been
satisfactory.
• Tertiary sector’s contribution to growth has gone up
from 27.2 per cent in the 1980s to 64.68 per cent in
the 1990s. Contribution by the non-infrastructural

EXECUTIVE SUMMARY 31
category of tertiary service (which includes public
administration and other services) to growth has
increased from 14.11 per cent in the 1980s to 40.48
per cent in the 1990s. In the infrastructure category
the contribution by transport, storage and
communication has increased from 0.79 per cent in
1980s to 24.42 per cent in the 1990s. In other
sectors of the infrastructure category like trade,
hotel and restaurant, banking and insurance, the
contribution has declined from 8.73 per cent to
6.43 per cent in the 1990s.
• In the post-reform period, a sharp inter-district
variation in net district domestic product (NDDP)
is also observed. The districts like Tawang, Papum
Pare, Lower Subansiri, Upper Subansiri, Upper
Siang, Changlang and Tirap have higher rate of
growth than the State average. In East Siang, a
negative growth is observed. In per capita NDDP,
six districts namely Tawang, West Kameng, Papum
Pare, East Siang, Upper Siang, Dibang Valley have
negative growth. The highest growth in per capita
NDDP has taken plece in Upper Subansiri.
The above growth pattern has percolated down and
is reflected in the outcome variables like
employment, poverty and human development as
discussed below.
Employment
• The remarkable feature of the total workers in the
State is that 79.7 per cent are self-employed. In the
rural areas 90 per cent of the ST male and 95 per
cent of the ST female workers are self-employed.
• Dependency in agriculture sector in the state is high
but it is declining. The share of agriculture in 2004-
2005, among all workers, was 76 per cent (NSS 61st
Round), implying the dominance of agriculture in
the State’s economy. The declining share of
agriculture sector in the income is the most
important disturbing trend in the economy of the
State. The second important employment generating
sector is public administration, education and
community services.
• Manufacturing has a low share of 0.6 per cent,
while construction has a share of nearly 4 per cent
in 2004-05.
• Between 1993-94 and 2004-05, there has been a
marginal decline in the share of workers employed
in agriculture and increase is noticed in the share of
those employed in public administration and
construction.
• Overall employment growth was negative for all
workers and more significantly for the female
workers during 1993-94 to 1999-2000. However,
between 1999-2000 and 2004-05 employment
growth was positive for all categories of workers.
• The share of unemployed persons both in
population as well as in workforce had declined
between 1993-94 and 1999-2000, but increased
between 1999-2000 and 2004-05. Less than one per
cent of the labour force was unemployed in the
State. The low unemployment status might be a
reflection of the low level of commercialisation and
development of the economy.
• Unemployment rates are higher in the urban than
in the rural areas.
• Negative employment growth was observed during
1993-94 to 1999-2000 in sectors like agriculture,
electricity, gas and water supply, transport, finance
and business services, public administration,
education and community services.
• Between 1999-2000 and 2004-05, employment
hardly grew in manufacturing but it grew
substantially in electricity, gas and water supply,
trade, hotel, restaurant, transport and business
service and public administration.
• The Work Force Participation Rate (WFPR) in the
State declined between 1993-94 and 1999-2000 as
per the usual status employment for rural males.
Between 1999-2000 and 2004-05 it increased
consistently in rural and urban areas. However,
rural-urban difference still persists.
• Data from the employment exchange shows that
the number of unemployed people in the live
registration has crossed 26 thousand. NSS data
shows that between 1999-2000 and 2004-05, level
of unemployment among relatively better educated
declined.
• Till now the major chunk of employment generated,
outside agriculture sector, has been either in public
administration or sectors like construction, which
has strong linkages with government spending.
Expansion of employment opportunities in the
manufacturing sector has to be addressed with a
proper policy framework.
ARUNACHAL PRADESH DEVELOPMENT REPORT32
• The problem of youth and educated unemployment,
which exists along with shortages of skilled
manpower in specific sectors and occupations,
needs urgent attention, particularly because of its
potential role as a source of social destabilisation.
Policy Options
In the light of the employment situation in the State as
discussed above, the following options may be taken care
of:
• There is a tremendous scope for the expansion of
the rural non-farm occupations in the State.
Therefore, the State must come out with a rural
non-farm sector policy such that many youths can
take up the non-farm activities as their career
option.
• Some activities like manufacturing and petty trading
demand additional attention. Over the past decades,
partly as a result of the growing demonstration
effect of urban consumption patterns in the rural
areas, there has been a phenomenal growth of these
sectors in the rural areas.
• There is a clear case for special educational drives
for marginalised groups such as villagers in
inaccessible and border areas, traditionally
marginalised ethnic groups, migrant casual
labourers, tenants as well as those living in labour
camps.
Poverty and Inequality
• Poverty declined faster in Arunachal Pradesh than
in the rest of the country: between 1993-94 and
2004-05 the decline in poverty was 27.10
percentage points in the State and 8.34 percentage
points at the national level.
• Poverty in the State is largely a rural phenomenon.
Unlike in other tribal states, households living in
rural areas are more vulnerable to poverty, which is
mainly due to low productive jhum cultivation,
absence of labour, product and credit market, and
poor transport network.
• Arunachal Pradesh has higher normative calorie
requirements than the states in the plains.
• Paradoxically, poverty measured by Head Count
Ratio has declined but incidence of calorie
deficiency has increased in the State.
• Between 1993-94 and 2004-05, proportion of
calorie deficient households in the rural areas
remained stagnant around 64 per cent, whereas in
urban areas it has gone up by 20.75 percentage
points and stood at 47.50 per cent in 2004-05.
Policy Options
• Mismatch between Head Count Ratio of poverty
measurement and proportion of calorie deficient
households puts certain serious questions on the
methodology followed in estimation of poverty
particularly in the hilly states.
• Method of measurement of normative calorie
requirements of the hilly states must be reviewed.
• In the absence of price index for the hill of North-
east, Assam’s price index is used to compute the
poverty ratio which is not justifiable. Therefore,
effort should be made to construct separate price
indices for the smaller states such that poverty ratio
can be computed correctly.
Human Development
• The level of human development is low in the
State. Its rank in human development index (HDI)
is 14th among the 16 states of India of which 15 are
categorised as major states.
• East Siang with an HDI of 0.66 has the highest rank
among the old 13 districts of the State. East
Kameng has the lowest position in HDI. Dibang
Valley (old) occupies the second rank and Papum
Pare, the third in HDI.
• Health status, a dimension of human development,
varies widely in the State.
• Papum Pare’s expectancy of life at birth is
marginally above 60 years which is comparable with
the national average of 63.30 years but Kurung
Kumey’s life expectancy at 42.50 years is
comparable with that prevailing in Sub-Saharan
Africa, the region with the worst health status in
the world.
• In literacy, the rate of progress in the State is one of
the highest in the country. From almost a total
illiteracy in 1947, the State reached a literacy rate of
54.34 per cent in 2001 which is higher than that in
Bihar and Jharkhand.
• The spread of literacy is not even and there is high
inter-district variation.
Policy Measures
• All-out steps should be taken to expand the health
EXECUTIVE SUMMARY 33
services to the disadvantaged section of the
population—those living below poverty line and
those living in the far-flung areas of the State.
• Immunisation should be expanded to cover all the
children in the State.
• The expansion of educational institutes should
receive priority especially in the remote areas.
• Vocationalisation of education should receive
priority.
• Gender-sensitive measures such as gender-
budgeting and collection of development indicators
along gender lines should receive the attention of
the policymakers.
Potential Sectors for Development
Natural Resource Base
• Coal: Major workable coal resource is available in
Namchik-Namphuk coalfield with estimated
reserves of 84.23 million tonnes, spread over an
area of 35.5 sq km. Lack of good communication
and remoteness from the nearest railhead is the
main constraint of development of this coal field.
• Oil and natural gas: Available in Kumchai, Diyun
and Kharsang area in Changlang district. Here 13
exploratory wells have been completed and
exploratory work has been started.
• Limestone and dolomite: Major reserves are found
in Rupa (143 million tonnes), Tidding (140 million
tonnes), Pangin (225 million tonnes). Rupa mining
was started in the 1990s but was stopped owing to
various reasons. Considering the growing demand
of steel in the international market, the dolomite
deposits would also be of importance in near
future. Similarly, cement plant with a capacity of 30
tonnes/day at Tezu, which started its commercial
production in 1985 using limestone from Tidding,
was closed down within a decade.
• Graphite: Major reserves are found in Deed village
on Joram-Palin road (50 m thick), Bopi on Tamen-
Raga-Daporijo road (2.46 million tonnes), and
Lalpani (71 million tonnes) on Tezu-Hayuliang road.
• Other mineral resources: Lead and zinc, ferro
silicon minerals, clay, etc., are available. Building
materials like sand, boulder, marble, quartsite,
granite, etc., are also available in the State.
These are merely indicative of the availability of
mineral resources as the entire State has not been
surveyed thoroughly for the purpose. The existing data
reveals that only around less than 10 per cent of the total
geographical area is surveyed by the GSI.
Policy Options
• The existing data reveals that only around less than
10 per cent of the total geographical area is
surveyed by the GSI. Therefore, efforts should be
made to survey the entire State. Further, whatever
the survey that has been done so far, should be
made public.
• Since no economic feasibility study has been done
for most of the mineral reserves of the region,
specific studies need to be done.
• The abrupt stop of Rupa Dolomite mining was
mainly due to denial by the military, for the truck
movement at the night time. Therefore,
coordination with the military is a must for
exploitation of mineral resources in the region.
• Rangiya-Lakhimpur-Jonai railway line is the supply
line to the State. Therefore, in order to reduce the
transport cost, this railway line must be converted
into broad gauge in order to transport the mineral
resources of the State to the various industrial areas
in the country. It may be pointed out that
honourable Prime Minister of India announced its
conversion in to broad gauge on 31st January 2008.
• The State must come out with a clearly defined
mineral policy.
• Since the State is located in the seismic prone zone,
for sustainable development strict enforcement of
building code, geotechnical studies of building code
and hazards microzonation mapping should be
followed.
Forest Resourses
• Out of the total geographical area of 83,743 sq km,
forest area of the state is 51,540 sq km.
• The expected annual yield of timber is 74152.55
cubic metres, the annual yield of cane, bamboo and
resin are estimated to be 1,53,36,851 Rmt, 278,162
(no.) and 2,28,980 blazes.
• Different programmes like artificial plantation,
aided natural vegetation, social forestry, joint forest

ARUNACHAL PRADESH DEVELOPMENT REPORT34
management, apanaban, fuel wood plantation under
minimum need programme, minor forest
production are in operation in the State.
• Though the high power committee has cleared 115
forest-based industries in the State only 14 are in
operation.
Forestry Potential
• Bamboo: Total area under bamboo in the State is
1218.75 sq km and there is an additional potential
of raising 8000 sq km area. Therefore, bamboo-
based industries like paper mills is a potential area
of development.
• Cane: The area under cane has not yet been
estimated. Studies suggest that 18 different species
are available in the State. Keeping in view the
demand of cane in other parts of the country,
specific programmes need to be launched to
develop this sector.
• Medicinal plants: In the State around 500 species
of medicinal plants have been identified by different
agencies. For commercial exploitation the need of
an apex body like State Medicinal Plant Board is
urgently felt.
• Gums, resins, oils, and orchid: Chir pine resin,
dhuna, citronella, agar, orchids and other different
varieties of oil-yielding plants are abundantly
available in the State. Out of 600 species of orchids
150 species are commercially important. All these
forest products have not yet been fully exploited
due to limited infrastructure availability in the
State.
• Wildlife reserves: There are four elephant and two
tiger reserves in the State. These reserves can be
developed to attract tourists.
• Carbon financing: As per Kyoto Protocol, the State
has enormous potential to develop the forest sector
by participating in carbon financing scheme to
generate forests. The State has around 1404.13 sq
km of fallow land, cultivable waste land and area
not available for cultivation. Thus, the schemes
related to carbon financing can be taken up to
regenerate forest.
Constraints to Development of Forest Sector
• Poor infrastructure, inadequate resource and
manpower,
• Constraints related to different forest laws, and
• Poor awareness among the people related to
forestry.
Policy Options
• Increase in the investment in forestry sector.
• Scientific management of NTFPs like bamboo, cane,
medicinal plants, orchids, etc., and establishing
strategic market linkages with private sector.
• Strengthening protection mechanism and legal
framework.
• Conservation and development of wildlife and
biodiversity.
• Involving indigenous communities especially
women for conservation, protection and sustainable
development through JFM/local systems for
utilising the traditional wisdom and ethos of
conservation.
• Ensuring ways and means for sustainable utilisation
of forestry resources for poverty alleviation,
environmental stability and ecological security.
• Promoting eco-tourism.
• Initiation for carbon trading in the line of State’s
interest.
Land Use Potentials
• Arunachal Pradesh is a mountainous state covering
83,743 sq km. Part of Himalayas, the State has
more than two-third of its area above 1000 m and
about one-third area above 2000 m altitude.
• It has a very low proportion of plain area. Below 5°
slope, land including riverbed covers only 12,434 sq
km and about half of the geographic area is either
very steep or overhanging. Its typical geographic
set-up is responsible for the rain deficiency in the
western part and perhumid conditions in the east-
central part. Soils of the State are mostly shallow
and recently formed, and have low fertility.
• Land capability in the State is mostly of Class IV
type which puts severe limitations on the choice of
plants and requires special conservation practices.
Nature has posed a great deal of hardship to the
people of the State for pursuing any viable
economic activity.
These constraints may be overcome by this least
densely populated State through a careful understanding
of the geophysical parameters of altitude, slope, rainfall,
soil, vegetation cover through Normalised Difference

EXECUTIVE SUMMARY 35
Vegetation Index (NDVI), and agro climatic suitability of
different crops. Demand as well as production of cereals is
low in the State and there is also little scope for its
expansion owing to physical and agro climatic limitations.
Besides this, cultivation of cereal crops will accelerate soil
erosion as it needs tillage of soil and weeding on regular
basis. Economically, cereal cropping is not profitable as
yield is low on recently formed, argillaceous and less
fertile soils of Arunachal Pradesh.
Policy Options
• The strength of the State is its varied agro climatic
condition that is capable of producing a variety of
horticultural and plantation crops such as apple,
pear, orange, pineapple, kiwi, tuber crops like
ginger, turmeric and vegetables. Cash crops like
jute may be grown in perhumid areas of East Siang,
Lower Dibang Valley and Lohit.
• Commercial cropping particularly horticulture and
herbal medicine is still in infancy in the State.
Hence, the government needs to facilitate the
farmers with technical know-how and material
inputs so that they can grow high-valued crops
according to agro climatic suitability. Above all, a
network of market should be promoted through
non-governmental agencies with proper regulatory
system or directly by the government. Further, it is
possible only through developing the grower’s
cooperative and linking them with bulk purchasers
such that economy of scale is realised.
Sectoral Profile of Development
Rural Development
Provision of social and physical infrastructures is the
key to improving the quality of life of the people. In this
context the chapter has articulated the status of rural
development and suggested various policy options.
• In 1991 only 16.96 per cent of the villages in the
State had bus stop facility. Among the districts,
Upper Subansiri was the least and East Kameng the
most accessible.
• In 1997, 38.53 per cent of the villages in the State
were connected by roads. East Kameng had the
highest and Kurung Kumey the lowest connectivity.
In the rural areas of the State 46.51 per cent of the
population had access to pucca, 26.71 per cent to
kuccha road, and 26.56 per cent had no connectivity.
Kurung Kumey was the least accessible district
where 1.35 and 21.89 per cent of the population
had access to pucca and kuccha road, respectively.
• In 2001, 44.53 per cent of the rural households
were electrified. Papum Pare had the highest (77.19
per cent) and Lohit the lowest (22.85 per cent)
coverage of electricity.
• In 2001, 63.34 per cent of the rural households had
access to tap as the source of drinking water. In the
same year 73.93 per cent of the rural households
had no drainage facilities. However, it should be
mentioned that treated water is not supplied. Even
people in Itanagar city got treated water only three
years before. Therefore, the quality of water that
people consume is poor as 6.65 per cent of total
deaths in Arunachal Pradesh is due to water borne
diseases like dysentery, diarrhoea and gastro-
enteritis as compared to all India average of 2.41
per cent.
• Only 68.09 per cent of the children in the State had
access to immunisation in 2001-02. Kurung Kumey
has the highest IMR of 113. In the State, 48.38 per
cent of the habitations do not have primary
schooling facility within a radius of one kilometre.
Only 14.29 per cent of the allopathic medical
institutions are located in rural areas.
• In the State, 36.2 per cent of the rural households
own radio as compared to 31.5 per cent in rural
India. In telephone connectivity the State is at par
with national average as 9.2 per cent of Arunachal’s
households own telephone as compared to 9.1 per
cent in the country. Rural telephone connectivity is
lowest in East Kameng (0.96 per cent) in the State.
• Only 4.4 per cent of the rural households in the
State own motor cycles as compared to the national
average of 6.7 per cent. Lowest rate of television
used was observed in East Kameng (3.63 per cent)
and highest in rural Papum Pare.
• Among the North-eastern states, Arunachal Pradesh
occupies the first position in access to banking
facilities; 28.6 per cent of the rural people in the
State have bank accounts as compared to the
national average of 30.1 per cent.
• Deposit-GSDP, Credit-GSDP in the State are 49.7
and 19.6 per cent respectively, which are very low.
Thus, credit-deposit comes to 39.44 per cent in the
State. The low credit disbursement in the State is
mainly because of non-availability of collateral.

ARUNACHAL PRADESH DEVELOPMENT REPORT36
• Net sown area per ST household in the State is 1.87
hectare and Dibang Valley has the highest and
Tawang the lowest net sown area per ST household.
• An overwhelming majority of the people in the
remote areas depend on jhum cultivation and
supplement their income through hunting and
gathering activities. There is high potential of
terrace cultivation as 29.49 per cent of the land
comes under the low slope category (10-20 degree).
• Rural technology is at the extremely low level. In
the remote part people even do not have even
access to kerosene.
• Most of the rural development programmes in the
State lack coordination.
Policy Options
• Connectivity needs to be improved.
• Expansion of schooling and health facilities is a sine
qua non for promotion of inclusive growth.
• Mobile health services in the remote areas through
public-private initiatives may be explored.
• Community involvement in delivering the basic
services like health and education in Nagaland line
may be implemented.
• In order to diversify the livelihood options of the
people, marketing network needs to be expanded.
• Agricultural extension services need to be revamped
to popularise slope specific new crops.
• In order to expand the credit facilities, self help
groups need to be popularised and state specific
collateral in the form of community/clan as the
guarantor of loan may be explored.
• Traditional technical know-how is on the verge of
extinction and technology mission should upgrade
the exiting indigenous technology in a way that
becomes economically viable.
• Small scale food processing industries along with
cold storage facilities should be developed
particularly in the remote areas. This requires
electricity. In order to make electricity available in
the remote areas, the construction of mini-hydel
projects should be encouraged.
• Technology being the source of all dynamism and
progress, all-out efforts should be made to improve
rural technological configuration of production,
distribution, etc.
• Agricultural land is yet to be cadastrally surveyed.
In order to promote rural banking, it is essential
that all cultivable land should be cadastrally
surveyed and records of their ownership duly
prepared, so that land can be used as collateral for
loans from financial institutions.
• Expansion of the market including financial market
in rural areas requires strengthening of the
contract-enforcing mechanism.
Urban Development
• Arunachal Pradesh is a late starter in the
urbanisation process (in 1971 only) but within two
decades, it had overtaken Assam, which has a long
history of urbanisation. The level of urbanisation in
the State increased from 3.70 per cent in 1971 to
20.41 per cent in 2001. The growth rate of urban
population during 1991-2001 is around 100 per
cent.
• The process of urbanisation is not a result of
economic development rather it is a State-induced
one.
• One of the important features of the growth of
urban settlements in Arunachal Pradesh is the
dominant role of inter-state migration rather than
intra-state rural-urban migration.
• As per 2001 census, 89.42 per cent of the urban
households of the State were electrified which is
marginally ahead of the country with 89.14 per
cent. Papum Pare the most urbanised district, has
the highest (97.07 per cent) and Lohit has the
lowest (73.77 per cent) coverage of electricity.
• In telephone connectivity, the urabn areas of the
State are ahead of the country. For example, as high
as 26.5 per cent of all urban households in the
State have telephone connectivity as compared with
23 per cent in India. However, there are substantial
inter-district variations.
• In urban banking Arunachal Pradesh is far ahead of
the national average. As high as 67.0 per cent of the
urban households in the State have bank accounts
as compared with 49.5 per cent in urban India.
• In 2001, 89.42 per cent of the urban households
had access to tap as the source of drinking water
(which is of course not treated). In the same year
36.75 per cent of the urban household had no
drainage facilities.

EXECUTIVE SUMMARY 37
Policy Options
• Since Arunachal Pradesh is a hilly State with
different environmental and geomorphic
characteristics, it is suggested that instead of
population conglomerating in one or two large
towns, it is better to have more small and medium
towns in different districts of the State.
• The State falls under Zone-V of the seismic prone
areas with a high risk of earthquake and land slide.
The pressure on urban land has led to unscientific
method of building/designing which has got serious
environmental consequences.
• The other environmental issues associated with
urbanisation are poor urban waste management. It
is estimated that the total urban solid waste
accumulated is around 230 tonnes per day which is
too high to be managed by the present set-up
(Chapter 15). Although the amount may not be
alarming but it needs special attention for its proper
treatment and disposal.
• Since the current urban administration is not yet
well-structured, setting up the urban municipalities
is a must. It should be noted that Arunachal
Pradesh is the only state in North-east India which
does not have any municipality till date.
• Proper institutional safeguards must be given to the
urban informal workers as they constitute a
significant segment of the urban workers.
• It is necessary to constitute a District Planning
Committee in the State for rural-urban integrated
development.
Agriculture
• Agriculture contributes 27 per cent to the NSDP
and employs around 63 per cent of the total
workers in the State. However, a negative growth
rate is observed in the recent years in agriculture
sector.
• Positive points observed in the agriculture sector
are: (i) net area sown is increasing, and (ii) area
under permanent cultivation is increasing and under
shifting cultivation declining.
• The weak points are: (i) low availability of
permanently cultivable land, (ii) increasing
marginalisation of land holding, (iii) yield growth
rate is not satisfactory, (iv) percentage of area under
HYV seeds has remained constant (around 26.76
per cent), (v) institutional credit access of the
farmers is very low (10 per cent), (vi) ill-defined
property rights, and (vii) poor marketing network
for the agricultural products.
On the basis of the above trends the following policy
measures are suggested:
• Early completion of cadastral survey and evolving of
an institutional mechanism to monitor and control
land alienation through land reform laws.
• Development of a transparent, equitable and well-
defined system of property rights over land.
• Development of location specific farming
technologies.
• Creation of marketing network.
• Land lease policy in agriculture should be brought
out by the government.
• Composite package which includes supply of high
yielding varieties of seeds and seedling, supply of
credit, and insurance to cover risk. Buy-back
arrangement in the short-run and setting of
processing units in the long-run should be the
priorities of the government.
• Since economic surplus of the farmers in the State
is very small, farmers cooperative should be
encouraged such that they can be linked with bulk
purchasers to reap the benefit of scale.
• Establishment of an effective data collection,
processing and dissemination agency.
Indigenous Industries
• The State has high potentials in indigenous
industrial activities as they are intrinsically linked to
the culture of different tribal groups. Therefore,
there is a need of identification and promotion of
these activities.
• Promotion of agro processing industries.
• This sector suffers from different constraints like
lack of raw materials, credit and marketing.
• There is no formal institutional set-up to address
their problems.
• In the line of village and khadi industries, a State-
level Indigenous Industries Commission may be set
up to address their problems.
Resource-based Industries
• The important characteristics of the resource-based
industries are that backward linkage is low and
ARUNACHAL PRADESH DEVELOPMENT REPORT38
forward linkage is located outside the State. The
share of manufacturing in the State income is very
low.
• In the early 1990s and 1980s, whatever industries
that were there in the State were mainly forest-
based. Due to Supreme Court’s restriction on
commercial timbering in the mid 1990s many
existing forest-based industries were closed.
• At present most of the industrial activities are
concentrated in the district of Papum Pare where
the State capital is located. These industries are of
small scale type.
Policy Options
• Development of large industries with strong mutual
inter-linkage should be planned. Simultaneous
development of industries with mutual inter-linkage
will take care of the marketing constraint to a good
extent. There will be gains in terms of cost
reduction which in turn will improve viability of
industrial projects.
• The plan for expansion of road network should take
into account the industrial development plan along
with the proposed locations of industrial units.
Resulting improvement of connectivity will further
brighten the viability of industrialisation
programme.
• In view of ambiguity of land ownership,
government will have to play a pro-active role in
making land available for setting up of industries.
Long term leasing of land should be arranged if
outright purchase is not possible.
• Local entrepreneur should be supported to
participate in developing ancillary and downstream
industries. This will prepare a class of local
entrepreneurs to carry forward the industrialisation
process.
• Industrial workers including managerial and
technical personnel may have to be brought from
outside at least in the initial years. They should be
given proper work permits which should clearly
state the extent of their rights. To attract the best
of talent they should enjoy all civil rights. But to
avoid apprehension of indigenous communities of
being outnumbered and overwhelmed, the right to
acquire landed property should not be extended to
the permit holders.
• Above all, the industrialisation process of the State
should be environment-friendly.
Environment
The State is endowed with abundant forest, mineral
and water resources. The main concerns on environment
are: (i) intensification of agricultural practices, (ii) low
level of sanitation facilities, (iii) unplanned urbanisation,
vehicular growth and urban waste generation. Indoor
environment in rural areas poses threat to people’s health
as they continue to use traditional fuels for cooking.
• Inadequate sewerage network and improper
sanitation facilities lead to environmental
degradation.
• Though the vehicular density is low (37 as
compared to 53 at the national average), vehicular
air pollution is expected to become a big concern.
• Urban solid waste generation is quite significant (12
tonnes per day in Itanagar only). Health care waste
contributes around 5.58 per cent to the urban
waste.
• Jhuming is the main cause of soil erosion. The
erosion rate is 91 tonnes per hectare per year in the
State.
• Central Pollution Control Board has not found a
single polluting industry in the State since the
industrial base of the State is weak.
• Data on water quality of most of the rivers in the
State is not available. However the Brahmaputra that
traverses through the State has been reported to
exceed the accepted bacteriological level. This is an
indication of the quality of river water of the State.
• The dominance of fuel wood as cooking fuel (87 per
cent in 2001) has implications for indoor
environment and health condition of women and
children.
Policy Options
• Enforcement of different environmental laws is
constrained by scarcity of skilled manpower.
Therefore, financial, technical and skilled manpower
requirements of the enforcement agencies need to
be taken care of.
• Proper policies need to be formulated to phase out
old polluting vehicles, and inspection and
maintenance of vehicles on road.
• Policies are needed to ensure management of
urban, industrial and health care wastes. Here the
involvement of private entrepreneurs and NGOs
should be encouraged.

EXECUTIVE SUMMARY 39
Border Trade
• The State has borders with three countries mainly
Bhutan, China and Myanmar with a total
international boundary of 1628 km.
• From time immemorial informal trade has been
taking place through different passes.
• The products that are identified where the State has
the export potential are coffee, floriculture
products, fresh fruits and vegetables, spices, tea and
handicraft products.
• Different fruits like apple, orange, pineapple,
banana, kiwi etc., are produced in the State.
• The State has identified more than 500 herbal
medicinal plants and other aromatic plants like
citronella, lemon-grass, vanilla, patchouli, agar, etc.,
having high international demand.
• Identified 50,000 MW hydroelectric potential can be
a boon for the State. Considering the differential in
peak time demand of India and South East Asia,
there lies huge potential in power export to these
regions.
Policy Options
• The State can also play a major role in reducing the
transport cost for the goods exported from other
parts of India to China through sea route. This is
possible only after development of proper internal
transport communication network in: (a) Tezpur-
Bomdila-Bumla, (b) Lakhimpur-Daporijo-Naso,
(c) Jonai-Sadhiya-Mekha-Malvinil-Tajobum, and
(d) Sadhiya-Tezu-Chirangal-Kahoo sectors.
• Finally the Rangiya-Jonai train route should be
upgraded to broad gauge so that goods produced
from mainland India can be exported to China
through these trade routes.
Tourism
• There are eleven identified tourist spots in the
State, out of which Tawang, Bhimaskanagar and
Itanagar are historical tourist spots. Malinithan and
Parasuram Kund are pilgrimage tourist centres and
Bomdila, Dirang, Tipi, Along and Pasighat are
mountain resort tourist spots. Namdapha National
Park is an attractive destination for wildlife lovers.
Arunachal Pradesh with rich cultural tradition is a
wonderful destination for cultural tourists. So there
is enough scope for developing nature-based,
heritage, pilgrimage as well as cultural tourism in
the State.
• The constraints to attract tourists to these centres
are basically due to: (a) inadequate infrastructural
facilities, (b) institutional constraints, (c) limited
information, etc.
• A survey was undertaken to study the nature and
structure of tourist demand in relation to socio-
economic and demographic characteristics of
tourists survey. The survey results show the
existence of a market particularly for eco-tourism in
the State. The study emphasises the need to
organise more and more challenging adventures for
relatively youthful tourist population. This means
greater investment is needed for developing
adventure tourism.
Policy Options
• Tourism development will be more productive if it
is a part of North-east scenario. More specifically,
the circuits of North-eastern region may be divided
into different categories like pilgrimage, historical,
cultural, recreation, wildlife etc., and the identified
tourist spots of Arunachal Pradesh may be linked to
those circuits accordingly.
• Public-private partnership should be treated as an
essential ingredient of the policy for the
development of tourism in the State. At the same
time, the State government should also provide
road, land, water and electricity to private
entrepreneurs for constructing private hotels in
different tourist spots of the State.
• Air connectivity is a cost-intensive option but it
needs to be developed for promoting tourism. The
State government should also build other
infrastructural facilities for tourism like proper road,
tourist lodges and huts, properly managed
website, etc.
• The participation of local people should be
encouraged. The tourist destination has to be
developed in consonance with the local
communities. It may be possible to provide a
unique experience to tourists by building low cost
infrastructure in the villages (with proper hygiene,
sanitation facilities and electricity) in adjoining
district headquarters, by using local materials and
local design inputs.

ARUNACHAL PRADESH DEVELOPMENT REPORT40
• The simplifying of the entry formalities can lead to
more tourist arrivals throughout the year.
Therefore, steps may be taken to simplify the
procedure to obtain inner line permit at the entry
points.
Power Sector
• The chapter explores into policy options for
utilising the State’s power resources for stimulating
socio-economic transformation in the longer run.
• A review of the State’s power sector performance in
past couple of years has indicated a slower progress,
at least up to 2005. This is reflected in a smaller
and stagnant installed generation capacity, huge
untapped hydro-power potentials, low level of
power consumption, a sub-optimal equilibrium with
no visible energy deficit, high and growing
dependence on the central sector generating
stations, grossly underdeveloped transmission and
distribution (T&D) networks, and alarmingly high
aggregate technical and commercial losses (AT&C).
Severe resource constraints, difficult topographical
characteristics and high levels of inefficiencies are
among the main reasons behind such a scenario.
• Even the progress made towards rural electrification
could not produce the desired fruits due to lack of
necessary distribution infrastructure. Some
initiatives towards it are, however, planned under
the RGGVY.
• The sector witnessed significant developments,
especially for exploiting its immense hydro-
potential, in recent past in the background of new
policies like Small Hydro Power Policy 2007.
• Many private entrepreneurs have shown interest in
the State’s power sector. They, along with the
Central power utilities, have concluded MoAs to
develop as much as 25,722 MW accounting for 42.2
per cent of the total identified potential of the State.
Still, more than half of the potential would remain
unexploited.
• Even the Centre has been highly generous in
supporting the State’s efforts, as reflected in the
recent ‘Prime Minister’s Economic Package’, as also
in the rising activities of Central power utilities in
the State.
• All these could enable the State to emerge as a
power house of the country in near future and, in
the process, earn large resources through selling of
power to other states of the country.
Suggested Policy Options
• In the process of developing power resources, a
suitable model balancing local aspirations/concerns
and revenue considerations need to be evolved.
Without this, people’s support for the sectoral
initiatives may not be forthcoming and, hence, the
desired socio-economic transformation may not be
achieved. Therefore, mega project should be done in
such a way that it does not require much
resettlement of people and the environment is least
affected.
• Towards this, while the mega projects may be
developed taking mainly revenue consideration into
account, various decentralised generation options
based on alternative technologies, inclusive of solar
and biomass, could be used for meeting local
demand. Further, the mega hydro projects could
have a built-in arrangement for supplying power
locally to the nearby areas at a minimum T&D cost.
• A high priority should be accorded to development
of T&D networks including the intra-state grid.
Without this, the power could neither be evacuated
to the load centres outside the State for earning
revenue nor could it be supplied to the local
population meeting their needs. But, this is a highly
challenging task given the difficult local terrain and
hence, the Centre has to play a pivotal role in it.
• Since T&D is costly in the state, micro project
should be given top priority.
• The financial requirement for the sectoral
development being quite high, the State should tap
all possible sources inclusive of central agencies,
financial institutions, private developers as well as
its own resources.
• The Department of Power should aim at generating
internal resources through reducing inefficiencies.
Towards this, metering at all levels must be
prioritised.
• The State government should introduce power
sector reforms, as committed under the MoA with
the Ministry of Power in July 2002, at the earliest.
This could begin with setting up of a State
Electricity Regulatory Commission.
Transport and Infrastructural Development
• Arunachal Pradesh has the lowest road development
index in the country.
• The road density in the State is 18 km per 100 sq

EXECUTIVE SUMMARY 41
km of area as against the national average of 75 km
and North-eastern regional average of 52 km.
• The rural connectivity is low: out of 3,599 villages
in the State only 1407 (40 per cent of the total) has
road connectivity.
• The length of national highways in Arunachal
Pradesh is only 392 km which is second lowest
among all North-eastern states.
• The rate of growth of national highway and other
roads is very low, as compared with that of some
other states in the North-east.
• The State faces severe problems in road
development: hilly terrains susceptible to erosion,
seismologically active zone, dense forest cover,
heavy rainfall, etc.
• In order to speed up the development of roads the
Government of India has initiated the Special
Accelerated Road Development Programme in
North-East India (SARDP-NE). Arunachal Pradesh
received more than Rs. 500 crore for improvement
of roads.
• Connecting the villages is a priority of the
Government of India which has launched the
Pradhan Mantri Gram Sadak Yojana (PMGSY) in
order to expedite the process. The State has
completed 356.84 km of roads under this
programme. A ‘Four Year Business Plan for Rural
Connectivity’ under Bharat Nirman (2005-2009)
aims to bring connectivity of 2119 km for 298
habitations in the State.
• The number of vehicles registered during 1999-
2000 was 3586, which rose by 55 per cent to 5703
(excluding Dibang Valley) during 2003-04. By the
end of 2002-03, the number of vehicles including
two wheelers was 21,144 in the State.
• The rate of increase of vehicles being much higher
than the road development, there has been a sharp
rise in the fatal vehicular accidents in the State.
• In order to ensure road safety, the State has set up
State Road Safety Council and District Road Safety
Councils.
• The services extended by the State transport
department being not adequate, the private sector
has assumed increasing importance in recent years.
Apart from bus services, the private operators run
vans, tata sumos, auto rickshaws, etc.
• Tele-density in the State is high as compared with
the national average. In recent years the internet
services have grown rapidly in the State. In terms of
internet growth, Arunachal Pradesh occupies in the
North-east the third position after Nagaland and
Meghalaya.
Policy Options
• In case of high cost of road construction especially
in the steep hills, ropeways may be a viable
alternative. In the riverine plains waterways may be
the cheapest mode of transport.
• Air connectivity demands priority in view of the
high tourism potentiality in the State. Apart from
this the remote rural areas where road connectivity
is a problem, air connectivity may be explored as an
alternative. The recent announcement by the
honourable Prime Minister to build airstrips at
different places will be a boost to the State.
• Though postal services have improved in the State
in recent years, its rural coverage remains as low as
before. Still telegraphic facilities are not provided by
the post offices.
• Postal services should be strengthened in the rural
areas where, in the absence of banks, the post
offices can encourage the savings of the rural people
with little means.
• Postal services can be improved, only by
augmenting transport and telecommunication
services.
Science and Technology
Arunachal Pradesh is lagging in science and technology
(S&T) which is the vital input for a steady improvement
of the quality of life of the people especially of those who
are suffering from various deprivations. This chapter
identifies the main areas where a big thrust is necessary
for a rapid development of S&T in the State. The priority
areas include information technology, biotechnology,
telemedicine, tele-education, bamboo technology,
medicinal plants, etc.
Arunachal Pradesh has established 55 CICs which are
engaged in disseminating information on agricultural
markets, government schemes, job opportunities, etc., but
this is not enough; more CICs should be established.
Information technology should be popularised by
education and training so that the people can take
advantage of e-banking, e-education, etc. In order to make

ARUNACHAL PRADESH DEVELOPMENT REPORT42
its patent compatible, traditional knowledge especially on
medicinal plants should be digitalised in the State by
establishing a ‘Traditional Knowledge Digital Library’
which is already operating in other parts of the country.
Apart from this, BPO or call centres and a centre for
bioinformatics should be established in order to generate
employment.
Policy Options
The sustainable use of rich bio-resources in the State
requires properly-planned biotechnological interventions
especially in the forms of collection and selection of elite
germplasm, application of plant tissue culture for mass
propagation of quality planting materials. Biotechnology
should be applied to develop high yielding varieties of
crops and bio-fertilisers, and it can be used to control
pests and diseases biologically. Biotechnology should also
be applied to the improvement of indigenous fruits,
vegetables and plantation crops. Much of the farming in
the State is organic, planned promotion of this method
and its certification can enable the farmers to produce
organic products which have an increasing international
market. For biodiesel production, potential of different
tree-borne oilseeds should be explored and jatropha
plantation may be taken up in wastelands in collaboration
with experienced parties.
With an incomparable reserve of orchids, aromatic and
medicinal plants, timber and non-timber tree species and
bamboos, the State should take up different projects
aimed at tissue culture and propagation of selected
orchids, medicinal plants and bamboo species which have
high market demand. A network of telemedicine should
be established in order to cover the people deprived of the
modern health services. There is a vast scope of expansion
of tele-education in the State. Tele-education should
include programme on health, nutrition, agriculture,
cottage industry, hazard mitigation, etc. Expansion of tele-
medicine and tele-education requires development of
infrastructural facilities, such as, health care centres,
electricity, computers, etc.
This chapter suggests the establishment of an institute
of science, technology and environment in the State to
carry out research and development for utilisation of the
immense natural resources, generate scientific manpower,
and provide scientific and technical inputs for industries.
Fiscal Issues
• Over time, non-developmental expenditure like
interest payment and pension has increased on an
average from 41.37 per cent to 50.32 per cent of
GSDP, during 1995-2000 to 2000-2004. There is
also a declining trend in developmental capital
expenditure particularly in the areas of agriculture,
industry and minerals, rural development, transport
and general economic services. Thus, capital
formation is declining in the State. The process has
resulted in falling revenue surplus and decreasing
developmental capital expenditure in the budget of
the government and the State is dependent on
borrowed fund to meet its increasing non-
developmental expenditure. The process has gone
to such an extent that the State is neither
sustainable nor solvent in public debt front. Thus,
the State is on a path of creating more jobs by
withdrawing itself from productive capital
investment. In a situation of low level of private
investment in the State, there is shrinkage in
productive capacity of the economy.
In the light of the above mentioned process, the SDR
has identified the potential sectors and the associated
constraints and suggested various policies options both in
the potential sectors and the process variables, so that a
sustained economic growth is achieved in future.
Fiscal Management
Over time developmental capital expenditure has gone
down and non-developmental revenue expenditure has
gone up in the State. Government expenditure is around
70 per cent of the GSDP and contribution of service sector
is more than 100 per cent to the growth of GSDP. There
is also a distortion, in the sense that non-infrastructure
categories service sector contributes around 70 per cent
and infrastructure categories around 30 per cent to the
growth of service sector. This is the reason why a proper
balance is required in expenditure priorities of the State.
Policy Options
• Capital expenditure in the sectors like agriculture,
industry and minerals, transport and general
economic service needs to be increased.
• Rising interest payment and pension are the main
reasons of the increase in non-developmental
expenditure. Therefore, low interest loan options
may be explored and alternatives like institutional
based pension reform may be introduced.
• Identification and redeployment of excess
employees is a must.
• All the steps must be taken to use borrowed fund
for developmental capital expenditure.

EXECUTIVE SUMMARY 43
• In order to increase the revenue receipts, steps may
be taken to revise land tax rate, revamping of land
revenue administration, revising of motor vehicle tax,
imposition of professional and urban property tax.
• Finally in the long run, with the increase in power
production of the State the power royalty would be
sufficient to meet the budgetary need of the State.
Strategy for Development
• The State has witnessed broad changes in the
strategies twice. First the strategy of gradualism in
development gave way to the strategy of rapid
development and integrationism after the Chinese
aggression in 1962.
• Government sponsored industrialisation was the
preferred strategy followed till the beginning of
1990s.
• Losses of the government-owned enterprise
changed the strategy: public-private partnership and
private initiatives are the backbone of the new
strategy.
• The new strategy must take into consideration the
fact of high transaction cost which keeps the
productivity of industrial capital low in the State.
• In Arunachal Pradesh’s economy 100 units of input
cannot produce 100 units of output. This means the
economy consumes more than what it can produce.
• The new strategy should aim at enhancing the
reduction of transaction costs which would enlarge
the productivity of the economy.
• Strengthening the contract-enforcing mechanism,
addressing the problems of inequality and
unemployment are the ways of reducing the
transaction costs.
• It is observed that the states that have properly
identified their potential and developed the
institutional back up have grown at a faster rate.
The example is Himachal Pradesh. In this context
the potential areas for Arunachal Pradesh are:
(i) power, (ii) biodiversity, (iii) tourism, and
(iv) horticulture. Therefore, developing proper
institutional set up like supply of inputs linking
with product marketing, and market friendly
infrastructure would yield benefits to the people.
• Speeding up the development of the hydro-electric
project, expansion of horticulture and plantation,
tourism and establishment of agro-industries in the
backward districts should be the priorities.
Over the period of time, Arunachal Pradesh has
undergone many types of changes. These transformations
can be conceptualised in three perspectives, namely
historical, social and economic. Thus, the objective of the
introductory chapter is to analyse all the changes in these
perspectives.
HISTORICAL TRANSFORMATION
Introduction
Arunachal Pradesh, the largest state in North-east
India, is home to 26 major tribes with a large number of
smaller sub-tribes or ethnic groups totalling around 100
who, by and large belong to the Indo-Mongoloid stock.
Arunachal Pradesh is sparsely settled with a population
of 10,97,968 and a density of 13 persons per sq km
(Census of India 2001). Earlier known as the North
Eastern Frontier Tracts and North East Frontier Agency
(NEFA), Arunachal Pradesh, was a terra incognita for the
historians till recent times. The paucity of written
documents, lack of script among most of the tribes of the
State, except of course among the Monpas (the Bodic
script), the Khamtis (Mon-Tai script), the Membas (Hikor
script) and the Khambas (Hingna script), and limited
exploration and excavation are the major bottlenecks to
understand the history and cultural transformation of the
ancient and medieval periods of the State. However, we
are fortunate to have British archival records, which are of
singular importance for the study of the history of the
State during the colonial period.
Prehistoric Scenario
The history of the State can be traced to the prehistoric
period (Dani, 1960). Scholars like Lubbock (1867), E.H.
Still (1870), John Anderson (1871), R.D. Banerjee (1924),
ARUN
ACH
AL PR
ADESH
J.P. Mills and J.H. Grace (1933-1935), Dani (1960), B.P.
Bopardikar (1972), T.C. Sharma (1980), A.A. Asraf
(1990) and others have thrown light on some aspects of
prehistoric culture of the State. A study of remains reveal
pre-Neolithic and Neolithic tools and their typology
indicates Arunachal Pradesh’s past link with Yunnan and
Szechwan in Neolithic phase (Chiang, 1942). E.C.
Worman (1947) and M. Wheeler (1959) have argued that
North-east India (including Arunachal Pradesh) served as
a corridor through which Neolithic tradition from Eastern
Asia entered India. The Neolithic assemblage of the area
may be compared with the late Bacosonian of Southeast
Asia, which reveals significant influence from Sichuan and
Yunnan (Sharma, 1990). In this connection, the history of
migration of Mongoloid population from the headwater of
Hwang-Ho and Yangtse-Kiang into Arunachal Pradesh and
other parts of North-east India could be attested by
archaeological evidence (Chatterjee, 1974). No direct
evidence of settlement and economy of the Neolithic
people are known. From the circumstantial evidence, it
can be inferred that shifting cultivation must have been
practised during the period. No structural remains are
found in any prehistoric site, which reveals that the
people lived in open field. This phase however witnessed
the production of handmade pottery. The Neolithic phase
of the State is approximately dated to 1500 B.C. (Sharma,
1991).
Early Historical Period and Cultural Interaction
Contrary to the general perception that the region was
isolated from the mainstream of Indian history, the people
of the area had trade and cultural interaction with the
people of Assam, Tibet, Myanmar (Burma) and other
parts of India, which can be verified from a number of
actual trade routes of medieval period (Ray, 2005). The
early Brahmanical literature mentions the Indo-Mongoloid
Chapter 1
Transformation
ARUNACHAL PRADESH DEVELOPMENT REPORT46
people living in the hills and valleys of Himalaya and Sub-
Himalaya north-eastern hills of India under a blanket term
Kirata (Barua, 1968), who are identified as the dwellers in
the eastern Himalaya and many of the north Assam tribes
(Chatterjee, 1974). The medieval texts of Assam,
specifically the Kalikapurana and the Yogini Tantra throw
light on pilgrimage centres like, Nadi Tirtha, Parsuram
Kunda, etc., located in the north-eastern part of the State.
The post-10th century witnessed the prevalence of
Brahmaputra culture in the foothills of the State, attested
by a number of Brahmanical remains. In this aspect, the
temple ruins at Malinithan, Tamresvari (Sadiya) and the
chain of forts at Bhishmaknagar, Rukmininagar, Tezu,
Itanagar, Bhalukpung with occasional discovery of
Brahmanical sculptural art, reveals the fact that during
this period, cultural interaction did take place between the
people of Brahmaputra valley and the people living in the
hills of Arunachal Pradesh. A medieval Assamese Vaisnava
text refers to some Mishmi Brahmanas, who were
probably tribal priests, influenced by the teachings of Neo-
Vaishnavism (Dutta Choudhury, 1978). It is not surprising,
as we have evidence to show that a few frontier tribes like
the Noctes and Tangsas, were influenced by the teachings
of Neo-Vaishnavism (Dutta, 1978).
The period also witnessed the establishment of a
number of Buddhist monuments including that of Tawang
monastery (17th century) in western and northern frontier,
revealing the cultural interaction with Tibet (Sarkar,
1980). Simultaneously, though of later period, one can
notice a number of Theravada Buddhist monuments of 18th
and 19th centuries, in Eastern Frontier of the State,
throwing light on Arunachal Pradesh’s contact with
Myanmar (Kondinya, 1985).
The foundation of Ahom kingdoms in early 13 th
century and their subsequent territorial expansion made
them closer with tribes of the North-East Frontier Tracts
(Gait, 1926). The Buranjis, both in Ahom and Assamese
language, provides valuable information on Ahom policy
towards Arunachal tribes. The Ahoms followed a policy of
conciliation backed by the display of force towards the hill
tribes. The Ahom king Pratap Singha (1603 AD) in this
context introduced the posa system, with regard to various
frontier tribes viz., a section of Bhutia, Aka, Nyishi, etc.
(Devi, 1968). The word posa means a collection or
subscription for a common purpose and when this term
was used to explain the payments made to the hill tribes,
it represents the subscription which was collected by the
villagers in order to meet the customary demands of the
hill people (Chakravorty, 1977). Mackenzie mentions that
each tribe knew the villages of the plains to which they
had to look for posa and they claimed to collect from their
allotted paiks (Mackenzie, 1884). A survey of the posa
refers to such things as garments of various description, a
few animals, iron products and salt. It is also argued that
the system created a class of paiks called Bahatiyas, who
were made to work for their hill masters and thus, a form
of slavery started in the hills (Barua, 1985). Those tribes
not offered posa, were either granted some cultivated
lands and fishing water along with paiks in the plains or
offered trading facilities with the plains on condition of
good behaviour and payment of annual tributes.
In pre-colonial period, social relations and economic
interdependence between the frontier hills and the
Brahmaputra valley existed. There were numerous passes
known as duars along the Himalayan foothills, through
which people of the State interacted with the plains
people. There were as many as 19 duars or passes existed
in the district of Durrang and Lakhimpur, which were
divided into three divisions—Charduar, Noduar and
Chaiduar (Mumtaza and Taher, 1997). These duars were
visited by Monpas, Sherdukpens, Nyishis, Akas and other
tribes. Reference to duars like Dijoo duar, Dulungmukh,
Likhabali and Murkongselek to the east of chaiduor were
used by tribes like Nyishis, Apatanis and Adis. The
territory visited by the Bhutias, Monpas and Sherdukpens
developed market centres, as they used to bring
merchandise from Tawang, West Kameng and even from
Tibet and Bhutan. References to market at Udalguri,
Mazbat and Doimara are important in this respect.
The locational pattern of trading centres, population
composition of catchment areas of these nodal centres and
physiography of the region indicate to the large distance
trade, which took place between hill tribes frontier region
or route zones. In this aspect, transfrontier trade with
Moguaung and Khamptilong region of Myanmar was
carried through the Khamtis and Singphos in eastern
frontier (Phukan, 2002). Similarly in the western frontier,
the Tibetan trade was carried through the land of
Sherdukpens and Monpa, who had socio-cultural link with
Tibet. A number of mountain passes are referred to in
medieval text and literature of British period (Barua,
1993; M’Cosh, 1937; and Dutta Choudhury, 1978).
The interactions of tribals of North-East Frontier with
the Ahom rulers, however, did not affect any resource
constraint for the tribes. The resources taken as tributes/
revenue under the posa system, were largely compensated
through administered trade resorted to by hill tribes,
practising various economic activities based on reciprocity
and redistribution. As human resource was of utmost
significance in the economies of hills as well as the plains,
47Chapter 1 •
TRANSFORMATION
domestic help and other servile institution continued. In
the ethnic frontier region, the institution of chieftainship
seems to have emerged clearly during this period.
The British came to Assam during the Anglo-Burmese
war of 1824-1826 and occupied it. The economic,
commercial as well as strategic and political interests of
the British in the hilly region shaped the trends and
pattern of colonial intervention. Beginning with the
measures for abolition of slavery, colonising the trade of
the region, the British established their political
paramountcy and colonial legitimacy in the region. The
British authorities adopted the posa of Ahoms but
modified and extended the posa system to suit colonial
priorities. Monetisation of posa was introduced, which
facilitated market trade (Ganguly, 1986). Through colonial
innovation in the posa system, the old ties between the
posa holders and their allotted paiks broke down, which
resulted in a cleavage in old-politico-economic ties.
Ganguly has rightly pointed out, “Annual system of
payments of sums of money in lieu of posa also injected
money into the tribal economy.” (Ganguly, ibid).
They established market trade at important nodal
centres of the plains which ultimately gave fillip to
indirect colonisation through trade. Attention in this
direction was paid to the route zones lying between the
Brahmaputra valley on the one hand and the highlands of
Tibet and Burma on the other. Old fairs of Ahom time at
Udalguri and Doimara were revived. A trade fair at Sadiya
was also started in 1867. Once these market centres grew
up under encouragement and patronage of the
government, the extractable surplus from the foothills and
the hills in the forms of forest products began to pour
into those markets. On the other hand, the finished goods
began to find their outlets into the frontier areas, causing
damage to the age-old cottage industries in the area. The
economic factors were primarily responsible for tribal
unrest in the North-East Frontier since abolition of
slavery, changes in the posa system, colonisation of trade
and coercive measures in the form of economic blockades,
which adversely affected the resource bases of different
tribes. Ultimately, the hillmen were tied to apron-stings of
the Raj and became subservient to its commercial and
imperial interests (Jha, 2002).
By the end of the 19th century Assam became a
promising centre for trade and industry. Tea, petroleum,
coal and rubber became flourishing industries. Elephant
catching and ivory attracted much attention. But the entire
prospective economy depended upon the capacity of the
colonial administration to maintain law and order in the
province which resulted in the Inner Line Regulation
being enacted by a Regulation in 1873 called “Regulation
for the peace and good government of certain districts of
the Eastern Frontier” (Bose, 1997). According to this act,
which was applicable to the districts of Kamrup, Darrang,
Nowgong, Sibsagar, Lakhimpur, Garo Hills, Khasi and
Jayantia Hills, Naga Hills, Cachar and Chittagong Hills, a
restriction line was laid down to regulate the interaction
between the tribes and the British subject in the plains
bordering the Hills. As a result, the inner line was
notified for the Lakhimpur district in 1875 and for
Darrang in 1876. This act provided the basis of
administration of justice in the frontier of Lakhimpur and
Darrang, inhibited by tribal communities. However, the
constitutional and administrative growth of Arunachal
Pradesh had its genesis in the Act No. XIV of 1874, also
known as the Scheduled District Act of 1874 (Luthra,
1971). The next stage of administrative growth can be
noticed in the Assam Frontier Tract Regulation of 1880 by
which the first Frontier Tract called Dibrugarh Frontier
Tract came into being in November 1882 and J.F.
Needham was appointed as the first Political Officer. After
the Anglo-Adi war of 1911-12, General Bower sent a
recommendation to the Government of India that the
Assam Frontier Tract should be divided into three
sections e.g.,1. Central Section 2. Eastern Section 3.
Western Section for effective administration, which was
subsequently accepted by the Government of India by a
notification of 1914. This notification promulgated that
the Assam Frontier Tract regulation would extent to the
hills inhabited or frequented by the Adis, Miris, Mishmis,
Singphos, Nagas, Khamtis, Bhutias, Akas and Nyishis, and
these hill areas were separated from the then Darrang and
Lakhimpur districts of Assam. Thus, the North-East
Frontier Tract came into existence consisting of three
administrative units such as, 1. The Central and Eastern
section 2. The Lakhimpur Frontier Tract 3. The Western
section in 1914. A contextual analysis of events from
1880 onwards shows that the British policies and
measures adopted in this frontier were guided by their
imperial and commercial interests beyond the frontiers,
Myanmar, Bhutan and Tibet and China—which culminated
in the Simla Conference of 1914.
With the passing of the Government of India Act of
1919, some changes in the nomenclature of the sections
of North East Frontier Tract were undertaken. Now
onwards, the Central and Eastern section were to be
known as the Sadiya Frontier Tract and the Western as
Balipara Frontier Tract. There was no change in the name
of Lakhimpur Frontier Tract. Under the provisions of the
Government of India Act 1935, the frontier tracts were
declared as ‘excluded areas’ and the government of Assam

ARUNACHAL PRADESH DEVELOPMENT REPORT48
was vested with wide discretion and authority in the
matters of administration of these areas. In 1937, J.P.
Mills was appointed as the secretary of tribal affairs to the
government of Assam. In 1943, a new Administrative
Tract called ‘The Tirap Frontier Tract’ was created by
taking certain portions of Lakhimpur Frontier Tract and
Sadiya Frontier Tract. In the same year N.K. Rustomji was
appointed as an advisor to the Governor of Assam to look
after the administration of North East Frontier Tract. In
1946, the administrative divisions of Balipara Frontier
Tract was bifurcated into Sela-Sub-Agency and Subansiri
area. Subsequently Sadiya Frontier Tract was divided into
Abor Hill Distrct and Mishmi Hill District.
The British relation of the frontier tracts was guided by
the policy what may be called in the word of Col. Henry
Hopkinson, the then Commissioner of Assam, ‘gold and
steel’. This means that they were to be conciliated by
granting ‘gold’ or cash payment in lieu of customary posa
of the Ahom regime, but when they declined to accept the
new terms of the new rulers, ‘steel’ that is to say, armed
force was to be employed to compel them to accept the
offer and conditions of the colonial ruler. As it is seen, till
1910, the British government followed a policy of ‘let
alone the tribes to themselves’. After 1910, beginning
with loose political control, direct control and
administration were imposed on the tribes, and their
territories were tagged to the province of Assam. Up to
the Second World War nothing substantial was done for
the development of the area which was clearly outlined by
the government of Assam in a letter to Government of
India in 1931.
In 1951, the plain portions of the Balipara Frontier
Tract, Tirap Frontier Tract, the Abor Hill District and the
Mishmi Hill District were transferred to the administrative
jurisdiction of Assam. The aforesaid area minus the
transferred plain portion of the frontier tract together with
Naga tribal area were thereafter renamed collectively as
the North-East Frontier Agency (NEFA) in 1954. It was
kept under Ministry of External Affairs. In 1954, NEFA
consisted of six divisions such as Kameng Division
(instead of Sela Sub Agency), Siang Division (Abor Hill
District), Subansiri Division (Balipara Frontier Tract),
Lohit Division (Mishmi Hill District), and Tirap Division
(Tirap Frontier Tract) and Tuensang Division (out of the
Naga Tribal Area). However in the year 1957, the
Tuensang Frontier division was excluded from NEFA and
merged with Naga Hills. The Government of India
followed a policy and programme of tribal development
which was given an ideological framework in the book A
Philosophy for NEFA. After 1962 Chinese aggression of
India, the Government of India tried to integrate the
administrative structure of the NEFA with the state of
Assam. The guidance and control of NEFA was
transferred from External Affairs Ministry to Home
Ministry on August 1, 1965. The Government of India set
up a committee for administrative reforms in NEFA under
the Chairmanship of Daying Ering and as per the
recommendation, the Panchayat Raj Regulation of 1967
was drawn up and promulgated on 2nd October 1969.
NEFA was constituted into a Union Territory in the name
of Arunachal Pradesh on 20th January 1972. The earlier
Agency Council was converted into a Pradesh Council to
serve as Provincial Legislature. Adult franchise was
introduced in Arunachal Pradesh in 1972. The first
election to the Parliament and Arunachal Pradesh
Legislature took place in 1977. And in 1987, Arunachal
Pradesh was granted full fledged statehood. Thus the
political evolution of Arunachal Pradesh was completed.
The Government of India with the cooperation of the
people of the State has attempted an uphill task of
planned and systematic development in spite of the
inaccessible terrain and age-old tradition of its people.
Development is now visible in political, economic,
education, social and cultural life of the people. The static
period of aloofness and isolation has yielded to a modern
period of dynamism which amounts to ‘shaking off the
dust and rust of ages’ for a brighter future of the people
of this kaleidoscopic land of the country. However extra
attention of all concerned is the need of the time for this
tribal State, affected by historical negligence for ages, to
bring it up at par with other states of the country.
SOCIAL TRANSFORMATION
Introduction
In the tribal social structures of Arunachal Pradesh, the
institution that stands out among all others is the
household. There are large measures of similarities in
certain aspects of social structure but there are also tribe-
specific distinctive elements. This distinctiveness has
come about as consequences of living in geographically
isolated habitats and pursuing different religions as well
as different economic activities. The search for viable
habitat ensuring a secure livelihood through hunting,
fishing, food gathering and cultivation made them move
from one place to another. The needs of shifting also
made them resilient enough to adapt their respective
lifestyles and institutions to the demand of nature. It is
the close interaction with nature, and the ability to adapt
and adjust that enabled different tribes to convert distinct
geographical spaces to social spaces. In these social spaces

49Chapter 1 •
TRANSFORMATION
arose in time distinctive social structures with
characteristic family, kinship, marriage institutions,
economic life, political organisation, and so on (Bhagabati,
1998). The traditional social structures underwent
changes in the post-Independence period with the new
politico-administrative configuration.
Agents of Change
In bringing about social changes multiple forces have
been working together, though their intensities vary from
one tribe to another. The overall social outcome in a tribe
is, however, determined by its relative access to
developmental programmes, exposure to forces of
modernisation, relative population size, geographical
location and finally its access to the power structure as
well as administration.
Democratic Institutions
• Numerically dominant tribes are playing a prime
role in the political sphere.
• Perhaps the most significant impact of changes is
traceable in the sphere of education. There were
only three schools and 50 students in 1947 but
with the initiatives of the government, the State has
witnessed a revolution in this field. Literacy
increased from 7.23 per cent (1961) to 54.73 per
cent (2001). This has far reaching implications in
terms of occupational mobility, traditional polity
and emerging social structure of the tribes.
• Emergence of a large number of non-government
organisations including literary and cultural
societies, association of the priests etc. All these
have important ramifications which reveal people’s
response to new possibilities and their growing
awareness about newer platforms to redress various
emerging issues.
• Emergence of modern secondary and tertiary sectors
has led to economic inequalities and along with
this, a new social stratification has taken shape.
Changing Traditional Village Economy
There is a significant change in terms of land tenure
system, which is steadily leading to individual ownership
by making collective ownership (clan, village, community
ownership) a marginal phenomenon. In urban or semi-
urban areas, land became a commodity for earning cash
and ‘brewing social conflicts’. In most of the places of
Arunachal Pradesh, adjacent to Assam, sharecropping has
made a deep root leading to a new agrarian relationship
(Eshi, 1998; Bejbarua, 2003; Das, 1995; Taidong, 2005).
Moreover, Government of Arunachal Pradesh has also
introduced a new agricultural policy.
• Some of the tribes/sub-tribes opted for a drastic
shift towards settled cultivation. Wherever possible
people went for massive terracing of earlier shifting
fields for a better productivity, looking for surplus
production. And even productions of shifting fields
are reaching steadily to local markets which is a
clear shift from the traditional notion of jhum
(Ganguly, 2004; Danda, 1994; Lollen, 2005) and
consumption norms of subsistence economy.
• Occupational mobility is very much evident with the
rapid spread of education, urbanisation and
expansion of induced developmental activities. All
these have collectively led to the development of
neo-rich class within the tribal societies making
roads for economic inequality in a much pervasive
way. This is more symptomatic among the
dominant tribes of this State.
• In recent times, some initiatives were taken by both
the Central and state governments to explore and
promote the potentialities of indigenous arts and
crafts looking at its prospects for income generating
employments. Some refinements in technological
inputs are clearly visible and even some valuable
innovative experiments are going on which can have
greater marketability even beyond the regional
frame.
• Existence of trade routes is a testimony to the
historical importance of trade among the tribes of
this Frontier State. In the present context a few
tribes are showing their traditional business acumen
and gearing up to avail new economic avenues.
Changing Socio-political Realities
The whole process of modernisation, greater
administrative penetration, developmental initiatives in
various forms, introduction of new political systems,
contesting religious ideologies along with changes in
economic sphere have a great impact on the traditional
social structure, social relationships, cultural traits and
value systems of the so-called segmental tribal societies of
this Frontier State.
• The politico-administrative conditions before 1947
were such that each tribal society, large or small,
maintained a sort of autonomous status in its
dealings with the world outside its defined social
boundary. For a tribal segment, with its essentially

ARUNACHAL PRADESH DEVELOPMENT REPORT50
kinship-based social structure, there was very little
scope or need to expand the network of social
relations involving other tribal segments in the
surrounding habitat, except for certain well-defined
trade and barter transactions.
• In recent times at broader levels some distinct trends
are visible where some larger tribes are trying to
subsume smaller tribes within their own fold,
whereas some tribes are trying to come out of larger
identity in search of their own identity. Considerable
fluidity which remains at the core of the formation of
expansive identity is also unique to underscore.
• All these processes are part of the politics of
numerical strength, which is gradually accentuated
within people’s psyche. On the other hand, there is
a gradual erosion of sense of collectivism at the
village as well as family level, which is considered
as one of the basic features of the social structure.
This is more in case of urban and semi-urban
centres and their fringe villages where neo-local
nuclear families are growing rapidly.
• Endogamy still represents their ideal form of
marriage but large numbers of inter-tribal marriages
are traceable. The government also encourages
inter-tribal marriage to promote larger tribal
solidarity though it has not yet gained wider social
sanction even among the educated and progressive
tribal families.
In the field of polity significant changes are noticeable.
Talukdar (2000) mentioned that for all practical purposes
the traditional self-governing institutions governed the
various tribal societies in the State till the 60s of the last
century when they got an opportunity to interact with a
central authority, external to the village or the tribe at the
political level. The introduction of the Panchayati Raj in
1969 and the creation of Arunachal Pradesh as a Union
Territory in 1972 provided this opportunity and they
together set into motion a process of change and
development in the society and governance in the State.
Talukdar (ibid) added, “The impact of the Panchayati Raj
was perceptible in the governance of the village and their
impact on the traditional institution, by bringing them
closure to a wider administration, bringing them face to
face with the larger society and opening up new
opportunities to the people and the tribal villages. The
creation of an integrated Arunachal society is giving rise
to new elements in governance in the form of modern
democratic institution, a representative state government
and electoral politics.”
It is true that emergence of State craft has brought an
end to frequent inter-and even intra-tribal blood feuds but
the new contesting political ideologies are gradually
disrupting the finer bonds of traditional polity by
loosening its secular structure nurtured and grown within
a patrilineal and patriarchal framework. With the
introduction of Gaon Bura system as well as Panchayati Raj
systems, the chieftainships of Wanchos, Noctes, etc., are
losing their ground though Kebang and such other
traditional polity did not lose their importance completely.
But politics of ‘vote bank’ reinstated significance of clan/
tribe/stratification or even religion in some parts of
Arunachal Pradesh.
Regarding the emerging leadership pattern in the
village, Talukdar (ibid) rightly mentioned, “It is
undergoing rapid transformation and the ascriptive factors
are no longer treated as the sole resources for village
leadership. The social base of the present leadership is
different from that of the traditional one and gradually
becoming broad-based. The Panchayat leaders unlike their
traditional counterpart are generally younger in age and
have formal education.”
Recently, the State Women Commission has been
formed by the government of Arunachal Pradesh, which is
the product of a long struggle of women across the tribes
largely under the banner of All Arunachal Pradesh
Women Welfare Society (APWWS). This has given some
hope for the women who in spite of their extensive
contribution to domestic and economic fronts (agriculture,
food gathering, cottage industries, etc.) are yet to have
any inheritance right over landed property which dilutes
the question of meaningful involvement of women in
development process (Chaudhuri, 2004). Participation of
women in decision-making processes or in state polity is
still very insignificant though they are performing well in
the field of higher education (44.24 per cent literacy rate
in 2001). However, there is growing gender sensitivity
even in remote areas of the State against child marriage,
polygamy, etc., where women remained the ultimate
victims to a large extent.
Contesting Religious Ideologies
Another significant social transformation is traceable in
the field of religion. Christianity is spreading very fast in all
tribal belts leaving Buddhists (both Therabeda and
Mahayana) and some other tribes who are least affected.
Introduction of such an alien belief system to some extent
led to disintegration of some of the very important
institutions like dormitories of the Wanchos and many of
the oral traditions which have sacred dimensions. In order
51Chapter 1 •
TRANSFORMATION
to counter conversion some NGOs became active under
different names. Under their patronage some reformist
movements have been taking place in the State.
• Such contesting religious ideologies created a new
space within the traditional social relationships.
And this is more significant in case of Christian,
non-Christian members of a family, clan or other
forms of segmental social formation. However,
community cohesiveness is still preserved to a large
extent though the finer threads of understanding at
the family, clan and village level are under strain to
some extent.
• Another significant development or extension of
‘sacred-secular’ continuum is the transformation of
village or family level ceremonies into community
level festivals. This has consolidated community
participation of otherwise scattered villagers who
are coming together and taking part in festivities.
Conclusions
Today tribal situation in Arunachal Pradesh has
changed to a considerable extent; whether it is economy,
polity, education, material or other elements of culture,
religious beliefs and practices. Changes are everywhere
which collectively made an impact on the traditional social
structures by reshaping social relationships and
negotiating with emerging wider socio-political realities.
Developmental initiatives in post-1962 phase have made
tremendous impact on the tribal societies in general who
are managing the State and trying to develop their own
human resources to uplift the overall economic condition
in order to bridge the gap of emerging economic
inequality of the heterogeneous tribes.
Naturally, the old social structures do not exist any
more in their pristine state. New elements have seeped
into the old patterns very rapidly; ‘slavery’ have given way
to more egalitarian types of social relations, polygyny as
an ideal is giving way to monogamy, and the position of
women is changing in most tribes. The essentially kin-
based societies with rigid lines of demarcations between
tribes is fast transforming to a regional society where new
lines of inter-tribal communication are emerging cutting
through former tribal boundaries.
ECONOMIC TRANSFORMATION
Introduction
Douglas North (1994) defined institutions as ‘rules of
the game’—both formal and informal (norms,
conventions, code of conduct), and organisation and their
entrepreneurs as ‘players’. The informal institutions are
basically conventions and code of conduct defined by the
society. The changes in the economy have an impact on
the traditional institutions also. The changes in the
production and consumption structure and in the
distribution of income are normally accompanied with
changes in the institutional set-up. Thus, the outcome
variable is the change in the institutional structure and
the process variable is the change in the nature of
production and consumption structure which the society
had practised since long. Thus, the forces behind the
institutional transformation come from the economy itself.
The framework of this section is based on the above
understanding—that the institutional transformation takes
place because of change in the taste and preference of the
society. The change in the production structure can be
analysed in terms of the growth dynamics of the NSDP
(explained in Chapter 3) which affects the consumption
pattern (as a proxy variable to explain the taste and
preference). Thus, outcome variable is the change in the
nature of the institutional set-up and the process variable
is the change in production and consumption pattern.
Changing Consumption Structure
One special characteristic of the North-east hill
economy is that, per capita consumption expenditure is
higher than the national average (Table 1.1). In all the
states the increase in per capita consumption expenditure
during 1993-94 and 1999-2000 is higher than the national
average. However, the exception is urban Arunachal
Pradesh. When the division is made between the food and
non-food consumption, the percentage share of food item
is less, and non-food item is more than the national
average in Arunachal Pradesh (Table 1.2).
TABLE 1.1
Per Capita Consumption Expenditure(Inflation and Inequality Adjusted)
(in Rupees)
1993-94 1999-2000
Rural Urban Combined Rural Urban Combined
Arunachal 94.02 164.47 104.71 123.42 153.35 129.38Pradesh
Manipur 108.02 124.19 112.89 116.97 157.27 130.88
Meghalaya 110.28 185.27 124.55 128.99 219.10 145.65
Mizoram 137.88 208.36 174.47 157.64 228.69 202.99
Nagaland 158.43 188.51 164.15 213.98 279.52 228.04
All India 87.90 124.27 97.53 98.49 143.49 111.28
Source: National HDR 2001.

ARUNACHAL PRADESH DEVELOPMENT REPORT52
TABLE 1.2
Composition of Per Capita Consumption Expenditure
1993-94 1999-2000 1993-94 1999-2000(Rural) (Rural) (Urban) (Urban)
Food Non- Food Non- Food Non- Food Non-food food food food
Arunachal 61.63 38.37 55.06 44.04 60.82 39.18 57.65 42.35Pradesh
Manipur 67.48 32.58 63.12 36.88 63.82 36.18 56.04 43.06
Meghalaya 60.83 39.18 60.44 39.56 56.38 43.62 47.02 52.98
Mizoram 61.24 38.76 59.36 40.64 54.14 45.86 52.04 47.96
Nagaland 64.99 35.01 58.93 41.07 58.85 41.15 57.64 52.36
All India 63.18 36.82 59.41 40.59 54.65 45.35 48.06 51.94
Source: National HDR 2001.
In the rural areas, the share of non-food expenditure
recorded an increment of six percentage points whereas in
urban areas the increase was only three percentage points.
This suggests that non-food expenditure is gaining
importance in the consumption basket of the rural
population in Arunachal Pradesh. It is also more than their
urban counterpart. Thus, the rural consumption pattern is
changing fast as compared to the national average.
Changing Employment Structure
The changing consumption structure is also
accompanied by changing employment structure. The
process is observed in all states of North-east. Table 1.3
gives the detail. A declining share of employment in
agriculture in the rural areas and an increasing share of
agriculture in urban areas is observed. This particular
trend reveals that dependency on agriculture is fast
reducing and importance of non-agriculture is fast
increasing in rural areas. This phenomenon bears the
testimony of the changing institutional set-up, which
revolves around agriculture sector in many parts of North-
east India. Arunachal Pradesh is not the exception.
Thus, the importance of non-food items has increased
and share of non-agricultural employment in rural areas
has increased. The process has led to an increase in
demand for money. The logic is that only 16.6 per cent of
the population have access to cash income as they are
employed in non-agriculture activities. Since agriculture is
at a subsistence level and the marketable surplus is very
limited, a strong demand for money income has resulted
in high rural-urban migration. (Even if there is marketable
surplus, people cannot sell the surplus because of poor
marketing network.) Thus in the hilly rural economy, due
to low technological change and limited existence of
market in the agricultural sector, people are compelled to
search for high productive jobs, from where they receive
money income. Therefore, high demand for money income
has led to many changes in their traditional economic
institutions as follows.
TABLE 1.3
Employment (Principal and Subsidiary Status) (per 1000)
Arunachal Arunachal Arunachal Assam Assam AssamAgriculture Industry Service Agriculture Industry Service
Rural 1993-94 864 17 116 792 40 168
Rural 1999-2000 834 31 134 677 44 280
Change -30 14 18 -115 4 112Rural
Urban 1993-94 79 169 750 30 171 799
Urban 1999-2000 87 22 891 60 83 857
Change 8 -147 141 30 -88 58Urban
Manipur Manipur Manipur Meghalaya MeghalayaMeghalayaAgriculture Industry Service Agriculture Industry Service
Rural 1993-94 638 127 234 860 18 123
Rural 1999-2000 753 80 167 865 14 121
Change 115 -47 -67 5 -4 -2Rural
Urban 1993-94 293 155 549 30 28 936
Urban 1999-2000 283 114 601 13 41 947
Change -10 -41 52 -17 13 11Urban
Mizoram Mizoram Mizoram Nagaland Nagaland NagalandAgriculture Industry Service Agriculture Industry Service
Rural 1993-94 889 6 104 749 12 240
Rural 1999-2000 855 13 133 797 14 189
Change -34 7 29 48 2 -51Rural
Urban 1993-94 410 49 541 62 50 887
Urban 1999-2000 303 53 644 84 69 847
Change -107 4 103 22 19 -40Urban
Tripura Tripura Tripura India India IndiaAgriculture Industry Service Agriculture Industry Service
Rural 1993-94 476 56 464 784 78 138
Rural 1999-2000 457 40 503 763 81 157
Change -19 -16 39 -21 3 19Rural
Urban 1993-94 60 97 838 123 258 618
Urban 1999-2000 27 39 934 88 242 672
Change -33 -58 96 -35 -16 54Urban
Source: National Sample Survey, 50th and 55th Round.
Land and Forest
In the early period, the community jointly owned the
land. The members of the community shared the output
produced and hardly anything was left for the market.

53Chapter 1 •
TRANSFORMATION
Timber was the only product, where a market existed
before the Supreme Court restriction on tree felling.
When the resource system was jointly owned, the forest
product (timber) could not be sold. The cash need of the
population, has forced the emergence of individual
ownership of the resources—both land and forest. Thus,
in many parts of Arunachal Pradesh, individual
ownership has gained momentum at the cost of
community-based ownership.
The form of individual ownership has certain features
as follows (Roy 2005, p.29).
a. Land is not alienable to the non-tribals.
b. Land can usually be sold to the people belonging to
same tribe; there is a limitation in the transfer of
land from people belonging to one tribe to people
belonging to the other tribes. Inter-tribal transfer of
land is found, of course, in the urban areas and
rarely in the semi-urban areas. In the rural areas it
is not normally found.
c. The cadastral survey having not been conducted,
there is no title deed to the land owned by an
individual. In the absence of documentary evidence
land cannot be used as collateral for bank loans.
This has limited the provision of the bank loans to
the farmers. In recent years the government of
Arunachal Pradesh has started issuing land
possession certificates. But the problem of
disbursing bank loans based on land as collateral
still remains. The non-alienability of land drastically
reduces its collateral value to the banks.
d. Land as property is still highly encumbered. It
cannot be freely willed away. The inheritance of
land is more or less guided by traditional practices
which prefer a particular order of sons, too often,
the eldest one, to others. Daughters normally do
not inherit the paternal landed property.
Rental Market
The individual ownership of land has also resulted in
rental market (Roy, ibid). Land is leased out to others for
cultivation. The rental market is also prevalent in
business. The trading license holder charges a fixed rent
and lends it out to migrants. The arrangement is such that
the local people own the fixed capital and the migrants
own the variable capital. This type of ownership operation
has tended to reduce the time span of business planning
and the end result is a tendency to reap short-term
benefits from the business (Roy, ibid).
Labour
The process of modernisation has also generated the
demand of labour. Perhaps this is the reason why in-
migration rate to the state is 15.54 per cent in 2001
(Sarma and Nayak, 2006). Before the transition, labour
was also community based. No money wage was paid and
all payments were in kind. Thus, labour market was
absent. Still today, in the remote parts of Arunachal
Pradesh, daily wage labourers from tribal areas of Orissa
and Jharkhand are engaged in road construction.1 One
contrast is also observed: the local people are also
engaged by the PWD department as daily wage labourers.2
Thus demand for cash need has brought the labour
market to operate and the transformation of labour
institution from being community-based to market-based
is quite rampant, both in urban and remote rural areas of
Arunachal Pradesh. Thus, the labourers brought from
other parts of the country have led to the evolution of
modern labour market in the State (Roy, 2005).
Credit Market
The process of transition and the need for money has
also resulted in emergence of the credit market in the
State. In the traditional society, the informal credit in kind
(food item), was used to be given at the time of crop
failure to the people by the village chief in some parts of
the State. The repayment system was in the form of
labour. In some cases Mithun and cow were given in credit
and no interest was charged at the time of repayment.3
With the increase in cash need of the people (particularly
for medical and contract works), informal credit market
has emerged in many areas including interior region of
the State. Thus, credit need has increased and modern
credit market has failed to enter owing to collateral
problem, which has resulted in market failure in the
formal credit market. Thus, increased cash need of the
people on the one hand and failure of the formal
institutions on the other has led to the growth of informal
credit market in the State.
1. This observation was made during the field work for the preparation of Human Development Report of Arunachal Pradesh.
2. Ibid.
3. Personal discussion with Dr. Pura Tado, Reader in the department of Political Science, Rajiv Gandhi University, Itanagar.

ARUNACHAL PRADESH DEVELOPMENT REPORT54
Conclusion
In a nutshell it may be argued that subsistence nature
of farming coupled with modern consumption structure is
the driving force behind the changing economic
institutions in Arunachal Pradesh. The rural-urban
migration, due to pull factors in the State, has led to a
substantial increase in employment in service sector.
Further due to decline in the industrial urban employment
they are forced to enter in urban agriculture sector where
land market has emerged. Thus, the process of
modernisation has led to the transformation of the
traditional economic institutions in the State.

Introduction
The relationship between demographic and socio-
economic variables is so strong that any change in the
socio-economic space is reflected in the demographic
space. This relationship is, however, not characterised by
a one-way causation from the socio-economic space to
the demographic space. There is a mutual causation. A
demographic configuration is the realisation of a
particular level of the socio-economic variables, but the
demographic outcome is also a potent factor in the
determination of the socio-economic outcome. Given a
highly complex relation spanning the demographic and
socio-economic variables, it is difficult to work out the
relationship in both ways. So, focus is kept narrow to
show how the process of development in Arunachal
Pradesh has produced the main demographic outcomes:
changes in fertility, mortality and migration. The main
topics covered in this chapter are: (1) size and density of
population, (2) distribution of population,
(3) composition of population, (4) migration, and
(5) population growth.
Size and Density of Population
Arunachal Pradesh has a small population: only 10.98
lakh (according to 2001 census) which is 0.107 per cent
of the country’s population of 1.03 billion. In North-east
India (excluding Sikkim which has a population of 5.40
lakh) only Mizoram’s population (8.91 lakh) is smaller
than Arunachal Pradesh’s. With a hilly and mountainous
topography, the State has a very sparse settlement, so
sparse that its density of population is lowest in the
country. According to 2001 census, the population density
in Arunachal Pradesh is only 13 people per sq km against
the country’s 325.
ARUN
ACH
AL PR
ADESH
With a high growth of population, the density has
increased in the State over time (Table 2.1), but the
expanding population has not spread evenly. It is the river
valleys and urban areas which have got the highest
concentration of population. The remote areas of the State
remain more or less as thinly-populated as before. It may
be pointed out that the first population census was
conducted in the State in 1961. Prior to 1961, the
administrative infrastructure was too inadequate to conduct
census in the State. In the absence of census and other
evidence it is not possible to quantify the State’s population
prior to 1961. However, a backward projection gives us a
population of 2.68 lakh and a density of 3 people per sq
km in 1947. Population increased to 3.36 lakh and its
density to 4 people per sq km in 1961. In the subsequent
decades population grew rapidly, in each decade on an
average 1.90 lakh people were added to the State and the
decadal increase of density was around 2 people per sq km.
TABLE 2.1
Density of Population: Arunachal Pradeshvis-a-vis the Country
Year Population Density of Population Arunachal Populationas Per cent of
Indian PopulationArunachal Pradesh India
1961 3,36,558 4 142 0.077
1971 4,67,511 6 177 0.085
1981 6,31,839 8 216 0.092
1991 8,64,558 10 267 0.102
2001 10,97,968 13 325 0.107
Note: (i) Population size refers to 1st March, the day of census in all yearsexcept for 1971 in which year the census was conducted on 1stApril.
(ii) The population of Arunachal Pradesh is estimated to have been2.68 lakh at the time of Independence against the country's 34.54crore.
Source: Different Population Censuses of Arunachal Pradesh and India.
Chapter 2
Demographic Transition

ARUNACHAL PRADESH DEVELOPMENT REPORT56
Distribution of Population
Arunachal Pradesh has a highly uneven distribution of
population. The plains which constitute only five per cent
of the area of the State have a relatively dense settlement.
We would discuss two aspects of distribution of
population: inter-district and rural-urban.
Inter-district Distribution
Some districts of Arunachal Pradesh have large areas.
As many as 10 districts of this State are larger in area
than Goa, the smallest State in the country and five
districts are bigger in area than Sikkim, the smallest State
in North-east India. In terms of population among the 16
districts, Changlang is the largest and Dibang Valley the
smallest (Annexure Table A-2.1). Dibang Valley (new)
has the smallest density. Kurung Kumey and Upper Siang
have also a low density. There are seven districts whose
density is lower than the State’s density of 13. The
districts with a density lower than the State’s average
cover 50.73 per cent area of the State but only 24.00 per
cent of its population. There are eight districts with a
density higher than the State’s average. These districts
cover 35.65 per cent of the State’s area but as high as
62.92 per cent of its population.
Rural-Urban Distribution
Urbanisation is relatively new in Arunachal Pradesh;
prior to 1971 there was no urban population. In 1971
census, for the first time, four administrative centres were
counted as urban. The population in these towns was 17
thousand forming 3.70 per cent of the State’s population
of 4.68 lakh. The average population in these urban areas
was about four thousand, so small that the settlements
counted as urban were more like overgrown villages than
towns. However, the tempo of urbanisation increased over
time. During the 1970s the urban population grew at
13.96 per cent per annum. By 2001, there were 17 towns
and 20.75 per cent of the population was urban.
Annexure Table A-2.2 shows the rural-urban
distribution of population in the districts of Arunachal
Pradesh. Papum Pare, the district in which the capital of
the State is located, has the highest level of urbanisation,
50.85 per cent, and Upper Siang has no urbanisation at
all. Upper Subansiri is second in the level of urbanisation
(28.47 per cent). East Kameng is third with 26.24 per
cent of its population being urban. It can be noted that
East Siang’s urbanisation level is only fourth; it is
somewhat less urbanised than Upper Subansiri and East
Kameng, the districts which rank far below East Siang in
all indicators of development.
Population Composition
Scheduled Tribes and General Category
In the simplest composition we make a binary
classification. People belonging to different tribes are
considered as one category and those not belonging as
another. The first category is scheduled tribes (ST) and
the second is non-scheduled tribe (non-ST). We do not
take into consideration another category, scheduled caste
(SC) because this category constitute only 0.56 per cent of
the State’s population. Moreover, they are not considered
to be indigenous and hence, treated like the people of the
general category.
The ST and non-ST composition is shown in Table 2.2.
In 1961, the ST category formed the overwhelming
majority of the population (88.67 per cent), and the non-
ST only 11.33 per cent. The relative size of the non-ST
category, however, increased in subsequent years. In
1991, this category became as high as 36.34 per cent of
the total; in the 1990s its relative size, however, declined,
reaching 35.78 per cent of the population in 2001.
TABLE 2.2
Changes in Population Composition in Arunachal Pradesh
Year Population Percentage of Population
ST General Total ST General
1961 298439 38119 336558 88.67 11.33
1971 369408 98103 467511 79.02 20.98
1981 441167 190672 631839 69.82 30.18
1991 550351 314207 864558 63.66 36.34
2001 705158 392810 1097968 64.22 35.78
Note: ST means Scheduled Tribes.
Source: Census of India, 1961 through 2001, Arunachal Pradesh.
The non-tribal population in Arunachal Pradesh is not
evenly distributed; their presence is more in the urban
than in the rural areas. Kurung Kumey, a hilly district
with no urban areas, has the lowest percentage (2.11) of
the non-tribal population (Annexure Table A-2.4). At the
other end is Lohit, a district with extensive plains
bordering the Brahmaputra valley of Assam, has the
highest concentration of the non-tribal population
(67.58).
Sex Ratio
Sex ratio is a reflection of how different socio-
economic and political opportunities are distributed
between men and women. Table 2.3 shows the sex ratio
of the ST, non-ST and total population of Arunachal

57Chapter 2 •
DEMOGRAPHIC TRANSITION
Pradesh. Sex ratios of some states and of the country are
also presented in the table. Arunachal Pradesh’s overall
sex ratio was 894 in 1961, fell to 861 in 1971 and
through a fluctuation reached 893 in 2001.
TABLE 2.3
Sex Ratio in Arunachal Pradesh: A Comparison with theSelected States and the Country’s Sex Ratio
Year Arunachal Pradesh Kerala Haryana Punjab Assam India
ST General Total
1961 1013 296 894 1022 868 854 869 941
1971 1007 461 861 1016 867 865 896 930
1981 1005 599 862 1032 870 879 910 934
1991 998 657 859 1040 874 888 925 929
2001 1003 723 893 1058 861 874 932 933
Note: Sex ratio is the number of women per 1000 men in the population.
Source: Different Population Censuses of Arunachal Pradesh and India.
The overall sex ratio of Arunachal Pradesh is not
comparable with that of other states because of a large
migration. As we have seen before, 35.78 per cent of the
population in Arunachal Pradesh belongs to general
category most of whom are either migrants from other
states or descendants of the migrants.
A look at the sex ratio of the general category gives us
an impression of gender-bias in the migration. In 1961, the
migrants were largely males: sex ratio of the general
category was only 296. Over the years the sex-bias in
migration declined. The sex ratio of the general category
increased to 723 in 2001. However, it is neither the overall
sex ratio nor the sex ratio of the general category that
represents the true gender composition; it is the sex ratio
of the ST population that portrays the true picture. This is
because of the ST people being more or less closed.
The ST sex ratio shows a clear declining trend from
1961 to 1991. However, it was more than 1000 in all
censuses except in 1991 when it dropped to 998.
Compared with the overall gender composition of the
country, Arunachal Pradesh’s is much more favourable to
the women. In 1961 the sex ratio of the ST population in
the state was 1013 against the countrys 941. In 2001, ST
sex ratio was 1003. The trend of the sex ratio of the ST,
of the non-ST and total population is shown in Appendix
A-2.1.
Literacy in Arunachal Pradesh
In the spread of education, Arunachal Pradesh occupies
a unique position in the country. At the time of
Independence in 1947, there were very little formal
educational facilities. After 1947 there was a rapid
expansion of the educational facilities. The first college in
the State was established in 1964 and after 20 years a
university came into being.
Literacy spread rapidly in the State, given its very poor
base. Table 2.4 compares the literacy rate in Arunachal
Pradesh with that in India. In 2001, Arunachal Pradesh
had a literacy rate of 54.34 per cent against the country’s
64.80 per cent. So Arunachal Pradesh was 10.46
percentage points below the national average. The male
literacy was 63.83 per cent in Arunachal Pradesh against
75.20 per cent in the country. In female literacy the
difference between Arunachal Pradesh and the country is
smaller at 9.92 percentage points. As shown in the table,
the literacy rate in Arunachal Pradesh was only 7.13 per
cent in 1961. In four decades from 1961 to 2001 literacy
gained by 47.61 percentage points.
TABLE 2.4
Literacy Rate in Arunachal Pradesh: AComparison with the National Rate
Year Arunachal Pradesh India
Male Female Total Male Female Total
1961 12.24 1.42 7.13 40.40 15.34 28.31
1971 17.82 3.71 11.29 45.95 21.97 34.45
1981 35.12 14.02 25.55 56.38 39.76 43.57
1991 51.45 29.69 41.59 64.13 39.29 52.21
2001 63.83 43.53 54.34 75.20 53.70 64.80
Source: Census of India 2001, series-1 India, Provisional population totals,paper-1 of 2001 and Bose (1991).
Migration
The implementation of the development programmes
launched by the Government of India after Independence
occasioned a growing stream of migration from the rest of
the country. The composition as well as the duration of
migration was determined partly by the circumstances
inside this State and mainly by the inner line regulation
(ILR) which, enacted in 1873, proved fateful: the areas
constituting Arunachal Pradesh remained outside the
mainstream. The forces of modernisation which swept the
rest of the country did not touch Arunachal Pradesh. Most
of the people were dependent on swidden cultivation
(jhuming).
Nature of Inter-State Migration: Composition
Immediately after Independence almost all government
officials from the highest rank to the lowest came from
outside to establish direct administration in an area which
had seen only ‘indirect’ or ‘political’ administration
ARUNACHAL PRADESH DEVELOPMENT REPORT58
without any public offices being located here. The local
people accustomed to jhuming could not supply any labour
power. The only way was to depend on migrants from the
rest of the country. Given the nature of development
work, most of the migrants were unskilled. But what is
considered raw or unskilled labour in the rest of the
country appeared highly skilled in Arunachal Pradesh. For
example, an agricultural labourer is considered unskilled
in the plains but in Arunachal Pradesh he became an
‘expert’ in wet-rice cultivation. He was a diffuser of high
technology ‘the bullock plough’ in an area where the
people’s best technology was sickle and hoe. Any worker
whose skill was above sickle-hoe duo came to be regarded
as skilled and was highly demanded in the infrastructure-
building activities, laying the foundation for development.
The demand for external skill did not remain unabated
long, the spread of education and exposure to new
technology became instrumental in developing the local
skills. The educated local people entered the service sector
especially the public administration and in course of time
they spread in different secondary activities, mostly in
construction sector. In the beginning all traders were from
outside, later locals came to these burgeoning activities.
However, till today the trading and industrial activities are
dominated by the migrants who rent the license from the
locals.
Magnitudes of Migration
Based on the 1991 census we try to make a
quantitative analysis of migration in Arunachal Pradesh.
Annexure Table A-2.3 shows the rate of migration of
different categories. In the entire State 66.37 per cent of
the people are non-migrants and 33.63 per cent migrants:
a majority of the migrants (14.24 per cent of the State’s
population) are from other states of the country. Next
come the intra-district migrants forming 13.78 per cent of
the total population. The migrants from other districts are
as unimportant as the migrants from other countries. The
inter-district migrants are 2.96 per cent of the total
population against a weight of 2.65 per cent from the
emigrants.
The rate of migration varies widely among the districts.
Tawang has the lowest rate and its opposite is Dibang
Valley (Annexure Table A-2.3). As high as 93.00 per cent
people are non-migrants in Tawang and in Dibang Valley
most of the people (58.96 per cent of the total) are
migrants. Out of 11 districts in 1991, in as high as six
districts migrants were more than 30 per cent of the total
population and only in two districts less than 20 per cent.
In-migration within the district West Siang had the
highest rate, 23.87 per cent and Tawang the lowest, 2.51
per cent. Compared with the intra-district migration, the
inter-district migration is rather insignificant. This is due
not much to physical distance but to cultural, linguistic
and ethnic distance. In many cases the physical borders of
a district coincide with its linguistic borders and this
discourages inter-district migration.
Tawang has the lowest rate (0.83 per cent) of inter-
district as well as inter-state (3.25 per cent) in-migration.
On the other end, Dibang Valley is at the top in receiving
migrants from other states, 27.59 per cent of its
population being born in other parts of the country. It has
also the second position in receiving international
migrants: 6.28 per cent of its people are foreign-born. The
immigrants constitute the largest proportion (9.17 per
cent of the population) among districts, in Changlang.
Population Growth
In Arunachal Pradesh population started growing after
1947. Prior to Independence, there was no modern
hospital nor was there any modern industry in the State.
A low-productive agriculture, the total absence of
industrial activities outside the household, almost total
illiteracy kept the pre-1947 Arunachal Pradesh in the
same demographic regime as the rest of the country was
prior to 1921. So the ‘great divide’ for Arunachal Pradesh
can be taken to be 1947, after which its population took a
path of high growth shaped by both natural increase and
migration.
During 1961-2001, the population grew in the State at
the average exponential rate of 2.98 per cent per annum
compared with the national growth of 2.14 per cent. This
is shown in Table 2.5. The ST population grew at the rate
of 2.12 per cent while the non-ST grew at a much higher
rate of 5.83 per cent. There was a high decadal variation
in the growth rate. In the 1960s population grew in the
State at the yearly rate of 3.29 per cent, the highest in all
decades. In the country also, the 1960s witnessed the
highest growth rate of population but in the subsequent
decades the rate fell without any reversal. But Arunachal
Pradesh did not follow exactly the country’s pattern. In
the 1970s the rate of growth fell markedly but in the
1980s a reversal took place. In the 1970s the fall in the
overall growth was due to the sharp fall in the growth of
the tribal population. In the 1960s the tribal population in
the State grew at 2.13 per cent per annum but in the
1970s the rate declined to 1.78 per cent.
Since the trajectory of the population growth shifted
upwards after the launch of the development programmes
and the consequent migration, we should begin with an

59Chapter 2 •
DEMOGRAPHIC TRANSITION
effort to identify the factors leading to the migration of
people in the State. The operationalisation of the
development programme created a gap between the wage
rates in Arunachal Pradesh and the rest of the country.
The wage differential triggered a steady flow of migration
thereby raising the rate of growth of population in the
State.
TABLE 2.5
Population Growth in Arunachal Pradesh:A Comparison with the National Average
(Per cent per annum)
Year Arunachal Pradesh India Difference
ST General Total
1961-1971 2.13 9.45 3.29 2.22 1.07
1971-1981 1.78 6.65 3.01 2.20 0.81
1981-1991 2.21 5.00 3.14 2.14 1.00
1991-2001 2.45 2.23 2.39 1.95 0.44
1981-2001 2.35 3.61 2.76 2.05 0.71
1971-2001 2.16 4.66 2.88 2.10 0.78
1961-2001 2.12 5.83 2.98 2.14 0.84
Note: 1. Growth rate is the estimated value of b in log p = a + bt, where pis population and t is time in years; b is expressed in percentage.
2. Difference is the rate of growth of population in ArunachalPradesh—the rate of growth of the population in the country.
Source: Different Population Censuses of Arunachal Pradesh and India.
Fertility and Mortality Rates
According to the estimates by the Sample Registration
System (SRS), Arunachal Pradesh had a crude birth rate
(CBR) of 36.8 and a crude death rate (CDR) of 19.8 in
1971 (Annexure Table A-2.5). The CBR in the State
continued to be high in the 1970s and 1980s but CDR
started falling in the 1980s. The marked fall in fertility,
however, took place in the 1990s. By 2000 the CBR
reached 22.3 against the country’s 25.8. In the following
years the fertility fell further. In 2003, the CBR was 18.9
in the State against the country’s 24.8. The fall in CDR
was more pronounced. In 2003 the CDR was as low as
4.7 in the State against the country’s 8. SRS data on CBR
and CDR suffer from a severe underestimation. The
population growth rate based on SRS estimates stands in
sharp contrast with the census data. The estimates of
CBR, CDR and IMR given in the Human Development
Report (HDR) of Arunachal Pradesh appear to be
consistent with the census but the HDR data are available
for a single year only—2001. According to HDR (2005)
CBR in Arunachal Pradesh was 34.62, CDR was 11.57 and
IMR 77 in 2001. These rates are much higher than their
national average.
The Empirical Estimation
The conceptual framework as well as empirical findings
are provided in Appendix A-2.2. The estimated equation
(15) in Appendix A-2.2 shows that CBR is negatively
related to the literacy rate and positively related to per
capita income. In case of CDR (shown in equation 16 in
Appendix A-2.2), both literacy rate and per capita income
have a negative, and medical services a positive effect on
CDR. However, the effect of medical services is not a
linear one, the square of medical services having a
negative effect on CDR.
Population Projection
Population projection for the State is difficult in view
of its population growth being determined partly by the
volume of migration from the rest of the country. The
element of migration in the growth of population was very
large in the years following the Independence of the
country. The relative importance of migration in the
population growth declined in subsequent decades. In the
1990s net migration in the State from the rest of the
country was very small. This was due mainly to the return
migration of many non-ST workers rendered jobless by
the close down of the most of the industries during the
1990s in the State. However, the condition changed after
2000 with the undertaking of hydropower projects. As
shown elsewhere in this chapter, in-migration in the State
has been shaped mainly by the inflow of central funds and
the growth of local labour, with more investment
especially in the hydropower sector, the demand for semi-
skilled labour will increase and this type of skill being not
locally available will be met by migrant workers from the
rest of the country. This is likely to raise the population
growth in the State.
Given a complex set of factors determining the net in-
migration in the state and the non-declining rate of
growth of the ST population, it is safe to assume that the
rate of growth of population the state will not change
much up to 2015. However, a high element of uncertainty
remains as regards the actual growth that would take
place during 2001-2015. Under the circumstances it
would be meaningful to use the actual growth rate of the
1990s in the projection of the population. The resulting
projection is then based on a highly optimistic assumption
about the behaviour of migration that the unfolding of job
opportunities created by the new large sized power
projects would entail a continuous migration of skilled
and semi-skilled workers in the State.

ARUNACHAL PRADESH DEVELOPMENT REPORT60
The projected population based on the growth rate of
2.39 per cent per annum is shown in Annexure Table A-
2.6. The table also shows the projected 6-14 year age
group, which is the potential school going group
(schooling ranging from class I to Class VIII). Another
important age group (15-59) is the potential working age
group. Projection gives us some glimpses of the needs of
schooling facilities to be established and the job
opportunities to be created.
Conclusion and Policy Implications
The conceptual framework provides a reasonable fit to
the demographic transition in Arunachal Pradesh. It
specifically highlights the role of the development
programme of the Government of India in entailing
migration of workers, both skilled and unskilled, in
Arunachal Pradesh. It was these migrant workers who
built up the infrastructure which led to the shift of the
growth trajectory of the indigenous population in the
State. The mortality rate fell but fertility rate remained
sticky up to the 1980s. In the 1990s the fertility rate
tended to fall which reduced the rate of growth of
population, but compared with the rest of the country, the
vital rates—fertility and mortality rates—remain high in
Arunachal Pradesh. The demographic situation in the
State demands the following measures:
• Expansion of health services in the remote areas of
the State. Posting of doctors in the primary health
centres (PHCs) in the interior areas should receive
a priority.
• Public distribution system (PDS) should be
strengthened to cover all people living below the
poverty line.
• Family planning services should be integrated more
meaningfully with the health services in the State.
• Given the threat of AIDS, the precautionary
measures require, among others, a high pitched
propagation of the information of the
epidemiological condition of this deadly disease.
• Since the strategically sensitive border areas should
not suffer from depopulation due to migration of
people to the urban areas, efforts should be made
to invest more in the development of border areas.

61Chapter 2 •
DEMOGRAPHIC TRANSITION
ANNEXURE TABLE A-2.1
Distribution of Population in Arunachal Pradesh: 2001
District/State Area (sq km) Population Density Percentage of Cumulative % of
Area Population Area Population
D. Valley 13029 57720 4 15.56 5.26 15.56 5.26
K. Kumey 8818 42518 5 10.53 3.87 26.09 9.13
U. Siang 6188 33363 5 7.39 3.04 33.48 12.17
U. Subansiri 7032 55346 8 8.39 5.04 41.87 17.21
East Kameng 7422 74599 10 8.86 6.79 50.73 24.00
Lohit 11402 143527 13 13.62 13.08 64.35 37.08
West Siang 7643 103918 14 9.13 9.46 73.48 46.54
W. Kameng 4134 57179 14 4.94 5.21 78.42 51.75
Tawang 2172 38924 18 2.59 3.55 81.01 55.30
East Siang 4687 87397 19 5.60 7.96 86.61 63.26
Changlang 4662 125422 27 5.57 11.42 92.18 74.68
L. Subansiri 1317 55726 42 1.57 5.08 93.75 79.76
Papum Pare 2875 122003 42 3.43 11.10 97.18 90.86
Tirap 2362 100326 42 2.82 9.14 100.00 100.00
Arunachal Pradesh 83743 1097968 13 100.00 100.00 100.00 100.00
Note: D means Dibang, K means Kurung, W means West, U means Upper, and L means Lower.
Source: Population Census of India (Arunachal Pradesh) 2001.
ANNEXURE TABLE A-2.2
Rural-Urban Distribution of Population inArunachal Pradesh: 2001
District/State Population Percentage of Population
Rural Urban Total Rural Urban
Tawang 30548 8376 38924 78.48 21.52
W. Kameng 67906 6693 74599 91.03 8.97
E. Kameng 42177 15002 57179 73.76 26.24
Papum Pare 59961 62042 122003 49.15 50.85
L. Subansiri 85860 12384 98244 87.39 12.61
U. Subansiri 39590 15756 55346 71.53 28.47
W. Siang 82806 21112 103918 79.68 20.32
E. Siang 65432 21965 87397 74.87 25.13
U. Siang 33363 0 33363 100.00 0
D. Valley 47613 10107 57720 82.49 17.51
Lohit 116765 26762 143527 81.35 18.65
Changlang 113034 12388 125422 90.12 9.88
Tirap 85032 15294 100326 84.76 15.24
Arunachal 870087 227881 1097968 79.25 20.75Pradesh
Note: D means Dibang, W means west, E means East, W means West, Lmeans Lower and U means Upper.
Source: Census of Arunachal Pradesh, 2001.
ANNEXURE TABLE A-2.3
Migration in Arunachal Pradesh: 1991
District/ Non- Migrants Born within Born outsideState migrants Arunachal Pradesh Arunachal Pradesh
Same Other Other OtherDistricts Districts States Countries
Tawang 93.00 7.00 2.51 0.83 3.25 0.41
West Kameng 69.44 30.56 7.23 3.41 14.99 4.88
East Kameng 76.34 23.66 17.66 1.38 4.08 0.54
Lower 60.69 39.31 17.99 3.41 16.82 1.09Subansiri
Upper 74.03 25.97 17.83 2.42 5.30 0.42Subansiri
West Siang 60.59 39.41 23.87 2.86 11.67 1.01
East Siang 74.82 25.18 9.98 2.37 11.22 1.61
Dibang Valley 41.04 58.96 17.90 7.19 27.59 6.28
Lohit 60.59 39.41 11.56 2.83 22.09 2.93
Changlang 58.38 41.62 11.47 3.49 17.49 9.17
Tirap 80.82 19.18 6.72 2.01 9.68 0.77
Arunachal 66.37 33.63 13.78 2.96 14.24 2.65Pradesh
Source: Census of India 1991.

ARUNACHAL PRADESH DEVELOPMENT REPORT62
ANNEXURE TABLE A-2.4
Population Composition of Arunachal Pradesh, 2001
Percentage
Districts Total ST General ST General
Tawang 38,924 29,191 9,733 74.99 25.01
West Kameng 74,599 36,951 37,648 49.53 50.47
East Kameng 57,179 49,585 7,594 86.72 13.28
Papum Pare 122,003 69,007 52,996 56.56 43.44
Kurung Kumey 42,518 41,619 899 97.89 2.11
Lower Subansiri 55,726 46,893 8,833 84.15 15.85
Upper Subansiri 55,346 49,552 5,794 89.53 10.47
West Siang 103,918 84,922 18,996 81.72 18.28
East Siang 87,397 60,420 26,977 69.13 30.87
Upper Siang 33,363 26,094 7,269 78.21 21.79
Lower Dibang Valley 50,378 22,005 28,373 43.68 56.32
Dibang Valley (New) 7,342 4,827 2,515 65.75 34.25
Lohit 125,086 40,552 84,534 32.42 67.58
Anjaw 18,441 14,249 4,192 77.27 22.73
Changlang 125,422 45,351 80,071 36.16 63.84
Tirap 100,326 83,940 16,386 83.67 16.33
Arunachal Pradesh 1,097,968 705,158 392,810 64.22 35.78
Note: ST means Scheduled Tribes.
Source: Census of India 2001, Series 13 Arunachal Pradesh, Final PopulationTotals.
ANNEXURE TABLE A-2.5
Trend of CBR, CDR and Population Growth in ArunachalPradesh: A Comparison with the Country, 2001
Arunachal Pradesh India
Year CBR CDR G CBR CDR G
1971 36.8 19.8 1.7 - - -
1972 35.8 20.9 1.49 36.3 15.9 2.04
1973 35.2 22.6 1.26 35.3 15.7 1.96
1974 32.1 20.6 1.15 34.8 15.3 1.95
1975 32.2 22.8 0.94 34.4 15.0 1.94
1976 33.2 19.4 1.38 34.2 15.2 1.90
1977 33.8 19.5 1.43 33.3 14.5 1.88
1978 36.7 17 1.97 33.1 13.9 1.92
1979 32.6 17.1 1.55 33.3 13.1 2.02
1980 33.1 15.4 1.77 33.8 12.7 2.11
1981 31.1 14.6 1.65 33.8 12.3 2.15
1982 34.7 15.9 1.88 33.8 12.1 2.17
1983 34.7 16.6 1.81 33.8 12.1 2.17
1984 35.2 16.1 1.91 33.6 12.1 2.15
1985 36.7 15.3 2.14 33.2 11.8 2.14
contd...
contd...
Arunachal Pradesh India
Year CBR CDR G CBR CDR G
1986 37.3 14.2 2.31 32.6 11.3 2.13
1987 38.8 15.2 2.36 32.1 11.0 2.11
1988 37.3 14.9 2.24 31.5 10.7 2.08
1989 35 14.8 2.02 30.7 10.3 2.04
1990 29.7 13.2 1.65 29.5 9.8 1.97
1991 29.2 12 1.72 29.2 10.1 1.91
1992 26.6 9.4 1.72 28.7 9.3 1.94
1993 27.6 8.6 1.9 27.5 9.0 1.85
1994 28.5 9.9 1.86 26.5 9.0 1.75
1995 23.8 6 1.78 28.3 9.0 1.93
1996 21.9 5.5 1.64 27.5 9.0 1.85
1997 21.4 5 1.64 27.2 8.9 1.83
1998 21.9 5.9 1.6 26.5 9.0 1.75
1999 22.3 6 1.63 26.0 8.6 1.74
2000 22.3 6 1.63 25.8 8.5 1.73
2001 22.2 5.7 1.65 25.4 8.4 1.70
2002 20.6 5.2 1.54 25.0 8.7 1.63
2003 18.9 4.7 1.42 24.8 8.0 1.68
Note: G means rate of natural growth per annum.
Source: SRS Bulletins.
ANNEXURE TABLE A-2.6
Population Projection
Year Projected Population 6-14 Age Group 15-59 Age Group
2001 1097968* 274492 603882
2002 1124256 281131 618489
2003 1151725 287931 633449
2004 1179583 294896 648771
2005 1208115 302029 664463
2006 1237337 309334 680535
2007 1267265 316816 696996
2008 1297918 324479 713855
2009 1329312 332328 731122
2010 1361465 340366 748806
2011 1394396 348599 766918
2012 1428123 357031 785468
2013 1462667 365667 804467
2014 1498045 374511 823925
2015 1534280 383560 843854
Note: * Actual population enumerated in the 2001 census.
Source: Census of Arunachal Pradesh, 2001.

63Chapter 2 •
DEMOGRAPHIC TRANSITION
APPENDIX A-2.1
Trend of Sex Ratio in Arunachal Pradesh
ST sex ratio = 1011.00 – 0.29t (1)
(373.2) (2.6)
R2 = 0.70 n = 5
ST sex ratio = 1013.43 – 0.78t + 0.012t2 (2)
(380.0) (2.5*) (1.6*)
R2 = 0.87 n = 5
Non-ST sex ratio = 337.20 + 10.50t (3)
(9.5) (7.5)
R2 = 0.95 n = 5
Overall sex ratio = 874.60 – 0.04t (4)
(54.3) (0.1*)
R2 = 0.001 n = 5
Overall sex ratio = 893.17 – 3.75t + 0.09t2 (5)
(141.4) (5.0) (5.1)
R2 = 0.93 n = 5
In all trend equations t is time measured in years and
parenthesised figures are t values; n is the number of
observations. The origin of t is 1961. Asterisked t values are not
significant at 5 per cent level. ST sex ratio seems to suffer a
decline, but the negative coefficient of t is not significant at 5
per cent level. Moreover the degrees of freedom is very low. A
quadratic time-path seems to give a better fit but again neither
the quadratic coefficient or nor the linear coefficient of time is
statistically significant. The sex ratio of the non-ST has a
positive trend. Overall sex ratio has no linear trend during this
period (equation 4), but a quadratic function provides an
excellent fit (equation 5); coefficients of both t and t2 are
significant at 5 per cent level.
APPENDIX A-2.2
Conceptualising Population Growth in Arunachal Pradesh
In Arunachal Pradesh the development activities initiated by
the Central government were financed by a continuous inflow of
funds. In this framework the inflow of Central funds is taken as
exogenous. The conceptual framework and its empirical
estimation follow closely (Roy, 2005). The Central inflow, in Roy
(2005), is, however, treated indigenously. In Arunachal Pradesh
there was no labour market, so labourers were brought from the
rest of the country by paying them a higher wage rate. The wage
differential between Arunachal Pradesh and other areas is a
function of the gap in the demand for labour and its supply in
this State. This relation is formalised as
Wa/W = f1 (G, Li) (1)
In equation (7), Wa is the wage rate in Arunachal Pradesh,
W is the wage rate in areas supplying labour force to Arunachal
Pradesh, G is the Central funds flowing into the State and Li is
the supply of local labour. Wa/W is an increasing function of G
but a decreasing function of Li.
The migration of workers (Lm) in Arunachal Pradesh from
outside is a function of Wa/W:
Lm = f2 (Wa/W) (2)
The inflow of funds along with the migration of workers
facilitates the development of educational institutions (S):
S = f3 (G, Lm) (3)
Educational facilities and income per head (Yp) are
hypothesised to determine the level of education (E):
E = f4 (S, Yp) (4)
The local labour force (Li) grows with the spread of
education and expansion of ST population:
Li = f5 (E, P) (5)
The Central funds and the migration of people from the rest
of the country shape the growth of the medical services:
M = f6 (G, Lm) (6)
The crude birth rate (CBR) is a function of the spread of
education and the growth of per capita income:
CBR = f7 (E, YP) (7)
The death rate (CDR) depends on the expansion of health
services, spread of education and the growth of per capita
income:
CDR = f8 (E, YP, M) (8)
We have eight endogenous and only three exogenous
variables. The system is over-identified, but does not suffer from
serious biases of simultaneous equations.

ARUNACHAL PRADESH DEVELOPMENT REPORT64
Empirical Estimation
100* (Wa/W) = 891.09 – 63.94 log Li + 1.60 log G (9)
(5.4) (4.4) (0.8)
R2 = 0.49 n = 32
In equation (9) the coefficient of log G is insignificant but
the coefficient of log Li is significant with the expected sign. The
number of observations (n) is 32 covering the period 1970-71 to
2001-02.
The wage differential induced the migration to Arunachal
Pradesh:
Δlog Lm = 0.344 + 0.0032 (100* Wa/W) (10)
(6.4) (7.4)
R2 = 0.62 n = 32
Equation (10) has both the parameters significant at one per
cent level.
The inflow of Central funds (G) and the migrant workers
became instrumental in the growth of educational institutions. In
our estimation, the pre-primary and primary schools are taken to
represent the educational institutions. The estimated relation:
log S = –2.29 + 0.88 log G + 4.27 Δ log Lm (11)
(3.6) (15.24) (3.3)
R2 = 0.94 n = 32
All the parameters in equation (17) are significant. There is
some multi-colinearity between G and Lm. Though their
relationship is not direct, yet it comes simply through the
medium of the relative wage rate, Wa/W.
In explaining the spread of education both the demand and
supply factors are considered. On the supply side there is the
educational institution (S) and on the demand side, per capita
income (YP).
log E = 5.81 + 0.75 S + 0.47 log YP (12)
(25.3) (7.9) (5.9)
R2 = 0.98 n = 33
The coefficients of both the arguments in equation (12) are
highly significant. The period covered in equation (12) is 1970-
1971 to 2002-03.
The next estimated relation, the growth of local labour (Li)
as a function of spread of education (E) and the growth of ST
population (P1) is as follows:
log Li = 9.20 + 0.24 log P1 + 0.0023 E (13)
(10.6) (3.4) (2.2)
R2 = 0.99 n = 33
One problem with equation (13) is that Li includes all the ST
workers as provided in the census, but in our conceptual
framework Li is the population on paid jobs. But no time series
data is available on this.
Another important development is the growth of medical
services in the State. The estimated relation is
M = 0.74 + 0.44 log P2 + 0.13 log G (14)
(1.1) (2.0) (0.6)
R2 = 0.90 n = 34
The medical services (M) is measured by the number of
hospital beds in the State. P2 is the non-ST population. The non-
ST population is supposed to represent both the demand and
supply. The estimated relation on CBR:
CBR = - 43.03 – 0.68 E + 11.30 log YP (15)
(0.6) (2.5) (1.2)
R2 = 0.67 n = 33
The data on CBR as well as CDR is from Sample Registration
System (SRS). The specification seems to be too simple to be
convincing; but fitness is too good to be neglected. Moreover,
the interpretation is simple. We can invoke Becker’s formulation
of the demand for children as an increasing function of income
(Becker, 1960). We can also argue a la Easterlin (1975) that
Arunachal Pradesh up to the 1980s was in the stage when its
fertility from the supply side was increasing due to growth in
nutrition but demand for children did not decline. Only in the
1990s, the demand for children declined.
So the sign of the coefficient of log YP {Yp is per capita Net
State Domestic product (NSDP)} is theoretically valid. The
negative sign of education (E) is also theoretically expected.
The estimated equation for CDR is as follows:
CDR = 91.75–0.21 E–10.06 log Yp+0.029 M–0.00001 M2 (16)
(3.2) (1.5) (2.5) (2.4) (1.8)
R2 = 0.95 n = 33
All the parameters are significant at 10 per cent but the
significance level of the coefficient of E is 14.4 per cent. Both E
and log Yp have the expected sign but not the medical services
(M). The coefficient of M is positive and that of M2 is negative

65Chapter 2 •
DEMOGRAPHIC TRANSITION
which is not expected. The reason is, of course, that the medical
services in the State had been growing robustly in the 1970s and
1980s but in the 1990s there was a slowdown. The slowdown in
public health services was largely compensated by the expansion
of health services in the private sector especially in the urban
areas. However, our data does not include the health services in
the private sector.
Notes:
1. In general the migrants from outside do not enjoy property rights inland or in any fixed assets in Arunachal Pradesh, but this restrictiondoes not apply to all migrants or non-ST population. In the firstplace, migrants cannot be equated to non-ST. True that all migrantsare non-ST but all non-ST people are not migrants. Migrant are onlya subset of the non-ST people. We can mention here three groups ofnon-ST people enjoying property rights in Arunachal Pradesh.
a. There are a few communities spread over Assam and ArunachalPradesh. The major segments of these communities are in Assamand culturally they are identified with that State. In spite of theirpresence in Arunachal Pradesh for generations they are nottreated as ST, though in Assam they are treated so.
b. Prior to 1947 some government servants from other areas of thecountry settled in Arunachal Pradesh and they were allotted landby the government. They do not belong to ST category but theyenjoy property rights in land.
c. In the years following the Chinese War in 1962, the Governmentof India settled some refugees and ex-service men in ArunachalPradesh in order to augment the defence of the country. Theywere provided with land and they enjoy its ownership. In fact thetraditional institution vests the ownership of land in someentities such as community, clan, etc. This prevents land beingalienated to a person belonging to other communities or clans.An effect of this institution is the restricted internal migration(inter-district, and some times intra-district) in the State.
Introduction
Arunachal Pradesh has undergone remarkable
economic changes within a comparatively short period of
time. The relatively isolated economies of the tribal
communities of the area, which were later reorganised as
Arunachal Pradesh, were gradually integrated into the
larger economy only after Independence, and more
particularly after the Indo-China war of 1962. Apart from
the relatively late exposure to modernisation, another
specificity of the historical transformation of the
Arunachal Pradesh economy was the role of the State as
the prime mover in this process of gradual transformation
and integration of the economy. The State’s economy has
not only experienced a remarkable growth over the past
decades, it has diversified from an agriculture and forestry
based subsistence economy into a market economy. The
predominantly barter economies are in the process of
being transformed into a monetised economy. The market
institutions are still underdeveloped in many respects, and
there is a great deal of regional variations in the degree of
integration with the market economy, but a remarkable
feature of the transformation process is the way the
geographical, historical and policy-induced specificities of
the State have shaped the trajectories of economic change.
Some important aspects of the process of economic
change have been examined in this chapter.
Per Capita Income
In 1970-71, the per capita net state domestic product
(NSDP) of Arunachal Pradesh was 56.14 per cent of the
per capita national income. Starting from a very low base,
Arunachal Pradesh’s per capita income increased at a
faster rate than the country’s national income. On
ARUN
ACH
AL PR
ADESH
average, during 1970s Arunachal Pradesh’s per capita
income was 63.38 per cent of the national per capita
income. Throughout the decade of the 1980s, because of
the relatively higher growth of the states per capita NSDP,
the gap between Arunachal Pradesh’s income per head
with the national average tended to narrow down. From
1991-92 to 1995-96 the per capita income in Arunachal
Pradesh remained higher than that of the country. After
reaching the peak level of 110 per cent of national per
capita income in 1995-96, the growth of income in
Arunachal Pradesh slowed relative to that of the national
income and this was reflected in the falling ratio of
Arunachal Pradesh’s per capita income to average per
capita income in the country. In the year 1999-2000,
Arunachal Pradesh’s per capita income was only 84.64 per
cent of the national average. There was, however, a phase
of recovery since then. During 2004-2006, on an average,
the State’s per capita NSDP was 95 per cent of the
national average.
Growth of NSDP: 1970-71 to 2004-05
During the entire period from 1971 to 2004-05, for
which data is available, the NSDP has registered an
average annual growth rate of 7.05 per cent per annum.
The growth rate was much higher in the 1970s (7.07 per
cent) and in the 1980s (7.81 per cent) than in the 1990s
(4.85 per cent) (Table 3.1). It is important to note that
the growth of the NSDP has shown a sharp decline since
1993-94. During the 1990s, generally described as the
post-reform decade, while the performance of the national
economy showed improvements over the previous
decades, the growth of the State's economy suffered a
significant setback.
Chapter 3
Economic Growth, StructuralChange and Workforce Participation

ARUNACHAL PRADESH DEVELOPMENT REPORT68
TABLE 3.1
Growth Rate of Arunachal’s NSDP
Period Growth Rate of
NSDP Per Capita NSDP
1970-71 to 1979-80 7.07 4.03
1980-81 to1989-90 7.81 4.69
1990-91 to 1999-00 4.85 2.01
1993-94 to 2004-05 3.63 1.70
1970-71 to 2004-05 7.05 4.32
Note: NSDP data are from State Domestic Product of Arunachal Pradeshfor different years published by the Directorate of Economics andStatistics, Government of Arunachal Pradesh.
Changes in Sectoral Composition ofNSDP: 1970-71 to 2004-05
The changing sectoral composition of the State’s NSDP
captures the structural transformation of the economy. In
1970-71, the primary sector contributed 59 per cent of the
State’s economy (Figure 3.1). The share of the sector
steadily declined to 31 per cent in 2004-05 (Table 3.2).
This decline was largely due to the fall in the relative
contribution of forestry and logging. The contribution of
agriculture declined from 38 per cent to 24 per cent
during the same period, while that of fishing increased
from 0.04 per cent to 1.1 per cent. The contribution of
the secondary sector increased from 20 per cent to only
25 per cent during 1970-71 to 2004-05. The share of the
manufacturing had increased from less than 1 per cent in
1971 to more than 6 per cent in the 1980s but in the
1990s it declined and reached 2.27 per cent in 2004-05.
The bulk of the secondary sector activity is construction.
It is interesting to note that services in Arunachal
Pradesh in recent years have come to occupy the most
predominant position, making a contribution to the
State’s net domestic product, which is higher than that of
agriculture. Thus, the decline in the share of agriculture
has not been accomplished with the expansion of the
secondary sector; rather the tertiary sector has expanded
rapidly. The share of the tertiary sector was around 43 per
cent of the NSDP in 2004-05. Within the service sector,
public administration was relatively more important,
yielding 15 per cent of income in the State. A significant
aspect of the structural transformation of the State, as
captured by the changes in sectoral composition of State
domestic product is that in the last 35 years, the
contribution from manufacturing activities could never
reach 7 per cent of the State income. Another aspect is
that the specificity of the State’s economy lies in the
overwhelming and increasing dominance of the service
sector in the states economy.
FIGURE 3.1
Changing Sectoral Composition of NSDPin Arunachal Pradesh: 1970-71 to 2004-05
0
10
20
30
40
50
60
70
Primary Secondary Tertiary
1970-71
1972-73
1974-75
1976-77
1978-79
1980-81
1982-83
1984-85
1986-87
1988-89
1990-91
1992-93
1994-95
1996-97
1998-99
2000-01
2002-03
2004-05
TABLE 3.2
Sectoral Composition of NSDP of Arunachal Pradesh
Industry 1970- 1980- 1990- 2000- 2004- Changes71 81 91 01 05 1970-71
to 2004-05
Agriculture 38.33 36.91 35.09 31.16 24.37 -13.96
Forestry and Logging 20.72 10.23 9.58 3.64 4.30 -16.42
Fishing 0.04 0.08 0.72 1.06 1.07 1.03
Mining and Quarrying 0.11 0.06 0.79 1.04 1.34 1.23
Primary Sector 59.19 47.28 46.19 36.89 31.09 -28.10
Manufacturing 0.85 6.51 6.04 4.43 2.27 1.42
Construction 19.58 18.69 17.98 15.58 22.51 2.93
Electricity, etc. -0.10 -2.99 -2.47 2.14 0.64 0.74
Secondary Sector 20.33 22.21 21.56 22.16 25.42 5.09
Transport, Storage, etc. 1.55 0.36 0.65 5.89 8.19 6.64
Trade, Hotel, etc. 1.96 4.42 4.95 4.79 3.86 1.90
Banking & Insurance 0.11 0.60 1.49 1.78 2.61 2.50
Real Estate, etc. 0.79 7.79 5.29 2.46 2.09 1.30
Public Administration 9.98 10.36 8.17 13.80 14.99 5.01
Other Services 6.09 6.98 11.72 12.23 11.77 5.68
Tertiary Sectors 20.48 30.51 32.25 40.96 43.50 23.02
Total 100.00 100.00 100.00 100.00 100.00 100.00
Note: Changes in percentage points are over the period 1970-71 to 2004-2005.
Source: Estimates of Domestic Product, Arunachal Pradesh, Directorate ofEconomics and Statistics, Itanagar, 2002.
Growth of Various Sectors: 1970-71 to 2004-05
During the period 1970-71 to 2004-05, the growth rate
of the service sector was the highest, followed by that of
the secondary and the primary sectors. So far as the
growth rate in various sub-periods under study are
concerned, in the 1970s and in the 1990s the service
sector had registered the highest growth rates among the
three sectors, but in the 1980s it was the primary sector,
which had grown at a faster rate. In sectoral terms, the
primary sector, starting from a growth rate of 4.61 per

69Chapter 3 •
ECONOMIC GROWTH, STRUCTURAL CHANGE AND WORKFORCE PARTICIPATION
cent in the 1970s, reached a high growth of nearly 9 per
cent per annum in the 1980s, but witnessed a remarkable
slowdown in its growth during 1990-91 to 2004-05.
Agriculture, after growing at an annual average rate of
9.18 per cent in the 1980s also witnessed a sharp
deceleration in the 1990s. While this broad pattern was
true for all other sub-sectors, within the primary sector,
perhaps, the striking feature is the negative growth of
forestry and logging since the 1990-91 (Table 3.3). The
secondary sector as a whole has witnessed a decline in
growth rate during the three decades. Manufacturing
sector expanded at the average annual rate of 9.4 per cent
while construction grew at a rate of 7.11 per cent per
annum. However, both these sectors registered
remarkably lower growth rates during the 1990s in
comparison to the earlier decades. The tertiary sector
expanded quite rapidly in the 1970s registering a growth
of 11.39 per cent annually. In the 1980s tertiary sector’s
growth slowed to 7.62 per cent, but what is remarkable is
that in spite of overall slowing down of the economy in
the 1990s the tertiary sector grew at 7.53 per cent per
annum and public administration grew at a high rate of
8.68 per cent (Table 3.3).
TABLE 3.3
Growth Rate of Industries in ArunachalPradesh: 1971-2005
Name of the Industries 1970-71 to 1980-81 to 1990-91 to 1970-71 to1979-80 1989-90 2004-05 2004-05
Agriculture 6.4 9.18 1.22 5.95
Forestry and Logging 0.32 4.05 -7.92 2.48
Fishing 16.1 34.3 4.8 18.55
Mining and Quarrying 14.4 37.3 9.99 16.04
Primary Sector 4.61 8.48 -0.26 5.40
Manufacturing 14.2 7.85 -0.61 9.44
Construction 7.70 6.26 3.89 7.11
Elect., Gas, etc. 0 0 0 0
Secondary Sector 8.03 6.43 3.69 7.49
Transport, Storage 9.77 13.3 12.49 12.63and Comm.
Trade, Hotel, etc. 17.6 9.69 -0.89 8.39
Banking and Insurance 27.96 20.77 11.39 16.45
Real Estates, etc. 3.57 4.54 4.03 10.50
Public Adm. 10.81 5.29 8.68 8.05
Other services 9.58 9.5 7.61 9.44
Tertiary Sector 11.39 7.62 7.53 9.17
NSDP 7.07 7.81 3.55 7.05
Population 3.04 3.12 1.14 2.75
NSDP per capita 4.03 4.69 1.61 4.32
Source: Calculated from Estimates of Domestic Product, Directorate ofEconomics and Statistics, Government of Arunachal Pradesh,Itanagar, 2002.
The decade of the 1990s witnessed the structural
imbalances of the State’s economy. In the beginning of
the 1990s the State-owned non-timber industries faced
closure because of accumulated losses. The process of
industrial closure got aggravated with the imposition of
restriction on the felling of trees by the Supreme Court.
The timber-based industries which constituted the
backbone in the State’s industrialisation were closed down
after 1996-97. The down-turn of industrial sector and the
non-expanding primary sector were translated into a semi-
stagnation of the State economy. However, the economy
did not slide down into a state of negative growth because
of the expansion of the tertiary sector especially the public
administration whose relative importance in the NSDP
progressively increased.
Sectoral Contributions to the Growth of NSDP
During 1970-71 to 2004-05 the contribution of
agriculture to the growth of the Arunachal Pradesh’s
economy was higher than that of any other sectors.
Though agricultural growth was not very high compared
with other sectors, yet its relatively higher share in the
State’s NSDP resulted in its higher contribution to the
growth of the economy. During 1970-71 to 2004-05, on
an average, the contribution of agriculture to NSDPs
growth was 31.16 per cent, while its share was 32.52 per
cent (Table 3.4). Forestry and logging, which is an
important sector of Arunachal Pradesh’s economy, having
on an average, a share of 8.78 per cent of NSDP during
1970-71 to 2004-05, has grown only at a rate of 2.48 per
cent per annum. As a result, its contribution to the
economic growth was just 3.51 per cent. The primary
sector as a whole made a contribution of 32.40 per cent to
the growth of the State’s economy during the period.
Manufacturing sector has grown at a high rate of 9.44
per cent during 1970-71 to 2004-05, but its small size—
its average contribution being 3.77 per cent of NSDP—
kept its relative contribution to the growth of NSDP to
5.73 per cent. In contrast, construction with a growth rate
of 7.11 per cent per annum during the period produced
21.28 per cent of the growth of the State economy. This
large contribution emanated mainly from its relatively
large size—during the period construction contributed on
an average 18.58 per cent of the State’s income. The
overall contribution of the secondary sector was 22.64 per
cent of the State’s economic growth. Tertiary sector
contributed 44.96 per cent of the growth of NSDP during
the period. Within the tertiary sector, public
administration, which forms the largest sub-sector with a
11.99 per cent share of NSDP, contributed 15.56 per cent
of the growth of NSDP.

ARUNACHAL PRADESH DEVELOPMENT REPORT70
TABLE 3.4
Sectoral Contribution to NSDP Growthin Arunachal Pradesh
Sl. Sectors 1971- 1981- 1990-91 to1970-71 toNo. 1980 1990 2004-05 2004-05
1 Agriculture 35.56 41.95 12.03 31.16
2 Forestry and Logging 0.82 5.45 -6.85 3.51
3 Fishing 0.16 1.30 1.52 2.36
4 Mining and Quarrying 0.25 5.66 1.60 2.51
5 Primary Sector 36.79 54.36 8.90 32.40
6 Manufacturing 2.91 5.93 -1.65 5.73
7 Construction 21.53 12.51 22.32 21.28
8 Electricity, Gas and -0.52 0.00Water Supply
9 Secondary Sector 23.92 18.44 26.41 22.64
10 Transport, Storage 2.66 0.79 24.42 8.33and Comm.
11 Trade, Hotel and 9.40 5.43 1.91 6.44Restaurant
12 Banking and Insurance 1.09 3.30 4.52 4.70
13 Real Estate, Ownership 0.37 3.57 -0.30 5.44of Dwellings and BusinessServices
14 Public Administration 17.54 5.63 28.25 15.56
15 Other Services 8.23 8.48 12.23 14.23
16 Tertiary Sector 39.29 27.20 64.68 44.96
Total 100.00 100.00 100.00 100.00
Source: Calculated from Estimates of Domestic Product, Arunachal Pradesh,Directorate of Economics and Statistics, Itanagar, 2005.
There is a significant decadal variation in the relative
sectoral contributions to the growth of NSDP in
Arunachal Pradesh. In the 1970s agriculture contributed
35.56 per cent of the State’s economic growth, which
increased to 41.95 per cent in the 1980s but declined
steeply to a modest 12.03 per cent during 1990-91 to
2004-05. It was in the 1980s that the primary sector’s
contribution soared to the peak rate of 54.36 per cent and
in the last period it had dropped to only 8.90 per cent. In
the post-1990 phase, forestry and logging made a negative
contribution of more than 6 per cent. It is interesting to
note that the secondary sector’s contribution to the NSDP
growth dipped in the 1980s and rose sharply in the last
period. The contributory role of the tertiary sector
followed almost a similar pattern as that of the secondary
sector—in the 1970s the tertiary sector’s contribution
amounted to 39.29 per cent, and then rose to 64.68 per
cent during 1990-91 to 2004-05.
Inter-District Variations in Level of Income
The levels of income at the district level, as captured
by the per capita net district domestic product (NDDP)
shows considerable inter-district variations. Between
1993-94 and 2003-04, the average per capita income of
the poorest district, Lower Subansiri, was just 53.47 per
cent of that of the richest district, Dibang Valley. Among
the 13 districts, six districts, viz., Dibang Valley, West
Kameng, East Siang, Tawang, Upper Siang, and Papum
Pare had a per capita income higher than that of the State.
At the lower end of the income ladder, the districts having
a low per capita income included East Kameng, Changlang
and Lower Subansiri (Annexure Table A-3.1).
Growth of Income in the Districts:1993-94 to 2003-04
Sharp variations in the growth of income in different
districts of Arunachal Pradesh are noticed during 1993-94
to 2003-04. The highest growth in district domestic
product was registered in Upper Siang; its income grew at
the average annual exponential rate of 7.84 per cent, the
highest among all the 13 districts of the State. The NDDP
of Papum Pare grew at the average rate of 5.0 per cent per
annum during the period. East Siang had a negative
growth of 0.84 per cent (Table 3.5). Dibang Valley, the
district having the highest per capita income among all
the districts of Arunachal Pradesh had a growth rate of
0.24 per cent, a rate which is much below the State
average. Lower Subansiri, the district with the lowest per
capita income experienced a growth rate of 4.49 per cent.
TABLE 3.5
District-wise Growth Rate of Net DistrictDomestic Product: 1993-94 to 2003-2004
1993-94 to 2003-04
Name of the District Growth Rate of Net Growth Rate of PerDomestic Product Capita Net Domestic
Product
Tawang 3.29 (7) -0.58 (9)
West Kameng 1.71(11) -1.33(12)
East Kameng 2.57(9) 1.70(5)
Papum Pare 5.00(3) -0.59(10)
Lower Subansiri 4.49(5) 3.30(2)
Upper Subansiri 5.24(2) 4.27(1)
West Siang 2.53(10) 1.14(7)
East Siang -0.84(13) -0.03(8)
Upper Siang 7.84 (1) -0.71(11)
Dibang Valley 0.24(12) -2.66(13)
Lohit 2.95(8) 1.30(6)
Changlang 4.33(6) 2.37(4)
Tirap 4.64(5) 2.96(3)
Arunachal Pradesh 3.10 1.53
Note: Growth rates are average yearly exponential growth rate of netdomestic product of a district/Arunachal Pradesh and that of percapita net domestic product of a district/Arunahal Pradeshrespectively. Figures within brackets refer to rank of districts.
Source: Same as table 3.4

71Chapter 3 •
ECONOMIC GROWTH, STRUCTURAL CHANGE AND WORKFORCE PARTICIPATION
Composition of District Domestic Product
The sectoral composition of district product provides
some interesting insights into the inter-district variation
in the changes in the structure of production in Arunachal
Pradesh. There were at least four districts, where, on an
average, agriculture contributed less than 25 per cent of
the district domestic product during 1993-94 to 2000-01.
It is not just that in the highly urbanised Papum Pare
district agriculture contributed around 13 per cent of the
NDDP, but also in few others, such as West Kameng
(14.45), Tirap (27.52) and Upper Subansiri (25.74), the
share of agriculture is considerably low. In fact, the only
district, which, on an average, derived more than 40 per
cent of its district domestic product from agriculture, was
East Siang (Annexure Table A-3.3). West Kameng, Lohit,
Changlang and Tirap districts had a relatively high
dependence on forestry and logging. As a whole, the share
of the primary sector in the NDDP ranged from 18.21 per
cent in Papum Pare to around 55 per cent in Changlang.
The other district deriving more than 45 per cent of the
district domestic product from the primary sector were
Dibang valley, East Siang and Upper Siang."
The relatively insignificant contribution of
manufacturing to the State’s economy is brought out
sharply from the analysis of its contribution at the district
level. Out of the 13 districts, in as many as 9 districts, the
share of manufacturing in NDDP was less than 2.5 per
cent. The share of manufacturing was highest in Tirap
(10.45 per cent), while the least industrialised district,
Tawang, derives less than 1 per cent of its income from
manufacturing. Within the secondary sector, construction
has come to play a more significant role than
manufacturing. In 5 of the 13 districts, on an average, it
has contributed to more than 20 per cent of the NDDP.
The relative prominence of the tertiary sector in the
State’s NSDP also gets manifested at the district level. In
the 2 districts of Papum Pare and Tawang, its share has
been more than 50 per cent, while in 9 others it ranges
from 30-40 per cent. The lowest share of the tertiary
sector was 27.25 per cent in Upper Siang district.
The considerable inter-district variations in the share
of different sectors in the NDDP, clearly brings out the
spatial unevenness in the transformation of the State’s
economy. The district level analysis, nevertheless, does
point out the great deal of similarity in the nature of
economic transformation across the districts, so far as
some broad features of the transformation process, such
as the relative insignificance of manufacturing and the
predominance of the service sector are concerned.
Although the 10-year period under consideration here
is too short to study the changes in the structure of the
domestic product, the fall in the share of the secondary
sector along with that of the primary sector, at the district
level is too pervasive to be neglected (Annexure Table A-
3.3). In all the districts, without any exception, the
relative importance of the tertiary sector has increased.
The fall in relative share of the primary sector is 1.78 per
cent points and that in the share of the secondary sector
is 0.43 per cent points for the entire state. The total fall in
the shares of these two sectors is 2.21 per cent points
which is matched by the rise in the share of tertiary
sector. In the tertiary sector, public administrations
relative share has increased in all the districts.
The share of agriculture has declined in all but two
districts of the state—Upper Subansiri and Upper Siang.
In Upper Siang agriculture’s share increased by 2.18 per
cent points per annum and in Upper Subansiri the share
of agriculture increased slowly by 0.17 per cent points per
annum. In Arunachal Pradesh as a whole the share of
agriculture fell marginally by 0.25 per cent points per
annum. The share of forestry and logging fell in all the
districts, with the highest fall of 2.44 per cent points per
annum in Tirap. The fall in the share of forestry and
logging in the composition of domestic product was also
pronounced in West Kameng, which experienced a yearly
fall of 2.36 per cent points. In Arunachal Pradesh forestry
and logging lost its share in NSDP by an average of 1.53
per cent points per annum during 1993-94 to 2000-01.
The share of manufacturing industry in domestic product
grew very slowly in some districts, in others the share
remained unchanged or even went down further
(Annexure Table A-3.3).
Sectoral Distribution of Workers
Along with the changes in the structure of production,
the sectoral distribution of the workers in Arunachal
Pradesh has also undergone some important changes. The
share of primary sector workers came down from 80.40
per cent in 1971 to 62.27 per cent in 2001. The share of
workers engaged in the secondary sector increased from a
negligible 0.44 per cent to 11.41 per cent during the same
period, and the share of the tertiary sector workers went
up from 19 per cent to around 26 per cent during the
same period. While changes in the distribution of workers
broadly follow the direction of changes in the structure of
production, the pace of changes in the employment
structure is much slower. Two important aspects of this
changing pattern of employment in Arunachal Pradesh

ARUNACHAL PRADESH DEVELOPMENT REPORT72
are, firstly, the pace of transformation has been much
slower in the rural than in the urban areas; and secondly,
women in general and rural women in particular, are
moving out of agriculture rather at a much slower pace.
Even in 2001, for example, 74 per cent of rural workers
were still engaged in the primary sector. In the case of
female workers, their share in primary sector was as high
as 89 per cent in rural areas and 82 per cent in all areas.
(Table 3.6).
When the composition of workers is analysed at a
disaggregated level, it is noticed that although the share of
cultivators had been declining, that of agricultural
labourers had been increasing during 1971-1991 (Table 3.
7). Less than 3 per cent of workers in the State are
engaged in the manufacturing sector. Over the years the
share of workers engaged in the household manufacturing
has declined and that in non-household manufacturing has
slightly increased. Although the share of workers in
construction increased substantially during 1971-1991, it
decreased during 1981-1991, bringing down the share of
workers in the secondary sector during the latter period.
Within the tertiary sector, share of workers engaged in
trade and commerce as well as in other services, that
includes public administration went up substantially.
Occupational Structure ofWorkers at District Level
The industrial classification of main workers at the
district level shows a marked unevenness in the process of
workforce restructuring in the State. In 1981, the share of
cultivators in total main workers ranged from 84 per cent
in Upper Subansiri to only 47.47 per cent in Dibang
Valley. In all the districts, a negligible percentage of total
workers were engaged in household manufacturing, and in
non-household manufacturing the highest share was in
Lohit district, which was only 4.7 per cent. The share of
workers in construction in total main workers ranged
from a low of 5.96 per cent in Tirap to a high of 13.40 per
cent in West Kameng. During 1980s the shift of workers
away from agriculture continued in all the districts, but
with an uneven pace. In districts such as East Kameng
and Lohit, more than 70 per cent of the workers were still
in the cultivator category, while in others, such as Dibang
Valley it had come down to less than 40 per cent in 1991.
Around 20 per cent of workers in Dibang Valley were
agricultural labourers and their share in rural areas was
even higher. But in none of the districts, the share of
manufacturing showed a significant rise. It was rather
construction activities whose share reached in between 6
to 11 per cent in a number of districts. Similarly, the
share of ‘other services’ ranged from 35 per cent in
Tawang to 12 per cent in East Kameng (Annexure Table
A-3.4 and A-3.5).
Although, figures in Annexure Table A-3.6 are based
on both main and marginal categories of workers, yet the
essential features of workforce restructuring at the district
level could be made out from it. Among all the districts,
Papum Pare has the lowest share in cultivation, which is
less than 25 per cent, while three districts have more than
70 per cent of the total workers in cultivation. The share
of agricultural labourers in total workers is the highest in
Dibang Valley, while it is the lowest in Tirap. In all the
TABLE 3.6
Sectoral Distribution of Workers by Industries in Arunachal Pradesh: 1971-2001
Areas Primary Secondary Tertiary
1971 1981 1991 2001 1971 1981 1991 2001 1971 1981 1991 2001
Total Male 68.78 63.21 54.60 51.57 0.65 13.13 12.34 14.54 30.56 23.66 33.06 33.93
Female 97.12 95.11 89.93 81.70 0.14 2.00 2.21 5.74 2.74 2.89 7.87 12.55
Total 80.44 75.28 67.44 62.27 0.44 8.92 8.66 11.41 19.12 15.80 23.90 26.32
Rural Male 72.30 68.00 62.34 64.59 0.55 11.85 11.09 12.18 27.15 20.15 26.57 23.23
Female 97.38 96.10 92.61 89.04 0.11 1.74 1.87 4.47 2.50 2.16 5.52 6.49
Total 82.92 79.08 74.13 74.14 0.36 7.87 7.50 9.17 16.72 13.06 18.37 16.69
Urban Male 5.39 6.75 6.72 6.70 2.58 28.25 20.10 22.63 92.03 65.00 73.18 70.64
Female 45.99 30.60 22.46 15.40 5.75 18.93 10.69 17.22 48.26 50.47 66.85 67.39
Total 8.01 9.25 8.86 8.40 2.78 27.27 18.82 21.57 89.21 63.47 72.32 70.03
Sources: i. Census of India: Arunachal Pradesh (1971) Series-24, Part-II (B)
ii. Census of India: Arunachal Pradesh (1981) Series-24, Part-III (A&B)
iii. Census of India: Arunachal Pradesh (1991) District Census Handbook, 1991, Series-III.

73Chapter 3 •
ECONOMIC GROWTH, STRUCTURAL CHANGE AND WORKFORCE PARTICIPATION
districts the share of workers in household industry
remains below 1.5 per cent of the total workers.
Trends in Workforce Participation: 1971-2001
The overall work participation rate (WPR) in
Arunachal Pradesh went down from around 58 per cent in
1971 to nearly 44 per cent in 2001 (Figure 3.2). The rural
WPR has all along been higher than that in the urban
areas. WPR in Arunachal Pradesh, during 1981-1991, for
both males and females, were higher than the national
average. However, the gap between the two was wider in
case of female work participation rate (FWPR). In 2001,
FWPR of the State was 36.45 per cent in comparison with
the national average of 25.68 per cent. The gap between
male and female WPRs in the State was lower than that at
the national level. This can be attributed to the relatively
higher percentage of ST population as well as the low
levels of development in the State.
FIGURE 3.2
Work Participation Rates in Arunachal Pradesh: 1971-2001
0
10
20
30
40
50
60
70
80
1971 1981 1991 2001
Male (Total)
Female (Total)
All Persons (Total)
Male (Rural)
Female (Rural)
All Persons (Rural)
Male (Urban)
Female(Urban)
All Persons(Urban)
There has been a persistent decline in both male and
female WPRs in rural areas, and for males in urban areas.
In particular, there has been a remarkable decline in the
FWPR in the rural areas.1 The gap between male and
female WPRs had been increasing during 1971-1991 but
in the 1990s it has declined, partly because of a sharper
fall in male work participation rate during the period. As
expected, gender gap in work-participation is much higher
in the urban areas than the rural areas. The FWPRs have
been very low in the urban areas, although it has shown a
rise from 11 per cent in 1971 to 17 per cent in 2001.
The inter-district variations in work participation rates
have been presented in Annexure Table A-3.7 through
Table A-3.9. In 2001, the overall WPR varied from 56.31
per cent in Tawang district to 36.32 per cent in Papum
Pare district. In urban WPR the highest was recorded in
Tawang, but East Siang had the lowest overall WPR. In
terms of rural WPR, Tawang and Papum Pare were at the
top and the bottom respectively. So far as female work
participation rates are concerned, in 2001, Tawang, closely
followed by Tirap had the highest FWPR, while Papum
Pare the lowest. In case of urban FWPRs, which were
significantly below those in rural areas in all the districts,
East Kameng was at the top while Lohit had the lowest
value. The rural FWPR, which shows a great deal of inter-
district variations, was highest in Tirap and lowest in
Papum Pare. So far as the gender gap in work
1. The relationship between economic development and female work participation rate has been a widely-debated issue. Often it is conceptualised in terms ofa U-shaped curve. At initial stages of development a good portion of non-agricultural productive activity takes place in households where females find iteasy to combine their traditional domestic responsibilities with part-time productive endeavour. With movement to higher levels of development as theproduction structure gets more formalised, the scope of such informal work shrinks. A second set of arguments emphasises the role of shrinkage in spanof working age, resulting from greater consciousness of the need for learning rather than earnings in early years of life on the one hand and lowering ofaverage exit age with the growth of organised sector on the other, in contributing to the decline of work of both males and females (Durand, 1975). At anadvanced stage of development, spread of education among women, skill-acquisition as well as rising levels of living enhances the employability of womenin the economy, particularly in the service sector, leading to rising work participation rates among females.
TABLE 3.7
Changes in Sectoral Distribution ofWorkers in Arunachal Pradesh
Sectors Percentage of Workers
1971 1981 1991
Cultivators 78.34 71.26 60.36
Agricultural Labourers 1.96 2.49 5.13
Livestock/Forestry/Fishing 0.14 1.51 1.77
Mining and Quarrying 0 0.02 0.18
Primary Sector 80.44 75.28 67.44
Manufacturing in Household Industry 0.31 0.32 0.19
Manufacturing other than in Household 0.04 1.64 2.49Industry
Construction 0.1 6.97 5.98
Secondary Sector 0.44 8.92 8.66
Trade and Commerce 0.58 2.22 3.31
Transport, Storage and Communication 0 0.41 1.13
Other Services 18.54 13.17 19.47
Tertiary Sector 19.12 15.8 23.9
Total 100 100 100
Sources: Census of India (Arunachal Pradesh) 1971, 1981 and 1991 EconomicTables.

ARUNACHAL PRADESH DEVELOPMENT REPORT74
participation was concerned, West Kameng had the
highest and Lower Subansiri the lowest gap in overall
work participation. The gender gap in work participation
was considerably lower in rural than in urban areas. West
Kameng, followed by Lohit, had the highest gender gap in
rural WPR while Lower Subansiri and Tirap had the
lowest gender gap. The gender gap in WPR was
significant in urban areas—it was the highest in Tirap and
Changlang and was the lowest in East Kameng and Lower
Subansiri. So far as the determinants of inter-district
variations in overall WPR are concerned, it is found that
WPR is negatively correlated with literacy in 1991 as well
as in 2001.2
Conclusion
The significance of the process of structural
transformation of Arunachal Pradesh’s economy lies in the
speed with which a set of relatively isolated, jhum-based
economies got transformed into a money-based economy
within few decades. The analysis of the level and growth
of the per capita income of the state, notwithstanding the
limitations of the data, clearly points out that starting
from a very low base the State’s economy has grown, on
average, at a comparatively high growth rate. But in the
1990s, particularly after 1993-94, the growth rate of the
economy slowed down substantially. There has been a
decline in the share of the primary sector in NSDP, but
the share of the manufacturing sector continues to be
abysmally low in the State. On the other hand, there has
been a phenomenal growth of the service sector. This
sector has maintained a higher growth rate than the other
two sectors, and its contribution to the growth was
substantial during 1970-71 to 2001-02. The declining
significance of the primary sector, the relative
insignificance of the secondary sector in general, and that
of manufacturing in particular as well as the growing
importance of the service sector in the State's economy
come out in bolder relief at the district level analysis.
However, the spatially uneven process of transformation
as well as the high degree of inter-district variations of per
capita income has also been brought out by the foregoing
analysis.
The work participation rates in the State had been
consistently declining during 1971-2001, for all categories
of workers, with the sole exception of urban female
workers. With increasing opportunity for formal
education, the young age population in general, and young
girls in particular have been withdrawing from the
workforce to get educated before they enter the job
market. Other possible reasons could be the move away
from labour-intensive shifting cultivation practices,
withdrawal of the old and the women from the economy
as a result of betterment of standard of living, changes in
the family composition of the migrants to the State, etc.
So far as the changing sectoral composition of workers is
concerned, it is noticed that there is a steady decline in
the share of workers in the primary sector. While the
proportion of workers in the secondary sector has
increased, mainly because of the growth in the
construction sector, that of the workers in the tertiary
sector has shown a remarkable rise.
Our analysis shows that agriculture, construction,
transport, storage, communications, trade, business and
public administration are the dynamic activities in the
economy. In terms of growth of inputs, there has been a
2. The results of the regression analysis are as follows: For 1991, WPR91
= 65.623 – 0.459 Lit91
* (–6.030), R2 = 0.802, Adj R2 = 0.780, N= 11, and for 2001,WPR
01= 67.322 – 0.420 Lit
01* (–3.463), R2 = 0.522, Adj R2 = 0.478, N= 12; where * implies significance at 1 per cent level and figures within the brackets
are t-values.
TABLE 3.8
Work Participation Rates in ArunachalPradesh and India: 1971-2001
(Percentages)
Arunachal Pradesh 1971 1981 1991 2001
All Populations Male 63.14 58.63 53.76 50.69
Female 51.28 45.67 37.49 36.45
Total 57.65 52.63 46.24 43.97
Rural Male 62.78 58.50 53.69 51.13
Female 52.27 47.64 40.86 41.33
Total 57.88 53.42 47.69 46.47
Urban Male 70.32 60.24 54.18 48.99
Female 10.58 11.62 11.95 16.69
Total 51.57 41.47 36.39 34.19
India
All Populations Male 52.7 52.6 51.6 51.93
Female 13.9 19.8 22.3 25.68
Total 34.0 36.8 37.5 39.26
Rural Male 53.6 53.8 52.5 52.36
Female 15.5 23.2 26.7 30.98
Total 36.1 38.9 40.0 41.97
Urban Male 48.9 49.1 48.9 50.85
Female 7.1 8.3 9.2 11.55
Total 29.6 30.0 30.2 32.23
Note: (i) Work Participation Rates = {Total Workers (Main + Marginal)/Total Population} ×100
(ii) Figures for 2001 are based on provisional population totals.
Source: Census of India 2001, Series-13, Arunachal Pradesh, ProvisionalPopulation Totals, Paper-3 of 2001.

75Chapter 3 •
ECONOMIC GROWTH, STRUCTURAL CHANGE AND WORKFORCE PARTICIPATION
robust expansion of land under cultivation in general and
that under permanent cultivation in particular, both the
quantity and quality of the labour force has improved
through both migration from outside the State and
improvement in the levels of educational attainment, and
finally, there has been a steady growth of physical capital,
though the magnitude of its increase, in the absence of
data, is difficult to ascertain. However, the prime mover of
the growth of the economy has been the flow of funds
from the Centre. For a number of historical, political and
strategic considerations, outlined in earlier chapters, the
State has been playing a central role in modernising, and
thereby increasing the productive capacity of the economy.
Under special constitutional provisions, the State has been
receiving central funds to the tune of around 70 per cent
of the State's revenue and around 50 per cent of its
NSDP. As a proportion of the State income, the inflow
from the Centre has been declining in recent years, but
the absolute value of the inflow in real terms is not
falling—in fact it is increasing. During the 17 years from
1986-87 to 2002-03 the real inflow increased at the
constant annual growth of 2.55 per cent. However, the
inflow as a percentage of the State income declined on an
average by 2.15 points per year. The relative importance
of the inflow in the State budget has changed little since
the mid-1980s. During the period 1986-87 to 2001-02,
the inflow of funds from the Centre constituted about 80
per cent of the total revenue of the State. In 2002-03
however the proportion declined to about 68 per cent3
(GoAr P, 2005). There is an urgent need to expand and
consolidate the earnings of the State's own financial
resources.
The chapters on various sectors of the economy have
identified several key areas, which needs urgent attention
for creating a strategy of sustainable and inclusive
growth.4 The prospect of creating an industrial base in the
State seems daunting in the light of the ecological and
economic specificities of the State. However, a carefully
designed strategy for establishing specific industries
having strong forward and backward linkages is the need
of the hour. At the same time, the earlier reliance on
state-owned and state-initiated industrialisation should be
reviewed in the light of the changes in the economic
environment at the national as well as the regional level.
The hydro-power potential of the state has been much
talked about. But the success of this sector depends on
massive investment in the power sector both by the public
as well as the private sector. Making the private sector
interested in long-term and heavy investments in the state
requires an imaginative public policy. Effective and
efficient institutional structures are key to the
development process. Issues like transparency and
accountability in governance are going to play an
increasingly significant role in fostering economic growth
in Arunachal Pradesh.
3. For a detailed discussion on the fiscal issues and the dependence of the state government on Central government see the chapter on fiscal issues.
4. Also see the chapter devoted to development strategy, which contains a review of the strategies followed so far and suggest various measures to develop alocally relevant development strategy, keeping in mind the various specificities of the State.

ARUNACHAL PRADESH DEVELOPMENT REPORT76
ANNEXURE TABLE A-3.1
Per Capita Net Domestic Products in Districts of Arunachal Pradesh: 1993-94 to 2003-04
District Minimum Maximum Mean Rank Std.Deviation
Tawang 9287 12082 10265.00 3 996.84
W. Kameng 10698 14740 12108.27 2 1279.56
E. Kameng 6703 8939 7638.18 12 797.21
Papum Pare 7848 10582 9211.09 6 781.70
L.Subansiri 5811 8415 6715.09 13 985.75
U.Subansiri 6075 9670 7844.18 10 1200.83
West Siang 7842 9465 8737.36 8 574.70
East Siang 8223 12203 10150.55 4 1647.37
Upper Siang 8912 10374 9662.56 5 463.21
Dibang Valley 10181 13890 12559.82 1 1363.41
Lohit 7655 9891 8771.73 7 751.60
Changlang 6364 9626 7757.18 11 1119.33
Tirap 7166 10391 8295.91 9 1240.53
Note: Unit of Minimum, Maximum, Mean and Std. Deviation is Rupee.
Source: Computed from Estimates of District Domestic Product, Directorate of Economics and Statistics, Government of Arunachal Pradesh, Itanagar, various years.
ANNEXURE TABLE A-3.2
Growth Rates of District Domestic Product in Arunachal Pradesh: 1993-94 to 2003-04
Tawang West East Papum Lower Upper West East Upper Dibang Lohit Changlang TirapKameng Kameng Pare Subansiri Subansiri Siang Siang Siang Valley
Agriculture -1.21 0.67 1.83 1.69 6.12 7.29 -0.88 -9.08 59.06 -8.56 1.33 5.67 8.37
Forest, etc. -6.05 -14.79 -16.43 -9.62 -19.30 -21.23 -23.10 -13.96 -11.00 -10.05 -5.99 -9.33
Fishing -0.83 7.02 0.52 8.08 -1.60 -2.22 -8.93 1.94 24.06 4.90 8.99 16.84 -12.55
Mining and Quarrying 9.79 53.97 33.55 1.63 8.40 18.67
Primary Sector -2.49 -6.51 -0.32 0.05 3.39 4.23 -2.81 -9.15 -7.13 -1.22 3.81 4.04
Manufacturing -0.42 -0.01 -0.19 0.12 0.98 -0.30 0.06 0.12 0.26 0.12 0.10 0.11 0.10
Construction 0.81 0.59 0.60 0.60 0.59 0.60 0.59 0.60 0.60 0.59 0.60 0.58 0.59
Secondary Sector 2.14 4.35 1.21 -0.26 1.36 1.04 1.20 1.17 0.88 0.97 0.90 0.99 0.87
Transport, Storage, etc. 12.73 12.79 12.62 12.61 12.67 12.66 12.62 12.58 12.56 12.64 12.62 12.57 12.60
Trade, Hotel 1.16 1.14 1.10 1.14 1.13 1.14 1.15 1.15 1.06 1.14 1.13 1.14 1.13
Banking and Insurance 12.40 12.58 12.62 12.58 12.58 12.56 12.61 12.67 12.43 12.66 12.54 18.86 12.54
Real Estate, etc. 4.57 4.93 4.97 6.74 4.76 4.85 5.21 4.63 4.75 4.61 5.16 4.49 4.77
Public Admin. 9.72 9.73 9.66 9.70 9.66 9.68 9.65 9.66 9.68 9.69 9.65 9.67 9.34
Other Services 8.09 8.09 8.03 8.09 8.11 8.09 8.10 8.09 8.09 8.09 8.10 8.10 8.08
Tertiary Sector 7.98 8.12 8.44 9.18 8.44 8.20 8.31 8.03 8.40 8.32 8.42 7.97 8.15
Source: Computed from Estimates of District Domestic Product, Directorate of Economics and Statistics, Government of Arunachal Pradesh, Itanagar, various years.
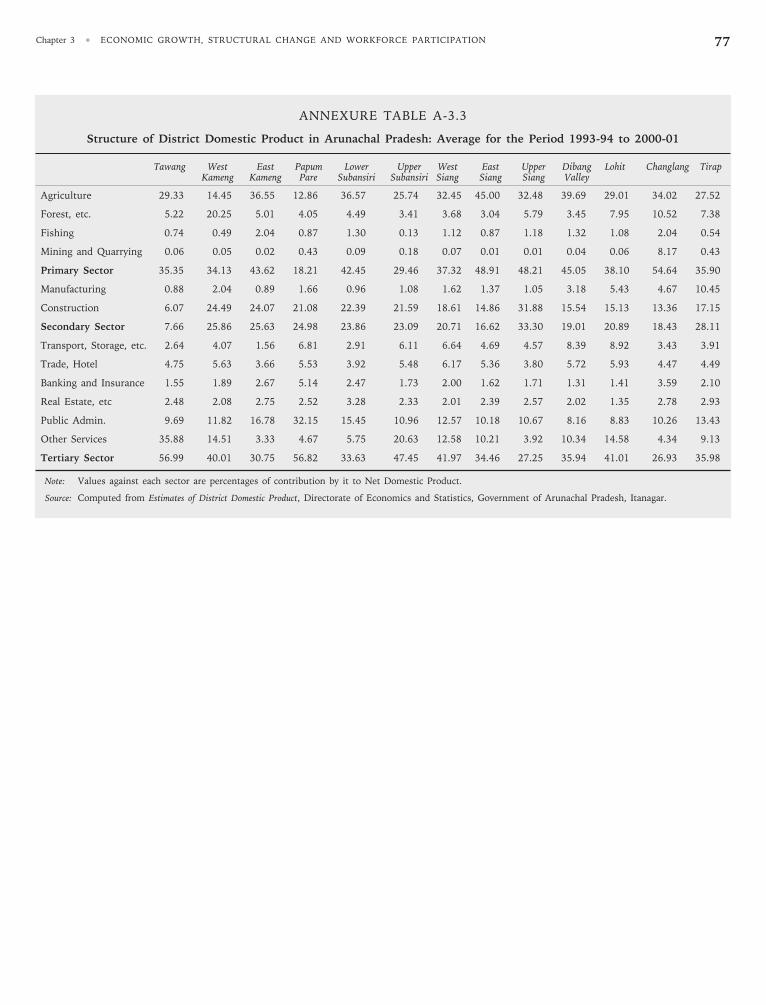
77Chapter 3 •
ECONOMIC GROWTH, STRUCTURAL CHANGE AND WORKFORCE PARTICIPATION
ANNEXURE TABLE A-3.3
Structure of District Domestic Product in Arunachal Pradesh: Average for the Period 1993-94 to 2000-01
Tawang West East Papum Lower Upper West East Upper Dibang Lohit Changlang TirapKameng Kameng Pare Subansiri Subansiri Siang Siang Siang Valley
Agriculture 29.33 14.45 36.55 12.86 36.57 25.74 32.45 45.00 32.48 39.69 29.01 34.02 27.52
Forest, etc. 5.22 20.25 5.01 4.05 4.49 3.41 3.68 3.04 5.79 3.45 7.95 10.52 7.38
Fishing 0.74 0.49 2.04 0.87 1.30 0.13 1.12 0.87 1.18 1.32 1.08 2.04 0.54
Mining and Quarrying 0.06 0.05 0.02 0.43 0.09 0.18 0.07 0.01 0.01 0.04 0.06 8.17 0.43
Primary Sector 35.35 34.13 43.62 18.21 42.45 29.46 37.32 48.91 48.21 45.05 38.10 54.64 35.90
Manufacturing 0.88 2.04 0.89 1.66 0.96 1.08 1.62 1.37 1.05 3.18 5.43 4.67 10.45
Construction 6.07 24.49 24.07 21.08 22.39 21.59 18.61 14.86 31.88 15.54 15.13 13.36 17.15
Secondary Sector 7.66 25.86 25.63 24.98 23.86 23.09 20.71 16.62 33.30 19.01 20.89 18.43 28.11
Transport, Storage, etc. 2.64 4.07 1.56 6.81 2.91 6.11 6.64 4.69 4.57 8.39 8.92 3.43 3.91
Trade, Hotel 4.75 5.63 3.66 5.53 3.92 5.48 6.17 5.36 3.80 5.72 5.93 4.47 4.49
Banking and Insurance 1.55 1.89 2.67 5.14 2.47 1.73 2.00 1.62 1.71 1.31 1.41 3.59 2.10
Real Estate, etc 2.48 2.08 2.75 2.52 3.28 2.33 2.01 2.39 2.57 2.02 1.35 2.78 2.93
Public Admin. 9.69 11.82 16.78 32.15 15.45 10.96 12.57 10.18 10.67 8.16 8.83 10.26 13.43
Other Services 35.88 14.51 3.33 4.67 5.75 20.63 12.58 10.21 3.92 10.34 14.58 4.34 9.13
Tertiary Sector 56.99 40.01 30.75 56.82 33.63 47.45 41.97 34.46 27.25 35.94 41.01 26.93 35.98
Note: Values against each sector are percentages of contribution by it to Net Domestic Product.
Source: Computed from Estimates of District Domestic Product, Directorate of Economics and Statistics, Government of Arunachal Pradesh, Itanagar.

ARUNACHAL PRADESH DEVELOPMENT REPORT78
ANNEXURE TABLE A-3.4
Industry-wise Distribution of Workers in Districts of Arunachal Pradesh: 1981
District Cultivators Agri. Livestock Mining Household Other Const. Trade and Transport, OtherLab Forestry and Industries than Commerce Storage Services
etc. Quarrying Household andIndustries Comm.
West Kameng
T 57.72 1.90 3.68 0.01 0.48 1.82 13.40 3.21 0.54 17.25
R 60.57 1.95 3.81 0.00 0.47 1.56 12.97 2.75 0.44 15.49
U 1.99 0.96 1.22 0.06 0.58 6.87 21.89 12.13 2.44 51.86
East Kameng
T 81.65 0.84 1.07 0.00 0.06 0.38 7.48 1.30 0.11 7.12
R 81.65 0.84 1.07 0.00 0.06 0.38 7.48 1.30 0.11 7.12
U - - - - - - - - - -
L/Subansiri
T 73.82 1.03 0.94 0.00 0.31 0.91 6.67 1.98 0.36 13.98
R 82.70 1.12 0.55 0.00 0.26 0.39 3.91 1.17 0.12 9.80
U 1.70 0.29 4.14 0.00 0.70 5.21 29.12 8.55 2.38 47.91
U/Subansiri
T 83.60 0.45 0.16 0.00 0.12 0.52 2.36 1.18 0.13 11.48
R 83.60 0.45 0.16 0.00 0.12 0.52 2.36 1.18 0.13 11.48
U - - - - - - - - - -
West Siang
T 78.02 1.29 0.52 0.00 0.64 0.74 4.91 1.95 0.34 11.61
R 85.41 1.30 0.43 0.00 0.34 0.52 3.67 1.11 0.23 6.99
U 10.22 1.16 1.36 0.00 3.38 2.72 16.23 9.68 1.36 53.89
East Siang
T 70.88 5.31 0.57 0.11 0.54 1.07 7.67 2.35 0.35 11.17
R 77.22 5.51 0.46 0.12 0.35 0.78 7.23 1.33 0.13 6.89
U 11.60 3.49 1.60 0.03 2.34 3.78 11.73 11.89 2.37 51.15
Dibang Valley
T 47.47 13.06 1.93 0.00 0.23 1.83 8.58 4.16 0.63 22.11
R 47.47 13.06 1.93 0.00 0.23 1.83 8.58 4.16 0.63 22.11
U - - - - - - - - - -
Lohit
T 59.63 2.73 1.96 0.00 0.32 4.73 6.16 3.41 0.82 20.25
R 64.20 2.94 1.87 0.00 0.21 4.79 5.16 2.51 0.58 17.75
U 3.23 0.15 3.63 0.00 2.02 4.64 21.67 0.30 4.44 59.93
Tirap
T 76.68 1.64 2.27 0.02 0.12 2.28 5.96 1.57 0.41 9.04
R 76.68 1.64 2.27 0.02 0.12 2.28 5.96 1.57 0.41 9.04
U - - - - - - - - - -
A.P.
T 71.30 2.49 1.51 0.02 0.32 1.64 6.97 2.17 0.41 13.18
R 75.05 2.57 1.45 0.02 0.24 1.48 6.15 1.74 0.30 11.02
U 5.55 1.12 2.75 0.01 1.72 4.51 21.60 8.77 2.41 51.57
Source: Census of India, 1981, Economic Tables.

79Chapter 3 •
ECONOMIC GROWTH, STRUCTURAL CHANGE AND WORKFORCE PARTICIPATION
ANNEXURE TABLE A-3.5
Industry-wise Distribution of Workers in Districts of Arunachal Pradesh: 1991
District Cultivators Agri. Livestock Mining Household Other Const. Trade and Transport, OtherLab Forestry and Industries than Commerce Storage Services
etc. Quarrying Household andIndustries Comm.
Tawang
T 51.7 5.8 1.7 0 0.3 0.5 2.0 2.9 0.5 34.5
R 51.7 5.8 1.7 0 0.3 0.5 2.0 2.9 0.5 34.5
U - - - - - - - - - -
West Kameng
T 43.3 3.8 3.1 0.0 0.7 2.1 11.2 5.0 1.2 29.6
R 47.2 4.0 3.2 0.0 0.8 1.9 10.8 4.5 1.0 26.6
U 2.3 1.9 1.1 0.0 0.2 4.0 15.6 10.9 3.7 60.3
East Kameng
T 76.7 1.5 1.0 0 0.1 0.5 5.8 1.7 0.2 12.5
R 76.7 1.5 1.0 0 0.1 0.5 5.8 1.7 0.2 12.5
U - - - - - - - - - -
L/Subansiri
T 62.2 2.5 1.1 0.0 0.1 1.1 6.6 2.9 1.0 22.6
R 76.4 2.8 0.7 0.0 0.1 0.8 4.7 1.1 0.4 13.2
U 5.5 1.4 2.4 0.0 0.4 2.4 13.9 10.2 3.5 60.2
U/Subansiri
T 68.0 1.0 0.3 0.0 0.4 0.5 5.7 2.8 1.0 20.3
R 68.0 1.0 0.3 0.0 0.4 0.5 5.7 2.8 1.0 20.3
U - - - - - - - - - -
West Siang
T 64.9 2.2 0.4 0.0 0.1 1.4 6.0 3.9 1.4 19.8
R 73.1 2.4 0.5 0.0 0.1 1.2 5.4 2.5 1.2 13.6
U 8.5 0.7 0.3 0.0 0.1 3.2 9.8 12.9 2.6 62.0
East Siang
T 57.9 9.9 1.8 0.0 0.1 4.4 7.0 3.6 1.1 17.2
R 64.2 10.8 1.7 0.0 0.1 4.6 5.9 2.4 1.0 13.2
U 9.5 3.3 2.6 0.0 0.3 3.0 14.8 12.9 5.2 48.1
Dibang Valley
T 37.8 19.2 2.4 0.0 0.1 4.4 7.3 5.2 2.5 21.1
R 42.8 21.4 2.2 0.0 0.1 4.6 7.2 3.5 1.9 16.4
U 2.5 3.9 4.4 0.0 0.3 3.0 7.8 17.4 6.7 54.2
Lohit
T 51.5 6.1 2.6 0.0 0.2 6.0 5.7 4.4 2.1 21.4
R 62.8 7.3 2.6 0.0 0.2 4.1 4.0 2.3 1.6 15.2
U 2.7 1.1 2.4 0.0 0.3 14.3 13.2 13.1 4.5 48.3
Changlang
T 62.5 9.2 3.5 1.5 0.2 4.2 4.2 2.7 0.7 11.3
R 62.5 9.2 3.5 1.5 0.2 4.2 4.2 2.7 0.7 11.3
U - - - - - - - - - -
Tirap
T 72.7 0.6 1.8 0.1 0.0 3.7 4.3 2.2 0.6 13.9
R 77.8 0.6 1.8 0.2 0.0 3.8 3.6 1.6 0.4 10.3
U 0.1 1.3 1.2 0.0 0.1 2.0 15.3 11.0 3.3 65.8
Arunachal Pradesh
T 60.4 5.1 1.8 0.2 0.2 2.5 6.0 3.3 1.1 19.5
R 66.7 5.5 1.7 0.2 0.2 2.2 5.2 2.3 0.8 15.3
U 5.0 1.7 2.2 0.0 0.3 5.3 13.2 12.0 3.9 56.4
Source: Census of India 1991, Arunachal Pradesh District Profile 1991, Registrar General of India, New Delhi.

ARUNACHAL PRADESH DEVELOPMENT REPORT80
ANNEXURE TABLE A-3.6
Industry-wise Distribution of Total Workers inDistricts of Arunachal Pradesh: 2001
District Percentage to Total Workers (Main + Marginal)
Cultivators Agricultural Workers in Other WorkersLabourers Household
Industry
Tawang 43.00 2.11 0.45 54.44
West Kameng 35.42 3.99 1.03 59.56
East Kameng 70.95 2.74 0.33 25.98
Papum Pare 24.36 3.35 1.41 70.88
Lower Subansiri 72.24 3.36 0.62 23.78
Upper Subansiri 68.68 2.05 0.50 28.77
West Siang 63.24 2.01 1.37 33.38
East Siang 52.23 5.78 1.92 40.07
Upper Siang 65.08 2.39 0.17 32.36
Dibang Valley 53.99 7.19 0.60 38.22
Lohit 57.64 6.53 0.69 35.14
Changlang 69.94 5.40 0.98 23.68
Tirap 75.35 0.72 0.32 23.61
Arunachal Pradesh 58.44 3.85 0.86 36.85
Source: Census of India, 2001.
ANNEXURE TABLE A-3.7
Rural Work Participation Rates in ArunachalPradesh: 1991-2001
Districts 1991 2001
Total Male Female Total Male Female
Tawang 55.61 61.71 48.38 58.63 65.74 49.37
West Kameng 44.78 56.06 31.21 47.29 59.35 31.01
East Kameng 50.77 53.98 47.43 49.54 50.14 48.94
Papum Pare 43.60 50.72 35.19 36.53 43.53 28.96
Lower Subansiri 51.88 53.35 50.38 47.94 48.07 47.81
Upper Subansiri 47.38 51.37 42.78 43.97 44.70 43.24
West Siang 44.19 49.59 38.30 42.46 45.55 39.19
East Siang 42.86 4 9.37 35.72 41.09 45.23 36.74
Upper Siang 52.41 58.64 48.83 51.30 57.34 44.17
Dibang Valley 47.86 57.22 36.31 46.68 53.37 38.87
Lohit 45.98 54.92 35.27 44.52 52.13 35.73
Changlang 45.53 53.15 36.70 49.15 52.77 45.23
Tirap 52.82 55.25 50.06 51.19 51.48 50.87
Arunachal 47.69 53.69 40.86 46.47 51.13 41.33Pradesh
Note: Work Participation Rates has been calculated for total workers whichincludes both Main and Marginal Workers.
Source: Census of India, 2001, Series-13, Arunachal Pradesh, ProvisionalPopulation Totals, Paper-3 of 2001.
ANNEXURE TABLE A-3.8
Urban Work Participation Rates in ArunachalPradesh: 1991-2001
Districts 1991 2001
Total Male Female Total Male Female
Tawang - - - 38.26 54.86 18.59
West Kameng 37.77 54.36 15.64 33.96 48.15 17.26
East Kameng - - - 33.83 44.60 21.82
Papum Pare 35.64 53.20 14.10 36.12 49.71 20.66
Lower Subansiri 35.36 52.15 13.02 33.14 44.68 20.65
Upper Subansiri - - - 30.80 42.94 17.11
West Siang 37.06 53.27 12.25 36.63 52.64 15.98
East Siang 34.90 51.96 12.10 30.59 45.93 13.30
Upper Siang - - - - - -
Dibang Valley 34.95 50.76 11.74 33.18 48.80 12.68
Lohit 37.21 56.65 8.28 31.16 48.15 10.45
Changlang - - - 36.17 53.20 14.13
Tirap 40.42 61.78 8.81 35.80 55.49 11.49
Arunachal 36.39 54.18 11.95 34.16 48.99 16.69Pradesh
Note: Work Participation Rates has been calculated for total workers whichincludes both Main and Marginal Workers.
Source: Census of India, 2001, Series-13, Arunachal Pradesh, ProvisionalPopulation Totals, Paper-3 of 2001.
ANNEXURE TABLE A-3.9
Combined Work Participation Rates in ArunachalPradesh (Rural + Urban): 1991-2001
Districts 1991 2001
Total Male Female Total Male Female
Tawang 55.61 61.71 48.38 56.31 64.55 45.71
West Kameng 44.08 55.88 29.72 46.09 58.40 29.69
East Kameng 50.77 53.98 47.43 45.42 48.63 42.76
Papum Pare 40.22 51.78 26.31 36.32 46.71 24.79
Lower Subansiri 50.12 53.21 46.88 46.08 47.63 44.50
Upper Subansiri 47.38 51.37 42.78 40.22 44.17 36.12
West Siang 43.14 50.20 35.05 41.30 47.07 34.95
East Siang 41.24 49.94 31.31 38.45 45.41 31.01
Upper Siang 52.41 58.64 44.83 51.30 57.34 44.17
Dibang Valley 45.77 56.11 32.65 44.31 52.53 34.51
Lohit 44.12 55.31 30.09 42.04 51.38 31.16
Changlang 45.53 53.15 36.70 47.88 52.82 42.43
Tirap 51.79 55.85 47.08 48.84 52.13 45.23
Arunachal 46.24 53.76 37.49 43.97 50.69 36.45Pradesh
Note: Work Participation Rates has been calculated for total workers whichincludes both Main and Marginal Workers.
Source: Census of India, 2001, Series-13, Arunachal Pradesh, ProvisionalPopulation Totals, Paper-3 of 2001.

Introduction
Access to productive employment is one of the
important means of securing well-being. The employment-
unemployment situation in north-eastern states has an
added significance because of its perceived linkages with
insurgency and political instability, particularly because
the latter, apart from its other negative impacts, hampers
the growth prospects significantly by raising transaction
costs (Sarma, 2005).
Workforce Participation Rates
The proportion of population engaged in ‘economically
productive work’ is one of the widely used indicators of
human resource use. Workforce participation is studied
not only as a measure of the economic contribution of the
labour force but also to understand the degree to which
people are integrated into the economy. In Arunachal
Pradesh the workforce participation rate (WFPR) among
the rural males has increased from 422 per 1000 persons
in 1999-2000 to 504 in 2004-05. In case of urban males
also there has been an increase in the WFPR from 399
per 1000 persons to 463 during the same period. During
the period 1993-94 to 1999-2000 as per the usual status
criteria, there had been a decline in the male WFPR for
the State both in the rural and urban areas. In urban areas
there has been a noticeable increase in the WFPR for
urban males during 1999-2000 to 2004-05, but the WFPR
is still lower than what it was in 1993-94. In case of
females, during the period 1993-94 to 1999-2000, as per
the usual status criterion, there had been a significant
decline in the WFPR in rural areas, while that in urban
area, notwithstanding its low level, had remained almost
constant. But this trend seems to have been reversed in
the latter period. As per current weekly status (CWS) and
current daily status (CDS) there has been a decline in
FWPR of both male and female workers, both in the rural
ARUN
ACH
AL PR
ADESH
as well as in the urban areas during the first period and
since 1999-2000 there has been an increase in FWPR in
all these categories. A particularly noticeable feature,
however, is the sharp rural-urban difference in the work
force participation rates of female workers in the State
(Table 4.1).
TABLE 4.1
Workforce Participation Rates (WFPR) inArunachal Pradesh: 1993-94 to 2004-05
(No. of persons employed per 1000 persons)
State Male Female
WFPR WFPR WFPR WFPR WFPR WFPR(1993- (1999- (2004- (1993- (1999- (2004-
94) 2000) 05) 94) 2000) 05)
Arunachal US Rural 497 422 504 409 310 410Pradesh Urban 515 399 463 101 100 150
CWS Rural 498 417 503 410 295 406Urban 513 348 466 104 75 158
CDS Rural 489 375 490 399 241 388Urban 503 341 463 133 75 157
All India US Rural 553 531 546 328 299 249Urban 521 518 566 155 139 148
CWS Rural 531 510 545 267 253 287Urban 511 509 566 139 128 168
CDS Rural 504 478 531 220 204 237Urban 498 490 561 120 111 150
Source: NSS Reports No. 409 and 458 and NSS 61st Round.
So far as age group-wise participation is concerned, for
most of the age groups there has been a decline in WFPR
during the period 1993-94 to 1999-2000, whereas an
increase has been observed during 1999-2000 and 2004-
2005. In overall terms, the WFPR has declined during the
first period under consideration and has increased in the
subsequent period, except for the younger age groups,
i.e., those between 10-14 years, (Annexure Table A-4.1).
The trends in age group-wise labour force participation
Chapter 4
Labour and Employment

ARUNACHAL PRADESH DEVELOPMENT REPORT82
rate (LFPR) have been broadly the same. Except for the
very young, the participation of all other age groups has
increased during the period under study (Annexure Table
A-4.2). Apart from the sharp fall in the overall LFPR from
445 in 1993-94 to 363 per thousand persons in 1999-
2000, it is important to note that, except for urban
females, the decline has been severe for all other groups
under consideration, during 1999-2000 but during the
latter period, i.e., 2004-05 there has been an increase in
the LFPR for all age groups.
Composition of Employment
The changing composition of employment in Arunachal
Pradesh, for various categories of workers, is presented in
Tables 4.2, 4.3, and 4.4 for the three NSS rounds. In
2004-05, it is found that out of the total workers in
Arunachal Pradesh, 79.7 per cent were self-employed,
while nearly 6.1 per cent worked as casual labourers and
the rest worked as regular salaried workers. The
proportion of self-employed workers was remarkably
higher in the rural than in the urban areas. In fact, it is
regular salaried employment that has the largest category
of employment in urban Arunachal Pradesh. The share of
self-employed was around 93 per cent in rural female
categories, while it was 40.5 per cent among urban
females. In terms of social groups, it is very clear that the
share of regular salaried employment was remarkably low
in the case of ST workers (9 per cent) than non-ST
workers (27 per cent). Casual labour category also had a
lower share among the ST than the non-ST. In rural areas,
as high as 90 per cent of total workers and 95 per cent of
women workers in the ST category were self-employed.
The important changes that happened during 1993-94
and 2004-05 are as follows. Firstly, between 1993-94 to
1999-2000 there has been a decrease in the share of self-
employed workers, a marginal decline in the share of
salaried employment and a rise in the share of casual
workers. During the period 1993-94 and 2004-05, while
in the urban areas the share of self-employed and that of
salaried employment has declined, but as far as the share
of casual workers is concerned, which was around 15 per
cent in the earlier two rounds, has gone down to 8.4 per
cent in 2004-05. Between 1999-2000 and 2004-05,
however, there has been an increase in the share of the
self-employed people and a decline in the share of casual
labourers. Thus, between 1993-94 and 2004-05 we see
that there has only been marginal changes in the
composition of employment in Arunachal Pradesh. In the
rural areas, there has been a growth of casual wage labour
along with a decline in the share of salaried employment,
while the share of self-employment has remained almost
stagnant. Given the substantial role of the government
sector in providing regular salaried jobs in the State, the
impact of a job squeeze in the government sector on the
overall employment structure comes out very clearly from
the data presented here. Secondly, it is important to note
that there has been a decline in the relative importance of
self-employment among the ST workers, and it has been
accompanied by a rise in the share of both regular salaried
employment as well as casual labour. Thirdly, among the
male workers in rural areas belonging to ST category,
there has been a fall in the share of self-employment,
along with a corresponding rise in the share of casual
labour and regular employment. The only group of
workers, which has not witnessed any significant change
in the structure of employment, is rural females belonging
to ST category. In fact, their share in regular salaried
employment has increased marginally, while the shift
away from self-employment, which has been a consistent
feature in case of most of the categories, has not been
TABLE 4.2
Composition of Employment in ArunachalPradesh: 1993-94 (UPSS basis)
Location Employment Male Female PersonsCategory
All Social Groups
Rural Self-Employed 76.19 93.57 83.61Regular Employed 17.39 5.07 12.13Casual Labour 6.42 1.36 4.26
Urban Self-Employed 18.93 31.18 20.66Regular Employed 67.01 52.55 64.97Casual Labour 14.06 16.27 14.37
All Self-Employed 68.99 91.65 78.09Regular Employed 23.63 6.53 16.76Casual Labour 7.38 1.82 5.15
ST Social Group
Rural Self-Employed 90.57 96.68 93.24Regular Employed 7.79 2.26 5.38Casual Labour 1.64 1.05 1.38
Urban Self-Employed 0.00 25.94 3.95Regular Employed 36.44 74.06 42.16Casual Labour 63.56 0.00 53.89
All Self-Employed 88.28 96.26 91.73Regular Employed 8.52 2.69 6.00Casual Labour 3.20 1.05 2.27
Non-ST Social Group
Rural Self-Employed 73.29 92.91 81.62Regular Employed 19.33 5.67 13.52Casual Labour 7.39 1.42 4.85
Urban Self-Employed 19.53 31.36 21.19Regular Employed 67.96 51.81 65.69Casual Labour 12.51 16.82 13.12
All Self-Employed 65.56 90.70 75.52Regular Employed 26.32 7.32 18.79Casual Labour 8.12 1.98 5.69
Source: NSS 50th Round.

83Chapter 4 •
LABOUR AND EMPLOYMENT
seen in the case of female workers of this category.
Although, given the small size of the sample in some of
the disaggregated categories, some of these trends might
not be reflecting the ground realities, but by and large the
restructuring of employment as shown in these tables
brings out the broad contours of change in the
employment scenario of the State.
Distribution of Workers across Industries
Tables 4.5 through 4.7 presents the distribution of
workers at the broad industry level in Arunachal Pradesh.
The share of agriculture in 2004-05, among all workers,
was 76 per cent, implying the continuing significance of
agriculture in the State’s economy. It is important to note
that the next important activity was public administration,
followed by education and community services, which
clearly underlines the significance of the government
sector in generating employment outside agriculture.
Manufacturing has a low share of 0.6 per cent, while
construction has a share of nearly 4 per cent. Among the
other activities, trade, hotels and restaurants account for 4
per cent of the workers employed. The industrial
diversification of workers is even less pronounced in the
case of rural workers in general and rural female workers
in particular. While the share of rural males and females
in public administration and others is significantly less
than that of their urban counterparts. In urban areas, the
share of female workers was higher than that of male
workers in construction. Among urban males, around 51
per cent were in public administration, while 27 per cent
were in trade, hotels and restaurants. The share of ST
workers in agriculture, particularly in rural areas and
among females, was considerably high.
So far as changes between 1993-94 and 2004-05 are
concerned there has been a marginal decline in the share
of workers employed in agriculture, while an increase is
TABLE 4.3
Composition of Employment in ArunachalPradesh: 1999-2000 (UPSS basis)
Location Employment Male Female PersonsCategory
All Social Groups
Rural Self-Employed 70.17 92.98 79.31Regular Employed 20.14 1.38 12.63Casual Labour 9.69 5.64 8.07
Urban Self-Employed 21.57 35.54 23.89Regular Employed 59.31 58.10 59.11Casual Labour 19.13 6.36 17.00
All Self-Employed 66.24 91.51 76.01Regular Employed 23.31 2.83 15.39Casual Labour 10.45 5.66 8.60
ST Social Group
Rural Self-Employed 80.48 97.01 88.10Regular Employed 12.51 1.14 7.27Casual Labour 7.02 1.84 4.63
Urban Self-Employed 19.90 60.71 30.12Regular Employed 72.25 39.29 64.00Casual Labour 7.85 0.00 5.88
All Self-Employed 77.43 96.28 85.98Regular Employed 15.51 1.91 9.34Casual Labour 7.06 1.81 4.68
Non-ST Social Group
Rural Self-Employed 60.81 86.69 69.42Regular Employed 27.07 1.75 18.65Casual Labour 12.12 11.56 11.93
Urban Self-Employed 22.23 12.40 20.99Regular Employed 54.13 75.39 56.83Casual Labour 23.64 12.21 22.19
All Self-Employed 56.68 84.18 65.35Regular Employed 29.97 4.24 21.86Casual Labour 13.35 11.58 12.79
Source: NSS 55th Round.
TABLE 4.4
Composition of Employment in ArunachalPradesh: 2004-05 (UPSS basis)
Location Employment Male Female PersonsCategory
All Social Groups
Rural Self-Employed 76.4 92.6 83.3Regular Employed 16.5 2.9 10.8Casual Labour 7.0 4.4 5.9
Urban Self-Employed 41.3 47.9 42.7Regular Employed 51.1 40.5 48.9Casual Labour 7.5 11.6 8.4
All Self-Employed 72.3 90.6 79.7Regular Employed 20.6 4.7 14.2Casual Labour 7.1 4.7 6.1
ST Social Group
Rural Self-Employed 84.7 94.9 89.3Regular Employed 11.5 3.0 7.6Casual Labour 3.8 2.1 3.1
Urban Self-Employed 40.8 50.0 44.1Regular Employed 55.9 41.8 50.7Casual Labour 3.3 8.2 5.1
All Self-Employed 82.5 93.4 87.4Regular Employed 13.7 4.3 9.4Casual Labour 3.8 2.4 3.2
Non-ST Social Group
Rural Self-Employed 55.2 82.3 63.8Regular Employed 29.5 2.9 21.0Casual Labour 15.3 14.8 15.1
Urban Self-Employed 41.6 44.7 42.0Regular Employed 49.3 38.4 47.9Casual Labour 9.1 16.9 10.1
All Self-Employed 51.7 78.7 59.2Regular Employed 34.6 6.3 26.7Casual Labour 13.7 15.0 14.1
Source: NSS 61st Round.
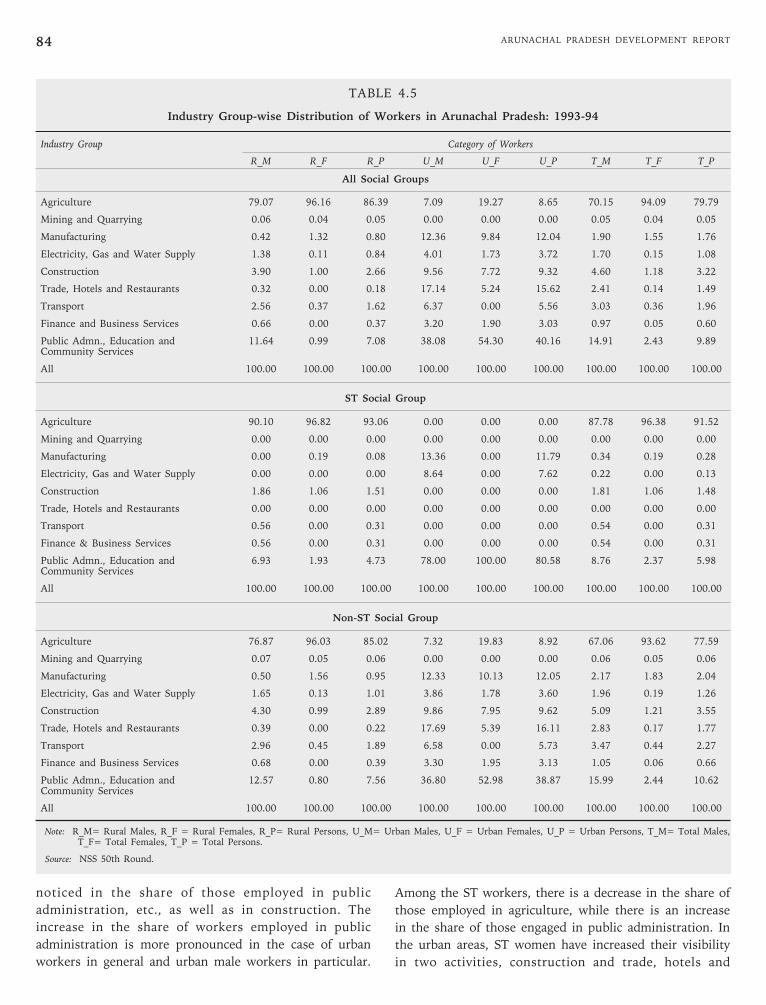
ARUNACHAL PRADESH DEVELOPMENT REPORT84
noticed in the share of those employed in public
administration, etc., as well as in construction. The
increase in the share of workers employed in public
administration is more pronounced in the case of urban
workers in general and urban male workers in particular.
Among the ST workers, there is a decrease in the share of
those employed in agriculture, while there is an increase
in the share of those engaged in public administration. In
the urban areas, ST women have increased their visibility
in two activities, construction and trade, hotels and
TABLE 4.5
Industry Group-wise Distribution of Workers in Arunachal Pradesh: 1993-94
Industry Group Category of Workers
R_M R_F R_P U_M U_F U_P T_M T_F T_P
All Social Groups
Agriculture 79.07 96.16 86.39 7.09 19.27 8.65 70.15 94.09 79.79
Mining and Quarrying 0.06 0.04 0.05 0.00 0.00 0.00 0.05 0.04 0.05
Manufacturing 0.42 1.32 0.80 12.36 9.84 12.04 1.90 1.55 1.76
Electricity, Gas and Water Supply 1.38 0.11 0.84 4.01 1.73 3.72 1.70 0.15 1.08
Construction 3.90 1.00 2.66 9.56 7.72 9.32 4.60 1.18 3.22
Trade, Hotels and Restaurants 0.32 0.00 0.18 17.14 5.24 15.62 2.41 0.14 1.49
Transport 2.56 0.37 1.62 6.37 0.00 5.56 3.03 0.36 1.96
Finance and Business Services 0.66 0.00 0.37 3.20 1.90 3.03 0.97 0.05 0.60
Public Admn., Education and 11.64 0.99 7.08 38.08 54.30 40.16 14.91 2.43 9.89Community Services
All 100.00 100.00 100.00 100.00 100.00 100.00 100.00 100.00 100.00
ST Social Group
Agriculture 90.10 96.82 93.06 0.00 0.00 0.00 87.78 96.38 91.52
Mining and Quarrying 0.00 0.00 0.00 0.00 0.00 0.00 0.00 0.00 0.00
Manufacturing 0.00 0.19 0.08 13.36 0.00 11.79 0.34 0.19 0.28
Electricity, Gas and Water Supply 0.00 0.00 0.00 8.64 0.00 7.62 0.22 0.00 0.13
Construction 1.86 1.06 1.51 0.00 0.00 0.00 1.81 1.06 1.48
Trade, Hotels and Restaurants 0.00 0.00 0.00 0.00 0.00 0.00 0.00 0.00 0.00
Transport 0.56 0.00 0.31 0.00 0.00 0.00 0.54 0.00 0.31
Finance & Business Services 0.56 0.00 0.31 0.00 0.00 0.00 0.54 0.00 0.31
Public Admn., Education and 6.93 1.93 4.73 78.00 100.00 80.58 8.76 2.37 5.98Community Services
All 100.00 100.00 100.00 100.00 100.00 100.00 100.00 100.00 100.00
Non-ST Social Group
Agriculture 76.87 96.03 85.02 7.32 19.83 8.92 67.06 93.62 77.59
Mining and Quarrying 0.07 0.05 0.06 0.00 0.00 0.00 0.06 0.05 0.06
Manufacturing 0.50 1.56 0.95 12.33 10.13 12.05 2.17 1.83 2.04
Electricity, Gas and Water Supply 1.65 0.13 1.01 3.86 1.78 3.60 1.96 0.19 1.26
Construction 4.30 0.99 2.89 9.86 7.95 9.62 5.09 1.21 3.55
Trade, Hotels and Restaurants 0.39 0.00 0.22 17.69 5.39 16.11 2.83 0.17 1.77
Transport 2.96 0.45 1.89 6.58 0.00 5.73 3.47 0.44 2.27
Finance and Business Services 0.68 0.00 0.39 3.30 1.95 3.13 1.05 0.06 0.66
Public Admn., Education and 12.57 0.80 7.56 36.80 52.98 38.87 15.99 2.44 10.62Community Services
All 100.00 100.00 100.00 100.00 100.00 100.00 100.00 100.00 100.00
Note: R_M= Rural Males, R_F = Rural Females, R_P= Rural Persons, U_M= Urban Males, U_F = Urban Females, U_P = Urban Persons, T_M= Total Males,T_F= Total Females, T_P = Total Persons.
Source: NSS 50th Round.

85Chapter 4 •
LABOUR AND EMPLOYMENT
restaurants. Thus, the unevenness in the process of
occupational diversification has been clear from the
disparities in the access to non-agricultural occupations by
various categories of workers. Rural workers in general
and rural female workers have continued to be tied to
agriculture. While at some level it signifies the unequal
opportunities available to females than to males, micro-
studies suggest that the shift of the rural male workers to
non-agriculture has led to a process of feminisation of
agriculture in the sense that women are substituting men
in farm work (Mishra, 2003).
Growth of Employment: 1993-94 to 2004-05
So far as growth of employment between 1993-94 and
1999-2000 is concerned, for the State as a whole, the
TABLE 4.6
Industry Group-wise Distribution of Workers in Arunachal Pradesh: 1999-2000
Industry Group Category of Workers
R_M R_F R_P U_M U_F U_P T_M T_F T_P
All Social Groups
Agriculture 75.62 95.11 83.42 6.45 19.95 8.69 70.02 93.19 78.98
Mining and Quarrying 0.00 0.00 0.00 0.00 0.00 0.00 0.00 0.00 0.00
Manufacturing 2.80 2.68 2.75 0.50 0.00 0.42 2.62 2.61 2.62
Electricity, Gas and Water Supply 0.53 0.00 0.32 2.19 0.00 1.83 0.66 0.00 0.41
Construction 6.66 1.12 4.44 12.93 2.56 11.20 7.17 1.16 4.84
Trade, Hotels and Restaurants 1.00 0.09 0.63 33.32 34.21 33.47 3.61 0.96 2.59
Transport 0.19 0.00 0.12 1.20 0.00 1.00 0.28 0.00 0.17
Finance and Business Services 0.27 0.21 0.24 1.00 0.52 0.92 0.33 0.21 0.28
Public Admn., Education and 12.93 0.79 8.07 42.41 42.76 42.46 15.32 1.87 10.12Community Services
All 100.00 100.00 100.00 100.00 100.00 100.00 100.00 100.00 100.00
ST Social Group
Agriculture 86.25 98.51 91.90 14.32 41.64 21.16 82.64 97.36 89.31
Mining and Quarrying 0.00 0.00 0.00 0.00 0.00 0.00 0.00 0.00 0.00
Manufacturing 0.00 0.00 0.00 0.00 0.00 0.00 0.00 0.00 0.00
Electricity, Gas and Water Supply 0.72 0.00 0.39 1.13 0.00 0.85 0.74 0.00 0.40
Construction 7.35 0.85 4.35 17.54 0.00 13.15 7.86 0.84 4.68
Trade, Hotels and Restaurants 0.50 0.07 0.30 16.73 30.85 20.27 1.32 0.69 1.03
Transport 0.00 0.00 0.00 0.00 0.00 0.00 0.00 0.00 0.00
Finance and Business Services 0.09 0.00 0.05 0.00 0.00 0.00 0.08 0.00 0.05
Public Admn., Education and 5.09 0.57 3.01 50.27 27.51 44.57 7.36 1.11 4.53Community Services
All 100.00 100.00 100.00 100.00 100.00 100.00 100.00 100.00 100.00
Non-ST Social Group
Agriculture 65.97 89.80 73.89 3.30 0.00 2.88 59.26 0.00 67.93
Mining and Quarrying 0.00 0.00 0.00 0.00 0.00 0.00 0.00 0.00 0.00
Manufacturing 5.35 6.86 5.85 0.70 0.00 0.61 4.85 6.63 5.41
Electricity, Gas and Water Supply 0.36 0.00 0.24 2.62 0.00 2.29 0.60 0.00 0.41
Construction 6.04 1.54 4.54 11.08 4.91 10.30 6.58 1.65 5.02
Trade, Hotels and Restaurants 1.44 0.13 1.01 39.96 37.31 39.62 5.57 1.39 4.25
Transport 0.37 0.00 0.25 1.67 0.00 1.46 0.51 0.00 0.35
Finance and Business Services 0.43 0.53 0.46 1.40 1.00 1.35 0.53 0.54 0.54
Public Admn., Education and 20.05 1.14 13.76 39.26 56.78 41.48 22.10 3.02 16.09Community Services
All 100.00 100.00 100.00 100.00 100.00 100.00 100.00 100.00 100.00
Note: R_M= Rural Males, R_F = Rural Females, R_P= Rural Persons, U_M= Urban Males, U_F = Urban Females, U_P = Urban Persons, T_M= Total Males,T_F= Total Females, T_P = Total Persons.
Source: NSS 55th Round.

ARUNACHAL PRADESH DEVELOPMENT REPORT86
employment growth was negative for all workers, but
more significantly for the female workers. Location-wise,
deceleration in employment growth was sharper for urban
males, urban females and rural females. There was a
contrasting pattern of employment growth for non-ST and
ST workers—while for non-ST workers in general and
non-ST female workers in particular, the employment
scenario worsened, but for the ST workers employment
gains were substantial. Thus, the overall negative growth
in employment was because of a strong decline in
employment of the non-ST workers (Table 4.8).
Between 1999-2000 to 2004-05, employment growth
was 5.8 per cent for all workers. It was remarkably higher
in the urban areas than in the rural areas. Unlike the
earlier period, employment growth was positive for all
categories of worker. While there was a substantial gain
TABLE 4.7
Industry Group-wise Distribution of Workers in Arunachal Pradesh: 2004-05
Industry Group Category of Workers
R_M R_F R_P U_M U_F U_P T_M T_F T_P
All Social Groups
Agriculture 74.0 92.7 81.9 4.7 35.3 11.1 65.8 90.1 75.6
Mining and Quarrying 0.0 0.0 0.0 0.0 0.0 0.0 0.0 0.0 0.0
Manufacturing 0.4 0.3 0.4 4.5 0.0 3.6 0.9 0.3 0.6
Electricity, Gas and Water Supply 1.5 0.0 0.9 0.3 0.0 0.2 1.4 0.0 0.8
Construction 5.0 2.8 4.0 9.0 4.7 8.1 5.4 2.9 4.4
Trade, Hotels and Restaurants 3.6 0.4 2.3 25.6 14.1 23.2 6.2 1.0 4.1
Transport 1.1 0.0 0.6 3.0 0.0 2.3 1.3 0.0 0.8
Finance and Business Services 1.0 0.2 0.6 1.6 0.0 1.2 1.1 0.1 0.7
Public Admn., Education and 13.4 3.6 9.3 51.4 45.9 50.2 17.9 5.6 12.9Community Services
All 100.0 100.0 100.0 100.0 100.0 100.0 100.0 100.0 100.0
ST Social Group
Agriculture 83.3 94.9 88.6 13.0 37.9 22.1 79.8 92.9 85.8
Mining and Quarrying 0.0 0.0 0.0 0.0 0.0 0.0 0.0 0.0 0.0
Manufacturing 0.1 0.2 0.1 1.6 0.0 1.0 0.2 0.2 0.2
Electricity, Gas and Water Supply 0.7 0.0 0.4 0.0 0.0 0.0 0.6 0.0 0.3
Construction 2.5 1.3 1.9 11.2 3.8 8.5 2.9 1.4 2.2
Trade, Hotels and Restaurants 1.3 0.2 0.8 12.9 14.7 13.6 1.9 0.7 1.4
Transport 0.5 0.0 0.3 1.7 0.0 1.1 0.6 0.0 0.3
Finance and Business Services 1.1 0.2 0.7 0.0 0.0 0.0 1.1 0.1 0.6
Public Admn., Education and 10.6 3.2 7.2 59.6 43.6 53.7 13.0 4.6 9.2Community Services
All 100.0 100.0 100.0 100.0 100.0 100.0 100.0 100.0 100.0
Non-ST Social Group
Agriculture 50.3 82.6 60.6 1.5 31.4 5.3 37.8 77.7 48.9
Mining and Quarrying 0.0 0.0 0.0 0.0 0.0 0.0 0.0 0.0 0.0
Manufacturing 1.2 0.8 1.1 5.7 0.0 4.9 2.3 0.7 1.9
Electricity, Gas and Water Supply 3.8 0.0 2.6 0.4 0.0 0.4 2.9 0.0 2.1
Construction 11.3 9.6 10.8 8.1 6.0 7.8 10.5 9.2 10.2
Trade, Hotels and Restaurants 9.4 1.1 6.7 30.5 13.3 28.3 14.8 2.3 11.3
Transport 2.7 0.0 1.8 3.4 0.0 3.0 2.9 0.0 2.1
Finance and Business Services 0.7 0.2 0.5 2.2 0.0 1.9 1.1 0.1 0.8
Public Admn., Education and 20.7 5.8 15.9 48.2 49.3 48.4 27.7 10.0 22.7Community Services
All 100.0 100.0 100.0 100.0 100.0 100.0 100.0 100.0 100.0
Note: R_M= Rural Males, R_F = Rural Females, R_P= Rural Persons, U_M= Urban Males, U_F = Urban Females, U_P = Urban Persons, T_M= Total Males,T_F= Total Females, T_P = Total Persons
Source: NSS 61st Round.

87Chapter 4 •
LABOUR AND EMPLOYMENT
in employment for both male and female workers of ST
category, for non-ST workers employment growth was
negative, primarily because of shrinking employment
opportunities for rural non-ST workers (Table 4.9).
The limited coverage of the data makes it difficult to
conclude regarding the growth of employment at the
industry level. However, during 1993-94 to 1999-2000
there was negative growth in sectors like agriculture,
electricity, gas and water supply, transport, finance and
business services, public administration, education and
community services, while employment increased in
manufacturing, construction, trade, hotel and restaurants.
TABLE 4.8
Industry Group-wise Growth of Employment in Arunachal Pradesh: 1993-94 to 1999-2000
Industry Group Growth of Employment (%)
R_M R_F R_P U_M U_F U_P T_M T_F T_P
All Social Groups
Agriculture -0.76 -2.07 -1.37 -9.05 -2.20 -6.83 -0.84 -2.07 -1.42
Mining and Quarrying -100.00 -100.00 -100.00 -100.00 -100.00 -100.00
Manufacturing 37.12 10.45 21.78 -47.29 -100.00 -48.12 2.31 7.04 3.97
Electricity, Gas and Water Supply -14.78 -100.00 -15.60 -16.45 -100.00 -17.30 -15.25 -100.00 -16.08
Construction 9.32 0.02 8.07 -2.84 -19.12 -4.02 6.80 -2.22 5.70
Trade, Hotels and Restaurants 20.62 21.81 3.22 32.95 5.70 6.14 35.10 8.22
Transport -34.91 -100.00 -36.02 -30.09 -30.09 -33.48 -100.00 -34.33
Finance and Business Services -13.92 -7.76 -23.83 -21.62 -23.65 -17.27 24.47 -12.89
Public Admn., Education and 1.75 -5.52 1.38 -5.94 -6.56 -6.04 -0.37 -6.14 -0.87Community Services
All -0.02 -1.89 -0.80 -7.61 -2.76 -6.91 -0.81 -1.91 -1.25
ST Social Group
Agriculture 18.30 21.18 19.66 18.47 21.36 19.84
Mining and Quarrying
Manufacturing -100.00 -100.00 -100.00 -100.00 -100.00 -100.00 -100.00
Electricity, Gas and Water Supply -4.69 -4.69 46.13 46.13
Construction 49.84 16.57 43.10 52.83 16.57 45.72
Trade, Hotels and Restaurants
Transport -100.00 -100.00 -100.00 -100.00
Finance and Business Services -12.52 -12.52 -12.52 -12.52
Public Admn., Education and 13.20 -1.44 11.20 24.29 25.74 24.50 16.24 6.84 14.88Community Services
All 19.16 20.83 19.91 33.73 55.92 37.42 19.67 21.15 20.32
Non-ST Social Group
Agriculture -9.79 -14.35 -11.84 -23.09 -100.00 -27.27 -9.94 -14.44 -11.95
Mining and Quarrying -100.00 -100.00 -100.00 -100.00 -100.00 -100.00
Manufacturing 37.12 10.93 22.14 -47.04 -100.00 -47.89 2.72 7.42 4.37
Electricity, Gas and Water Supply -28.32 -100.00 -29.02 -17.70 -100.00 -18.59 -24.57 -100.00 -25.32
Construction -2.09 -6.73 -2.70 -10.47 -19.12 -11.21 -4.04 -8.69 -4.61
Trade, Hotels and Restaurants 15.21 16.04 0.59 20.99 2.00 2.93 22.90 4.13
Transport -34.51 -100.00 -35.66 -30.09 -30.09 -33.18 -100.00 -34.06
Finance and Business Services -14.16 -7.08 -23.83 -21.62 -23.65 -17.78 24.47 -12.92
Public Admn., Education and 0.01 -8.01 -0.28 -11.23 -11.34 -11.25 -2.97 -10.22 -3.52Community Services
All -7.47 -13.39 -9.75 -12.19 -12.36 -12.21 -8.06 -13.35 -9.98
Note: (i) R_M= Rural Males, R_F = Rural Females, R_P= Rural Persons, U_M= Urban Males, U_F = Urban Females, U_P = Urban Persons, T_M= TotalMales, T_F= Total Females, T_P = Total Persons.
(ii) Blanks occur in the cells where employment was zero in the 50th Round; –100 per cent occur in the cells where employment was zero in the 55thRound.
Source: NSS 50th and 55th Round.

ARUNACHAL PRADESH DEVELOPMENT REPORT88
In fact in the later period, rural employment growth was
robust. Between 1999-2000 to 2004-05 the significant
changes were the decline in employment in manufacturing
and substantial growth in electricity, gas and water
supply, trade, hotels, restaurants, transport, finance and
business services and public administration. Also
remarkable was the fact that rural females gained in
TABLE 4.9
Industry Group-wise Growth of Employment in Arunachal Pradesh: 1999-2000 to 2004-05
Industry Group Growth of Employment (%)
R_M R_F R_P U_M U_F U_P T_M T_F T_P
All Social Groups
Agriculture 3.8 5.8 4.8 6.4 34.7 20.4 3.9 6.1 4.9
Mining and Quarrying
Manufacturing -29.4 -31.0 -30.0 75.9 75.9 -15.4 -31.0 -20.1
Electricity, Gas and Water Supply 29.3 29.3 -23.6 -23.6 22.1 22.1
Construction -1.7 27.7 3.2 5.3 35.6 7.3 -0.6 28.2 3.8
Trade, Hotels and Restaurants 35.0 43.1 35.6 7.5 0.7 6.5 17.2 8.3 16.1
Transport 47.4 47.4 35.9 35.9 43.8 43.8
Finance and Business Services 35.7 0.3 27.6 23.9 -100.0 21.5 33.2 -1.0 26.5
Public Admn., Education and 5.0 44.3 8.1 17.8 21.8 18.5 8.4 33.0 11.1Community Services
All 4.3 6.4 5.1 13.3 20.1 14.6 5.2 6.8 5.8
ST Social Group
Agriculture 12.5 12.1 12.3 10.7 23.5 17.7 12.5 12.2 12.3
Mining and Quarrying
Manufacturing
Electricity, Gas and Water Supply 11.6 11.6 -100.0 -100.0 9.8 9.8
Construction -9.0 23.1 -3.8 3.2 7.0 -7.3 25.6 -2.4
Trade, Hotels and Restaurants 36.9 46.6 38.0 7.2 8.5 7.7 21.5 14.9 19.6
Transport
Finance and Business Services 88.4 92.5 88.4 92.5
Public Admn., Education and 31.1 59.3 34.6 16.8 38.0 21.1 26.8 50.2 30.4Community Services
All 13.3 12.9 13.1 12.9 25.9 16.7 13.2 13.2 13.2
Non-ST Social Group
Agriculture -12.8 -10.6 -11.9 -3.5 28.2 -12.7 -9.8 -11.5
Mining and Quarrying
Manufacturing -31.7 -41.5 -34.9 72.3 72.3 -17.5 -41.5 -23.6
Electricity, Gas and Water Supply 47.8 47.8 -21.1 -21.1 31.2 31.2
Construction 4.4 31.2 9.0 6.6 18.4 7.5 4.8 30.1 8.7
Trade, Hotels and Restaurants 33.8 40.0 34.1 7.6 -7.5 6.2 16.0 1.9 14.8
Transport 36.4 36.4 31.1 31.1 34.6 34.6
Finance and Business Services 1.8 -27.9 -5.5 23.9 -100.0 21.5 10.0 -28.9 2.9
Public Admn., Education and -7.4 25.7 -5.6 18.3 10.5 17.1 -0.2 17.0 1.2Community Services
All -7.9 -9.1 -8.3 13.5 13.7 13.5 -4.5 -7.8 -5.5
Note: (i) R_M= Rural Males, R_F = Rural Females, R_P= Rural Persons, U_M= Urban Males, U_F = Urban Females, U_P = Urban Persons, T_M= TotalMales, T_F= Total Females, T_P = Total Persons.
(ii) Blank means there was no employment in relevant cell in 1999-2000. -100% means that whatever employment was there in 1999-2000 was no morein 2004-2005 for relevant cells.
Source: NSS 55th and 61st Round.
sectors like construction, trade, hotels and restaurants,
apart from public administration. Another noticeable
pattern was that there was significant employment growth
for ST workers in agriculture and public administration,
education and community services, while in these
industries, non-ST workers experienced a negative
employment growth.

89Chapter 4 •
LABOUR AND EMPLOYMENT
Unemployment in Arunachal Pradesh
Table 4.10 shows the unemployment rates for various
categories of workers in Arunachal Pradesh from the two
NSS rounds. It is found that unemployment rates are
lower in Arunachal Pradesh than in all other north-eastern
states. The share of unemployed persons,1 both in
population as well as in work force had declined in the
State between 1993-94 and 1999-2000 but increased
between 1999-2000 and 2004-05. Less than one per cent
of the labour force was unemployed in the State as per
NSS figures. The low level of unemployment has to be
seen in the context of the level of development as well as
the nature of the economy of the State. Apart from the
low population density and labour shortage, manifested in
the heavy in-migration of workers from outside the State,
the low unemployment status might be a reflection of the
low level of commercialisation and development of the
economy. It is well known that the poor people cannot
afford to remain unemployed for long.2 It is precisely the
lack of development in the rural areas in general and
within agriculture in particular, which explains the low
levels of unemployment in the State. However, some
other aspects of unemployment in Arunachal Pradesh
come out from the data presented in Table 4.10.
Firstly, unemployment rates are higher in the urban
area than in rural areas. In the urban areas,
unemployment is significantly higher in the case of
females than in the case of males, while in the rural areas,
male unemployment is higher than female unemployment.
Secondly, so far as unemployment in terms of social
groups is concerned, it is found that unemployment is
higher among the ST workers than the overall
TABLE 4.10
Unemployment Rate (Arunachal Pradesh): 1993-94, 1999-2000 and 2004-05
Proportion of Labour Force
R_M R_F R_P U_M U_F U_P T_M T_F T_P
1993-94 16.37 2.26 10.40 17.73 73.91 26.07 16.54 4.63 11.79
1999-2000 7.72 1.41 5.20 6.50 89.97 21.30 7.62 3.85 6.16
2004-05 11.14 5.74 8.85 10.64 24.27 13.54 11.08 6.61 9.27
ST
1993-94 19.51 3.38 12.53 0.00 0.00 0.00 19.03 3.36 12.32
1999-2000 13.71 1.75 8.23 11.21 102.28 35.56 13.59 3.98 9.26
2004-05 11.27 6.67 9.17 15.91 32.67 22.10 11.50 7.59 9.73
Non-ST
1993-94 15.74 2.02 9.96 18.27 76.25 26.87 16.10 4.90 11.69
1999-2000 2.20 0.89 1.76 4.57 78.11 14.42 2.45 3.64 2.82
2004-05 10.82 1.44 7.85 8.57 11.14 8.90 10.25 2.39 8.07
Proportion of Population
R_M R_F R_P U_M U_F U_P T_M T_F T_P
1993-94 8.28 0.93 4.78 9.30 8.08 8.75 8.41 1.74 5.25
1999-2000 3.31 0.44 1.95 2.64 9.86 5.84 3.25 1.15 2.26
2004-05 5.63 2.37 4.09 4.96 3.68 4.37 5.54 2.52 4.12
ST
1993-94 9.65 1.51 5.92 0.00 0.00 0.00 9.40 1.45 5.73
1999-2000 4.95 0.55 2.79 3.39 13.69 8.04 4.86 1.22 3.08
2004-05 5.48 2.92 4.24 6.11 6.83 6.48 5.52 3.19 4.39
Non-ST
1993-94 8.00 0.81 4.56 9.62 8.51 9.12 8.22 1.79 5.17
1999-2000 1.14 0.28 0.75 2.16 7.29 4.41 1.26 1.04 1.16
2004-05 6.08 0.47 3.60 4.36 1.18 3.04 5.61 0.65 3.45
Note: R_M= Rural Males, R_F = Rural Females, R_P= Rural Persons, U_M= Urban Males, U_F = Urban Females, U_P = Urban Persons, T_M= Total Males,T_F= Total Females, T_P = Total Persons.
Source: NSS 50th, 55th and 61st Rounds.
1. The unemployment rate increased from 1.9 per cent in 1993-94 to 2.2 per cent in 1999-2000 at the all-India level.
2. Vaidyanthan (1994:69), for example, has shown that there is a significant and positive correlation between unemployment rate and the incidence of wagelabour and the degree of commercialisation at the State-level. Given the positive correlation between the latter two variables themselves, it is possible toargue that with commercialisation of agriculture, and the consequent rise in the incident of wage labour and casualisation of wage labour, the traditionalmechanisms to take care of the ‘surplus labour’ also breaks down. Hence, the latent unemployment becomes more and more open.

ARUNACHAL PRADESH DEVELOPMENT REPORT90
unemployment rate of the State. However, unemployment
has declined between the period under consideration, for
male ST workers only.
Youth and Educated Unemployment
Youth and educated unemployment is normally found
to be higher than the general unemployment rate. At the
all India level, for all groups except urban females, it has
increased significantly over the 1990s (Planning
Commission, 2002). In the case of Arunachal Pradesh, the
problem of unemployment is generally considered to be a
problem of the educated and the young age population.
The data from employment exchange shows that the
number of unemployed persons in the live register has
crossed twenty six thousand (Table 4.11). The NSS data
also shows a relatively higher level of unemployment
among the relatively better educated. The rate of
unemployment among those having a secondary or higher
level of education was higher than that among the general
population. Between 1993-94 and 2004-05, the level of
unemployment among the relatively better educated has
declined. However, an important change between these
two years is that, while in 1993-94 unemployment among
the educated in the ST group was virtually non-existent; it
started showing some presence since 1999-2000.3
Although, given the thin spread of the sample across all
these categories, conclusions should be drawn rather
cautiously. The available data suggests that, between
1993-94 and 2004-05, the decline in the unemployment
rates among the relatively better educated groups, was
accompanied by a rise in unemployment among the
relatively better educated ST youths in the rural areas.
Among the different age groups, the unemployment rate
was highest in the age group of 20-24 years followed by the
category 25-29 years in 2004-05. The unemployment rate
was particularly high among the urban youth in the State.
Urban females belonging to the age group of 15-24 have a
high level of unemployment in the State (Annexure Tables
A-4.9-A-4.11). Another important aspect of the
unemployment scenario in the State is that the extent of
youth unemployment among the population is higher
among the ST population than the general levels of youth
unemployment in the State. Between 1993-94 and 2004-05
there has been an increase in the extent of youth
unemployment among the ST population.
The problem of unemployment among the youth and
the educated in Arunachal Pradesh, though considerably
lower than many other parts of the country, basically
exemplifies the mismatch between the available jobs and
the skills, expectations and aspirations of young job
seekers. Given the negligible presence of the organised
manufacturing in the State, and the dominance of public
administration as a source of employment, so far, the
major source of employment creation has been through
expansion of employment in the government sector. There
are, however, obvious limits to the possibility of
expanding employment opportunities in the government
sector, particularly in the context of increasing emphasis
on fiscal responsibilities of the government at various
levels. The analysis of sectoral issues in employment
generation brings out these problems and inadequacies in
a clearer manner.
Growth Rate of Labour Force and Unemployment
Between 1999-2000 and 2004-05, the labour force in
Arunachal Pradesh increased at the rate of 5.9 per cent,
while unemployment increased at the rate of 13.1 per cent
for all categories of workers. Unemployment has
decreased in urban areas but it has increased in the rural
areas of the State. For the ST workers, overall
3. In the 2004-05, for example, unemployment among the ST population with an education level of higher secondary but less than graduation was nearly 3.75per cent of the labour force, while that among those having graduation or higher level of education in the ST group was 6.49 per cent.
TABLE 4.11
Registered Unemployed in Arunachal Pradesh
Year No. of No. of Job Seekers No. of Job Seekers No. of Job SeekersEmployment Registered during Sponsored during on Live RegisterExchanges the Year the Year
Male Female Total Male Female Total Male Female Total
2001-02 11 3852 2207 6059 347 132 479 15400 7116 22516
2002-03 12 2586 1432 4018 609 181 790 16255 7697 23952
2003-04 13 11 16 27 502 206 708 7487 8507 15994
Source: Director, Employment and Training, Naharlagun, Itanagar.

91Chapter 4 •
LABOUR AND EMPLOYMENT
unemployment has increased, but mainly due to increase
in rural unemployment (Table 4.12).
TABLE 4.12
Growth Rates of Labour Force and Unemployment:1993-94 to 1999-2000 and 1993-94 to 2004-05
Category UPSS Growth Rates (%)—1993-94 to 1999-2000
Labour Force Unemployment
Rural Urban Total Rural Urban Total
ST 19.56 37.61 19.99 11.47 15.37
Non-ST -9.92 -12.90 -10.20 -32.51 -16.94 -27.14
All -0.96 -7.49 -1.46 -11.78 -5.77 -10.43
UPSS Growth Rates (%)—1993-94 to 2004-05
ST 13.1 16.1 13.2 15.6 -0.5 13.2
Non-ST -8.2 13.3 -5.4 23.7 -3.8 12.8
All 5.2 14.2 5.9 17.0 -2.0 13.1
Strategy for Employment Generation:Sectoral Issues
Employment generation strategy of any State is not
independent of the overall strategy for economic
development adopted at the national level. However, given
the specifities in the State the conventional employment
generation strategies conceived at the level of Central
government and other agencies are quite often inadequate
and inappropriate for the State. Thus, there is an urgent
need for a serious revaluation of the employment
generation strategy in the State, keeping in mind the local
specificities. For a number of reasons, the standard model
of employment generation is less likely to be effective in
Arunachal Pradesh.4 Given the fact that most of the poor
in the State are self-employed in agriculture, it is quite
natural that the standard programmes that attempt to
tackle poverty by providing more employment opportunity
through labour-intensive casual work would not be
successful in Arunachal Pradesh.5 In fact, given the labour
market characteristics of the State, such programmes have
helped the non-poor (viz., contractors) more than the
really poor.
There is a need to integrate the problems of
unemployment and poverty simultaneously. As in the case
of many other underdeveloped regions of India, poverty
doesn’t necessarily reflect itself through unemployment,
as the poor are too poor to be unemployed. So far as the
problems of the self-employed poor, who are mainly
cultivators in rural areas, are concerned there are only two
viable policy options: a) to increase productivity and
profitability of agriculture; and b) to provide alternative
sources of earnings and employment in non-agricultural
occupations.6 In this context the increasing participation
of women in a number of micro-enterprises provides an
alternative strategy to address the problems of the poor.
Many of these women are found in retail trade and
seasonal enterprises, but some of them are also involved
in the traditional manufacturing (Upadhyay, 2005). Given
the ecological preconditions and spatial dispersion of
settlements of the State, these enterprises cater to a
locally differentiated market.7
Employment in the Urban Informal Sector
The important role, played by informal sector activities,
in providing earnings and livelihood to a growing number
of workers in future is gradually being recognised at
various levels (Planning Commission, 2002). The
economic census data shows that informal enterprises in
Arunachal Pradesh account for more than 90 per cent of
establishments and their share in total employment was
as high as 50 per cent. The result of the 5th Economic
Census reveal that in 2005, there were 28,734
establishments in Arunachal Pradesh, of which 98.6 per
cent were non-agricultural establishments. The compound
annual growth rate of establishments during the period
1998-2005 was 4.8 per cent. The number of persons
engaged in these establishments were 110,385 out of
4. For example, in 1993-94, among the very poor category, more than 45 per cent were landless in states like Bihar, Assam, Andhra Pradesh and many others,but in the case of Arunachal Pradesh, only 6.7 per cent of the very poor were landless. Among the poor only 7.4 per cent were landless. However, 54 percent among the very poor and 41 per cent among the poor were sub-marginal farmers. Around 90.2 per cent of the very poor were self-employed and only3.7 per cent were wage earners in the state. In no other state of India such a high proportion of very poor people were self-employed (Chaudhuri, 2002).
5. Between 1987-88 and 1993-94, as per estimates based on the NSS data, the percentage of poor in Arunachal Pradesh has increased from 29.76 per cent to47.70 per cent (Srivastava and Dubey, 2004). In fact, among the North-eastern states, it is only in Arunachal Pradesh, where such a rise in the incidenceof poverty has been noticed. Moreover, in terms of human development parameters, the progress of the State has been less than satisfactory (Upadhyay andMishra, 2004).
6. Although there is scope for increasing earnings within agriculture through crop diversification, technological change, value addition at local levels etc., butgiven the ecological constraints and weak market linkages there are limits to which agricultural growth could be projected as the sole hope for ruraldevelopment. The alternative is to provide education and gradually shift labour from low productive to high productive occupations. This strategy has itsown problems as well, mainly because of the dependence on government sector jobs. This strategy is wasteful, unproductive and unsustainable in the long-run, but more importantly, it would almost certainly by-pass the poor.
7. There is a strong linkage with the household economy as well, with many of them selling output produced or collected by themselves and other familymembers (Upadhyay, 2005).

ARUNACHAL PRADESH DEVELOPMENT REPORT92
which 98 per cent were engaged in non-agricultural
establishments. Employment grew at the rate of 4.61 per
cent per annum during the period 1998-2005. The growth
of employment was more in urban than in rural
enterprises. These enterprises mainly consist of retail
trading and social, personal and community services. A
recent study on the micro-enterprises in Arunachal
Pradesh reveals that a key aspect of micro-enterprises in
the State, particularly those involved in manufacturing and
processing activities, is the weak production linkages.
Apart from the very low production base of the economy,
high transportation costs, low levels of commercialisation
and marketisation of output and unreliable and poor
communication services have also contributed towards
this (Upadhyay and Mishra, 2004). The contractual
relations in the urban informal economy also need to be
carefully understood to design effective policies for
employment generation in the informal sector. Insights
from a recently concluded study bring out the exploitative
mechanisms that underlie the contractual relations in the
urban informal sector (Upadhyay, 2006).
Employment Prospects in theRural Non-farm Sector
The share of non-farm employment in rural
employment in the State has gone up from only 17.09 per
cent in 1971 to 26.07 per cent in 1991. From the census
data, it can be inferred that rural employment in non-
household manufacturing, construction, trade and
commerce, and transport, storage and communications
expanded during 1971-1991, while the relative share of
household manufacturing and other services has shown a
decline. Employment in transport, storage and
communications has recorded the highest growth rate
during this period, followed by mining and quarrying and
non-household manufacturing.
As per NSS data, the share of non-farm sector in total
rural labour force in the State has gone up from 13.61 per
cent in 1993-94 to 16.58 per cent in 1999-2000 as per
UPSS status of employment. The share of RNF sector
employment in the State continues to be lower than the
national average as well as that for the North-east region
(Annexure Table A-4.16). Rural males in Arunachal
Pradesh had higher access to non-farm employment than
their female counterparts. Even in 1999-2000, the
participation of woman in RNFE in Arunachal Pradesh
was the lowest among all the north-eastern states.
So far as the composition of rural non-farm
employment in Arunachal Pradesh is concerned, ‘other
services’, which also includes those employed in public
administration, continues to be the most important
occupational category, although its share in RNFE has
declined significantly from around 96 per cent in 1971 to
around 56 per cent during 1991. The second most
important source of employment in the rural non-farm
sector comes from the construction sector. A substantial
portion of employment opportunities in this sector also
comes from the road construction activities of the
government, including those by the defence organisations.
Trade and commerce and non-household manufacturing
have also expanded substantially in the rural areas
(Annexure Table A-4.17). There is of course considerable
inter-district variations in the share of RNFE (Annexure
Table A-4.18).
The literature on determinants of RNFE has identified
factors like agricultural growth, urbanisation, literacy,
rural poverty and unemployment, infrastructural
development and equity in the distribution of rural assets
as major determinants of RNFE. Although some studies
suggest the RNFE to be determined by agricultural
growth8, given the low levels of commercialisation and
productivity in agriculture, it is doubtful that the non-
farm economy has been exclusively driven by the growth
impetus in the farm economy. Inter-sectoral production
linkages are remarkably low in the State. However, rising
farm incomes might have resulted in greater demand for
non-farm products and services in the rural areas through
consumption linkages. Analysis of data from 2001 census
shows that rural literacy rate is positively associated with
the level of non-farm employment, while average size of
operational holding has a negative relationship with it9
(Mishra, 2006).
8. In 1991, food crops yield and main cereal crop yield per hectare are positively correlated with the share of rural non-farm employment. The correlation ofRNFE with literacy and urbanisation, was, however, found to be weak (Mishra, 2006). The results indicate that RNFE growth in the State might have beendriven by growth in agriculture. The fact that the correlation between agricultural growth and RNFE growth was weak in 1981, but significant in 1991 canbe attributed to stronger inter-sectoral linkages in the rural areas as a result of rising productivity, increasing marketisation and commercialisation of theagro-economy (Panda, 1999).
9. A micro-level study on rural non-farm sector concludes that the probability of a household entering into any non-farm occupation is influenced significantlyby the ST status, the education of the head of the household and size of operational holdings. While the ST status reduces the possibility of entering a non-farm occupation, the education of the head of the household is positively related with participation in non-farm occupation. Size of operational holding isnegatively associated with participation in the non-farm sector. Participation in agricultural wage labour is negatively, but insignificantly associated withparticipation in non-farm activity, while the dummy capturing distance from the urban locality shows a significant relationship between nearness to urbanlocality and participation in non-farm occupation (Mishra, 2006).

93Chapter 4 •
LABOUR AND EMPLOYMENT
Conclusion and Policy Implications
Several policy implications could be noted on the basis
of the existing employment situation in Arunachal
Pradesh.
• Till now the major chunk of employment generated
outside agriculture sector has been either in public
administration or sectors like construction, which
has strong linkages with government spending. The
inadequate expansion of employment opportunities
in the manufacturing sector has to be addressed in
a forward looking perspective, giving due emphasis
to the relative advantages and disadvantages of the
State in specific sectors.
• The crux of the problem is however, to create
enough employment opportunities outside the
government sector. Given the low level of
development of the State as well as the strong
presence of the State in various sectors of the
economy, it may be possible to expand employment
in the government sector at least for some more
years. But there are obvious limits to this and any
forward-looking strategy has to take cognisance of
this limitation.
• The problem of youth and educated unemployment,
which exists along with shortages of skilled
manpower in specific sectors and occupations,
needs urgent attention, particularly because of its
potential role as a source of social destabilisation.
The policy options here range from harmonisation
of skill requirements and skill creation on the one
hand to create additional avenues of earnings for
the youth, particularly for those living in the rural
areas. Strengthening the system of vocational
education will go a long way in addressing the skill
deficit in the State. Lack of entrepreneurial ability
has acted as a major constraint in making self-
employment an attractive option for the youth and
the unemployed.
• There is a tremendous scope for the expansion of
the rural non-farm occupations in the State. There
has been a great deal of spatial concentration in
rural non-farm sector employment in the State.
There is a clear need for a more dispersed rural
non-farm sector growth.
• There is also an urgent need to identify and
prioritise the rapidly growing rural non-farm
occupations to dovetail their sector specific needs to
a comprehensive strategy of employment generation
in rural Arunachal Pradesh.
• Some sectors like rural manufacturing, and petty
trading needs additional attention. Over the past
decades, partly as a result of the growing
demonstration effect of urban consumption patterns
in the rural areas, there has been a phenomenal
growth of these sectors in the rural areas. Women,
particularly those belonging to the APST
communities have already taken a lead in
establishing small self-financed micro-enterprises in
petty trading. In the urban areas of the State there
has been a modest growth of traditional handicrafts
manufacturing as well. All these activities should be
made part of the strategy to generate more
employment, particularly more self-employment in
the rural areas. Among the basic needs of these
enterprises is credit and marketing support. There
is a scope for better horizontal as well as vertical
coordination among various agencies working in
these areas.
• Finally, given the overwhelming significance of
education as a determinant for entry into more
remunerative occupations, education has to be
made more accessible to all sections of the
population. There are significant rural-urban as well
as gender divide in terms of access to education in
the State.
• Apart from addressing these glaring inequalities,
there is a clear case for special educational drives
for specific marginalised groups such as those in
inaccessible and border areas, traditionally
marginalised ethnic groups, migrant casual
labourers, tenants as well as those living in labour
camps.
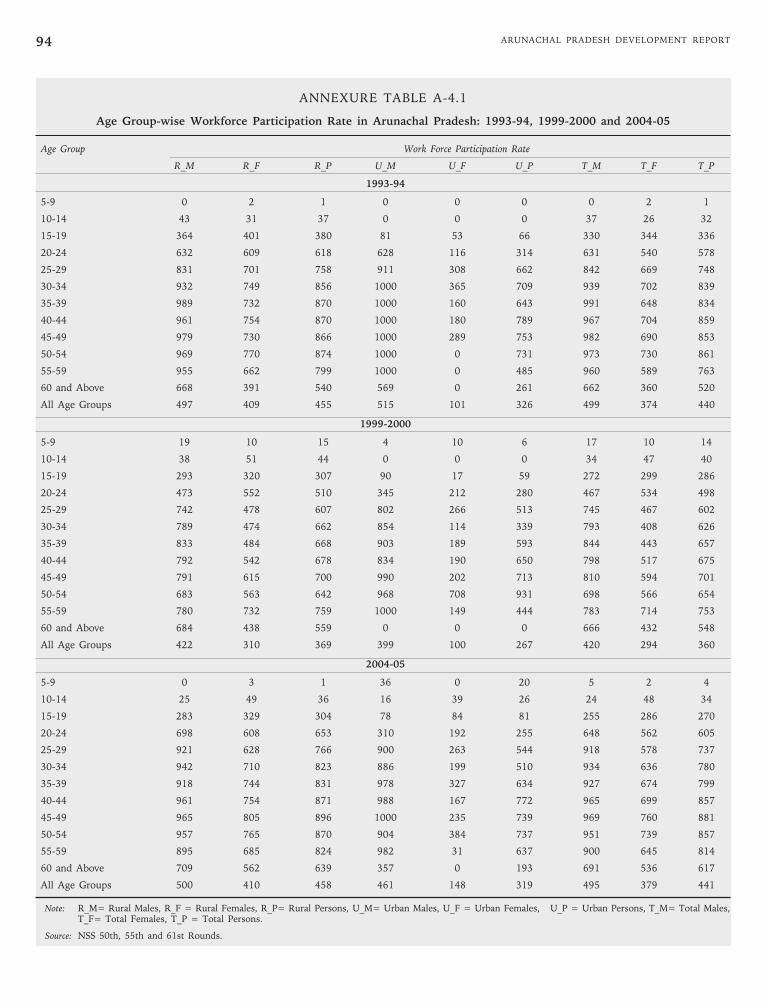
ARUNACHAL PRADESH DEVELOPMENT REPORT94
ANNEXURE TABLE A-4.1
Age Group-wise Workforce Participation Rate in Arunachal Pradesh: 1993-94, 1999-2000 and 2004-05
Age Group Work Force Participation Rate
R_M R_F R_P U_M U_F U_P T_M T_F T_P
1993-94
5-9 0 2 1 0 0 0 0 2 1
10-14 43 31 37 0 0 0 37 26 32
15-19 364 401 380 81 53 66 330 344 336
20-24 632 609 618 628 116 314 631 540 578
25-29 831 701 758 911 308 662 842 669 748
30-34 932 749 856 1000 365 709 939 702 839
35-39 989 732 870 1000 160 643 991 648 834
40-44 961 754 870 1000 180 789 967 704 859
45-49 979 730 866 1000 289 753 982 690 853
50-54 969 770 874 1000 0 731 973 730 861
55-59 955 662 799 1000 0 485 960 589 763
60 and Above 668 391 540 569 0 261 662 360 520
All Age Groups 497 409 455 515 101 326 499 374 440
1999-2000
5-9 19 10 15 4 10 6 17 10 14
10-14 38 51 44 0 0 0 34 47 40
15-19 293 320 307 90 17 59 272 299 286
20-24 473 552 510 345 212 280 467 534 498
25-29 742 478 607 802 266 513 745 467 602
30-34 789 474 662 854 114 339 793 408 626
35-39 833 484 668 903 189 593 844 443 657
40-44 792 542 678 834 190 650 798 517 675
45-49 791 615 700 990 202 713 810 594 701
50-54 683 563 642 968 708 931 698 566 654
55-59 780 732 759 1000 149 444 783 714 753
60 and Above 684 438 559 0 0 0 666 432 548
All Age Groups 422 310 369 399 100 267 420 294 360
2004-05
5-9 0 3 1 36 0 20 5 2 4
10-14 25 49 36 16 39 26 24 48 34
15-19 283 329 304 78 84 81 255 286 270
20-24 698 608 653 310 192 255 648 562 605
25-29 921 628 766 900 263 544 918 578 737
30-34 942 710 823 886 199 510 934 636 780
35-39 918 744 831 978 327 634 927 674 799
40-44 961 754 871 988 167 772 965 699 857
45-49 965 805 896 1000 235 739 969 760 881
50-54 957 765 870 904 384 737 951 739 857
55-59 895 685 824 982 31 637 900 645 814
60 and Above 709 562 639 357 0 193 691 536 617
All Age Groups 500 410 458 461 148 319 495 379 441
Note: R_M= Rural Males, R_F = Rural Females, R_P= Rural Persons, U_M= Urban Males, U_F = Urban Females, U_P = Urban Persons, T_M= Total Males,T_F= Total Females, T_P = Total Persons.
Source: NSS 50th, 55th and 61st Rounds.

95Chapter 4 •
LABOUR AND EMPLOYMENT
ANNEXURE TABLE A-4.2
Age Group-wise Labour Force Participation Rate in Arunachal Pradesh: 1993-94, 1999-2000 and 2004-05
Age Group Labour Force Participation Rate
R_M R_F R_P U_M U_F U_P T_M T_F T_P
1993-94
5-9 0 2 1 38 0 22 6 2 4
10-14 54 31 44 0 16 8 47 28 38
15-19 380 401 389 91 71 81 346 347 347
20-24 680 620 645 678 147 352 680 554 607
25-29 855 701 768 911 308 662 863 669 757
30-34 940 749 861 1000 365 709 947 702 844
35-39 989 732 870 1000 160 643 991 648 834
40-44 961 754 870 1000 180 789 967 704 859
45-49 979 730 866 1000 289 753 982 690 853
50-54 969 770 874 1000 0 731 973 730 861
55-59 955 662 799 1000 0 485 960 589 763
60 and Above 668 391 540 569 0 261 662 360 520
All Age Groups 506 410 460 525 109 335 508 375 445
1999-2000
5-9 19 10 15 4 10 6 17 10 14
10-14 38 51 44 0 0 0 34 47 40
15-19 304 320 312 90 37 68 283 301 292
20-24 494 557 523 401 310 357 489 544 515
25-29 747 478 610 880 273 552 754 467 607
30-34 790 474 663 854 114 339 794 408 626
35-39 833 484 668 903 203 599 844 445 658
40-44 792 542 678 834 190 650 798 517 675
45-49 791 615 700 990 202 713 810 594 701
50-54 683 563 642 968 708 931 698 566 654
55-59 780 732 759 1000 149 444 783 714 753
60 and Above 684 438 559 0 0 0 666 432 548
All Age Groups 425 310 371 406 110 275 424 295 363
2004-05
5-9 1 3 2 36 0 20 6 2 4
10-14 25 49 36 16 39 26 24 48 34
15-19 290 331 309 85 90 88 262 289 275
20-24 724 616 669 347 216 286 675 572 623
25-29 951 645 789 921 273 559 947 594 759
30-34 952 710 829 886 199 510 944 636 785
35-39 921 744 832 978 327 634 930 674 800
40-44 961 754 871 988 167 772 965 699 857
45-49 965 805 896 1000 235 739 969 760 881
50-54 957 765 870 904 384 737 951 739 857
55-59 895 685 824 982 31 637 900 645 814
60 and Above 709 562 639 357 0 193 691 536 617
All Age Groups 505 413 462 466 151 323 500 382 445
Note: R_M= Rural Males, R_F = Rural Females, R_P= Rural Persons, U_M= Urban Males, U_F = Urban Females, U_P = Urban Persons, T_M= Total Males,T_F= Total Females, T_P = Total Persons.
Source: NSS 50th, 55th and 61st Rounds.

ARUNACHAL PRADESH DEVELOPMENT REPORT96
ANNEXURE TABLE A-4.3
Unemployment Rate by Educational Standards in Arunachal Pradesh (as a Proportion of Labour Force): 1993-94
Age Group Proportion of Labour Force
R_M R_F R_P U_M U_F U_P T_M T_F T_P
All Social Groups
Illiterate 14.25 0.64 7.60 0.00 0.00 0.00 13.56 0.63 7.35
Below Primary 0.00 0.00 0.00 76.74 285.70 93.91 16.38 23.68 17.75
Primary 5.82 0.00 5.00 0.00 0.00 0.00 4.94 0.00 4.29
Middle 16.49 0.00 13.90 30.47 0.00 26.96 20.45 0.00 17.47
Secondary 76.26 38.66 73.57 0.00 295.97 27.25 49.39 146.21 57.01
Higher Secondary 5.00 246.57 26.16 29.19 167.65 64.92 12.75 196.79 40.38
Graduate and Above 107.10 106.44 106.93 0.00 0.00 0.00 47.38 80.15 52.88
All 16.37 2.26 10.40 17.73 73.91 26.07 16.54 4.63 11.79
ST Social Group
Illiterate 26.54 4.07 15.34 0.00 0.00 0.00 25.97 4.06 15.15
Below Primary 0.00 0.00 0.00 0.00 0.00 0.00 0.00 0.00
Primary 17.87 0.00 14.34 17.87 0.00 14.34
Middle 0.00 0.00 0.00 0.00 0.00 0.00 0.00 0.00 0.00
Secondary 0.00 0.00 0.00 0.00 0.00 0.00 0.00 0.00
Higher Secondary 0.00 0.00 0.00 0.00 0.00 0.00 0.00 0.00
Graduate and Above 0.00 0.00 0.00 0.00 0.00 0.00 0.00 0.00
All 19.51 3.38 12.53 0.00 0.00 0.00 19.03 3.36 12.32
Non-ST Social Group
Illiterate 12.06 0.00 6.20 0.00 0.00 0.00 11.43 0.00 5.97
Below Primary 0.00 0.00 0.00 79.04 285.70 96.49 19.96 44.19 23.13
Primary 0.00 0.00 0.00 0.00 0.00 0.00 0.00 0.00 0.00
Middle 21.47 0.00 17.73 30.96 0.00 27.75 24.66 0.00 20.92
Secondary 82.57 54.72 81.02 0.00 295.97 27.48 52.13 176.35 60.78
Higher Secondary 5.37 246.57 27.90 30.96 176.37 68.71 13.63 203.13 42.95
Graduate and Above 128.43 353.80 153.27 0.00 0.00 0.00 51.37 169.28 62.43
All 15.74 2.02 9.96 18.27 76.25 26.87 16.10 4.90 11.69
Note: R_M= Rural Males, R_F = Rural Females, R_P= Rural Persons, U_M= Urban Males, U_F = Urban Females, U_P = Urban Persons, T_M= Total Males,T_F= Total Females, T_P = Total Persons.
Source: NSS 50th Round.

97Chapter 4 •
LABOUR AND EMPLOYMENT
ANNEXURE TABLE A-4.4
Unemployment Rate by Educational Standards in Arunachal Pradesh (as a Proportion of Labour Force): 1999-2000
Education Level Proportion of Labour Force
R_M R_F R_P U_M U_F U_P T_M T_F T_P
All Social Groups
Illiterate 0.00 0.00 0.00 0.00 0.00 0.00 0.00 0.00 0.00
Below Primary 5.85 0.00 4.00 0.00 0.00 0.00 5.31 0.00 3.71
Primary 37.26 0.00 25.05 38.46 0.00 32.48 37.32 0.00 25.37
Middle 17.35 0.00 13.44 0.00 0.00 0.00 15.67 0.00 12.34
Secondary 2.53 42.82 6.92 16.67 149.81 43.99 5.33 79.50 14.98
Higher Secondary 2.16 0.00 2.07 0.00 220.31 36.31 1.72 118.89 9.80
Graduate and Above 7.36 661.06 30.84 0.00 31.97 4.90 4.42 180.75 19.67
All 7.72 1.41 5.20 6.50 89.97 21.30 7.62 3.85 6.16
ST Social Group
Illiterate 0.00 0.00 0.00 0.00 0.00 0.00 0.00 0.00 0.00
Below Primary 16.02 0.00 10.45 0.00 0.00 0.00 14.02 0.00 9.40
Primary 91.05 0.00 54.98 0.00 0.00 0.00 87.52 0.00 53.13
Middle 37.13 0.00 26.39 0.00 0.00 0.00 34.82 0.00 24.93
Secondary 2.08 46.57 9.02 47.94 0.00 42.70 7.76 42.58 13.00
Higher Secondary 0.00 0.00 0.00 0.00 540.26 141.05 0.00 203.19 45.61
Graduate and Above 8.02 800.61 38.67 0.00 0.00 0.00 5.56 233.06 25.45
All 13.71 1.75 8.23 11.21 102.28 35.56 13.59 3.98 9.26
Non-ST Social Group
Illiterate 0.00 0.00 0.00 0.00 0.00 0.00 0.00 0.00 0.00
Below Primary 0.00 0.00 0.00 0.00 0.00 0.00 0.00 0.00 0.00
Primary 9.20 0.00 6.57 50.86 0.00 46.10 11.74 0.00 8.50
Middle 0.00 0.00 0.00 0.00 0.00 0.00 0.00 0.00
Secondary 3.23 0.00 3.15 0.00 179.48 44.56 2.29 151.48 17.60
Higher Secondary 2.48 0.00 2.45 0.00 0.00 0.00 2.02 0.00 1.95
Graduate and Above 6.80 524.05 24.16 0.00 51.05 7.17 3.67 145.52 15.85
All 2.20 0.89 1.76 4.57 78.11 14.42 2.45 3.64 2.82
Note: R_M= Rural Males, R_F = Rural Females, R_P= Rural Persons, U_M= Urban Males, U_F = Urban Females, U_P = Urban Persons, T_M= Total Males,T_F= Total Females, T_P = Total Persons.
Source: NSS 55th Round.

ARUNACHAL PRADESH DEVELOPMENT REPORT98
ANNEXURE TABLE A-4.5
Unemployment Rate by Educational Standards in Arunachal Pradesh (as a Proportion of Labour Force): 2004-05
Education Level Proportion of Labour Force
R_M R_F R_P U_M U_F U_P T_M T_F T_P
All Social Groups
Illiterate 0.0 0.0 0.0 27.8 0.0 20.3 0.8 0.0 0.4
Below Primary 8.6 10.1 9.1 38.3 6.1 23.3 10.7 9.7 10.4
Primary 17.7 15.8 17.0 0.0 14.8 1.9 15.2 15.7 15.4
Middle 14.1 20.6 16.3 0.0 35.9 7.8 12.1 21.9 15.2
Secondary 8.5 7.7 8.3 0.0 0.0 0.0 7.1 6.2 6.9
Higher Secondary 33.2 46.8 35.8 6.0 47.9 11.3 23.1 47.0 27.2
Graduate and Above 61.4 70.6 62.1 18.0 135.5 29.4 48.5 93.7 52.2
All 11.1 5.8 8.9 10.6 24.3 13.5 11.1 6.6 9.3
ST Social Group
Illiterate 0.0 0.0 0.0 165.9 0.0 74.2 1.0 0.0 0.5
Below Primary 3.4 12.9 6.9 0.0 0.0 0.0 3.3 12.0 6.5
Primary 22.2 19.7 21.3 0.0 26.3 10.7 21.6 19.9 21.0
Middle 21.8 23.5 22.5 0.0 39.7 19.5 20.4 24.9 22.3
Secondary 14.4 8.8 12.6 0.0 0.0 0.0 13.4 7.3 11.3
Higher Secondary 44.3 51.2 46.1 0.0 72.7 13.6 31.7 55.7 37.5
Graduate and Above 68.4 52.7 67.0 32.1 286.9 57.7 60.2 111.2 64.9
All 11.3 6.7 9.2 15.9 32.7 22.1 11.5 7.6 9.7
Non-ST Social Group
Illiterate 0.0 0.0 0.0 0.0 0.0 0.0 0.0 0.0 0.0
Below Primary 21.2 0.0 15.4 59.0 11.1 38.7 26.8 2.8 19.5
Primary 5.3 0.0 3.8 0.0 0.0 0.0 3.4 0.0 2.7
Middle 0.0 0.0 0.0 0.0 0.0 0.0 0.0 0.0 0.0
Secondary 0.0 0.0 0.0 0.0 0.0 0.0 0.0 0.0 0.0
Higher Secondary 15.1 0.0 14.3 10.3 0.0 9.5 12.8 0.0 12.0
Graduate and Above 54.7 95.2 57.3 11.0 54.5 15.1 39.2 76.5 42.0
All 10.8 1.4 7.9 8.6 11.1 8.9 10.3 2.4 8.1
Note: R_M= Rural Males, R_F = Rural Females, R_P= Rural Persons, U_M= Urban Males, U_F = Urban Females, U_P = Urban Persons, T_M= Total Males,T_F= Total Females, T_P = Total Persons.
Source: NSS 61st Round.

99Chapter 4 •
LABOUR AND EMPLOYMENT
ANNEXURE TABLE A-4.6
Unemployment Rate by Educational Standards in Arunachal Pradesh (as a Proportion of Population): 1993-94
Education Level Proportion of Population
R_M R_F R_P U_M U_F U_P T_M T_F T_P
All Social Groups
Illiterate 8.29 0.32 4.10 0.00 0.00 0.00 7.83 0.30 3.86
Below Primary 0.00 0.00 0.00 31.62 17.03 26.04 4.80 2.39 3.83
Primary 2.02 0.00 1.29 0.00 0.00 0.00 1.68 0.00 1.04
Middle 6.79 0.00 4.25 15.27 0.00 8.97 8.87 0.00 5.46
Secondary 44.73 4.64 33.79 0.00 29.58 12.33 30.78 16.19 26.04
Higher Secondary 3.42 54.65 15.13 22.37 64.30 39.57 9.03 59.44 23.80
Graduate and Above 84.51 60.99 76.96 0.00 0.00 0.00 41.92 38.64 41.03
All 8.28 0.93 4.78 9.30 8.08 8.75 8.41 1.74 5.25
ST Social Group
Illiterate 14.54 2.03 8.00 0.00 0.00 0.00 14.19 1.96 7.77
Below Primary 0.00 0.00 0.00 0.00 0.00 0.00 0.00 0.00 0.00
Primary 7.78 0.00 5.36 0.00 0.00 0.00 7.73 0.00 5.24
Middle 0.00 0.00 0.00 0.00 0.00 0.00 0.00 0.00 0.00
Secondary 0.00 0.00 0.00 0.00 0.00 0.00 0.00 0.00
Higher Secondary 0.00 0.00 0.00 0.00 0.00 0.00 0.00 0.00 0.00
Graduate and Above 0.00 0.00 0.00 0.00 0.00 0.00 0.00 0.00
All 9.65 1.51 5.92 0.00 0.00 0.00 9.40 1.45 5.73
Non-ST Social Group
Illiterate 7.10 0.00 3.37 0.00 0.00 0.00 6.66 0.00 3.15
Below Primary 0.00 0.00 0.00 32.14 17.58 26.63 5.71 2.89 4.59
Primary 0.00 0.00 0.00 0.00 0.00 0.00 0.00 0.00 0.00
Middle 8.53 0.00 5.08 15.84 0.00 9.23 10.60 0.00 6.27
Secondary 47.02 4.83 35.43 0.00 29.58 12.46 32.04 16.54 26.94
Higher Secondary 3.85 61.08 17.02 23.40 74.42 43.08 9.95 67.59 26.46
Graduate and Above 99.42 101.77 100.01 0.00 0.00 0.00 45.47 51.78 46.92
All 8.00 0.81 4.56 9.62 8.51 9.12 8.22 1.79 5.17
Note: R_M= Rural Males, R_F = Rural Females, R_P= Rural Persons, U_M= Urban Males, U_F = Urban Females, U_P = Urban Persons, T_M= Total Males,T_F= Total Females, T_P = Total Persons.
Source: NSS 50th Round.
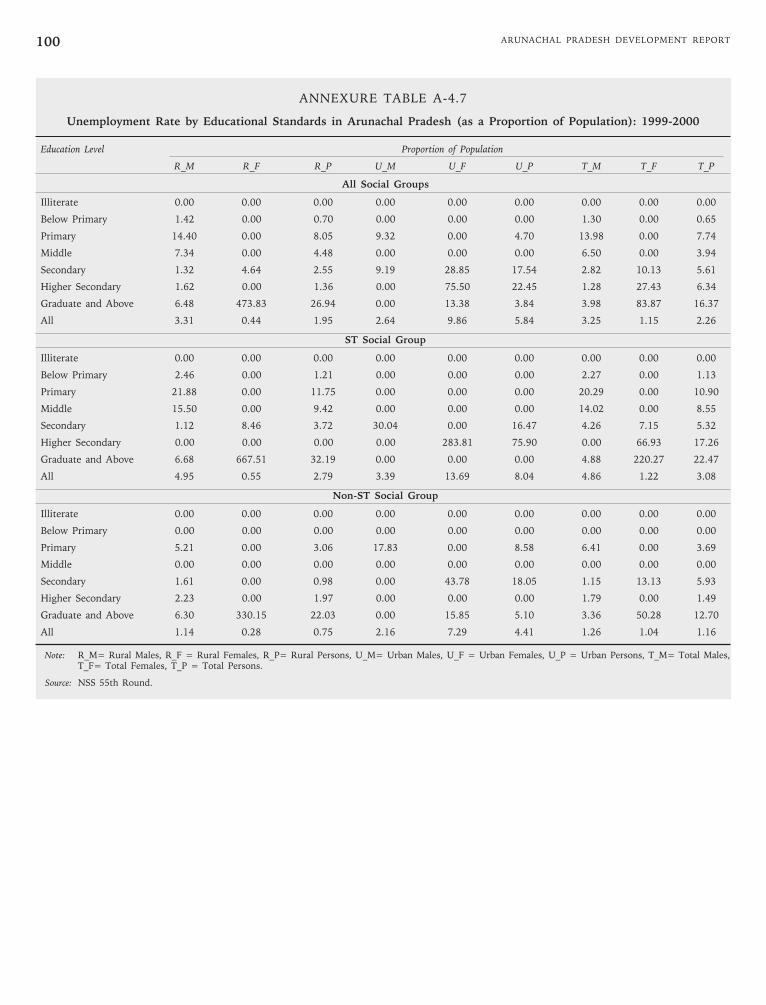
ARUNACHAL PRADESH DEVELOPMENT REPORT100
ANNEXURE TABLE A-4.7
Unemployment Rate by Educational Standards in Arunachal Pradesh (as a Proportion of Population): 1999-2000
Education Level Proportion of Population
R_M R_F R_P U_M U_F U_P T_M T_F T_P
All Social Groups
Illiterate 0.00 0.00 0.00 0.00 0.00 0.00 0.00 0.00 0.00
Below Primary 1.42 0.00 0.70 0.00 0.00 0.00 1.30 0.00 0.65
Primary 14.40 0.00 8.05 9.32 0.00 4.70 13.98 0.00 7.74
Middle 7.34 0.00 4.48 0.00 0.00 0.00 6.50 0.00 3.94
Secondary 1.32 4.64 2.55 9.19 28.85 17.54 2.82 10.13 5.61
Higher Secondary 1.62 0.00 1.36 0.00 75.50 22.45 1.28 27.43 6.34
Graduate and Above 6.48 473.83 26.94 0.00 13.38 3.84 3.98 83.87 16.37
All 3.31 0.44 1.95 2.64 9.86 5.84 3.25 1.15 2.26
ST Social Group
Illiterate 0.00 0.00 0.00 0.00 0.00 0.00 0.00 0.00 0.00
Below Primary 2.46 0.00 1.21 0.00 0.00 0.00 2.27 0.00 1.13
Primary 21.88 0.00 11.75 0.00 0.00 0.00 20.29 0.00 10.90
Middle 15.50 0.00 9.42 0.00 0.00 0.00 14.02 0.00 8.55
Secondary 1.12 8.46 3.72 30.04 0.00 16.47 4.26 7.15 5.32
Higher Secondary 0.00 0.00 0.00 0.00 283.81 75.90 0.00 66.93 17.26
Graduate and Above 6.68 667.51 32.19 0.00 0.00 0.00 4.88 220.27 22.47
All 4.95 0.55 2.79 3.39 13.69 8.04 4.86 1.22 3.08
Non-ST Social Group
Illiterate 0.00 0.00 0.00 0.00 0.00 0.00 0.00 0.00 0.00
Below Primary 0.00 0.00 0.00 0.00 0.00 0.00 0.00 0.00 0.00
Primary 5.21 0.00 3.06 17.83 0.00 8.58 6.41 0.00 3.69
Middle 0.00 0.00 0.00 0.00 0.00 0.00 0.00 0.00 0.00
Secondary 1.61 0.00 0.98 0.00 43.78 18.05 1.15 13.13 5.93
Higher Secondary 2.23 0.00 1.97 0.00 0.00 0.00 1.79 0.00 1.49
Graduate and Above 6.30 330.15 22.03 0.00 15.85 5.10 3.36 50.28 12.70
All 1.14 0.28 0.75 2.16 7.29 4.41 1.26 1.04 1.16
Note: R_M= Rural Males, R_F = Rural Females, R_P= Rural Persons, U_M= Urban Males, U_F = Urban Females, U_P = Urban Persons, T_M= Total Males,T_F= Total Females, T_P = Total Persons.
Source: NSS 55th Round.

101Chapter 4 •
LABOUR AND EMPLOYMENT
ANNEXURE TABLE A-4.8
Unemployment Rate by Educational Standards in Arunachal Pradesh (as a Proportion of Population): 2004-05
Education Level Proportion of Population
R_M R_F R_P U_M U_F U_P T_M T_F T_P
All Social Groups
Illiterate 0.0 0.0 0.0 8.8 0.0 4.4 0.4 0.0 0.2
Below Primary 3.5 2.8 3.2 9.1 1.2 5.2 4.1 2.6 3.4
Primary 7.0 4.3 5.8 0.0 0.9 0.5 6.1 3.7 5.1
Middle 7.3 6.5 7.0 0.0 5.1 2.3 6.0 6.3 6.1
Secondary 4.6 2.0 3.5 0.0 0.0 0.0 3.8 1.5 2.8
Higher Secondary 20.2 13.7 18.0 4.0 10.2 5.9 14.5 12.5 13.9
Graduate and Above 57.6 20.0 49.6 14.8 46.0 21.2 43.6 28.2 40.4
All 5.6 2.4 4.1 5.0 3.7 4.4 5.5 2.5 4.1
ST Social Group
Illiterate 0.0 0.0 0.0 41.8 0.0 16.6 0.5 0.0 0.3
Below Primary 1.3 3.8 2.4 0.0 0.0 0.0 1.2 3.5 2.2
Primary 8.7 5.9 7.5 0.0 2.0 1.3 8.3 5.5 7.0
Middle 10.3 8.6 9.5 0.0 8.2 4.9 9.4 8.6 9.0
Secondary 6.9 2.6 5.0 0.0 0.0 0.0 6.2 2.1 4.3
Higher Secondary 23.8 17.1 21.4 0.0 24.9 7.0 17.4 18.7 17.8
Graduate and Above 62.6 19.0 54.0 20.8 131.7 35.9 50.5 42.4 49.0
All 5.5 2.9 4.2 6.1 6.8 6.5 5.5 3.2 4.4
Non-ST Social Group
Illiterate 0.0 0.0 0.0 0.0 0.0 0.0 0.0 0.0 0.0
Below Primary 9.4 0.0 5.3 13.9 1.9 8.0 10.5 0.6 6.0
Primary 2.2 0.0 1.2 0.0 0.0 0.0 1.5 0.0 0.8
Middle 0.0 0.0 0.0 0.0 0.0 0.0 0.0 0.0 0.0
Secondary 0.0 0.0 0.0 0.0 0.0 0.0 0.0 0.0 0.0
Higher Secondary 11.6 0.0 8.8 7.8 0.0 5.1 9.8 0.0 6.9
Graduate and Above 52.6 20.9 45.3 10.3 16.2 11.8 37.4 19.1 33.1
All 6.1 0.5 3.6 4.4 1.2 3.0 5.6 0.7 3.5
Note: R_M= Rural Males, R_F = Rural Females, R_P= Rural Persons, U_M= Urban Males, U_F = Urban Females, U_P = Urban Persons, T_M= Total Males,T_F= Total Females, T_P = Total Persons.
Source: NSS 61st Round.

ARUNACHAL PRADESH DEVELOPMENT REPORT102
ANNEXURE TABLE A-4.9
Unemployment Rate by Age Group in Arunachal Pradesh (as a Proportion of Labour Force): 1993-94(Per Thousand Population)
Age Group Proportion of Labour Force
R_M R_F R_P U_M U_F U_P T_M T_F T_P
All Social Groups
10-14 209.28 0.00 142.73 1000.00 1000.00 209.28 84.36 167.13
15-19 44.33 1.61 25.27 110.86 254.56 177.72 46.40 10.11 30.19
20-24 71.38 18.13 41.92 74.51 207.82 108.67 71.76 25.15 47.04
25-29 27.79 0.00 13.51 0.00 0.00 0.00 23.67 0.00 12.23
30-34 8.52 0.00 5.43 0.00 0.00 0.00 7.58 0.00 4.92
35-39 0.00 0.00 0.00 0.00 0.00 0.00 0.00 0.00 0.00
40-44 0.00 0.00 0.00 0.00 0.00 0.00 0.00 0.00 0.00
45-49 0.00 0.00 0.00 0.00 0.00 0.00 0.00 0.00 0.00
50-54 0.00 0.00 0.00 0.00 0.00 0.00 0.00 0.00
55-59 0.00 0.00 0.00 0.00 0.00 0.00 0.00 0.00
60 and Above 0.00 0.00 0.00 0.00 0.00 0.00 0.00 0.00
All Age Groups 16 2 10 18 74 26 17 5 12
ST Social Group
10-14 0.00 0.00 0.00 0.00
15-19 140.63 0.00 72.35 140.63 0.00 72.35
20-24 23.86 52.01 32.72 0.00 0.00 0.00 23.35 47.63 31.34
25-29 38.73 0.00 19.31 0.00 0.00 37.72 0.00 19.06
30-34 25.01 0.00 8.89 25.01 0.00 8.89
35-39 0.00 0.00 0.00 0.00 0.00 0.00 0.00 0.00
40-44 0.00 0.00 0.00 0.00 0.00 0.00 0.00 0.00
45-49 0.00 0.00 0.00 0.00 0.00 0.00 0.00 0.00
50-54 0.00 0.00 0.00 0.00 0.00 0.00
55-59 0.00 0.00 0.00 0.00 0.00 0.00
60 and Above 0.00 0.00 0.00 0.00 0.00 0.00
All Age Groups 19.51 3.38 12.53 0.00 0.00 0.00 19.03 3.36 12.32
Non-ST Social Group
10-14 214.92 0.00 145.33 1000.00 1000.00 214.92 84.36 170.09
15-19 28.47 1.93 16.82 110.86 254.56 177.72 31.45 12.04 22.91
20-24 88.66 14.42 43.86 77.80 272.19 119.68 87.00 22.55 50.20
25-29 25.82 0.00 12.49 0.00 0.00 0.00 21.50 0.00 11.15
30-34 7.50 0.00 5.02 0.00 0.00 0.00 6.62 0.00 4.50
35-39 0.00 0.00 0.00 0.00 0.00 0.00 0.00 0.00 0.00
40-44 0.00 0.00 0.00 0.00 0.00 0.00 0.00 0.00 0.00
45-49 0.00 0.00 0.00 0.00 0.00 0.00 0.00 0.00 0.00
50-54 0.00 0.00 0.00 0.00 0.00 0.00 0.00 0.00
55-59 0.00 0.00 0.00 0.00 0.00 0.00 0.00 0.00
60 and Above 0.00 0.00 0.00 0.00 0.00 0.00 0.00 0.00
All Age Groups 15.74 2.02 9.96 18.27 76.25 26.87 16.10 4.90 11.69
Note: R_M= Rural Males, R_F = Rural Females, R_P= Rural Persons, U_M= Urban Males, U_F = Urban Females, U_P = Urban Persons, T_M= Total Males,T_F= Total Females, T_P = Total Persons.
Source: NSS 50th Round.
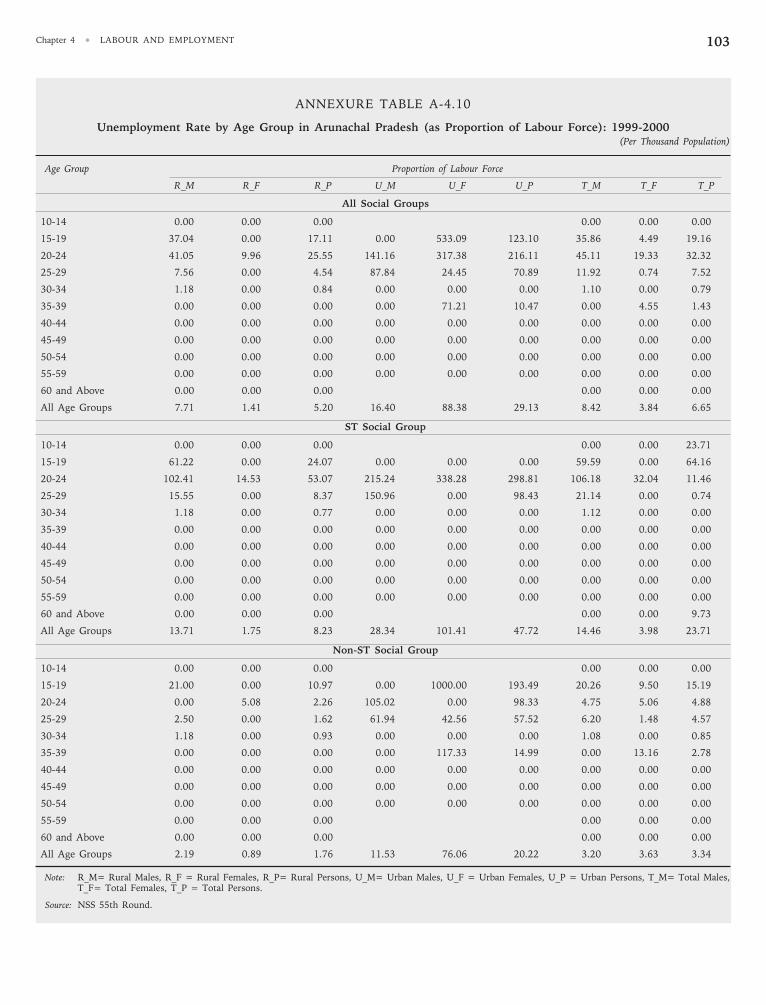
103Chapter 4 •
LABOUR AND EMPLOYMENT
ANNEXURE TABLE A-4.10
Unemployment Rate by Age Group in Arunachal Pradesh (as Proportion of Labour Force): 1999-2000(Per Thousand Population)
Age Group Proportion of Labour Force
R_M R_F R_P U_M U_F U_P T_M T_F T_P
All Social Groups
10-14 0.00 0.00 0.00 0.00 0.00 0.00
15-19 37.04 0.00 17.11 0.00 533.09 123.10 35.86 4.49 19.16
20-24 41.05 9.96 25.55 141.16 317.38 216.11 45.11 19.33 32.32
25-29 7.56 0.00 4.54 87.84 24.45 70.89 11.92 0.74 7.52
30-34 1.18 0.00 0.84 0.00 0.00 0.00 1.10 0.00 0.79
35-39 0.00 0.00 0.00 0.00 71.21 10.47 0.00 4.55 1.43
40-44 0.00 0.00 0.00 0.00 0.00 0.00 0.00 0.00 0.00
45-49 0.00 0.00 0.00 0.00 0.00 0.00 0.00 0.00 0.00
50-54 0.00 0.00 0.00 0.00 0.00 0.00 0.00 0.00 0.00
55-59 0.00 0.00 0.00 0.00 0.00 0.00 0.00 0.00 0.00
60 and Above 0.00 0.00 0.00 0.00 0.00 0.00
All Age Groups 7.71 1.41 5.20 16.40 88.38 29.13 8.42 3.84 6.65
ST Social Group
10-14 0.00 0.00 0.00 0.00 0.00 23.71
15-19 61.22 0.00 24.07 0.00 0.00 0.00 59.59 0.00 64.16
20-24 102.41 14.53 53.07 215.24 338.28 298.81 106.18 32.04 11.46
25-29 15.55 0.00 8.37 150.96 0.00 98.43 21.14 0.00 0.74
30-34 1.18 0.00 0.77 0.00 0.00 0.00 1.12 0.00 0.00
35-39 0.00 0.00 0.00 0.00 0.00 0.00 0.00 0.00 0.00
40-44 0.00 0.00 0.00 0.00 0.00 0.00 0.00 0.00 0.00
45-49 0.00 0.00 0.00 0.00 0.00 0.00 0.00 0.00 0.00
50-54 0.00 0.00 0.00 0.00 0.00 0.00 0.00 0.00 0.00
55-59 0.00 0.00 0.00 0.00 0.00 0.00 0.00 0.00 0.00
60 and Above 0.00 0.00 0.00 0.00 0.00 9.73
All Age Groups 13.71 1.75 8.23 28.34 101.41 47.72 14.46 3.98 23.71
Non-ST Social Group
10-14 0.00 0.00 0.00 0.00 0.00 0.00
15-19 21.00 0.00 10.97 0.00 1000.00 193.49 20.26 9.50 15.19
20-24 0.00 5.08 2.26 105.02 0.00 98.33 4.75 5.06 4.88
25-29 2.50 0.00 1.62 61.94 42.56 57.52 6.20 1.48 4.57
30-34 1.18 0.00 0.93 0.00 0.00 0.00 1.08 0.00 0.85
35-39 0.00 0.00 0.00 0.00 117.33 14.99 0.00 13.16 2.78
40-44 0.00 0.00 0.00 0.00 0.00 0.00 0.00 0.00 0.00
45-49 0.00 0.00 0.00 0.00 0.00 0.00 0.00 0.00 0.00
50-54 0.00 0.00 0.00 0.00 0.00 0.00 0.00 0.00 0.00
55-59 0.00 0.00 0.00 0.00 0.00 0.00
60 and Above 0.00 0.00 0.00 0.00 0.00 0.00
All Age Groups 2.19 0.89 1.76 11.53 76.06 20.22 3.20 3.63 3.34
Note: R_M= Rural Males, R_F = Rural Females, R_P= Rural Persons, U_M= Urban Males, U_F = Urban Females, U_P = Urban Persons, T_M= Total Males,T_F= Total Females, T_P = Total Persons.
Source: NSS 55th Round.

ARUNACHAL PRADESH DEVELOPMENT REPORT104
ANNEXURE TABLE A-4.11
Unemployment Rate by Age Group in Arunachal Pradesh (as Proportion of Labour Force): 2004-05(Per Thousand Population)
Age Group Proportion of Labour Force
R_M R_F R_P U_M U_F U_P T_M T_F T_P
All Social Groups
10-14 0.0 0.0 0.0 0.0 0.0 0.0 0.0 0.0 0.0
15-19 20.8 7.9 14.4 92.3 66.0 77.8 24.0 11.1 17.6
20-24 35.6 13.0 25.1 107.6 110.2 108.5 40.3 17.0 29.6
25-29 31.1 25.6 28.7 23.0 36.4 26.7 30.1 26.2 28.5
30-34 10.9 0.0 6.1 0.0 0.0 0.0 9.6 0.0 5.6
35-39 3.9 0.0 2.1 0.0 0.0 0.0 3.2 0.0 1.9
40-44 0.0 0.0 0.0 0.0 0.0 0.0 0.0 0.0 0.0
45-49 0.0 0.0 0.0 0.0 0.0 0.0 0.0 0.0 0.0
50-54 0.0 0.0 0.0 0.0 0.0 0.0 0.0 0.0 0.0
55-59 0.0 0.0 0.0 0.0 0.0 0.0 0.0 0.0 0.0
60 and Above 0.0 0.0 0.0 0.0 0.0 0.0 0.0 0.0
All Age Groups 11.1 5.7 8.9 10.6 24.3 13.5 11.1 6.6 9.3
ST Social Group
10-14 0.0 0.0 0.0 0.0 0.0 0.0 0.0 0.0 0.0
15-19 5.1 11.4 8.4 0.0 80.1 69.0 5.0 15.8 10.9
20-24 44.9 16.6 31.2 240.8 142.5 186.0 48.7 19.8 34.7
25-29 26.0 30.1 27.8 34.5 44.0 38.7 26.6 31.1 28.6
30-34 15.2 0.0 8.0 0.0 0.0 0.0 14.6 0.0 7.7
35-39 6.2 0.0 3.0 0.0 0.0 0.0 5.9 0.0 2.8
40-44 0.0 0.0 0.0 0.0 0.0 0.0 0.0 0.0 0.0
45-49 0.0 0.0 0.0 0.0 0.0 0.0 0.0 0.0 0.0
50-54 0.0 0.0 0.0 0.0 0.0 0.0 0.0 0.0 0.0
55-59 0.0 0.0 0.0 0.0 0.0 0.0 0.0 0.0
60 and Above 0.0 0.0 0.0 0.0 0.0 0.0 0.0 0.0
All Age Groups 11.3 6.7 9.2 15.9 32.7 22.1 11.5 7.6 9.7
Non-ST Social Group
10-14 0.0 0.0 0.0 0.0 0.0 0.0 0.0 0.0
15-19 44.4 0.0 25.3 110.3 0.0 87.7 50.3 0.0 29.4
20-24 10.7 0.0 6.4 73.9 80.7 75.7 21.6 7.6 16.2
25-29 46.5 8.5 31.6 15.5 0.0 13.9 38.8 8.0 28.4
30-34 0.0 0.0 0.0 0.0 0.0 0.0 0.0 0.0 0.0
35-39 0.0 0.0 0.0 0.0 0.0 0.0 0.0 0.0 0.0
40-44 0.0 0.0 0.0 0.0 0.0 0.0 0.0 0.0 0.0
45-49 0.0 0.0 0.0 0.0 0.0 0.0 0.0 0.0 0.0
50-54 0.0 0.0 0.0 0.0 0.0 0.0 0.0 0.0
55-59 0.0 0.0 0.0 0.0 0.0 0.0 0.0 0.0 0.0
60 and Above 0.0 0.0 0.0 0.0 0.0 0.0 0.0 0.0
All Age Groups 10.8 1.4 7.8 8.6 11.1 8.9 10.2 2.4 8.1
Note: R_M= Rural Males, R_F = Rural Females, R_P= Rural Persons, U_M= Urban Males, U_F = Urban Females, U_P = Urban Persons, T_M= Total Males,T_F= Total Females, T_P = Total Persons.
Source: NSS 61st Round.

105Chapter 4 •
LABOUR AND EMPLOYMENT
ANNEXURE TABLE A-4.12
Unemployment Rate by Age Group in Arunachal Pradesh (as a Proportion of Population): 1993-94(Per Thousand Population)
Age Group Proportion of Population
R_M R_F R_P U_M U_F U_P T_M T_F T_P
All Social Groups
10-14 11.38 0.00 6.22 0.00 15.64 7.54 9.80 2.39 6.41
15-19 16.86 0.65 9.84 10.11 18.09 14.32 16.07 3.51 10.46
20-24 48.54 11.24 27.06 50.54 30.53 38.25 48.79 13.93 28.54
25-29 23.76 0.00 10.38 0.00 0.00 0.00 20.42 0.00 9.25
30-34 8.02 0.00 4.67 0.00 0.00 0.00 7.17 0.00 4.15
35-39 0.00 0.00 0.00 0.00 0.00 0.00 0.00 0.00 0.00
40-44 0.00 0.00 0.00 0.00 0.00 0.00 0.00 0.00 0.00
45-49 0.00 0.00 0.00 0.00 0.00 0.00 0.00 0.00 0.00
50-54 0.00 0.00 0.00 0.00 0.00 0.00 0.00 0.00 0.00
55-59 0.00 0.00 0.00 0.00 0.00 0.00 0.00 0.00 0.00
60 and Above 0.00 0.00 0.00 0.00 0.00 0.00 0.00 0.00 0.00
All Age Groups 8.28 0.93 4.78 9.30 8.05 8.73 8.40 1.74 5.25
ST Social Group
10-14 0.00 0.00 0.00 0.00 0.00 0.00 0.00 0.00 0.00
15-19 32.54 0.00 20.22 0.00 0.00 0.00 31.82 0.00 19.90
20-24 14.77 27.14 19.13 0.00 0.00 0.00 14.58 24.31 18.22
25-29 28.25 0.00 13.54 0.00 0.00 0.00 27.71 0.00 13.38
30-34 23.67 0.00 7.63 0.00 0.00 23.67 0.00 7.52
35-39 0.00 0.00 0.00 0.00 0.00 0.00 0.00 0.00 0.00
40-44 0.00 0.00 0.00 0.00 0.00 0.00 0.00 0.00 0.00
45-49 0.00 0.00 0.00 0.00 0.00 0.00 0.00 0.00
50-54 0.00 0.00 0.00 0.00 0.00 0.00
55-59 0.00 0.00 0.00 0.00 0.00 0.00
60 and Above 0.00 0.00 0.00 0.00 0.00 0.00
All Age Groups 9.62 1.51 5.91 0.00 0.00 0.00 9.37 1.45 5.72
Non-ST Social Group
10-14 12.92 0.00 7.25 0.00 16.04 7.70 10.96 2.80 7.33
15-19 12.12 0.79 7.05 10.52 18.19 14.63 11.89 4.16 8.31
20-24 62.54 9.13 28.94 52.03 33.34 40.82 60.86 12.61 30.72
25-29 22.78 0.00 9.76 0.00 0.00 0.00 19.06 0.00 8.54
30-34 7.05 0.00 4.33 0.00 0.00 0.00 6.27 0.00 3.80
35-39 0.00 0.00 0.00 0.00 0.00 0.00 0.00 0.00 0.00
40-44 0.00 0.00 0.00 0.00 0.00 0.00 0.00 0.00 0.00
45-49 0.00 0.00 0.00 0.00 0.00 0.00 0.00 0.00 0.00
50-54 0.00 0.00 0.00 0.00 0.00 0.00 0.00 0.00 0.00
55-59 0.00 0.00 0.00 0.00 0.00 0.00 0.00 0.00 0.00
60 and Above 0.00 0.00 0.00 0.00 0.00 0.00 0.00 0.00 0.00
All Age Groups 7.99 0.81 4.56 9.62 8.47 9.10 8.22 1.79 5.16
Note: R_M= Rural Males, R_F = Rural Females, R_P= Rural Persons, U_M= Urban Males, U_F = Urban Females, U_P = Urban Persons, T_M= Total Males,T_F= Total Females, T_P = Total Persons.
Source: NSS 50th Round.

ARUNACHAL PRADESH DEVELOPMENT REPORT106
ANNEXURE TABLE A-4.13
Unemployment Rate by Age Group in Arunachal Pradesh (as a Proportion of Population): 1999-2000(Per Thousand Population)
Age Group Proportion of Population
R_M R_F R_P U_M U_F U_P T_M T_F T_P
All Social Groups
10-14 0.00 0.00 0.00 0.00 0.00 0.00 0.00 0.00 0.00
15-19 11.26 0.00 5.34 0.00 19.84 8.34 10.13 1.35 5.59
20-24 20.26 5.55 13.37 56.66 98.37 77.07 22.06 10.51 16.64
25-29 5.65 0.00 2.77 77.28 6.68 39.12 8.98 0.35 4.56
30-34 0.93 0.00 0.56 0.00 0.00 0.00 0.87 0.00 0.49
35-39 0.00 0.00 0.00 0.00 14.47 6.28 0.00 2.02 0.94
40-44 0.00 0.00 0.00 0.00 0.00 0.00 0.00 0.00 0.00
45-49 0.00 0.00 0.00 0.00 0.00 0.00 0.00 0.00 0.00
50-54 0.00 0.00 0.00 0.00 0.00 0.00 0.00 0.00 0.00
55-59 0.00 0.00 0.00 0.00 0.00 0.00 0.00 0.00 0.00
60 and Above 0.00 0.00 0.00 0.00 0.00 0.00 0.00 0.00 0.00
All Age Groups 3.28 0.44 1.93 6.66 9.69 8.00 3.57 1.13 2.41
ST Social Group
10-14 0.00 0.00 0.00 0.00 0.00 0.00 0.00 0.00 0.00
15-19 14.52 0.00 6.08 0.00 0.00 0.00 13.77 0.00 5.81
20-24 34.46 7.62 22.36 64.08 228.38 143.42 35.57 17.01 27.18
25-29 8.97 0.00 4.07 116.04 0.00 54.12 12.32 0.00 5.60
30-34 0.84 0.00 0.51 0.00 0.00 0.00 0.81 0.00 0.46
35-39 0.00 0.00 0.00 0.00 0.00 0.00 0.00 0.00 0.00
40-44 0.00 0.00 0.00 0.00 0.00 0.00 0.00 0.00 0.00
45-49 0.00 0.00 0.00 0.00 0.00 0.00 0.00 0.00 0.00
50-54 0.00 0.00 0.00 0.00 0.00 0.00 0.00 0.00 0.00
55-59 0.00 0.00 0.00 0.00 0.00 0.00 0.00 0.00 0.00
60 and Above 0.00 0.00 0.00 0.00 0.00 0.00 0.00 0.00 0.00
All Age Groups 4.88 0.55 2.76 8.64 13.61 10.88 5.10 1.21 3.20
Non-ST Social Group
10-14 0.00 0.00 0.00 0.00 0.00 0.00 0.00 0.00 0.00
15-19 7.85 0.00 4.33 0.00 31.17 11.86 6.70 3.57 5.33
20-24 0.00 3.03 1.49 50.78 0.00 25.67 3.34 2.83 3.09
25-29 2.30 0.00 1.22 57.93 9.88 31.80 5.71 0.80 3.39
30-34 1.04 0.00 0.62 0.00 0.00 0.00 0.94 0.00 0.53
35-39 0.00 0.00 0.00 0.00 23.57 9.94 0.00 4.23 1.84
40-44 0.00 0.00 0.00 0.00 0.00 0.00 0.00 0.00 0.00
45-49 0.00 0.00 0.00 0.00 0.00 0.00 0.00 0.00 0.00
50-54 0.00 0.00 0.00 0.00 0.00 0.00 0.00 0.00 0.00
55-59 0.00 0.00 0.00 0.00 0.00 0.00 0.00 0.00
60 and Above 0.00 0.00 0.00 0.00 0.00 0.00 0.00 0.00 0.00
All Age Groups 1.14 0.27 0.74 5.41 7.11 6.16 1.64 1.03 1.36
Note: R_M= Rural Males, R_F = Rural Females, R_P= Rural Persons, U_M= Urban Males, U_F = Urban Females, U_P = Urban Persons, T_M= Total Males,T_F= Total Females, T_P = Total Persons.
Source: NSS 55th Round.

107Chapter 4 •
LABOUR AND EMPLOYMENT
ANNEXURE TABLE A-4.14
Unemployment Rate by Age Group in Arunachal Pradesh (as a Proportion of Population): 2004-05(Per Thousand Population)
Age Group Proportion of Population
R_M R_F R_P U_M U_F U_P T_M T_F T_P
All Social Groups
10-14 0.0 0.0 0.0 0.0 0.0 0.0 0.0 0.0 0.0
15-19 6.0 2.6 4.4 7.9 6.0 6.9 6.3 3.2 4.8
20-24 25.7 8.0 16.8 37.3 23.8 31.1 27.2 9.7 18.5
25-29 29.6 16.5 22.6 21.2 9.9 14.9 28.5 15.6 21.6
30-34 10.4 0.0 5.1 0.0 0.0 0.0 9.0 0.0 4.4
35-39 3.6 0.0 1.8 0.0 0.0 0.0 3.0 0.0 1.5
40-44 0.0 0.0 0.0 0.0 0.0 0.0 0.0 0.0 0.0
45-49 0.0 0.0 0.0 0.0 0.0 0.0 0.0 0.0 0.0
50-54 0.0 0.0 0.0 0.0 0.0 0.0 0.0 0.0 0.0
55-59 0.0 0.0 0.0 0.0 0.0 0.0 0.0 0.0 0.0
60 and Above 0.0 0.0 0.0 0.0 0.0 0.0 0.0 0.0 0.0
All Age Groups 5.6 2.4 4.1 5.0 3.7 4.4 5.5 2.5 4.1
ST Social Group
10-14 0.0 0.0 0.0 0.0 0.0 0.0 0.0 0.0 0.0
15-19 1.1 3.3 2.1 0.0 9.4 6.0 1.0 4.1 2.6
20-24 31.1 10.3 20.5 33.8 37.3 35.2 31.3 11.9 21.6
25-29 24.5 22.2 23.3 31.7 18.1 23.1 25.0 21.8 23.3
30-34 14.2 0.0 6.9 0.0 0.0 0.0 13.4 0.0 6.4
35-39 5.5 0.0 2.5 0.0 0.0 0.0 5.3 0.0 2.4
40-44 0.0 0.0 0.0 0.0 0.0 0.0 0.0 0.0 0.0
45-49 0.0 0.0 0.0 0.0 0.0 0.0 0.0 0.0 0.0
50-54 0.0 0.0 0.0 0.0 0.0 0.0 0.0 0.0 0.0
55-59 0.0 0.0 0.0 0.0 0.0 0.0 0.0 0.0 0.0
60 and Above 0.0 0.0 0.0 0.0 0.0 0.0 0.0 0.0 0.0
All Age Groups 5.5 2.9 4.2 6.1 6.8 6.5 5.5 3.2 4.4
Non-ST Social Group
10-14 0.0 0.0 0.0 0.0 0.0 0.0 0.0 0.0 0.0
15-19 22.4 0.0 12.8 13.9 0.0 7.9 20.0 0.0 11.5
20-24 8.9 0.0 4.6 40.8 15.0 27.7 16.5 3.8 10.2
25-29 45.6 3.8 21.0 14.2 0.0 7.3 37.4 3.1 18.0
30-34 0.0 0.0 0.0 0.0 0.0 0.0 0.0 0.0 0.0
35-39 0.0 0.0 0.0 0.0 0.0 0.0 0.0 0.0 0.0
40-44 0.0 0.0 0.0 0.0 0.0 0.0 0.0 0.0 0.0
45-49 0.0 0.0 0.0 0.0 0.0 0.0 0.0 0.0 0.0
50-54 0.0 0.0 0.0 0.0 0.0 0.0 0.0 0.0 0.0
55-59 0.0 0.0 0.0 0.0 0.0 0.0 0.0 0.0 0.0
60 and Above 0.0 0.0 0.0 0.0 0.0 0.0 0.0 0.0 0.0
All Age Groups 6.1 0.5 3.6 4.4 1.2 3.0 5.6 0.7 3.5
Note: R_M= Rural Males, R_F = Rural Females, R_P= Rural Persons, U_M= Urban Males, U_F = Urban Females, U_P = Urban Persons, T_M= Total Males,T_F= Total Females, T_P = Total Persons.
Source: NSS 61st Round.

ARUNACHAL PRADESH DEVELOPMENT REPORT108
ANNEXURE TABLE A-4.15
Percentage Share of Informal Sector Enterprises and Employment in Arunachal Pradesh: 1990-1998
Categories Rural Urban Combined
Numbers Employment Numbers Employment Numbers Employment
1990 Agriculture
OAE 58.59 30.89 57.94 35.38 58.52 31.38
Informal Enterprise 94.16 66.82 99.21 95.61 94.77 70.44
Non-Agriculture
OAE 45.56 16.20 36.40 8.31 43.36 13.48
Informal Enterprise 93.36 47.86 88.11 34.27 92.10 43.18
Total
OAE 46.31 16.87 36.96 8.60 44.12 14.08
Informal Enterprise 93.40 48.72 88.39 34.93 92.23 44.09
1998 Agriculture
OAE 58.01 34.05 20.00 8.64 54.23 31.24
Informal Enterprise 93.92 63.80 90.00 60.49 93.53 63.44
Non-Agriculture
OAE 48.55 19.34 50.50 15.25 49.12 17.89
Informal Enterprise 93.24 51.91 92.63 43.79 93.06 49.02
Total
OAE 48.66 19.52 50.40 15.23 49.18 18.01
Informal Enterprise 93.25 52.06 92.62 43.84 93.06 49.14
Source: Report on Economic Census, 1990 and 1998, Arunachal Pradesh.
ANNEXURE TABLE A-4.16
Rural Non-farm Labour Force in North-east India
State 1993-94 1999-2000 2004-05
R_M R_F R_P R_M R_F R_P R_M R_F R_P
Arunachal Pradesh 20.93 3.84 13.61 24.38 4.89 16.58 26.0 7.3 18.1
Assam 22.36 17.65 21.41 35.35 20.6 32.32 30.4 11.7 25.7
Manipur 33.49 39.56 35.88 22.05 30.43 24.7 30.6 30.9 30.7
Meghalaya 17.46 9.48 14.01 14.03 12.72 13.45 20.7 15.2 18.3
Mizoram 13.65 6.73 11.22 15.99 12.53 14.49 15.1 8.9 12.6
Nagaland 32.13 10.81 25.55 29.47 8.07 20.34 30.4 9.6 20.7
Sikkim 43.02 32.97 40.86 43.16 29.93 39.25 45.3 28.1 39.5
Tripura 51.56 45.48 50.52 54.72 50.93 54.29 57.6 51.4 56.8
All North East 25.32 18.82 23.76 34.86 19.97 31.34 32.2 14.9 27.4
All India 25.90 13.80 21.60 28.60 13.70 23.70
Note: R_M= Rural Males, R_F = Rural Females, R_P= Rural Persons.
Source: NSS 50th, 55th and 61st Rounds, extracted from household level data on CD-ROM.

109Chapter 4 •
LABOUR AND EMPLOYMENT
ANNEXURE TABLE A-4.17
Changing Composition of RNFE in Arunachal Pradesh: 1971-1991
Industry Category Percentage Share of RNFE Annual Growth
1971 1991 1971-1991
Mining and Quarrying 0.01 0.77 28.06
Manufacturing [a+b] 1.65 8.97 12.81
a. Household Manufacturing 1.53 0.63 -0.48
b. Non-household Manufacturing 0.12 8.29 28.17
Construction 0.48 19.79 24.90
Trade and Commerce 1.93 8.87 11.87
Transport, Storage and Communication 0.02 3.10 32.63
Other Services 95.91 58.50 1.14
Total RNFE 100.00 100.00 3.67
Note: Growth Rate is simple annual average growth.
Source: Census of India, various years.
ANNEXURE TABLE A-4.18
Inter-district Variations in the Share of Rural Non-farm Employment in Arunachal Pradesh: 2001(Main+Marginal Workers)
Districts Share of Rural Non-farm Employment
Persons Males Females
Tawang 51.15 67.11 23.52
West Kameng 57.83 69.93 26.55
East Kameng 15.39 23.76 6.97
Papum Pare 47.18 59.39 27.33
Lower Subansiri 18.5 29.42 7.43
Upper Subansiri 14.92 23.94 5.57
West Siang 22.72 31.1 12.42
East Siang 28.84 35.08 20.78
Upper Siang 32.53 45.82 12.2
Dibang Valley 29.81 39.61 14.09
Lohit 26.91 34.98 13.33
Changlang 18.97 25.61 10.56
Tirap 14.66 23.79 4.75
Arunachal Pradesh 27.47 38.31 12.65
Source: Census of India, 2001.f

Introduction
This chapter assesses poverty incidence in Arunachal
Pradesh. It specially investigates the inter-district variation
in the incidence of poverty.
The differences in the level of living, and consequently
on incidence of poverty and inequality could arise due to
variations in land use pattern across the states, the
settlement of population, composition of population in
different ethnic groups, temporal change and spatial
variation in education and literacy rates and so on. Given
that poverty is multidimensional; these characteristics
would have significant influence on outcomes like poverty
and consumption.
The data used here to investigate these issues have
been obtained from the National Sample Survey
Organisation (NSSO), Census of India, Ministry of Rural
Development, Government of India and benchmarking
survey of the households conducted by the Institute of
Applied Manpower Research, New Delhi. The temporal
change and spatial variation in the incidence of poverty
and inequality have been investigated using household
level data collected during two recent rounds of surveys
conducted by the NSSO during the 50th (1993-94) and
61st Rounds (2004-05). In this study, we have used the
unit record data, rather than the published tables brought
out by the NSSO.
Poverty and Undernutrition
In this section, we look at incidence of poverty in
Arunachal Pradesh. The issues surrounding poverty
measurement have been thoroughly debated.1 Standard of
ARUN
ACH
AL PR
ADESH
living or welfare is measured using consumption
expenditure of the households. The reasonable minimum
standard of living or poverty norm is taken from GoI
(1993, 1997, 2007). It is to be noted that for the states
located in the north-eastern region (NER), the state-
specific price indices are available only for Assam.
Consequently, the official poverty ratios are reported
separately for Assam only from among the states in the
NER (GoI, 1993, 1997, 2001). For the remaining six
states in the region, the poverty ratios of Assam have
been assigned. In this chapter, we have used expenditure
distribution of Arunachal Pradesh and poverty line of
Assam to calculate incidence of poverty in Arunachal
Pradesh (as well as other states in NER) along with
estimates of poverty incidence among districts in
Arunachal Pradesh.
The poverty incidence in Arunachal Pradesh and NER
as captured by the HCR is reported in Table 5.1. We
observe from the table that the poverty incidence in the
NER vis-à-vis the all India level was marginally lower in
1993-94, whereas in 2004-05, the all India figure (27.47
per cent) is over nine percentage points higher than the
NER (18.17 per cent). While poverty incidence at the all-
India level has recorded a steady and continuous fall
during 1980s and 1990s, the NER has shown an uneven
variation over time. Using the same methodology of
poverty calculation among the states in the NER, we find
that for the region as a whole, incidence of poverty in the
NER declined sharply.
The estimates of poverty for 2004-05 released by the
Planning Commission, Government of India have two
different set of figures, mean per capita expenditure
Chapter 5
Poverty
1. For a survey of the literature on issues surrounding poverty measurement, see Dubey and Gangopadhyay (1998) and , Pradhan and Saluja (1998). For recentdevelopments, see Dubey and Palmer-Jones (2005, 2005a, 2005b).

ARUNACHAL PRADESH DEVELOPMENT REPORT112
(MPCE) based on uniform recall period (URP) and mixed
recall period (MRP).2 The difference in the estimates of
poverty between URP and MRP measures of MPCE arises
due to difference in the concept of mean per capita
expenditure. It is to be noted that the numbers reported
under columns 2004-05 in Table 5.1 are based on URP
method which is comparable with the calculations of
poverty in 1993-94. The HCR based on URP is higher by
about six percentage points compared to HCR based on
MRP measure of MPCE. We find a similar difference
between the two measures for NER though the gap is
marginally lower in case of NER compared to national
figure.3
The state-wise break-up of poverty incidence in the
NER highlights the intra-state variation. In 2004-05,
Arunachal Pradesh has about 10 per cent of its population
below the official poverty line. This is a steep decline from
over 37 per cent in 1993-94. In fact, this is one of the
fastest decline in poverty, especially among the smaller
states.
Table 5.1 also highlights the break-up of poverty
incidences into rural and urban sectors. While strict
comparisons in rural poverty for Arunachal Pradesh, and
Nagaland is not possible (because of limited survey of
rural areas in Nagaland), the general trend is that poverty
incidence has been on the decline in all the states except
Tripura from 1993-94 to 2004-05.
Sectoral break-up of poverty incidence suggests that in
Arunachal Pradesh, like other states in the region, poverty
is mainly a rural phenomenon though it has declined
significantly (by about 31 percentage points). In fact, one
of the highest reductions in rural poverty among the
Indian states is recorded in Arunachal Pradesh. The urban
population in Arunachal Pradesh, as well as among other
states is less vulnerable. Given that nearly two-thirds of
Arunachal Pradesh is inhibited by indigenous population,
we have also calculated poverty ratios for these groups
separately (not reported in this chapter). The STs in
Arunachal Pradesh do not fare worse than other
population groups. In sum, unlike other predominantly
tribal states in the region (Meghalaya, Mizoram and
Nagaland), households living in rural areas of Arunachal
Pradesh are more vulnerable to poverty which could be
due to relatively low productive jhum cultivation, absence
of labour, product and credit market, and poor transport
network (compared to other smaller states in the region).
While the debate on poverty in India goes back several
decades, it has focused almost exclusively on changes in
the ‘headcount’ ratio of consumption poverty—viz., the
proportion of the population having monthly per capita
consumption expenditure that is lower than the poverty
line. In this chapter, we have also measured hunger-
poverty, as measured by calorie deficiency—the inability to
consume the energy (calories) required by the body. As
pointed out earlier, we have used NSS consumption
survey data from the 50th and 61st Rounds to calculate
mean daily calorie intake per person, using food-to-calorie
conversion factors obtained from Gopalan et al. (1993)
and NSSO (1996, 2007). The normative calorie
requirements for the population in Arunachal Pradesh
were calculated using age-sex-activity structure for the
rural and urban sectors separately.
2. See GoI (2007) for details on the concepts of URP and MRP.
3. Table 5.1a has HCR figures by type of recall period (URP and MRP) for NER and states in the NER.
TABLE 5.1
Poverty Incidence in Arunachal Pradesh andOther States in NER (1993-94 and 2004-05)
50th Round 61st Round
State Rural Urban Total Rural Urban Total
Arunachal 41.20 6.02 37.00 10.85 2.58 9.90
Pradesh
Assam 45.20 7.92 41.40 22.09 3.64 20.38
Manipur 18.86 6.83 15.54 4.22 0.67 3.35
Meghalaya 24.37 1.82 21.29 3.57 0.06 3.11
Mizoram 6.24 0.00 4.26 2.80 0.00 1.69
Nagaland 2.29 0.00 1.68 0.00 0.00 0.00
Tripura 23.63 5.97 21.29 34.59 5.57 30.52
All India 36.85 32.86 35.86 28.04 25.81 27.47
Source: Dubey and Pala (2008).
TABLE 5.1A
HCR for NER States in 2004-05: URP and MRP
URP MRP
States Rural Urban All Rural Urban All
Arunachal 10.85 2.58 9.90 10.09 1.76 9.13
Pradesh
Assam 22.09 3.64 20.38 16.84 2.15 15.48
Manipur 4.22 0.67 3.35 2.43 0.26 1.90
Meghalaya 3.57 0.06 3.11 1.10 0.00 0.96
Mizoram 2.80 0.00 1.69 1.68 0.00 1.02
Nagaland 0.00 0.00 0.00 0.00 0.00 0.00
Tripura 34.59 5.57 30.52 28.68 2.72 25.04
All India 28.0 25.8 27.5 21.73 21.86 21.76
Source: Dubey and Pala (2008).
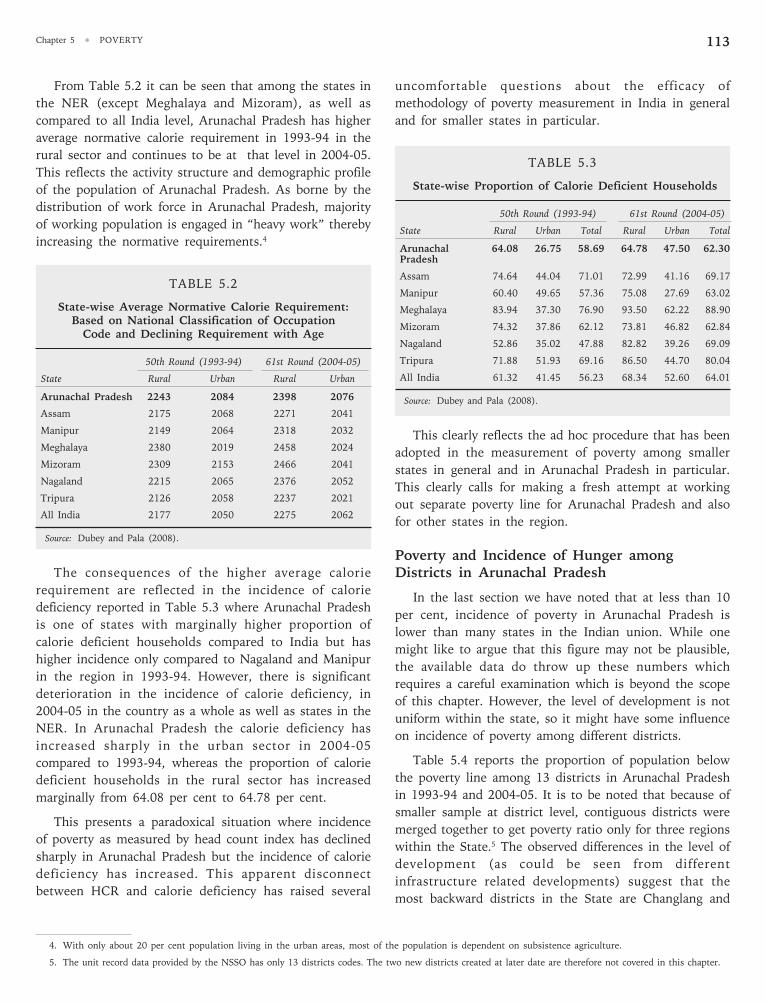
113Chapter 5 •
POVERTY
From Table 5.2 it can be seen that among the states in
the NER (except Meghalaya and Mizoram), as well as
compared to all India level, Arunachal Pradesh has higher
average normative calorie requirement in 1993-94 in the
rural sector and continues to be at that level in 2004-05.
This reflects the activity structure and demographic profile
of the population of Arunachal Pradesh. As borne by the
distribution of work force in Arunachal Pradesh, majority
of working population is engaged in “heavy work” thereby
increasing the normative requirements.4
TABLE 5.2
State-wise Average Normative Calorie Requirement:Based on National Classification of Occupation
Code and Declining Requirement with Age
50th Round (1993-94) 61st Round (2004-05)
State Rural Urban Rural Urban
Arunachal Pradesh 2243 2084 2398 2076
Assam 2175 2068 2271 2041
Manipur 2149 2064 2318 2032
Meghalaya 2380 2019 2458 2024
Mizoram 2309 2153 2466 2041
Nagaland 2215 2065 2376 2052
Tripura 2126 2058 2237 2021
All India 2177 2050 2275 2062
Source: Dubey and Pala (2008).
The consequences of the higher average calorie
requirement are reflected in the incidence of calorie
deficiency reported in Table 5.3 where Arunachal Pradesh
is one of states with marginally higher proportion of
calorie deficient households compared to India but has
higher incidence only compared to Nagaland and Manipur
in the region in 1993-94. However, there is significant
deterioration in the incidence of calorie deficiency, in
2004-05 in the country as a whole as well as states in the
NER. In Arunachal Pradesh the calorie deficiency has
increased sharply in the urban sector in 2004-05
compared to 1993-94, whereas the proportion of calorie
deficient households in the rural sector has increased
marginally from 64.08 per cent to 64.78 per cent.
This presents a paradoxical situation where incidence
of poverty as measured by head count index has declined
sharply in Arunachal Pradesh but the incidence of calorie
deficiency has increased. This apparent disconnect
between HCR and calorie deficiency has raised several
uncomfortable questions about the efficacy of
methodology of poverty measurement in India in general
and for smaller states in particular.
TABLE 5.3
State-wise Proportion of Calorie Deficient Households
50th Round (1993-94) 61st Round (2004-05)
State Rural Urban Total Rural Urban Total
Arunachal 64.08 26.75 58.69 64.78 47.50 62.30
Pradesh
Assam 74.64 44.04 71.01 72.99 41.16 69.17
Manipur 60.40 49.65 57.36 75.08 27.69 63.02
Meghalaya 83.94 37.30 76.90 93.50 62.22 88.90
Mizoram 74.32 37.86 62.12 73.81 46.82 62.84
Nagaland 52.86 35.02 47.88 82.82 39.26 69.09
Tripura 71.88 51.93 69.16 86.50 44.70 80.04
All India 61.32 41.45 56.23 68.34 52.60 64.01
Source: Dubey and Pala (2008).
This clearly reflects the ad hoc procedure that has been
adopted in the measurement of poverty among smaller
states in general and in Arunachal Pradesh in particular.
This clearly calls for making a fresh attempt at working
out separate poverty line for Arunachal Pradesh and also
for other states in the region.
Poverty and Incidence of Hunger amongDistricts in Arunachal Pradesh
In the last section we have noted that at less than 10
per cent, incidence of poverty in Arunachal Pradesh is
lower than many states in the Indian union. While one
might like to argue that this figure may not be plausible,
the available data do throw up these numbers which
requires a careful examination which is beyond the scope
of this chapter. However, the level of development is not
uniform within the state, so it might have some influence
on incidence of poverty among different districts.
Table 5.4 reports the proportion of population below
the poverty line among 13 districts in Arunachal Pradesh
in 1993-94 and 2004-05. It is to be noted that because of
smaller sample at district level, contiguous districts were
merged together to get poverty ratio only for three regions
within the State.5 The observed differences in the level of
development (as could be seen from different
infrastructure related developments) suggest that the
most backward districts in the State are Changlang and
4. With only about 20 per cent population living in the urban areas, most of the population is dependent on subsistence agriculture.
5. The unit record data provided by the NSSO has only 13 districts codes. The two new districts created at later date are therefore not covered in this chapter.

ARUNACHAL PRADESH DEVELOPMENT REPORT114
Tirap. Our calculations also show these differences as the
poverty incidence at 20 per cent is highest among these
two districts. Similarly, if we do not go by the absolute
numbers, these differences conform to our understanding
of level of development among different districts in
Arunachal Pradesh.
Table 5.4 also reports the incidence of hunger among
districts in Arunachal Pradesh. The incidence of hunger is
calculated from NSSO data on consumption expenditure.
In the 61st Round of consumption expenditure survey,
respondents were asked if all the members in the
household get two square meals every day. The response
from households in Arunachal Pradesh has been that
almost all the households answered this question. Among
the districts, Lower Subansiri and Upper Subansiri
reporting over 24 per cent of the households not having
two square meals round the year is alarming. In fact four
districts have severe food insufficiency among households
in Arunachal Pradesh.
TABLE 5.4
Poverty in the Districts in Arunachal Pradesh
District 1993-94 2004-05
% of Population % of % of Population % ofBelow the Households Below the Households
Poverty Line going Hungry Poverty Line going Hungry
Changlang 38.3 25.3 20.0 23.5
Dibang Valley 16.4 0.0 10.3 0.0
East Kameng 24.9 17.3 11.2 10.1
East Siang 16.4 2.1 6.4 5.1
Lohit 38.3 6.0 10.3 0.0
Lower Subansiri 24.9 31.2 3.0 24.2
Papum Pare 24.9 31.2 1.6 2.8
Tawang 24.9 2.7 11.2 10.1
Tirap 38.3 43.4 20.0 23.5
Upper Siang 16.4 2.1 6.4 5.1
Upper Subansiri 24.9 47.3 3.0 24.2
West Kameng 24.9 32.2 11.2 10.1
West Siang 16.4 6.3 6.4 5.1
Source: Dubey and Pala (2008).
TABLE 5.5
District Level Poverty in Arunachal Pradesh
50th Round (1993-94)
Districts Districts Merged Sample Estimated Estimated HCRwith the District in Size Population NumberColumn 1 of Poor
01 Tawang 02 West Kameng, 524 287969 99581 34.603 East Kameng,04 Lower Subansari,05 Upper Subansari
06 West Siang 07 East Siang, 321 187675 63201 33.708 Dibang Valley
09 Lohit 11 Changlang, 460 213673 93759 43.910 Tirap
61st Round (2004-05)
01 Tawang 02 West Kameng, 827 318635 19281 6.103 East Kameng,04 Papum Pare,05 Lower Subansari,06 Upper Subansari
07 West Siang 08 East Siang, 600 285528 17346 6.110 Dibang Valley,09 Upper Siang
11 Lohit 12 Changlang, 616 267164 49630 18.613 Tirap
Note: Poverty calculations at the district level is possible for only threegroups of districts. The name of the district is reported in column 1.Other contiguous districts have been merged (reported in column 2)with the districts in column 1. This has been done to maintaincomparability with the 50th Round.
Source: Dubey and Pala (2008).
TABLE 5.6
District Level Poverty in Arunachal Pradesh in 2004-05
Dist Combined with Sample HCR
Tawang West Kameng, East Kameng 279 11.2
Papum Pare None 280 1.6
Lower Subansiri Upper Subansiri 268 3.0
West Siang East Siang, Upper Siang 480 6.4
Lohit Dibang Valley 336 10.3
Changlang Tirap 400 20.0
Arunachal Pradesh 2043 9.9
Note: In 61st Round, district poverty can be calculated for six districts if weconsider sample size for 61st Round only.
Source: Dubey and Pala (2008).

115Chapter 5 •
POVERTY
TABLE 5.7
District Level Poverty and Hunger Incidencein Arunachal Pradesh
District Districts Merged with HCR Incidenceof Hunger
Tawang West Kameng, East Kameng 11.2 10.1
Papum Pare None 1.6 2.8
Lower Subansiri Upper Subansiri 3.0 24.2
West Siang East Siang, Upper Siang 6.4 5.1
Lohit Dibang Valley 10.3 0.0
Changlang Tirap 20.0 23.5
Source: Dubey and Pala (2008).
Conclusions and Policy Issues
In this chapter, we looked at the most important
consequence of underdevelopment—the existence of
poverty and malnutrition in Arunachal Pradesh along with
states in the NER as well as all India. In Arunachal
Pradesh, poverty incidence as measured by the Head
Count Index is less than all India average but higher
compared to smaller states in NER in 2004-05. Arunachal
Pradesh is also one of the states where poverty incidence
declined significantly. The intra-state incidence of poverty
is also reported where we observe that highest poverty
levels are recorded in the most backward districts in the
State.
An important finding of this chapter is the higher
normative calorie requirement as well as higher incidence
of calorie deficiency in Arunachal Pradesh. This highlights
the issue that was raised in the GoI (1979). The Task
Force had suggested that the poverty norm at the all India
level is not a true reflection of normative calorie
requirement of the population living in the hilly areas.
This finding also suggests that the consumption pattern,
especially consumption of food items, of the rural
population in Arunachal Pradesh is not being captured
adequately in the NSSO surveys.
The issues of immediate concern are calculation of
separate poverty norm and creation of price indexes that
could capture the living standard and cost of living
adequately for Arunachal Pradesh. In addition, the
exercise carried out in this chapter is based on data
available from the Central Sample of the NSSO surveys.
For smaller states like Arunachal Pradesh, there is urgent
need to increase the sample size (number of the
households surveyed) for getting a more reliable estimate
of poverty at the State as well as districts within
Arunachal Pradesh.

Introduction
The increasing visibility and growing popularity of the
concept of ‘human development’, has created an entirely
new paradigm of public policymaking, particularly in
developing economies. Human development is not just
another dimension of development; it is altogether a new
perspective, ‘a revolutionary way to recast our
conventional approach to development’. What is ‘new’ in
this approach to development is that the focus is on
‘human beings’ and not just on the economy. Further, it
is not just about plan-targets and growth rates; it is more
concerned about the impact of growth on human beings.
And last but not least, human development is a broader
and holistic concept which encompasses developments in
the economy, polity and society. In its essence, human
development is about expansion of human freedoms. This
conceptual watershed in the history of development
studies clearly recognises the values of freedom to
choose—not only between commodities, but also among
technologies, political parties, ideologies and institutions.
Thus, human development is not just limited to the
material aspects of well-being it goes beyond that. There
is a greater recognition of the intrinsic value of human
well-being and education in this framework. At the same
time, human development is not only important in itself,
but also has important linkages with the growth process.
Human Development in ArunachalPradesh and its Districts
The human development index (HDI) is basically a
composite index based on three dimensions of human
development—income, health and education. In
ARUN
ACH
AL PR
ADESH
conventional analysis a country is called rich or poor mainly
on the basis of a single indicator—the per capita income.
The HDI, on the other hand, puts equal emphasis on all
the three dimensions of development. Thus, different
indicators of development like per capita income, life
expectancy, adult literacy and enrolment ratio are used to
construct a single index—the human development index.
In terms of HDI the position of Arunachal Pradesh is
dismal, ranking 14th among the 16 major states of India.1
At a disaggregated level, in Arunachal Pradesh, the district
East Siang with an HDI of 0.660 ranks first among the 13
districts, followed by Dibang Valley with an HDI of 0.659.
The district of Papum Pare in which the capital complex,
Itanagar is situated ranks third with an HDI of 0.573.
Further it has been observed that the hilly districts have a
lower HDI compared to that of the plain districts (Table
6.1).
The spatially uneven process of development in the
State has created new challenges and constraints. Usually,
the districts or areas bordering Assam, and within the
district areas near the urban, administrative centres have
better infrastructural facilities than the interiors.
Arunachal Pradesh has been the home of a number of
tribes and sub-tribes, and many of them have limited
mobility beyond their well-defined local boundaries. Inter-
regional disparities in the State, therefore, have an
additional implication—as in many cases, it may reflect
inter-tribal disparities to a certain extent. Though the
state has been relatively free from secessionist violence
and insurgency, its development performance, particularly
in terms of the human development indicators, has not
been satisfactory. Among the eight north-eastern states,
Chapter 6
Human Development
1. Annexure Table A-6.1 clearly reflects that Kerala with an HDI of 0.721 occupies the highest rank and Bihar occupies the lowest position with an HDI of 0.446.Whereas on per capita basis, the rank of Arunachal Pradesh is 10th—only six states namely Assam, Bihar, Madhya Pradesh, Orissa, Rajasthan and UttarPradesh are ranked lower than that of Arunachal Pradesh. Further, in the field of education the rank of Arunachal Pradesh is 12th. However, in terms of healthstatus, the position of Arunachal Pradesh is the worst among all the 16 states (GoAP, 2006).
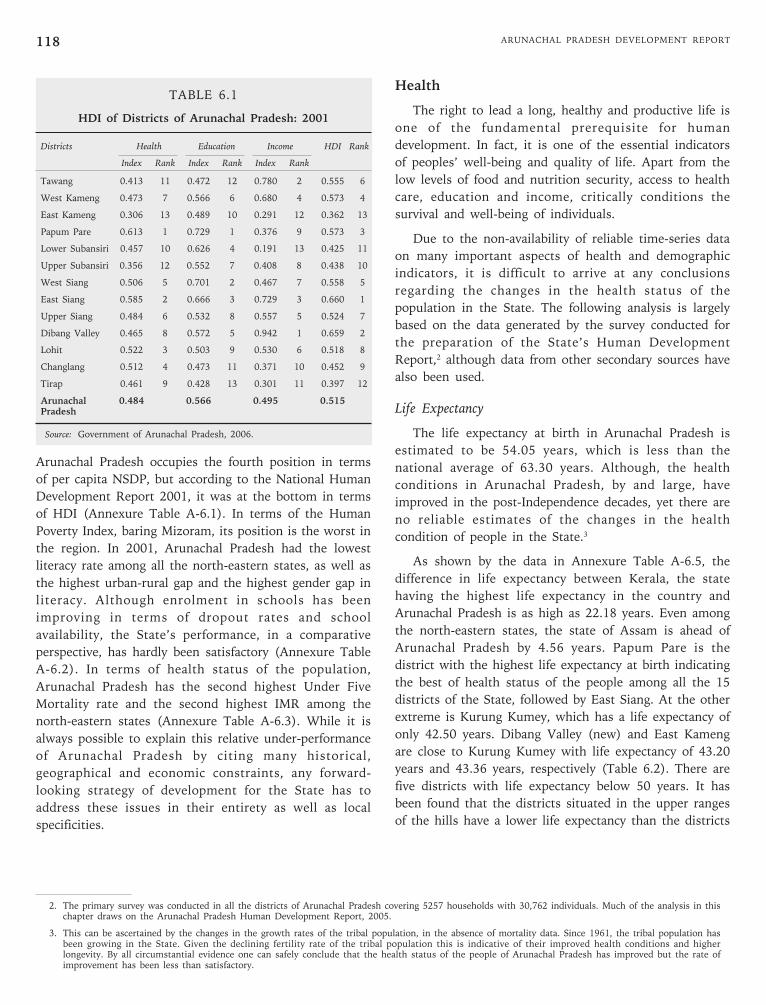
ARUNACHAL PRADESH DEVELOPMENT REPORT118
Arunachal Pradesh occupies the fourth position in terms
of per capita NSDP, but according to the National Human
Development Report 2001, it was at the bottom in terms
of HDI (Annexure Table A-6.1). In terms of the Human
Poverty Index, baring Mizoram, its position is the worst in
the region. In 2001, Arunachal Pradesh had the lowest
literacy rate among all the north-eastern states, as well as
the highest urban-rural gap and the highest gender gap in
literacy. Although enrolment in schools has been
improving in terms of dropout rates and school
availability, the State’s performance, in a comparative
perspective, has hardly been satisfactory (Annexure Table
A-6.2). In terms of health status of the population,
Arunachal Pradesh has the second highest Under Five
Mortality rate and the second highest IMR among the
north-eastern states (Annexure Table A-6.3). While it is
always possible to explain this relative under-performance
of Arunachal Pradesh by citing many historical,
geographical and economic constraints, any forward-
looking strategy of development for the State has to
address these issues in their entirety as well as local
specificities.
Health
The right to lead a long, healthy and productive life is
one of the fundamental prerequisite for human
development. In fact, it is one of the essential indicators
of peoples’ well-being and quality of life. Apart from the
low levels of food and nutrition security, access to health
care, education and income, critically conditions the
survival and well-being of individuals.
Due to the non-availability of reliable time-series data
on many important aspects of health and demographic
indicators, it is difficult to arrive at any conclusions
regarding the changes in the health status of the
population in the State. The following analysis is largely
based on the data generated by the survey conducted for
the preparation of the State’s Human Development
Report,2 although data from other secondary sources have
also been used.
Life Expectancy
The life expectancy at birth in Arunachal Pradesh is
estimated to be 54.05 years, which is less than the
national average of 63.30 years. Although, the health
conditions in Arunachal Pradesh, by and large, have
improved in the post-Independence decades, yet there are
no reliable estimates of the changes in the health
condition of people in the State.3
As shown by the data in Annexure Table A-6.5, the
difference in life expectancy between Kerala, the state
having the highest life expectancy in the country and
Arunachal Pradesh is as high as 22.18 years. Even among
the north-eastern states, the state of Assam is ahead of
Arunachal Pradesh by 4.56 years. Papum Pare is the
district with the highest life expectancy at birth indicating
the best of health status of the people among all the 15
districts of the State, followed by East Siang. At the other
extreme is Kurung Kumey, which has a life expectancy of
only 42.50 years. Dibang Valley (new) and East Kameng
are close to Kurung Kumey with life expectancy of 43.20
years and 43.36 years, respectively (Table 6.2). There are
five districts with life expectancy below 50 years. It has
been found that the districts situated in the upper ranges
of the hills have a lower life expectancy than the districts
2. The primary survey was conducted in all the districts of Arunachal Pradesh covering 5257 households with 30,762 individuals. Much of the analysis in thischapter draws on the Arunachal Pradesh Human Development Report, 2005.
3. This can be ascertained by the changes in the growth rates of the tribal population, in the absence of mortality data. Since 1961, the tribal population hasbeen growing in the State. Given the declining fertility rate of the tribal population this is indicative of their improved health conditions and higherlongevity. By all circumstantial evidence one can safely conclude that the health status of the people of Arunachal Pradesh has improved but the rate ofimprovement has been less than satisfactory.
TABLE 6.1
HDI of Districts of Arunachal Pradesh: 2001
Districts Health Education Income HDI Rank
Index Rank Index Rank Index Rank
Tawang 0.413 11 0.472 12 0.780 2 0.555 6
West Kameng 0.473 7 0.566 6 0.680 4 0.573 4
East Kameng 0.306 13 0.489 10 0.291 12 0.362 13
Papum Pare 0.613 1 0.729 1 0.376 9 0.573 3
Lower Subansiri 0.457 10 0.626 4 0.191 13 0.425 11
Upper Subansiri 0.356 12 0.552 7 0.408 8 0.438 10
West Siang 0.506 5 0.701 2 0.467 7 0.558 5
East Siang 0.585 2 0.666 3 0.729 3 0.660 1
Upper Siang 0.484 6 0.532 8 0.557 5 0.524 7
Dibang Valley 0.465 8 0.572 5 0.942 1 0.659 2
Lohit 0.522 3 0.503 9 0.530 6 0.518 8
Changlang 0.512 4 0.473 11 0.371 10 0.452 9
Tirap 0.461 9 0.428 13 0.301 11 0.397 12
Arunachal 0.484 0.566 0.495 0.515
Pradesh
Source: Government of Arunachal Pradesh, 2006.
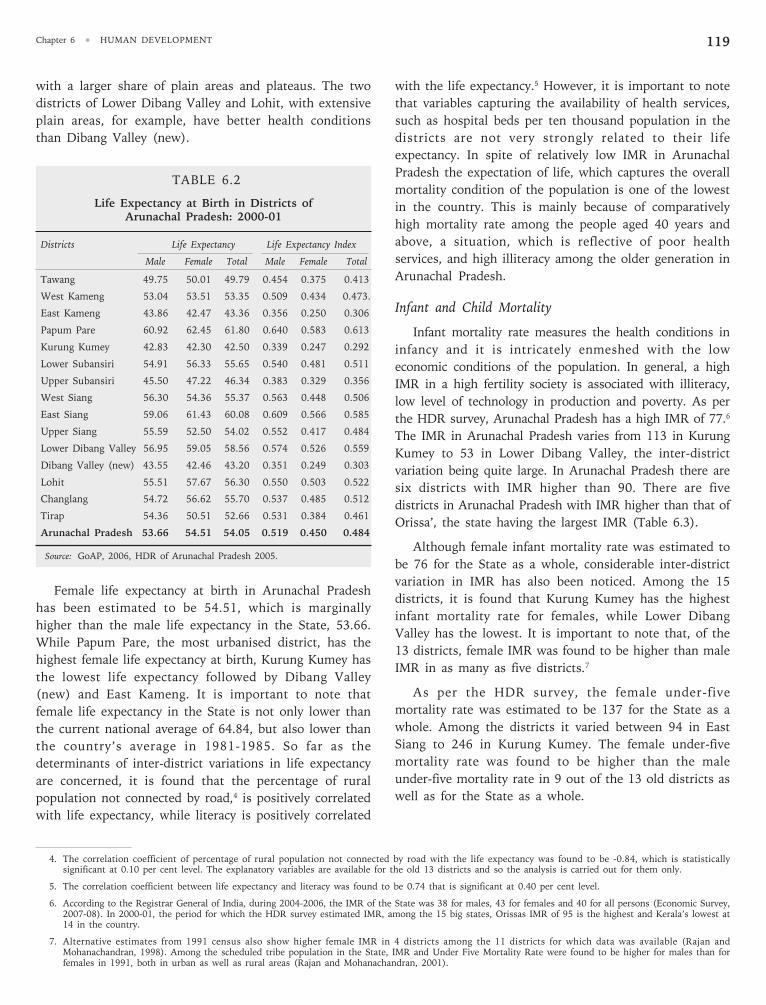
119Chapter 6 •
HUMAN DEVELOPMENT
with a larger share of plain areas and plateaus. The two
districts of Lower Dibang Valley and Lohit, with extensive
plain areas, for example, have better health conditions
than Dibang Valley (new).
TABLE 6.2
Life Expectancy at Birth in Districts ofArunachal Pradesh: 2000-01
Districts Life Expectancy Life Expectancy Index
Male Female Total Male Female Total
Tawang 49.75 50.01 49.79 0.454 0.375 0.413
West Kameng 53.04 53.51 53.35 0.509 0.434 0.473.
East Kameng 43.86 42.47 43.36 0.356 0.250 0.306
Papum Pare 60.92 62.45 61.80 0.640 0.583 0.613
Kurung Kumey 42.83 42.30 42.50 0.339 0.247 0.292
Lower Subansiri 54.91 56.33 55.65 0.540 0.481 0.511
Upper Subansiri 45.50 47.22 46.34 0.383 0.329 0.356
West Siang 56.30 54.36 55.37 0.563 0.448 0.506
East Siang 59.06 61.43 60.08 0.609 0.566 0.585
Upper Siang 55.59 52.50 54.02 0.552 0.417 0.484
Lower Dibang Valley 56.95 59.05 58.56 0.574 0.526 0.559
Dibang Valley (new) 43.55 42.46 43.20 0.351 0.249 0.303
Lohit 55.51 57.67 56.30 0.550 0.503 0.522
Changlang 54.72 56.62 55.70 0.537 0.485 0.512
Tirap 54.36 50.51 52.66 0.531 0.384 0.461
Arunachal Pradesh 53.66 54.51 54.05 0.519 0.450 0.484
Source: GoAP, 2006, HDR of Arunachal Pradesh 2005.
Female life expectancy at birth in Arunachal Pradesh
has been estimated to be 54.51, which is marginally
higher than the male life expectancy in the State, 53.66.
While Papum Pare, the most urbanised district, has the
highest female life expectancy at birth, Kurung Kumey has
the lowest life expectancy followed by Dibang Valley
(new) and East Kameng. It is important to note that
female life expectancy in the State is not only lower than
the current national average of 64.84, but also lower than
the country’s average in 1981-1985. So far as the
determinants of inter-district variations in life expectancy
are concerned, it is found that the percentage of rural
population not connected by road,4 is positively correlated
with life expectancy, while literacy is positively correlated
with the life expectancy.5 However, it is important to note
that variables capturing the availability of health services,
such as hospital beds per ten thousand population in the
districts are not very strongly related to their life
expectancy. In spite of relatively low IMR in Arunachal
Pradesh the expectation of life, which captures the overall
mortality condition of the population is one of the lowest
in the country. This is mainly because of comparatively
high mortality rate among the people aged 40 years and
above, a situation, which is reflective of poor health
services, and high illiteracy among the older generation in
Arunachal Pradesh.
Infant and Child Mortality
Infant mortality rate measures the health conditions in
infancy and it is intricately enmeshed with the low
economic conditions of the population. In general, a high
IMR in a high fertility society is associated with illiteracy,
low level of technology in production and poverty. As per
the HDR survey, Arunachal Pradesh has a high IMR of 77.6
The IMR in Arunachal Pradesh varies from 113 in Kurung
Kumey to 53 in Lower Dibang Valley, the inter-district
variation being quite large. In Arunachal Pradesh there are
six districts with IMR higher than 90. There are five
districts in Arunachal Pradesh with IMR higher than that of
Orissa’, the state having the largest IMR (Table 6.3).
Although female infant mortality rate was estimated to
be 76 for the State as a whole, considerable inter-district
variation in IMR has also been noticed. Among the 15
districts, it is found that Kurung Kumey has the highest
infant mortality rate for females, while Lower Dibang
Valley has the lowest. It is important to note that, of the
13 districts, female IMR was found to be higher than male
IMR in as many as five districts.7
As per the HDR survey, the female under-five
mortality rate was estimated to be 137 for the State as a
whole. Among the districts it varied between 94 in East
Siang to 246 in Kurung Kumey. The female under-five
mortality rate was found to be higher than the male
under-five mortality rate in 9 out of the 13 old districts as
well as for the State as a whole.
4. The correlation coefficient of percentage of rural population not connected by road with the life expectancy was found to be -0.84, which is statisticallysignificant at 0.10 per cent level. The explanatory variables are available for the old 13 districts and so the analysis is carried out for them only.
5. The correlation coefficient between life expectancy and literacy was found to be 0.74 that is significant at 0.40 per cent level.
6. According to the Registrar General of India, during 2004-2006, the IMR of the State was 38 for males, 43 for females and 40 for all persons (Economic Survey,2007-08). In 2000-01, the period for which the HDR survey estimated IMR, among the 15 big states, Orissas IMR of 95 is the highest and Kerala’s lowest at14 in the country.
7. Alternative estimates from 1991 census also show higher female IMR in 4 districts among the 11 districts for which data was available (Rajan andMohanachandran, 1998). Among the scheduled tribe population in the State, IMR and Under Five Mortality Rate were found to be higher for males than forfemales in 1991, both in urban as well as rural areas (Rajan and Mohanachandran, 2001).

ARUNACHAL PRADESH DEVELOPMENT REPORT120
TABLE 6.3
Infant Mortality Rate in the Districts of Arunachal Pradesh
Sl.No. Districts IMR Rank
1 Tawang 98 13
2 West Kameng 88 9
3 East Kameng 97 12
4 Papum Pare 67 5
5 Kurung Kumey 113 15
6 Lower Subansiri 59 3
7 Upper Subansiri 97 11
8 West Siang 85 7
9 East Siang 57 2
10 Upper Siang 87 8
11 Lower Dibang Valley 53 1
12 Dibang Valley (new) 98 14
13 Lohit 72 6
14 Changlang 62 4
15 Tirap 92 10
Arunachal Pradesh 77
Source: HDR of Arunachal Pradesh 2005.
IMR in Arunachal Pradesh varies significantly with the
accessibility. It is excessively high in the remote and
relatively inaccessible areas and relatively low in accessible
areas. By and large, the districts in the upper region have
a higher IMR than the districts in the lower regions of the
State. Both female IMR and female under-five mortality
rate are found to be negatively correlated with female
adult literacy rates. In spite of the fact that gender
discrimination is generally believed to be less severe in
predominantly tribal societies, excess female mortality in
Arunachal Pradesh puts a question mark on the prevailing
social attitudes towards girl child. Improvement in female
literacy to some extent might have contributed in
eliminating gender bias in childcare that results in excess
female mortality among children.
Immunisation
The universal immunisation programme (UIP) was
introduced by the Government of India in 1985-86 with
the objective of covering at least 85 per cent of infants
against six vaccine-preventable diseases by 1990.
Subsequently, the programme was expanded to cover all
the districts of the country and the target now is to
achieve 100 per cent immunisation coverage. In spite of
the programme being universal, a number of states in the
country including Arunachal Pradesh have failed to really
‘universalise’ it. As per the HDR survey, the overall
achievement in immunisation against polio and DPT is
only 68.09 per cent in the State, a level that is
significantly below the national average. Some districts
have achieved a better coverage with Papum Pare being at
the top. National Family Health Survey (NFHS-3) in
Arunachal Pradesh found that 28.4 per cent of the
children were vaccinated fully against BCG, polio, DPT
and measles during 2005-06. Apart from Nagaland, in all
other states of the north-eastern region a higher
percentage of children have received all the basic
vaccination. There is an urgent need to expand the reach
of the programme in the State, particularly to the remote
and hilly areas.
Health Services
The availability and effective utilisation of health
services are necessary preconditions for improvements of
the health status of the population. The tribes of
Arunachal Pradesh had a rich knowledge about medicinal
plants, and in some areas (for example in the Buddhist
belts) traditional medicines were being used more
systematically. The growth of modern health services,
however, is a comparatively recent phenomenon. As
reflected by Annexure Table A-6.6, hospital beds per
thousand population, increased from 11.0 in 1960-61 to
26.4 in 1990-91. In the post-reform decade of the 1990s,
however, this has declined to 20.1. Doctors per thousand
population, similarly increased from 1.6 in 1950-51 to 4.3
in 2000-01. In comparision to all India averages, the level
of health facilities might seem somewhat satisfactory, but
the conventional indicators based on availability of health
services per thousand population have limited significance
in a hilly state like Arunachal Pradesh because of the
scatteredness of settlements and difficulties in utilising
health facilities in high altitude areas.
An important aspect of the availability of health
infrastructure in the State, as in many other parts of the
country, is the rural-urban disparity. As shown in
Annexure Table A-6.7, of all the allopathic medical
institutions in the State, 85.71 per cent are located in the
urban areas. Only 29.63 per cent of community health
centres (CHCs) and 37.31 per cent of primary health
centres (PHCs) are located in the rural areas of the State.
Providing basic health care to scattered human habitations
is a tough and challenging task in Arunachal Pradesh.
Educational Attainments
Access to education plays a significant role in
expanding opportunities for individuals, households and
communities. Given the positive externalities of education
in general, it is hardly surprising that expansion of
educational opportunities has been regarded as one of the
fundamental means for social transformation. In

121Chapter 6 •
HUMAN DEVELOPMENT
Arunachal Pradesh access to formal education has been
one of the most important means for achieving a better
quality of life in the context of the rapid transformation
and modernisation of the economy, the society and the
polity.
Literacy Rates
The literacy rate for Arunachal Pradesh, according to
2001 census, is only 54.34 per cent, much lower than the
national average of 64.80 per cent. Nevertheless, the State
has made some progress in raising the literacy rate—from
only 25.55 per cent in 1981 to 54.34 per cent in 2001.
However, literacy rate in rural areas is as low as 47.8 per
cent, and the rural-urban gap in literacy continues to be
very high. Among the ST population literacy has gone up
from 14.04 per cent in 1981 to 34.45 per cent in 1991
and further to 49.62 per cent in 2001. Adult literacy rate
went up from 23.77 per cent in 1981 to 37.53 per cent in
1991, but in rural Arunachal Pradesh literacy was only
32.61 per cent, which was much below the other north-
eastern states (Table 6.4 and Annexure Table A-6.8).
Female literacy rate for Arunachal Pradesh was only 43.53
per cent, much lower than the national average of 53.70
per cent in 2001. However the State has made rapid
progress in raising the female literacy—from only 14.02
per cent in 1981 to 43.53 per cent in 2001. In rural areas
female literacy rate is as low as 36.9 per cent, and its
rural-urban gap continues to be very high. Among the ST
population female literacy has gone up from 7.31 per cent
in 1981 to 24.94 per cent in 1991 and 39.86 in 2001.
Adult literacy rate for females has gone up from 11.01 per
cent in 1981 to 23.59 per cent in 1991, but in rural
Arunachal Pradesh female literacy was only 19.13 per
cent, in 1991, which was much below the other north-
eastern States. Further it is found that the male literacy
rate for Arunachal Pradesh is 63.83 per cent, which is
lower than the national average of 75.20 per cent,
according to census 2001. Nevertheless, the State has
made substantial progress in raising the male literacy—
from only 35.12 per cent in 1981 to 63.83 per cent in
2001. In rural areas though the male literacy rate is 57.7
per cent, yet the rural-urban gap continues to be very
high. Among the ST population male literacy has gone up
from 20.79 per cent in 1981 to 44.00 per cent in 1991
and further to 58.77 per cent in 2001. Adult literacy rate
for males has gone up from 34.02 per cent in 1981 to
48.69 per cent in 1991, but in rural Arunachal Pradesh
male literacy was only 43.80 per cent, which was much
below compared to other north-eastern states.
Although the State has made significant progress in
the past, its performance in comparative terms has not
TABLE 6.4
Literacy Rate in Districts of Arunachal Pradesh: 2001 (All Areas) (Percentage)
Districts All Areas Rural Urban
M F All M F All M F All
Tawang 51.05 30.87 41.14 45.66 25.89 35.83 83.60 67.37 76.31
West Kameng 71.02 48.56 61.67 69.65 45.84 59.83 85.47 72.47 79.55
East Kameng 52.66 28.86 40.89 42.28 20.98 31.5 79.99 53.48 67.72
Papum Pare 79.00 61.72 70.89 70.11 49.66 60.35 87.03 73.35 80.72
Kurung Kumey 32.74 15.94 24.31 32.74 15.94 24.31 - - -
Lower Subansiri 53.68 36.19 45.09 48.79 31.16 40.01 85.86 71.76 79.10
Upper Subansiri 58.81 42.74 50.89 49.69 34.84 42.27 80.90 63.94 72.86
West Siang 66.72 53.24 60.31 60.92 48.58 54.9 87.01 74.10 81.5
East Siang 69.02 52.87 61.22 64.13 48.12 56.3 82.43 67.24 75.38
Upper Siang 58.64 39.09 49.8 58.64 39.09 49.8 - - -
Dibang Valley 69.21 49.73 60.34 63.26 42.79 53.74 89.97 78.39 85.05
Dibang Valley (N) 60.55 43.15 53.36 60.55 43.15 53.36 - - -
Lohit 65.68 44.59 56.05 61.2 38.80 50.89 83.83 69.68 77.56
Changlang 62.83 39.85 51.98 59.34 36.00 48.2 90.11 76.46 84.26
Tirap 53.76 29.00 42.01 46.56 21.24 34.36 88.50 73.69 82.02
Arunachal Pradesh 64.07 44.24 54.74 58.09 37.56 48.34 85.61 70.60 78.82
Source: Censuses of India 2001, Series 13-Arunachal Pradesh, Provisional Population Totals, Paper - of 2001, Directorate of Censuses Operations, ArunachalPradesh.

ARUNACHAL PRADESH DEVELOPMENT REPORT122
been very impressive. Considerable inter-district variations
exist in literacy rates from 69.32 per cent in Papum Pare
to 25.74 per cent in Kurung Kumey, 40.64 per cent in
East Kameng, and 41.73 per cent in Tirap. Substantial gap
exists between urban and rural literacy levels in many of
the districts as well. The gap was found to be the highest
in Tawang followed by Tirap, Lower Subansiri, East
Kameng and Changlang, respectively. The urban-rural gap
in literacy was lowest in East Siang and West Kameng
districts. Given the inaccessibility and inadequacy in
provision of social infrastructure, there is a huge gap in
the opportunities before the rural masses and their urban
counterparts. Between 1981-1991 there has been a decline
in urban-rural gap in literacy both for male and female
literacy rates, but it was found that the decline in urban-
rural gap in case of male literacy was sharper than that of
the females. However, during the 1990s the urban-rural
gap in female literacy has come down very sharply.
TABLE 6.5
Female Literacy Rate: Arunachal Pradesh 2001
District Female Literacy Rate Urban-Rural Gap
Total Rural Urban
Tawang 30.0 25.0 66.6 41.6
West Kameng 47.5 44.8 71.3 26.5
East Kameng 28.6 20.8 52.7 31.9
Papum Pare 60.4 49.0 71.3 22.3
Lower Subansiri 36.0 31.3 69.8 38.5
Upper Subansiri 40.7 32.5 63.0 30.5
West Siang 51.6 46.7 73.0 26.3
East Siang 52.4 47.5 67.2 19.7
Upper Siang 38.8 38.8 - -
Dibang Valley 48.7 42.5 78.1 35.6
Lohit 44.5 38.8 69.3 30.5
Changlang 39.2 35.0 75.4 40.5
Tirap 28.8 21.2 73.1 51.9
Arunachal Pradesh 43.5 36.9 69.5 32.6
Note: Upper Siang district does not have any urban area.
Source: Census of India 2001, Series-13, Arunachal Pradesh, Final PopulationTotals, Paper-2 of 2001.
Gender Gap in Literacy
The gender gap in literacy in Arunachal Pradesh as per
2001 census is 20.30 per cent points which is lower than
the national average of 21.5 percentage points. The gap
between male and female literacy rates in the State
declined very slowly during 1981 to 2001. In rural areas,
gender gap in literacy is sharper than that in urban areas.
Although the gender gap in literacy has been narrowing
down in the urban areas; it has remained at around 20 per
cent points during the past two decades in rural areas—a
fact that needs to be addressed in all future initiatives. In
comparative terms, gender gap in literacy in Arunachal
Pradesh is highest among all the states in north-east India
both for total as well as for rural population (Annexure
Table A-6.9). At a disaggregated level, gender gap in
literacy is highest in Tawang district and lowest in West
Siang.8 The districts having higher gender gap in literacy
than the State average include the western districts of
Tawang, West Kameng and East Kameng on one end, and
the eastern districts of Tirap, Changlang and Lohit on the
other. Such patterned concentration of districts having
high gender gap in literacy rates may imply the
importance of shared social attitudes in determining
gender difference in access to education, an issue that
needs further scrutiny. Another disturbing fact is that in
West Kameng and East Kameng, gender gap increased
between 1991 and 2001, while in Lower Subansiri, Tirap
and East Siang the decline was marginal, although the
disparity index in literacy has shown a decline in all the
districts (Table 6.6). Gender gap in literacy among the ST
population in the State, although lower than that among
the total population, is quite high. Despite the rise in
female literacy rate among the ST population, the gender
gap increased substantially from 13.48 percentage points
in 1981 to 19.06 percentage points in 1991 and has
marginally reduced to 18.92 points in 2001. This implies
that the expansion of educational opportunities has not
been gender-neutral: females within the ST population are
lagging behind their male counterparts.
Notwithstanding the importance of literacy rate as a
basic measure of educational attainment, the relative
access to secondary, higher and technical education has to
be taken into account to get a complete picture of gender
disparities in educational attainments. Among the literate
females in Arunachal Pradesh, substantial proportions
have studied only up to below primary levels.9 National
Family Health Survey data for 1998-99 shows that the
median years of schooling among males in Arunachal
Pradesh was 4.4, while that for females was only 2.1. It is
important to mention that the survey found median years
8. The gender gap in adult literacy is higher than that of the overall literacy rate in 2001. Changlang has the highest gender gap in adult literacy, followed byTirap, West Kameng, Tawang, Lohit and Upper Siang, all of which show higher gender gaps than the state average (GoAP, 2006).
9. In 1991, of the total female literates in Arunachal Pradesh 36.4 per cent had studied up to below primary levels, while in rural areas 40.9 per cent of literatefemales had studied up to that level. In some districts like East Kameng, 48 per cent of female literates had not studied beyond primary levels. On the otherhand, 6.1 per cent of literate males had studied up to graduation and beyond in the State, but only 3.6 per cent of women could reach that stage in 1991.

123Chapter 6 •
HUMAN DEVELOPMENT
of schooling for females in the State to be the lowest
among all north-eastern states (IIPS, 2002:25-29). In
2005-2006, as per the NFHS-III data, only 9.6 per cent of
women in the age group 15-49 have completed 12 or
more years of schooling, which is the lowest among the
north-eastern states, except Tripura (IIPS, 2007: 62).
TABLE 6.6
Gender Gap in Literacy in Districts ofArunachal Pradesh: 1991-2001
Districts Gender Gap in Literacy Rate Disparity Index in Literacy
1991 2001 1991 2001
Tawang 35.82 30.28 0.440 0.388
West Kameng 19.81 22.83 0.252 0.241
East Kameng 23.67 23.77 0.489 0.328
Papum Pare 22.47 16.92 0.251 0.163
Lower Subansiri 17.55 17.36 0.295 0.220
Upper Subansiri 20.34 18.85 0.297 0.219
West Siang 18.01 15.07 0.227 0.157
East Siang 16.74 16.00 0.233 0.166
Upper Siang 21.97 19.92 0.348 0.237
Dibang Valley 22.64 18.55 0.300 0.196
Lohit 22.81 21.20 0.277 0.233
Changlang 24.80 22.90 0.332 0.267
Tirap 24.92 24.52 0.434 0.336
Arunachal 21.76 20.30 0.298 0.227Pradesh
Note: (i) Literacy rate is the percentage of literates to total population aged7 years and above.
(ii) Disparity Index is the modified Sopher's index.
Source: Census of India, 2001 Final Population Totals, Paper-2 of 2001.
The gender bias in educational attainment results from
a variety of discriminatory attitudes towards females and
their education. All available studies show that societies
and families benefit immensely from female education.
The benefits of female education are societal—a more
productive workforce, lower fertility, lower infant
mortality—whereas the costs are private (King and Hill,
1999). Apart from the tangible costs such as tuition fees,
uniforms and school supplies, etc., an important
component of cost of education of the girl child is the
opportunity cost in the shape of foregone child labour
(McDougall, 2000).
According to the NFHS-III, the percentage of children
attending schools in the age group 6-17 was 68.5 per cent
in the State in the year 2005-06. While among the boys
72.2 per cent were attending school, among the girls their
percentage was 64.3. In rural areas of the State, 72.1 per
cent of boys were attending schools while 63.9 per cent of
girls were in schools. In urban areas 72.5 per cent of boys
and 66.4 per cent of girls were attending schools (IIPS,
2007:33).
BOX 6.1
Sarva Shiksha Abhiyan in Arunachal Pradesh
The Sarva Shiksha Abhiyan (SSA) was initiated by the
Government of India in the year 2000-01 with the
objective to attain universalisation of elementary
education in the country as a whole. Their main aim was
to achieve universal education for all children within the
age group of 6-14 years by the year 2003. They also
intended that by the year 2010 all the children should
complete eight years of schooling along with quality
improvement in elementary education. Further they
aimed at bringing down the dropout rate to zero in
primary education and bridging all gaps in gender and
social category in the elementary stage of education.
In Arunachal Pradesh the SSA was first implemented in
the three districts of Tawang, East Kameng and Tirap in
2001-02. The following year the other districts of the
State were also covered and finally in the year 2007-08,
the SSA was also implemented in the newly formed
district of Anjaw. This scheme is funded by the
Government of India (75 per cent), the state government
(10 per cent) and the DONER ministry (15 per cent)
presently.
The SSA provides a host of facilities in the field of
education by creating jobs for new teachers and building
infrastructure in the primary as well as upper primary
level. In order to encourage the girl child and SC and ST
students the scheme provided free text books to them.
Further to provide quality education they initiated
teacher’s training and training of community leaders. The
SSA also introduced innovative activity for out of school
children like vocational education for girls, computer
aided learning, early childcare education, inter-village
residential school and education on wheels.
The Sarva Shiksha Abhiyan has been quite successful in
the state of Arunachal Pradesh. Out of the total grant
approved by 2006-07 the achievement has been nearly
100 per cent for most of the schemes apart from a few
like teachers training, electrification, school grant,
teacher ’s grant and repair and maintenance of the
schools. Initial assessments suggests that on the whole
the SSA has gone a long way in achieving its goal that
universal education should reach the interior most areas
of the State also. A review of SSA conducted in four
districts of the State in 2007 has observed that by and
large grants have been utilised for the purpose for which
it was granted, improvements in enrolment and
attendance as well as in teacher recruitment and training
has been noticed. The study has pointed out that midday
meals, scheme in the schools, however needs to be
improved (Kapoor and Lhungdim, 2007).
Source: With inputs from Prof. K.C. Kapoor, Department of Education,Rajiv Gandhi University, Itanagar.

ARUNACHAL PRADESH DEVELOPMENT REPORT124
Enrolment
In Arunachal Pradesh, the educational infrastructure
continues to be inadequate, but its expansion over the
past three decades or so has been impressive. Children, as
a result, have better access to schooling today in
comparison with the past. Enrolment ratio in the age
group 6-11 has gone up from 31.9 to 38.1 per cent, while
in 11-14 age group it improved from 42.8 to 61.5 per cent
during 1981 to 1991 (Planning Commission, 2002). There
is, however, a considerable inter-district variation in the
GER in the State (Annexure Table A-6.10). Efforts have
been made to strengthen the educational set-up
particularly at the pre-primary and primary levels. The
educational institutions now accommodate nearly two
lakh students out of which 73.60 per cent are tribal. It
was found that initially the sex-ratio among students first
increased from 787 girls per 1000 boys at pre-primary
level to 830 girls at primary and 903 girls at middle
school levels and then declined fast at secondary and
tertiary levels dropping to only 222 girls per 1000 boys at
university level. Arunachal Pradesh has a higher gender
disparity index10 at all levels of schooling than that of
most of the north-eastern states. This disparity is even
more pronounced in higher education. At this stage, with
the sole exception of Tripura, Arunachal Prdaesh has a
higher gender disparity index than all other states of the
region. Thus, as pointed out earlier, greater emphasis has
to be given to expand access of the girls to higher
education.
Dropout Rates
Improvements in enrolment, however, do not
guarantee access to adequate levels of education. The
dropout rates in relatively underdeveloped regions are
very high. Dropout rates in classes I-V for children in
Arunachal Pradesh have come down substantially from
73.9 per cent in 1981-82 to 46.85 per cent in 2004-05
(Annexure Table A-6.11). It is still higher than the
national average, but there seems to be very little
improvement in reducing dropout rate at this stage in the
past few years. The dropout rate at this stage had already
reduced to 46.89 per cent in 1998-99. The dropout rate in
classes I-VIII for children, similarly, was reduced from
84.20 per cent in 1981-82 to 63.63 per cent in 2004-05.
Similarly the dropout rate for children in classes I-X has
been reduced from 90.70 per cent in 1981-82 to 70.79 per
cent in 2004-05. In this case, in classes I-X, girls in the
state have a higher dropout rate than boys. The dropout
rates for scheduled tribe students are higher than that of
all categories of students.
BOX 6.2
Infrastructure and Human Development
The crucial role of infrastructure in fostering economic
growth and enhancing public welfare has been widely
acknowledged by economists and planners. Adequate
development of infrastructure is considered to be a vital
prerequisite to accelerate the pace of development, which
in turn has its impact on human development.
Infrastructure services are typically characterised by high
upfront costs and long pay back periods and the lumpiness
of investment. The existence of externalities makes it
difficult for investors to recover investment and
operational costs. All these factors along with the
relatively weak private sector had created a consensus on
the necessity of heavy public investment in infrastructure
as a necessary ingredient of planned economic
development. Experiences in a number of developing
countries, however, show that there are limits to
infrastructure development through public investment and
a range of policy changes, broadly aiming at encouraging
private investment in the infrastructure sector are being
given increasing importance in recent policy measures.
In spite of the fact that significant development of
infrastructural facilities has taken place over the past
decades in Arunachal Pradesh, the State still lags behind
the national average in various components of
infrastructure. Wide rural-urban as well as inter-district
disparities exist in case of infrastructural facilities in
Arunachal Pradesh. The urban centres as well as the
administrative centres are much more developed
compared to other areas. Social infrastructure facilities in
the relatively remote districts are in a very dismal state.
Low population density and scatteredness of the villages
makes the cost of providing basic infrastructure facilities
too high.
While the levels of infrastructure development and the
divergence in the growth of different components of
infrastructure have important implications for
development of a State, the regional or spatial
distribution of infrastructure services also affects the
prospects for development. The regional disparities in the
provision of infrastructure development in Arunachal
Pradesh have accentuated regional disparities in socio-
economic development. Studies show that there exists
considerable inter-district disparity in infrastructural
facilities in Arunachal Pradesh. Hence, given the low
level of development in Arunachal Pradesh, there is an
urgent need to focus on development of infrastructural
facilities, particularly in the rural and remote areas, as
part of an overall strategy for fostering human
development in the state.
10. Gender parity index (GPI) is girls ‘GER divided by boys’ GER at a given level of education. GPI=1 indicates that there is no gender disparity at that level.

125Chapter 6 •
HUMAN DEVELOPMENT
Educational Infrastructure
Availability of educational infrastructure is an
important prerequisite for enhancing the scope of
education. There has been a steady expansion of
educational institutions in Arunachal Pradesh over the
past four decades at all levels. The schools at primary and
middle levels have increased more than 11 times and 23
times respectively, during the last 40 years but this
increase is sharper in case of secondary and higher
secondary schools. However, the number of pre-primary
and primary schools declined in 2000-01 as compared
with 1990-91, primarily because a number of primary
schools have been converted to middle schools. In 2004-
2005, there were one university, 11 colleges, 78 higher
secondary, 138 secondary, 495 middle, 1371 primary and
22 pre-primary schools in Arunachal Pradesh. An
independent survey by NGOs, called the Annual Status of
Education Report, 2007, has pointed out the need to
focus on the quality of education in the schools. Nearly 52
per cent of primary schools do not have access to potable
water, while 73 per cent of primary schools do not have
usable toilets. The survey points out that though the
State’s learning levels are above the national average,
there is a need to focus on school infrastructure as well as
learning outcomes at the primary level. The poor learning
skills among the children who are attending schools need
to be tackled seriously.11 The share of trained teachers in
Arunachal Pradesh, was 22 per cent at the primary level,
29 per cent at the middle school level, 49 per cent at the
high school and 66 per cent at the higher secondary level
in 2004-05. There has been significant growth of
educational opportunities in Arunachal Pradesh in the
post-Independence period, particularly since the 1980s,
but crucial gaps in institutional needs and availability still
remains. Closing of this gap demands a high priority.
Social Development
The role of the State in ensuring equality of
opportunity and dignity to all individuals has been widely
accepted. As a result of the struggle for greater overall
justice at various levels, social development concerns are
being increasingly made an integral part of various state-
sponsored development and welfare programmes. The
objectives of creating a just, democratic and prosperous
society will remain unfulfilled without ensuring equality
of opportunities for all the marginalised groups in the
society. However, there is a growing concern regarding
the systematic exclusion of certain sections of population
on grounds of ethnicity, caste, gender, religion, location
and affordability.12 Such exclusionary processes of
development may have grave consequences for the
economy and the society, not only through its impact on
equity and social justice, but also in terms of its impact
on the growth process as well. In the case of Arunachal
Pradesh, the implications are all the more severe, because
there has been an alarming rise in inequality in the past
few decades. In addition to that, there is the formidable
challenge of overcoming well entrenched traditional social
hierarchies.
The relative performance of Arunachal Pradesh, on
various dimensions of social development has not been
satisfactory, as pointed out in the discussions on the
previous section. Government expenditure on social sector
has remained at around 30 per cent of total government
spending for most of the years in the past decade
(Annexure Table A-6.4). In comparision with other small
states of India in general and north-eastern states in
particular, the social development scenario in Arunachal
Pradesh was, in fact, one of the worst (Annexure Table A-
6.13), although there has been some progress during
1991-2001 (Annexure Table A-6.14). According to a
recently released report, among the nine relatively small
states of India, Arunachal Pradesh, barring Meghalaya,
was at the bottom in terms of its performance on social
development (CSD, 2006).
As it has already been mentioned, people in Arunachal
Pradesh face additional constraints because of the relative
backwardness of the State itself. However, various
schemes initiated by the Government of India for helping
the disadvantaged group as well as women’s
empowerment are being employed by various departments
and agencies in the state (Box 6.3). There is a need for
greater accountability and transparency in implementation
of these programmes.13 The role of civil society
institutions and community-based organisations in making
these programmes responsive to the local needs can
hardly be overstressed.
11. The Annual Status of Primary Education (ASER) 2007, for example, points out that only 47 per cent of standard III children can read a standard II leveltext. This ability increases with standard but only 52.5 per cent of standard V children can read standard II level text.
12. As the Indian economy is gradually moving towards market, there is an apprehension that those who cannot pay the right price for certain essential goodsand services, like quality health care and education, for example, would be excluded from having access to them.
13. Ineffective governance not only reduces the efficiency of development intervention, more importantly, it creates and sustains a set of institutions orinstitutional constraints that prohibits the scope of democratic and inclusive growth. Mishra and Upadhyay (2007) note that governance failures havespecific adverse outcomes for the marginalised, including the poor.

ARUNACHAL PRADESH DEVELOPMENT REPORT126
BOX 6.3
Schemes for the Welfare of Women and Children
Various schemes have been launched by the Government of Arunachal Pradesh, with assistance from the Government of
India for the welfare of women and children. The outlines of some of these schemes are as below.14
Reservation for Women in Panchayat Bodies
In order to ensure participation of women in the political process, 33 per cent seats in the three tier Panchayat Raj System
has been reserved for women in the state. The Panchayat elections held in April 2003, has opened up a new chapter in the
political history of the State. In total 3,183 ST women have been elected to different Panchayat bodies. Their exposure at the
grassroots level is expected to encourage women to participate more actively in the political arena in the State.
Integrated Women’s Empowerment Programme (IWEP)
The vision of the IWEP, which was created by recasting the Indira Mahila Yojana (IMY), was basically meant to develop
empowered women who would demand their rights from family, community and government; have greater access and control
over material, social and political resources; as well as enhance awareness and improved skills and raise issues of common
concerns through mobilisation and networking. The immediate objectives of the programme was to establish self-reliant
women’s Self Help Groups (SHGs) which would create confidence and awareness among members of SHGs regarding
women’s status, health, nutrition, education, sanitation and hygiene, legal rights, economic upliftment and other social,
economic and political issues; and further help in strengthening and institutionalising the savings habit in rural women
and their control over economic resources by improving access of women to microcredit and by involvement of women in
local level planning.
Swayamsidha
Under the IMY only one ICDS project was launched in Tezu-Namsai in Lohit district in 1995-96 and 62 SHGs have been
promoted. The following numbers of SHGs were formed during 2002-03 under Swayamsidha: Sagalee in Papum Pare district
(76), Roing in Dibang Valley district (67), Buragaon in West Kameng district (53) and Tezu in Lohit district (62). In total
102 SHGs were operating in the State during 2001-02. From 1995-96 to 2002-03 the Government of India under this scheme
released a total amount of Rs. 20,31,000. Out of the sanctioned amount only Rs. 6,11,56 has been spent so far. Thus, around
70 per cent of the fund released by the Central government has remained unspent.
Kishori Shakti Yojana
Kishori Shakti Yojana is part of ICDS programme with an intention to improve the condition of adolescent girls in the age
group of 11-18 years in the field of health, nutrition, education, family welfare, self awareness, etc. So far two ICDS Projects
in the State have been selected for implementation of this programme.
Health Facilities for Women
The Family Welfare Branch of the Directorate of Health Services, Government of Arunachal Pradesh is implementing the
reproductive and child health programme (RCH), which is a 100 per cent centrally sponsored scheme. The major focus in
this programme is delivery of need-based, client-centred, good quality, and comprehensive reproductive and child health
services to all beneficiaries in an integrated manner. Although the Government of India formally launched the RCH
programme in October 1997, its implementation in the State effectively began in 1999-2000. The major schemes under the
RCH programme intended specifically for improving the health status of the women and children by Safe Motherhood
Scheme, 24-Hour Delivery Services, RCH Camps and Out-Reach Services, Vande Mataram, National Maternity Benefit
Scheme, and Pre-Natal Diagnostic Techniques Act.
Beneficiaries of Rural Development Schemes
The various rural development schemes undertaken by the Government of Arunachal Pradesh cover many women
beneficiaries. All these schemes are exclusively for Arunachal Pradesh Scheduled Tribes (APST). However, the percentage
of women beneficiaries of many of the programmes are far from satisfactory. For example, in 2001-02, only 25.1 per cent
of the beneficiaries in Swarnjayanti Gram Swarozgar Yojana (SGSY) were women, whereas under the scheme 40 per cent
should have been reserved for women. Under Sampoorna Gramin Rozgar Yojana (SGRY), out of the 18.39 lakh man-days
claimed to be created in the year 2001-02, 29.20 per cent were for women. Similarly, of the 3118 houses constructed under
the Indira Awas Yojana, 1340 were for women beneficiaries and 935 were jointly held in the name of both the spouses.
Encouragement to Entrepreneurs
In order to help entrepreneurs the following steps have been taken by the Government of Arunachal Pradesh under the
Prime Minister’s Rozgar Yogana (PMRY) scheme. People have been given assistance to start their own business. So far 390
contd...
127Chapter 6 •
HUMAN DEVELOPMENT
women have been assisted and provided self-employment during the past five years. In this scheme 25 per cent of the seats
have been reserved for female candidates. The Department of Industries in collaboration with various other institutions
has been organising Entrepreneurship Development Programmes and Industrial Management Trainings, in which women
have been given preference for participation.
Schemes for Education
The government is attempting to increase the literacy rates through various measures including the Sarva Siksha Abhiyan
(SSA). It is noteworthy, that at present girls are 44 per cent of the total enrolments in the State. Certain special incentives
are provided to girl students like, free textbooks from class I to XII, stipend in lieu of ration for hostel boarders for ten
and a half months in a year, special incentives of Rs. 5000 per girl to discourage early marriage till completion of class
X, cooked mid-day meals for all children from class I to V and girl students who are one time repeater in a class are allowed
hostel boarders stipend to avoid dropout and encourage them for continuation of their studies.
Balika Samriddhi Yojana (BSY)
The Balika Samriddhi Yojana (BSY) a 100 per cent centrally sponsored scheme is also being implemented in the State. The
main objectives of the programme is to change negative family and community attitudes towards the girl child at birth and
towards her mother, to improve enrolment and retention of girl child in schools, to raise the age of marriage for girls and
to assist the girl to undertake income generating activities. In 2001-02, 1687 girls had been covered under the scheme.
The BSY covers girl children in families below the poverty line, both in rural and urban areas.
Source: Upadhyay and Mishra, 2005.
...contd...
Conclusions
Human development requires interventions at multiple
levels by a number of agencies, including the state,
community and individuals. However, given the ground
realities of Arunachal Pradesh, the State’s commitment
towards providing sustainable, affordable, reliable and
equitable access to earnings, employment, education,
health care and other social security, would be the most
critical determinant of the human development scenario.
Special needs programmes, like those for the women,
children, aged, disabled and other marginalised groups,
have to be made more responsive to the specific needs of
the State. There is a need to specifically target the
relatively backward districts and groups. Apart from
expanding and consolidating the gains in healthcare
services, there is a need to focus on the programmes
targeted at improving maternal and child health,
particularly in rural areas and relatively in accessible parts
of the State. In terms of educational opportunities,
specific programmes to improve the retention rates of
girls in higher school level and beyond, needs to be given
emphasis. The gender gap in literacy in rural Arunachal
Pradesh, which has remained stagnant, needs to be
brought down. The other area of concern in the education
field is quality of education. The greatest challenge in
financing these programmes, notwithstanding the support
of the Central government, would be to mobilise
resources from within the State. The state government
has to take pragmatic and effective steps to design local
solutions, which could respond to the specificities of
spatial and ecological variations across the State. At the
same time, unless the civil society in general and the
intelligentsia in particular, comes out in support of the
need to view development of the State together with the
human development in a holistic framework, it would be
difficult to achieve the goals of a just and equitable social
order.
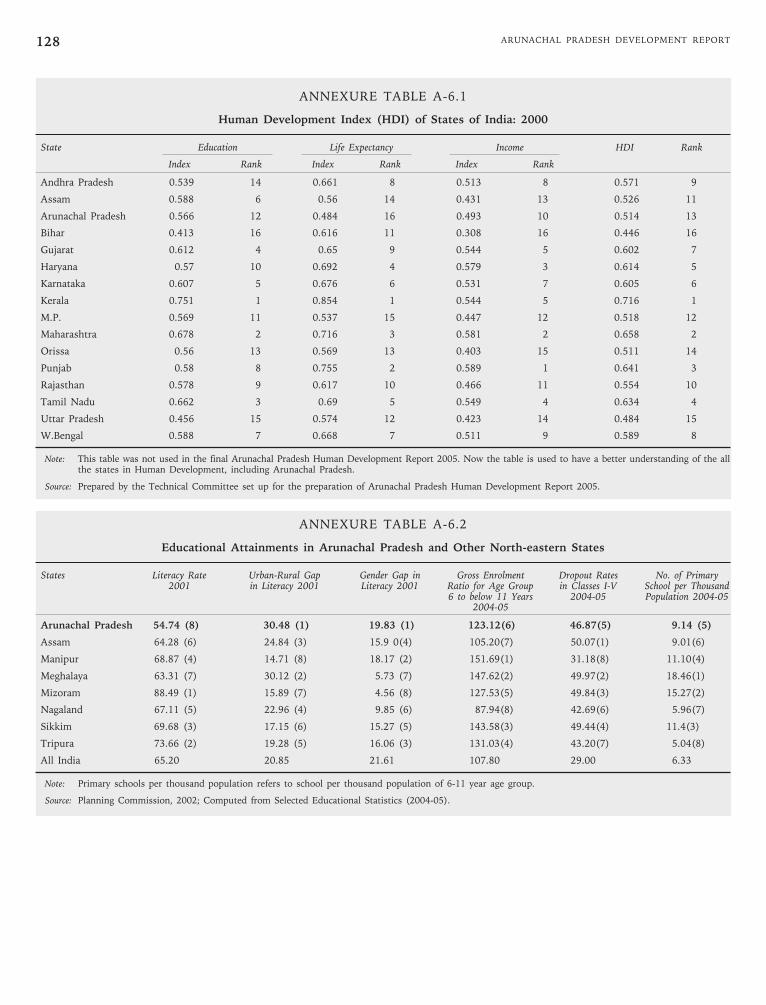
ARUNACHAL PRADESH DEVELOPMENT REPORT128
ANNEXURE TABLE A-6.1
Human Development Index (HDI) of States of India: 2000
State Education Life Expectancy Income HDI Rank
Index Rank Index Rank Index Rank
Andhra Pradesh 0.539 14 0.661 8 0.513 8 0.571 9
Assam 0.588 6 0.56 14 0.431 13 0.526 11
Arunachal Pradesh 0.566 12 0.484 16 0.493 10 0.514 13
Bihar 0.413 16 0.616 11 0.308 16 0.446 16
Gujarat 0.612 4 0.65 9 0.544 5 0.602 7
Haryana 0.57 10 0.692 4 0.579 3 0.614 5
Karnataka 0.607 5 0.676 6 0.531 7 0.605 6
Kerala 0.751 1 0.854 1 0.544 5 0.716 1
M.P. 0.569 11 0.537 15 0.447 12 0.518 12
Maharashtra 0.678 2 0.716 3 0.581 2 0.658 2
Orissa 0.56 13 0.569 13 0.403 15 0.511 14
Punjab 0.58 8 0.755 2 0.589 1 0.641 3
Rajasthan 0.578 9 0.617 10 0.466 11 0.554 10
Tamil Nadu 0.662 3 0.69 5 0.549 4 0.634 4
Uttar Pradesh 0.456 15 0.574 12 0.423 14 0.484 15
W.Bengal 0.588 7 0.668 7 0.511 9 0.589 8
Note: This table was not used in the final Arunachal Pradesh Human Development Report 2005. Now the table is used to have a better understanding of the allthe states in Human Development, including Arunachal Pradesh.
Source: Prepared by the Technical Committee set up for the preparation of Arunachal Pradesh Human Development Report 2005.
ANNEXURE TABLE A-6.2
Educational Attainments in Arunachal Pradesh and Other North-eastern States
States Literacy Rate Urban-Rural Gap Gender Gap in Gross Enrolment Dropout Rates No. of Primary2001 in Literacy 2001 Literacy 2001 Ratio for Age Group in Classes I-V School per Thousand
6 to below 11 Years 2004-05 Population 2004-052004-05
Arunachal Pradesh 54.74 (8) 30.48 (1) 19.83 (1) 123.12(6) 46.87(5) 9.14 (5)
Assam 64.28 (6) 24.84 (3) 15.9 0(4) 105.20(7) 50.07(1) 9.01(6)
Manipur 68.87 (4) 14.71 (8) 18.17 (2) 151.69(1) 31.18(8) 11.10(4)
Meghalaya 63.31 (7) 30.12 (2) 5.73 (7) 147.62(2) 49.97(2) 18.46(1)
Mizoram 88.49 (1) 15.89 (7) 4.56 (8) 127.53(5) 49.84(3) 15.27(2)
Nagaland 67.11 (5) 22.96 (4) 9.85 (6) 87.94(8) 42.69(6) 5.96(7)
Sikkim 69.68 (3) 17.15 (6) 15.27 (5) 143.58(3) 49.44(4) 11.4(3)
Tripura 73.66 (2) 19.28 (5) 16.06 (3) 131.03(4) 43.20(7) 5.04(8)
All India 65.20 20.85 21.61 107.80 29.00 6.33
Note: Primary schools per thousand population refers to school per thousand population of 6-11 year age group.
Source: Planning Commission, 2002; Computed from Selected Educational Statistics (2004-05).
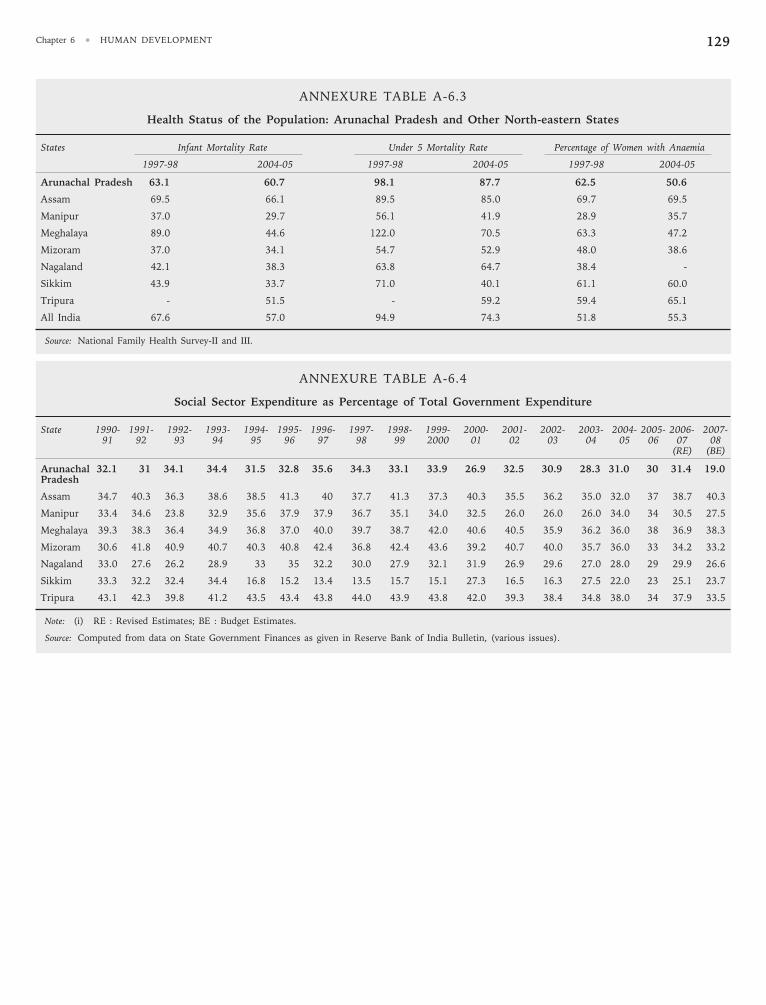
129Chapter 6 •
HUMAN DEVELOPMENT
ANNEXURE TABLE A-6.3
Health Status of the Population: Arunachal Pradesh and Other North-eastern States
States Infant Mortality Rate Under 5 Mortality Rate Percentage of Women with Anaemia
1997-98 2004-05 1997-98 2004-05 1997-98 2004-05
Arunachal Pradesh 63.1 60.7 98.1 87.7 62.5 50.6
Assam 69.5 66.1 89.5 85.0 69.7 69.5
Manipur 37.0 29.7 56.1 41.9 28.9 35.7
Meghalaya 89.0 44.6 122.0 70.5 63.3 47.2
Mizoram 37.0 34.1 54.7 52.9 48.0 38.6
Nagaland 42.1 38.3 63.8 64.7 38.4 -
Sikkim 43.9 33.7 71.0 40.1 61.1 60.0
Tripura - 51.5 - 59.2 59.4 65.1
All India 67.6 57.0 94.9 74.3 51.8 55.3
Source: National Family Health Survey-II and III.
ANNEXURE TABLE A-6.4
Social Sector Expenditure as Percentage of Total Government Expenditure
State 1990- 1991- 1992- 1993- 1994- 1995- 1996- 1997- 1998- 1999- 2000- 2001- 2002- 2003- 2004- 2005- 2006- 2007-91 92 93 94 95 96 97 98 99 2000 01 02 03 04 05 06 07 08
(RE) (BE)
Arunachal 32.1 31 34.1 34.4 31.5 32.8 35.6 34.3 33.1 33.9 26.9 32.5 30.9 28.3 31.0 30 31.4 19.0Pradesh
Assam 34.7 40.3 36.3 38.6 38.5 41.3 40 37.7 41.3 37.3 40.3 35.5 36.2 35.0 32.0 37 38.7 40.3
Manipur 33.4 34.6 23.8 32.9 35.6 37.9 37.9 36.7 35.1 34.0 32.5 26.0 26.0 26.0 34.0 34 30.5 27.5
Meghalaya 39.3 38.3 36.4 34.9 36.8 37.0 40.0 39.7 38.7 42.0 40.6 40.5 35.9 36.2 36.0 38 36.9 38.3
Mizoram 30.6 41.8 40.9 40.7 40.3 40.8 42.4 36.8 42.4 43.6 39.2 40.7 40.0 35.7 36.0 33 34.2 33.2
Nagaland 33.0 27.6 26.2 28.9 33 35 32.2 30.0 27.9 32.1 31.9 26.9 29.6 27.0 28.0 29 29.9 26.6
Sikkim 33.3 32.2 32.4 34.4 16.8 15.2 13.4 13.5 15.7 15.1 27.3 16.5 16.3 27.5 22.0 23 25.1 23.7
Tripura 43.1 42.3 39.8 41.2 43.5 43.4 43.8 44.0 43.9 43.8 42.0 39.3 38.4 34.8 38.0 34 37.9 33.5
Note: (i) RE : Revised Estimates; BE : Budget Estimates.
Source: Computed from data on State Government Finances as given in Reserve Bank of India Bulletin, (various issues).

ARUNACHAL PRADESH DEVELOPMENT REPORT130
ANNEXURE TABLE A-6.5
Life Expectancy in Different States of India: 2000 (Adjusted)
State Life Expectancy Life Expectancy Index
Male Female Persons Male Female Persons
Andhra Pradesh 62.58 66.53 64.66 0.668 0.650 0.661
Assam 57.74 59.77 58.61 0.587 0.538 0.560
Arunachal Pradesh 53.66 54.51 54.05 0.519 0.450 0.484
Bihar 61.96 61.46 61.94 0.658 0.566 0.616
Gujarat 62.27 66.00 64.03 0.663 0.642 0.650
Haryana 65.26 67.90 66.53 0.713 0.673 0.692
Karnataka 62.89 68.11 65.59 0.673 0.677 0.676
Kerala 72.26 80.05 76.23 0.829 0.876 0.854
Madhya Pradesh 56.71 57.76 57.25 0.570 0.504 0.537
Maharashtra 65.67 69.91 67.99 0.719 0.707 0.716
Orissa 58.57 59.77 59.17 0.601 0.538 0.569
Punjab 68.34 72.44 70.29 0.764 0.749 0.755
Rajasthan 60.32 62.94 62.05 0.630 0.591 0.617
Tamil Nadu 64.64 68.43 66.43 0.702 0.682 0.690
Uttar Pradesh 59.39 59.56 59.47 0.615 0.534 0.574
West Bengal 63.61 66.64 65.07 0.685 0.652 0.668
All India 61.86 64.84 63.30 0.656 0.622 0.638
Source: Data of life expectancy of all the states except Arunachal Pradesh relating to the period 1992-1996 are taken from National Human Development Report2001 and adjusted for the year 2000. Arunachal Pradesh’s expectancy of life is taken from Human Development Report of Arunachal Pradesh 2005.
ANNEXURE TABLE A-6.6
Growth of Health Services in Arunachal Pradeshand in the Country
Year Hospital Beds per 10,000 Doctors per 10,000Population Population
Arunachal Pradesh India Arunachal Pradesh India
1950-51 - 3.2 1.6 1.7
1960-61 11.0 5.7 2.1 1.9
1970-71 25.4 6.4 3.3 2.8
1980-81 23.3 8.3 4.1 3.9
1990-91 26.4 9.5 3.1 4.7
1991-92 25.5 9.7 3.1 4.8
1995-96 - 9.4* - 5.1p
1997-98 - 9.3* - 5.3p
2000-01 20.3 - 4.3 -
Note: Dash means data not available. '*' means the figure is provisional.
Source: Economic Survey, 2002-03, Government of India. Statistical Abstractsof Arunachal Pradesh, Government of Arunachal Pradesh.
ANNEXURE TABLE A-6.7
Rural Urban Distribution of Allopathic MedicalInstitutions in Arunachal Pradesh, 2001
No. of Medical Institutions Rural Urban Total
General Hospital — 3 (100) 3
District Hospital 2 11 13(15.38) (84.62)
Dispensaries — 18 18(100)
Community Health Centre (CHC) 8 19 27(29.63) (70.37)
Primary Health Centre (PHC) 25 42 67(37.31) (62.69)
Health Sub Centre 350 — 350(100.00)
Others 48 8 56(85.71) (14.29)
Note: Figures in the parentheses indicate percentage to total.
Source: Statistical Abstract of Arunachal Pradesh, 2001.

131Chapter 6 •
HUMAN DEVELOPMENT
ANNEXURE TABLE A-6.8
Literacy Rate in Districts of Arunachal Pradesh: 1991(Percentage)
Districts All Areas Rural Urban
M F All M F All M F All
Tawang 40.41 16.83 29.80 40.41 16.83 29.80 - - -
West Kameng 55.03 35.22 46.31 52.43 32.42 43.56 76.10 60.79 69.75
East Kameng 37.69 14.02 26.20 37.69 14.02 26.20 - - -
Lower Sunbansiri 51.10 30.70 41.57 41.40 21.68 31.95 77.02 59.74 69.54
Upper Subansiri 47.58 27.24 38.31 47.58 27.24 38.31 - - -
West Siang 53.86 35.85 45.64 47.83 31.50 40.14 81.78 65.63 75.70
East Siang 52.49 34.43 44.30 48.72 30.56 40.35 71.71 58.49 66.26
Dibang Valley 56.94 33.27 46.88 51.79 27.06 41.10 80.31 66.71 75.00
Lohit 59.02 36.21 49.21 53.33 29.96 42.98 77.10 61.42 71.06
Changlang 54.44 29.64 43.20 54.44 29.64 43.20 - - -
Tirap 43.44 18.52 32.06 38.15 13.59 26.76 89.83 78.40 85.43
Arunachal Pradesh 51.45 29.69 41.59 47.00 25.31 37.02 77.99 62.23 71.59
Source: Censuses of India, Arunachal Pradesh, 1981 and 1991, Age, Sex and Level of Education, Table C-2, Directorate of Censuses Operations, ArunachalPradesh.
ANNEXURE TABLE A-6.9
Gender Gap in Literacy: Arunachal Pradesh and North-eastern States 1981-2001
States 1981 1991 2001
Total Rural Urban Total Rural Urban Total Rural Urban
Arunachal Pradesh 21.1 20.23 18.48 18.73 21.69 15.76 20.30 20.80 15.70
Assam - - - 18.84 19.47 11.17 15.19 16.77 8.85
Manipur 29.48 29.33 29.07 24.03 24.38 23.44 18.17 18.62 17.31
Meghalaya 9.48 8.59 10.81 8.27 7.71 8.40 5.73 5.88 5.60
Mizoram 10.75 11.97 6.4 7.01 10.33 3.54 4.56 8.21 1.28
Nagaland 18.20 18.20 9.7 12.87 13.06 6.84 9.85 9.86 6.92
Sikkim 25.62 26.49 15.37 19.05 19.51 10.25 15.27 16.06 8.42
Tripura 23.48 24.74 14.32 20.93 22.74 12.07 16.06 17.84 8.15
All India 26.62 27.89 - 24.84 27.25 - 21.50 24.60 13.43
Note: (i) Census not held in Assam in 1981.
(ii) Literacy rate is defined as the proportion of literates to the population in the age group 7+.
(iii) Gender gap in literacy is defined as male literacy rate minus female literacy rate.
Source: 1981- Census of India, Social and Cultural Tables; 1991- Paper 2 of 1991, Series1, Census of India 1991; 2001—Primary Census 2001 estimates.Calculations based on NHDR, 2001; Tables 4.1-4.3.

ARUNACHAL PRADESH DEVELOPMENT REPORT132
ANNEXURE TABLE A-6.10
Gross Enrolment Ratio (2000-01)
Districts Primary Rank Upper Primary Rank
Tawang 98.50 8 54.38 11
West Kameng 92.62 9 46.14 13
East Kameng 110.58 6 81.64 6
Papum Pare 123.07 4 100.01 3
Lower Subansiri 180.11 1 95.48 4
Upper Subansiri 131.53 3 73.20 8
West Siang 141.67 2 143.85 1
East Siang 120.64 5 120.54 2
Upper Siang 109.13 7 82.07 5
Dibang Valley 80.72 10 78.15 7
Lohit 62.41 13 53.62 12
Changlang 64.88 12 54.92 10
Tirap 74.47 11 66.50 9
Arunachal Pradesh 104.66 79.05
All India 95.66 58.64
Note: For Arunachal Pradesh ratios are estimated.
Source: GoAP, 2006.
ANNEXURE TABLE A-6.11
Dropout Rates in Arunachal Pradesh and India: 2004-05
State Category Class I-V Class I-VIII Class I-X
Boys Girls Total Boys Girls Total Boys Girls Total
Arunachal Pradesh All 45.86 48.01 46.85 63.23 61.90 62.63 69.59 72.30 70.79
ST 47.91 47.74 47.83 68.03 66.58 67.37 73.38 74.89 74.05
India All 31.81 25.42 29.00 50.49 51.28 50.84 60.41 63.88 61.92
ST 42.55 42.04 42.32 64.97 67.09 65.87 77.75 80.66 78.89
Source: Selected Educational Statistics 2004-05, Ministry of Human Resource Development, Government of India.

133Chapter 6 •
HUMAN DEVELOPMENT
ANNEXURE TABLE A-6.12
Gender Parity Index in Enrolment: 2004-05
States Category Gender Parity Index
Class I-V Class VI-VIII Class I-VIII Class IX-XII Class I-XII Higher Education
Arunachal Pradesh All 0.89 0.85 0.88 0.82 0.87 0.63
ST 0.89 0.87 0.88 0.87 0.87 0.58
Assam All 0.99 0.93 0.98 0.79 0.95 0.70
ST 1.05 0.91 1.00 0.68 0.93 0.74
Manipur All 0.96 0.94 0.96 0.93 0.95 0.79
ST 0.92 0.92 0.92 0.87 0.91 0.78
Meghalaya All 1.03 1.12 1.05 1.04 1.05 0.83
ST 1.03 1.16 1.06 0.98 1.05 0.92
Mizoram All 0.93 0.99 0.95 1.02 0.96 0.61
ST 0.93 0.99 0.95 1.02 0.96 0.85
Nagaland All 0.98 1.00 0.99 0.98 0.99 0.89
ST 0.98 0.99 0.98 0.97 0.98 0.80
Sikkim All 0.99 1.17 1.04 1.01 1.03 0.75
ST 1.00 1.21 1.05 1.14 1.06 1.11
Tripura All 0.96 0.94 0.95 0.88 0.94 0.72
ST 0.90 0.85 0.89 0.76 0.88 0.47
India All 0.95 0.88 0.93 0.79 0.91 0.71
ST 0.90 0.81 0.88 0.67 0.86 0.55
Note: Gender Parity Index (GPI) is girls' GER divided by boys' GER at a given level of education. GPI=1 indicates that there is no gender disparity at that level.
Source: Selected Educational Statistics 2004-05, Ministry of Human Resource Development, Government of India.
ANNEXURE TABLE A-6.13
Index of Social Development among Small States: 1991
States Demography Health Care Basic Amenities Education Unemployment Social Aggregate Index Rankingand Poverty Deprivation of Social
Development
Arunachal Pradesh 12.48 24.16 35.43 1.51 20.23 55.91 24.97 9
Delhi 37.75 35.45 93.02 66.29 43.95 28.80 50.88 3
Goa 66.81 76.76 53.69 68.66 39.37 32.45 56.29 2
Manipur 40.00 52.69 24.45 60.18 45.13 49.59 45.35 5
Meghalaya 11.50 19.53 8.73 12.08 40.54 57.67 25.01 8
Mizoram 50.07 76.55 42.79 74.27 71.50 59.03 62.37 1
Nagaland 41.52 47.54 28.87 61.11 38.79 65.18 47.17 4
Sikkim 27.41 34.68 41.24 63.17 39.80 39.95 41.04 6
Tripura 50.65 15.28 33.35 37.22 15.31 34.00 30.97 7
Note: For details of methodology see CSD, 2006.
Source: Council for Social Development, 2006.

ARUNACHAL PRADESH DEVELOPMENT REPORT134
ANNEXURE TABLE A-6.14
Index of Social Development among Small States: 2001
States Demography Health Care Basic Amenities Education Unemployment Social Aggregate Index Rankingand Poverty Deprivation of Social
Development
Arunachal Pradesh 36.26 47.39 30.24 4.81 37.62 58.79 35.85 8
Delhi 66.88 40.52 92.35 59.37 24.63 32.58 52.72 3
Goa 85.02 72.92 62.38 87.37 41.81 44.25 65.63 1
Manipur 55.56 39.94 29.58 61.13 32.48 46.89 44.26 5
Meghalaya 0.0 9.11 5.78 11.03 65.25 53.67 24.14 9
Mizoram 74.25 54.15 51.77 79.21 38.20 54.65 58.71 2
Nagaland 22.12 35.94 29.95 49.68 41.37 56.04 39.18 7
Sikkim 46.00 62.33 48.39 64.39 25.33 45.56 48.66 4
Tripura 66.51 21.03 27.19 52.92 32.79 56.89 42.89 6
Note: For details of methodology see CSD, 2006.
Source: Council for Social Development, 2006.
Mineral Resources
Arunachal Pradesh has a large number of metallic and
non-metallic mineral occurrences, most of which are not
being exploited at present, either because of lack of
detailed information, or not being economically viable for
extraction. The available information regarding mineral
resources in the State has been summarised in Table 7.1.
Various minerals which can be exploited are as
follows:
(i) Coal: It occurs at two stratigraphic levels under
different tectonic setting, one is tertiary in age and
the other is Gondwana. Unlike the Peninsular
counterpart, the resources of coal in Arunachal
Pradesh are insignificant in the Gondwana
Formations whereas sizeable resources occur in
the tertiary coal measure of Tirap district.
The bulk of coal is located in the Namchik-
Namphuk area in Changlang district spread over
an area of 35.5 sq km, which is supposed to be
the eastern extension of the adjacent Makum
coalfield. MECL (1984), CMPDIL (1991) and
Laskar (1983) show that the coal seams here
extend over a strike length of 11 km along the
northern flanks of Kuwenbum hill. The
exploration drilling in Namchik-Namphuk area has
proved the occurrence of 8 persistent coal seams
varying in thickness from 1 to 17.4 m. These
seams frequently thicken and thin out both along
the dip and strike. Of these seams, Seam No. 3 is
the most persistent in thickness varying from 2.4
to 17.4 m with average thickness being in the
order of about 13 m, and Seam No. 4 ranges in
thickness from 1.6 to 3.9 m. The Geological
Survey of India estimates a proven reserve of 91
ARUN
ACH
AL PR
ADESH
million tonnes. The estimated reserve, however, as
per CMPDIL (1991) is 84.23 million tonnes.
The chemical analysis by the Central Fuel
Research Institute shows that the moisture
content in coal varies from 1.7 to 3.6 per cent and
the ash content from -4 to 16 per cent. The
volatile content is usually between 40 to 45 per
cent. The coal is medium to strongly coking in
nature; coking indices range from 17 to 29. The
sulphur content varies widely from seam to seam
and ranges from 1 to 6 per cent.
In addition, tertiary coal is also available in the
form of lenses, peats and lignites all along the
foothills belt in Siwalik belt. This Siwalik coal
varies between lignite to high volatile bituminous
rank and shows high reflectance values near the
tectonic features such as thrusts/faults (Prakash
and Singh, 2000).
The Gondwana coal is available at certain places
only and can be utilised locally for domestic
purposes. Such Gondwana coal is available in
West Kameng, East Kameng, Lower Subansiri,
West Siang and a few other places.
However, the major workable coal resource is
confined to Namchik-Namphuk only. Lack of good
communication and the remoteness of this place
from the nearest rail are the major constraints to
the development of this coalfield. However, the
development of this coalfield should be viewed in
supplement of the Makum coalfield, where its
reserves are steadily decreasing. The coal of
Namchik-Namphuk is suitable for manufacture of
synthetic petroleum, and can be used in low
temperature carbonisation plants and power
generation.
Chapter 7
Natural Resources and
Sustainable Development

ARUNACHAL PRADESH DEVELOPMENT REPORT136
(ii) Oil and Natural Gas: It is available in Changlang
district, particularly in Kumchai, Diyun and
Kharsang area. Of these, the Kharsang oilfield is
supposed to be the continuation of the Digboi
oilfield.
Oil was discovered in 1976 at Kharsang. The
estimated reserve is about 12.14 million tonnes
with an estimated recoverable reserve of about
1.82 million tonnes. More than 13 exploratory
wells have been completed and exploratory works
have also been started in Monabum and Kumchai
oilfields.
(iii) Limestone and Dolomite: Limestone and dolomite are
found in Lohit, Dibang Valley, East Siang, Upper
Subansiri, and West Kameng. Estimated reserves
are 140.0 million tonnes in Lohit, 13.35 million
tonnes in Dibang Valley, 225.0 million tonnes in
East Siang, 0.70 million tonnes in Upper Subansiri
and 11.13 million tonnes in West Kameng. The
chemical composition of the limestone and
dolomite at these places is given in Table 7.2.
(iv) Graphite: It is associated with the mica schist and
sericite quarzite, and occurs in the form of thin
bands and lensoid bodies particularly in the rocks
of Bomdila and Se La groups. About 50 m thick
band of graphite is located near Did village on
Joram-Palin road and near Bopi on Tamen-Raga-
Daporijo road in Lower Subansiri district. Other
than these, some scanty deposits have also been
observed near Abdullah Nala on Kimin-Ziro road,
and a 70 m thick band of graphite schist
containing flaky graphite has been located near
Taliha in Upper Subansiri; and on Roing-Hunli
road in Dibang Valley, and near Lalpani-Tidding in
Lohit district. Graphite reserve has been estimated
to 2.46 million tonnes at Bopi, 0.50 million tonnes
in Khetabari, 0.30 million tonnes near Taliha and
71.0 million tonnes in Lalpani.
(v) Lead and Zinc: Some lead and zinc occurrences are
reported from Shergaon area in West Kameng. The
reserves are yet to be estimated in the area,
however, a 20 m thick zone having 3-5 per cent
lead and zinc content has been inferred by the GSI
near Amritganga (vide Chaudhari, 2002).
(vi) Ferro-silicon Minerals: The ferro-silicon grade
quartzite deposit is located in Kalaktang area of
West Kameng district with an estimated reserve of
1.13 million tonnes with 98.26 per cent of SiO2;
and 1.12 million tonnes with 97.15 per cent of SiO2.
(vii) Clay: Small pockets of clay having moderate to
good plasticity are associated with Siwalik
sandstone, exposed in the foothill belt bordering
the Brahmaputra flood plain. A small reserve of
80,000 tonnes has been estimated in East Kameng.
The economic viability of the clay is yet to be
ascertained, however, it may be suitable for use as
pozzolanic material.
(viii) Other Economic Minerals: In addition, a number of
other economic minerals such as gold, cobalt,
nickel, copper, magnetite-hematite (iron ore) and
other platinoid group of metals, occur in the State.
Although some scanty reports are available, a
thorough investigation is necessary for their
economic viability. Other potential resources in
Arunachal Pradesh include mineral water and hot
sulphurous springs.
TABLE 7.1
Minerals and their Locations in the State
Geographical Location
Minerals District Location Est. Reserve Quality Parameters Associated Industry Activity(million tonne)
Coal West Kameng Elephant Flat NA Gondwana Coal Mining and Trading, CoalEast Kameng Khuppi NA -do- Bracket, Thermal PowerLower Subansiri Lichi NA -do- Generation.West Siang Garu-Gensi-Siberette belt NA -do-Changlang Namchik-Nampuk 84.23 Tertiary Coal of
(90.23 as Lignite Bituminousper GSI) rank. Low Ash
contents (4-16%),High Sulphur (1-6%),High Volatile (30-49%)
Crude Oil Changlang Kunchai NA Mining and Trading,and Natural Diyun NA Refinery and associatedGas Kharsang NA Chemicals.
contd...

137Chapter 7 • NATURAL RESOURCES AND SUSTAINABLE DEVELOPMENT
contd...
Geographical Location
Minerals District Location Est. Reserve Quality Parameters Associated Industry Activity(million tonne)
Dolomite West Kameng Rupa 143.0 CaO – (30.06-39.32%) Mining and Trading. Also(243 as MgO (13.30-28.41%) utilised in Blast Furnace,per GSI) refractory Steel making
Jamiri (Dedza) 11.13 High grade quality with Paper, and ChemicalCaO – 31.75%; MgO – 18.24% Industry.
Limestone Upper Subansiri Taliha NA NA Mining and Trading.Menga 0.70 CaO – 29.63%; MgO – 19.42% Cement and ChemicalsYazuli NA NA industries as Flux
West Siang Dali NA NA Material.East Siang Pangin 225.0 CaO – 46.32%; MgO – 2.42%Lohit Tidding 140.0 CaO – 50.68%; MgO – 0.53%Dibang Valley Hunli 13.35 CaO – 50.5%; MgO – 1.5%
Graphite Lower Subansiri Khetabari 0.50 Mining and Trading,Upper Subansiri Did and Bopi 2.46 Pencil making, Industrial
Laa and Lamdak use.Taliha 0.30
West Siang TaiDibang Valley HunliLohit Lalpani
Lead and Zinc West Kameng Shergaon NA 5 km of strike length andaverage 70 m thick.
Amritganga NA 20 m thick zone.
Ferro-silicon West Kameng Kalaktang 1.25 Three Quartzite bands. Best utilised as RefractoryHigh silica (95.5-98.3 %) Material.and low Alumina (<0.9 -<2.2 %).
Gold Lower Subansiri In river sand at NA 50 ppb to 2.6 ppmthe rivers mouth
Base Metal Lower Subansiri Potin-Yazuli NA Cobalt – 2.2%, nickelSulphides – 0.11-0.51%, Copper
– 0.33%.Upper Subansiri Near Taliha NA NA
Platinoid group Lohit Tidding NA Pt 6-28 ppb, Pd 6-14of Metals ppb, Rh <2-10 ppb,
and Ir 2-14 ppb.
Mineral Water/ West Kameng Dirang, Bishum and Balu NA 41-42° CHot Springs
Upper Subansiri Kamla Valley and NA 30-49° C. Characterised by highTakshing, Maja, Chetu Li/Na, B/Cl and low Ca/Na ratio.and Tige Temp. at Takshing, Chetu and
Maja is 51.7°C, 37.8°C, and37.8°C, respectively
Lohit Parusram Kund NA
Source: Chaudhari (2002), De (2002), Kumar and Singh (1996), and Directorate of Geology and Mining, Government of Arunachal Pradesh.
TABLE 7.2
Chemical Composition of the Limestone at Different Places
Contents Tidding Hunli Pangin Menga Jamiri Rupa
CaO 50.68 50.5 46.32 29.63 32.67 31.75
MgO 0.53 1.5 2.422 19.42 18.76 18.24
SiO2
5.48 1.15 2.42 1.14 1.09
Al2O
31.98 1.70 2.45 0.34 0.58
Fe2O
30.64 0.44 1.59 0.62
LOI 40.32 44.20 39.12 45.95 44.52
Volatile matter 0.626
Source: Chaudhari (2002).
Building Material
In addition to the above stated economic minerals, the
State has plenty of marble, granite, volcanic, quartzite,
slate, etc., that may be utilised for making tiles and
mosaic chips.
(i) Sand, Concrete, Boulders, etc.: The State has sand,
concrete, gravel, etc., in vast quantity. The stone
crushing industry may be established to utilise these
resources.
(ii) Brick Making: Two types of bricks may be made (a)
hollow brick through concrete, sand, cement, etc.,

ARUNACHAL PRADESH DEVELOPMENT REPORT138
and (b) earthen brick through kiln process. There is
a great demand of both types of bricks in Arunachal
Pradesh. The hollow concrete brick can be made
cheaply in the State. It is durable and can be used in
constructing environmentally friendly houses.
(iii) Tiles and Mosaic chips: These are much in demand in
the State, which are being brought to the State from
the rest of the country. Various rocks used in tiles
and mosaic chips are available in good quantity in
the State, as given below:
(a) Marble: Thin bands of marble are found at
different stratigraphic levels along Bomdila-Se
La-Tawang road section in West Kameng and
Tawang districts, Ziro-Daporijo-Taliha road
section in Lower and Upper Subansiri districts,
Along-Pangin-Tuting road section in West and
Upper Siang districts, Myodia Pass-Hunli-
Angolin-Annini road section in Dibang Valley
district, and Tezu-Tidding-Hayuliang-Walong
road section in Lohit district. Of these deposits
the estimated reserves are: 2.34 million tonnes
near Hunli, 0.18 million tonnes at Ryalli, 30.30
million tonnes at Tezu and 43.30 million tonnes
at Dora.
(b) Quartzite: Significant deposits of quartzite are
also found at several stratigraphic horizons
almost in all the main road sections of Arunachal
Pradesh. Of these exposures, which need
attention for exploitation, are between Ziro-
Tamen, Daporijo-Taliha, Dali-Basar, Bame-Along,
Bame-Daporijo, Kaying-Tato, Pangin-Boleng,
Roing-Myodia Pass and Tezu-Tidding.
(c) Granite/Granite Gneiss: It is available in
different stratigraphic levels in almost all the
districts, except Changlang and Tirap. However,
potential deposits viable for such purposes are
exposed along Tenga-Bomdila, Dirang-Se La,
around Tamen and Daporijo.
(d) Volcanics/Meta-volcanics: Significant deposits
of volcanics are exposed in West Siang,
particularly around Rotung, between Boleng to
Dite Dame, and at a few patches on Bodak-
Dumro along the Yamne Valley. The meta-
volcanics, such as grano-diorite, etc., that forms
a part of the Lohit Plutonic Complex are exposed
between Hayuliang-Walong along the Lohit
River. These rocks are also exposed in Dibang
Valley, but at present this area lacks
infrastructural facilities.
Hydro Resources
The only known and apparent resource which is not
hidden is the enormous water wealth of Arunachal
Pradesh, which is available in the form of surface and
groundwater. This vast resource can effectively be
converted into hydro-power, besides drinking and
irrigation purposes.
(i) Surface Water: The major rivers in the State form
what is termed as Upper Brahmaputra River System,
details of which appear in Table 7.3. The data
reveals the presence of six river basins of high order
(Kameng, Subansiri, Siang, Dibang, Lohit and Tirap-
Dihing) and four of low order (Tawang, Dikrong,
Sessri and Tiso). In addition, there are also 36 sub-
basin, 46 total catchments/watershed areas and 420
streams of 1st order.
The data also shows that the Siang and Lohit river
basins have 9, Dibang has 8, and Subansiri has 7 sub-
basins. Whereas, the streams of 1st order are
maximum, i.e., 111 in Siang, 83 in Dibang, 80 in
Lohit, 61 in Subansiri and 34 in Kameng river basins.
The water volume is highest in the Siang, followed by
Lohit, Dibang, and Subansiri river basins.
(ii) Hydro-power Potential: The large river system along
with the structure of the landforms provides ideal
conditions to generate huge amount of electricity.
According to various estimates, the State has one-
third of the country’s total potentiality. However,
the State has so far developed only 33,210 KW
under the State Sector from 53 micro/mini/small
hydro-electric projects (Table 7.4), which is not
sufficient to meet the peak domestic demand of
90,000 KW. Thus, the deficiency is met out by the
DG sets (about 20,000 KW) and about 25,000 KW
is purchased from the Central Sector.
In the Central Sector, a major hydro-power project
commissioned in the State is the Ranga Nadi Hydel
Project by NEEPCO, which has a power generation
capacity of 405 MW (3x135 MW). The State is
getting only a meagre quantity from the Ranga Nadi
Hydel Project for domestic utilisation. Two other
central projects with an installed capacity of 600
MW in Kameng by NEEPCO and 2,000 MW in
Lower Subansiri by NHPC are likely to be
completed during the XI Plan period.
Further, under the State Sector 37 micro/mini/small
projects have been taken up which are at various
stages of construction with a target capacity of 58,990
KW during the 10th–11th Plan period (Table 7.5).

139Chapter 7 • NATURAL RESOURCES AND SUSTAINABLE DEVELOPMENT
TABLE 7.3
River Basins of Arunachal Pradesh
River Basin Sub-basin Area Slope Drainage Av. Rainfall Total Annual Available Water for Use(Km2) (in %) Density (in cm) Volume of Including Water Absorbed
(m/km2) Available by Soil throughRainwater Percolation(ha. m) (in ha. m) (in %)
I. Tawang 1. Nyamjong 580.6 21.05 112.82 75 43542 5146 11.82
2. Tawang Chu 1536.1 23.15 90.75 75 115205 13515 11.75
II. Kameng 1. Tammaphu- 1689.4 15.20 154.91 98 584603 195469 33.44
2. Bichom 4297.5 16.33 40.79
3. Upper Kameng 3855.7 18.96 92.33 115 443408 193173 43.57
4. Pakke 2980.1 5.95 122.04 173 515580 322172 62.49
III. Dikrang 1. Dikrang 1614.6 11.05 198.38 215 347135 121414 34.98
IV. Subansiri 1. Ranga 2733.3 13.35 90.88 203 553473 171374 30.96
2. Khru 3467.2 17.08 86.87 155 537410 137642 25.61
3. Kamla 3578.1 21.40 89.94 123 438305 71911 16.41
4. Tsari 3251.4 23.75 96.67 168 1186853 408843 34.45
5. Syee 1162.6 11.73 120.76
6. Middle 2671.7 20.25 88.71Subansiri
7. Subansiri 2334.9 3.85 106.17 278 647938 408849 63.10interfluves
V. Siang 1. Lower Siyom 2249.6 9.58 176.03 213 478035 231029 48.33
2. Shimang 613.5 13.45 135.78 283 173318 85772 49.49
3. Upper Siyom 2490.1 16.70 100.00 153 379738 706325 28.00
4. Sike 871.9 19.60 107.24 181 156943 32523 20.72
5. Siyong 2122.8 20.75 137.04 150 318420 85336 26.80
6. Yangsang 1739.6 15.63 183.89 218 378360 130119 34.39
7. Yamne 1379.1 77.45 161.92 340 468908 272110 58.03
8. Upper Siang 1655.7 16.63 134.69 344 994530 582041 58.52
9. Lower Siang 1234.9 3.80 116.77
VI. Sessri 1. Sessri 411.4 14.80 149.00 388 159415 120455 75.56
2. Sessri interfluves 640.1 6.03 86.71 495 316853 256235 80.87
VII. Dibang 1. Ahi 569.9 14.35 122.65 325 185218 131248 70.86
2. Emra 1459.8 10.25 181.12 260 379550 241307 63.58
3. Matun 2488.2 13.65 164.13 188 466540 230908 49.49
4. Dri 1661.3 17.20 121.17 180 299033 141708 47.39
5. Tangon 2393.5 21.50 145.81 198 472718 246054 52.05
6. Ethun 1256.6 16.98 61.99 358 449235 330235 73.51
7. Upper Dibang 468.2 20.50 108.71 184 231038 155597 48.47
8. Lower Dibang 1278.8 6.35 134.58
VIII. Lohit 1. Digaru 987.9 4.58 148.09 385 380343 266438 70.05
2. Tidding 681.0 12.23 166.59 283 192385 113866 59.15
3. Delei 1764.1 18.90 92.91 245 432203 228802 52.94
4. Middle Lohit 1543.8 20.40 88.29 245 378230 200230 52.94
5. Upper Lohit 2995.3 19.85 134.51 210 629013 283655 45.10
6. Beiang 1109.9 7.95 135.42 273 302448 174477 57.69
7. Bara Tanga 248.5 6.15 466.00 300 74548 45896 61.57
8. Lohit 1314.7 8.25 41.38 320 913030 584056 63.97
9. Tellu 1538.5 1.65 256.09
IX. Tirap- 1. Neo Dihing 3775.0 6.08 118.65 245 924875 417893 45.18Dihing
2. Tirap 2573.4 9.53 166.01 258 662650 317042 47.84
X. Tiso 1. Upper Tiso 1789.4 8.95 99.08 275 492085 251769 51.16
2. Lower Tiso 2021.1 1.90 100.69 300 606328 334894 55.23
Ten 46 Sub-basins 17799444 8647523 48.58Basins
Source: Singh (1999).

ARUNACHAL PRADESH DEVELOPMENT REPORT140
TABLE 7.4
Small Hydro-power Stations Under Operation
S.No. Name of Station Unit in Installed Year ofKW Capacity Commission
in KW
1. Tawang District
1 Kitpi Ph-I 3 × 500 1,500 1977-78
2 BTK camp 1 × 10 10 1995-96
3 Thongleng 1 × 10 10 1995-96
4 Nuranang 3 × 2000 6,000 1996-97
5 T. Gompa 1 × 50 50 2001-02
6 Dudunghar 1 × 30 30 2004-05
Total of the District 7,600
2. West Kameng District
7 Rahung 3 × 250 750 1972-73
8 Dirang 4 × 500 2,000 1977-78
9 Sessa 3 × 500 1,500 1992-93
10 Khelong 1 × 10 10 1995-96
11 Rupa 2 × 100 200 1997-98
12 Dokumpani 1 × 30 30 2000-01
Total of the District 4,490
3. East Kameng District
13 Seppa 3 × 100 300 1980-81
14 18th mile 1 × 10 10 1995-96
15 Pakke Kessang 1 × 30 30 2001-02
Total of the District 340
4. Papum Pare District
16 Senkhi 3 × 250 750 1979-80
17 Hostalam 1 × 5 5 1995-96
Total of the District 755
5. Kurung Kumey District
18 Koloriang 1 × 10 10 1995-96
Total of the District 10
6. Lower Subansiri District
19 Mai PH-I 4 × 500 2,000 1977-78
20 Mai PH-II 2 × 500 1,000 1982-83
21 Tago 3 × 1500 4,500 1992-93
Total of the District 7,500
7. Upper Subansiri District
22 Daporijo 4 × 100 400 1981-82
23 Maro 1 × 30 30 2002-03
Total of the District 430
8. West Siang District
24 Pagi (Basar) 2 × 50 100 1980-81
25 Along 4 × 100 400 1984-85
26 Ego-Echi 4 × 100 400 1992-93
27 Mechuka 2 × 50 100 1994-85
28 Yomcha 2 × 50 50 1994-95
29 Tato 1 × 50 50
Total of the District 1,100
contd...
...contd...
S.No. Name of Station Unit in Installed Year ofKW Capacity Commission
in KW
9. Upper Siang District
30 Yingkiong Ph-I 3 × 50 150 1980-81
31 Tuting 2 × 50 100 1984-85
32 Yingkiong Ph-II 3 × 100 200 1992-93
33 Silli 2 × 250 500 1994-95
34 Pangkang 1 × 125 125 1995-96
35 Sirnyuk 2 × 1000 2,000 1996-97
Total of the District 3,075
10. East Siang District
36 Pasighat 2 × 100 200 1974-75
37 Yembung 4 × 500 2,000 1994-95
38 Sille 1 × 50 50 2001-02
Total of the District 2,250
11. Lower Dibang Valley District
39 Deopani Ph-I 3 × 250 750 1986-87
40 Sissri 3 × 250 500 1992-93
41 Abhapani (1 × 250) + (2 × 100)450 1994-95
42 Jambupani 1 × 30 30 2000-01
43 Deopani Ph-II 2 × 250 500 2004-05
Total of the District 2,230
12. Upper Dibang Valley District
44 Anini 3 × 50 150 1994-95
45 Tah Ahfra 1 × 50 50 2001-02
46 Chini Afra 1 × 250 250 2001-02
Total of the District 450
13. Lohit District
47 Dura Nallah 4 × 100 400 1976-77
48 Tafragram 1 × 250 250 1984-85
Total of the District 650
14. Anjaw District
49 Ampani 2 × 250 500 1989-90
50 Kebitho 1 × 30 30 2004-05
Total of the District 530
15. Changlang District
51 Tissue 4 × 100 400 1986-87
Total of the District 400
16. Tirap District
52 Thiraiju 4 × 250 1,000 1978-89
53 Charju 2 × 200 400 1984-85
Total of the District 1,400
Total (in KW) 33,210
Source: Hydro Electric Power Policy Document of the Government ofArunachal Pradesh, 2005.
As stated above, the State has a large potentiality of
hydro-power generation, which is estimated at
49,000 MW from the 89 major projects identified in

141Chapter 7 • NATURAL RESOURCES AND SUSTAINABLE DEVELOPMENT
the State by the Central Electricity Authority (CEA)
(Table 7.6).
In addition, the potential from micro/mini/small
project is also estimated to be about 1,600 MW.
(iii) Inland Water Transport: Another dimension of the
surface water resource is the development of Inland
Water Transport System, subject to the
development of the multi-purpose hydro-power
projects. With the limitation of land development
infrastructure and difficulties due to hilly terrain,
inland water transport may stand the viable mode of
cheap transportation, and can improve the overall
transport communication in the State.
(iv) Groundwater: Groundwater potential in the State is
equally impressive (Table 7.7). The quality of
groundwater in the State is good for domestic as
well as industrial and agricultural use. The water
has pH value ranging from 6.5-8.5, and its electrical
conductivity varies from 46 to 316 micro mhos/cm
at 25° C. All other cations and anions are within the
permissible limit.
The following suggestions are given by the CGWB to
augment water resources:
• In valley area—to construct deep tubewells, and to
construct bunds/check dams, etc., on perennial
streams.
• In hilly areas—to develop perennial springs and to
provide storage for better supply by applying
scientific methods, such as arresting rain water for
drinking and creating artificial recharge through
construction of suitable roof top rain water
harvesting structures.
Problems in Utilisation of Mineral Resources
Arunachal Pradesh is thought to have a treasure of
natural wealth including minerals. But as long as the net
worth of natural wealth is not estimated it has no
relevance for socio-economic development. Therefore, it is
very important to update the information through surveys
and remote sensing technology. Further, with respect to
the known mineral deposits, attempts should be made to
study the economic feasibility for their exploitation.
Mineral exploitation involves the various steps:
• Detailed geological investigation
• Terrain consideration
• Quantity and quality assessment of the mineral
deposits
TABLE 7.5
Ongoing Hydro Electric Projects under State Sector
S.No. Name of Project Installed Capacity (in KW)
1. Tawang District
1 Kitpi MHS Ph-II 3,000
2 Mukto MHS 6,000
3 Khangtang MHS 7,500
Total of District 16,500
2. West Kameng District
4. Domkhrong MHS 2,000
Total of District 2,000
3. East Kameng District
5 Pacha MHS 3,000
Total of District 3,000
4. Kurung Kumey District
6 Kush MHS 2,000
7 Payu MHS 1,000
8 Pate Nallah MHS 50
Total of District 3,050
5. Lower Subansiri District
9 Augmentation of Mai Ph-I, Ph-IIand Tago MHS by diverting PangeRiver to Mai (civil works only)
6. Upper Subansiri District
10 Siyum MHS 30
Total of District 30
7. West Siang District
11 Liromoba MHS 2,000
12 Tato MHS 50
13 Beye 50
Total of District 2,100
8. Upper Siang District
14 Sidip KHS at Mariyang 3,000
15 Sipit MHS at Gette 2,000
16 Angong Nallah MHS 4,500
17 Singa MHS 30
18 Sillingiri MHS 50
19 Ramsing MHS 50
20 Gosang MHS 500
21 Kopu MHS 50
Total of District 10,180
9. East Siang District
22 Subbung MHS near Supsing 3,000
23 Rina MHS over Simen river 2,000
Total of District 5,000
10. Lower Dibang Valley District
24 Deopani MHS Ph-II 500
25 MHS over Eme River 1,500
Total of District 2,000
contd...

ARUNACHAL PRADESH DEVELOPMENT REPORT142
...contd...
S.No. Name of Project Installed Capacity (in KW)
11. Upper Dibang Valley District
26 Echi Ahfra MHS 400
27 Aug. of Awapani MHS 500
28 Tah Ahfra Ph-II 50
Total of District 950
12. Lohit District
29 Dus Nallah MHS 500
Total of District 500
13. Anjaw District
30 Yapak Nallah MHS 200
31 Teepani MHS 400
32 Mati Nallah MHS 500
33 Langpani MHS 400
34 Halaipani HEP 12,000
35 MHS over Kebitho 30
Total of District 13,530
14. Changlang District
36 MHS over Ngonalo at Vijay Nagar 100
Total of District 100
15. Tirap District
37 Baraf Nallah at Lazu 50
Total of District 50
Grand Total (in KW) 58,990
Source: Hydro Electric Power Policy Document of the Government ofArunachal Pradesh, 2005.
• Method of exploitation
• Environment impact assessment of commercial
exploitation
• Economic, commercial, and technical feasibility
• Policy and legal framework.
These steps are time consuming and involve heavy
investment. Given the financial constraints of the State,
the private sector may be involved.
The following industries may be set up in the State
based on the mineral potential:
• Fertiliser plants, refractory units based on dolomite.
• Calcium carbide manufacturing units and cement
plants based on limestone.
• Coking plants and gasification based on coal.
• Refractory, pencil, abrasive-manufacturing units
based on graphite.
• Cutting and polishing units of decorative and
building stones.
TABLE 7.6
Identified Sites for Hydro Power Potentialin Arunachal Pradesh
S.No. Name of River Basin Latitude Longitude Probable GradeSchemes Installed
Capacity(in MW)
1. Siang Lower Dihang/ 28o 10’ 95o 13’ 1,700 ADibang
2. Bhareli Lift Kameng 27o 01’ 92o 37’ 330 ADam-II
3. Hegio Subansiri 27o 46’ 93o 47’ 250 A
4. Bhareli Lift Kameng 27o 08’ 92o 37’ 240 ADam-I
5. Emini Dihang/ 28o 50’ 95o 52’ 295 ADibang
6. Amulin Dihang/ 28o 53’ 95o 53’ 235 ADibang
7. Agolin Dihang/ 28o 47’ 95o 54’ 235 ADibang
8. Kapak Leyak Kameng 27o 32’ 92o 48’ 195 A
9. Rigong Dihang/ 28o 55’ 94o 50’ 130 ADibang
10. Badao Kameng 27o 43’ 93o 01’ 120 A
11. Pakke Kameng 27o 07’ 93o 05’ 120 A
12. Kurung Dam-II Subansiri 27o 48’ 93o 37’ 115 A
13. Seba Kameng 27o 05’ 93o 02’ 105 A
14. Yepin Dibang/ 28o 15’ 95o 12’ 95 ADibang
15. Milli Subansiri 27o 58’ 93o 03’ 75 A
16. Chela Subansiri 27o 57’ 93o 17’ 75 A
17. Par Subansiri 27o 13’ 94o 37’ 65 A
18. Pongging Dihang/ 28o 13’ 95o 12’ 60 ADibang
19. Tago-I Subansiri 27o 28’ 93o 48’ 55 A
20. Para Kameng 27o 43’ 93o 07’ 55 A
21. Seppla Kameng 27o 25’ 91o 00’ 46 A
22. Lachung Kameng 27o 33’ 93o 07’ 41 A
23. Sape Subansiri 27o 57’ 93o 05’ 38 A
24. Ralgam Lohit 28o 12’ 96o 32’ 32 A
25. Nyapin Subansiri 27o 44’ 93o 28’ 32 A
26. Gimiliang Lohit 28o 08’ 96o 39’ 31 A
27. Rebby Kameng 27o 43’ 93o 08’ 30 A
28. Chanda Kameng 27o 47’ 92o 56’ 110 A
29. Tarang Warang Kameng 27o 30’ 93o 15’ 65 A
30. Hiya Subansiri 27o 42’ 93o 27’ 41 A
31. Tiding-I Lohit 28o 05’ 96o 17’ 31 A
Sub total 5,047
32. Kimi Kameng 27o 17’ 92o 42’ 535 B
33. Tato-II Dihang/ 28o 58’ 94o 26’ 360 BDibang
34. Phanchung Kameng 27o 32’ 93o 04’ 90 B
35. Dardu Subansiri 27o 14’ 93o 46’ 60 B
36. Hutong Lohit 27o 56’ 96o 47’ 950 B
37. Chomi Subansiri 27o 58’ 93o 11’ 80 B
contd...

143Chapter 7 • NATURAL RESOURCES AND SUSTAINABLE DEVELOPMENT
Policy Options
Arunachal Pradesh is rich in geo-resources, however,
an integrated approach is necessary for long term
sustainability, keeping in view the diverse needs of socio-
economic activities and ecological and environmental
preservation.
It is a well known fact that Arunachal Pradesh falls
under high seismic zone. The frequency of tremors can be
judged by the fact that in Subansiri alone, particularly in
...contd...
S.No. Name of River Basin Latitude Longitude Probable GradeSchemes Installed
Capacity(in MW)
38. Oju-II Subansiri 28o 18’ 93o 25’ 2,580 B
39. Atunli Dihang/ 28o 41’ 96o 04’ 175 BDibang
40. Naba Subansiri 28o 17’ 93o 35’ 1,290 B
41. Emra-II Dihang/ 28o 38’ 95o 42’ 870 BDibang
42. Noa-Dehing Lohit 27o 28’ 96o 24’ 75 B
43. Tammu Subansiri 27o 58’ 94o 25’ 55 B
44. Etalin Dihang/ 28o 39’ 96o 00’ 3,045 BDibang
45. Kalai Lohit 27o 59’ 96o 59’ 2,550 B
46. Naying Dihang/ 28o 02’ 94o 31’ 495 BDibang
47. Kameng Kameng 27o 06’ 92o 54’ 1,100 B
48. Oju-I Subansiri 28o 21’ 93o 21’ 1,925 B
49. Niare Subansiri 28o 17’ 93o 29’ 1,405 B
50. Bichom-II Kameng 27o 18’ 92o 37’ 205 B
51. Passar Kameng 27o 16’ 93o 08’ 32 B
52. Siang Middle Dihang/ 28o 30’ 94o 40’ 700 BDibang
53. Emra – I Dihang/ 28o 43’ 95o 37’ 275 BDibang
54. Minnying Dihang/ 28o 54’ 94o 36’ 195 BDibang
55. Elango Dihang/ 28o 33’ 95o 32’ 180 BDibang
56. Doimukh Subansiri 27o 10’ 93o 46’ 170 BStorage
57. Mirak Dihang/ 28o 52’ 94o 40’ 160 BDibang
58. Tato-I Dihang/ 28o 32’ 94o 24’ 80 BDibang
59. Nazong Kameng 27o 28’ 92o 32’ 65 B
60. Pauk Dihang/ 28o 33’ 94o 16’ 50 BDibang
61. Satuk Kameng 27o 37’ 92o 45’ 47 B
62. Gameng Dihang/ 28o 38’ 94o 39’ 37 BDibang
63. Papu Kameng 27o 16’ 93o 02’ 160 B
64. Jaru Dihang/ 28o 17’ 95o 12’ 60 BDibang
contd...
...contd...
S.No. Name of River Basin Latitude Longitude Probable GradeSchemes Installed
Capacity(in MW)
65. Pichang Kameng 27o 20’ 92o 35’ 31 B
66. Ranga Nadi Subansiri 27o 23’ 93o 46’ 180 BStage-II
67. Mathithing Kameng 27o 20’ 92o 30’ 40 B
68. Khultam Kameng 27o 20’ 92o 23’ 29 B
69. Talong Kameng 27o 34’ 93o 00’ 150 B
70. Utong Kameng 27o 28’ 92o 32’ 110 B
71. Dibbin Kameng 27o 27’ 92o 32’ 95 B
72. Jarong Dihang/ 28o 43’ 94o 18’ 85 BDibang
73. But Kameng 27o 19’ 92o 27’ 26 B
74. Hirong Dihang/ 28o 44’ 94o 24’ 180 BDibang
75. Malinya Dihang/ 28o 43’ 96o 11’ 335 BDibang
76. Heo Dihang/ 28o 31’ 94o 19’ 90 BDibang
77. Yangman U/ 27o 18’ 96o 12’ 60 BStorage Brahmaputra
78. Tenga Kameng 27o 13’ 92o 36’ 275 B
79. Mithundon Dihang/ 28o 53’ 95o 59’ 145 BDibang
80. Dibang Dihang/ 28o 20’ 95o 47’ 1,000 BDibang
81. Sissiri Dihang/ 28o 17’ 95o 33’ 222 BDibang
82. Subansiri Subansiri 27o 45’ 94o 04’ 2,000 BMiddle
83. Siang Upper Dihang/ 28o 57’ 94o 57’ 11,000 BDibang
84. Bichom-I Kameng 27o 20’ 92o 30’ 190 B
85. Subansiri Upper Subansiri 28o 05’ 94o 10’ 2,500 B
86. Kurung Dam-I Subansiri 27o 48’ 93o 37’ 200 B
Sub total 38,999
87. Subansiri lower Subansiri 27o 33’ 94o 15’ 2,000 C
88. Demwe Lohit 27o 57’ 96o 24’ 3,000 C
89. Tipang U/ 27o 15’ 95o 54’ 80 CBrahmaputra
Sub-Total 5,080
Total 49,126
Source: Hydro Electric Power Policy Document of the Government ofArunachal Pradesh, 2005.
Yazuli area, nearly 1,000 mild earthquakes were recorded
in 10 months in 1990 (Kayal et al., 1992). The seismic
data for 1979-1990 indicates that seismicity in Arunachal
Pradesh is mostly aligned along the Main Boundary Thrust
(MBT), Main Central Thrust (MCT), Lohit and Mishmi
thrusts (Verma et al., 1993). Further, a total number of 17
tremors of magnitude 2.4 to 5.0 during November 1997
to December 1999 (Sitaram, 2003), and 18 tremors of
magnitude varying from 1.6 to 4.8 in 2003 were recorded
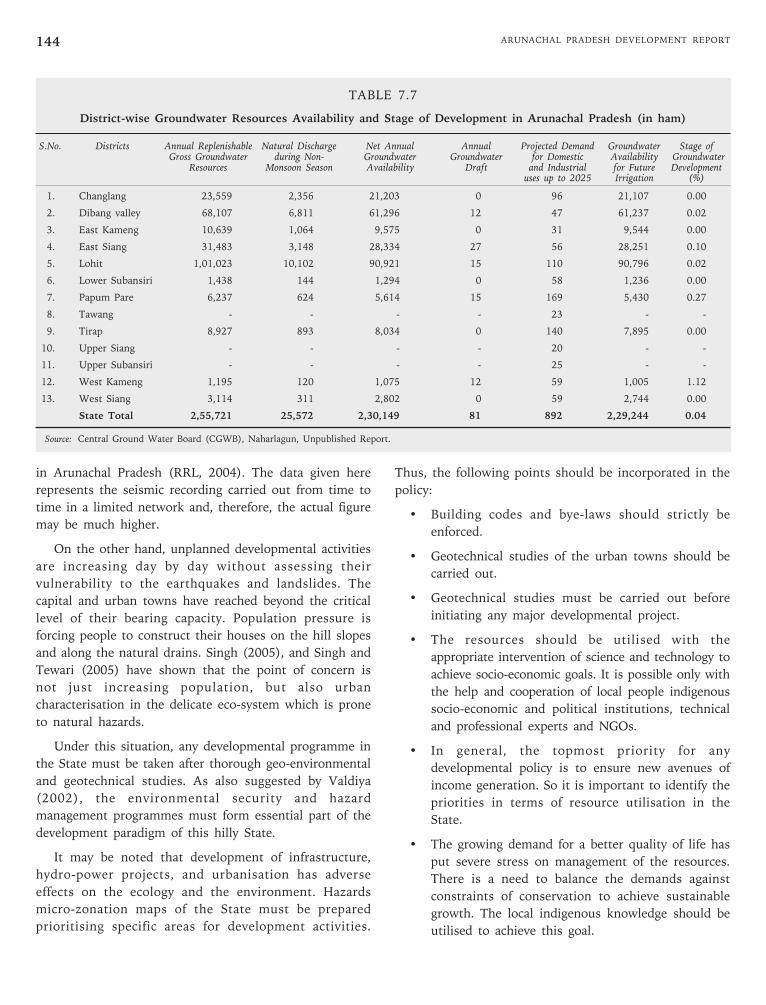
ARUNACHAL PRADESH DEVELOPMENT REPORT144
in Arunachal Pradesh (RRL, 2004). The data given here
represents the seismic recording carried out from time to
time in a limited network and, therefore, the actual figure
may be much higher.
On the other hand, unplanned developmental activities
are increasing day by day without assessing their
vulnerability to the earthquakes and landslides. The
capital and urban towns have reached beyond the critical
level of their bearing capacity. Population pressure is
forcing people to construct their houses on the hill slopes
and along the natural drains. Singh (2005), and Singh and
Tewari (2005) have shown that the point of concern is
not just increasing population, but also urban
characterisation in the delicate eco-system which is prone
to natural hazards.
Under this situation, any developmental programme in
the State must be taken after thorough geo-environmental
and geotechnical studies. As also suggested by Valdiya
(2002), the environmental security and hazard
management programmes must form essential part of the
development paradigm of this hilly State.
It may be noted that development of infrastructure,
hydro-power projects, and urbanisation has adverse
effects on the ecology and the environment. Hazards
micro-zonation maps of the State must be prepared
prioritising specific areas for development activities.
Thus, the following points should be incorporated in the
policy:
• Building codes and bye-laws should strictly be
enforced.
• Geotechnical studies of the urban towns should be
carried out.
• Geotechnical studies must be carried out before
initiating any major developmental project.
• The resources should be utilised with the
appropriate intervention of science and technology to
achieve socio-economic goals. It is possible only with
the help and cooperation of local people indigenous
socio-economic and political institutions, technical
and professional experts and NGOs.
• In general, the topmost priority for any
developmental policy is to ensure new avenues of
income generation. So it is important to identify the
priorities in terms of resource utilisation in the
State.
• The growing demand for a better quality of life has
put severe stress on management of the resources.
There is a need to balance the demands against
constraints of conservation to achieve sustainable
growth. The local indigenous knowledge should be
utilised to achieve this goal.
TABLE 7.7
District-wise Groundwater Resources Availability and Stage of Development in Arunachal Pradesh (in ham)
S.No. Districts Annual Replenishable Natural Discharge Net Annual Annual Projected Demand Groundwater Stage ofGross Groundwater during Non- Groundwater Groundwater for Domestic Availability Groundwater
Resources Monsoon Season Availability Draft and Industrial for Future Developmentuses up to 2025 Irrigation (%)
1. Changlang 23,559 2,356 21,203 0 96 21,107 0.00
2. Dibang valley 68,107 6,811 61,296 12 47 61,237 0.02
3. East Kameng 10,639 1,064 9,575 0 31 9,544 0.00
4. East Siang 31,483 3,148 28,334 27 56 28,251 0.10
5. Lohit 1,01,023 10,102 90,921 15 110 90,796 0.02
6. Lower Subansiri 1,438 144 1,294 0 58 1,236 0.00
7. Papum Pare 6,237 624 5,614 15 169 5,430 0.27
8. Tawang - - - - 23 - -
9. Tirap 8,927 893 8,034 0 140 7,895 0.00
10. Upper Siang - - - - 20 - -
11. Upper Subansiri - - - - 25 - -
12. West Kameng 1,195 120 1,075 12 59 1,005 1.12
13. West Siang 3,114 311 2,802 0 59 2,744 0.00
State Total 2,55,721 25,572 2,30,149 81 892 2,29,244 0.04
Source: Central Ground Water Board (CGWB), Naharlagun, Unpublished Report.

Introduction
Arunachal Pradesh has large forest cover with around
82 per cent of its area being under forests. There are over
20 forest types ranging from tropical to alpine situation
(Baishya et al., 2001, Hegde, 2000, Kaul and Haridasan,
1987).
The ecological and environmental factors have greatly
influenced the life and lore of the indigenous people of
the State. The influence of forests and variety of wildlife
have found manifestations in the diverse art and culture,
lifestyles, food habits, cultivation practices, crafts,
customs, traditions and their enormous indigenous
knowledge system (IKS).
Biological Diversity
The State is home to myriad life forms coexisting in
diverse ecological situations. Its forest and faunal diversity
makes it one of the 25 “Biodiversity Hotspots” in the
world (Hegde, 2000). The varying climatic conditions have
favoured the luxuriant growth of various forest types.
Flora
Floristically, there are about 4500 species of flowering
plants, 605 species of orchids, 89 species of bamboos, 18
species of canes, 400 species of ferns, 34 species of
gymnosperms, and equally high number of unexplored
algae, fungi, lichen, bryophytes and micro-organisms
inhabiting the State. It is significant to note that 76.93 per
cent of plant families known in India are found in
Arunachal Pradesh. Some of the dominant families
represented in the State are: Orchidaceae, Leguminosae
Asteraceae, Ericaceae, Poaceae, Urticaceae, Rosaseae, Cyperaceae
and Euphorbiaceae. Orchidceae is most predominant with
ARUN
ACH
AL PR
ADESH
more than 600 species and with about 30 endemic species
that adore the forests of Arunachal Pradesh (Hegde,
2001). Thus, this eastern Himalayan State harbours more
than 33 per cent of the total Indian flora with unique taxa
and large number of genetic resources making it a “cradle
of speciation”.
Fauna
Faunistically, the State is also rich in having more than
213 mammals, 872 birds, 113 reptiles, 130 fishes, 7 non-
human primates and innumerable species of insects,
micro-organisms and other life forms. Major animals
found in the State are: elephant, gaur, sambhar, mithun,
wild buffaloes, four major cats—tiger, spotted/clouded/
snow leopards—rare feline species like the golden cats
and the marbled cats, hog deer, barking deer, musk deer,
black bear, three goat antelopes, goral, serow, takin, red
panda, hispid hare, pheasants, Bengal pelican, migratory
birds, etc. Hoolock gibbon found here is the only ape in
India. Takin and Chinese goral are two rare animals found
in the higher elevations. Similarly, mithun is a semi-
domesticated animal (bos frontalis) having religious
significance in Arunachal Pradesh.
Forest Resources and Forestry
The forests of Arunachal Pradesh are the rich source of
various timber and non-timber products including
bamboo, cane, medicinal plants, orchids, thatch and
broom grass, resin, etc. These resources are found
throughout the State in various forest types. According to
the classification of Champion and Seth (1968) there are
19 different and divergent forest types which can broadly
be grouped under six general forest types in different
altitudinal and climatic zones as in Table 8.1.
Chapter 8
Development of Forest Resources

ARUNACHAL PRADESH DEVELOPMENT REPORT146
TABLE 8.1
Various Forest Types with Important Plant Species
Forest Type Altitudinal Range Important Species(in m)
Alpine Above 3500 Rhododendron spp., Arenaria,Saxifraga, Saussurea, Rheum,etc.
Temperate 1800-3500 Acer, Castanopsis, Populus,Tsuga, Abies, Berberis, Taxus,Cupressus, Pinus, Juniperus
Subtropical Pine 1000-1800 Pinus roxburghii, P. merkusii,P. Wallichiana, Tsuga demosa,etc.
Subtropical Broad Leaved 900-1900 Castanopsis, Quercus, Michelia,Alnus, Schima sp
Tropical Wet Evergreen Up to 900 South Bank: Dipterocarpusmacrocarpus, Shorea assamica,North Bank: Mesua ferrea,Altingia excelsa.
Tropical Semi-evergreen Upto 600 Terminalia myriocarpa, Bombaxceiba, Canarium strictum,Ailanthus grandis, etc.
Note: All these forests are home for the State’s rich wild life.
Source: Champion and Seth (1968).
Considering the land use pattern in Arunachal Pradesh
(Table 8.2), out of the total geographical area of 83,743
sq km, 51,540 sq km (61.54 per cent) falls under forest.
Cropped area is only 1931.93 sq km. Rest of the land is
either fallow, uncultivable or waste lands. Large chunk of
the degraded forest areas belong to various communities
inhabiting the State and traditionally enjoying rights over
them.
TABLE 8.2
Land-use Classification in Arunachal Pradesh(Area in Sq. Km)
Sl. Land use Area % of GeographicalNo. Area
1. Total Geographical Area 83743.00
2. Forest Area 51540.00 61.540
3. Fallow Land 646.30 0.771
4. Land under Misc. Tree Crops 444.55 0.530
5. Cultivable Wasteland 330.94 0.395
6. Cropped Area 1931.93 2.307
7. Area not Available for Cultivation 426.89 0.5109
Source: Statistical Abstract of Arunachal Pradesh, 1998.
Legal Status of the Forests
The forests of the State are legally classified as
reserved forests (RF), protected forests, anchal and village
forest reserves, national parks and wild life sanctuaries
(Table 8.3) under relevant provisions of Assam Forest
Regulation 1891, Anchal and Village Forest reserve Act
1978, 1981 and Wild Life Protection Act 1972.
Unsurveyed forests where status of right and ownership is
not settled are classified as unclassed state forests (USF).
The USF is a very ambiguous word and there is not much
departmental control on it.
TABLE 8.3
Legal Status of Forests
Sl. Legal Classification Area % of Recorded % ofNo. (Sq Km) Forest Geographical
Area
1. Reserved Forests 9815.37 19.04 11.72
2. Protected Forests 7.79 0.01 0.01
3. Anchal Reserve Forests 256.08 0.50 0.30
4. Village Reserve Forests 175.20 0.34 0.21
5. National Parks 2468.23 4.79 2.94
6. Wild Life Sanctuary 6777.75 13.15 8.09
7. Unclassified State Forest 32039.00 62.16 38.25
Total 51540.00 100.00 61.54
Source: SFRI News Bulletin No. 27 (Sinha, 2008).
The reserved forests are scientifically managed. Most
of them are covered under working plan and resource
surveys. To replenish the dwindling resource, the
department has been taking up various afforestation
programmes. A large area of plantation has also been
raised under various state and Central schemes.
According to the directives of Supreme Court of India,
it is mandatory to prepare working plans for felling trees
in any forest area. In this direction Arunachal Pradesh
Forest Department has made significant progress in
carrying out resource survey and preparation of working
plans/schemes. Out of 9815.37 sq km of reserved forests,
8490 sq km has so far been covered under working plan.
Similarly, under USF, 13 working schemes have been
prepared covering 4,564.73 sq km area and approval for
11 schemes had so far been obtained.
Based on the up-to-date survey of resources and
working plan prescriptions, it is expected to have an
annual yield of timber at 74,152.55 cum. Similarly, the
yield of non-wood forest products like cane, bamboo and
resin are: cane—1,53,36,851 rmt.; bamboo—2,78,162 nos;
resin—2,28,980 blazes.
Management and Conservation/Protection of Forests
Keeping in view people’s needs, traditional rights,
sustainable economic development, industrial needs and
conservation and protection of rich biodiversity the
Department of Environment and Forests has adopted and

147Chapter 8 •
DEVELOPMENT OF FOREST RESOURCES
FIG
UR
E 8
.1
Forest C
over of
Aru
nach
al
Prad
esh
Taw
ang
Wes
tK
amen
g
Eas
tK
amen
g
Pap
um
Par
e
Itan
agar
Low
erSu
ban
siri
Up
per
Su
ban
siri
Eas
tSia
ng
Wes
tSia
ng
Up
per
Sia
ng
Dib
ang
Val
ley
Loh
it
Ch
anglo
ng
Tir
ap
Ch
ina
Ch
ina
Mya
nm
ar
Nag
alan
dA
ssam
Bh
uta
n
Tib
et
68019
sqK
m=
81.2
2%
Lar
ges
tD
ense
Fore
stC
ove
rin
the
Cou
ntr
y
Th
isE
aste
rnH
imal
ayan
Sta
teis
con
sid
ered
tob
eo
ne
of
the
inth
ew
orl
dB
iod
iver
sity
Hots
pots
Forest
Cover
(Lan
dsa
tim
age)
Wil
dli
feSan
ctu
arie
san
dPar
ks
Den
selo
nes
t
Op
enfo
rest
Scr
ub
Non
-fore
st
Wat
er-b
od
ies
Dis
tric
tbou
nd
ary
Sta
tebou
nd
ary
Inte
rnat
ion
albou
nd
ary
Source:
Fore
st C
ove
r of
Aru
nac
hal
Pra
des
h (
Lan
dsa
t Im
age)
Work
ing P
lan
s an
d F
ore
st M
anag
emen
t.

149Chapter 8 • DEVELOPMENT OF FOREST RESOURCES
initiated a number of eco-friendly and people-friendly
schemes/programmes involving the local people as given
below:
Ongoing Schemes/Programmes
State Sector
• Artificial plantation
• Aided natural regeneration
• Social forestry
• Joint forest management
• Apanaban
• Minimum needs programme (fuel wood plantation)
• Minor forest products
Central Sector
• Social forestry
• MFP i.e., medicinal plants
• Area oriented fuel wood and fodder project
• Integrated wasteland development project
• Operation soil watch
The State has also taken up initiative in following areas
• Bamboo, cane and medicinal plant development
• Establishment of Medicinal Plant Board
• Ban on unplanned timber and cane harvesting
• Emphasis on NTFPs
• Catchment area development and watershed
management system
• Establishment of wildlife board
• Establishment of biodiversity cell
Under Compensatory Afforestation Programme, out of
the stipulated area of 1796.166 ha for compensatory
afforestation, 1451.57 ha has been achieved.
Forest-based Industry
Prior to the intervention of the Supreme Court there
were 242 licensed saw and veneer mills in the State. All
of them came to a grinding halt and the State’s revenue
dropped considerably after the imposition of the Supreme
Court’s restriction.
Joint Forest Management
In Arunachal Pradesh, by and large, various tribal
communities have been utilising the forests as their own
common property resource (CPR) since time immemorial.
Realising the sentimental attachment of the local people
and the role and importance of involvement of local
communities in the protection and sustainable
development of forest resources through Apanaban and
anchal reserve schemes, government of Arunachal Pradesh
adopted Joint Forest Management (JFM) Resolution in
1997 for proper protection and regeneration of degraded
forest areas. The basic objective of JFM is to meet the
requirement of fuel, fodder, minor forest produce and
small timber of the tribal population, and to prevent at
the same time degradation of the forests. The JFM is
expected to reduce demand and supply imbalances by
increasing the productivity of forests. In this direction
Arunachal Forest Department has been able to achieve
significant progress by establishing 21 forest development
agencies (FDA) and 364 village forest management
committees (VFMC) in 21 territorial forest divisions of
the State. Under this scheme, an area of 21,416 hectare
has been covered under plantations generating 1,33,559
labour days. Efforts should be made to cover all the
villages of Arunachal Pradesh under JFM system for
sustainable development of the forest resources for socio-
economic upliftment of villagers and maintenance of
ecological balance.
Development of Non-timber Forest Products
Non-timber forest products (NTFP) play an important
role in the State, as described below:
(i) Bamboo: In Arunachal Pradesh, there are as many as
89 species recorded, some of which find multifarious
uses such as in the house construction, and in the
manufacturing of baskets, various utensils,
handicrafts, furniture, etc., besides its commercial use
in mat board. The total area under bamboo of the
State is 4,590 sq km (5.5 per cent of geographical
area). There is a potential for raising it to 8000 sq km.
Hence, Government of Arunachal Pradesh has come
up with a Bomboo Development Policy which is a
positive step for the growth of bamboo sector.
(ii) Cane: Arunachal Pradesh has about 18 species of
canes available at different climatic areas. It is an
important resource catering to the needs of the
furniture and handicraft industry. Keeping in view of
the scarcity of cane in many parts of the country and
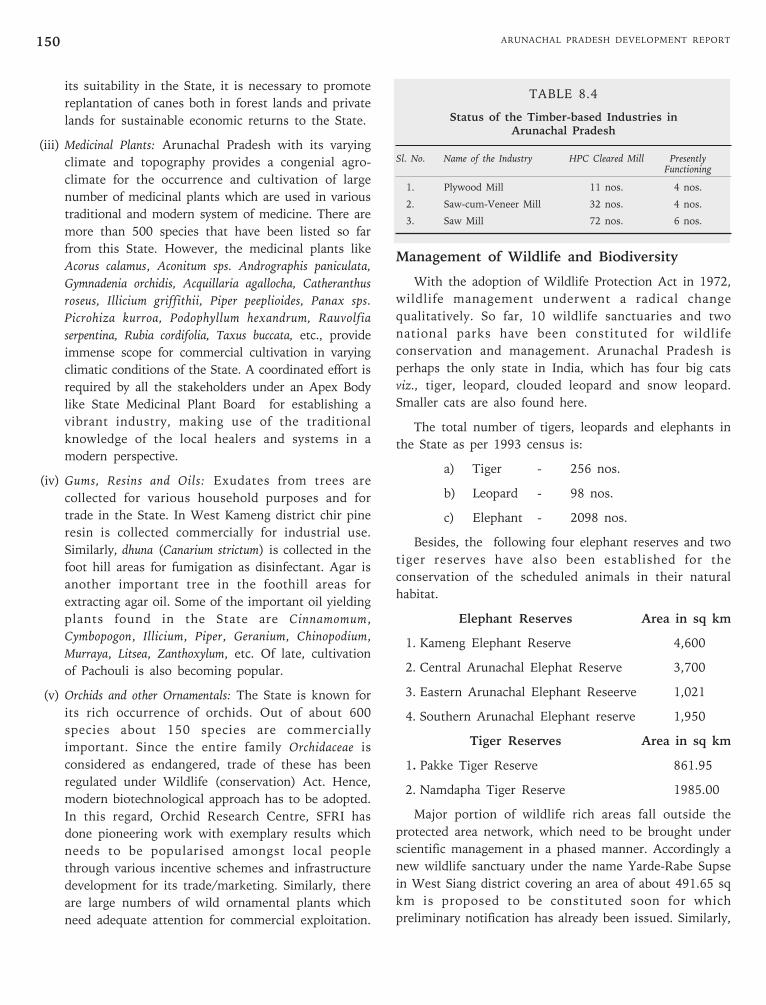
ARUNACHAL PRADESH DEVELOPMENT REPORT150
its suitability in the State, it is necessary to promote
replantation of canes both in forest lands and private
lands for sustainable economic returns to the State.
(iii) Medicinal Plants: Arunachal Pradesh with its varying
climate and topography provides a congenial agro-
climate for the occurrence and cultivation of large
number of medicinal plants which are used in various
traditional and modern system of medicine. There are
more than 500 species that have been listed so far
from this State. However, the medicinal plants like
Acorus calamus, Aconitum sps. Andrographis paniculata,
Gymnadenia orchidis, Acquillaria agallocha, Catheranthus
roseus, Illicium griffithii, Piper peeplioides, Panax sps.
Picrohiza kurroa, Podophyllum hexandrum, Rauvolfia
serpentina, Rubia cordifolia, Taxus buccata, etc., provide
immense scope for commercial cultivation in varying
climatic conditions of the State. A coordinated effort is
required by all the stakeholders under an Apex Body
like State Medicinal Plant Board for establishing a
vibrant industry, making use of the traditional
knowledge of the local healers and systems in a
modern perspective.
(iv) Gums, Resins and Oils: Exudates from trees are
collected for various household purposes and for
trade in the State. In West Kameng district chir pine
resin is collected commercially for industrial use.
Similarly, dhuna (Canarium strictum) is collected in the
foot hill areas for fumigation as disinfectant. Agar is
another important tree in the foothill areas for
extracting agar oil. Some of the important oil yielding
plants found in the State are Cinnamomum,
Cymbopogon, Illicium, Piper, Geranium, Chinopodium,
Murraya, Litsea, Zanthoxylum, etc. Of late, cultivation
of Pachouli is also becoming popular.
(v) Orchids and other Ornamentals: The State is known for
its rich occurrence of orchids. Out of about 600
species about 150 species are commercially
important. Since the entire family Orchidaceae is
considered as endangered, trade of these has been
regulated under Wildlife (conservation) Act. Hence,
modern biotechnological approach has to be adopted.
In this regard, Orchid Research Centre, SFRI has
done pioneering work with exemplary results which
needs to be popularised amongst local people
through various incentive schemes and infrastructure
development for its trade/marketing. Similarly, there
are large numbers of wild ornamental plants which
need adequate attention for commercial exploitation.
TABLE 8.4
Status of the Timber-based Industries inArunachal Pradesh
Sl. No. Name of the Industry HPC Cleared Mill PresentlyFunctioning
1. Plywood Mill 11 nos. 4 nos.
2. Saw-cum-Veneer Mill 32 nos. 4 nos.
3. Saw Mill 72 nos. 6 nos.
Management of Wildlife and Biodiversity
With the adoption of Wildlife Protection Act in 1972,
wildlife management underwent a radical change
qualitatively. So far, 10 wildlife sanctuaries and two
national parks have been constituted for wildlife
conservation and management. Arunachal Pradesh is
perhaps the only state in India, which has four big cats
viz., tiger, leopard, clouded leopard and snow leopard.
Smaller cats are also found here.
The total number of tigers, leopards and elephants in
the State as per 1993 census is:
a) Tiger - 256 nos.
b) Leopard - 98 nos.
c) Elephant - 2098 nos.
Besides, the following four elephant reserves and two
tiger reserves have also been established for the
conservation of the scheduled animals in their natural
habitat.
Elephant Reserves Area in sq km
1. Kameng Elephant Reserve 4,600
2. Central Arunachal Elephat Reserve 3,700
3. Eastern Arunachal Elephant Reseerve 1,021
4. Southern Arunachal Elephant reserve 1,950
Tiger Reserves Area in sq km
1. Pakke Tiger Reserve 861.95
2. Namdapha Tiger Reserve 1985.00
Major portion of wildlife rich areas fall outside the
protected area network, which need to be brought under
scientific management in a phased manner. Accordingly a
new wildlife sanctuary under the name Yarde-Rabe Supse
in West Siang district covering an area of about 491.65 sq
km is proposed to be constituted soon for which
preliminary notification has already been issued. Similarly,

151Chapter 8 • DEVELOPMENT OF FOREST RESOURCES
there is also a proposal under consideration of the Central
government to establish one biosphere reserve covering
about 5126 sq km in the State.
Wildlife Development Schemes
The developmental schemes on wildlife in the state
sector envisage protection of wildlife, upkeep and health
care of animals in zoos and strengthening of infrastructure
facilities. These schemes also envisage carrying out
census, conducting wildlife research and survey, making
bridle paths, promoting wildlife awareness, etc., in various
protected areas of the State. The following special
schemes in the Central Sector are also implemented in the
State:
- Project Tiger
- Project Elephant
- Eco-development around protected areas.
‘Project Tiger’ scheme has been operational in
Namdapha National Park since 1983 and ‘Project
Elephant’ in the foothill belt of the State within and
outside the protected areas. This scheme was launched in
1992 with the objective of stabilising the dwindling
elephant population through habitat improvement,
corridor linking and control of poaching.
Forest Research
Recognising the importance of R&D backup for
afforestation and forest management, the department
established the State Forest Research Institute in 1993.
This is the only institute of its kind in north-east India
and is catering to the needs of the State. However, the
technology developed here is applicable to other states as
well. The fruits of research have now been available to the
common people. The institute has field research stations
at different locations like Namsai, Chessa, Tipi, Dirang,
etc. Its main concentration is in the field of non-timber
forest produce covering bamboo, cane, medicinal plants,
broom grass and orchids. The different programmes of the
institute help in biodiversity management and
conservation.
Major Forestry, Wildlife andBiodiversity Related Issues
With rapid development and administrative expansion,
there is a considerable change in the lifestyle and the
consequent influence on the flora and fauna of the State.
Some of the important factors that have led to
deforestation and loss in wildlife and biodiversity are as
follows:
1. Agricultural expansion/jhumming;
2. Logging and timber extraction for various wood-
based industries;
3. Road and building construction;
4. Construction of dams;
5. Urbanisation and new settlements;
6. Unscientific method of harvesting bio-resources;
7. Increasing use of high yielding varieties of crops
replacing traditional ones;
8. Increasing population.
The State is now at the crossroads of tradition and
modernisation. There is an increasing pressure on land
and natural resources and as a result forests are getting
depleted. At the same time the forest and wildlife
management suffers from some specific constraints as
follows:
• Poor infrastructure and communication,
• Inadequate manpower for protection,
• Inadequate resource and fund supports,
• Forest fires and other natural calamities,
• Lack of awareness among people about forestry
schemes and peoples participation,
• Unexpected conflicts with encroachers and illegal
settlements.
Forest Laws
Arunachal Pradesh has adopted the Assam Forest
Regulation Act 1891 which has been amended from time
to time keeping in view the objective of sustainable
development of forests through a participatory mechanism
of the local people. The following are the acts and
regulations in forestry and wildlife sector:
Acts and Regulations in Forestry and Wildlife Sector
State Enactments
• Assam Forests Regulation, 1891
• Anchal Forest Reserve (Constitution and
management) Act, 1975
• Village Forest Reserve (Constitution and
management) Act, 1978
• Arunachal Timber Regulation Act, 2000
• Jhum Land Regulation, 1948
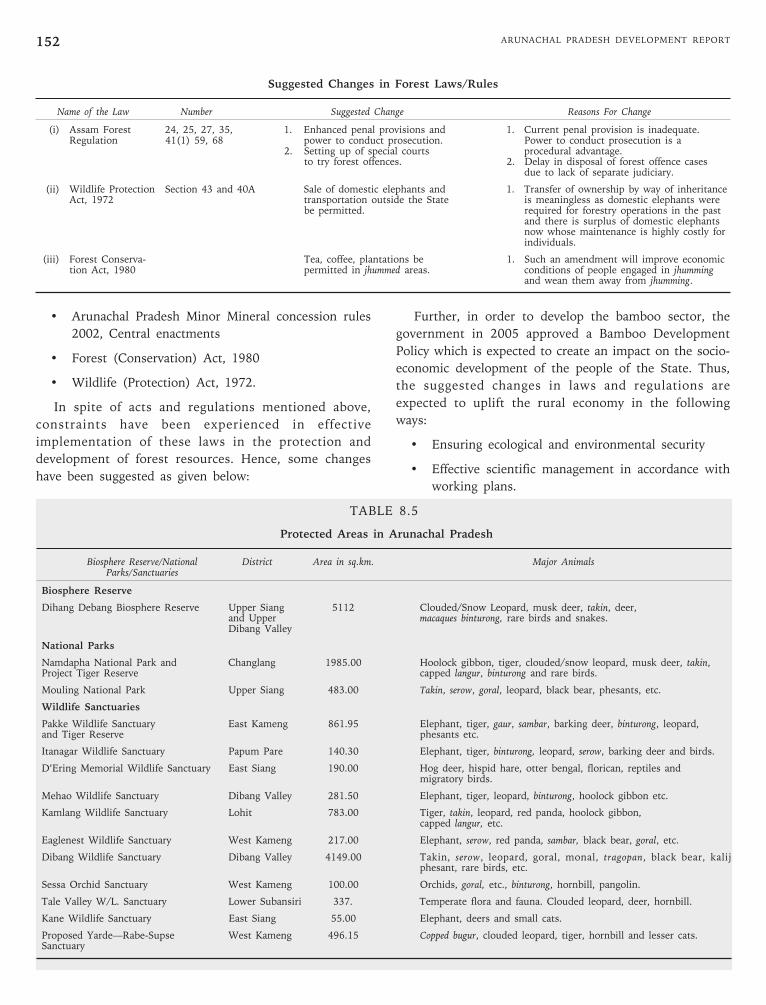
ARUNACHAL PRADESH DEVELOPMENT REPORT152
• Arunachal Pradesh Minor Mineral concession rules
2002, Central enactments
• Forest (Conservation) Act, 1980
• Wildlife (Protection) Act, 1972.
In spite of acts and regulations mentioned above,
constraints have been experienced in effective
implementation of these laws in the protection and
development of forest resources. Hence, some changes
have been suggested as given below:
Further, in order to develop the bamboo sector, the
government in 2005 approved a Bamboo Development
Policy which is expected to create an impact on the socio-
economic development of the people of the State. Thus,
the suggested changes in laws and regulations are
expected to uplift the rural economy in the following
ways:
• Ensuring ecological and environmental security
• Effective scientific management in accordance with
working plans.
TABLE 8.5
Protected Areas in Arunachal Pradesh
Biosphere Reserve/National District Area in sq.km. Major AnimalsParks/Sanctuaries
Biosphere Reserve
Dihang Debang Biosphere Reserve Upper Siang 5112 Clouded/Snow Leopard, musk deer, takin, deer,and Upper macaques binturong, rare birds and snakes.Dibang Valley
National Parks
Namdapha National Park and Changlang 1985.00 Hoolock gibbon, tiger, clouded/snow leopard, musk deer, takin,Project Tiger Reserve capped langur, binturong and rare birds.
Mouling National Park Upper Siang 483.00 Takin, serow, goral, leopard, black bear, phesants, etc.
Wildlife Sanctuaries
Pakke Wildlife Sanctuary East Kameng 861.95 Elephant, tiger, gaur, sambar, barking deer, binturong, leopard,and Tiger Reserve phesants etc.
Itanagar Wildlife Sanctuary Papum Pare 140.30 Elephant, tiger, binturong, leopard, serow, barking deer and birds.
D’Ering Memorial Wildlife Sanctuary East Siang 190.00 Hog deer, hispid hare, otter bengal, florican, reptiles andmigratory birds.
Mehao Wildlife Sanctuary Dibang Valley 281.50 Elephant, tiger, leopard, binturong, hoolock gibbon etc.
Kamlang Wildlife Sanctuary Lohit 783.00 Tiger, takin, leopard, red panda, hoolock gibbon,capped langur, etc.
Eaglenest Wildlife Sanctuary West Kameng 217.00 Elephant, serow, red panda, sambar, black bear, goral, etc.
Dibang Wildlife Sanctuary Dibang Valley 4149.00 Takin, serow, leopard, goral, monal, tragopan, black bear, kalijphesant, rare birds, etc.
Sessa Orchid Sanctuary West Kameng 100.00 Orchids, goral, etc., binturong, hornbill, pangolin.
Tale Valley W/L. Sanctuary Lower Subansiri 337. Temperate flora and fauna. Clouded leopard, deer, hornbill.
Kane Wildlife Sanctuary East Siang 55.00 Elephant, deers and small cats.
Proposed Yarde—Rabe-Supse West Kameng 496.15 Copped bugur, clouded leopard, tiger, hornbill and lesser cats.Sanctuary
Suggested Changes in Forest Laws/Rules
Name of the Law Number Suggested Change Reasons For Change
(i) Assam Forest 24, 25, 27, 35, 1. Enhanced penal provisions and 1. Current penal provision is inadequate.Regulation 41(1) 59, 68 power to conduct prosecution. Power to conduct prosecution is a
2. Setting up of special courts procedural advantage.to try forest offences. 2. Delay in disposal of forest offence cases
due to lack of separate judiciary.
(ii) Wildlife Protection Section 43 and 40A Sale of domestic elephants and 1. Transfer of ownership by way of inheritanceAct, 1972 transportation outside the State is meaningless as domestic elephants were
be permitted. required for forestry operations in the pastand there is surplus of domestic elephantsnow whose maintenance is highly costly forindividuals.
(iii) Forest Conserva- Tea, coffee, plantations be 1. Such an amendment will improve economiction Act, 1980 permitted in jhummed areas. conditions of people engaged in jhumming
and wean them away from jhumming.

153Chapter 8 • DEVELOPMENT OF FOREST RESOURCES
• Flow of tangible and intangible economic benefits
to the people.
• Ensuring people’s participation especially women in
protection and conservation of forests.
• Ensuring basic livelihood needs of the local tribal
population.
• Dovetailing traditional knowledge and modern
scientific management for conservation of
biodiversity and sustainable development.
Future Vision
In order to achieve conservation and sustainable
development of forest resources, the State requires a
forest policy of its own to address the multifarious needs
and aspirations of the people of the State. These
suggested measures are as follows:
• Increase in the investment in forestry sector.
• Scientific management of NTFPs like bamboo, cane,
medicinal plants, orchids, etc., and establishing
strategic market linkages with private sector.
• Strengthen protection mechanism and legal
framework.
• Conservation and development of wildlife and
biodiversity.
• Involve indigenous communities especially women
for conservation, protection and sustainable
development through JFM/local systems for utilising
the traditional wisdom and ethos of conservation.
• Ensure ways and means for sustainable utilisation
of forestry resources for poverty alleviation,
environmental stability and ecological security.
• Promote eco-tourism.
• Initiation for carbon trading in the line of the
State’s interest.
Conclusion
There is scope for scientific management to improve
the productivity and sustainable utilisation of vast forest
resources in the State. Various projects and programmes
are being implemented in the State. In the past, the
state’s economy depended to some extent on forest. This
dependency has showed a decline recently owing to the
structural transformation of the economy. However,
economic transformation and development has led to the
loss of biodiversity and deforestation. Now serious
attempts are being made to counter this by involving the
local committee in Joint Forest Management. Alternatives
are being explored and the forest management is
reoriented towards NTFP and sustainable utilisation
without compromising on conservation issues. A long-
term perspective plan is being evolved in forestry,
research and wildlife sectors. With these expected shifts
in policies and plans the State is poised for a better
environment and sustainable development.

ARUNACHAL PRADESH DEVELOPMENT REPORT154
APPENDIX 8.1
Carbon Financing in Arunachal Pradesh: Pros and Cons
Carbon trading is a contract-based transaction of carbon dioxide equivalent emission reductions (t CO2 e) in compliance with
the regulations of Kyoto protocol. Two common methods of carbon trading are:
• Allowance-based transactions where the buyer purchases emission allowances from regulators under Cap-and-trade regime.
• Project-based carbon trading which refers to the purchase of emission credits from a project with a valid and authentic
track record of emission reduction.
There was a three-fold increase in project-based carbon trading (374t CO2 e) in 2006 as compared to the traded volume in
the previous year. About 79 million tonnes of emission reduction contracts were signed by the end of March 2006 exhibiting a
bullish trend in the carbon trading market. The prices for certified emission reductions (CERs) also climbed from an average of
USD 5.15 in 2004 to 11.56 in the first three months of March 2006.
In view of the profitable trend in the global carbon market, there is a considerable scope for participation of Arunachal
Pradesh in global carbon transactions. In order to reap the optimum benefits of carbon trading, following measures could be
incorporated in the state level planning:
• A proper rapport with World Bank and state government should be established to evolve the strategy for future carbon
trading.
• A project-based approach for carbon trading should be adopted ensuring an active participation from government and non-
governmental organisations and local populace in forest regeneration.
• In the first phase, the projects based on forest regeneration on wastelands covering a huge area may be submitted for
carbon financing.
• The forest regeneration should be initiated after a careful selection of the plant species and a consortium of plant species
with high carbon sequestration rate e.g., Mesua ferrea, Dipterocarpus microcapsule, Shorea assamica, etc., shall be propagated for
the regeneration purpose.
Courtesy: Dr. S.P. Shukla, Department of Botany, Rajiv Gandhi University, Rono Hills, Itanagar, Arunachal Pradesh.

Introduction
Arunachal Pradesh, enjoys a geo-environmentally
unique, sensitive and strategic location at national and
global scale. The State has distinct topography, monsoon
climatic regime and advantage of variation of altitude
along with rich diversity in environmental conditions,
flora, fauna and equally diverse cultures in human space.
Land cover
The physical surface of the earth, including various
combinations of vegetation types, soils, exposed rocks,
water bodies as well as anthropogenic elements such as
agriculture and built environments. Land cover classes
can generally be discriminated by characteristic patterns
using remote sensing data and technique.
Land use
Land use refers to the domain of anthropocentric
utilisation of land. It is studied with a management
objective. Some land uses, such as agriculture, have a
characteristic land cover pattern. These generally appear
in land cover classifications. Other land uses, such as
nature conservation, are not readily discriminated by a
characteristic land cover pattern.
Historically, the relationship of humans with the
environment has evolved, although often without feeling
of necessity, through—modification, control, exploitation,
management and restoration—a full circle and Arunachal
Pradesh is no exception even if the scale of this pattern of
relationship is small. Land as a resource has been
primarily colonised by human beings for their sustenance
and as a consequence they have changed the land cover
pattern to a distinct land use pattern.
As the relationship between human beings and
environment changes direction over time, understanding
of environment vis-à-vis the land cover/land use pattern
provides an insight into the socio-cultural fabric, socio-
ARUN
ACH
AL PR
ADESH
economic endurance, and vision for future path for
progress of the community. Some of the benefits of land
cover/land use inventories and optimisation procedures
are:
• Generation of timely and reliable information base
for effective land use management (Gautam et al.,
1994),
• Increasing in the production of cereals, pulses and
oil seeds,
• Increasing in the fodder production to support the
livestock system leading to higher production of
milk, meat, eggs, etc.,
• Saving land from degradation and bringing more
areas under cultivation,
• Increasing production of vegetables and fruits,
• Improving the economic and nutrition standards of
the people,
• Improving the environmental conditions all over the
study area.
Land is the most important primary natural resource
that is characterised by soil, water and components of
ecosystem. An assessment of the present land cover and
the other controlling factors like altitude, slope, rainfall,
dissection of land by drainage, land capability, etc., helps
in identifying the areas of potentialities and
vulnerabilities. This State is the least densely populated
area in the country. Its unique geo-environmental set-up
has facilitated such uniqueness. Arunachal Pradesh is a
biological hotspot, but it has a very delicate and fragile
ecosystem which evolves around a symbiotic relation
between nature and human. A careful assessment and
exploration of potential areas for planned development
needs a careful study of the characteristics of land.
Chapter 9
Land Use and Potentials

ARUNACHAL PRADESH DEVELOPMENT REPORT156
Altitude
As a part of Himalayan Orogenic Belt, traversing
around 700 km with altitude ranging from about 150m to
6000m, Arunachal Pradesh poses a challenge for proper
utilisation of each and every part. Figure 9.1 shows
altitude zones of Arunachal Pradesh and presents an
account of the inaccessibility as a challenge for potential
use of land. Altitude and relative relief are two dominant
factors that define complexity of terrain in terms of solar
illumination, slope and aspect, and thus control the land
cover and land use type of the State. Altitude information
in the form of Digital Elevation Model (DEM) is now
being integrated with the remote sensing data for
vegetation discrimination and land cover—land use
inventory (Singh et al., 2005).
High altitude terrain of Arunachal Pradesh is beneficial
in maintaining a high endowment of natural resources but
simultaneously it acts as a retarding agent and hinders
development. As there is lack of data on this terrain
parameter, only about 80 per cent area (i.e., 66320 km2)
has been studied for this exercise (Table 9.1). Out of this
more than 65 per cent area is highly elevated being 1000
metres above the mean sea level, a condition which reduces
the potential of land for any intended use and increases the
cost of developmental programmes. Districts like Tawang
have no land below 1000m; Dibang Valley and Anjaw have
no low altitude area and major rivers have carved out large
and wide valleys. These areas are also characterised by high
dissection of land. Areas close to international border,
which are excluded for this parameter, have extremely high
altitude and are inaccessible.
Slope
Slope is the derivative of altitude, an inclined surface
over which all the bio-physical activities take place.
Arunachal Pradesh located on the young folded mountain
of Himalayas, which is still growing tall due to tectonics
and simultaneously is being eroded due to denuding
agents of running water and glacier. This process has
produced a marvelous geo-physical complex as well as a
forbidding landscape for habitation and use of Kurung
Kumey, Upper Subansiri, Upper Siang, Dibang Valley and
Anjaw districts are covered with high slope values and are
also identified as the most underprivileged districts of
Arunachal Pradesh (Government of Arunachal Pradesh,
2005). Slope has a direct bearing on the cost of building
infrastructure and its maintenance. Future expansion of
agriculture in a predominantly agrarian state of Arunachal
TABLE 9.1
District-wise Altitude Class
Altitude Class (Area in sq Km) (Data available area only)
Altitude Class Very Low Low Mid Level Upper Level High Altitude Mountainous Alpine TotalDistrict <200m 200-500m 500-1000m 1000-2000m 2000-3000m 3000-4000m >4000m
Tawang 0 0 0 175 400 610 638 1823
West Kameng 21 222 534 1370 1820 618 380 4965
East Kameng 165 554 1477 2179 1188 340 107 6009
Kurung Kurmey 0 15 771 2542 1289 302 56 4976
Papum Pare 358 627 587 1430 498 58 0 3557
Lower Subansiri 23 93 720 1688 298 0 0 2821
Upper Subansiri 7 147 1194 1541 1325 533 106 4852
West Siang 134 878 2221 1933 1135 617 16 6933
Upper Siang 16 188 728 2178 926 423 6 4465
East Siang 938 896 958 1006 91 0 0 3889
Dibang Valley 0 0 346 1092 2305 805 27 4575
Lower Dibang Valley 576 612 545 827 776 264 15 3614
Lohit 1068 1120 489 726 523 165 0 4092
Anjaw 0 0 225 1021 1201 1045 323 3815
Changlang 448 981 1312 1596 484 215 4 5039
Tirap 108 525 647 640 62 0 0 1982
Total 3861 6857 12753 21943 14320 5994 1674 67405
Percentage 5.73 10.17 18.92 32.55 21.25 8.89 2.49 100.00
Source: Computed on the basis of SoI toposheets.

157Chapter 9 •
LAND USE AND POTENTIALS
FIGURE 9.1
Altitude Zones
FIGURE 9.2
Rainfall

159Chapter 9 •
LAND USE AND POTENTIALS
TABLE 9.2
District-wise Slope Category
Area (sq Km) in Slope Class
Slope/Class Districts Plain<5° Moderate5-10° Steep10-20° Very Steep20-45° Hanging>45° Total
Tawang 111 116 573 973 51 1823
West Kameng 370 476 1896 2187 36 4965
East Kameng 827 456 2333 2351 42 6009
Kurung Kurmey 309 268 1563 2738 99 4976
Papum Pare 701 493 1432 929 3 3557
Lower Subansiri 411 281 1287 834 8 2821
Upper Subansiri 403 324 1175 2801 151 4852
West Siang 1003 663 2257 2932 79 6933
Upper Siang 480 359 782 2744 101 4465
East Siang 1469 413 802 1190 17 3889
Dibang Valley 597 407 864 2594 113 4575
L Dibang Valley 1374 237 336 1552 115 3614
Lohit 2187 266 493 1102 43 4092
Anjaw 296 242 514 2525 239 3815
Changlang 1525 593 1722 1163 36 5039
Tirap 373 368 713 527 2 1982
Grand Total 12436 5962 18742 29142 1135 67415
Percentage 18.5 8.8 27.8 43.2 1.7 100
Source: Computed on the basis of SoI toposheets.
Pradesh is also affected by non-availability of land for
settled cultivation. Lohit, Changlang, East Siang, Lower
Dibang Valley and West Siang districts have comparatively
large proportion of plain land (Table 9.2). But extensive
tracts of mighty rivers coupled with high rainfall account
for loss of land through soil erosion. Hence, these areas
need to be put under multiple cropping of cereals and
vegetables and mixed farming to optimise utilisation of
available land.
Rainfall
Precipitation, main agent of land sculpturing and life
support resource for organisms, is seasonal and follows
the dynamics of monsoon in the State. A strong
seasonality and high amplitude orography control
vegetation, and climax variety maintain a rich biodiversity
in this part of the Himalayas. Rainfall ranges from below
100cm per year in Tawang district to over 500cm per
annum in Siang and Lower Dibang Valley districts.
Hydrological resource endowment for this State is high
from power resource perspective, but areas of high rainfall
have become permanent flood hazard zone and
susceptible to crop failure and loss of arable land. Another
effect of such high rainfall is channel migration and
damage to infrastructure.
A very little amount of plain land available in
Arunachal Pradesh is transformed to cultivable waste by
the floods. The other part of the extreme scenario is the
low precipitation areas of higher Himalayas where the
high elevation is coupled with cold climate. So estimation
of land resources requires a deep understanding of each
and every land and climate parameter, and aims to resolve
for a best agro-climatic area for each intended crop in the
State. Papum Pare, Lower Subansiri, Lohit, Changlang and
Tirap districts are in a rainfall regime that is appropriate
for a wide range of cereals, pulses and horticulture. Other
districts are either rain deficient or excess where only a
few crops may be cultivated.
Generic Name Conventional Equivalence
Ustalfs High base status red loamy, red sandy andalluvial soil.
Aqualfs High base status soil (hydromorphic).
Udalfs High base status soils of humid regions.
Ochrepts Shallow black, brown and alluvial soils ofnorthern region.
Aquepts Brown soil hyperthermic.
Orthents Recently formed soils.
Aquents Recently formed hydromorphic soil.
Fluvents Alluvial soils.
Umbrepts Red and yellow forest soil.

ARUNACHAL PRADESH DEVELOPMENT REPORT160
Soil
Soils of Arunachal Pradesh are rich in base status due
to high moisture content, thick leaf litter and higher
quantum of rainfall and leaching of base metals. Soils are
well drained owing to steep slope but are coarse textured
and less fertile which limit its potential in agriculture and
commercial plantations. Soil types in Arunachal Pradesh
mostly belong to Entisol Order, which primarily owe its
genesis to i) Unweatherable parent materials—sand, iron
oxide, aluminum oxide, kaolinite clay, ii) Erosion—
common on shoulder slopes; other kinds also are
important, iii) Deposition—continuous, repeated
deposition of new parent materials by water, wind,
colluvium, mudflows and other means, iv) Flooding or
saturation, v) Cold climate not sufficiently cold in winter
for permafrost, vi) Shallow to bedrock being
“unweatherable” rock such as quartsite or ironstone.
NDVI
NDVI is one of the most successful of many attempts
to simply and quickly identify vegetated areas and their
“condition”, and it remains the most well-known and
used index to detect live green plant canopies in
multispectral remote sensing data. The index is derived
from a simple algorithm of: (near infrared band – visible
band)/(near infrared band + visible band). As a result,
vigorously growing healthy vegetation has low red-light
reflectance and high near-infrared reflectance, and hence,
high NDVI values. This relatively simple algorithm
produces output values in the range of -1.0 to 1.0. NDVI
values less than zero indicate non-vegetated features such
as barren surfaces (rock and soil) and water, snow, ice,
and clouds. Large chunks of area in Arunachal Pradesh
thereby have no prerequisite capability for plant growth;
on the other hand luxuriant forest covered areas cannot
be sacrificed for expansion of agriculture. Hence, limited
areas are available for diversification and intensification of
agriculture as envisaged by the Government of Arunachal
Pradesh (2007).
Negative NDVI areas have been isolated as these are
the agriculturally inoperable areas like barren slopes and
snow capped areas. On the other side of the spectrum, the
high NDVI areas are luxuriant forest areas and have been
excluded. So less area is left for agriculture, horticulture,
plantation crops and other development programme.
Remotely sensed data are the recorded response of
land surface characteristics including natural and artificial
cover. This digital information is processed (digital image
processing: DIP) either through cluster analysis or
through supervised classification using known spatial
information base as training set wherein each pixel (i.e.,
23.5m × 23.5m ground area of LISS 3 sensor of IRS) is
treated as one unit for computation. The other method of
classification is through screen digitisation/visual
interpretation, wherein delimitation of any land cover unit
is delineated by the user. Both the methods have their
own advantages, however, for Arunachal Pradesh
supervised classification has been preferred as contextual
spatial information carries more meaning to the
interpreted land cover/land use map.
FIGURE 9.4
NDVI Class versus Area
0
5000
10000
15000
20000
25000
30000
35000
40000
Negative Low Medium High VeryHigh
NDVI Class
Are
a (s
q K
m)
Land Cover
Classification criteria for delineating land parcels are
standardised since the successful attempt of Anderson
(1971), Anderson et al. (1972), which are referred to as
USGS or Anderson classification. In this, a four-level
classification scheme is suggested. Level I information
caters to the requirement at state level planning, Level II
for statewide to regional level planning, Level III for
regional to local level planning, and Level IV for local to
micro level planning. National Remote Sensing Agency
(NRSA), Hyderabad developed a classification scheme for
Indian context (NRSA, 1990) which is used by several user
departments including Planning Commission, Government
of India and has been demonstrated efficiently by Rao et al.
(1991, 2002). However, Arunachal Himalaya does not
provide a homogeneous and constraint free terrain for
implementation of an ideal theoretical model.
Eleven IRS 1D LISS III Satellite images with 23.5m
resolution covering Arunachal Pradesh (for an area of
80659 km2) has been classified using supervisied
classification Digital Image Processing (DIP) technique.
Out of the area processed for land cover: 37.61 per cent
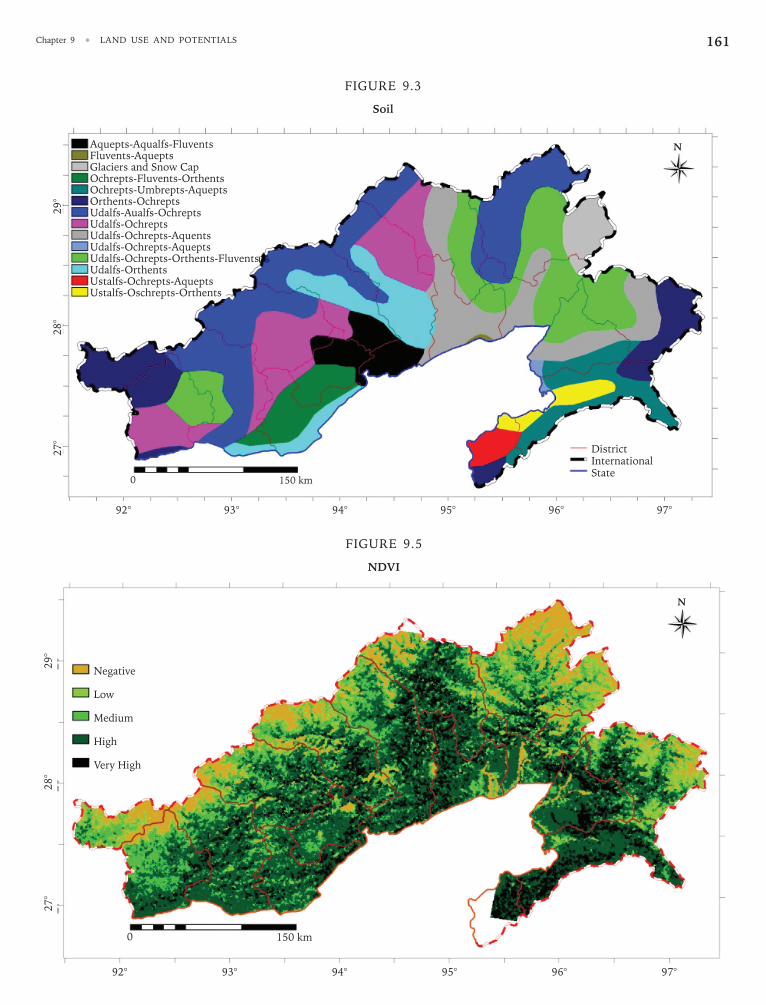
161Chapter 9 •
LAND USE AND POTENTIALS
FIGURE 9.5
NDVI
FIGURE 9.3
Soil
Aquepts-Aqualfs-FluventsFluvents-AqueptsGlaciers and Snow CapOchrepts-Fluvents-OrthentsOchrepts-Umbrepts-AqueptsOrthents-OchreptsUdalfs-Aualfs-OchreptsUdalfs-OchreptsUdalfs-Ochrepts-AquentsUdalfs-Ochrepts-AqueptsUdalfs-Ochrepts-Orthents-FluventsUdalfs-OrthentsUstalfs-Ochrepts-AqueptsUstalfs-Oschrepts-Orthents
0 150 km
DistrictInternationalState
92° 93° 94° 95° 96° 97°
27°
28°
29°
N
Negative
Low
Medium
High
Very High
0 150 km
92° 93° 94° 95° 96° 97°
27°
28°
29°
N

163Chapter 9 •
LAND USE AND POTENTIALS
area is under dense forest followed by shadow zone
(27.13 per cent) and cultivated area is only 0.34 per cent.
Land Potential
Potential of any parcel of land is dependent on the
above mentioned factors coupled with financial strength of
the State and needs of the people. As of Arunachal
Pradesh, the severe challenge posed by the adverse
controlling factors can be mitigated with an alternative
eco-friendly and sustainable course of action. The avenues
are eco-tourism, harnessing hydro-power potential and
limited agriculture-horticulture-plantation based on site
specific investigations and recommendations. Different
geophysical spatial information layers have been prepared
viz., land cover, NDVI, digital elevation model (DEM),
slope, aspect, rainfall, soil; and on the basis of it, an area
of 66320 km2 has been modeled into different suitability
classes. According to these suitability classes (Table 9.3)
“most suitable class” is appropriate for cultivation of
paddy and out of these areas high rainfall areas are
suitable for jute that belongs to hydrophyte group. The
areas of suitable category are appropriate for
intensification of existing crops, such as paddy, vegetables,
and wheat in colder areas of the State. Moderately suitable
areas are target areas for millet and maize, and other
important crops of the State. Horticulture, especially, cash
crops have a high prospect in augmenting economic
standing of the people of Arunachal Pradesh. There is a
need for diversification as per macroclimatic conditions for
a number of varieties of horticulture practiced in
Arunachal Pradesh, viz., orange, banana, apple, pineapple,
kiwi, etc. Identification of area for each specific plant is
possible with parametric combination of different
geospatial layers at a finer resolution.
FIGURE 9.6
Landuse versus Area
0
5000
10000
15000
20000
25000
30000
35000
Land Use
Wat
er b
od
y
Clo
ud
/Sn
ow
San
d/R
iver
bed
Deg
rad
ed
Lan
d
Sh
ado
wZ
on
e
Op
en F
ore
st
Den
seF
ore
st
Sh
rub
Lan
d
Cu
ltiv
ated
lan
d
Are
a sq
km
TABLE 9.3
District-wise Land Potential Area
Land potential in Arunachal Pradesh (Area is in km2)
Districts Unsuitable Percentage Least Percentage Moderately Percentage Suitable Percentage Most Percentage GrandSuitable Suitable Suitable Total
Tawang 1331 73.70 283 15.65 153 8.46 36 1.99 4 0.19 1806
West Kameng 2747 55.35 788 15.88 629 12.67 568 11.44 231 4.66 4963
East Kameng 2949 49.09 813 13.53 823 13.70 787 13.10 636 10.58 6006
Kurung Kurmey 2450 49.24 972 19.53 878 17.64 536 10.77 141 2.83 4976
Papum Pare 1898 53.40 324 9.12 335 9.42 426 11.97 572 16.09 3554
Lower Subansiri 1542 54.65 243 8.60 368 13.04 405 14.35 264 9.36 2821
Upper Subansiri 3065 63.17 709 14.61 562 11.59 376 7.74 141 2.90 4852
West Siang 4488 64.76 506 7.30 590 8.52 723 10.44 623 8.98 6929
Upper Siang 2749 61.57 385 8.62 524 11.73 560 12.53 248 5.55 4465
East Siang 2325 59.84 85 2.18 197 5.07 319 8.21 959 24.70 3884
Dibang Valley 2168 47.38 587 12.84 582 12.71 881 19.26 357 7.81 4575
L Dibang Valley 2043 56.54 229 6.33 244 6.75 397 11.00 700 19.38 3612
Lohit 2437 59.55 203 4.96 135 3.30 144 3.52 1173 28.67 4091
Anjaw 2770 72.63 371 9.72 340 8.91 259 6.78 75 1.95 3813
Changlang 4080 81.05 178 3.53 202 4.00 207 4.11 368 7.31 5034
Tirap 791 84.24 9 0.96 14 1.46 25 2.61 101 10.73 939
Grand Total 39830 60.06 6682 10.07 6573 9.91 6646 10.02 6591 9.94 66320
Source: Computed on the basis of land and land cover parameters.

ARUNACHAL PRADESH DEVELOPMENT REPORT164
0
20000
40000
60000
80000
100000
120000
140000
2003-04 2002-03 2001-02 2000-01 1999-2000
Rice Maize Millet Wheat Pulses Oil Seed
Potato Ginger Turmeric Chillies Sugarcane Vegetables
Area i
n h
ectare
FIGURE 9.9
Cropped Area—Important Crops
Food habit, difficulties in agricultural modernisation
and lack of entrepreneurship for commercial or cash crops
have also derailed the search of areas of potential land for
diversification of agriculture to plantation and
horticulture. However, private initiatives for commercial
plantation of tea and fruits are coming up in both the
eastern and western districts in a limited way. The
Government has recorded production of horticultural
products for 2003-04 for apple, walnut, kiwi, citrus,
pineapple, banana in its survey with cropped area (in
hectares) of 7852, 3054, 173, 21864, 7849 and 4858 and
production of 9288, 56, 60, 26716, 35598 and 14526 MT,
respectively.
Rice is the staple food of Arunachal Pradesh and the
majority of the farmers practice subsistence type of
agriculture, primarily in the form of shifting cultivation. A
specific model has been followed and geospatially
integrated through GIS technique with a slope value of
≤20°; 100cm ≤ rainfall ≤ 400cm; all soil types of Arunachal
Pradesh except areas under glacier and snow caps,
unsorted and recently formed soils; and areas below
2000m elevation (as it affects accessibility and
temperature condition in the region). The map thus
derived shows potential areas for rice cultivation in the
State.
Wheat is cultivated in very limited areas of Arunachal
Pradesh except Tawang and West Siang where agro-
climatic condition is favourable. East Siang and Lohit have
also wheat cropped areas; however, those areas are agro-
climatically less suitable for wheat owing to high annual
rainfall i.e., more than 250cm. In comparison to its
present cultivated area, West Kameng has larger potential
area and its full potential may be harnessed through
extension services, incentives for encouraging wheat
cultivation and creation of collection centres, etc.
Potential areas for millet, apple and ginger have been
modeled as per their agro-climatic condition and district-
wise potential areas have been given in Table 9.4. It has
been modeled at a spatial resolution of 500m (i.e., a plot
of 500m × 500m) is good enough for formulation of
schemes and policy promoting cultivation of specific crops
in the potential area at district level implementation
programme; however exact small target area at village
level i.e., at micro level may be selected on the basis of
finer resolution map (e.g., 100m), location of village and
accessibility to area surrounding village centres and terrain
specific cultivation techniques.
For any other utilisation of land, a classification of land
based on altitude and slope has been carried out to act as
a guideline for any future course of action in
infrastructure development, agriculture, horticulture, etc.
(Table 9.5).

165Chapter 9 •
LAND USE AND POTENTIALS
FIGURE 9.8
Agriculture Potential Area
FIGURE 9.7
Landcover

167Chapter 9 •
LAND USE AND POTENTIALS
TABLE 9.4
Potential Area (in km2) for Agriculture for Specific Crops
District Rice Wheat Millet Apple Ginger
Tawang 0 20 305 134 0
West Kameng 676 277 718 604 80
East Kameng 1784 181 681 297 388
Kurung Kurmey 786 166 919 226 173
Papum Pare 1415 71 231 130 389
Upper Subansiri 897 31 284 204 283
Lower Subansiri 940 135 969 0 366
West Siang 2347 103 688 293 530
Upper Siang 859 51 446 29 440
East Siang 1054 4 36 0 198
Dibang Valley 179 112 759 0 240
L Dibang Valley 393 0 32 0 155
Lohit 2211 0 127 0 126
Anjaw 191 69 409 0 123
Changlang 2961 49 93 0 167
Tirap 640 0 9 0 22
Source: Computed on the basis of agro-climatic parameters derived from SoI toposheets, NATMO Climate map, LISS III Satellite images.
TABLE 9.5
Maximum Area available at District Level for Development Planning Altitude andSlope Classes Explained in Tables 9.1 and 9.2
Altitude Low vs. Low vs. Mid Level Mid Level Upper Level Upper Level High Alt High Alt Total Area Percentage Area ofvs. Slope Mod Plain vs. Mod vs. Plain vs. Mod vs. Plain vs. Mod vs. Plain DistrictDistricts Calculated
Tawang 0.0 0.0 0.0 0.0 10.3 11.5 15.5 13.3 50.5 2.8 1822.5
W Kameng 84.0 38.0 70.8 57.5 83.0 88.8 153.3 93.5 668.8 13.5 4965.3
E Kameng 105.5 237.8 100.0 183.0 131.8 168.8 76.0 75.0 1077.8 17.9 6009.0
Kurung Kurmey 1.3 1.8 46.5 96.3 147.3 142.3 55.3 56.3 546.8 11.0 4975.5
Papum Pare 190.3 187.8 65.5 60.8 115.3 160.0 37.3 45.5 862.3 24.2 3557.0
Upper Subansiri 28.3 40.3 88.0 202.3 99.3 76.0 70.8 50.8 655.5 13.5 4852.3
Lower Subansiri 2.5 18.0 66.3 100.3 178.0 241.5 31.8 42.3 680.5 24.1 2821.0
West Siang 139.3 327.5 238.5 355.3 130.0 169.3 92.3 67.3 1519.3 21.9 6932.5
Upper Siang 18.3 59.3 67.8 128.5 183.8 206.0 49.5 47.3 760.3 17.0 4464.5
East Siang 161.0 433.5 116.8 149.3 81.3 99.3 4.0 9.5 1054.5 27.1 3889.3
Dibang Valley 0.0 0.0 17.8 77.8 79.0 128.0 234.8 274.3 811.5 17.7 4574.8
L Dibang Valley 46.0 531.5 71.8 102.3 59.8 71.8 43.0 62.5 988.5 27.4 3613.5
Lohit 104.0 963.5 75.0 81.3 47.3 38.0 29.8 22.0 1360.8 33.3 4091.5
Anjaw 0.0 0.0 12.8 41.8 61.8 53.8 61.3 40.5 271.8 7.1 3814.8
Changlang 231.0 523.3 169.0 275.0 132.5 250.8 34.8 31.3 1647.5 32.7 5039.3
Tirap 174.0 160.8 109.0 101.0 60.3 34.0 5.5 7.0 651.5 32.9 1982.3
Grand Total 1285.3 3522.8 1315.3 2012.0 1600.3 1939.5 994.5 938.0 13607.5 20.2 67404.8
Source: Key to Altitude category and Slope classes are given in Table Nos. 9.1 and 9.2.

Introduction
There is an increasing realisation that provision of
certain social and physical infrastructural facilities is the
key to improving the level of living as well as the quality
of life and to eradicating poverty and hunger.
By providing the facilities the economic condition of
the people can be improved. It is to be borne in mind that
an evaluation of development in the basic services in rural
Arunachal Pradesh is severely hampered by non-
availability of data. This chapter aims at an assessment of
rural development in terms of: (i) rural Infrastructure,
(ii) access to basic services like provision of education and
health services, (iii) rural assets, (iv) rural livelihood,
(v) rural technology, and (vi) rural development
programme.
Rural Infrastructure
Road is the only means of transport among the villages
in the State since it is not connected by railways. The road
density may not throw proper light on the lack of proper
road communications among villages in Arunachal
Pradesh since the villages are scattered and many of the
interior villages are yet to be connected by the motorable
roads. Therefore, this indicator has been supplemented by
another relevant indicator, road accessibility. The road
accessibility refers to the distance (physical or in terms of
time or otherwise), which is computed from user’s
location like villages where users live to the nearest road
connection (i.e., bus stop, etc.). Based on 1991 census
data the road accessibilities of the villages have been
calculated (Table 10.1).
It shows that in 1991 only 16.96 per cent of the
villages in Arunachal Pradesh had bus stop facilities, while
as high as 62.86 per cent of villages had the bus stop
ARUN
ACH
AL PR
ADESH
facilities more than 10 km away. These villages may be
regarded as relatively inaccessible. On that basis, 80.50
per cent of villages in Upper Subansiri, the highest among
all districts were inaccessible followed by East Kameng
with 72.00 per cent being inaccessible.
TABLE 10.1
Percentage of Villages with Bus Stop Facilities on theBasis of Distance Covered, 1991
District 0 km 0-5 km 5-10 km 10 km
Tawang 6.75 25.15 22.09 46.01
West Kameng 17.65 11.76 8.09 62.50
East Kameng 9.46 10.18 8.36 72.00
Papum Pare 6.08 16.35 17.49 60.08
Lower Subasiri 44.03 2.69 1.18 52.10
Upper Subansiri 6.17 4.69 8.64 80.50
West Siang 9.56 12.99 7.35 70.10
East Siang 22.55 12.75 11.76 52.94
Dibang Valley 16.39 10.50 7.98 65.13
Lohit 9.65 15.81 6.78 67.76
Changlang 11.58 20.35 13.33 54.74
Tirap 28.21 7.69 8.97 55.13
Arunachal Pradesh 16.96 11.46 8.72 62.86
Source: Census of India, 1991, District Census Hand Books of Different Districtsof Arunachal Pradesh.
The road connectivity status of the villages in
Arunachal Pradesh was defined by the Arunachal Pradesh
Public Works Department in 1997 on the criterion that
the villages falling within a radius of 1 km in a hilly
terrain and 5 km in plains from the constructed roads
(pucca or kutcha) would be considered to be connected
(Human Development Report, 2005]. The details are
given in Figure 10.1.
Chapter 10
Rural Development

ARUNACHAL PRADESH DEVELOPMENT REPORT170
FIGURE 10.1
Road Connectivity Status, 1997
Village
Connected,
38.53
Village not
Connected,
61.47
It shows that 38.53 per cent of the villages of Arunachal
Pradesh are connected by road (out of which only 12.30
per cent of the villages are connected by pucca road and the
rest by kutcha road). Among the districts, East Siang (73.68
per cent) has the highest connectivity by roads followed by
Lower Dibang Valley (66.96 per cent). Kurung Kumey has
the lowest road connectivity (7.47 per cent) (Table 10.2).
In rural Arunachal Pradesh 46.51 per cent of the
population has access to pucca road, 26.93 per cent to
kutcha road, and 26.56 per cent has no connectivity at all.
In Kurung Kumey only 1.35 and 21.89 per cent of
rural population have access to pucca and kutcha roads
respectively (Table 10.3). Even within villages, the higher
the population the higher is the road connectivity. For
example, among the villages having a population of more
than 1000, 93.96 per cent are connected by pucca or kutcha
roads.
TABLE 10.2
Road Connectivity Status of Villages, 1997
District % of Villages Connected % of Villages not Connected
Tawang 25.66 74.34
West Kameng 46.97 52.03
East Kameng 26.52 73.48
Papum Pare 43.02 56.98
Lower Subasiri 33.17 66.83
Upper Subansiri 28.18 71.82
Kurung Kumey 7.47 92.53
Upper Siang 56.00 44.00
East Siang 73.68 26.32
West Siang 45.72 54.28
Lower Dibang Valley 66.96 33.04
Dibang Valley(New) 23.58 76.42
Lohit 40.70 59.30
Changlang 59.57 40.43
Tirap 57.23 42.77
Arunachal Pradesh 38.53 61.47
Note: Connectivity status for all 15 districts has been calculated on thebasis of data available in the circles.
Source: Connectivity of Villages, Public Works Department, Government ofArunachal Pradesh, Itanagar, 1997.
However, only 34.98 per cent of villages having a
population of less than 500 are connected by any type of
road (Table 10.3).
TABLE 10.3
Road Connectivity Status on the Basis of Population, 1997
District % of Total % of Total % of TotalRural Population Rural Population Rural Population
of Dist. of Dist. of Dist.Connected by Connected by not ConnectedPucca Road Kutcha Road by any Road
Tawang 20.10 27.78 52.12
West Kameng 49.13 29.89 20.98
East Kameng 27.19 20.28 52.53
Papum Pare 64.90 16.59 18.51
Lower Subasiri 78.37 2.68 18.95
Upper Subansiri 38.19 19.57 42.24
Kurung Kumey 1.35 21.89 76.76
Upper Siang 4.66 81.51 13.83
East Siang 47.22 44.24 8.54
West Siang 45.77 30.33 23.90
Lower Dibang Valley 66.21 27.11 6.68
Dibang Valley(New) 0.16 62.26 37.58
Lohit 60.24 23.92 15.84
Changlang 34.26 32.79 32.95
Tirap 46.67 27.79 25.54
Arunachal Pradesh 46.51 26.93 26.56
Note: Connectivity status for all 15 districts has been calculated on thebasis of data available in circle level.
Source: Connectivity of Villages, Public Works Department, Government ofArunachal Pradesh, Itanagar, 1997.
Now, an attempt is made to examine the other
infrastructural and basic services of the rural areas across
the districts. Electricity is a basic infrastructure and an
input to many amenities today. In Arunachal Pradesh, the
successive five year plans had specific targets for
extending the coverage of electricity to households.
BOX 10.1
Prime Minister’s Announcement
On 31st January and 1st February 2008, the Prime
Minister announced, “We will surely provide the required
funds for providing drinking water facilities in remote
villages and settlements of Arunachal Pradesh. In order
to stop losses due to floods and bring about
improvements in flood affected areas, we will provide an
assistance of 400 crore rupees from the Central
Government. Many projects in the State are lying
unfinished. We will provide an amount of Rs.265 crore
for completion of these projects.”

171Chapter 10 •
RURAL DEVELOPMENT
According to 2001 census 44.53 per cent of the rural
households were electrified. However, there were
variations among the districts. For example, Papum Pare
had the highest coverage of electricity (77.19 per cent) in
rural areas while Lohit had the lowest (25.85 per cent)
(Table 10.4).
The source of drinking water is another indicator of
infrastructural development. The rural households in
Arunachal Pradesh use multiple sources like tap, tubewell,
pond, well and others including spring and river water.
According to 2001 census 63.34 per cent of the rural
households had tapped water as the dominant source,
15.26 per cent used tubewells and wells, and 23.40 per
cent used other sources like springs, rivers, etc. (Table
10.5). The rural Arunachal Pradesh had poor drainage and
sanitation facilities. In 2001, only 3.27 per cent of rural
households had closed drainage, 22.80 per cent open
drainage and as high as 73.93 per cent had no drainage
facilities (Table 10.7).
TABLE 10.4
Percentage of Rural Households having Access toElectricity and Other Sources of Lighting
Districts Electricity Kerosene Solar Other Any NoEnergy Oil Other Lighting
Tawang 63.86 34.86 0.06 0.01 0.20 1.01
West Kameng 73.84 17.88 0.04 0.17 6.98 1.09
East Kameng 12.69 23.68 0.08 0.00 21.10 42.46
Papum Pare 77.19 10.68 0.20 0.02 1.96 9.94
Lower Subansiri 58.62 6.64 0.07 0.51 5.15 29.01
Upper Subansiri 24.78 40.53 0.28 0.25 9.71 24.45
West Siang 37.78 34.48 0.52 0.52 13.55 13.15
East Siang 33.97 62.28 0.15 0.31 1.42 1.87
Upper Siang 57.94 23.74 0.09 2.69 11.09 4.45
Dibang Valley 41.83 52.18 0.33 0.01 0.49 5.16
Lohit 25.85 64.34 0.56 5.22 1.35 2.68
Changlang 33.05 61.37 0.20 0.12 4.05 1.20
Tirap 52.22 30.88 0.07 0.05 7.05 9.73
AP Rural 44.53 37.86 0.23 0.96 5.91 10.52
AP Urban 89.42 9.35 0.22 0.02 0.28 0.70
AP Total 54.69 31.41 0.23 0.74 4.63 8.30
Source: Census of India 2001, H-Series: Tables on Houses, HouseholdAmenities and Assets, Arunachal Pradesh.
TABLE 10.5
Percentage of Rural Households havingDifferent Sources of Water
Districts Tap Hand Tube Well Tank, River, Spring AnyPump well Pond, Canal Other
Lake
Tawang 63.97 0.16 0.03 0.10 1.32 4.17 23.84 6.42
West Kameng 82.77 0.29 0.16 0.57 0.92 4.72 9.00 1.57
East Kameng 69.52 0.17 0.00 0.82 2.23 12.06 13.06 2.14
Papum Pare 71.62 0.39 0.32 7.40 0.93 14.45 4.23 0.66
Lower Subansiri 74.95 0.40 0.25 5.27 0.58 9.39 4.81 4.36
Upper Subansiri 78.15 1.10 0.15 0.57 0.01 7.19 8.45 4.39
West Siang 82.23 0.83 0.25 0.41 0.62 6.58 4.83 4.25
East Siang 70.19 7.89 2.78 7.05 0.31 5.73 5.76 0.29
Upper Siang 82.76 0.29 0.00 0.00 0.00 2.83 13.66 0.47
Dibang Valley 65.71 13.01 3.41 4.71 0.12 9.27 1.77 2.01
Lohit 34.65 36.30 4.59 6.59 2.45 11.84 1.42 2.17
Changlang 33.75 11.72 11.74 14.95 1.82 18.92 4.21 2.89
Tirap 64.01 0.17 0.08 1.64 2.81 6.18 20.06 5.05
AP Rural 63.34 7.76 2.59 4.91 1.26 9.65 7.64 2.86
AP Urban 83.09 6.02 1.61 3.86 0.83 2.49 1.09 1.01
AP Total 67.81 7.37 2.37 4.67 1.16 8.03 6.16 2.44
Source: Census of India 2001, H-Series: Tables on Houses, HouseholdAmenities and Assets, Arunachal Pradesh.
TABLE 10.6
Percentage of Rural Households havingDifferent Types of Sanitation
Districts Households Pit Water Other Nohaving Latrine Closet Latrine Latrine
BathroomFacilitywithin
the House
Tawang 9.89 66.71 7.50 5.63 20.16
West Kameng 21.96 20.17 9.23 9.84 60.76
East Kameng 6.85 9.92 3.20 14.65 72.24
Papum Pare 28.18 25.23 11.39 19.47 43.91
Lower Subansiri 13.10 14.52 2.96 30.65 51.87
Upper Subansiri 10.52 12.08 3.25 35.57 49.10
West Siang 11.62 23.75 5.21 42.73 28.31
East Siang 10.48 19.34 5.41 28.57 46.68
Upper Siang 20.79 14.52 7.40 6.65 71.43
Dibang Valley 15.16 24.67 8.54 11.41 55.39
Lohit 10.49 28.68 6.37 3.36 61.60
Changlang 11.63 30.95 7.09 5.03 56.94
Tirap 7.50 24.14 2.74 15.92 57.19
AP Rural 13.28 24.02 6.04 17.28 52.66
AP Urban 53.93 32.08 28.06 26.82 13.05
AP Total 22.48 25.84 11.02 19.43 43.70
Source: Census of India 2001, H-Series: Tables on Houses, HouseholdAmenities and Assets, Arunachal Pradesh.

ARUNACHAL PRADESH DEVELOPMENT REPORT172
TABLE 10.7
Percentage of Rural Households havingDifferent Types of Drainage
Districts Closed Drainage Open Drainage No Drainage
Tawang 1.09 13.29 85.62
West Kameng 7.40 27.18 65.42
East Kameng 1.04 12.01 86.95
Papum Pare 8.21 33.17 58.62
Lower Subansiri 3.58 25.03 71.39
Upper Subansiri 4.27 23.89 71.84
West Siang 4.94 41.69 53.37
East Siang 2.33 27.40 70.27
Upper Siang 2.77 15.92 81.31
Dibang Valley 1.86 17.19 80.95
Lohit 1.30 15.21 83.49
Changlang 2.37 19.09 78.54
Tirap 1.94 20.32 77.74
AP Rural 3.27 22.80 73.93
AP Urban 12.90 50.36 36.74
AP Total 5.45 29.03 65.51
Source: Census of India 2001, H-Series: Tables on Houses, HouseholdAmenities and Assets, Arunachal Pradesh.
Access to Basic Services
Child Immunisation
One of the basic health services provided by the State
are child immunisation. Both the Central and the State
governments reiterated their commitment to the
eradication of a few fatal diseases. A phased programme
of free immunisation has been chalked out for all children
mainly during the first year (the programme actually
covers children up to the age of 10 years). For pregnant
women, immunisation as well as iron supplements are
provided. However, the ground level reality is very distant
from the goals proclaimed by the State. In general, the
pulse polio campaign has been a major success, over
68.09 per cent children have been immunised (Govt. of
Arunachal Pradesh, 2006). While there have been
vigorous campaigns for providing child immunisation free
to all infants, the access to immunisation of children in
the State is 68.09 per cent with a wide variation among
the districts (Table 10.8).
Health and Education
On the education front, Arunachal Pradesh has
advanced markedly. Total rural literacy rate is about 47.8
per cent with Kurung Kumey district having lowest
literacy rate 25.74 per cent. The gross enrolment ratio of
children at the upper primary level is once again less than
100 per cent with a wide variation across districts. One of
the important reasons of low level of literacy and poor
educational status of population could be related to access
to educational institutions. The HDR of the State clearly
pointed out that 48.38 per cent of the habitations of the
State do not have primary schooling facilities within a
radius of one kilometre, and 68.83 per cent of the
habitations do not have upper primary schooling facilities
within a radius of three kilometre. There are also wide
scale variations among the districts.
Similarly, as pointed out in Chapter VI, the
performance of the State in all indicators of health is not
satisfactory particularly in the rural and inaccessible
districts. For example, Kurung Kumey had the highest
infant mortality rate of 113 and the lowest Dibang Valley
53. The basic reason behind poor rural health condition
is, inadequacy of health services. Only 14.29 per cent of
the allopathic medical institutions in the State are located
in the rural areas.
Rural Assets in Arunachal Pradesh
Assets are enmeshed in highly intricate ways with the
functioning of individuals. This relational intricacy
emerges from the fact that in the action space the assets
are in some forms inputs to and in others outputs of an
TABLE 10.8
Access to Immunisation and School Enrolment
Infant % of Rural Gross GrossMortality Children Literacy Enrolment Enrolment
Rate Immunised Rate Ratio Ratioagainst Polio 2001 (Primary) (Upper
and DPT Primary)
Changlang 62 69.67 47.6 64.88 54.92
Dibang Valley 98 58.82 43.27 80.72 78.15(New)
Lower Dibang 53 76.67 53.13 80.72 78.15Valley
Kurung Kumey 113 60.00 25.74 NA NA
East Kameng 97 66.25 31.3 110.58 81.64
East Siang 57 80.28 55.7 120.64 120.54
Lohit 72 75.13 51.0 62.42 53.62
Lower Subansiri 59 81.29 54.23 180.11 95.48
Papum Pare 67 82.62 59.0 123.07 100.01
Tawang 98 63.73 35.1 98.50 54.38
Tirap 92 63.04 34.2 74.47 66.50
Upper Siang 87 74.63 49.8 109.13 82.07
Upper Subansiri 97 63.13 41.5 131.53 73.20
West Kameng 88 60.87 58.9 92.62 46.10
West Siang 85 71.37 53.9 141.67 143.85
Source: Human Development Report of Arunachal Pradesh 2005 (2006).
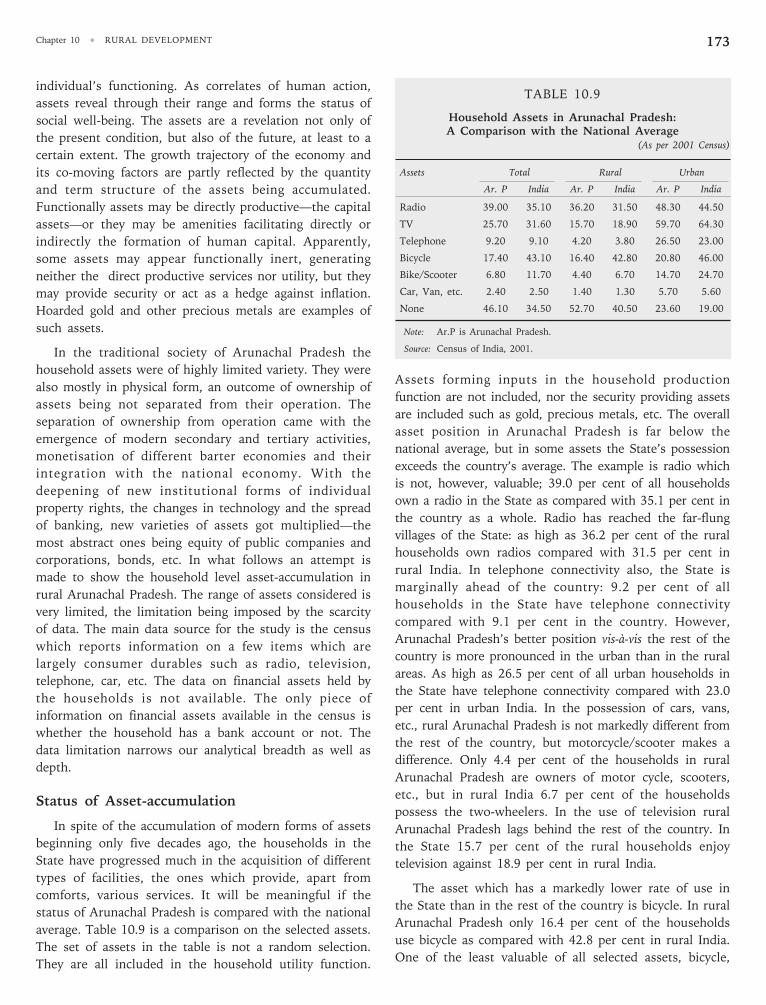
173Chapter 10 •
RURAL DEVELOPMENT
individual’s functioning. As correlates of human action,
assets reveal through their range and forms the status of
social well-being. The assets are a revelation not only of
the present condition, but also of the future, at least to a
certain extent. The growth trajectory of the economy and
its co-moving factors are partly reflected by the quantity
and term structure of the assets being accumulated.
Functionally assets may be directly productive—the capital
assets—or they may be amenities facilitating directly or
indirectly the formation of human capital. Apparently,
some assets may appear functionally inert, generating
neither the direct productive services nor utility, but they
may provide security or act as a hedge against inflation.
Hoarded gold and other precious metals are examples of
such assets.
In the traditional society of Arunachal Pradesh the
household assets were of highly limited variety. They were
also mostly in physical form, an outcome of ownership of
assets being not separated from their operation. The
separation of ownership from operation came with the
emergence of modern secondary and tertiary activities,
monetisation of different barter economies and their
integration with the national economy. With the
deepening of new institutional forms of individual
property rights, the changes in technology and the spread
of banking, new varieties of assets got multiplied—the
most abstract ones being equity of public companies and
corporations, bonds, etc. In what follows an attempt is
made to show the household level asset-accumulation in
rural Arunachal Pradesh. The range of assets considered is
very limited, the limitation being imposed by the scarcity
of data. The main data source for the study is the census
which reports information on a few items which are
largely consumer durables such as radio, television,
telephone, car, etc. The data on financial assets held by
the households is not available. The only piece of
information on financial assets available in the census is
whether the household has a bank account or not. The
data limitation narrows our analytical breadth as well as
depth.
Status of Asset-accumulation
In spite of the accumulation of modern forms of assets
beginning only five decades ago, the households in the
State have progressed much in the acquisition of different
types of facilities, the ones which provide, apart from
comforts, various services. It will be meaningful if the
status of Arunachal Pradesh is compared with the national
average. Table 10.9 is a comparison on the selected assets.
The set of assets in the table is not a random selection.
They are all included in the household utility function.
Assets forming inputs in the household production
function are not included, nor the security providing assets
are included such as gold, precious metals, etc. The overall
asset position in Arunachal Pradesh is far below the
national average, but in some assets the State’s possession
exceeds the country’s average. The example is radio which
is not, however, valuable; 39.0 per cent of all households
own a radio in the State as compared with 35.1 per cent in
the country as a whole. Radio has reached the far-flung
villages of the State: as high as 36.2 per cent of the rural
households own radios compared with 31.5 per cent in
rural India. In telephone connectivity also, the State is
marginally ahead of the country: 9.2 per cent of all
households in the State have telephone connectivity
compared with 9.1 per cent in the country. However,
Arunachal Pradesh’s better position vis-à-vis the rest of the
country is more pronounced in the urban than in the rural
areas. As high as 26.5 per cent of all urban households in
the State have telephone connectivity compared with 23.0
per cent in urban India. In the possession of cars, vans,
etc., rural Arunachal Pradesh is not markedly different from
the rest of the country, but motorcycle/scooter makes a
difference. Only 4.4 per cent of the households in rural
Arunachal Pradesh are owners of motor cycle, scooters,
etc., but in rural India 6.7 per cent of the households
possess the two-wheelers. In the use of television rural
Arunachal Pradesh lags behind the rest of the country. In
the State 15.7 per cent of the rural households enjoy
television against 18.9 per cent in rural India.
The asset which has a markedly lower rate of use in
the State than in the rest of the country is bicycle. In rural
Arunachal Pradesh only 16.4 per cent of the households
use bicycle as compared with 42.8 per cent in rural India.
One of the least valuable of all selected assets, bicycle,
TABLE 10.9
Household Assets in Arunachal Pradesh:A Comparison with the National Average
(As per 2001 Census)
Assets Total Rural Urban
Ar. P India Ar. P India Ar. P India
Radio 39.00 35.10 36.20 31.50 48.30 44.50
TV 25.70 31.60 15.70 18.90 59.70 64.30
Telephone 9.20 9.10 4.20 3.80 26.50 23.00
Bicycle 17.40 43.10 16.40 42.80 20.80 46.00
Bike/Scooter 6.80 11.70 4.40 6.70 14.70 24.70
Car, Van, etc. 2.40 2.50 1.40 1.30 5.70 5.60
None 46.10 34.50 52.70 40.50 23.60 19.00
Note: Ar.P is Arunachal Pradesh.
Source: Census of India, 2001.

ARUNACHAL PRADESH DEVELOPMENT REPORT174
finds a low use in the State because of its hilly
topography. It is the bicycle which makes a difference
between the State’s use of at least one of the selected
assets from the national average.
The selected assets are not uniformly used throughout
the State; there are substantial inter-district and rural-
urban differences. Telephone connectivity is lowest in East
Kameng with only 0.96 per cent of the rural households
having this facility. Not far better situation is in Tirap or
Upper Subansiri. In Tirap only 1.29 per cent of the rural
households have telephone connectivity and in Upper
Subansiri only 1.37 per cent. On the other side of the
spectrum is the district Papum Pare with its 14.93 per
cent of the rural households having telephone
connectivity. Upper Siang, an all-rural district occupies the
second position with 7.49 per cent of its households
having telephone connectivity. East Siang, the district with
the highest human development index, has not much
advanced in extending telephone facilities in the rural
areas. In this district only 5.35 per cent of the rural
households have telephone connectivity.
The lowest user of television is rural East Kameng
where only 3.63 per cent of the households possess
television. The highest user is again rural Papum Pare
with as high as 34.35 per cent of the households
possessing television. The range of inter-district variation
in the ownership of cars, vans, etc., is not as high as in
that of other assets. The lowest user is rural East Kameng
with only 0.33 per cent of households owning cars, vans,
etc. The highest user is rural Papum Pare with 2.75 per
cent of the households having cars, vans, etc. Scooter/
motor cycle use is partly determined by the topography
and road connectivity. In Tawang, a hilly district, the use
of scooter/motor cycle in the rural areas is very low but it
is high in the districts with some plains and having better
road connectivity. Hilly conditions make the highest
difference in the use of bicycles. Tawang is the lowest
user with its only 0.14 per cent rural households owning
bicycles. On the other side, rural Lohit with extensive
plains witnesses as high as 38.47 per cent of its
households possessing bicycles.
Financial Assets
Proportions of different financial assets in the portfolio
of a household are a measure of its efforts to diversify the
sources of income and protect itself against risk. Holding
of financial assets is also a reflection of the spread of
financial market whose instruments also deal with risk. In
Arunachal Pradesh, the financial market is relatively new
and immature. The first bank branch in the State was
opened in December 1971. To date banking has not
spread widely; most of the rural areas especially the
remote ones remain outside the reach of banking and
financial intermediation. There is an acute scarcity of data
on the holding of different financial assets by the
households. The data on the aggregate bank deposits are
available, but its rural-urban division is not. The only
information available is the number of households having
bank accounts, the indicator in which Arunachal Pradesh
has a very good position. As high as 37.3 per cent of all
households in Arunachal Pradesh have bank accounts
compared with a national average of 35.5 per cent. Among
all the eight North-eastern states, Arunachal Pradesh
occupies the first position in access to banking, and
among all the 35 states and union territories, Arunachal
Pradesh’s position is 16th. Many households in rural areas
have developed banking habits; 28.6 per cent people in
rural Arunachal Pradesh have bank accounts against the
national average of 30.1 per cent. However, in urban
banking Arunachal Pradesh is far ahead of the national
average; as high as 67.0 per cent of all urban households
in the State have bank accounts compared with 49.5 per
cent in urban India. It is remarkable that Arunachal
Pradesh’s proportion of urban households having bank
accounts is fifth highest—only four states and union
territories have higher proportions of urban households
with bank accounts. In some districts of the State, the
banking services have reached far off from the urban
centres, but in others, banking is concentrated in and
around urban areas. In rural Papum Pare 50.2 per cent of
all households have bank accounts, the highest in the
State. The lowest is in East Kameng with only 16.0 per
cent rural households having bank accounts (Table 10.10).
In a good number of districts, more than 30 per cent of
the rural households have bank accounts. In East Siang,
40.5 per cent of the rural households have bank accounts.
In West Siang this percentage is 33.4.
The number of bank accounts does not provide us
information on the quantity of banking transactions. An
idea can be formed about the magnitude of intermediation
by banks by considering the state-level deposits in relation
to gross state domestic product (GSDP). In Arunachal
Pradesh, the aggregate bank deposits are 49.67 per cent of
GSDP (the deposits relate to 31st March 2005 and GSDP
to 2004-05). This is low compared with what exists at the
national level. In the country as a whole, bank deposits
were 67.07 per cent of gross national product (GNP) in
2004-05. Deposit-GSDP ratio is low in the State but credit
GSDP ratio is still lower, being only 0.196 or 19.6 per
cent. A low disbursement of credit in the State is due to
various factors but the one which stands above others

175Chapter 10 •
RURAL DEVELOPMENT
especially in rural areas is the non-availability of collateral.
Land being not surveyed cadastrally cannot be used as
collateral to the banks. This restricts the expansion of
bank credit.
Land Ownership
The people of the State are adequately endowed with
land, but most of it is hilly. However, with urbanisation,
the value of land especially in the suburban area and in
TABLE 10.10
Percentage of Households Availing Banking Services and having each of the Specified Assets in Arunachal Pradesh
Dist Account Bank Radio Television Telephone Bicycle Scooter/Bike Car/Van R None Some
1 Ar. P 37.29 38.96 25.70 9.19 17.42 6.77 2.38 46.14 53.86
2 R 28.61 36.22 15.74 4.12 16.43 4.44 1.42 52.74 47.26
3 U 66.99 48.33 59.74 26.53 20.77 14.71 5.66 23.59 76.41
4 Taw 38.73 50.69 23.28 11.95 0.53 1.32 1.88 44.36 55.64
5 R 30.27 46.72 14.07 5.42 0.14 0.93 1.24 50.39 49.61
6 U 85.00 72.35 73.68 47.68 2.67 3.46 5.42 11.39 88.61
7 WK 42.84 40.72 30.78 8.12 1.81 3.63 2.30 46.65 53.35
8 R 38.74 39.89 25.39 5.04 1.73 3.45 1.87 50.26 49.74
9 U 72.16 46.64 69.27 30.17 2.38 4.88 5.38 20.91 79.09
10 EK 27.44 17.87 12.08 4.05 5.30 2.49 0.96 76.11 23.89
11 R 15.98 13.39 3.63 0.96 3.42 1.27 0.33 84.66 15.34
12 U 62.75 31.69 38.12 13.56 11.08 6.25 2.90 49.76 50.24
13 PP 60.63 41.44 52.91 29.04 13.29 16.34 6.41 29.39 70.61
14 R 50.20 39.52 34.35 14.93 18.50 10.14 2.75 40.32 59.68
15 U 68.76 43.02 68.25 40.70 8.99 21.46 9.43 20.35 79.65
16 LS 27.24 26.65 15.85 5.17 4.03 4.83 2.04 65.28 34.72
17 R 21.82 23.34 9.19 2.45 3.14 3.71 1.45 71.56 28.44
18 U 61.82 47.74 58.40 22.53 9.70 11.94 5.81 25.20 74.80
19 US 37.29 43.18 17.70 6.87 6.07 5.24 1.26 50.96 49.04
20 R 27.29 38.14 5.50 1.37 2.92 2.76 0.43 59.91 40.09
21 U 63.58 56.42 49.79 21.33 14.34 11.77 3.45 27.45 72.55
22 WS 43.68 47.33 26.03 8.16 12.57 9.35 2.42 41.92 58.08
23 R 33.36 44.54 14.70 3.50 10.00 6.74 1.51 48.93 51.07
24 U 77.60 56.47 63.24 23.44 21.01 17.92 5.40 18.89 81.11
25 ES 48.40 50.74 35.02 9.33 31.56 12.45 3.15 32.76 67.24
26 R 40.51 48.82 25.23 5.35 28.58 9.92 2.49 37.50 62.50
27 U 67.13 55.30 58.25 18.77 38.66 18.45 4.71 21.52 78.48
28 US 45.96 34.92 14.73 7.49 1.68 4.62 1.37 58.24 41.76
29 D 33.96 49.80 23.79 7.26 29.67 7.31 2.13 35.98 64.02
30 R 25.37 48.07 15.19 4.49 29.45 5.62 1.92 40.11 59.89
31 U 73.13 57.69 63.00 19.86 30.67 15.00 3.07 17.14 82.86
32 L 27.60 40.21 22.06 6.45 42.65 5.50 1.62 37.73 62.27
33 R 19.25 38.00 13.54 2.87 38.47 3.86 1.14 42.35 57.65
34 U 57.29 48.09 52.36 19.17 57.51 11.32 3.34 21.29 78.71
35 C 27.62 38.81 19.73 4.95 33.39 4.15 1.44 40.73 59.27
36 R 23.05 38.22 15.39 3.05 35.40 3.15 1.11 42.05 57.95
37 U 63.91 43.58 54.20 20.03 17.38 12.13 4.08 30.20 69.80
38 T 28.71 27.58 20.94 4.13 4.17 2.85 1.39 63.16 36.84
39 R 21.20 23.64 13.03 1.29 2.71 1.76 0.84 70.87 29.13
40 U 63.74 45.93 57.81 17.37 10.96 7.92 3.96 27.21 72.79
Note: Ar. P = Arunachal Pradesh, Taw = Tawang, WK = West Kameng, EK = East Kameng, PP = Papum Pare, LS = Lower Subansiri, US = Upper Subansiri,WS = West Siang, ES = East Siang, US = Upper Siang, D = Dibang Valley, L = Lohit, C = Changlang, T = Tirap, R = Rural, U = Urban, R None =None of the Assets and Some stands for at least one of the asset.
Source: Census of India, 2001 (Arunachal Pradesh).

ARUNACHAL PRADESH DEVELOPMENT REPORT176
the plains has been increasing. Consequently, land has
emerged as an important asset with a high market value.
Table 10.12 gives an idea about the potential land
availability in different districts of the State. The table is
notional giving an idea of endowment. In the State as a
whole, the net sown area is more than two lakh hectares.
When this area is divided by the number of ST
households, the net sown area turns out to be 1.87
hectares per household. (Here ST households are
considered in view of the fact that non-ST households, in
TABLE 10.11
Assets Ownership in ST Households in Arunachal Pradesh: 2001
Dist Account Bank Radio Television Telephone Bicycle Scooter/Bike Car/Van R None
1 Ar P 33.12 33.66 19.74 7.33 10.91 7.01 2.71 55.76
2 R 26.90 31.33 12.64 3.48 9.94 4.93 1.65 61.11
3 U 69.86 47.42 61.60 30.07 16.66 19.23 9.00 24.24
4 Taw 32.61 45.09 17.44 9.21 0.42 1.13 1.95 51.22
5 R 27.16 42.14 11.62 5.14 0.13 0.86 1.31 55.39
6 U 84.90 73.45 73.29 48.33 3.18 3.66 8.11 11.13
7 WK 38.62 34.23 25.71 7.11 1.41 3.85 3.18 54.00
8 R 34.74 32.96 20.67 4.13 1.22 3.72 2.47 57.71
9 U 77.98 47.12 76.86 37.31 3.37 5.19 10.38 16.41
10 EK 21.95 12.29 7.15 2.31 4.13 2.03 0.85 82.75
11 R 13.66 10.02 1.88 0.45 2.94 1.06 0.28 88.27
12 U 56.14 21.67 28.90 9.96 9.03 6.04 3.20 60.01
13 PP 57.76 39.14 45.55 27.15 13.97 18.13 8.28 34.60
14 R 46.96 35.00 26.94 12.11 17.14 11.15 3.32 47.05
15 U 71.92 44.56 69.95 46.86 9.82 27.30 14.78 18.28
16 LS 21.21 22.51 10.42 3.37 3.48 4.36 1.80 71.38
17 R 17.14 20.31 5.41 1.36 2.83 3.29 1.20 76.07
18 U 60.14 43.56 58.29 22.61 9.79 14.62 7.52 26.55
19 US 33.09 39.77 13.61 5.03 5.69 4.95 1.25 55.34
20 R 24.89 35.7 4.01 1.20 2.75 2.50 0.40 62.48
21 U 63.14 54.7 48.84 19.06 16.49 13.92 4.36 29.15
22 WS 37.11 44.07 21.24 6.85 11.05 9.93 2.66 46.63
23 R 30.13 41.82 12.44 3.03 9.27 6.86 1.61 52.17
24 U 78.89 57.53 73.99 29.75 21.72 28.28 8.94 13.48
25 ES 47.28 50.47 32.55 8.22 30.47 14.47 3.92 33.98
26 R 41.23 48.63 26.49 5.45 28.8 12.19 3.12 37.26
27 U 83.04 61.31 68.30 24.64 40.35 27.96 8.65 14.60
28 US 42.26 30.29 10.81 6.52 1.83 5.10 1.50 64.02
29 D 35.91 48.03 22.15 8.77 26.03 10.90 3.87 40.53
30 R 32.06 47.56 18.21 7.13 25.97 9.79 3.54 42.58
31 U 79.19 53.30 66.50 27.16 26.65 23.35 7.61 17.51
32 L 26.42 34.19 19.35 6.73 27.62 8.32 3.08 49.84
33 R 20.73 31.75 13.09 3.37 23.63 6.32 2.22 54.48
34 U 69.13 52.56 66.37 31.95 57.59 23.37 9.57 14.99
35 C 32.14 34.25 20.09 5.35 25.03 5.57 2.31 48.86
36 R 28.74 33.57 16.2 3.25 26.23 4.52 1.80 50.98
37 U 70.32 41.89 63.68 28.90 11.59 17.31 8.04 25.04
38 T 20.41 22.20 13.69 2.16 2.51 2.25 1.14 71.26
39 R 16.78 20.40 9.95 0.87 1.95 1.54 0.73 74.89
40 U 62.36 42.97 56.77 17.03 9.00 10.48 5.76 29.43
Note: Ar.P = Arunachal Pradesh, Taw = Tawang, WK = West Kameng, EK = East Kameng, PP = Papum Pare, LS = Lower Subansiri, US = Upper Subansiri,WS = West Siang, ES = East Siang, US = Upper Siang, D = Dibang Valley, L = Lohit, C = Changlang, T = Tirap, R = Rural, U = Urban and R None= None of the Assets.
Source: Census of India, 2001 (Arunachal Pradesh).

177Chapter 10 •
RURAL DEVELOPMENT
general, cannot own cultivable land in the State. So the
asset value of land to them is nil.) All the districts are not
equally favoured with cultivable land. Dibang Valley has
the highest endowment with net sown area per family
being 6.54 hectares. On the other extreme is Tawang
where the average land per ST household is only 0.66
hectare. The high land availability has kept the problem of
landlessness in the State to a minimum.
TABLE 10.12
Net Sown Area (hectare) Per Rural ST Household
District Net Sown Area No. of ST Col. 2 as %(hectare) Households Col. 3
Tawang 4013 6035 0.66
West Kameng 6767 7233 0.94
East Kameng 11755 7995 1.47
Papum Pare 22132 6325 3.50
Lower Subansiri 7754 16030 0.48
Upper Subansiri 12383 7561 1.64
West Siang 26399 11860 2.23
East Siang 20163 8538 2.36
Upper Siang 8265 4922 1.68
Dibang Valley 28999 4432 6.54
Lohit 22921 7616 3.01
Changlang 14252 7259 1.96
Tirap 17827 13204 1.35
Arunachal Pradesh 203630 109010 1.87
Note: Net sown area relates to the Agricultural Census year 1995-96 andhousehold data refers to 1st March 2001.
Source: Statistical Abstract of Arunachal Pradesh, 2005 and Census of India(Arunachal Pradesh, 2001).
Rural Livelihood
As described in the chapter on employment (Chapter
4), most of the rural people still depend on agricultural
activities for their livelihood. This is because of non-farm
activities having not yet expanded significantly. True that
some activities like construction, transport, trade, etc.,
have proliferated in accessible areas but in inaccessible
areas overwhelming majoritiy of the people still depend
on jhum cultivation which is low productive providing a
bare subsistence.
Jhum cultivation is practised where slopy land is
abundant but labour is scarce. In spite of high land-labour
ratio, the productivity of labour is still low because of low
capital intensity in production. There is a high potential in
terms of terrace cultivation (Table 9.2 of chapter on Land
Potential) as 29.49 per cent of land comes under steep
(10-20 degree) category which can be terraced easily for
cultivation. This is possible of course, if support is given
to the jhum cultivators in terms of extension services and
long term loans.
Rural Technology
In the course of last 60 years the technology frontiers
in the rural areas have expanded. But this expansion is
limited to the accessible area. In the inaccessible areas the
old technology which is in fact the oldest human
technology continues to be used. In general, the
inaccessible areas remain unelectrified; people practise
only slash-and-burn method of cultivation, an agricultural
practice which depends almost wholly on natural inputs
leading to wide fluctuations in production. This renders
livelihood risky. Even today people in remote areas
supplement their income through hunting and gathering
activities.
In the remotest part of the State, kerosene is still not
available and people continue to use wood-burned fire as
their source of lighting; in the absence of cash income and
market many people continue to use banana leaves as
their utensils and bamboo pipes as cooking pots. Thus,
there exists a sharp contrast between the accessible and
inaccessible areas in the levels of technological
configuration of production and different amenities which
enhance the quality of life.
Rural Development Programmes
The Rural Development Department of the State
government has implemented programmes that aimed at
alleviation of poverty through creation of infrastructure by
generating sustainable employment opportunities for the
rural poor. The major schemes that have been undertaken
by the Rural Development Department for enhancement
of income and employment opportunities to the rural
poor fall into two categories:
(a) Centrally Sponsored Schemes (CSS): This includes
programmes viz., Swarnajayanti Gram Swarojgar
Yojana (SGSY), Jawahar Gram Samridhi Yojana
(JGSY), Indira Awaas Yojana (IAY), Employment
Assurance Scheme (EAS) and Drought Prone Area
Programme (DPAP).
(b) State Plan Schemes (SPS): This includes
programmes viz., Prime Minister Gramodaya Yojana
(PMGY), Community Development Programme
(CDP) and Minimum Needs Programme (MNP).
These programmes aim at a direct three-pronged attack
on poverty i.e.: (i) in terms of creating an income
generating assets base for self-employment of the rural
poor, (ii) by creating opportunities for wage employment

ARUNACHAL PRADESH DEVELOPMENT REPORT178
for the poor, and (iii) area (land) development activities in
backward regions like dry-land, rain-fed, drought prone
areas. Apart from this, there are also programmes for
providing basic infrastructure and basic civic amenities for
better quality of life in rural areas run by different
concerned departments. This segment of schemes includes
programmes related to rural health services, water supply,
sanitation, housing, rural roads, etc.
We could get information on three rural development
programmes, SGSY, IAY and PMGSY which have been
launched in Arunachal Pradesh. Details are reported in
Table 10.13 which suggests that most of the rural
development programmes in Arunachal Pradesh lack
coordination. As no targets have been fixed in many of
them, the number appearing in the ‘achievement’ column
is just an indication of some activity. One possible
explanation for unpopularity of these programmes could
be lack of awareness among the rural households about
their existence.
TABLE 10.13
Performance of Rural Development Programmes
Programme *Month Unit Total Total AchievementName Code Target Achievement as % of
Target
2004-05
SGSY 3 Individual Swarozgaris … 1364 …Assisted (Nos.)
SGSY 3 Members of SHGs … 404 …Assisted (Nos.)
SGSY 3 Total Swarozgaris … 1768 …Assisted (Nos.)
IAY 3 Dwelling Units 4966 4162 83.81(Nos.)
PMGSY 3 Length of roads 340 … …(in Kms.)
PMGSY 3 No. of roads 64 … …
2005-06
SGSY 10 Individual Swarozgaris … 186 …Assisted (Nos.)
SGSY 10 Members of SHGs … 58 …Assisted (Nos.)
SGSY 10 Total Swarozgaris … 244 …Assisted (Nos.)
IAY 10 Dwelling Units 4603 2192 47.62(Nos.)
Note: *month code refers to the month launched.
Source: Ministry of Rural Development, Government of India.
Policy Options
It is observed that the rural areas in general and the
inaccessible areas in particular are lagging much behind
the urban and accessible areas. Various benefits of
development are yet to reach the remote part of the State.
The policy needs to be reoriented to include the rural
areas especially the remote ones in the process of growth.
The following policy options appear pertinent:
• Connectivity needs to be improved.
• Expansion of schooling and health facilities is a sine
qua non for promotion of inclusive growth.
• Mobile health services in the remote areas through
public private initiatives may be explored.
• In order to diversify the livelihood options of the
people, marketing network needs to be expanded.
• Agricultural extension services need to be revamped
to popularise slope specific new crops.
• In order to expand the credit facilities Self Help
Groups need to be popularised and state specific
collateral in the form of community/clan as the
guarantor of loan may be explored.
• Traditional technical know-how is in the verge of
extinction and technology mission should upgrade
the exiting indigenous technology in a way that
becomes economically viable.
• Small scale food processing industries along with
cold storage facilities should be developed
particularly in the remote areas. This requires
electricity. In order to make electricity available in
the remote areas the construction of mini-hydel
projects should be encouraged.
• Technology being the source of all dynamism and
progress, all-out efforts should be made to improve
rural technological configuration of production,
distribution, etc.
• Agricultural land is yet to be cadastrally surveyed.
In order to promote rural banking, it is essential
that all cultivable land should be cadastrally
surveyed and records of their ownership duly
prepared, so that land can be used as collateral for
loans from financial institutions.
• Expansion of the market including financial market
in rural areas requires strengthening of the
contract-enforcing mechanism.
• Steps should be taken to implement the 73rd and
74th Amendment of the Constitution to empower
the Panchayati Raj Institution to monitor the
implementation of various Rural Development
Programmes in the State.

Introduction
Urbanisation is relatively new in Arunachal Pradesh. It
came into the urban map in 1971 census. If we go
through the history of urbanisation, we find that in the
1961 census, none of the places in Arunachal Pradesh
satisfied the criteria of being declared as a census town
and hence the entire State was declared rural. However,
four of the districts and sub-divisional headquarters of the
State were found possessing distinct urban characteristics
in 1971. In consideration of their pronounced urban
characteristics and the occupational pattern, it was
decided that the districts and sub-divisional headquarters
that recorded a population of 2500 persons during 1961
census should be treated as town for the purpose of 1971
ARUN
ACH
AL PR
ADESH
census. Accordingly, Bomdila, Pasighat, Tezu and Along
were treated as census towns during the 1971 census.
Two more towns were added in the 1981 census and they
were Old Itanagar (now Naharlagun) and New Itanagar
(now Itanagar). In 1991 census, this number increased
from six to ten with the addition of four more census
towns in the State. These are Ziro, Roing, Namsai and
Khonsa. In 2001, the number of census towns rose from
10 to 17 (Figure 11.1). The level of urbanisation increased
from 3.70 per cent in 1971 to 20.41 per cent in 2001
(Annexure Table A-11.2) as against all-India average of
27.78 percentage.
All these towns of the State are administrative centres.
In fact, Arunachal Pradesh is the only State in North-east
Chapter 11
Urban Development
FIGURE 11.1
Location of Urban Centres in Arunachal Pradesh
Tawang
Seppa
Ziro
Daporije
Pasighat
Roing
Jairampur
ChangiangDeemall
250 km0 Scale
Bomdila
Itanagar
NaharlagunKhonsa
Along
Basar Tezu
Namsai
N
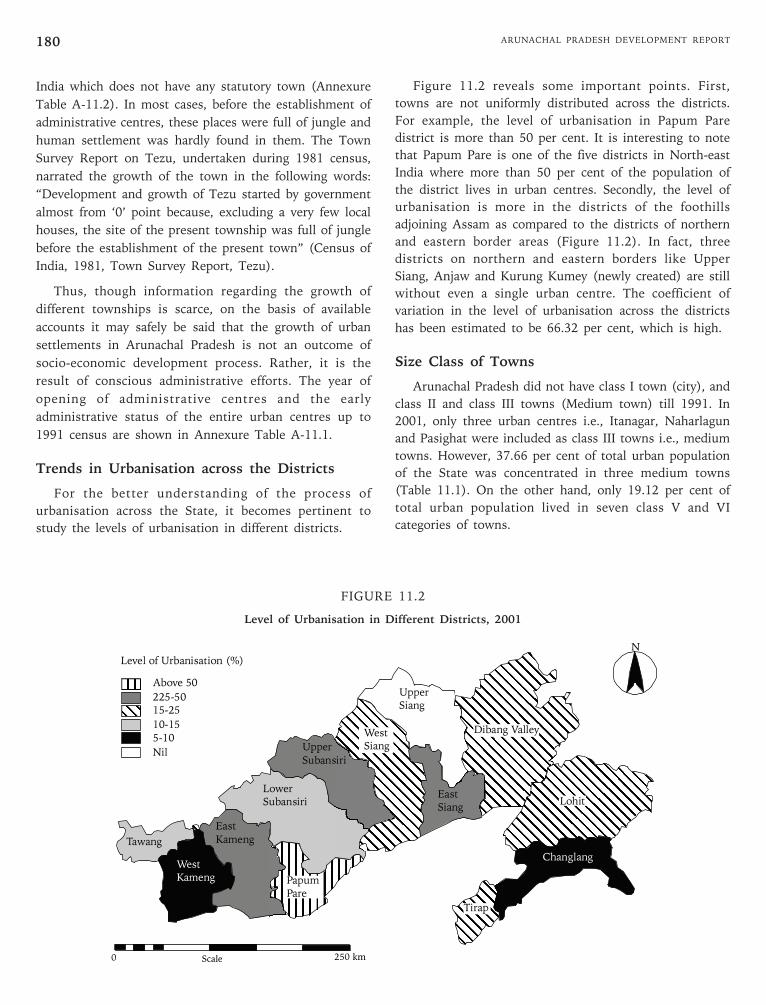
ARUNACHAL PRADESH DEVELOPMENT REPORT180
India which does not have any statutory town (Annexure
Table A-11.2). In most cases, before the establishment of
administrative centres, these places were full of jungle and
human settlement was hardly found in them. The Town
Survey Report on Tezu, undertaken during 1981 census,
narrated the growth of the town in the following words:
“Development and growth of Tezu started by government
almost from ‘0’ point because, excluding a very few local
houses, the site of the present township was full of jungle
before the establishment of the present town” (Census of
India, 1981, Town Survey Report, Tezu).
Thus, though information regarding the growth of
different townships is scarce, on the basis of available
accounts it may safely be said that the growth of urban
settlements in Arunachal Pradesh is not an outcome of
socio-economic development process. Rather, it is the
result of conscious administrative efforts. The year of
opening of administrative centres and the early
administrative status of the entire urban centres up to
1991 census are shown in Annexure Table A-11.1.
Trends in Urbanisation across the Districts
For the better understanding of the process of
urbanisation across the State, it becomes pertinent to
study the levels of urbanisation in different districts.
Figure 11.2 reveals some important points. First,
towns are not uniformly distributed across the districts.
For example, the level of urbanisation in Papum Pare
district is more than 50 per cent. It is interesting to note
that Papum Pare is one of the five districts in North-east
India where more than 50 per cent of the population of
the district lives in urban centres. Secondly, the level of
urbanisation is more in the districts of the foothills
adjoining Assam as compared to the districts of northern
and eastern border areas (Figure 11.2). In fact, three
districts on northern and eastern borders like Upper
Siang, Anjaw and Kurung Kumey (newly created) are still
without even a single urban centre. The coefficient of
variation in the level of urbanisation across the districts
has been estimated to be 66.32 per cent, which is high.
Size Class of Towns
Arunachal Pradesh did not have class I town (city), and
class II and class III towns (Medium town) till 1991. In
2001, only three urban centres i.e., Itanagar, Naharlagun
and Pasighat were included as class III towns i.e., medium
towns. However, 37.66 per cent of total urban population
of the State was concentrated in three medium towns
(Table 11.1). On the other hand, only 19.12 per cent of
total urban population lived in seven class V and VI
categories of towns.
FIGURE 11.2
Level of Urbanisation in Different Districts, 2001
Tawang
250 km0 Scale
N
EastKameng
LowerSubansiri
UpperSubansiri
EastSiang
UpperSiang
Changlang
Level of Urbanisation (%)
Above 50
225-5015-25
10-155-10
Nil
WestKameng Papum
Pare
WestSiang
Dibang Valley
Lohit
Tirap

181Chapter 11 •
URBAN DEVELOPMENT
TABLE 11.1
Class-wise Distribution of Towns andtheir Population: 2001
Sl. No. Class of Number of Per cent Per cent PercentageTown Town Share Share of of Decadal
Urban Growth ofPopulation Population
1. Class I(1,00,000 above) 0 0 0 -
2. Class II(50,000-99,999) 0 0 0 -
3. Class III(20,000-49,999) 3 17.65 37.66 -
4. Class IV(10,000-19,999) 7 41.18 43.23 29.9
5. Class V(5,000-9,999) 5 29.41 15.40 6.23
6. Class VIl(less than 5,000) 2 11.76 3.72 -
Source: Census of India, 2001, Paper 2 of Arunachal Pradesh.
BOX 11.1
Determinants of Inter-district Variation in Urbanisation
The regression of level urbanisation (U) on district per
capita income (Y), road density (R), percentage
contribution of manufacturing sector to district domestic
product (M), and percentage of workers engaged in non-
agricultural occupation (W) is as follows:
U= 28.08-0.27Y+0.18R-0.15M + 0.35W
(3.8) (1.2) (0.89) (0.7) (2.6*)
R2=0.73 AdjR2=0.54 n=12
*significant at 0.05 level of significance.
The figures in parenthesis are‘t’ values, R2 and AdjR2
values are given and n is the number of observations
(districts). The explanatory variables have the expected
sign except per capita income and percentage
contribution of manufacturing sector to district domestic
product but these two variables are not significant.
There is only one variable i.e., percentage of workers
engaged in non-agricultural occupation i.e., basically in
the services sector which has the primacy in the
determination of inter-district variation of urbanisation.
Slow Internalisation of ExternallyGrafted Urban Centres
One of the important features of the growth of urban
settlements in Arunachal Pradesh is the dominant role of
the inter-State migration rather than intra-State rural-
urban migration. When the process of urbanisation is the
concomitant outcome of internal social dynamics, intra-
State rural-urban migration is seen to be the major
phenomenon that leads to the growth of urban centres.
But in the case of Arunachal Pradesh such rural-urban
migration played an insignificant role in the early phase of
the growth of the urban settlements. The details of urban
migrants based on the 1991 census are shown in
Annexure Table A-11.5.
Annexure Table A-11.5 reveals that migration was an
important component of the urban population of the State
even in 1991. It was comparatively low in the existing
towns like Bomdila in West Kameng (42.39 per cent),
Pasighat in East Siang (34.32 per cent) and comparatively
high in new towns like Naharlagun, Itanagar and Ziro in
Lower Subansiri (66.10 per cent). The only exception is
Along (59.03 per cent) in West Siang district. The table
also shows that inter-State migration component was
highest in Tezu in Lohit (69.97 per cent) in 1991 and also
quite high in other towns of Arunachal Pradesh where
urbanisation has been affected by administrative
expansion. It is also noteworthy that while the percentage
of scheduled tribe population in Lohit and Dibang Valley
district was 38.18 per cent and 46.49 per cent respectively
in 2001, but their percentage in Tezu and Namsai (Lohit)
and Roing (Dibang Valley) township, accounts for only
26.42 and 19.79 percentage respectively (Annexure Table
A-11.4). Similar is the case of the other districts having
urban settlements. However, there is nothing to be
apprehensive about because the percentage of scheduled
tribes in urban population of Arunachal Pradesh increased
from 17.64 in 1971 to 24.72 in 1981, and finally to 43.39
in 2001.
Socio-economic Aspects of Urbanisation
This sub-section analyses the relationship between a
district level of urbanisation (X1) and its developmental
indicators. These indicators can be broadly divided into
the following subsets:
1. Economic
(a) Per capita income of the district (X2).
(b) Percentage of households below the poverty line
(estimated for HDR for Arunachal Pradesh, 2005)
(X3).
(c) Yield of major agricultural crops (X4).
(d) Number of functioning small-scale industrial units
(X5).
(e) Percentage share of district in terms of annual
production of small scale industries (X6).
2. Infrastructural
(a) Road length per 100 sq km (X7).
(b) Percentage of villages having connectivity status of
roads (X8).
(c) Percentages of villages electrified to total villages
(X9).
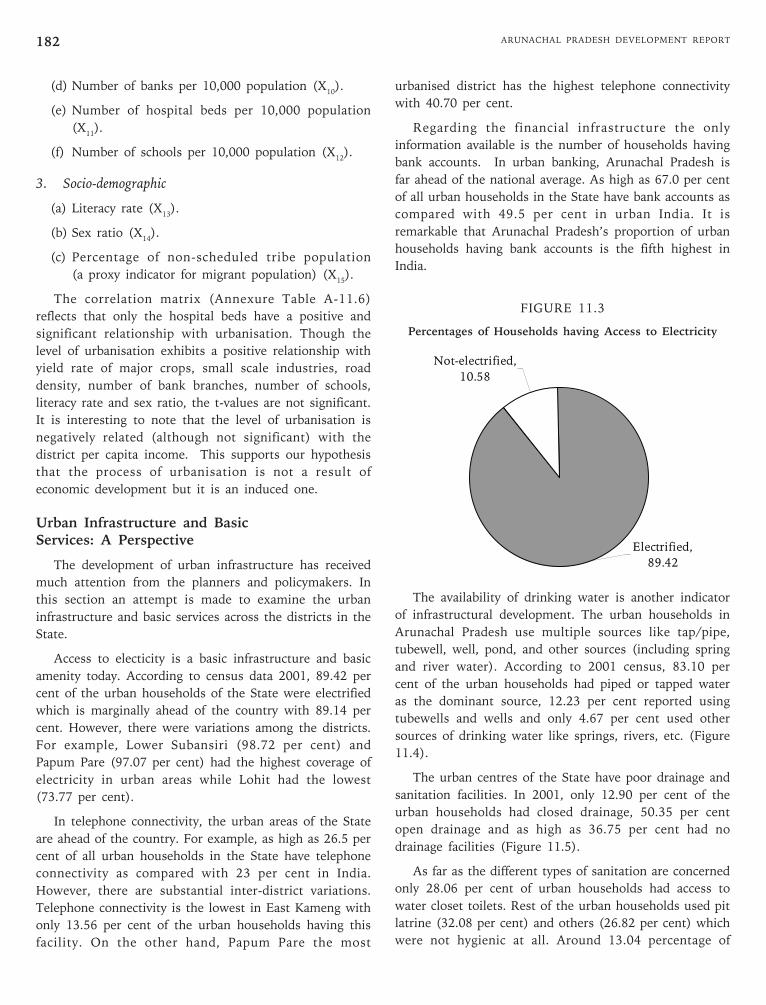
ARUNACHAL PRADESH DEVELOPMENT REPORT182
(d) Number of banks per 10,000 population (X10
).
(e) Number of hospital beds per 10,000 population
(X11
).
(f) Number of schools per 10,000 population (X12
).
3. Socio-demographic
(a) Literacy rate (X13
).
(b) Sex ratio (X14
).
(c) Percentage of non-scheduled tribe population
(a proxy indicator for migrant population) (X15
).
The correlation matrix (Annexure Table A-11.6)
reflects that only the hospital beds have a positive and
significant relationship with urbanisation. Though the
level of urbanisation exhibits a positive relationship with
yield rate of major crops, small scale industries, road
density, number of bank branches, number of schools,
literacy rate and sex ratio, the t-values are not significant.
It is interesting to note that the level of urbanisation is
negatively related (although not significant) with the
district per capita income. This supports our hypothesis
that the process of urbanisation is not a result of
economic development but it is an induced one.
Urban Infrastructure and BasicServices: A Perspective
The development of urban infrastructure has received
much attention from the planners and policymakers. In
this section an attempt is made to examine the urban
infrastructure and basic services across the districts in the
State.
Access to electicity is a basic infrastructure and basic
amenity today. According to census data 2001, 89.42 per
cent of the urban households of the State were electrified
which is marginally ahead of the country with 89.14 per
cent. However, there were variations among the districts.
For example, Lower Subansiri (98.72 per cent) and
Papum Pare (97.07 per cent) had the highest coverage of
electricity in urban areas while Lohit had the lowest
(73.77 per cent).
In telephone connectivity, the urban areas of the State
are ahead of the country. For example, as high as 26.5 per
cent of all urban households in the State have telephone
connectivity as compared with 23 per cent in India.
However, there are substantial inter-district variations.
Telephone connectivity is the lowest in East Kameng with
only 13.56 per cent of the urban households having this
facility. On the other hand, Papum Pare the most
urbanised district has the highest telephone connectivity
with 40.70 per cent.
Regarding the financial infrastructure the only
information available is the number of households having
bank accounts. In urban banking, Arunachal Pradesh is
far ahead of the national average. As high as 67.0 per cent
of all urban households in the State have bank accounts as
compared with 49.5 per cent in urban India. It is
remarkable that Arunachal Pradesh’s proportion of urban
households having bank accounts is the fifth highest in
India.
FIGURE 11.3
Percentages of Households having Access to Electricity
Not-electrified,
10.58
Electrified,
89.42
The availability of drinking water is another indicator
of infrastructural development. The urban households in
Arunachal Pradesh use multiple sources like tap/pipe,
tubewell, well, pond, and other sources (including spring
and river water). According to 2001 census, 83.10 per
cent of the urban households had piped or tapped water
as the dominant source, 12.23 per cent reported using
tubewells and wells and only 4.67 per cent used other
sources of drinking water like springs, rivers, etc. (Figure
11.4).
The urban centres of the State have poor drainage and
sanitation facilities. In 2001, only 12.90 per cent of the
urban households had closed drainage, 50.35 per cent
open drainage and as high as 36.75 per cent had no
drainage facilities (Figure 11.5).
As far as the different types of sanitation are concerned
only 28.06 per cent of urban households had access to
water closet toilets. Rest of the urban households used pit
latrine (32.08 per cent) and others (26.82 per cent) which
were not hygienic at all. Around 13.04 percentage of

183Chapter 11 •
URBAN DEVELOPMENT
urban households had no latrine facility (Annexure Table
A-11.11).
FIGURE 11.4
Percentage of Urban Households withSources of Drinking Water
Tap
83.1
Tubewell/Well
12.23
Spring etc.
4.67
Source: Census of India, 2001, Tables of Houses, Household Amenities andAssets.
FIGURE 11.5
Percentage of Urban Households withDifferent Types of Drainage
Open Drainage
50.35
No Drainage
36.75
Closed
Drainage
12.9
Source: Census of India, 2001, Tables of Houses, Household Amenities andAssets.
The level of urban basic amenities like electricity,
access to tap water, drainage facilities are positively
correlated with urbanisation, although the values are
statistically insignificant (Annexure Table A-11.12). Thus,
it may not be possible to argue that more urbanised
districts provide basic amenities to a larger percentage of
urban population.
Issues of Urban Administration and Planning
Arunachal Pradesh has a unique urban administrative
system. This is the only State in North-east India which
does not have corporations or municipalities. There are
several departments of government which are responsible
for urban development in the State. These include
Directorate of Urban Development and Housing,
Departments of Public Health Engineering, Power, Public
Works Department, etc. However, the Directorate of
Urban Development and Housing is a nodal agency for
the development of urban areas. Hence, in this section an
attempt is made to examine the activities of the
Directorate of Urban Development and Housing.
With the creation of a full fledged State of Arunachal
Pradesh, the town planning unit was set up under the
office of Chief Engineer, Arunachal Pradesh Public Works
Department, Itanagar. A separate directorate of Urban
Development and Housing was established in 1996. The
Directorate was responsible for the preparation of master
plans, action plans, for the urban areas in the State,
preparation of designs including building designs, interior
décor, plans for government buildings, traffic and
transportation plans, and implementation of other
developmental schemes. The Directorate was also
implementing developmental schemes like infrastructural
development and centrally sponsored schemes like
(i) Swarna Jayanti Shahari Rozgar Yojana (SJSRY), (ii)
Nehru Rozgar Yojana (NRY), (iii) National Urban
Information Scheme (NUIS), (iv) National Slum
Development Programme (NSDP), (v) Integrated
Development of Small and Medium Towns (IDSMT).
However, it was observed that these schemes could not be
implemented satisfactorily as the scope and nature of the
schemes were different from the schemes so far being
implemented by the Directorate. The operational
guidelines of these schemes require a different
organisational set-up, working flexibility and work culture.
Further, these schemes require participation of local
voluntary agencies, social workers, etc., who are already
engaged in the programmes for the upliftment of the
urban poor.
The urban development sector in the State has not
received the priority it deserves. The outlay on urban

ARUNACHAL PRADESH DEVELOPMENT REPORT184
development in the Ninth and Tenth Five Year Plans is
shown in Table 11.2.
TABLE 11.2
State Plan Outlay in Urban DevelopmentSector (in Rs. lakh)
Sector Ninth Five Ninth Five Tenth Five YearYear Plan Year Plan Plan Outlay
Outlay Actual Expenditure
Urban Development 3710 (1.04) 1239.94 10,500 (2.70)
Note: Figures in the bracket indicate percentage to total outlay.
Source: Tenth Five Year Plan (2002-2007), Government of ArunachalPradesh.
Table 11.2 shows that the urban development sector
got only 1.04 per cent of total outlay during the Ninth
Five Year Plan but it has slightly increased to 2.70 per
cent during the Tenth Five Year Plan. However, this is
nowhere near 8 per cent of the outlay recommended by
the National Commission on Urbanisation. At the same
time, it is surprising to note that only 33.42 per cent was
spent on urban development out of the total fund allotted
during the Ninth Five Year Plan.
Policy Implications
Arunachal Pradesh had, no doubt, a late start in
urbanisation process, but within two decades, it had
overtaken Assam, which has a long history of
urbanisation. The growth rate of urbanisation is high
(101.29 per cent in 1991-2001). This fairly rapid growth
of urban population deserves serious attention of urban
planners.
• Arunachal Pradesh is basically a hilly State with
different environmental set up and geomorphic
characteristics. Hence, the State may not support
the excessive concentration of urban population in
its big towns and also the hilly terrain may not
permit the lateral expansion of big towns as in the
plains. Hence, it is suggested that instead of
population conglomerating in one or two large
towns, it is better to have more small and medium
towns in different districts of the State.
• It is found that almost all the towns in the State are
not planned and they grew as administrative centres
only. The small towns with high potentialities can
be developed in a planned way to accommodate the
rising urban population of the State. The small
towns are nothing but the overgrown villages that
have acquired some features of urban environment.
Such urban centres need to be taken care of, as
planned growth becomes necessary in view of the
environmental concerns in the long run.
• It is observed that there is a mushroom growth of
settlements in some urban areas particularly in
Itanagar and Naharlagun where multistoried
concrete buildings are coming up without following
building codes and that too on unconsolidated to
loose terrace material. The area falls under very
high risk zone of earthquake and landslide. This
needs serious attention of the urban planners.
There is a need for setting up an umbrella body
which can strictly check undesirable construction. In
fact, there should be strict vigilance on land
allotment so that the hills should not be
demolished for the personal benefits of few people.
It should be noted that such activities will create
environmental problems in the near future and will
have an adverse impact on the livelihoods of the
common people.
• The other environmental issues associated with
urbanisation are poor urban waste management. It
is estimated that the total urban solid waste
management is accumulated around 230 tonnes per
day (State Development Report, Chapter 15).
Although the amount may not be alarming, it needs
special attention for its proper disposal. Therefore,
there is need to construct treatment and disposal
facilities for urban solid waste as well as biomedical
waste particularly in Itanagar, Naharlagun and
Pasighat towns.
• At present urban development schemes are
implemented by and large on ad hoc basis. With
growing urbanisation, it is necessary that a
comprehensive policy on the subject should be
formulated for guidance of various agencies
involved in the system. The policy may spell out the
framework for providing economic, social and
physical inputs for proper planning and
development of urban centres, the hierarchy of the
urban centres, their assigned functions and their
linkages with the hinter land. Therefore, the urban
management structure must be streamlined by
abolishing the system of multiplicity of authorities
dealing with urban planning and execution.
• There is another aspect of urbanisaion demanding
proper planning. With urbanisation, there has
invariably been the emergence and expansion of the
informal sector. The size of the sector may not be

185Chapter 11 •
URBAN DEVELOPMENT
high in the State but it is expanding. In fact, a
significant percentage of workers are engaged in
construction sector, hotels and restaurants, vending
fruit and vegetables, and small retailing. In the
overall planning of urban development due
importance should be given to make institutional
arrangements for freeing the informal sector from
unequal bargaining position.
• No plan of urban development can be successfully
carried out without mobilisation of adequate
resources. In this respect, urban development gets
the major share of its funds from the State which
heavily depends on the Centre for grants-in-aid.
The State also should raise resources locally for
urban development and management. There is a
need for setting up the urban municipalities in the
State. Recently the Government of Arunachal
Pradesh has decided to establish municipality in
two towns namely, Itanagar and Pasighat. The
possibility of generating resources locally will
depend on the participation of the local people in
planning and execution of schemes. This can be
ensured by elected self-governing bodies.
• Even at the State level a broad generalised
development strategy may not help in managing
urbanisation. A more conscious assessment of
growth at district level and its spatial configuration
are essential (Sivaramakrishnan et al, 2005). This
makes district planning crucial. The 74th Amendment
has specifically mandated District Planning
Committees (DPCs) to address issues of common
interest to municipalities including spatial planning,
integrated development of infrastructure and
environmental conservation. These committees are
required to integrate urban and rural planning and
facilitate the development of regional infrastructure.
Hence, it is necessary to constitute DPCs in the State
for proper rural-urban integration.

ARUNACHAL PRADESH DEVELOPMENT REPORT186
ANNEXURE TABLE A-11.1
Year of Opening of Administrative Centresand Early Administrative Status of the Towns
in Arunachal Pradesh, 1991
Name of the Town Year of Opening Administrative Statusof Administrative
Centre
Bomdila 1953 Divisional Head Quarters ofKameng Frontier Division
Ziro 1952 Divisional Head Quarters ofSubansiri Frontier Division
Along 1948 Divisional Head Quarters ofSiang Frontier Division
Pasighat 1911 Sub-divisional Head Quartersof Pasighat Subdivision inSiang Frontier Division
Tezu 1952 Divisional Head Quarters ofLohit Frontier Division
Namsai 1953 Sub-divisional Head Quartersof Namsai Sub division inLohit Frontier Division
Khonsa 1954 Divisional Head Quarters ofTirap Frontier Division
Roing 1951 Sub-divisional Head Quartersof Anini Sub Division in LohitFrontier Division
Old Itanagar 1974 Old Capital Complex
New Itanagar 1978 New Capital Complex
Source: District Gazetters, Government of Arunachal Pradesh.
ANNEXURE TABLE A-11.2
Number of Towns and Percentage of UrbanPopulation in North-east India, 2001
Sl.No. States Statutory Census Total % of UrbanTown Population
01 Arunachal 00 17 17 20.41Pradesh
02 Assam 80 45 125 12.72
03 Manipur 28 05 33 23.88
04 Meghalaya 10 06 16 19.63
05 Mizoram 01 21 22 49.50
06 Nagaland 08 01 09 17.74
07 Sikkim 08 01 09 11.10
08 Tripura 13 10 23 17.02
09 North-east 143 106 249 21.50
Source: Census of India, 2001, Paper 2 of Arunachal Pradesh.
ANNEXURE TABLE A-11.3
Trends in Urbanisation of Arunachal Pradesh, 1971-2001
Year Total Urban Percentage of Decennial AnnualPopulation Urban Growth Exponential
Population Rate(%) GrowthRate (%)
1971 17,288 3.70 - -
1981 41,428 6.56 139.63 9.13
1991 1,10,628 12.80 167.04 10.32
2001 2,22,688 20.41 101.29 7.24
Source: Census of India, 2001, Paper 2 of Arunachal Pradesh.
ANNEXURE TABLE A-11.4
Distribution of Scheduled Tribe Populationin Urban Centres of Arunachal Pradesh, 2001
District % of ST Population % of ST Population in Urbanof the District Centres of the District
Tawang 74.99 29.20
West Kameng 49.53 43.09
East Kameng 86.72 70.95
Papum Pare 56.56 44.03
Lower Subansri 90.09 68.06
Upper Subansiri 78.21 74.60
West Siang 81.72 50.63
East Siang 69.13 34.68
Lohit 38.18 26.42
Dibang Valley 46.49 19.79
Changlang 36.16 26.36
Tirap 83.76 38.35
Source: Census of India, 2001, Paper 2 of Arunachal Pradesh.
ANNEXURE TABLE A-11.5
Percentage Distribution of Birth Place UrbanMigrants in Arunachal Pradesh, 1991
Sl. No. State/Districts Migrants as Intra- Inter- Inter- InternationalPer cent of district district state
UrbanPopulation
1. West Kameng 42.39 17.65 23.57 44.94 13.85
2. Lower Subansiri 66.10 21.71 13.17 61.88 3.24
3. West Siang 59.03 34.69 11.49 50.24 3.58
4. East Siang 34.32 19.34 14.07 58.67 7.92
5. Lohit 55.79 13.39 10.81 69.97 5.85
6. Tirap 56.02 22.03 18.34 53.14 6.49
7. Arunachal Pradesh 57.48 20.61 13.61 60.65 5.13
Note: Those districts which do not have urban centres are not included.
Source: Census of India, 1991, Series 3- Arunachal Pradesh, Migration Table,Volume I.

187Chapter 11 •
URBAN DEVELOPMENT
AN
NE
XU
RE
TA
BL
E A
-11
.6
Inte
rdep
en
den
ce b
etw
een
Urb
an
isati
on
an
d I
nd
icato
rs o
f S
oci
o-e
con
om
ic D
evelo
pm
en
t at
Dis
tric
t L
evel
in A
run
ach
al
Pra
desh
X1
X2
X3
X4
X5
X6
X7
X8
X9
X10
X11
X12
X13
X14
X15
X1
1-0
.14
-0.4
16
0.1
46
0.5
54
0.4
09
0.0
32
-0.0
35
-0.3
36
0.3
50.8
14(*
*)-0
.141
0.4
98
0.2
18
-0.0
94
X2
-0.1
41
-0.4
52
0.2
50.1
91
-0.0
46
-0.0
71
0.2
98
0.0
27
0.4
96
0.2
5-0
.143
0.3
38
-0.4
25
0.3
19
X3
-0.4
16
-0.4
52
1-0
.392
-0.2
15
-0.0
37
-0.1
03
0.0
39
-0.1
42
-.746(*
*)-.
686(*
)-0
.054
-0.2
85
-0.2
07
0.3
06
X4
0.1
46
0.2
5-0
.392
10.4
59
0.4
94
-0.0
69
0.3
89
0.0
27
0.2
44
0.1
99
0.0
22
0.1
56
0.3
27
0.1
13
X5
0.5
54
0.1
91
-0.2
15
0.4
59
10.6
44(*
)0.0
56
0.5
83(*
)-0
.081
0.4
22
0.4
13
-0.3
82
.739(*
*)-0
.141
0.4
36
X6
0.4
09
-0.0
46
-0.0
37
0.4
94
0.6
44(*
)1
0.2
19
0.7
00(*
)0.0
93
-0.0
20.2
15
-0.5
51
0.3
46
-0.0
42
0.4
31
X7
0.0
32
-0.0
71
-0.1
03
-0.0
69
0.0
56
0.2
19
10.2
46
0.6
60(*
)0.3
65
-0.2
06
0.2
09
-0.2
60.1
5-0
.235
X8
-0.0
35
0.2
98
0.0
39
0.3
89
0.5
83(*
)0.7
00(*
)0.2
46
10.2
59
0.0
69
-0.0
06
-0.3
91
0.4
49
-0.3
93
0.4
35
X9
-0.3
36
0.0
27
-0.1
42
0.0
27
-0.0
81
0.0
93
0.6
60(*
)0.2
59
10.3
95
-0.4
13
-0.1
16
-0.1
03
-0.1
22
0.0
53
X10
0.3
50.4
96
-.746(*
*)0.2
44
0.4
22
-0.0
20.3
65
0.0
69
0.3
95
10.4
60.0
86
0.4
6-0
.08
-0.0
05
X11
0.8
14(*
*)0.2
5-.
686(*
)0.1
99
0.4
13
0.2
15
-0.2
06
-0.0
06
-0.4
13
0.4
61
-0.0
68
0.6
03(*
)0.0
12
-0.1
05
X12
-0.1
41
-0.1
43
-0.0
54
0.0
22
-0.3
82
-0.5
51
0.2
09
-0.3
91
-0.1
16
0.0
86
-0.0
68
1-0
.492
0.4
76
-.681(*
)
X13
0.4
98
0.3
38
-0.2
85
0.1
56
.739(*
*)0.3
46
-0.2
60.4
49
-0.1
03
0.4
6.6
03(*
)-0
.492
1-0
.572
0.5
25
X14
0.2
18
-0.4
25
-0.2
07
0.3
27
-0.1
41
-0.0
42
0.1
5-0
.393
-0.1
22
-0.0
80.0
12
0.4
76
-0.5
72
1-.
721(*
*)
X15
-0.0
94
0.3
19
0.3
06
0.1
13
0.4
36
0.4
31
-0.2
35
0.4
35
0.0
53
-0.0
05
-0.1
05
-.681(*
)0.5
25
0.7
21(*
*)1
Not
e:**
Sig
nif
ican
t at
th
e 0.0
1 l
evel
* S
ign
ific
ant
at t
he
0.0
5 l
evel
.
Sou
rce:
Com
pu
ted
by
the
auth
or.

ARUNACHAL PRADESH DEVELOPMENT REPORT188
ANNEXURE TABLE A-11.7
Percentage of Urban Households havingAccess to Electricity
Districts Electricity (%)
Tawang 96.44
West Kameng 95.84
East Kameng 82.81
Papum Pare 97.07
Lower Subansiri 98.72
Upper Subansiri 96.00
West Siang 95.42
East Siang 76.34
Dibang Valley 90.51
Lohit 73.77
Changlang 85.45
Tirap 85.45
Arunachal Pradesh 89.42
Source: Census of India, 2001, Tables of Houses, Household Amenities andAssets.
ANNEXURE TABLE A-11.8
Percentage of Urban Households having Bankingand Telephone Facilities
Districts Banking Telephone
Tawang 84.99 47.68
West Kameng 72.16 30.17
East Kameng 62.75 13.56
Papum Pare 68.75 40.70
Lower Subansiri 61.82 22.53
Upper Subansiri 63.58 21.33
West Siang 77.60 23.44
East Siang 67.13 18.77
Dibang Valley 73.12 19.86
Lohit 57.29 19.17
Changlang 63.91 20.03
Tirap 63.74 17.37
Arunachal Pradesh 67.00 26.53
Source: Census of India, 2001, Tables of Houses, Household Amenities andAssets.
ANNEXURE TABLE A-11.9
Percentage of Households havingDifferent Sources of Water
Districts Tap Tubewell/Well/Pond River/Spring etc.
Tawang 93.79 3.14 3.06
West Kameng 96.45 0.99 2.55
East Kameng 82.95 1.01 16.04
Papum Pare 85.56 7.14 7.30
Lower Subansiri 95.15 4.63 0.21
Upper Subansiri 97.66 1.36 0.97
West Siang 88.28 11.10 0.61
East Siang 72.15 26.61 1.24
Dibang Valley 99.80 00 0.19
Lohit 61.80 33.08 5.13
Changlang 90.55 5.97 3.48
Tirap 69.74 24.82 5.43
Arunachal Pradesh 83.10 12.32 4.58
Source: Census of India, 2001, Tables of Houses, Household Amenities andAssets.
ANNEXURE TABLE A-11.10
Percentage of Urban Households havingDifferent Types of Drainage
Districts Closed Drainage Open Drainage No Drainage
Tawang 18.70 70.78 10.53
West Kameng 12.42 74.71 12.87
East Kameng 16.60 35.99 47.41
Papum Pare 18.09 51.33 30.58
Lower Subansiri 29.91 62.17 7.91
Upper Subansiri 8.19 66.15 25.66
West Siang 14.38 50.41 35.20
East Siang 9.66 48.06 42.27
Dibang Valley 2.82 52.58 44.60
Lohit 5.64 26.28 68.07
Changlang 1.70 51.81 46.48
Tirap 8.14 57.84 34.02
Arunachal Pradesh 12.90 50.35 36.75
Source: Census of India, 2001, Tables of Houses, Household Amenities andAssets.

189Chapter 11 •
URBAN DEVELOPMENT
TABLE A-11.11
Percentages of Households havingDifferent Types of Sanitation
Districts Pit Latrine Water Closet Others No Latrine
Tawang 15.08 67.80 13.20 11.78
West Kameng 12.64 22.74 49.47 15.14
East Kameng 18.52 24.63 17.05 39.80
Papum Pare 26.65 25.40 36.42 11.52
Lower Subansiri 31.05 30.98 34.15 3.81
Upper Subansiri 33.27 14.93 39.61 12.20
West Siang 27.37 25.37 22.45 14.20
East Siang 45.62 15.44 31.66 7.28
Dibang Valley 22.20 54.58 10.66 12.56
Lohit 45.82 29.83 12.30 12.04
Changlang 34.62 41.00 98.26 14.55
Tirap 33.65 31.48 19.63 15.24
Arunachal Pradesh 32.08 28.06 26.82 13.04
Source: Census of India, 2001, Tables of Houses, Household Amenities andAssets.
TABLE A-11.12
Interdependence between Level of Urbanisationand Selected Indicators of Basic Urban Amenities
Var.1 Var.2 Var.3 Var.4
Var.1 1.000 0.277 0.220 0.081
Var.2 0.277 1.000 0.809 (**) 0.531
Var.3 0.220 0.809 (**) 1.000 0.224
Var.4 0.081 0.531 0.224 1.000
Note: ** Significant at the 0.01 level
Variable 1: Level of Urbanisation.
Variable 2: Percentage of Urban Households with Access toElectricity.
Variable 3: Percentage of Urban Households with Tap Water.
Variable 4: Percentage of Urban Households with ClosedDrainage.
ANNEXURE TABLE A-11.13
Annual Expenditure on Urban Developmentin Arunachal Pradesh
(in ’000 Rs.)
Year Plan Non-plan Total % to TotalExpenditure
1999-2000 24571 2200 26771 0.53
2000-01 26397 2389 28786 0.55
2001-02 30181 2803 32984 0.53
2002-03 36915 2369 39284 0.65
2003-04 44464 4047 48511 0.71
Source: Directorate of Urban Development and Housing, Government ofArunachal Pradesh.

Introduction
Agriculture is the predominant sector in Arunachal
Pradesh, accounting for 27 per cent of the NSDP (in
2003-04) and as per 2001 census, nearly 63 per cent of
total workers were engaged in agricultural activities.
Given the hilly topography and diversity in farming
systems in the State, modernisation of agriculture, in a
way that enhances productivity and raises the earnings of
those dependent on agriculture, remains one of the
fundamental challenges.
Changing Property Rights Structures
The property rights in land in Arunachal Pradesh have
undergone substantial changes over the last half-century.
The traditional form of land ownership was community-
based, although animals, tools and implements were
privately owned. Most of the villages had some
institutional mechanism like village councils to manage
and safeguard property rights in land and forest. While in
some areas the institution of chieftainship was well
developed and the individuals derived their rights of
ownership from village chief, in many areas the village
council, consisting of all adult male members was the
basic institution of decision making, conflict resolution
and collective action1 (Mishra, 1979; Das, 1995). The
shifting cultivation was based upon cooperation, resource
pooling, and mutual insurance mechanisms. However,
because of internal dynamics of the system such as non-
coverage of covariant risks, absence of fairness in the
distribution of agricultural land in terms of quality, lack of
ARUN
ACH
AL PR
ADESH
Chapter 12
Development of Agriculture
and Allied Sector
sufficient surplus generation and demographic changes as
well as the mutually reinforcing interventions by the State
and market forces, private property rights over land have
emerged in many parts of the State (Mishra, 2001; Roy
and Kuri, 2001:53-59).
Although individualisation of ownership rights over
land is the most widely noticed dimension of the
transitional phase in Arunachal Pradesh, it is important to
note that the communal property rights continue to have
diverse context-specific operational meanings. For many
years, the Jhum Land Regulations, 1947-48, which did
recognise, to some extent, the rights of the tribes
practising shifting cultivation remained the only legal
framework governing access to cultivable land. Recently,
the Arunachal Pradesh (Land Settlement and Records)
Act, 2000 has been passed with a view to conducting the
cadastral survey of land in the State. The land under
shifting cultivation, generally described as under
ownerships by the whole village community and over
which individuals are supposed to have use rights alone,
are owned by specific clans and by individual households2
(Bordoloi, 1998).
Land Use Patterns
Arunachal Pradesh is a hilly state with a very low
population density. Of the total geographical area of the
State around five per cent is available for cultivation. The
scope for further expansion of land under cultivation is
not yet exhausted, however, bringing new areas under
cultivation is costlier in the State, and the scope for
1. The village chiefs had special privileges such as shares from produce, free labour-services of the villagers etc. Surplus generated through this mechanism weregenerally redistributed through rituals, feasts and festivals (Mishra, 1979).
2. On the basis of a micro-study, Mishra (2002a, 2002b) has reported that in case of privately owned land the rights of use, occupancy and inheritance aregenerally enjoyed by the owners, but the right to transfer is often conditional. In some cases 'limited transfer rights' (viz., temporary transfer rights undermortgage, use rights without inheritance rights etc.) and 'preferential transfer rights' (viz., transfer within family, clan or tribe) were found, along withunconditional rights to alienate. The specificity of the emerging private property regime lies not only in its institutional basis but also in the changingdimensions of collective ownership.

ARUNACHAL PRADESH DEVELOPMENT REPORT192
expansion of land under cultivation in some areas is
rather limited. Table 12.1 provides the pattern of land use
in the State. It is clear that the net area sown has been
increasing as a percentage of total reported area. The
shifting cultivation has been undergoing different kinds of
changes in response to the emerging opportunities and
constraints. First, there has been a perceptible decline in
the area under shifting cultivation, although there are
conflicting estimates of the area under shifting cultivation
in the State. Second, the jhum cultivation has changed in
terms of the time span of the jhum cycle, crop mixes and
input use (see Box 12.1).
TABLE 12.1
Changing Land Use Pattern in ArunachalPradesh: 1970-71 to 2000-01
(as Percentage to Total Area under Operation)
Year Net Area Current Other Fallow Land Culturable Land notSown Fallow Uncultivated other than Waste Land Available
Land Current Fallow forCultivation
1970-71 23.56 10.55 3.92 24.08 30.41 7.48
1976-77 28.29 6.26 12.60 26.61 21.37 4.86
1980-81 35.22 6.89 10.39 17.05 14.18 16.27
1985-86 43.38 7.18 8.32 14.24 12.91 13.98
1990-91 47.33 8.13 12.70 10.24 9.43 12.16
1995-96 47.76 8.85 11.62 13.68 10.66 7.43
2000-01 50.86 5.83 11.74 16.27 7.07 8.23
Source: Agricultural Census of Arunachal Pradesh, various years.
BOX 12.1
Jhum Cultivation in Arunachal Pradesh
Shifting cultivation, or jhum, is the traditional cultivation
system of the indigenous people in many parts of
Arunachal Pradesh. The Forest Survey of India data
suggest that during 1987-1997, 0.23 million ha of area in
Arunachal Pradesh has been affected by shifting
cultivation. According to the State of India’s Forests
reports during the 1990s, shifting cultivation has been the
major cause of forest degradation in Arunachal Pradesh.
For many years the government agencies have actively
pursued the policy of expansion of permanent cultivation
and have discouraged shifting cultivation. However,
shifting cultivation system provides livelihoods to a large
section of the rural population of the State. Many of the
jhumias still reside in remote and relatively underdeveloped
pockets of the State. Pursuing them to leave their
traditional way of living has not been easy for the
government. A recent body of research, has however,
questioned the traditionally held opinion that jhum
cultivation is a wasteful and inefficient method of
cultivation. Linking the crop diversity to the cultivation
practices, researchers point out that the jhum cultivation
systems typically involve mixed and sequential cropping.
The jhum farmers in Arunachal Pradesh raise between 8 to
35 crops on a small plot of 2 to 2.5 ha with simultaneous
sowing and sequential harvesting. It is thus considered as
‘a highly intensive system of farming in harmony with the
environment’. With the shortening of the jhum cycle to 3-
10 years, the crop-mixture and cropping pattern has also
changed. As a result of high population pressure,
particularly in urban vicinities, burning of slash is
dispensed with, which has led to rotational/sedentary
system of cultivation. A shift towards certain crop-species,
which are more appropriate under reduced fertility status
of the soil, signifies the response of the forest farmers to
ecological stress (Ramakrishnan, 1992). Researchers point
out that the redevelopment of jhum cultivation in the
north-eastern region could be possible through inter-tribe
and inter-regional transfer of technology and cropping
practices, maintenance of a jhum cycle of minimum 10
years, which is found to be critical for sustainability;
improvement of the nitrogen economy of jhum at the
cropping and fallow phases by nitrogen-fixing legumes and
non-legumes and accelerated restoration of degraded land
(Ramakrishnan, 1992).
The emergence of private property rights over land is
often preceded by adoption of permanent cultivation,
which in turn might have followed a gradual shortening of
the jhum cycle or abandonment of jhum cultivation. Thus,
the increasing significance of private property rights over
cultivable land could be inferred from Figure 12.1, where
the share of area under settled cultivation in total
operated area has been presented.3 While the area under
settled cultivation has increased from 5.73 per cent in
1970-71 to 31.96 per cent in 1995-96 as a proportion of
total operated area, its share in net sown area has gone up
from 24.31 per cent to 48.84 per cent during the same
period (Table 12.2).
Trends in Agrarian Structure
The distribution of land ownership is often considered
to be an important indicator of the access to one of the
most important means of production in predominantly
agrarian economies. However, because of the non-
availability of data on land ownership in Arunachal
Pradesh, the distribution of operational holdings has been
used to understand the changes in agrarian structure in
Arunachal Pradesh.
3. The steady decline in the proportion of area under jhum cultivation during 1970-71 to 1990-91 seems to have slowed down during 1990-91 to 1995-96. Whilethe reasons behind such a shift needs more careful investigation, a study on changing livelihood diversification in rural Arunachal Pradesh had reported thatin response to the short fall in earnings, following the restriction of felling of trees in 1993, at least some households returned back to jhum cultivation, whichthey had left a few years ago (Mishra, 2003b).

193Chapter 12 •
DEVELOPMENT OF AGRICULTURE AND ALLIED SECTOR
Size-Class Distribution of OperationalHoldings: 1970-71 to 2000-01
As per Agricultural Census, 2000-01, around 16 per
cent of operational holdings were marginal, operating on
less than 2 per cent of the total operated area. Around 33
per cent of holdings in the State were small or marginal
(Figure 12.2). On the other hand, only 5 per cent of
holdings belonging to the large size operated on nearly 23
per cent of area. Between 1970-71 to 2000-01, there was
a significant increase of the share of marginal, small and
semi-medium categories of holdings, while that of the
medium and large size-classes declined (Table 12.3).
0.00
20.00
40.00
60.00
80.00
100.00
1970-71 1976-77 1980-81 1985-86 1990-91 1995-96
Jhum Permanent
FIGURE 12.1
Share of Jhum and Settled Cultivation in Total Operated Area in Arunachal Pradesh: 1970-71 to 1995-96
TABLE 12.2
Extent of Jhum and Settled Cultivation inArunachal Pradesh: 1970-71 to 1995-96
Year Share in Total Operated Area Share in Net Area Sown
Jhum Permanent Jhum Permanent
1970-71 94.27 5.73 75.69 24.31
1976-77 89.88 10.12 64.25 35.75
1980-81 84.51 15.49 56.01 43.99
1985-86 77.70 22.30 48.59 51.41
1990-91 68.90 31.10 44.08 55.92
1995-96 68.04 31.96 51.16 48.84
Source: Agricultural Census, Government of Arunachal Pradesh, various years.
TABLE 12.3
Size Class-wise Distribution of Operational Holdings (Arunachal Pradesh): 1970-71 to 2000-01(in percentage)
Share in Total Holdings
Size Class ofOperationalHoldings (in Ha) 1970-71 1976-77 1980-81 1985-86 1990-91 1995-96 2000-01
No Area No Area No Area No Area No Area No Area No Area
Marginal 7.67 0.71 9.69 0.99 16.53 2.25 17.18 2.67 17.38 2.87 19.26 3.03 14.04 1.90
Small 11.96 2.77 18.25 4.36 20.75 6.89 18.87 7.02 18.40 7.51 19.37 7.62 18.78 6.73
Semi-Medium 25.91 11.63 27.42 12.75 28.13 17.81 31.17 21.80 32.01 24.00 28.97 22.36 34.05 24.57
Medium 36.40 35.00 27.32 28.34 28.10 38.87 27.01 40.17 27.16 42.13 26.65 43.32 27.80 43.49
Large 18.06 49.89 17.33 53.57 6.48 34.18 5.77 28.33 5.04 23.50 5.75 23.67 5.33 23.30
All 100.00 100.00 100.00 100.00 100.00 100.00 100.00 100.00 100.00 100.00 100.00 100.00 100.00 100.00
Source: Agricultural Census, Government of Arunachal Pradesh, various years.

ARUNACHAL PRADESH DEVELOPMENT REPORT194
Thus, the prominent feature of the agrarian structure as
captured through the distribution of operational holdings
is the increase in the share of smaller holdings. Various
causes of this process of increasing dominance of small
and marginal holdings in the agrarian structure have been
put forth. The State Report of Agricultural Census, 1976-
1977 explained the rise in the number of small and semi-
medium holdings and the decrease in large size holdings
at the state level as a result of transfer of land from larger
to smaller cultivators and considered it as an ‘automatic
socio-economic corrective’. The fragmentation of holdings
due to family/clan-partition, partial or complete
abandonment of large jhum plots in favour of smaller
permanent holdings might have caused the decline in the
number of large size holdings. In addition to these, the
following causes might explain the decline of large
category of holdings in Arunachal Pradesh: (i) the shift of
manpower from rural/agricultural occupations to urban/
non-agricultural occupations; (ii) increasing population
pressure on fertile plain land which is scantily available;
and (iii) the influx of migrant labourers as tenants.
However, given the increasing popularity of horticulture
and the drive for land occupation among the neo-rich,
underreporting of area under the large-category of
holdings is also a distinct possibility. The gini
concentration ratio demonstrates a decline in inequality in
the distribution during 1980-81 to 1990-91, but between
1990-91 to 1995-96 there has again been a rise in
inequality in the distribution of operational holdings in
the State, a trend that has not continued in 2000-01,
although the relative share of the large-sized holdings has
shown an increase (Annexure Table A-12.1). Decline
during 1990-91 to 2000-01 in the inter-class
concentration ratio4 also shows that the relative shares of
the three smaller categories, declined after an upward
trend during the earlier period.
There is considerable inter-district variation in the
shares of different classes of holdings in the State
(Annexure Table A-12.2). The share of marginal holdings
in the districts, for example, varies from a high of 70.79
per cent in Tawang to a low of 1.58 per cent in Upper
Subansiri district. In a number of districts, the semi-
medium category of holdings seems to have an
overwhelming presence, while in others, their share is
relatively small. The variations are particularly high in the
case of the smallest and the largest of the size classes.
The size class-wise distribution of holdings, like many
other aspects of agriculture in the State, seem to have
been influenced by the local topography and other
agricultural conditions.
Another aspect of the agrarian structure that assumes
much significance in the State is the relative share of
holdings operated by the scheduled tribes. There has been
a marginal decline in the share of ST operated holdings,
both in number of holdings and area operated, during
4. The Index of Inter-Class Concentration Ratio for the i-th size class is defined as:
Ii =[( q
i /Σq
i)/ (p
i /Σp
i)]*100
where q
i and p
i are the area owned and number of households for the i-th class respectively.
FIGURE 12.2
Share of Small and Marginal Holdings in Arunachal Pradesh: 1970-71 to 2000-01
0
10
20
30
40
50
1970-71 1975-76 1980-81 1985-86 1990-91 1995-96 2000-01
Share of Marginal and Small Holdings in No Share of Marginal and Small Holdings in Area

195Chapter 12 •
DEVELOPMENT OF AGRICULTURE AND ALLIED SECTOR
1970-71 to 1995-96 (Annexure Table A-12.3). However,
among various size classes, the relative share of ST
operated holdings within the marginal category of
holdings has seen the sharpest decline. As the operational
holdings belonging to the scheduled tribes accounts for
around 93 per cent of the holdings in the State, the size
class distribution of ST operated holdings, by and large,
follows the same pattern as that of the total holdings
(Annexure Table A-12.4).
The average size of holding has declined from 6.19 ha
in 1970-71 to 3.69 ha in 2000-01, partly showing
increasing population pressure on the agricultural land.
Within the different size classes, the decline has, however,
not been uniform (Annexure Table A-12.5). In the large
size class for example, the average size increased, during
1970-71 to 1980-81, thereafter it has declined steadily till
1995-96. Between 1995-96 and 2000-01, there has been a
noteworthy increase in the average size of the large size-
class of holdings. Another conspicuous feature is the
decline in the average size of holdings in the marginal,
small and semi-medium size classes during 1990-91 to
2000-01.
Tenancy: Extent and Types
In Arunachal Pradesh, the agrarian structure continues
to be dominated by owner-cultivators, although the areas
under tenancy as well as the percentage share of both
partly leased-in and entirely leased-in holdings are
increasing (Annexure Table A-12.6). A few micro studies
have reported that a land-lease market has already
developed in parts of the State, with labourers from
neighbouring states and countries migrating to the rural
areas as tenants (Roy and Kuri, 2001; Mishra, 2002a,
2002b). However, the agricultural censuses do not report
an upward trend in tenancy. So far as the size class
distribution of leased-in operational holdings is concerned,
it is found that most of them belong to the marginal and
small categories of holdings (Annexure Table A-12.7). In
terms of the types of tenancy, it is found that in 2000-01,
sharecropping accounts for the largest proportion of
leased-in area, followed by ‘other terms’, while fixed
money accounts for around 13 per cent of the area leased-
in (Figure 12.3). There has been a remarkable rise in the
share of area under sharecropping during 1995-96 and
2000-01. There is possibility that the extent of leasing-in
is being underreported in the Agricultural Census data.
Cropping Pattern and Diversification
In the State, there is a significant change in cropping
pattern. The percentage of area under foodgrains has
declined, particularly since 1980. Out of nine major crops
produced the share of foodgrains came down from nearly
87 per cent in the early 1980s to nearly 77 per cent
during 2000-2003. The cereals accounted for 86 per cent
of total area in 1980-1983, but their share came down by
more than 11 percentage points by 2000-2003. Among the
cereals, maize is the only crop that has increased its share
in area during the last two decades, while all others, most
notably rice, have lost their share in total cropped area.
Pulses have also increased their share in total area.
Among other major gainers are oilseeds and vegetables.
The value of the Herfindahl Index declined from 0.38 in
triennium ending 1982-83 to 0.29 during triennium
ending 2002-03, suggesting a greater diversification of the
cropping pattern5 (Table 12.4).
Growth of Area, Production and Yieldof Major Crops: 1970-71 to 2004-05
The performance of agriculture in the state can be
judged from the growth of and yield of different crops and
crop groups presented in Table 12.5.6 During 1980-81 to
2004-05, the foodgrain output in the State grew at a
compound rate of 1.76 per cent. While area under
foodgrains grew at the rate of 1.18 per cent, but the
FIGURE 12.3
Area under Different Types of Tenancy in ArunachalPradesh: 2000-01
5. The Herfindahl Index (H) is an index of concentration. For increasing diversification H is decreasing and vice versa. It is bounded by 0 (completediversification) and 1 (complete specialisation).
6. The following analysis draws on Mishra, 2006.
Fixed Money
Fixed Produce
Share of Produce
Usufructuary
Mortgage
Other Terms
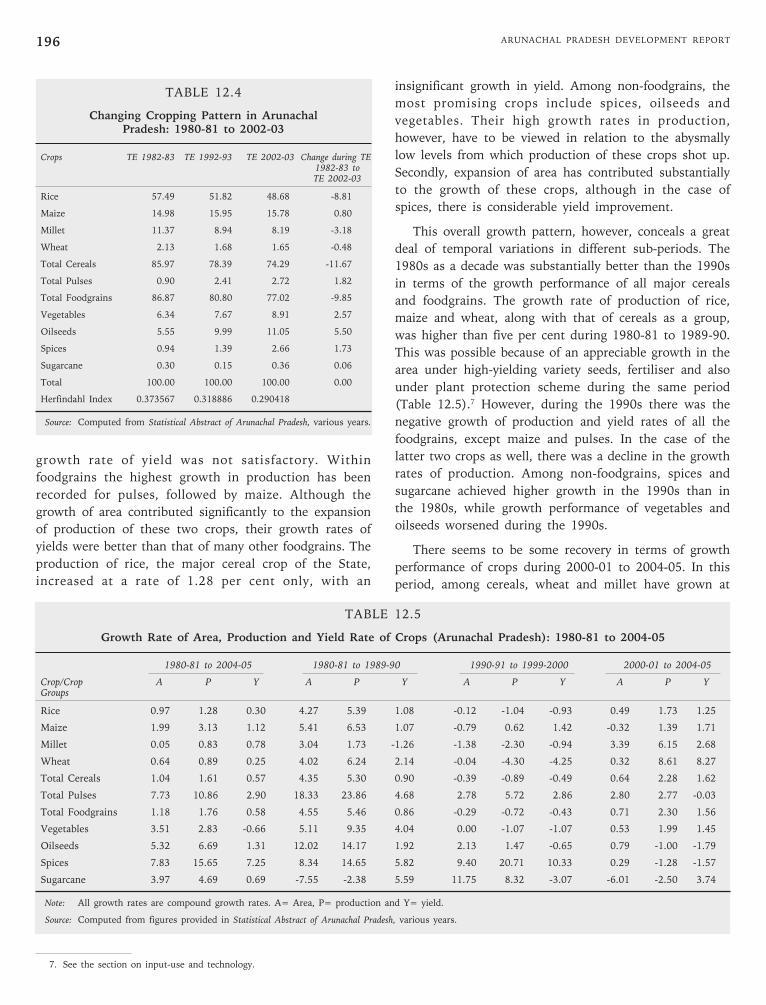
ARUNACHAL PRADESH DEVELOPMENT REPORT196
growth rate of yield was not satisfactory. Within
foodgrains the highest growth in production has been
recorded for pulses, followed by maize. Although the
growth of area contributed significantly to the expansion
of production of these two crops, their growth rates of
yields were better than that of many other foodgrains. The
production of rice, the major cereal crop of the State,
increased at a rate of 1.28 per cent only, with an
insignificant growth in yield. Among non-foodgrains, the
most promising crops include spices, oilseeds and
vegetables. Their high growth rates in production,
however, have to be viewed in relation to the abysmally
low levels from which production of these crops shot up.
Secondly, expansion of area has contributed substantially
to the growth of these crops, although in the case of
spices, there is considerable yield improvement.
This overall growth pattern, however, conceals a great
deal of temporal variations in different sub-periods. The
1980s as a decade was substantially better than the 1990s
in terms of the growth performance of all major cereals
and foodgrains. The growth rate of production of rice,
maize and wheat, along with that of cereals as a group,
was higher than five per cent during 1980-81 to 1989-90.
This was possible because of an appreciable growth in the
area under high-yielding variety seeds, fertiliser and also
under plant protection scheme during the same period
(Table 12.5).7 However, during the 1990s there was the
negative growth of production and yield rates of all the
foodgrains, except maize and pulses. In the case of the
latter two crops as well, there was a decline in the growth
rates of production. Among non-foodgrains, spices and
sugarcane achieved higher growth in the 1990s than in
the 1980s, while growth performance of vegetables and
oilseeds worsened during the 1990s.
There seems to be some recovery in terms of growth
performance of crops during 2000-01 to 2004-05. In this
period, among cereals, wheat and millet have grown at
TABLE 12.4
Changing Cropping Pattern in ArunachalPradesh: 1980-81 to 2002-03
Crops TE 1982-83 TE 1992-93 TE 2002-03 Change during TE1982-83 toTE 2002-03
Rice 57.49 51.82 48.68 -8.81
Maize 14.98 15.95 15.78 0.80
Millet 11.37 8.94 8.19 -3.18
Wheat 2.13 1.68 1.65 -0.48
Total Cereals 85.97 78.39 74.29 -11.67
Total Pulses 0.90 2.41 2.72 1.82
Total Foodgrains 86.87 80.80 77.02 -9.85
Vegetables 6.34 7.67 8.91 2.57
Oilseeds 5.55 9.99 11.05 5.50
Spices 0.94 1.39 2.66 1.73
Sugarcane 0.30 0.15 0.36 0.06
Total 100.00 100.00 100.00 0.00
Herfindahl Index 0.373567 0.318886 0.290418
Source: Computed from Statistical Abstract of Arunachal Pradesh, various years.
TABLE 12.5
Growth Rate of Area, Production and Yield Rate of Crops (Arunachal Pradesh): 1980-81 to 2004-05
1980-81 to 2004-05 1980-81 to 1989-90 1990-91 to 1999-2000 2000-01 to 2004-05
Crop/Crop A P Y A P Y A P Y A P YGroups
Rice 0.97 1.28 0.30 4.27 5.39 1.08 -0.12 -1.04 -0.93 0.49 1.73 1.25
Maize 1.99 3.13 1.12 5.41 6.53 1.07 -0.79 0.62 1.42 -0.32 1.39 1.71
Millet 0.05 0.83 0.78 3.04 1.73 -1.26 -1.38 -2.30 -0.94 3.39 6.15 2.68
Wheat 0.64 0.89 0.25 4.02 6.24 2.14 -0.04 -4.30 -4.25 0.32 8.61 8.27
Total Cereals 1.04 1.61 0.57 4.35 5.30 0.90 -0.39 -0.89 -0.49 0.64 2.28 1.62
Total Pulses 7.73 10.86 2.90 18.33 23.86 4.68 2.78 5.72 2.86 2.80 2.77 -0.03
Total Foodgrains 1.18 1.76 0.58 4.55 5.46 0.86 -0.29 -0.72 -0.43 0.71 2.30 1.56
Vegetables 3.51 2.83 -0.66 5.11 9.35 4.04 0.00 -1.07 -1.07 0.53 1.99 1.45
Oilseeds 5.32 6.69 1.31 12.02 14.17 1.92 2.13 1.47 -0.65 0.79 -1.00 -1.79
Spices 7.83 15.65 7.25 8.34 14.65 5.82 9.40 20.71 10.33 0.29 -1.28 -1.57
Sugarcane 3.97 4.69 0.69 -7.55 -2.38 5.59 11.75 8.32 -3.07 -6.01 -2.50 3.74
Note: All growth rates are compound growth rates. A= Area, P= production and Y= yield.
Source: Computed from figures provided in Statistical Abstract of Arunachal Pradesh, various years.
7. See the section on input-use and technology.

197Chapter 12 •
DEVELOPMENT OF AGRICULTURE AND ALLIED SECTOR
very high rates, mainly because of high growth rates of
yield rate, while rice and maize have grown at the rates of
1.73 and 1.39 per cent per annum respectively. Total
pulses have grown at a rate of 3 per cent, and foodgrain
production has grown at the rate of 2.3 per cent. The
performance of oilseeds, spices, vegetables and sugarcane,
however, has worsened off during the same period. Thus,
after a negative growth of output of most of the crops
during the 1990s, there seems to be some recovery during
the 2000-01 to 2004-05.
Oilseeds have shown a significant growth among the
major crops and crop groups of Arunachal Pradesh (Table
12.6). Among the oilseeds, mustard occupies the
prominent position (Table 12.6). The share of mustard in
total oilseeds production was as high as 90 per cent in
1980-81, which came down to nearly 79 per cent in 2000-
2001. The other important oilseeds were soyabean,
sesame and groundnut, respectively. All these oilseeds
have grown at a very high rate during 1980-81 to 2000-
01, but mainly because of expansion of area under
cultivation rather than improvements in yield rates.
TABLE 12.6
Growth Rate of Area, Production and Yield Rate ofOilseeds (Arunachal Pradesh): 1980-81 to 2000-01
Name of the 1980-81 to 1980-81 to 1990-91 toOilseed 2000-01 1989-90 1999-2000
A P Y A P Y A P Y
Mustard 5.88 7.56 1.59 11.30 12.70 1.26 1.54 1.83 0.27
Groundnut 5.54 5.26 -0.26 9.19 14.80 5.15 0.47 -5.44 -5.88
Sesame 8.37 7.85 -0.48 11.42 8.57 -2.56 4.10 2.43 -1.61
Soyabean 11.68 14.88 2.86 24.15 31.28 5.76 5.40 2.90 -2.36
Other 18.32 16.00 -1.97 24.21 27.92 2.98 5.32 -5.00 -9.80Oilseeds
Total 6.64 8.27 1.54 12.02 14.17 1.92 2.13 1.47 -0.65Oilseeds
Note: All growth rates are compound growth rates. A= Area, P=production and Y= yield.
Source: Computed from figures provided in Statistical Abstract of ArunachalPradesh, various years.
Agricultural Production at the District Level
The compound growth rates of the main cereal crops
at the district level have been presented in Table 12.7.
Due to non-availability of data, the analysis is confined to
only four major cereal crops and to the 11 undivided
districts of the State. However, since these crops account
for around 75 per cent of the total operated area in the
State, the growth performance of these crops at the
district level is likely to provide important insights into
the State of the agrarian economy at a disaggregated level.
During 1980-81 to 2003-04, two districts, namely Lower
Subansisri and Tirap, have witnessed negative growth in
overall cereal production. Relatively higher growth in total
cereals is observed in Dibang Valley, Changlang, East
Siang and Lohit districts. The growth rate of yield was the
highest in East Siang district, while in many of the better
performing districts the growth rate of area under cereals
was relatively high. In terms of crop-specific performance,
as many as 5 out of the 11 districts under study had
negative growth rates in rice production. The decline was
particularly sharp in the case of West Kameng district.
East Siang, Dibang Valley and Changlang have achieved
relatively high growth rates in the production of rice.
Again, apart from East Siang, in all other district the
growth in production of rice was largely a result of
expansion of area rather than improvements in yield rates.
The growth rates of production of maize in almost all
the districts have been much higher than that of rice. The
only district showing a negative growth in maize
production is Lower Subansiri. An important aspect of the
better growth performance of maize in the districts is the
relatively high growth rate of yield rate. In seven districts
the yield rate of maize has increased at a rate of more
than 2 per cent per annum. In the case of millet there
seems to be a wide dispersion of growth rates at the
district level. While Upper Subansiri has recorded a
growth rate of around 8.5 per cent in the production of
millet, Changlang, Tirap and East Kameng have shown
negative growth rates. Some other districts like East Siang
and Lohit have experienced very low growth rates in
millet production. Although the growth rate of production
of wheat has been very high in some of the districts, it is
largely because of expansion of area. In as many as five
districts, the growth rate of production of wheat was
negative during 1980-81 to 2003-04. Thus, there exists a
great deal of variations in the growth performance of
different crops in different districts of the State. However,
while analysing such aggregate growth performance over a
time period, it is important to note the diversity in
cropping pattern of the districts as well as the differences
in the initial levels of agricultural development. For
example, in the triennium ending 2003-04, rice accounted
for more than 70 per cent of area under cereals in a
number of districts such as East Kameng, Lower
Subansiri, West Siang, East Siang and Changlang, while in
some others such as Tawang and West Kameng it
accounted for less than 20 per cent of area under cereals.

ARUNACHAL PRADESH DEVELOPMENT REPORT198
Instability in Agricultural Production
Along with the level of production, fluctuations in
production also affect the agricultural economy. The
coefficient of variation in the area, production and yield of
foodgrains and other major crops has been presented for
the period 1980-81 to 2004-05 and also for different sub-
periods in Annexure Table A-12.8. Among the major
crops and crop groups the highest year-to-year
fluctuations were noticed in the production of spices,
oilseeds, pulses and sugarcane, when the entire period
from 1980-81 to 2004-05 are taken into consideration.
Among the foodgrains, production variability was the
highest in the case of pulses. Whereas, among the cereals
highest variation was in the production of wheat, closely
followed by millet. Yield fluctuations are high in spices,
sugarcane and pulses. Among the cereals, millet has
recorded comparatively higher fluctuations in yield levels.
However, an important fact is that compared to the
1980s, variability in production of a majority of crops
declined in the 1990s.
Trends in Input-use and Technological Change
The pattern of input-use is a reflection of the
technological level in agriculture. One of the significant
features of traditional agriculture is the relatively
unchanging input-combinations, which keeps the sector
tied to the low-level equilibrium trap (Schultz, 1964).
However, while analysing the nature of input-use in
Arunachal Pradesh agriculture, through conventional
indicators, it is important to note that given the
considerable diversity in ecological conditions, some of
these inputs may have limited applicability in certain
regions.8
Not withstanding the policy pronouncements and
efforts by different government agencies to modernise
agriculture in Arunachal Pradesh, the spread of irrigation
and use of modern inputs such as HYV seeds, chemical
fertilisers and pesticides remain limited and confined to
few pockets. However, the State has made steady progress
in the utilisation of these inputs (Figure 12.4). As it is
evident from Table 12.8, during 1981-82 to 1991-92 the
percentage of GCA under irrigation increased from 9 per
cent to 19 per cent, while that under HYV seeds has
increased from 10.79 to 26.76 per cent. During the same
period, the area treated with chemical fertiliser has
increased from merely 2 per cent to 16 per cent. Our
estimates show that during 2003-2005, area under HYV
seeds continue to hover around 26 per cent, but the area
under fertiliser came down to nearly 10 per cent of the
total cropped area. The growth rates of area under HYV
seeds, area under fertiliser and area under plant protection
chemicals during the period 1980-81 to 2004-05 is shown
in Table 12.9. But the growth in the various sub-periods
is found to be highly fluctuating. During the 1980s the
areas under these modern inputs increased at more than
10 per cent per annum, while the growth in use of these
inputs was relatively modest in the 1990s. During 2000-
01 to 2004-05, the use of NPK fertilisers declined. Even
the growth of area under HYV seeds and plant protection
chemicals came down sharply.
TABLE 12.7
Growth Rate of Area, Production and Yield Rate of Cereals in the Districts of Arunachal Pradesh: 1980-81 to 2003-04
District Rice Maize Millet Wheat Cereal
A P Y A P Y A P Y A P Y A P Y
Tawang -0.86 -0.46 0.40 2.38 4.91 2.47 1.41 2.28 0.85 0.16 -0.13 -0.29 0.40 0.78 0.38
West Kameng -1.34 -2.13 -0.80 1.21 3.39 2.14 -0.96 1.56 2.53 1.28 1.48 0.20 0.17 1.98 1.81
East Kameng 1.85 1.78 -0.07 2.55 5.61 2.97 -2.68 -1.55 1.17 -5.93 -6.58 -0.70 1.54 2.18 0.63
Lower Subansiri -0.79 -0.34 0.45 -0.38 -0.50 -0.12 2.04 2.33 0.28 9.55 5.10 -4.07 -0.52 -0.18 0.34
Upper Subansiri 2.70 -0.11 -2.72 2.93 6.87 3.82 10.33 8.45 -1.71 9.92 10.14 0.22 3.45 2.31 -1.10
West Siang 1.30 1.13 -0.17 1.71 3.10 1.35 0.60 1.89 1.29 7.18 6.22 -0.89 1.28 1.44 0.16
East Siang 1.36 2.78 1.40 -0.17 3.19 3.37 -2.20 0.09 2.34 3.41 4.37 0.93 0.47 2.54 2.06
Dibang Valley 1.77 2.90 1.12 2.42 4.52 2.06 0.76 1.47 0.71 12.08 11.61 -0.42 1.95 3.43 1.45
Lohit 1.49 1.69 0.21 6.72 5.35 -1.28 3.50 0.21 -3.18 -0.48 -0.82 -0.34 2.89 2.50 -0.38
Changlang 1.99 2.93 0.92 8.26 10.18 1.77 -0.98 -1.38 -0.41 -0.67 -1.61 -0.95 1.75 2.78 1.03
Tirap 1.24 -1.06 -2.28 2.05 2.53 0.46 0.04 -0.40 -0.44 -8.52 -7.66 0.95 0.78 -0.04 -0.82
Note: All growth rates are compound growth rates. A= Area, P= production and Y= yield.
Source: Computed from figures provided in Arunachal Agriculture in Brief, 1980-1993 and Statistical Abstract of Arunachal Pradesh, various years.
8. The use of irrigation intensity, for example, would be of limited explanatory significance in the context of high altitude agriculture.

199Chapter 12 •
DEVELOPMENT OF AGRICULTURE AND ALLIED SECTOR
FIGURE 12.4
Area under HYV Seeds, Chemical Fertilisersand Plant Protection Chemicals in
Arunachal Pradesh: 1980-81 to 2004-05
0
10
20
30
40
50
60
70
Area under HYV (in '000 Hect) Area under Fertiliser (in '000 hect)
Area under PP Chemical (in '000 Hect)
1980-81
1982-83
1984-85
1986-87
1988-89
1990-91
1992-93
1994-95
1996-97
1998-99
2000-01
2002-03
2004-05
TABLE 12.8
Use of Modern Inputs in Agriculture(as percentage to GCA)
Category of Area Irrigated Area Under Area Treated withHolding HYV Seeds Chemical Fertiliser
1981-82 1991-92 1981-82 1991-92 1981-82 1991-92
Marginal 22.52 6.52 18.95 15.9 14.69 13.47
Small 15.29 19.2 10.61 26.84 4.88 16.33
Semi-Medium 10.99 19.54 10.81 33.82 2.47 17.08
Medium 8.66 19.69 9.13 25.48 1.79 16.4
Large 6.55 22.45 12.59 22.93 1.08 13.42
All 9.02 19.21 10.79 26.76 2.1 15.83
Source: Report on Input Survey, 1981-82 and 1991-92, State AgriculturalCensus Commissioner, Government of Arunachal Pradesh.
TABLE 12.9
Growth Rates of Modern Inputs in ArunachalPradesh: 1980-81 to 2004-05
Inputs 1980-81 to 1980-81 to 1990-91 to 2000-01 to2004-05 1989-90 1999-2000 2004-05
Area Under HYV Crops 11.14 18.78 5.46 1.98
Area Under Fertilisers 13.84 13.86 9.98 3.01
Area Under Plant Protection 5.94 10.75 2.79 -0.25Chemicals
Amount of Fertilisers (NPK) 9.52 13.96 5.77 -0.21used
Note: All growth rates are compound growth rates.
Source: Computed from figures provided in Arunachal Agriculture in Brief,1980-1993 and Statistical Abstract of Arunachal Pradesh, various years.
Apart from the limited suitability of the modern inputs
to production conditions in hill agriculture, another
important cause of their slow adoption is the inadequate
infrastructure. The NSS 59th Round data, presented in
Annexure Table A-12.9 clearly bring out the locational
disadvantages and seasonal variations in the availability of
farm inputs in Arunachal Pradesh. In kharif season, for
example, more than 68 per cent of farmers have to travel
more than 10 kms to get fertiliser. Around 75 per cent
and 30 per cent of farmers have to travel that distance to
get improved seeds and pesticides, respectively.
Given the low use of modern inputs and predominance
of jhum cultivation, it is hardly surprising that there has
been little inflow of formal credit to agriculture in the
State. As per the NSS 59th Round data, only 5.9 per cent
of farming households were found to be indebted in the
State. Among those who have availed themselves of
credit, 49 per cent have taken loans from friends and
relatives, 33 per cent from traders, 10 per cent banks, 4
per cent from the government, and the rest from ‘other
sources’. Thus, the percentage of farmers who have
depended upon informal sources of credit was as high as
86 per cent in the State. Coming to the purpose of loans,
39 per cent have taken it for consumption expenditure, 18
per cent for medical expenditure, 6 per cent for education,
3 per cent for non-farm business, 10 per cent for current
expenditure in farm business, and only 4 per cent have
taken a loan for capital expenditure in farming. Thus, the
character of the credit market itself underlines the
underdeveloped nature of the state’s agrarian economy. A
related problem for enhancement of access to formal
credit in the State, particularly in the rural areas, is that
the nature of property rights and legal safeguards against
transfer of land prevents the use of cultivated land as
collaterals against credit, although recently there has been
efforts to expand credits to farmers in the region through
alternative mechanisms. Unless adequate measures are
adopted for providing credit to farmers, their dependence
on informal credit is likely to continue, which in turn
would act as a barrier to improvements in productivity.
The ongoing efforts to expand credit support to farmers
and other sections of the rural population have rightly
emphasised group-lending schemes as an alternative.
There is a voluminous literature suggesting the
positive impact of literacy and education of the farmers on
adoption of improved technology. There has been a great
deal of improvements in the literacy rate of Arunachal
Pradesh, but low educational standards of the farmers
continue to act as a barrier not only for use and adoption
of new technology, but also for availing the benefits of
different government programmes. Recent data from NSS
suggests that around 50 per cent farmers in the State are
illiterate and around 62 per cent of farmers were either
illiterate or have studied up to below primary school level
(Annexure Table A-12.10).
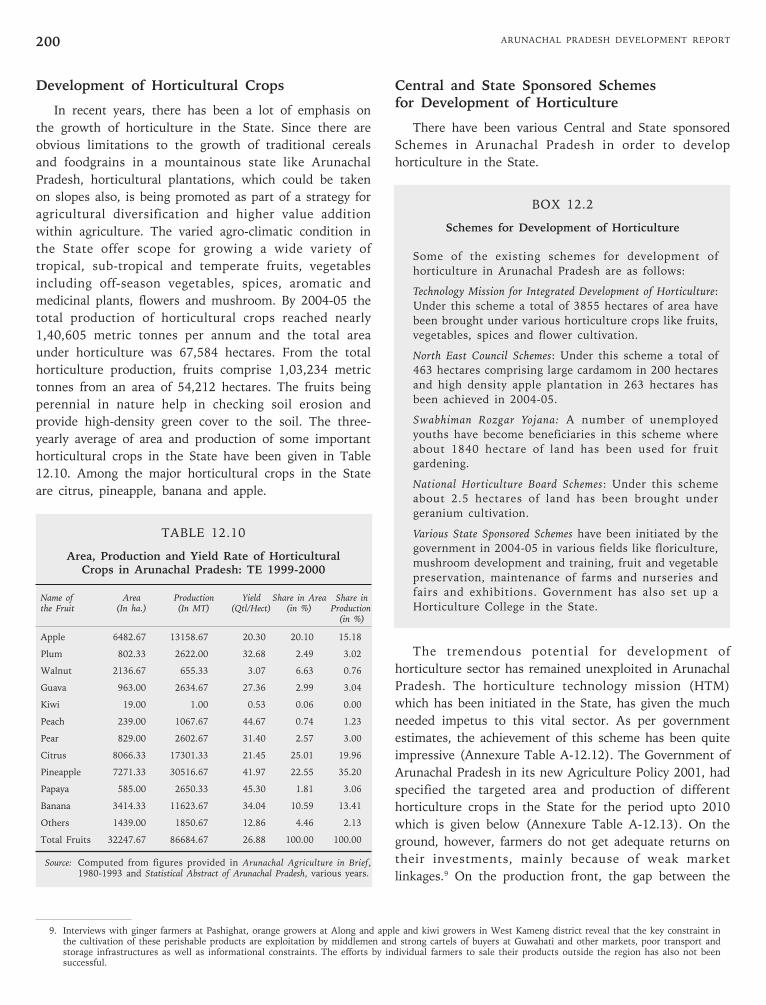
ARUNACHAL PRADESH DEVELOPMENT REPORT200
Development of Horticultural Crops
In recent years, there has been a lot of emphasis on
the growth of horticulture in the State. Since there are
obvious limitations to the growth of traditional cereals
and foodgrains in a mountainous state like Arunachal
Pradesh, horticultural plantations, which could be taken
on slopes also, is being promoted as part of a strategy for
agricultural diversification and higher value addition
within agriculture. The varied agro-climatic condition in
the State offer scope for growing a wide variety of
tropical, sub-tropical and temperate fruits, vegetables
including off-season vegetables, spices, aromatic and
medicinal plants, flowers and mushroom. By 2004-05 the
total production of horticultural crops reached nearly
1,40,605 metric tonnes per annum and the total area
under horticulture was 67,584 hectares. From the total
horticulture production, fruits comprise 1,03,234 metric
tonnes from an area of 54,212 hectares. The fruits being
perennial in nature help in checking soil erosion and
provide high-density green cover to the soil. The three-
yearly average of area and production of some important
horticultural crops in the State have been given in Table
12.10. Among the major horticultural crops in the State
are citrus, pineapple, banana and apple.
TABLE 12.10
Area, Production and Yield Rate of HorticulturalCrops in Arunachal Pradesh: TE 1999-2000
Name of Area Production Yield Share in Area Share inthe Fruit (In ha.) (In MT) (Qtl/Hect) (in %) Production
(in %)
Apple 6482.67 13158.67 20.30 20.10 15.18
Plum 802.33 2622.00 32.68 2.49 3.02
Walnut 2136.67 655.33 3.07 6.63 0.76
Guava 963.00 2634.67 27.36 2.99 3.04
Kiwi 19.00 1.00 0.53 0.06 0.00
Peach 239.00 1067.67 44.67 0.74 1.23
Pear 829.00 2602.67 31.40 2.57 3.00
Citrus 8066.33 17301.33 21.45 25.01 19.96
Pineapple 7271.33 30516.67 41.97 22.55 35.20
Papaya 585.00 2650.33 45.30 1.81 3.06
Banana 3414.33 11623.67 34.04 10.59 13.41
Others 1439.00 1850.67 12.86 4.46 2.13
Total Fruits 32247.67 86684.67 26.88 100.00 100.00
Source: Computed from figures provided in Arunachal Agriculture in Brief,1980-1993 and Statistical Abstract of Arunachal Pradesh, various years.
Central and State Sponsored Schemesfor Development of Horticulture
There have been various Central and State sponsored
Schemes in Arunachal Pradesh in order to develop
horticulture in the State.
BOX 12.2
Schemes for Development of Horticulture
Some of the existing schemes for development of
horticulture in Arunachal Pradesh are as follows:
Technology Mission for Integrated Development of Horticulture:
Under this scheme a total of 3855 hectares of area have
been brought under various horticulture crops like fruits,
vegetables, spices and flower cultivation.
North East Council Schemes: Under this scheme a total of
463 hectares comprising large cardamom in 200 hectares
and high density apple plantation in 263 hectares has
been achieved in 2004-05.
Swabhiman Rozgar Yojana: A number of unemployed
youths have become beneficiaries in this scheme where
about 1840 hectare of land has been used for fruit
gardening.
National Horticulture Board Schemes: Under this scheme
about 2.5 hectares of land has been brought under
geranium cultivation.
Various State Sponsored Schemes have been initiated by the
government in 2004-05 in various fields like floriculture,
mushroom development and training, fruit and vegetable
preservation, maintenance of farms and nurseries and
fairs and exhibitions. Government has also set up a
Horticulture College in the State.
The tremendous potential for development of
horticulture sector has remained unexploited in Arunachal
Pradesh. The horticulture technology mission (HTM)
which has been initiated in the State, has given the much
needed impetus to this vital sector. As per government
estimates, the achievement of this scheme has been quite
impressive (Annexure Table A-12.12). The Government of
Arunachal Pradesh in its new Agriculture Policy 2001, had
specified the targeted area and production of different
horticulture crops in the State for the period upto 2010
which is given below (Annexure Table A-12.13). On the
ground, however, farmers do not get adequate returns on
their investments, mainly because of weak market
linkages.9 On the production front, the gap between the
9. Interviews with ginger farmers at Pashighat, orange growers at Along and apple and kiwi growers in West Kameng district reveal that the key constraint inthe cultivation of these perishable products are exploitation by middlemen and strong cartels of buyers at Guwahati and other markets, poor transport andstorage infrastructures as well as informational constraints. The efforts by individual farmers to sale their products outside the region has also not beensuccessful.

201Chapter 12 •
DEVELOPMENT OF AGRICULTURE AND ALLIED SECTOR
laboratories and the farmers field continues to be
substantial, although several efforts are on to bridge this
gap. Unless there is a well-coordinated mechanism which
addresses the problems faced by horticulturists, the
expected diversification towards high-value crops would
remain unfulfilled. The key components of this strategy
should be: (a) to provide technology and input support to
enhance productivity; (b) to supply credit; (c) provision of
insurance cover to mitigate risks; and finally (d) buy-back
arrangement with the processing units in the short-run
and setting up of processing-units in the long run. There
is an urgent need to involve community organisations and
civil society groups in providing the technology and
information support to the farmers. Farmers’ cooperatives
should be built up on the foundations of already existing
community structures. Establishment of clusters of
horticultural processing units would help in value addition
within the State itself. There is also a need to dovetail
other rural development and employment generation
programmes to help the horticultural development in
rural Arunachal Pradesh.
Animal Husbandry
Livestock plays a very important role in the livelihood
diversification strategy of the rural population in
Arunachal Pradesh. It is not only an important source of
nutrition for a majority of rural people, but also acts as an
insurance against sudden shortfalls in consumption and
earnings. Apart from the cultural significance of the
livestock in the traditional economy of many of the tribes,
there is a growing demand for livestock and diary
products in the State. There has been a demand-induced
growth of diary farming and poultry-rearing activities,
particularly in and around the urban centres of the State.
There is, however, considerable scope for expansion of
these activities both in the rural and urban areas of
Arunachal Pradesh. Data generated by the Livestock
Census, suggests that between, 1978-79 to 1997-98, the
growth of cattle was robust, but in the case of buffalos the
growth was negative (Annexure Table A-12.14). While
the livestock as a whole has increased at a simple average
annual growth rate of around 6 per cent per annum, the
growth of the number of goats in the State has been
rising at around 7 per cent per annum. What is important
is that in spite of sizeable local demands, the growth in
the number of pigs and sheep has not been remarkably
high.
Given the current size of livestock in Arunachal
Pradesh, there is a huge scope for expanding the livestock
sector, however, considering the fragility of the ecological
system and the increasing demand for livestock products
in the State, there is a need for careful attention to
monitor and avoid localised environmental stress, if any,
caused by the imbalances between the livestock and
ecological systems. Livestock production has both positive
and negative impacts on the environment. The positive
effects include improvements in species (flora) wealth
through managed grazing, less pressure on the
environment as a result of alternative earning
opportunities for the population, and various other
benefits of mixed farming, such as sustenance,
enhancement and release of resource base. The negative
impacts are land degradation, deforestation and the
resultant loss of biodiversity. In fragile ecological systems,
it is not only the density, but also the composition of the
livestock population has a bearing on the scale of
environmental stress.
Fisheries
Fish production in Arunachal Pradesh has grown at a
compound rate of 5.66 per cent per annum during 1990-
1991 to 2003-04 (Figure 12.5). The encouraging aspect of
this growth of fish production in the State is that along
with expansion in area under pisciculture, improvements
in yield of fish production per hectare has also contributed
substantially to the growth of fish production. During
1993-94 to 2003-04, total fish production in the State
increased at a compound rate of 4.91 per cent per annum.
While area under pisciculture grew at a rate of 1.97 per
cent, yield of fish has grown at a rate of 2.87 per cent
during the same period. There is, however, considerable
scope for expansion of fish production in the State. The
current annual demand for fish in the State is estimated
to be around 9653 tonnes, out of which, production is in
the order of 2500-2600 tonnes.10 The traditional fish-cum-
rice cultivation of the Apatani tribe of Arunachal Pradesh
has attracted a great deal of attention as a successful
model of convergence between traditional practices and
changing demands (Box 12.3). There is, however, a need
for wider replication2 of such good practices.
10. As per the targets for Tenth Five Year Plan (2002-2007), Government of Arunachal Pradesh has plans to increase the fish production in the state up to 3500tonnes, by the end of the 10th plan period.

ARUNACHAL PRADESH DEVELOPMENT REPORT202
FIGURE 12.5
Fish Production in Arunachal Pradesh: 1990-91 to 2003-04
0
500
1000
1500
2000
2500
3000
Fish Production in Arunachal Pradesh (in Tonnes)
1990-91
1991-92
1992-93
1993-94
1994-95
1995-96
1996-97
1997-98
1998-99
1999-2000
2001-02
2002-03
2003-04
2000-01
Source: Directorate of Fisheries, Government of Arunachal Pradesh.
BOX 12.3
Fish-cum-Rice Cultivation by the Apatanis
The fish-cum-rice cultivation system practiced by the
Apatanis in Ziro plateau has attracted the attention of
scholars as an efficient and viable strategy of raising
earnings from traditional agriculture. The indigenous
irrigation system of the Apatanis is a multipurpose water
management system, which integrates land, water and
farming systems by protecting soil, conserving water for
irrigation and paddy-cum-fish culture. The rice field is
utilised for fish culture by rearing fish from the month
of April to September when the paddy crops grow in the
field. In order to water the fields, every stream rising
from the hill tops is tapped soon after it emerges from
the forest, channelised at the rim of the valley and
diverted by a network of primary, secondary and tertiary
channels. The first diversion from the stream takes off at
a short distance above the terraces. The feeder channel
branches off at angles which lead water through the
series of terraces so that by blocking or opening the
channels ducts (huburs) any field can be flooded or
drained. To prevent trashes or migration of fish, a semi-
circular wooden/bamboo net is installed at the inlet and
to reduce beating action of flowing water resulting in soil
erosion, wooden sticks or planks are put at the outlet.
The huburs are installed about 15 to 25 cm above the bed
level of the fields in order to maintain proper water level.
They are made of plank or pine tree trunk or bamboo
stems of different diameters. The Apatanis utilise
varieties of domestic waste products to their paddy field
to enhance crops productivity, which in turn enhance soil
fertility as well as feed to fishes. The State support to the
farmers in terms of providing seeds has been crucial in
sustaining and improving the system. It has been
reported that fish output has started dwindling in some
areas because of the use of chemical fertilisers and
pesticides.
Conclusion
Despite the institutional and ecological constraints in
the State, the agriculture and allied activities have grown
rapidly. Some of the worrying aspects of this growth in
agriculture are the continuing dependence on jhumming
and regional variations in growth performance. The key
issues that need to be addressed in the context of
agricultural development in the State are as follows:
• conduct of cadastral survey in order to define
property rights over land;
• an institutional mechanism to monitor and control
land alienation and land reforms legislation;
• development of location-specific farming
technologies that are suitable and compatible with
the local ecology;
• establishment of an effective data collection,
processing and disseminating agency for agricultural
sector;
• creation of basic market infrastructure;
• provision of credit and other inputs to the farmers;
• support for high-value diversification within
agriculture and related activities; a comprehensive
support strategy for development of horticulture;
• establishment of research and agricultural extension
linkages;
• development of agro-processing industries;
• horizontal coordination of various programmes
designed to support the farmers and the farm
sector.
While the New Agricultural Policy of Arunachal
Pradesh, 2001 has clearly identified the key areas of
concern for overall agricultural development (see Box
12.4), much remains to be done in terms of development
of rural infrastructure and capital formation in agriculture.
For example, there is a clear mismatch between the
institutional realities of the State and the institutional
assumptions of the various programmes. To overcome
this, at the field level, a farmers’ group should be
considered as an economic unit instead of an individual
farmer. This unit should be assured of the supply of high
yielding variety of seeds and seedlings thereby establishing
linkage with new ‘technology to enhance productivity’.
The second component should be ‘supply of credit’. The
third component should be ‘an insurance to cover the
risk’. The fourth one should be ‘buy-back arrangement’
with the processing units in the shorter run and setting
up of processing units in the longer run (Sarma, 2006).
There is a tremendous scope for expanding commercially
viable organic farming in the State. The key constraint
seems to be developing the marketing link between the

203Chapter 12 •
DEVELOPMENT OF AGRICULTURE AND ALLIED SECTOR
BOX 12.4
New Agricultural Policy of Arunachal Pradesh, 2001
The New Agricultural Policy of Arunachal Pradesh has identified the following as the major constraints faced by the Statein the agriculture sector: low level of productivity, capital inadequacy, lack of infrastructural support, unfavourable terrain,high cost of production and demand side constraints. Since the non-availability of basic preservation, storage and processingfacilities, low value addition and unfavourable price of agricultural commodities are considered to be the main reason behindthe lack of growth impetus in the agricultural sector, the policy basically emphasises shift towards cultivation of cash crops,floriculture, horticulture, fisheries, piggeries and agro-processing. In specific terms the policy envisages strong state supportin the following directions.
Addressing Problems related to Shifting Cultivation
Special emphasis needs to be given on shifting cultivation, ensuring better land management, introducing improvedcultivation in slope land through agro-forestry, horticulture and encouraging other household activities. The programmeis to be designed in such a way that there would be simultaneous thrust in weaning the jhum farmers towards bettercultivation.
Development of Location-specific Strategy and Convergence of Allied Activities
Efforts would be made to formulate an area specific differentiated strategy taking into account the agronomic, climatic, socio-economic practices as well as the resource worthiness of the farmer. Special emphasis will be made for introducing the newlydeveloped H.Y.V. seeds, improved planting material, adoption of new technology and mechanised farming. The policy willaim at avoiding duplication of programmes by different functionaries, as far as possible.
Technological Adoption
Importance will be accorded to identify new location specific and economically viable improved species of agriculture,horticulture, livestock and fish etc. Accordingly, motivational aspect of agriculture extension would receive due attention.The entire extension system will be revitalised. Innovative and decentralised institutional change will be introduced to makeextension system responsible and accountable. Development of human resources through capacity building and skillupgradation of extension functionaries will receive due attention.
Supply of Inputs
Adequate and timely supply of inputs such as seed, fertiliser, pesticides, agri-tools and implements, credit at reasonablerate to farmers will be provided by the government and other institutions, subject to availability of resources and funds.Greater emphasis will be given to increase the consumption of such inputs for achieving the targeted increase in per unitarea productivity. As far as possible use of organic manure/compost will be encouraged to avoid ill effects of inorganicfertilisers. Soil health card, quality testing of inputs like fertiliser, chemicals etc., will be introduced and supply of spuriousinputs will be checked. On farm management of water, increasing the area under irrigation through the use of surface waterand sub-surface water will receive added attention.
Facilitate Private Investment in Agriculture
Efforts would be made to create conditions that encourage participation of the private enterprises in the establishment ofagro-based industries. An incentive package and guideline would be finalised ensuring participation of private sector andfinancial institutions in the agricultural sector as a whole. NABARD will have to play a major role in channelisinginvestment. To meet local credit needs of farmers, rural credit banks are to be set up.
People’s Participation
The new policy would encourage formation of self help groups and village committees at different levels. The villagecommittee would be vested with the task of maintaining and managing the assets created so far, like irrigation channel,terraces market shed etc.
Marketing Infrastructure
Emphasis will be laid on development of marketing infrastructure and techniques of preservation, storage, and transportationetc., with a view to reduce the post-harvest losses and ensuring a better return to the grower. Direct marketing andprocurement by a notified State level procurement agency, as and when required with storage facilities of different itemswill be made available to the production areas. Upgradation and dissemination of market intelligence will receive particularattention. Efforts will be made to strengthen the market infrastructure.
Agro-processing
Setting up of agro-processing units in production areas will be given due priority. To reduce post-harvest wastage, effortwould be made to add values especially to agricultural and horticultural produce by setting up small processing units. TheSmall Farmers Agricultural Business Consortium (SFAC) will be activated to cater to the need of farmer entrepreneurs.
Price Support
Market intervention scheme involving procurement through a notified agency will be implemented for selected agricultural/horticultural crops so that farmers are assured of remunerative prices.
Source: Government of Arunachal Pradesh.
ARUNACHAL PRADESH DEVELOPMENT REPORT204
producers of organic food products and the consumers of
such niche markets.
Given the levels of development in different parts of
the State, there is an enormous need for strong
government intervention in various aspects of agricultural
development outlined above. While there has been no
dearth of schemes and promotional ventures within
agriculture, by and large, the impact of these programmes
has been limited because of the unsuitability of the
schemes to the local economic, ecological and social
conditions, and secondly because of a host of
implementational failures. There is an urgent need to
make these programmes participatory, transparent and
locally relevant. There is tremendous scope for learning
from the success stories of other mountain states, such as
Himachal Pradesh in the case of horticulture. To enhance
the scope for cooperation, a special agency should be
created at the national level to support mountain
agriculture in different parts of the country, including
Arunachal Pradesh.

205Chapter 12 •
DEVELOPMENT OF AGRICULTURE AND ALLIED SECTOR
ANNEXURE TABLE A-12.1
Index of Inter-class Concentration Ratio and Gini Ratio
Size Class of 1970-71 1976-77 1980-81 1985-86 1990-91 1995-96 2000-01OperationalHoldings (in Ha)
Marginal 9.26 10.23 13.67 15.54 16.60 15.74 13.53
Small 23.16 23.89 33.49 37.20 41.36 39.50 35.85
Semi-medium 44.89 46.50 63.88 69.97 77.57 72.24 72.17
Medium 96.15 103.69 139.52 148.72 159.19 162.21 156.46
Large 276.25 309.24 518.52 490.99 509.03 411.30 437.43
Gini Concentration — 0.52444 0.527604 0.491387 0.460899 0.47723 0.46113Ratio
Source: Computed from Agricultural Census, Government of Arunachal Pradesh, various years.
ANNEXURE TABLE A-12.2
Size Class-wise Distribution of Operational Holdings in Districts of Arunachal Pradesh: 1995-96(in percentage)
District Share of Holdings and Area
Marginal Small Semi-medium Medium Large
No. Area No. Area No. Area No. Area No. Area
Tawang 70.79 50.38 26.51 41.72 2.69 7.9 0 0 0 0
West Kameng 25.5 6.56 24.04 17.4 45.28 61.38 4.95 12.64 0.24 2.01
East Kameng 7.57 1.64 21.89 10.01 38.62 33.46 31.63 50.43 0.29 4.46
Papum Pare 17.12 2.47 17.04 5.66 32.53 21.55 27.97 42.41 5.33 27.92
Lower Subansiri 20.01 3.5 23.07 9.74 32.02 26.35 19.8 35.49 5.1 24.91
Upper Subansiri 1.58 0.17 6.25 1.82 37.17 21.19 44.32 50.88 10.68 25.94
West Siang 4.76 0.37 5.52 1.35 22.08 9.39 48.04 46.85 19.6 42.04
East Siang 6.07 0.67 13.62 4.08 26.62 15.25 44.88 54.03 8.81 25.98
Upper Siang 29.28 3.97 17.03 6.28 18.8 12.44 25.12 43.67 9.78 33.64
Dibang Valley 27.27 7.56 24.86 15.86 26.06 28.89 16.4 31.09 5.41 16.6
Lohit 24 5.32 24.09 13.67 34.66 34.31 13.86 30.71 2.74 15.99
Changlang 26.9 6.07 33.77 19.42 25.48 24.9 10.69 21.86 3.16 27.74
Tirap 8.93 1.36 13.57 4.22 31.53 24.75 42.75 59.48 3.22 10.18
Arunachal Pradesh 19.24 3.03 19.33 7.64 28.96 22.37 26.69 43.31 5.75 23.65
Source: Computed from Agricultural Census, Government of Arunachal Pradesh, various years.
ANNEXURE TABLE A-12.3
Share of ST Operated Holdings in Total Holdings and Area in Arunacahl Pradesh: 1980-81 to 1995-96
Size Class of Operational Share of ST Operated Holdings in Total Holdings and Area
Holdings (in Ha) 1980-81 1985-86 1990-91 1995-96
No. Area No. Area No. Area No. Area
Marginal 96.39 96.77 87.85 94.43 93.75 93.08 88.44 87.7
Small 93.91 95.11 92.9 93.7 93.8 94.63 88.77 88.7
Semi-medium 92.58 93.85 93.24 94.77 97.44 97.81 93.31 93.9
Medium 98.92 99.11 98.4 98.65 98.97 99.08 98.34 98.5
Large 99.63 96.85 99.64 99.54 99.87 99.54 99.44 99.5
All 95.72 97.07 94.01 97.6 96.67 98.38 93.13 96.6
Source: Computed from Agricultural Census, Government of Arunachal Pradesh, various years.

ARUNACHAL PRADESH DEVELOPMENT REPORT206
ANNEXURE TABLE A-12.4
Size Class-wise Distribution of Operational Holdings among Scheduled Tribes(Arunachal Pradesh): 1970-71 to 1995-96
Size Class of Operational Share in Total Holdings
Holdings (in Ha) 1980-81 1985-86 1990-91 1995-96
No. Area No. Area No. Area No. Area
Marginal 16.65 2.24 16.05 2.59 16.85 2.72 19.09 2.67
Small 20.36 6.75 18.64 6.74 17.86 7.22 18.45 6.84
Semi-medium 27.21 17.22 30.92 21.17 32.26 23.86 28.37 21.78
Medium 29.04 39.69 28.27 40.61 27.81 42.43 28.38 45.72
Large 6.75 34.10 6.11 28.89 5.21 23.77 5.71 22.99
All 100.00 100.00 100.00 100.00 100.00 100.00 100.00 100.00
Source: Computed from Agricultural Census, Government of Arunachal Pradesh, various years.
ANNEXURE TABLE A-12.5
Average Size of Holdings in Arunachal Pradesh: 1970-71 to 1995-96
Size Class of Operational 1970-71 1975-76 1980-81 1985-86 1990-91 1995-96 2000-01Holdings (in Ha)
Marginal 0.57 0.61 0.59 0.62 0.61 0.48 0.50
Small 1.44 1.42 1.43 1.49 1.51 1.28 1.32
Semi-medium 2.78 2.77 2.73 2.80 2.78 2.62 2.66
Medium 5.95 6.17 5.97 5.95 5.75 5.53 5.77
Large 17.11 18.39 22.74 19.65 17.27 13.84 16.13
All size classes 6.19 5.95 4.31 4.00 3.71 3.31 3.69
Source: Computed from Agricultural Census, Government of Arunachal Pradesh, various years.
ANNEXURE TABLE A-12.6
Extent of Tenancy across Size Classes of Operational Holdings (Arunachal Pradesh): 1970-71 to 2000-01(as Percentages to Total Operational Holdings)
Year Type Marginal Small Semi-medium Medium Large All Size Classes
1970-71 Self Operated 99.67 99.47 99.71 99.76 100 99.75
Partly Leased in 0.33 0.53 0.29 0.24 0 0.25
Wholly Leased in 0.17 0.63 0 0 0 0.1
1976-77 Self Operated 90.41 98.18 99.52 99.29 99.11 98.26
Partly Leased in 6.69 1.57 0.38 0.66 0.89 1.38
Wholly Leased in 1.47 0.25 0.1 0.05 0 0.23
1980-81 Self Operated 97 98.39 97.19 98.43 99.27 97.89
Partly Leased in 1.26 1.39 2.57 1.54 0.73 1.7
Wholly Leased in 1.74 0.21 0.24 0.02 0 0.41
1985-86 Self Operated 99.26 98.12 97.85 99.54 99.66 98.7
Partly Leased in 0.6 1.85 1.95 0.46 0.34 1.21
Wholly Leased in 0.14 0.03 0.2 0 0 0.09
1990-91 Self Operated 99.41 98.85 98.28 99.38 99.68 98.95
Partly Leased in 0.47 1.15 1.56 0.6 0.32 0.97
Wholly Leased in 0.12 0 0.17 0.02 0 0.08
1995-96 Self Operated 97.94 97.7 99.24 99.31 98.41 98.66
Partly Leased in 1.35 0.94 0.03 0 0 0.46
Wholly Leased in 0.71 1.35 0.73 0.68 1.59 0.88
2000-01 Self Operated 95.51 99.36 99.36 99.00 96.91 98.59
Partly Leased in 2.27 0.37 0.14 0.08 0.30 0.47
Wholly Leased in 2.18 0.27 0.50 0.92 2.80 0.93
Source: Computed from Agricultural Census, Government of Arunachal Pradesh, various years.

207Chapter 12 •
DEVELOPMENT OF AGRICULTURE AND ALLIED SECTOR
ANNEXURE TABLE A-12.7
Extent of Tenancy in Arunachal Pradesh: 1970-71 to 1995-96
Size Class of Percentage of Leased-in Holdings to Total Holdings
Operational Holdings 1970-71 1976-77 1980-81 1985-86 1990-91 1995-96
(in Ha) No. Area No. Area No. Area No. Area No. Area No. Area
Marginal 0.50 0.12 8.17 3.64 3.00 1.81 0.74 0.32 0.59 0.29 2.07 2.39[10.71] [2.02] [49.30] [19.06] [23.55] [6.01] [9.04] [3.81] [9.71] [2.84] [23.09] [30.90]
Small 1.16 0.14 1.82 0.65 1.61 0.80 1.88 0.57 1.15 0.42 2.30 1.57[39.29] [9.41] [20.71] [14.95] [15.82] [8.09] [27.58] [18.00] [20.12] [10.78] [38.36] [33.05]
Semi-medium 0.29 0.08 0.48 0.15 2.81 1.58 2.15 0.57 1.72 0.58 0.77 0.23[21.43] [22.37] [8.25] [10.12] [37.50] [41.53] [52.17] [56.37] [52.58] [47.45] [17.27] [16.13]
Medium 0.24 0.03 0.71 0.17 1.57 0.71 0.46 0.09 0.62 0.24 0.68 0.09[25.00] [27.73] [12.09] [25.63] [20.89] [40.47] [9.67] [15.77] [16.08] [35.39] [13.36] [13.62]
Large 0.00 0.00 0.89 0.11 0.73 0.08 0.34 0.05 0.32 0.04 1.59 0.11[0.00] [0.00] [9.65] [30.24] [2.23] [4.00] [1.54] [6.04] [1.52] [3.53] [7.96] [6.31]
All 0.35 0.04 1.60 0.19 2.11 0.68 1.30 0.22 1.05 0.29 1.34 0.30[100] [100] [100] [100] [100] [100] [100] [100] [100] [100] [100] [100]
Note: Figures within square brackets refer to percentage to column totals.
Source: Computed from Agricultural Census, Government of Arunachal Pradesh, various years.
ANNEXURE TABLE A-12.8
Coefficient of Variations in Area, Production and Yield of Crops in Arunachal Pradesh: 1980-81 to 2004-05
Crop/Crop Coefficient of Variation
Group 1980-81 to 2004-05 1980-81 to 1989-90 1990-91 to 1999-2000 2000-01 to 2004-05
Rice A 9.399 12.716 3.626 2.036
P 13.725 15.698 10.263 7.555
Y 6.618 3.643 7.195 6.994
Maize A 15.844 16.364 5.632 2.666
P 21.929 19.406 3.085 3.225
Y 8.857 3.491 6.343 2.808
Millet A 12.320 17.124 8.373 5.711
P 12.479 11.745 10.910 9.705
Y 12.404 15.944 5.400 4.343
Wheat A 17.485 26.221 11.507 5.359
P 22.658 29.170 18.822 18.874
Y 16.805 19.366 15.905 16.189
Cereals A 9.711 13.068 2.947 1.983
P 14.006 15.392 6.807 5.948
Y 5.951 3.392 4.733 4.742
Pulses A 44.135 54.182 9.149 6.004
P 55.226 64.222 16.905 5.475
Y 21.602 21.497 9.230 1.360
Foodgrains A 10.402 13.543 2.670 2.097
P 14.689 15.837 6.419 5.899
Y 5.898 3.234 4.612 4.584
Vegetables A 25.404 15.120 6.141 6.197
P 21.321 25.755 5.731 3.555
Y 12.846 14.147 6.463 6.768
Oilseeds A 33.830 35.350 7.015 3.060
P 40.643 40.628 7.355 5.167
Y 12.971 13.798 6.446 3.561
Spices A 51.128 24.637 27.098 1.530
P 82.821 43.656 48.506 6.116
Y 48.385 20.816 27.997 5.054
Sugarcane A 39.245 29.301 32.496 14.866
P 39.808 58.423 25.130 12.455
Y 27.496 41.229 11.443 7.036
Note: All growth rates are compound growth rates. A= Area, P= production and Y= yield.
Source: Computed from figures provided in Statistical Abstract of Arunachal Pradesh, various years.

ARUNACHAL PRADESH DEVELOPMENT REPORT208
ANNEXURE TABLE A-12.9
Distance Covered by Farmers for Inputs in Arunachal Pradesh: 2003
Name of the Input Crop Season Distance Covered by Percentage of Farmer Households
Within Village <2 2-5 5-10 10-20 ≥20 Non Response
Fertiliser K 10.7 7.5 7.0 5.7 31.8 36.5 0.8
R 1.3 10.6 11.8 5.8 31.7 38.1 0.6
Organic Manure K 20.3 7.2 2.9 6.4 24.5 37.1 1.6
R 14.2 9.0 7.3 5.1 27.3 36.5 0.6
Improved Seeds K 2.1 8.5 5.5 7.9 31.1 44.0 0.9
R 0.5 9.9 9.5 5.0 35.3 39.8 0.0
Pesticides K 6.2 1.8 16.9 25.5 24.2 8.4 0.0
R 2.6 10.0 11.2 5.3 32.5 38.4 0.0
Veterinary Services K 7.5 8.0 6.3 12.2 28.2 36.8 0.9
R 1.8 10.9 10.2 15.4 25.6 36.0 0.0
Note: Distance is in Kms. K = Kharif, R = Rabi.
Source: NSS Report No:596, Situation Assessment Survey of Farmers, Some Aspects of Farming, NSS 59th Round (Jan.-Dec., 2003).
ANNEXURE TABLE A-12.10
Educational Levels of Farmers in Arunachal Pradesh
Educational Standard Percentage of Farmers in Farmer Households 7 Years and above
Arunachal Pradesh All India
Male Female Total Male Female Total
Not Literate 43.8 57.9 50.5 35.1 69.2 48.8
Literate without Formal Education 1.9 3.0 2.4 1.7 0.9 1.4
Literate below Primary 9.4 8.2 8.8 10.1 6.4 8.6
Primary 14.7 12.5 13.6 15.7 10.2 13.5
Middle 19.5 11.7 15.8 18.8 8.5 14.7
Secondary 7.7 5.5 6.7 10.0 3.2 7.3
High School 2.9 1.3 2.1 4.8 1.1 3.3
Diploma 0.0 0.0 0.0 0.4 0.1 0.3
Graduate 0.1 0.0 1.0 2.6 0.3 1.7
Postgraduate 0.0 0.0 0.0 0.7 0.0 0.4
Source: NSS Report No: 596, Situation Assessment Survey of Farmers, Some Aspects of Farming, NSS 59th Round (Jan.-Dec., 2003).

209Chapter 12 •
DEVELOPMENT OF AGRICULTURE AND ALLIED SECTOR
ANNEXURE TABLE A-12.11
District-wise Crop Area and Production of Horticulture Fruits and Spices during 2004-05
Districts Fruits Spices Total
Apple Walnut Kiwi Citrus Pineapple Banana Others Large Black GingerCardamom Pepper
Tawang A 1808 1102 18 56 - 16 181 - - 37 3218
P 2280 17 3 19 - 3 387 - - 61 2770
Bomdilla A 5357 1415 97 159 19 74 313 172 26 50 7684
P 7005 31 53 20 - 82 1268 29 - 152 8640
Seppa A 120 81 - 504 58 151 279 140 94 80 1507
P - - - 79 4 215 784 55 2 185 1324
Papum Pare A - 23 - 447 188 221 399 261 203 81 1823
P - - - 89 912 347 984 9 7 182 2530
Ziro A 821 513 32 527 36 310 384 305 26 82 3036
P 189 10 3 787 10 691 2779 45 - 240 4754
Daporijo A 37 8 - 3564 835 300 131 259 31 110 5275
P - - - 2919 3500 1148 644 33 2 220 8466
Kurum Kumey A - - - 304 43 130 6 194 15 75 821
P - - - 155 4 131 103 9 - 7 409
Along A 64 52 4 8355 4078 770 477 405 194 907 15306
P - - - 9707 21846 1446 1104 66 17 4864 8794
Pasighat A - - 2 4535 1122 576 1077 355 330 797 8794
P - - - 7764 4139 4041 1537 54 28 4111 21674
Anini A 106 124 25 191 - 63 41 81 26 371 1028
P - - 3 117 - 351 119 14 4 1893 2501
Roing A 3 6 1 727 99 571 390 381 113 3318 5609
P - - - 351 1649 526 1063 52 18 17028 20687
Lohit A 27 52 1 1596 133 325 581 407 244 1239 4605
P - - - 559 456 1274 835 73 32 6689 9918
Changlang A 37 27 - 483 663 475 735 328 96 108 2952
P - - - 303 2369 1290 1286 40 - 122 5410
Tirap A - 55 2 804 119 600 513 605 192 223 3113
P - - - 306 95 1008 1374 62 23 608 3476
Total A 8403 3516 190 23360 7913 4914 5916 4142 1612 7618 67584
P 9474 58 62 27251 36310 14817 15262 572 133 36666 140605
Note: A=Area in hectares, P=Production in Metric tonnes.
Source: Annual Report 2004-2005, Department of Horticulture, Government of Arunachal Pradesh.
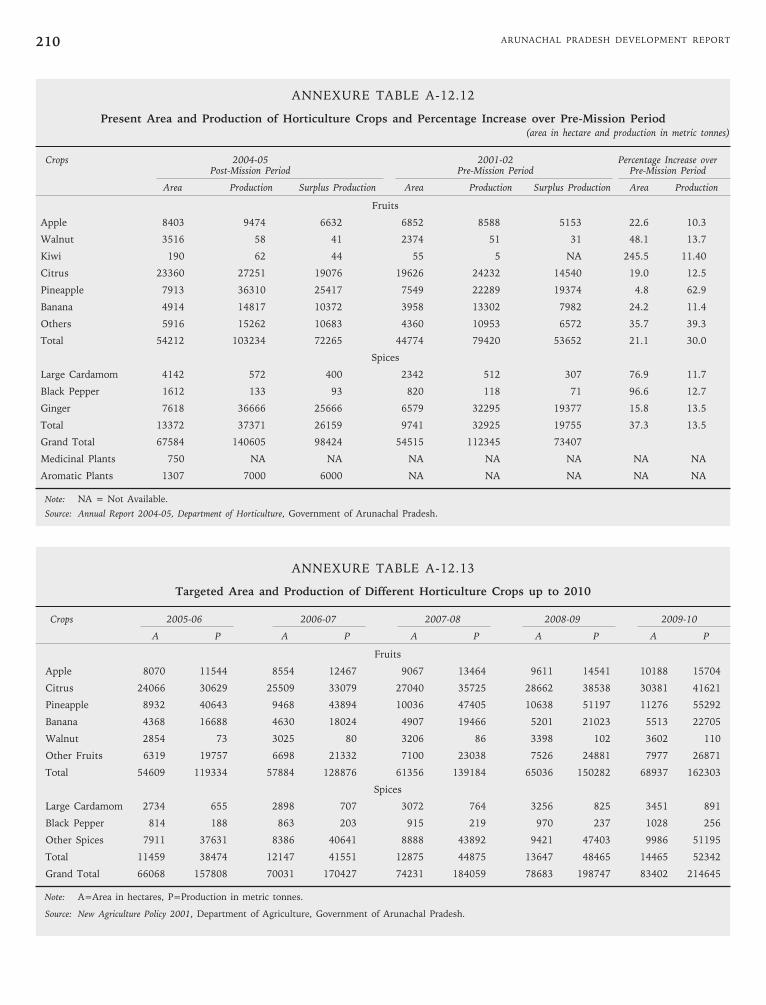
ARUNACHAL PRADESH DEVELOPMENT REPORT210
ANNEXURE TABLE A-12.12
Present Area and Production of Horticulture Crops and Percentage Increase over Pre-Mission Period(area in hectare and production in metric tonnes)
Crops 2004-05 2001-02 Percentage Increase overPost-Mission Period Pre-Mission Period Pre-Mission Period
Area Production Surplus Production Area Production Surplus Production Area Production
Fruits
Apple 8403 9474 6632 6852 8588 5153 22.6 10.3
Walnut 3516 58 41 2374 51 31 48.1 13.7
Kiwi 190 62 44 55 5 NA 245.5 11.40
Citrus 23360 27251 19076 19626 24232 14540 19.0 12.5
Pineapple 7913 36310 25417 7549 22289 19374 4.8 62.9
Banana 4914 14817 10372 3958 13302 7982 24.2 11.4
Others 5916 15262 10683 4360 10953 6572 35.7 39.3
Total 54212 103234 72265 44774 79420 53652 21.1 30.0
Spices
Large Cardamom 4142 572 400 2342 512 307 76.9 11.7
Black Pepper 1612 133 93 820 118 71 96.6 12.7
Ginger 7618 36666 25666 6579 32295 19377 15.8 13.5
Total 13372 37371 26159 9741 32925 19755 37.3 13.5
Grand Total 67584 140605 98424 54515 112345 73407
Medicinal Plants 750 NA NA NA NA NA NA NA
Aromatic Plants 1307 7000 6000 NA NA NA NA NA
Note: NA = Not Available.
Source: Annual Report 2004-05, Department of Horticulture, Government of Arunachal Pradesh.
ANNEXURE TABLE A-12.13
Targeted Area and Production of Different Horticulture Crops up to 2010
Crops 2005-06 2006-07 2007-08 2008-09 2009-10
A P A P A P A P A P
Fruits
Apple 8070 11544 8554 12467 9067 13464 9611 14541 10188 15704
Citrus 24066 30629 25509 33079 27040 35725 28662 38538 30381 41621
Pineapple 8932 40643 9468 43894 10036 47405 10638 51197 11276 55292
Banana 4368 16688 4630 18024 4907 19466 5201 21023 5513 22705
Walnut 2854 73 3025 80 3206 86 3398 102 3602 110
Other Fruits 6319 19757 6698 21332 7100 23038 7526 24881 7977 26871
Total 54609 119334 57884 128876 61356 139184 65036 150282 68937 162303
Spices
Large Cardamom 2734 655 2898 707 3072 764 3256 825 3451 891
Black Pepper 814 188 863 203 915 219 970 237 1028 256
Other Spices 7911 37631 8386 40641 8888 43892 9421 47403 9986 51195
Total 11459 38474 12147 41551 12875 44875 13647 48465 14465 52342
Grand Total 66068 157808 70031 170427 74231 184059 78683 198747 83402 214645
Note: A=Area in hectares, P=Production in metric tonnes.
Source: New Agriculture Policy 2001, Department of Agriculture, Government of Arunachal Pradesh.

211Chapter 12 •
DEVELOPMENT OF AGRICULTURE AND ALLIED SECTOR
ANNEXURE TABLE A-12.14
Livestock in Arunachal Pradesh: 1978-79 to 1997-98
Livestock Type 1978-79 1988-89 1991-92 1997-98
Cattle Male over 3 yrs 49611 111464 126215 155166
Female over 3 yrs 58427 85697 99004 144413
Young Stock 43405 54669 52968 153341
Buffalo Male over 3 yrs 2131 3311 2452 1405
Female over 3 yrs 5557 4426 4064 4160
Young Stock 3643 1396 1934 5985
Sheep 19041 28742 32774 28245
Horses & Ponies 5196 5472 5814 6678
Pigs 206963 242853 221062 275372
Goats 76949 108389 127956 183826
Other Livestock 94881 112114 196660 229330
Total Livestock 565804 758533 870903 1187921
Poultry 965123 1086832 1113391 1164700
Source: Computed from figures in Statistical Abstract of Arunachal Pradesh, various years.

Introduction
Indigenous industries essentially present a picture of
embeddedness. These operate not separately but form a
component in the domain of economic activities
embedded in the culture of the people. Indigenous
industries are associated with the indigenous skill and
knowledge system of the community. The importance of
indigenous industries derives from the fact that they are
the embodiment of the skills accumulated over many
generations. Refinement and improvement of the
traditional skills into the modern industrial skills is a
challenging task especially in Arunachal Pradesh where
modern industries are yet to make a breakthrough.
The basic characteristics of the indigenous industries
are as follows:
(i) They are undertaken for the fulfilment of the
immediate needs of the households.
(ii) These industries have their community-specificity.
(iii) Skills and knowledge are passed to future generation,
within the communities and households.
With the modern industries having not yet made much
headway in the State, the indigenous industries have
retained their importance in employment and income.
Therefore, in the development perspective, the aims of the
chapter are to analyse:
(i) Status of the indigenous industrial activities.
(ii) Demand base of the indigenous products.
(iii) Relative position of the indigenous industrial
activities in the total economic activity of the
household in terms of employment and income.
(iv) Possibilities of linking industries to market, and
(v) Policy formulation.
ARUN
ACH
AL PR
ADESH
Chapter 13
Indigenous Industries
Status of Indigenous Industrial Activities
The indigenous industries can be seen from two broad
perspectives. First, activities bearing on fulfilment of basic
material needs like food, clothing, shelter, etc., and
second, having a bearing on spiritual needs of the people.
However, these activities are now undergoing changes and
are becoming diversified. The tribes of Arunachal Pradesh
have different types of manufacturing activities as shown
in Table 13.1.
TABLE 13.1
Indigenous Manufacturing Activities among Various Tribes
Industrial Activities Tribes in which Popular Nature of Products
Textile Monpa, Miji, Apatani, Skirt, blouse, shawl,Galo, Adi, Khampti, coat, carpet, bag,Mishmi, (Idu, Mizu lungi, loin, cloth, etc.Digaruh), Nyishi, Tagin,Singpho, Wancho, Tangsa,and Hill Miri.
Basketry Almost in all tribes. Baskets for differentuses, mats, etc.
Pottery Monpa, Nyishi, Adi Earthen vessels,and Apatani. plates, etc.
Ornaments Monpa, Khampti, Beads, necklace,Mishmi, Adi, Nyishi, ear-ring, bracelet etc.and Nocte.
Wood Carving, Monpa, Khampti, Nocte, Statues, stair, masks,mask, etc. Wanchos, Tangsa, Memba, drum, mortar and
Khamba and Sherdukpens. pestle, monger, etc.Head-dress Monpa, Adi, Galo, Hats of different
Nyishi, Apatani, Hill varieties.Miri, Mishmi and Nocte.
Painting/Scroll Monpa, Miji, Khampti, Scroll painting, wallPainting Memba, Khamba and painting, etc.
Meyor.Dying Monpa, Adi, Nyishi, Preparing vegetable
Khampti, Tangsa, colour and dying.Wancho, Singpho,Apatani and Mishmi.
Smithy Nyishi, Puroik (Sulung) Dao, spear and arrowAdi, Mishmi and Nocte. heads, knife, axe,
scrapper, etc.Local wine All tribes. Home brewed wine
from rice, millet, etc.Leather Monpa and Adi Shoe, hover sack, etc.Salt Nocte Salt
Source: Field data.
ARUNACHAL PRADESH DEVELOPMENT REPORT214
Textile products are not same in all the tribes. For
example, the Khamptis, the Singphos and the Tangsas
exclusively make lungi, while carpet-making goes with
Monpa identity. The Akas and the Noctes hardly have the
traditions of weaving; they mostly depended on
neighbouring people. Presently, they have also taken up
weaving. The Puroiks (Sulungs) are expert in weaving and
iron smithy. Interestingly, the tribes which had the
tradition of weaving, have now diversified their products.
Mention may be made of Apatanis who make neckties,
shirts and baby suits. Weaving has not remained as an
activity in households to meet the requirement of its
members; it has now entered in the organised sector
where its products are marketed beyond the community.
Adi Gale (skirt for women) now has a good demand in
almost all the districts of the State. Similarly, Lupling (Adi
coat) traditionally for rich people, is now produced in
different designs and colours for wider market. Efforts
have been made to improve technology through training
and supply of improved looms.
Technological improvement has spread to other
indigenous industries. For example, traditional baskets are
improved with lids. Manufacturing of cane stool, chair,
and teapoy are very common among the Adis and
Apatanis. The making of masks and drums still continues.
The masks are now used as toy objects. Earlier, a statue
was not separated from its maker in the belief that his
soul would pass on to the stranger with the statue (Elwin,
1958; 1988). The statues were made for specific purposes.
But presently statues of different varieties are made for
sale also. In Nocte community, for example, statues of
Jesus, animals and birds are made for the market. In
general, the skill in wood carving and basketry is extended
to produce such items as pen-stand, candle-stand, artificial
flower, table mats, plastic cane bags of different sizes and
purposes, flower vessels, wooden elephant, swan, snake,
peacock, letter-box, tray, cane toy, bottle holder, purse,
chair, table, stool, etc., for market purpose. Though
basketry is a male activity, it is not a taboo for women. At
Pasighat, Roing and Khonsa, it was found that women are
fondly engaged in making plastic cane bags.
Scroll painting and wall painting is still a skill
preserved in Buddhist tribes though they use synthetic
dyes in place of earlier vegetable dyes. Obviously dying
skill and practice is no more in use. Similarly,
manufacturing of ink, salt and pottery items has been
discontinued since long. However, paper is still made in
Monpa area, though it has disappeared in Khampti area.
So is the case with hydro-powered mills. These mills are
in operation in Monpa area only.
The demand for iron and steel products has increased
manifold because of diversified occupational and adoption
of modern technology in agricultural practices. The
increased area under wet rice cultivation has necessitated
the use of implements like spade, shovel, plough, etc.
Traditional iron-smithy has disappeared except in few
pockets of some tribes.
The manufacturing of hats has changed with the
inclusion of new inputs. Previously natural cane was the
input used; it has been partially replaced by artificial cane.
However, the demand is limited to some local people
only. Earlier, beads were obtained from Tibet, but now
these are mostly manufactured in craft centres. However,
they are not valued much like that of the original beads
which were brought from Tibet in early days; Tibetan
beads have been preserved and are of high value.
The changes in technology in general are the results of
governmental promotional drive to industrialise the State
through indigenous and other manufacturing activities.
The government of Arunachal Pradesh has craft centres
and ITIs to develop skill through training. Ten craft
centres in the name of Craft Training-cum-Production
Centres (CTPCs) were first established during 1953-54 in
which common crafts like weaving, cane and bamboo
works, sewing, knitting, tailoring, soap making, carpet
making, bee keeping, painting, wood carving, pottery and
black smithy were introduced taking into consideration
the traditional expertise of the people. As in 2004 there
were 88 craft and weaving centres, 6 handloom
development centres, 18 emporia, 5 showroom-cum-sales
counters and 1 research design unit. The craft and
weaving centres mostly provide training and improve
skills in such activities in which the people have some
traditional expertise. However, the two ITIs of the State
provide training in non-traditional trade like electrician,
fitter, mechanic, wiremen, draftsman, carpentry, welder,
plumber, surveyor, secretarial practice, etc. Except
carpentry, people did not have any traditional skill or
familiarity with new trades.
Salient Features of Indigenous Industries
Technology: Technology used in the production is
basically simple and unsophisticated in nature. The only
metal equipment that is invariably used is iron knife (dao).
Tools like loom are made of wood, bamboo and stone.
Skill acquisition: The skill is acquired through imitation
and learning by doing. The skill acquisition has a gender
dimension as the males do not weave in communities like
Adi, Apatani, Nyishi and females do not learn hunting.
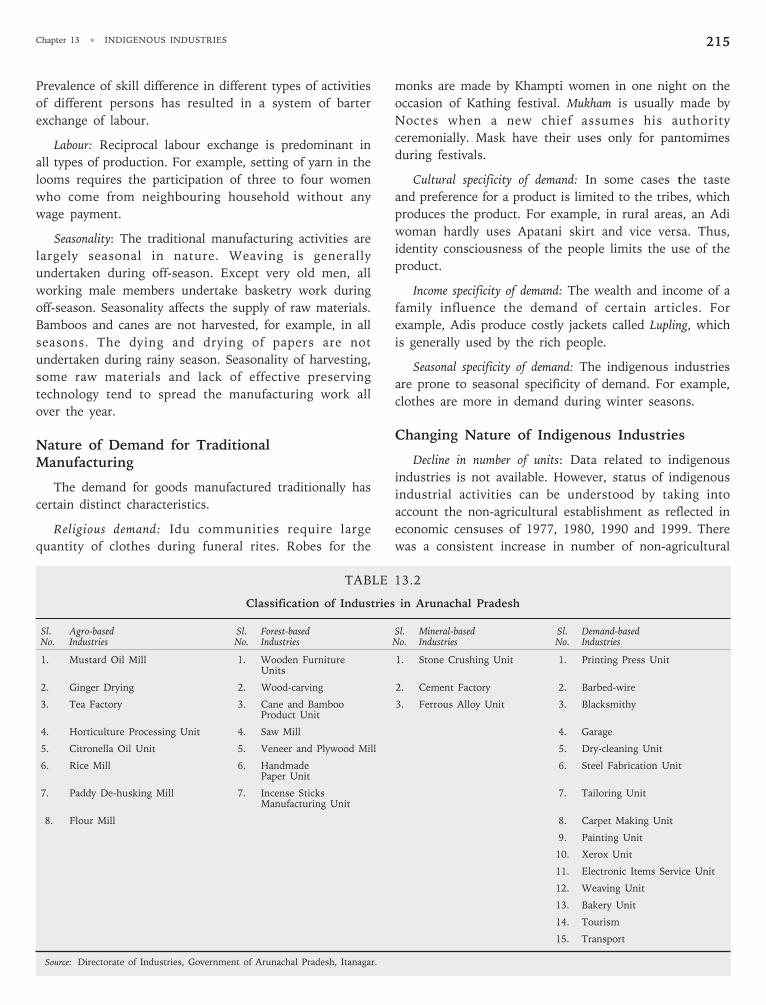
215Chapter 13 • INDIGENOUS INDUSTRIES
Prevalence of skill difference in different types of activities
of different persons has resulted in a system of barter
exchange of labour.
Labour: Reciprocal labour exchange is predominant in
all types of production. For example, setting of yarn in the
looms requires the participation of three to four women
who come from neighbouring household without any
wage payment.
Seasonality: The traditional manufacturing activities are
largely seasonal in nature. Weaving is generally
undertaken during off-season. Except very old men, all
working male members undertake basketry work during
off-season. Seasonality affects the supply of raw materials.
Bamboos and canes are not harvested, for example, in all
seasons. The dying and drying of papers are not
undertaken during rainy season. Seasonality of harvesting,
some raw materials and lack of effective preserving
technology tend to spread the manufacturing work all
over the year.
Nature of Demand for TraditionalManufacturing
The demand for goods manufactured traditionally has
certain distinct characteristics.
Religious demand: Idu communities require large
quantity of clothes during funeral rites. Robes for the
monks are made by Khampti women in one night on the
occasion of Kathing festival. Mukham is usually made by
Noctes when a new chief assumes his authority
ceremonially. Mask have their uses only for pantomimes
during festivals.
Cultural specificity of demand: In some cases the taste
and preference for a product is limited to the tribes, which
produces the product. For example, in rural areas, an Adi
woman hardly uses Apatani skirt and vice versa. Thus,
identity consciousness of the people limits the use of the
product.
Income specificity of demand: The wealth and income of a
family influence the demand of certain articles. For
example, Adis produce costly jackets called Lupling, which
is generally used by the rich people.
Seasonal specificity of demand: The indigenous industries
are prone to seasonal specificity of demand. For example,
clothes are more in demand during winter seasons.
Changing Nature of Indigenous Industries
Decline in number of units: Data related to indigenous
industries is not available. However, status of indigenous
industrial activities can be understood by taking into
account the non-agricultural establishment as reflected in
economic censuses of 1977, 1980, 1990 and 1999. There
was a consistent increase in number of non-agricultural
TABLE 13.2
Classification of Industries in Arunachal Pradesh
Sl. Agro-based Sl. Forest-based Sl. Mineral-based Sl. Demand-basedNo. Industries No. Industries No. Industries No. Industries
1. Mustard Oil Mill 1. Wooden Furniture 1. Stone Crushing Unit 1. Printing Press UnitUnits
2. Ginger Drying 2. Wood-carving 2. Cement Factory 2. Barbed-wire
3. Tea Factory 3. Cane and Bamboo 3. Ferrous Alloy Unit 3. BlacksmithyProduct Unit
4. Horticulture Processing Unit 4. Saw Mill 4. Garage
5. Citronella Oil Unit 5. Veneer and Plywood Mill 5. Dry-cleaning Unit
6. Rice Mill 6. Handmade 6. Steel Fabrication UnitPaper Unit
7. Paddy De-husking Mill 7. Incense Sticks 7. Tailoring UnitManufacturing Unit
8. Flour Mill 8. Carpet Making Unit
9. Painting Unit
10. Xerox Unit
11. Electronic Items Service Unit
12. Weaving Unit
13. Bakery Unit
14. Tourism
15. Transport
Source: Directorate of Industries, Government of Arunachal Pradesh, Itanagar.

ARUNACHAL PRADESH DEVELOPMENT REPORT216
establishment from 4410 in 1977 to 6331 in 1980 and
11193 in 1990. This number declined to 10045 in 1998.
The decline in industrial activities can be understood from
Table 13.3.
Table 13.3 reveals that around 50 per cent of the
small-scale industries were closed as on 31st October
2002. The closure rate is higher in rural than in urban
areas. The data gives a proxy estimate of the decline in
industrial activities in the State in general and indigenous
industries in particular.
TABLE 13.3
Rural-Urban Characteristics of Small-Scale Industries
Sl. Rural/Urban No. of SSI Closed SSI % of Closed% to Total ClosedNo. Working Units Units Units
1. Rural 145 183 55.79 72.62
2. Urban 121 66 36.31 27.38
3. Total 266 249 48.65 100
Source: Directorate of Industries, Government of Arunachal Pradesh.
Squeezing of demand: With the expansion of market even
in the interior areas of the State and availability of cheaper
substitutes have resulted in diversion of local demand
from the indigenous products to the cheaper products
from the rest of the country. As a result the demand for
indigenous manufactures has been squeezed.
Product variation: Market has facilitated in some cases
product variation. For example, Apatanis have switched
over to the production of indigenously designed neckties,
shirts and other clothes. These diversified textile products
of the Apatanies have helped them to market their
product in a better way. This type of product variation is
limited to certain tribes only.
Decline of mutual reciprocity: With the emergence of
money, economy and the spread of education many people
have switched over to better-paid non-traditional
activities. As a result, traditional labour supply based on
mutual reciprocity is on the decline in the indigenous
industries. Wage labour is hired in some cases for
production in traditional industries. Thus, the industries
have started using a combination of indigenous and non-
traditional skills.
Findings of the Field Survey
• Through indigenous industrial activities some
families earns around 25 per cent of their income.
Thus the activities are not full-time livelihood
options.
• Value added per worker in the indigenous
industries is higher than the non-indigenous
industries.
• Marketing network is mainly responsible for the
low price, that the producers get. This is the reason
why in indigenous textiles sector, the value added
becomes negative in some cases.
• Demand for the indigenously produced good is very
low, because of competition from the substitutes
available in the market. The existing demand is
because of promotional drive of the government
and the NGO sector. This demand is not enough to
promote mass production. Further seasonal nature
of the demand refuels the process and mass
production is discouraged.
• The promotional role of the government and NGOs
is restricted to the urban centres only.
• Product diversification is limited to certain tribes
only.
• Institutional credit is limited to a few
entrepreneurs.
Potentials and Prioritisation
Of the 12 indigenous activities shown in Table 13.1,
three activities namely local wine manufacturing, textile
and basketry still have significance in the changing
economic life. Textile products with innovations not only
meet the changing needs of local consumption but also
create a market demand outside the locality and the State.
Basketry products with innovations and modifications
meet the changing tastes of the people in setting up
drawing-rooms and creating market demand. Though local
wine is produced in almost all households, it does not
have market demand beyond the locality. Salt
manufacturing is limited to some brine wells in Barduria
and Namsang areas of Noctes in Tirap. Increasing the
scale of production depends on investigation into the
sustainability of wells, refinement of salt and cost-effective
technology of manufacturing. Manufacturing of pottery
and ornaments, and the skill of doing has declined.
Similarly, leather work and smithy have also declined.
Wood carving, scroll painting and head-dress have
decreased at some quarters because of the growing middle
class and consumerism among the tribes. These products
also have a demand base outside. For large scale
marketing the products need to be standardised, less
expensive and marketed through a marketing network. If
these things can be achieved, then the following industrial
activities can be promoted.

217Chapter 13 • INDIGENOUS INDUSTRIES
Activities Districts Innovations
Textile West Kameng, Standardisation,Tawang, East Kameng, marketing network,Lower Subansiri, East innovations in colourSiang, West Siang, pattern and design,Upper Siang, Lohit, designing products forAnjaw, Dibang Valley, use in differentLower Dibang Valley occasions by differentand Papum Pare age groups.
Basketry All districts Designing for differentuses and for competingavailable substitutes.
Wood carving Tirap, Changlang, Diversification of itemsLohit, West Kameng, to meet market demandTawang for utilitarian and
decorative objects.
Headdress West Siang, East Designing for variousSiang, Upper Siang, uses.West Kameng, Tawang,Tirap, Lower DibangValley and Papum Pare
Paper Tawang, West Kameng Technological innovationand attractive source ofraw materials.
Painting/Scroll Tawang, West Kameng Cost effectivenesspainting/Carpet
Smith In all districts Technological innovation.(Generally one in eachbig village but it isdeclining)
Local Wine All districts Technological innovationor preservation andflavour.
The number of units in the State for each activity
needs to be decided before starting the activities. Too
many units will fall victim to competition and be
unremunerative.
Policy Options
• Introduction of better technology to improve the
product quality so that it can capture the market
outside the State.
• Priority should be determined on the basis of
quantification of backward and forward linkages.
• Linkage between indigenous industrial activities and
modern industries to be strengthened.
• Identification and promotion of the indigenous
industrial products, which enjoy a comparative
advantage.
• Institutional credit facilities with procedural
simplification may be ensured to the indigenous
industries.
• Alternative sources of raw materials may be
ensured for the products like incense stick as the
existing inputs may not be sustainable in the long
run.
• To promote the indigenous industrial activities a
state level Commission may be set up.
• Reliable data base may be generated for proper
monitoring and evaluation of indigenous
manufacturing activities.
• In order to promote the marketing of the
indigenous product tie up may be made with the
reputed companies. In order to facilitate such tie-
ups institutional mechanism may be evolved.
Marketing network, preferably marketing
cooperatives under public-private partnership may
be established starting from at least circle HQ to
the state level. The state organisation may solely
look after the marketing within the country and
abroad (export).
• The marketing network will deal with the provision
of raw material supply to manufacturer, producers
and product marketing.
• In order to translate industrial potentiality into
viable production units training, in production of
innovations and issues regarding intellectual
property rights may be given top priority.

Introduction
In economic literature, connotation of the term
industry is not entirely unambiguous. In the context of
perfect competition, an industry comprises all firms
producing a homogeneous product. In input-output
parlance an industry corresponds to production of a
particular commodity as per classification of total
domestic product into various categories. In more
common usage the term is used to mean a manufacturing
based production unit as distinct from agriculture and
services. However, these days tourism, IT and IT-enabled
activities, which essentially fall in the service sector are
also referred to as industries. Since the present chapter is
concerned with development of resource-based and other
modern industries, the meaning of the term industry is
confined to manufacturing.1 It is well known that
Arunachal Pradesh has considerable potential for
generation of power, especially hydro-power. Hence,
power generation is obviously a major prospective
resource-based industry. But since power has been dealt
with in a separate chapter it will not be discussed in the
present chapter. For the same reason the problems and
prospects of traditional handicrafts—despite the sector
being based on local raw materials and the significant but
intangible local resource of traditional skill of the ethno-
culturally rich population of the state—will not be
discussed here. Thus in this chapter the meaning of the
term ‘resource-based and modern industries’ will be
confined to such manufacturing activities which are based
ARUN
ACH
AL PR
ADESH
Chapter 14
Development of Resource-based
and Modern Industries
on forest2 and mineral resources of the State and/or which
can add value to output of agriculture and related sectors
through processing.
The Status of ManufacturingIndustries in Arunachal Pradesh
In the present structural composition of the economy
of Arunachal Pradesh manufacturing sector constitutes a
rather thin layer. In 2003-04 the sector contributed only
2.05 per cent of net domestic product of the state.3 This
share is very low not only by all-India standard, but even
by the standard of the North-eastern region, which is well
recognised as one of the least industrialised parts of the
country. Not only is the share low but it has been
declining steadily through the last decade from 3.20 per
cent in 1993-94 to 2.05 per cent in 2003-04. Moreover, at
constant prices, the contribution of manufacturing has
been declining even in absolute terms in the last four
years. Another feature, rather a weakness, of the
manufacturing base of the State is that the entire value
addition from manufacturing takes place in the
unregistered segments, while in the most parts of the
country the registered segment is more dominant. Here in
Arunachal Pradesh this segment is conspicuous by its
absence.
The decline in industrial production can be largely
traced to the closure of plywood and other timber
processing units following the restrictions imposed on
felling of trees in Arunachal Pradesh by the Supreme
1. Oxford Advanced Learner’s Dictionary (Oxford University Press 2000) gives the first two meanings of ‘industry’ as “the production of goods from rawmaterial especially in factories” and “the people and activities involved in producing a particular thing or providing a particular service”. ‘Manufacturing’ onthe other hand has been defined as “the business or industry producing goods in large quantities using machinery”.
2. The techno-economic survey of the State conducted in late 1960s by the National Council for Applied Economic Research (1967: 63-79) identified forestsand hydro-power as the physical resources for immediate development. While forest-based plywood industry flourished in the State till a few years back, thehydro-power potential remains yet largely untapped.
3. Table 36.9, Statistical Abstract of Arunachal Pradesh, 2004.
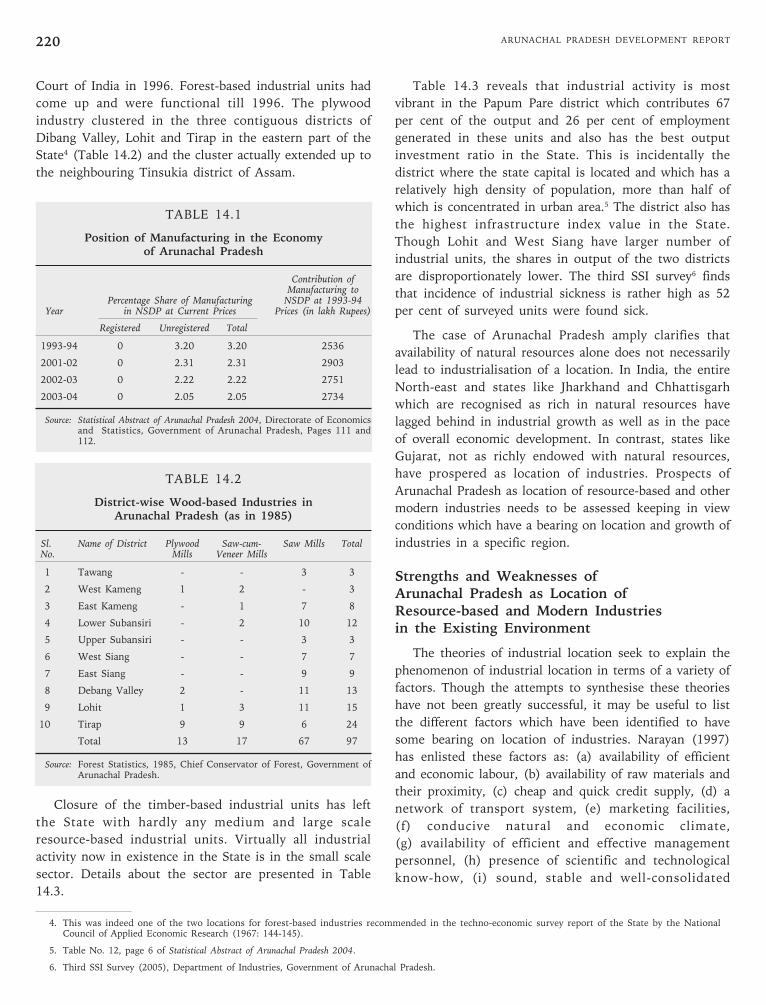
ARUNACHAL PRADESH DEVELOPMENT REPORT220
Court of India in 1996. Forest-based industrial units had
come up and were functional till 1996. The plywood
industry clustered in the three contiguous districts of
Dibang Valley, Lohit and Tirap in the eastern part of the
State4 (Table 14.2) and the cluster actually extended up to
the neighbouring Tinsukia district of Assam.
TABLE 14.1
Position of Manufacturing in the Economyof Arunachal Pradesh
Contribution ofManufacturing to
Percentage Share of Manufacturing NSDP at 1993-94Year in NSDP at Current Prices Prices (in lakh Rupees)
Registered Unregistered Total
1993-94 0 3.20 3.20 2536
2001-02 0 2.31 2.31 2903
2002-03 0 2.22 2.22 2751
2003-04 0 2.05 2.05 2734
Source: Statistical Abstract of Arunachal Pradesh 2004, Directorate of Economicsand Statistics, Government of Arunachal Pradesh, Pages 111 and112.
TABLE 14.2
District-wise Wood-based Industries inArunachal Pradesh (as in 1985)
Sl. Name of District Plywood Saw-cum- Saw Mills TotalNo. Mills Veneer Mills
1 Tawang - - 3 3
2 West Kameng 1 2 - 3
3 East Kameng - 1 7 8
4 Lower Subansiri - 2 10 12
5 Upper Subansiri - - 3 3
6 West Siang - - 7 7
7 East Siang - - 9 9
8 Debang Valley 2 - 11 13
9 Lohit 1 3 11 15
10 Tirap 9 9 6 24
Total 13 17 67 97
Source: Forest Statistics, 1985, Chief Conservator of Forest, Government ofArunachal Pradesh.
Closure of the timber-based industrial units has left
the State with hardly any medium and large scale
resource-based industrial units. Virtually all industrial
activity now in existence in the State is in the small scale
sector. Details about the sector are presented in Table
14.3.
Table 14.3 reveals that industrial activity is most
vibrant in the Papum Pare district which contributes 67
per cent of the output and 26 per cent of employment
generated in these units and also has the best output
investment ratio in the State. This is incidentally the
district where the state capital is located and which has a
relatively high density of population, more than half of
which is concentrated in urban area.5 The district also has
the highest infrastructure index value in the State.
Though Lohit and West Siang have larger number of
industrial units, the shares in output of the two districts
are disproportionately lower. The third SSI survey6 finds
that incidence of industrial sickness is rather high as 52
per cent of surveyed units were found sick.
The case of Arunachal Pradesh amply clarifies that
availability of natural resources alone does not necessarily
lead to industrialisation of a location. In India, the entire
North-east and states like Jharkhand and Chhattisgarh
which are recognised as rich in natural resources have
lagged behind in industrial growth as well as in the pace
of overall economic development. In contrast, states like
Gujarat, not as richly endowed with natural resources,
have prospered as location of industries. Prospects of
Arunachal Pradesh as location of resource-based and other
modern industries needs to be assessed keeping in view
conditions which have a bearing on location and growth of
industries in a specific region.
Strengths and Weaknesses ofArunachal Pradesh as Location ofResource-based and Modern Industriesin the Existing Environment
The theories of industrial location seek to explain the
phenomenon of industrial location in terms of a variety of
factors. Though the attempts to synthesise these theories
have not been greatly successful, it may be useful to list
the different factors which have been identified to have
some bearing on location of industries. Narayan (1997)
has enlisted these factors as: (a) availability of efficient
and economic labour, (b) availability of raw materials and
their proximity, (c) cheap and quick credit supply, (d) a
network of transport system, (e) marketing facilities,
(f) conducive natural and economic climate,
(g) availability of efficient and effective management
personnel, (h) presence of scientific and technological
know-how, (i) sound, stable and well-consolidated
4. This was indeed one of the two locations for forest-based industries recommended in the techno-economic survey report of the State by the NationalCouncil of Applied Economic Research (1967: 144-145).
5. Table No. 12, page 6 of Statistical Abstract of Arunachal Pradesh 2004.
6. Third SSI Survey (2005), Department of Industries, Government of Arunachal Pradesh.

221Chapter 14 • DEVELOPMENT OF RESOURCE-BASED AND MODERN INDUSTRIES
political atmosphere, (j) existence of complementary
industries, and (k) historical and regional importance.
Though the list of factors appears to be exhaustive, all of
them are usually not available in any location. All the
factors are also not equally important for each and every
industry. Hence, the net impact of the favourable factors
over the unfavourable factors in a specific location
compared to the same in other competing locations
become decisive for industries to come up and get
established in a region or place.
Some of the above-listed factors having bearing on
location of industries can be dealt with relatively easily
with suitable policy instruments. Cheap and quick credit
supply, and political atmosphere are some such factors.
For factors such as technological know-how and
management personnel, the State can rely on imports
when and till they are not locally available. The most
critical of the factors from the list in the previous section
for establishment of industries and consolidation of
industrial base in the State appears to be market access,
availability of skilled labourers, transportation network
and the quantity and quality of natural resources for
industrial exploitation. These four factors are thus worth
some detailed discussion. As it stands today, Arunachal
Pradesh appears to have some disadvantages with regard
to the first three of the four factors.
Market and Access
Locally the size of the markets is limited by small and
dispersed population with not particularly high levels of
income.7 The fact that the small scale industry sector is
doing relatively better in the more urbanised and
prosperous Papum Pare district, makes the point that, had
the markets in general been bigger, there would have
been more support for industrial activity to thrive. The
linkage with markets outside is difficult for the North-east
region as a whole because of its relative isolation from the
mainland and the weak economic conditions in the
neighbouring countries of Myanmar and Bangladesh. This
difficulty is more severe for Arunachal Pradesh because of
its location within the region and also its mountainous
terrain. The mountainous and landslide prone nature of
the terrain makes travel and transportation within the
State uncertain and costly in terms of both time and
money. This creates a hindrance for gathering bulky
natural resources at central locations for industrial use.
Transportation problems also weigh against locating
industries in the State if the finished products are to be
TABLE 14.3
Some Details of the Small Scale Industrial Units in Arunachal Pradesh as in 2003-04
District SSI Units Persons Employed Total Investment Output Infrastructure OutputIndex Invesment
Ratio
No % share No % share In Rs Lakhs %share In RsLakhs %share
Tawang 15 5.64 90 2.92 14.14 0.95 14.91 0.44 3.87 1.054
West Kameng 18 6.77 298 9.66 20.53 1.38 102.02 3.04 2.76 4.969
East Kameng 4 1.50 24 0.78 2.18 0.15 14.8 0.44 1.43 6.789
Papum Pare 46 17.29 811 26.29 242.15 16.33 2246.37 67.03 4.96 9.277
Lower Subansiri 12 4.51 62 2.01 16.73 1.13 22.35 0.67 2.56 1.336
Upper Subansiri 5 1.88 34 1.10 17.19 1.16 16.38 0.49 2.16 0.953
West Siang 52 19.55 670 21.72 248.44 16.76 237.09 7.07 3.01 0.954
East Siang 16 6.02 180 5.83 91.19 6.15 69.3 2.07 4.04 0.760
Upper Siang 1 0.38 10 0.32 4.98 0.34 4.22 0.13 2.10 0.847
Dibang Valley* 6 2.26 30 0.97 6.83 0.46 8.64 0.26 1.69 1.265
Lohit 60 22.56 414 13.42 57.47 3.88 44.83 1.34 2.17 0.780
Changlang 22 8.27 336 10.89 633.4 42.73 461.61 13.77 3.44 0.729
Tirap 9 3.38 126 4.08 126.97 8.56 108.97 3.25 3.66 0.858
Arunachal Pradesh 266 100 3085 100 1482.49 100 3351.36 100 2.91 2.261
Note: *Including Lower Dibang Valley.
Source: Statistical Abstract of Arunachal Pradesh 2004, Directorate of Economics and Statistic and Human Development Report of Arunachal Pradesh 2005, Department ofPlanning, Government of Arunachal Pradesh.
7. This point was made in the industrial potential survey report of the State prepared by the Industrial Development Bank of India (1972: 39) also.
ARUNACHAL PRADESH DEVELOPMENT REPORT222
disposed of mostly in markets outside the State. Indeed
the third SSI survey found that out of the total sick
industrial units in the State, 46 per cent reported lack of
demand as the main reason of sickness. Marketing of the
products and non-availability of raw materials were cited
as the second and the third most important reasons of
sickness.
Industrial Workforce
Non-availability of ready industrial workforce can also
be a disincentive for locating industrial units in the State.
If labour has to be brought from outside, obviously it
would be costlier to locate an industry in the State than to
locate it near the source of labour supply. Moreover, if
industrialisation has to depend primarily on in-migrant
workers, the participation of the local population in the
process of industrial development will be concomitantly
reduced. Hence, the contribution of industrialisation
towards achieving development goals will be limited.
Resource Base
On paper the State definitely has significant advantage
for industrial location in terms of availability of natural
resources.
Minerals
The chapter on natural resource management (Chapter
7) in this report gives an account of 11 different mineral
deposits which have been identified in various locations of
Arunachal Pradesh. The estimated reserves of many of
these are however, yet to be ascertained.8 Obviously there
is scope for further exploration and more detailed
estimation exercise. From the figures in Table 7.1 of that
chapter, the limestone deposit appears to be most
substantial and prospective. Significantly, the larger part
of the identified limestone deposit is located in three
contiguous districts of East Siang, Dibang Valley and
Lohit in the north-eastern bend of the State. This
limestone belt running across these three districts thus
can become a seat for a prospective cement industry.
Critical factors here of course will be the specific locations
and their accessibility, and the quality of the deposits.
Moreover, if the finished product is to be marketed
outside, transportation from the industrial site to the
market will also be a crucial factor for the viability of the
industrial units.
Even if the amount of deposits of the rest of the
minerals are not adequate for feeding viable industrial
units within the State, mining of these deposits should be
started to the extent that the minerals can be traded
profitably. Emergence of modernised mining activities,
besides generating income and employment directly, can
turn conditions favourable for emergence of modern
industrial activities in the State.
Forests
In view of the extensive forest cover9 of the State it is
natural to expect that the State has prospect for
development of forest-based industries. The closure of the
plywood mills and other timber processing units and
resultant displacement of employees is still a sensitive
issue in Arunachal Pradesh. Prima facie there is a case for
compensation to the State for this restriction imposed on
using forest resources for economic gains. But at the same
time it is imperative to recognise the hazard of
unrestricted commercial exploitation of forest. Forests,
besides providing raw materials for industrial use,
perform various other economic roles including providing
firewood and other livelihood support to the poorer
sections. Since these additional social benefits are usually
not internalised in the commercial profit calculation of
forest-based industrial units, the social cost of destroying
forests for industrial exploitation is generally
underestimated. Social cost-benefit analysis of forest-
based industrial units need to take into account these
externality benefits of forests which will be foregone if
forests are degraded in course of their industrial
exploitation. Since in any case, unrestricted commercial
exploitation of forests cannot be sustained over a long
period of time, forest-based industries will have only a
short life span unless adequate care is taken for
conservation of the raw material source. Hence, it is
advisable that a revival of forest-based industrial activities
should be encouraged to the extent that extraction of raw
materials from forests does not seriously outstrip their
sustainable yields.
A study by the Indian Institute of Entrepreneurship
identifies paper, handmade paper, forest plantation, tea
and coffee, herbal medicinal (ayurvedic type), saw mill,
cane and bamboo furniture, wooden furniture, sports
goods, bamboo ply (laminated bamboo), wooden electrical
8. In fact, the National Council of Applied Economic Research (1967) report was of the view that mineral resources as known at that time were insufficientto start any worthwhile industrial development programme.
9. As per the Basic Statistics of North Eastern Region 2002 Arunachal Pradesh has about 51.5 thousand sq. km. i.e., 82 per cent of its total geographical areaunder forest. (Government of India, 2002, pp. 44-45).

223Chapter 14 • DEVELOPMENT OF RESOURCE-BASED AND MODERN INDUSTRIES
accessories, particle board, etc., as prospective forest-
based industries in the State.10
Agriculture
In view of the predominance of agriculture in the
economy of the State, the case of agro-processing as a
prospective modern manufacturing activity is worth some
discussion here. Because of its strong backward linkage11
with the agriculture sector and its potentials to contribute
to the growth of rural income and employment, agro-
processing has received serious attention of policymakers
in recent years and special fiscal incentives have been
provided by the Central government for its expansion.
Commissioned studies by a number of agencies such as
the Tata Consultancy Service, Indian Institute of
Entrepreneurship and NEDFi12 on industrial potentials of
the State have highlighted potential of this sector. Some
of the specific agro-based industrial activities identified
are: tapioca processing for production of sago and starch,
brewing of fruit-based alcoholic beverages, ginger
processing/dehydration, apple cultivation and processing,
processing of citrus fruits, cold storages, multipurpose
fruits and vegetables processing. Notwithstanding the
potentials, the emergence of the agro-processing industry
will be conditional upon the growth and development of
the agriculture sector. The existing subsistence-oriented
agriculture obviously cannot provide the input base for
such processing activity. But as agriculture gets
increasingly commercialised and marketable surpluses
appear in sizeable quantities to feed viable modern agro-
processing plants, the industry can come up. Indeed
agriculture and agro-processing industry can then
mutually reinforce each other’s growth.
Government Policy Incentives
“Because governments structure so much of our lives,
they have tremendous influence over industrial location.
They exercise these influence in regulation of markets,
maintenance of macroeconomic conditions, the location of
their own activities, their procurement policies and in
their deliberate attempts to manage the location of private
investment.” (Harrington and Warf, 1995: 195)
In this context it is pertinent to examine whether
government interventions, especially the measures and
policies to promote industrial development, have
succeeded in mitigating disadvantages and/or enhancing
advantages of Arunachal Pradesh as a destination for
investment in resource-based and modern industries.
Initiative of the Central Governmentin the Pre-Liberalisation Period
To counter some of the locational disadvantages for
setting up of industries in Arunachal Pradesh, the Central
and the state governments have adopted various measures
and offered incentive packages from time to time.
Reviewing the reports of the different committees set up
by the Central government that had gone into the
problems of industrialisation of backward and hilly
regions, Chobin (2002: 44) concludes, “Though the need
to promote industrial development in backward areas of
the country was felt from the very inception of national
planning, concrete measures were awaited till the early
seventies…The Fourth Five Year plan noticed that the
cost of providing necessary infrastructure for the further
expansion of existing large urban and industrial centres
was often much larger than what it might be, if
development was purposefully directed to occur in smaller
country and rural areas.” Financially, such purposefully
directed efforts consisted of provision of concessional
borrowing facilities from All-India Term Lending
Institutions and a Central Investment Subsidy Scheme.
The measures had, if at all, very limited results. Despite
the absence of visible result the policy of investment
subsidy was continued uninterrupted for 15 years. The
policy was reviewed in the Seventh Plan and subsequently
phased out and finally withdrawn in 1989 but without any
alternative package of programmes for the development of
industries in backward and hilly areas.
Post-Liberalisation Incentives
In the post-liberalisation period, a package of incentive
measures was brought in under Industrial Policy and
Other Concession in the North-eastern region13 which has
now been available for about a decade. These include
transport subsidy to mitigate high cost of movement of
materials, tax holiday for first 10 years of production to
balance initial cost disadvantage, capital subsidy as well as
interest subsidy on working capital credit. The impact of
these measures is yet to be visible in Arunachal Pradesh.
10. “Arunachal Pradesh : Its Resources and Industrial Prospects”, study conducted by IIE, July 1996, accessed from NEDFi Data Bank, Bottom of Form NorthEastern Development Finance Corporation Ltd. 2002.
11. Analysing data from survey of unorganised industries of 2000-01, Sarkar and Karan (2005) found that the direct backward production linkage of village levelagro industry is much higher (0.5813) than that of non-agro industry.
12. As reported in the website maintained by National Informatics Centre, Assam, North Eastern Development Finance Corporation Ltd. Can be availed byemail to [email protected]
13. New Industrial Policy and Other Concession in the North-eastern region., EA/1/2/96-IPO, Government of India, Ministry of Industry, Department ofIndustrial Policy and Promotion, 24th December 1997.
ARUNACHAL PRADESH DEVELOPMENT REPORT224
Initiatives of the State Government
The Government of Arunachal Pradesh on its part
came out with an industrial policy in 1994. There have
been some efforts to boost the growth of small scale
industries by setting up industrial estates and industrial
growth centres. Tata Consultancy Service (1997) in its
study for a master plan for industries sector in Arunachal
Pradesh recommended marketing of the State as an
investment destination to investors in other parts of India
and abroad. A reflection of this suggestion is found in the
New Industrial Policy of 2001 of the Government of
Arunachal Pradesh (2001), which explicitly mentions that
investors from outside will be encouraged to invest in the
state. However, the conditionality attached to such offer
can impart a negative signal to the potential investors
from outside.14
From the present status of the manufacturing sector in
Arunachal Pradesh, as portrayed by the statistics
presented above in the present chapter, it is obvious that
governmental efforts and policies have so far not
succeeded in giving any noticeable impetus to the
development of recourse-based and modern industries in
the State. Perhaps, as Chobin (2002: 74) puts it,
“locational, topographical and economic disadvantages in
industrialising the State appears to be many times higher
than advantages offered by both Centre and State
Governments”. In that event a more comprehensive policy
package, addressing also the fundamental issues of the
problems of connectivity and factor market imperfections
may be required.
Resource-based and ModernIndustries in the Dynamics for EconomicDevelopment of Arunachal Pradesh
In view of the above discussion it is perhaps safe to
conclude that Arunachal Pradesh cannot bank on
resource-based and modern industries to kick start the
process of accelerated economic development. Such a
development process has to be unleashed by growth of
sectors such as hydro-power, tourism, plantation and
horticulture. This is however not to suggest that resource-
based and modern industries will have no role in the
dynamics of development in the State. Indeed as the
development process is set in motion by the growth of a
few key activities, the ground conditions will change and
the economic environment is likely to be favourably
turned for industrialisation to be turned on and then add
momentum to the development process.
For illustration let us take the case of
complementarities between hydro-power sector and the
cement industry. As indicated above, in spite of the
substantial limestone deposits in the north-eastern belt of
the state, the cement industry may not automatically
come up there because of the high transport cost to the
markets outside. But setting up of hydro-power plants will
create a ready and large enough local market for a cement
industry to thrive. Once power generation picks up,
availability of cheap power will make the cement and
other industrial units cost effective cancelling out some of
the disadvantage of high transport cost. Meanwhile,
growth of the lead sectors will impart experience and skill
to the workers in handling modern industrial activities.
This can address the problem of absence of a ready
industrial workforce within the State.
In this context a few more factors, which can
potentially work to enhance the prospect of industries
playing a significant role in the process of development of
Arunachal Pradesh, are worth mentioning.
1. Though as of now manufacturing industry is a
rather insignificant component of the economy of
Arunachal Pradesh, the Economic Census Report of
1998 reveals that there is no dearth of enterprise
and entrepreneurial skill at the grassroots (Table
14.4). Nearly 10 per cent of these enterprises are
engaged in manufacturing. Though the percentage
may not seem to be large, it is significant compared
to the much lower share of manufacturing in the
net state domestic product. Once industrialisation
process gets underway this latent entrepreneurial
base can come handy for reaping fuller benefits of
industrialisation by locally setting up units for
harnessing spin off economic activities.
2. Elsewhere in this report, prospect of Arunachal
Pradesh benefiting from cross border trade is being
discussed. If such trade becomes vibrant that will
provide Arunachal Pradesh significant market
linkage for growth of economic activities in general
and industrial expansion in particular. Of course
such trade can be a double-edged sword as this can
bring in more competition from industries across
the border.
14. The policy states, "Investors from outside the state will be encouraged to invest in the state. Hundred per cent equity ownership of an industrial unit byentrepreneurs will be allowed for a maximum period of 30 years by the end of which period such equity holding will be reduced to 49 per cent, theremaining 51 per cent will be held by a local Arunachal Tribal entrepreneur or a group of local tribal entrepreneurs or the state government, if it considersnecessary to do so.”

225Chapter 14 • DEVELOPMENT OF RESOURCE-BASED AND MODERN INDUSTRIES
3. Last but not the least, as late comer to the
industrialisation process, the state will enjoy the
advantage of learning from the experience of others
and using the latest technological know-how which
can give its industries an edge in technical
efficiency.
TABLE 14.4
Type and Sector-wise Number of Enterprisesin Arunachal Pradesh in 1998
Sl. No. Sector Own Account Establishments All Enterprises
1 Agricultural 109 92 201 (0.97)
2 Non-Agricultural 10068 10425 20493 (99.03)
3 Manufacturing 1371 640 2011 (9.72)
4 Total 10177 10517 20694 (100.00)
Note: (1) An enterprise is defined as a unit engaged in production ordistribution of goods or services not for the sole purpose of self-consumption. Own account enterprise refers to an entrepreneurialunit without any hired labour. An enterprise with at least onehired labourer is counted as an establishment.
(2) Figures with parentheses are percentages of the total.
Source: Report on Fourth Economic Census of Arunachal Pradesh,Directorate of Economics and Statistics, Government of ArunachalPradesh.
Policy Suggestions
In light of the above discussion the following policy
measures are suggested for facilitating growth of resource
based and modern industries in Arunachal Pradesh:
a. Development of a few large industries with strong
mutual inter-linkage should be planned.
Simultaneous development of industries with
mutual inter-linkage will take care of the marketing
constraint to a good extent. There will be gains in
terms of cost reduction which in turn will improve
viability of industrial projects.
b. The plan for expansion of road network should take
into account the industrial development plan along
with the proposed locations of industrial units.
Resulting improvement of connectivity will further
brighten the viability of industrialisation
programme.
c. In view of ambiguity of land ownership,
government will have to play a proactive role in
making land available for setting up of industries.
Long term leasing of land should be arranged if
outright purchase is not possible.
d. Local entrepreneurs should be supported to
participate in developing ancillary and downstream
industries. This will prepare a class of local
entrepreneurs to carry forward the industrialisation
process.
e. Industrial workers including managerial and
technical personnel may have to be brought from
outside at least in the initial years. They should be
given proper work permits which should clearly
state the extent of their rights. To attract the best
of talent they should enjoy all civil rights. But to
avoid apprehension of indigenous communities of
being outnumbered and overwhelmed, the right to
acquire landed property should not be extended to
the permit holders.

Introduction
Arunachal Pradesh is endowed with an abundant forest
cover, mineral reserves, and water resources. Over 85 per
cent of the land cover of the State is covered by various
types of forests.
This chapter examines the interaction of various socio-
economic factors with nature highlighting their impact on
the state of the environment—air, water and land. In the
absence of data on environmental monitoring, several
estimations have been made to assess the status of
pollution load in the State. The chapter also reviews
relevant initiatives taken at the Central and state levels to
address environmental concerns and recommends
remedial measures.
Pressures on the Environment
Intensification of agricultural practices, low levels of
sanitation facilities, a high rate of urbanisation, vehicular
growth and waste generation are some of the main
pressures on the environmental quality in the State,
compounding the stress imposed by natural conditions.
Indoor environments, especially in rural areas, continue to
suffer from the adverse effects of the use of traditional
fuels for cooking and space heating. Some of these
pressures are discussed in this section.
The size of population as well as density is no doubt
low, but the lack of adequate services such as sewage and
sanitation, especially in growing urban centres requires
attention. A large section of the population has access to
safe drinking water facilities, though access to sanitation
facilities is poor. Under the drinking water supply scheme
ARUN
ACH
AL PR
ADESH
Chapter 15
Environment
of Arunachal Pradesh, a total of 2,12,615 sources have
been enumerated for distribution of drinking water to
households. These sources cover all the 17 towns,
however, out of a total of 4298 villages, 3293 habitations
are fully covered while 742 are partially covered. About
263 villages were still not covered under the scheme till
2004 (Ministry of Finance, 2004).
Arunachal Pradesh ranks 9th amongst 35 states and
union territories in terms of percentage of households
having a tap as the source of drinking water. About 68 per
cent of the households use tap as a drinking water source,
as compared to a national average of about 3 per cent.
However, in terms of percentage of households with
source of drinking water within premises, with a figure of
32 per cent, Arunachal Pradesh stands lower than the
national average of 39 per cent. In the case of sanitation
services, the percentage of households with open drainage
for waste water outlet is 29 per cent as compared to the
national figure of 34 per cent. A meagre 11 per cent of
households are equipped with water closet latrine
systems. Inadequate sewerage network and improper
sanitation facilities lead to the degradation of environment
in the catchments of natural drains. Besides polluting
water bodies, this has a detrimental effect on the aquatic
life.
It is estimated that the total domestic BOD load
generated across the State is 10936 kg/day.1 Papum Pare
district is estimated to be the largest contributor (1086
kg/day), and Upper Siang district the lowest (224 Kg/
day).2
One of the clear signs of urbanisation in the State is
the growth in the number of vehicles. According to
1. The estimate is made assuming a normative BOD generation per capita per day of 45 gm and that on an average, 80 per cent of the water supplied to thedomestic sector ends up as waste water.
2. Since the data on the water quality of the rivers in the State is not available, the quantum of impact on the water resources could not be assessed.

ARUNACHAL PRADESH DEVELOPMENT REPORT228
Economic Review 2003-04, the total number of vehicles of
all types registered in the State during 2003-04 was 5703
(excluding Dibang Valley) as against 3586 vehicles
registered during 1999-2000, an increase of 55 per cent
over four years. Two wheelers accounted for almost 72.5
per cent of the total vehicles. Though the estimated
vehicular density (37) in 2001 was lower than the
national average of 53, vehicular air pollution is expected
to become an issue of concern due to high estimated
vehicular growth rate. As per the auto fuel policy, 2003
Bharat Stage II emission norms are applicable for all
vehicles in the country from April 1, 2005. However,
interactions with concerned departments revealed that the
degree of enforcement of these norms in the State is
weak. Vehicular pollution usually leads to greater
incidence of respiratory health problems.
The other environmental issue associated with
urbanisation and inadequate infrastructure is poor waste
management. Given limited information, it is difficult to
assess the amount or constitution of waste generated in
the State. The daily per capita generation of municipal
solid waste (MSW) in India ranges from about 100g in
small towns to 500g in large towns (Central Pollution
Control Board (CPCB), 1999). It is estimated that the
total municipal solid waste generation in Arunachal
Pradesh is about 230 tonnes/day.3 Estimates of the
Central Pollution Control Board suggest that about 12
tonnes/day MSW is generated in Itanagar city alone
(CPCB, 2005). However, in view of the rich endowment
of tropical rain forest and dominance of agriculture as an
economic activity, organic waste is likely to be a
significant share of the total waste in the State.
Biodegradable waste can be easily decomposed and used
as compost in agriculture. If properly managed, it can
hence bring benefits in terms of environmental
improvement and resource recovery.
Another category of waste that needs to be effectively
managed is health care waste. There are about 580
government health care facilities, 17 family welfare clinics
and 1 private hospital in Arunachal Pradesh with a total
bed strength of approximately 2218. In the absence of any
legislation and lack of awareness, waste generated from
hospitals, nursing homes, blood banks and dispensaries,
which include infectious items like amputated body parts,
body fluids, bandages, scalpels are being disposed along
with municipal waste in dumpsites. Estimated infectious
waste from health care facilities of Arunachal Pradesh is
about 555 kg/day or 0.55 tonnes per day.4 Although this
category of waste forms a negligible share of the total solid
waste, it needs special attention due to its hazardous
nature and its potential to contaminate municipal waste if
not properly segregated. Estimates show that Papume Pare
has the highest hospital waste generation in the State.
The above analysis indicates that Papum Pare has the
highest pollution load in the State. Lohit, Changlang and
Papum Pare are also tourist attractions with hotels and
lodges adding to the waste generation.
Economic Activity
Economic activity in the State, especially agriculture is,
to a large extent, a function of the natural landscape. Four
main features of land use/land cover patterns emerge in
the natural landscape of Arunachal Pradesh: (i) the land
under barren, rocky, sloppy including snow covered areas
of the conical hills and steep slopes of mountain ridges
and escarpments of the Greater Himalayas, (ii) the land
under forest cover in most parts of the Lesser Himalayas
including denudational Siwalik areas, (iii) the moderate
slopes of main river valley tracts which cover the land
under degraded forests and shifting cultivation, and
(iv) the alluvial plains of Siang, Dibang and Lohit rivers
under settled cultivation (Singh, 1999). The land cover of
Arunachal Pradesh is ‘forest dominated’ as a major share
of land (85.3 per cent) is under various types of forests.
In general, the land use/land cover features of forests
versus cultivation are directly influenced and controlled by
the physiographic conditions. There is no record on the
changes in the conversion of land from one category to
the other over time. However, the processes of land use
intensification have been operating and a gradual shift can
be observed in the reduced cycle. The farming intensity
has also been rising in fertile alluvial plains of the State.
A brief outline of the district level land cover is presented
in Table 15.1.
An area of about 2705 sq km of the State (i.e., 3.2 per
cent) is under the practice of shifting cultivation. There is
association between the soil degradation and shifting
cultivation. It is found that the areas of severe erosion are
dominated by this practice. The districts in which
jhumming is the main agricultural practice are East
Kameng, Upper Subansiri, Upper Siang and Tirap.
While industrial activity in the State is modest, the
state government has drafted a new Industrial Policy in
2001, which aims at the development of all industries with
3. Assuming per capita waste generation in small urban cities to be 0.21 kg/day (NEERI, 1996).
4. Infectious waste generation from health care facilities in Arunachal Pradesh has been estimated using a generation factor of 250 g/bed/day of infectiouswaste, reported by CPCB (2000) estimates.

229Chapter 15 •
ENVIRONMENT
special emphasis on textile, handicrafts, electronics,
tourism and industries based on non-timber forest produce.
Presently, there are about 30 industries in the medium
scale and 2526 small scale industries, which fall primarily
in the category of arts and crafts, weaving, cane and
bamboo. Agro-based industries usually generate
biodegradable solid waste. Sawdust is the largest fraction of
waste from saw mills and wood processing industries but
certain wood preservatives, chemicals, oils, sludge, etc.
used in wood processing industries may contain hazardous/
toxic substances, which need to be treated before disposal.
Thermal power generation (using diesel sets) is another
potential source of air pollution, however, it accounts for
only 20 per cent of the total power generation in the State
with a decreasing trend over the years.
Though CPCB has not identified any polluting industry
in the State yet, an inventorisation of industries can give a
better picture of industrial waste generation. Further, it is
necessary that environmental safeguards are built into the
industrial expansion plans for the State.
Use of Traditional Fuels forDomestic Use in Rural Areas
In rural areas of Arunachal Pradesh, firewood is the
main fuel used for cooking even though its consumption
has been on the decline in the last 15 years—while 94 per
cent of the households in rural areas used it as the
primary fuel for cooking in 1991, the proportion came
down to 87 per cent in 2001. At the same time, the share
of households using LPG as the primary source of cooking
fuel went up from 1.6 to 9.7 per cent during this period
(Table 15.2). The dominance of fuel wood as a cooking
fuel has implications for indoor environment and health of
inhabitants.
In poorly ventilated dwellings, smoke from firewood
can exceed acceptable levels for small particles in indoor
TABLE 15.1
Land Use by Districts in Arunachal Pradesh (1995 Area in Hectares)
District Total Area Land under Cultivation Forest Cover Land under Barren/ Other Uses**Rocky Snow Cover
Settled Shifting Evergreen Degraded &Agriculture* Cultivation Forests Deciduous
Area % Area % Area % Area % Area % Area %
Tawang 208500 784 0.38 0 0.00 87028 41.74 58252 27.94 42529 20.40 2646 1.27
West Kameng 513400 0 0.00 0 0.00 357175 69.57 141101 27.48 14421 2.81 310 0.06
East Kameng 642203 0 0.00 0 0.00 506703 78.90 94974 14.79 15570 2.42 8947 1.39
Papumpare 343000 390 0.11 13437 3.92 278830 81.29 24273 7.08 0 0.00 26080 7.60
Lower Subansiri 966700 0 0.00 84486 8.74 723205 74.81 60114 6.22 60610 6.27 13306 1.38
Upper Subansiri 703200 0 0.00 18951 2.69 576680 82.01 31939 4.54 72040 10.24 3390 0.48
West Siang 764400 31165 4.08 46861 6.13 554440 72.53 95340 12.47 25442 3.33 11145 1.46
East Siang 404210 56881 14.07 9399 2.33 314007 77.68 25335 6.27 0 0.00 6089 1.51
Upper Siang 683300 5646 0.83 15684 2.30 491486 71.93 96372 14.10 65266 9.55 6247 0.91
Dibang Valley 1302900 31387 2.41 6813 0.52 926909 71.14 86222 6.62 250015 19.19 5171 0.40
Lohit 1140200 30955 2.71 72569 6.36 763006 66.92 106482 9.34 138217 12.12 5679 0.50
Changlang 466170 22234 4.77 1248 0.27 364746 78.24 70437 15.11 3533 0.76 4009 0.86
Tirap 236200 0 0.00 0 0.00 157889 66.85 73347 31.05 0 0.00 2460 1.04
Note: * Settled agriculture includes Rabi, Kharif and Double cropping land.
** Category of other uses includes land under water bodies, lakes, streams and built-up areas.
Source: Data generated from the maps supplied by National Remote Sensing Agency, Hyderabad as cited in Singh, 1999.
TABLE 15.2
Percentage Distribution of Households based on Fuel Consumption for Cooking
Cow-dung Electricity Coal LPG Fuelwood Biogas Kerosene Crop Residue Others
1991 Rural 0.05 0.17 0.13 1.66 94.31 0.03 3.06 0.00 0.60
Urban 0.16 0.53 0.07 20.36 52.09 0.42 25.43 0.00 0.95
2001 Rural 0.02 0.38 0.10 9.71 87.31 0.13 1.45 0.87 0.03
Urban 0.03 0.15 0.05 57.08 32.80 0.40 8.37 1.02 0.11
Source: Census of India (1991 and 2001).

ARUNACHAL PRADESH DEVELOPMENT REPORT230
air by 100-fold. Exposure to indoor air smoke is
particularly high among women and children, who spend
most of their time near the domestic hearth. There is
consistent evidence that exposure to indoor air pollution
increases the risk of lung cancer, asthma, cataracts and
tuberculosis. Women exposed to indoor smoke are three
times as likely to suffer from chronic obstructive
pulmonary disease, such as chronic bronchitis, than
women who cook and heat with electricity, gas and other
cleaner fuels (WHO, 2005).
Natural Factors
Arunachal Pradesh falls within Zone-V in the seismic
map of India, indicating the highest seismic hazard zone
(Gopalakrishnan, 1994). Earthquakes are a common
phenomenon in the State. They occur several times in a
year but are usually low in magnitude. This makes the
State prone to severe landslides and floods.
In the wet tropical and sub-tropical climate which
prevails in most parts of the State, there is the usual
phenomenon of erosion and land degradation by the
action of water. The severity and extent of erosion are
dependent on various climatic and geomorphological
factors of the physical landscape notably the amount,
intensity and duration of rainfall; amount and velocity of
surface run-off influenced by the nature of slopes,
drainage systems and its density, surface roughness, the
nature of soils and land cover. The intensity and extent of
these factors also define the type of erosion like splash
erosion, sheet erosion, gully erosions, stream erosion of
landslides (Singh, 1999).
State of the Environment
It is difficult to comment on the status of environment
in the absence of adequate pollution monitoring. The
ambient air quality in the State is not being monitored
currently, though there is a proposal to establish two
monitoring stations in the State under National Ambient
Air Quality Monitoring Program (NAMP) and CPCB.5 The
emission load from the industrial sector in Arunachal
Pradesh, however, is expected to be low because of its
negligible density. The emissions from saw mill and
plywood industries may contribute to particulate matter
and volatile organic compounds (VOC). There may be
local impacts in the immediate vicinity, especially, if
proper environment protection measures are not taken.
Likewise, the monitoring dataset for surface and
groundwater is not adequate to arrive at a conclusion.
However, some studies done by the Central Ground
Water Board (CGWB) and other agencies suggest that the
water quality of groundwater sources is well within the
prescribed requirements for domestic, industrial and
agricultural uses.6 No toxic elements have been reported
so far from any part of the State (CGWB, 2005). While
water quality of most rivers in different districts of
Arunachal Pradesh is not available, water quality of the
Brahmaputra that traverses through the region has been
reported to exceed the required bacteriological quality.
Dissolved oxygen and biological oxygen demand
concentration are observed within water quality criteria
limit of desired class throughout the stretch (CPCB,
2003).
On land degradation and soil quality, different kinds of
soils are identified in Arunachal Pradesh due to the wide
variability in climate, physiography, geology and
vegetation that influence the ecosystem. The State
Landuse Board (SLB) has identified the soils and mapped,
described, analysed, characterised and classified them
under the following ecozones:
1. Soils of warm per-humid, Eastern Himalaya
Ecosystem.
2. Soils of warm per-humid, Siwalik Hill Ecosystem.
3. Soils of warm per-humid, Purvanchal Ecosystem.
4. Soils of hot humid, plain ecosystems (Brahmaputra
Valley).
Excessive precipitation, steep hill slopes and
tectonically disturbed rocks in conjunction with human
interference on vegetative cover result in severe landslides
and floods in all these ecozones. The rapid runoff on the
steep slopes causes heavy soil losses as well as siltation in
the river bed which ultimately leads to flood hazards in
the plains of Arunachal Pradesh and Assam. These factors
affect the soils in terms of low cation exchange capacity
(C.E.C.), poor base status, graveliness, etc. Shifting
cultivation, one of the most common cultivating practices
of Siwalik hill ecosystem, also contributes to the process
of soil erosion. It is estimated that about 669.35 million
tonnes of soil is eroded annually in the State with an
average rate of 91 tonnes/ha/year. The river catchments
located in the Siwaliks and foothills of the denudational
hills including the interfluves of the main rivers
5. The National Physical Laboratory (NPL), New Delhi conducted some air quality monitoring only for seven weeks (January-March), 2005 in Itanagar. Theparameters measured were SPM, RSPM, Ozone, SO2, NOx, CO and CH4. The data is not published yet.
6. Recently, an attempt has been made towards bio-monitoring of some important perennial rivers of Arunachal Pradesh, however, the study report was notavailable at the time of preparation of this document.

231Chapter 15 •
ENVIRONMENT
experience a moderate to severe rate of soil erosion (50-
150 tonnes/ha/year). These categories cover more than 60
per cent of the area of the State (Table 15.3). A few river
catchments in this belt are characterised by extremely
high rate of soil erosion (more than 200 tonnes/ha/year).
The severity of erosion and very high rate of soil loss in
these areas is due to the high intensity of rainfall and
deep soils on the steep slopes with their loamy and sandy
texture. The western and north western parts of the State,
especially the upper catchment areas of the main river
basins where the intensity and amount of rainfall is low
and climatic conditions are dry and cold, the rate of soil
loss is estimated as slight to moderate (10-100 tonnes/
ha/year).
TABLE 15.3
Number of River Basins and Area underDifferent Soil Loss Categories
Sl. Soil Loss (Soil Loss in No. of Area ExtentNo. Categories t/ha/yr) Catchment
Total (in %sq.km)
1 Extremely Severe (>150) 6 5744.1 6.75
2 Severe (150-100) 11 17095.6 20.09
3 Moderate (100-50) 16 34155.9 40.14
4 Sight (50>) 13 28094.1 33.02
Total 46 85089.7* 100.00
Note: The figures are inclusive of areas from outside the State because theboundaries of river-basins do not exactly match the State boundary inits southern border.
Source: Singh S. (1999).
Initiatives to Address Environmental Concerns
The Central and state governments have formulated
and executed a number of legislations, policies and
programmes for protecting the environment. Some of the
major Central government initiatives which are applicable
to all states are summarised in Box 15.1.
The state government has also taken measures to
protect the environment and conserve natural resources,
especially with respect to management of soils. Since the
topography of the state provides ideal conditions for
development of hydropower projects, the government is
taking several initiatives to tap this relatively clean form
of energy for self-consumption and export to other parts
of the country.
The State Pollution Control Board has been set-up
recently to monitor environmental quality and take steps
for environmental protection. While it has developed
several proposals for monitoring and management of air
and water quality and waste, it is currently constrained by
the limited availability of financial and technical resources
and adequate manpower. The Department of Urban
Development is the nodal agency in the management of
waste. It has a programme for garbage clearing in all
urban and selected habitations of rural areas. However,
effective waste management is constrained by limited
resources.7
The state government has taken several initiatives
through policies and programmes for the management of
BOX 15.1
Major Central Government Acts and InitiativesRelevant to Arunachal Pradesh
Vehicular emission norms
As per the Auto fuel policy, 2003 the applicable emission
norms for all new vehicles in Arunachal Pradesh should
be Bharat Stage II, implemented from April 1, 2005.
These emissions norms will have to be upgraded to Euro
III equivalent from April 1, 2010 for all vehicles except
2 and 3 wheelers and to Bharat stage III for 2 and 3
wheelers from April 1, 2008.
National ambient air quality standards
Ambient air quality standards (both short-term, i.e., 24
hourly and long-term, i.e., annual) have been laid down
for industrial, residential/rural/other and sensitive areas
with respect to pollutants such as SO2, NOX, SPM,
RSPM, Pb, Nh3 and CO.
Municipal solid waste (Management and Handling)
Rules, 2000
For management of solid waste, the Government of India
has notified the Municipal solid waste (Management and
Handling) Rules, 2000. These rules cover aspects such as
responsibility of municipal authority, State Government,
CPCB and SPCB/PCCs and management of municipal
solid wastes; specifications for landfill sites; standards for
composting, treated leachate and incineration.
Biomedical Waste (Management
and Handling) Rules, 1998
The Biomedical Waste (Management & Handling) Rules,
1998 have been notified for the management and safe
disposal of biomedical wastes in India. These Rules
specify the categories of wastes along with specifications
such as treatment and disposal options, colour coding,
labelling, and type of container. In 2003, CPCB published
guidelines for biomedical waste management that include
guidelines for common biomedical waste treatment
facility (CBWTF), and design and construction of
biomedical waste incinerators.
7. Recently, the Department has submitted a project proposal for a municipal solid and hazardous waste disposal facility in Itanagar to the Central PollutionControl Board, Ministry of Environment and Forests for necessary sanction and release of funds.
ARUNACHAL PRADESH DEVELOPMENT REPORT232
land. Programmes relating to control of soil erosion, water
conservation and irrigation in the State were initiated in the
Fourth Five Year Plan. As part of rural development works
programme, the problems of soil erosion and water
conservation have been incorporated in initiatives on
watershed management and protection/treatment of land
for soil conservation. Large-scale afforestation programmes
have been taken up and carried out through social forestry
programmes, reserved plantation of trees and so on.
Almost 2664 ha of land were brought under artificial
plantation and 350 ha through afforestation. Since 1986,
social forestry initiatives also incorporated soil and water
conservation, maintenance of local ecosystems through
strip plantation along the slopes, mass plantation in jhum
lands, etc. Box 15.2 provides the details of a recent
centrally sponsored scheme towards soil conservation.
BOX 15.2
Soil Conservation for Enhancing Productivity ofDegraded Land in the Catchment of a River
Valley Project and Flood Prone River
This project is a centrally sponsored scheme under macro
management of agriculture, sanctioned by the
government of Arunachal Pradesh in March 2005. Soil
conservation measures are being taken up on a watershed
basis and include:
• Drainage line treatment of upper, middle and lower
reaches.
• Contour staggered trenching.
• Afforestation.
• Silvi-pastoral development.
• Horticulture.
• Construction of water harvesting structure,
percolation tank, and silt detention tank.
• Establishment of hydrology and sediment
monitoring station.
The Department of Agriculture is the nodal department
of macro management, while the Rural Works
Department is the executing agency. The projects are
spread over three locations—Khondakhowa, No-bonga
and Tareso. Already, 30 hectares of land has been
brought under horticulture and 24 drainage lines have
been established.Source: Personal communication, Department of Soil Conservation,
Arunachal Pradesh.
The New Agricultural Policy gives special emphasis to
shifting cultivation, ensuring better land management,
introducing improved cultivation in sloppy land through
agro-forestry, horticulture and encouraging other
household activities. The programme is to be designed in
such a way that there would be simultaneous thrust in
weaning the Jhum farmers towards better cultivation.8
Considering that floods are a major problem in the
region, the Ministry of Water Resources, Government of
India is seeking to address related issues in the
Brahmaputra through the NIH (National Institute of
Hydrology) Centre for Flood Management Studies for the
Brahmaputra Basin. A Regional Centre at Guwahati has
been set-up to address the hydrological problems of North
East Region. As per the five-year action plan, the Regional
Centre is focusing on the following areas:
• Structural and non-structural measures for flood
management.
• Integrated watershed management for flood control.
• Hydrological data base management system.
• Drainage congestion and erosion problems.
• Water quality problems.
• Socio-economic aspects of flood disaster.
• Technology transfer.
Concerns and Recommendations
Although environmental pollution may not be
perceived as a major issue in the State at present, a
proactive approach towards integrating environmental
management while planning for the development of the
State is required. Some aspects, which need consideration,
are noted below.
Institutional Measures
It is noteworthy that the State Pollution Control Board
has been recently set-up in the State. However, it is
reportedly constrained by the scarcity of manpower and
resources, which in turn has adversely affected its
environmental monitoring and management activities.
Similarly, while emission norms, fuel quality and vehicle
inspection practices as laid down by the Auto Fuel Policy
are applicable to the State, enforcement by the relevant
transport department is inadequate. The technical and
financial requirements of the concerned departments need
to be assessed and addressed to enable their efficient
functioning including the enforcement of Central and state
level legislation. Secondly, environmental concerns such
as land and soil conservation need to be addressed in an
integrated manner across all relevant government
agencies.
8. http://arunachalpradesh.nic.in/nap.htm, Accessed on 15 February 2006.

233Chapter 15 •
ENVIRONMENT
Policy Initiatives
Several policies are required to address environmental
concerns as the State charts out its strategy for economic
development. The New Industrial Policy of the State
should, for instance, also emphasise the need for the
integration of environmental management through
environmental impact assessments, emission standards for
industries and environmental audits etc., which are
prescribed by CPCB and need to be followed in all states.
Likewise, appropriate policies are needed in the transport
sector to ensure phase out of old polluting vehicles and
adequate inspection and maintenance of vehicles on road.
Policies are needed to ensure the management of
municipal, industrial and health care waste through
appropriate segregation, collection, treatment and
recycling. Where possible, the collection and conversion of
organic waste into useful compost on a small scale could
be undertaken with the involvement of private
entrepreneurs and NGOs.
Inadequate access to basic needs such as clean cooking
fuels, water and sanitation pose a threat to the
environment and health of people and must be addressed
on a priority basis.
Infrastructure Development
Development of infrastructure is a prerequisite for
effective implementation of policies. For instance, there is
a need to construct treatment and disposal facilities for
municipal solid waste, biomedical waste and industrial
waste. Sanitation infrastructure needs to be augmented as
a priority. Environment friendly concepts such as eco
industrial parks should be implemented while planning
the industrial development of the State.
Data Inventory
An updated data inventory of environmental status is a
useful guide to policy making and improving awareness
on environmental issues. It is essential that a regular data
inventory is maintained for a range of environmental
parameters and relevant indicators of environment
through regular monitoring. For instance, a waste
inventory needs to be developed on the sources, quantity,
quality, treatment and disposal options.

Introduction
Border trade can be defined as the transactions of local
products, at certain convenient points, across the border
by the inhabitants living near the international boundary.
Such trade is usually based on barter system having no
cash and credit transactions. It flourishes because of lack
of infrastructure, both internal and cross-border. As it is
informal, no national and international laws are valid in
such trade and governments do not keep any formal
records on it. It exists irrespective of political and
diplomatic relations between the governments of the
bordering countries because it is a traditional way of life
of the border people.
When internal and cross-border infrastructure
develops, border trade becomes formal trade with all
modern characteristics of trade between bordering
countries. Many of the formal trade points of today were
earlier informal border trade points (Ghanashyam, 2001).
The present chapter deals mainly with the formal version
of border trade and partly with its informal version.
Experience has shown that every country enjoys higher
real income by specialising in production according to its
comparative advantage and trading with others. Trade
optimises production on the production possibility
schedule, it results in a more efficient allocation of
productive resources, it gives vent to surpluses, widens
the market, induces innovations, increases savings and
capital accumulation, instills new wants and taste, and
encourages technology transfer, skills and entrepreneurship
development. Thus, trade and investment become an
engine of growth in developing economies. These
advantages of trade have become much more significant
and relevant in the context of ongoing globalisation
process. This chapter makes an attempt to identify the
ARUN
ACH
AL PR
ADESH
Chapter 16
Border Trade and its Prospects
prospects of both border and formal trade of Arunachal
Pradesh. The specific objectives of the paper are to
provide answers to the following questions:
(i) How can the instrument of border trade (formal)
contribute in strengthening the State’s development
process?
(ii) How can the State emerge as a gateway for
entrepreneurs from the rest of India to increase trade
with the eastern border nations?
The rationales of border trade for land-locked Aruachal
Pradesh sharing border with China, Myanmar and Bhutan
are many, such as:
• To speed-up the process of development and
structural transformation by way of opening new
market opportunities for local producers and service
providers resulting in income and employment
generations;
• To provide avenues for division of labour and
strengthening linkages with the existing production
bases in the State;
• To infuse new technological inputs for price and non-
price competitiveness;
• Development of distribution networks with or
without linkages with the rest of the country;
• To reduce transportation cost because of geographical
proximity;
• To overcome disadvantages associated with
landlocked setting of the State;
• To join hands with other North-eastern states
including mainland India and extend the trade with
Bangladesh and Nepal.

ARUNACHAL PRADESH DEVELOPMENT REPORT236
Recent Developments in Regional Cooperation(both Bilateral and Multilateral) andProspects of Border Trade forNorth-Eastern States of India
In the context of globalisation and liberalisation and
the emerging ‘Look East Policy’ of the Government of
India, the issue of border trade across the eastern borders
of India has attracted the attention of the governments,
planners, development agencies and the academics in
India. Considering the geographical proximity and huge
potentialities, the existing value and volume of bilateral
trade between the neighbouring countries like China,
Myanmar and Bangladesh on the one hand and India on
the other, appear to be too small. It is because trading
between these countries has been quite difficult due to
transport bottlenecks and the protectionist policy followed
in the pre-globalisation period. However, in recent years
all the governments have shown keen interest in removing
these bottlenecks by establishing regional cooperation,
both at bilateral and multilateral levels which has raised
the hope of opening border trade among China, Myanmar,
Bhutan, Bangladesh and India in near future.
At multilateral level, such regional cooperation has
been manifested in the form of initiatives and
agreements for economic cooperation and trade, such as,
the Mekong-Ganga Cooperation (MGC) consisting of
India, Myanmar, Thailand, Cambodia, Laos and Vietnam;
the Bay of Bengal Initiative for Multi-Sectoral Technical
and Economic Cooperation (BIMSTEC), a sub-regional
group consisting of countries around the Bay of Bengal;
the South Asian Free Trade Agreement (SAFTA); the
India-ASEAN Vision: 2020—a roadmap of cooperation;
the South Asian Association on Regional Cooperation
(SAARC); the Bangladesh-China-India-Myanmar (BCIM)
Forum, etc., which will help in strengthening the growing
trade relationship between India and the neighbouring
countries. Several other initiatives by many South-east
Asian countries have also brightened the prospect of
growth of sub-regional cooperation among them. Some of
such major initiatives are, the East Asian Growth Area
(EAGA) comprising the Philippines, Malaysia, Indonesia
and Brunei, the Singapore-Johor (Malaysia)-Riau
(Indonesia)-Growth Triangle (SIJORI), etc. Success of
these initiatives and agreements would not only increase
the scope of trade but would also extend Arunachal
Pradesh’s reach, deep into South-east Asia and the
Mekong basin region.
At bilateral level India has already signed several
agreements for economic cooperation and trade with the
countries of its eastern border, and many more such
agreements are in the pipeline. A few major such
agreements signed in recent years are stated below.
Indo-China Cooperation and Trade
The rapid economic growth of China in recent years
has opened the possibilities of expanding trade
relationship with India. China’s huge population and
growing per capita income and rapid infrastructural
development have created opportunities for exporting
several new products from India The joint declaration
between the Prime Ministers of India and China in June
2003, signing of a memorandum on expanding border
trade through Nathula Pass on the Indo-China boundary,
China recognising Sikkim as a part of India and India
recognising Tibet as a part of China, the bilateral military
exchanges for mutual understanding including the joint
naval exercise off the coast of Shanghai in the east China
Sea in 2003, the formation of a joint study group to
examine the potential complementarities and also to draw
up a programme for development of India-China Trade
and Economic Cooperation for 2003-2008, etc., have
opened up new vistas for border trade between India and
China.
China is emerging as a major trading partner of India.
The major items of China’s imports from India in 2002-03
are semi-finished iron and steel (24.78 per cent of total
imports of China from India), iron ore (20.41 per cent),
plastic and linoleum products (8.44 per cent), other ores
and minerals (6.31 per cent), and marine products (5.35
per cent). Similarly, major items of China’s exports to
India in 2002-03 are electrical goods (27.82 per cent of
total exports of China to India), organic chemicals (10.95
per cent), coal coke and briquettes (6.03 per cent), and
medicinal and pharmaceutical products (5.18 per cent)
(CMIE, 2003).
Indo-Myanmar Cooperation and Trade
Myanmar’s entry into Association of South East Asian
Nations (ASEAN ) Block, its signing of MoU with India in
1994, recognising certain border trading points viz., Tamu
(Myanmar)-Moreh (Manipur, India) and Rhi (Myanmar)-
Changphai (Mizoram, India), the opening of 160 km
Tamu-Kalewakalemy Road in February 2001, the opening
of the Myanmar-India Friendship Centre at Yangoon and
signing of a bilateral trade agreement between India and
Myanmar in October 2003. The trade agreements between
India, China and ASEAN Block in October 2003, are likely
to play a major role in improving regional economic
cooperation between these countries.

237Chapter 16 • BORDER TRADE AND ITS PROSPECTS
The signing of an MoU between Myanmar and India,
on 25th October 2004 at New Delhi, for cooperation on
economic and security issues, is a landmark in the process
of their bilateral cooperation. In addition to the issues like
terrorism, drug-trafficking, smuggling, money laundering,
international economic crimes, cyber crimes, etc., the
MoU covers several economic issues as well. India has
agreed to upgrade the Yangoon-Mandalay rail link, help in
laying fibre-optic network in Myanmar and conduct a
feasibility study of deep water port and cooperate in
energy sector. Both the governments have agreed to
upgrade Mizoram-Chin State Road and Kaladan Multi-
Model Transportation System. The India-Myanmar Joint
Task Force constituted by the Confederation of Indian
Industries (CII) and the United Myanmar Federation of
Chamber of Commerce and Industry has submitted its
reports to both the governments on 25th October 2004.
The Report predicted that the value of the bilateral trade
between India and Myanmar would be worth $1 billion by
2006, if the suggestions are implemented by both the
governments.
In 2002-03, the major items of Myanmar’s exports to
India were pulses (59.95 per cent of the total Myanmar’s
exports to India), wood and wood products (27.39 per
cent). Similarly, the major items of Myanmar’s imports
from India are machinery and apparatus, dairy products,
textile yarns, pharmaceutical products, rubber
manufactures, base metals etc. The total value of
Myanmar’s formal imports from India was about $75
million worth in 2002-03. However, informal segment of
trade between Myanmar and India is several times higher
than the formal segment of the trade. A wide range of
goods produced in India are exported to Myanmar
through informal channels. These include bicycle, motor
vehicle accessories, tyres, chemical and chemical
compounds, drugs and pharmaceuticals, cotton yarn and
textiles, branded fruits, edible oils, electrical products,
construction materials, paints, sewing machines,
alcholohic beverages, cosmetics, etc. Similarly, several
third country products are exported by Myanmar to India
through informal channels which include electronic goods,
consumer durables, telephone instruments, blankets, high
quality textile products, tobacco products, toiletries, etc.
In addition, Myanmar also exports through informal
channels certain local produce such as agricultural,
marine, forest products, betel nuts, pulses, teak,
groundnuts, etc.
Indo-Bhutan Cooperation and Trade
India’s North-eastern region shares a common border
of about 650 km with Bhutan out of which 450 km is
with Assam, 140 km with Arunachal Pradesh, and 60 km
with Sikkim. Bhutan is one of the least developed nations
of the world. There is completely free trade between India
and Bhutan, and the official Indo-Bhutan trade has been
governed by the Indian Trade and Commerce Agreement.
There are as many as 12 exit and entry points in India for
trade with Bhutan. In addition to these official trading
points, there are several other trading points on the Indo-
Bhutan borders through which unofficial trade takes place.
It is estimated that the value of the unofficial trade
between India and Bhutan was about $33 million in 1993-
1994, the official component of the same is about one-
third of the unofficial trade (Baruah, 2000). India is
having a trade surplus with Bhutan on both official and
unofficial accounts. The major items of imports of Bhutan
from India in 1999 were machinery and mechanical
equipments (18.7 per cent of total imports from India),
mineral products (14.4 per cent), base metal and base
metal products (13.1 per cent), cereals, vegetables, fruits,
etc. (11.9 per cent), and transport equipments (9.9 per
cent). Similarly, the major items of exports of Bhutan to
India in the same year were electricity (43.0 per cent of
total exports of Bhutan to India), mineral products (14.8
per cent), products of chemical industries (12.1 per cent),
and base metal and base metal products (11.4 per cent)
(Royal Government of Bhutan, 2001-02).
In the context of the above developments, the question
of opening of borders of Arunachal Pradesh for trade with
its neighbouring countries (Myanmar, China and Bhutan)
has attained a special significance for its economy in
recent years, as it can convert the present locational
disadvantages of the State into economic advantages in
near future.
Indo-Bangladesh Cooperation and Trade
Bangladesh has a long border of 4,100 km with the
North-eastern region of India. Since the creation of
Bangladesh, India has been exporting several items
through its border points. The Border Trade Agreement
between India and Bangladesh was first signed in 1972 to
meet the day to day requirements of the people. Trade
between India and Bangladesh takes place through the
North-eastern border points like Dawki and Bholaganj (in
Meghalaya), Karimganj, Steamerghat and Suterkandi (in
Assam), Agartala, Kailash Sahar, Bilonia and Sonamua (in
Tripura), etc. The Indo-Bangladesh Trade Agreement
(1980), the Indo-Bangla Joint Economic Commission, the
Indo-Bangla Free Trade Agreement and other trade
agreements between them can go a long way in
accelerating economic growth through trade in both the
countries.
ARUNACHAL PRADESH DEVELOPMENT REPORT238
The major items of imports of Bangladesh from India
in 2002-03 through official channels were cotton yarn
(13.65 per cent of total Bangladesh imports from India),
non-basmati rice (9.85 per cent), and wheat (8.79 per
cent). Other minor imports of Bangladesh from India are
sugar, primary and semi-finished iron and steel, transport
equipments, etc. Among the major informal imports of
Bangladesh from India through the North-eastern trade
routes are orange, pineapples, jackfruits, potatoes, ginger,
spices, rice, betel, petroleum products, bicycles, tyres,
papers, milk products, cattle, pulses, timber, etc. (CMIE,
2003).
The formal exports of Bangladesh to India are too
small resulting into a huge trade deficit with India to the
extent of $1 billion. However, the informal segment of
exports of Bangladesh to India is quite significant.
Through the border points articles like electronic goods,
coconut oil, synthetic fibre, high quality clothes, etc.,
which are third country products and jute, poultry
products, etc., which are Bangladesh products, are
smuggled into India.
Border Trade of Arunachal Pradesh throughVarious Trade Routes in Retrospect
The entire North-east India had a long tradition of
trade relations with eastern Himalayan sub-region
comprising Bhutan, Tibet, China and Myanmar (Burma).
It is more so in case of Arunachal Pradesh, because most
of the tribes of Arunachal Pradesh migrated from these
countries. Therefore, they had maintained ethnic, cultural,
commercial and even matrimonial relationships with their
neighbouring territories through ages. The tribes of
Arunachal Pradesh living along the international border
had trade connections with China, Tibet, Bhutan and
Myanmar through several trade routes (Pamberton, 1835).
While the tribes living along the southern border of
Arunachal Pradesh had trade relations with Assam, the
eastern part of Arunachal Pradesh had trading relations
with Burma, and the western and the northern part of
Arunachal Pradesh had well developed trade links with
the Tibetans. The East India Company inspired the tribes
of Arunachal Pradesh to maintain these commercial
relations with the neighbouring countries with a view to
exporting British goods to China, Bhutan and Tibet
through Arunachal Pradesh but without much success due
to hostile attitude of the Tibetan and Burmese rulers
towards the British. After the annexation of Burma
(Myanmar), the British found it more convenient to
export their products to China through Burma. Therefore,
the British lost interest in Arunachal Pradesh as a trading
outlet.
History has recorded a number of trade routes between
Arunachal Pradesh and its neighbouring countries. As
many as 27 trade routes (passes) including the famous
Tawang route which passed via Tawang and Tsona Dzong
have been identified between Arunachal Pradesh and Tibet
(Choudhuri, 1971-72 and Phukan, 2002). Local goods of
Tibet and Bhutan were brought through these trade
routes to be exchanged for local goods of Arunachal and
Assam at different trade fairs (Mela) held annually
coinciding with certain religious festivals in the foothills.
The Bhutanese and Tibetans came down to the foothills
in Assam during winter loading their ponies, mules with
merchandise like rock-salt, gold-dust, musk, woolen clothes
and blankets, yak-tails (Chowar), ponies, dogs, Chinese silk
including Gomcheng, chillies, oranges and local fruits,
asafetida (Hing), herbal medicines, cinnamon, jabrang,
borax, Tibetan sword, etc., to barter for clothes, raw silk,
rice, dried fish, salt, perfumes, incenses, etc. Such annual
fairs were held at Udalguri, Daimara, Dewangiri, Sadiya and
other places in the bordering areas of Assam. As a means
of transport for carrying the merchandise both ways mules
and ponies were used in addition to carrying on their back.
Several tribal communities like Monpas, Akas,
Sherdukpans, Mijis, Nyishis, Sulungs, Banghis, Apatanis,
etc., acted as intermediaries between the groups of traders
(Goswami, 2002).
On the eastern border of Arunachal Pradesh four trade
routes have been identified including the famous Pangsu
Pass between Arunachal Pradesh and Burma (Phukan,
2002). A large number of hill tribes from the present
Tirap district of Arunachal Pradesh used to carry on trade
in tea, blankets, matches, etc., at various places in Burma
including in Bhamo, the most important trading centre on
the bank of river Irrawaddy in Burma. The major articles
from Burma side were amber (Jangphi), gum, nora cloth,
silver, etc. (Phukan, 2002). Quoting from Wilcox’s,
Memories of a Survey of Assam, Elwin wrote that every
Mishmi was a petty merchant (Elwin, 1959).
From the later part of the nineteenth century, imports
coming to Arunachal Pradesh and Assam through the
northern and eastern border points had to face steep
competition from those coming from England and the
mainland British India. Moreover, Western Indian
businessmen who came to do business in Assam were
granted Inner Line Permit (introduced in 1873, isolating
the people of hill-tracts from the rest of British Subjects)
to establish centres beyond the line. Indian and British
industrial goods were sold to the hill people who sold
their handlooms, handicrafts, cash-crops and forest
products to the merchants.

239Chapter 16 • BORDER TRADE AND ITS PROSPECTS
After Independence, the integration of Arunachal
Pradesh’s economy with the national market network
eroded the traditional base of cross border trade of the
State. In addition to this integration, two other factors
were also responsible for eliminating the traditional base
of cross border trade of the Arunachalees. One of these
factors is the decline in demand for Arunachal Pradesh’s
items of trade with neighbouring countries due to
emergence of alternative products. For example, the
availability of chemical dyes competed out the herbal dyes
that had been the principal export item of Arunachal
Pradesh’s trade with Tibet. Similarly, chemical rubber
competed out Arunachal Pradesh’s natural rubber in the
Burmese market. The Arunachalee’s demand for imports
from Burma and Tibet had also decreased owing to large
scale imports of Indian products through Assam into
Arunachal Pradesh following the improvement in
transport and communication system (Das, 2002). These
developments led to the breakdown of the Trans-
Himalayan trade of Arunachal Pradesh. Gradually the
traditional trade routes between Tibet and India being
untrodden for a long period have almost disappeared and
the entire 1030 km border is now almost inaccessible. In
the absence of an export market and the presence of a
small internal market, the natural resources of Arunachal
Pradesh could not be exploited commercially except in the
case of timber, coal and oil.
Therefore, the development strategy for Arunachal
Pradesh should identify certain locally available resources
which, when processed, could attract both national and
international markets.
The Present Status ofArunachal Pradesh’s Economy
Territorially Arunachal Pradesh is the largest unit of
the North-eastern region of India with 83,743 sq km of
area. Geographically, it is situated in a disadvantageous
position as it is not only a land-locked State, but is also
surrounded on its three sides by foreign countries with
total international boundary of 1628 km—1030 km in the
North with China, 157 km in the West with Bhutan, and
441 km in the East with Myanmar. The states of Assam
and Nagaland lie in its South. Like the other states of
North-east, it is commercially integrated with the
mainstream economy of the country.
In a study based on composite index of 20 major
development parameters it was found that Arunachal
Pradesh occupies the last position (under very low
category) among the states of India (Goswami and Gogoi,
2001). In terms of Human Development Index (HDI)
also, the position of Arunachal Praesh has been at the
lower level. The State’s HDI is only 0.501, a value which
stands significantly below the national average of 0.577.
Out of the 16 major states of the country whose HDI are
available (HDR Report, Arunachal Pradesh, 2005),
Arunachal Pradesh’s position was 14th only above Bihar
(0.449) and Uttar Pradesh (0.489).
To speed up the process of development in the State,
the present ‘inward looking’ paradigms of developmental
policy is to be supplemented by an ‘outward looking’
approach based on market and trade. The changing
scenario in international trade under WTO regime, India’s
emphasis on signing trade agreements with several foreign
countries including the South and South-east Asian
countries (a few of which share common border with
Arunachal Pradesh) and the ‘Look East’ policy of India can
be of great help for Arunachal Pradesh in its efforts to
introduce this ‘outward looking’ development strategy.
‘The global pattern of agrarian transformation initiated by
GATT/WTO suggests that the major portion of third
world peasantries have no future simply as subsistence
cultivators’ (Brass, 1995).
Prospects of Trade with NeighbouringCountries—Exploring New Frontiers
The locational advantage of Arunachal Pradesh having
common border with three foreign countries, viz., China,
Bhutan and Myanmar can be of great help in following its
trade-based and market-led ‘outward looking’
development strategy. China with its 9 to 10 per cent
annual growth rate can alone provide good markets for
several potential products of Arunachal Pradesh. In the
past 25 years of expansion, China has lifted an estimated
300 million people out of poverty (less than 668 Yuan or
about $60 a year). It is predicted by the Chinese Academy
of Sciences that by 2050 nobody will remain below
poverty line in China. The middle class will enjoy all
affluent lifestyle. Arunachal Pradesh with a huge resource
base can be one of the important providers of many of the
items to be demanded by the emerging affluent middle
class of China. Moreover, the rapid prosperity in the
ASEAN region is also going to offer prospects for border
trade of Arunachal Pradesh.
Arunachal Pradesh has potentials for producing some
of the goods which currently India is exporting to various
countries including those bordering Arunachal Pradesh.
Table 16.1 shows the value in million dollars of India’s
export goods which have potential in Arunachal Pradesh.
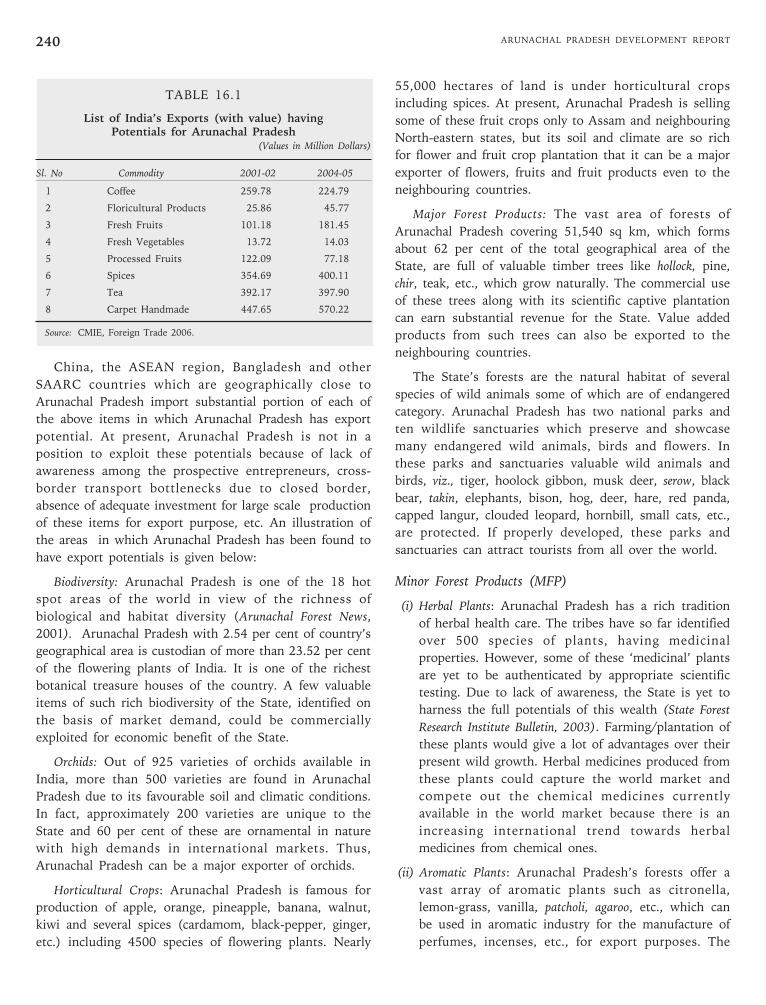
ARUNACHAL PRADESH DEVELOPMENT REPORT240
TABLE 16.1
List of India’s Exports (with value) havingPotentials for Arunachal Pradesh
(Values in Million Dollars)
Sl. No Commodity 2001-02 2004-05
1 Coffee 259.78 224.79
2 Floricultural Products 25.86 45.77
3 Fresh Fruits 101.18 181.45
4 Fresh Vegetables 13.72 14.03
5 Processed Fruits 122.09 77.18
6 Spices 354.69 400.11
7 Tea 392.17 397.90
8 Carpet Handmade 447.65 570.22
Source: CMIE, Foreign Trade 2006.
China, the ASEAN region, Bangladesh and other
SAARC countries which are geographically close to
Arunachal Pradesh import substantial portion of each of
the above items in which Arunachal Pradesh has export
potential. At present, Arunachal Pradesh is not in a
position to exploit these potentials because of lack of
awareness among the prospective entrepreneurs, cross-
border transport bottlenecks due to closed border,
absence of adequate investment for large scale production
of these items for export purpose, etc. An illustration of
the areas in which Arunachal Pradesh has been found to
have export potentials is given below:
Biodiversity: Arunachal Pradesh is one of the 18 hot
spot areas of the world in view of the richness of
biological and habitat diversity (Arunachal Forest News,
2001). Arunachal Pradesh with 2.54 per cent of country’s
geographical area is custodian of more than 23.52 per cent
of the flowering plants of India. It is one of the richest
botanical treasure houses of the country. A few valuable
items of such rich biodiversity of the State, identified on
the basis of market demand, could be commercially
exploited for economic benefit of the State.
Orchids: Out of 925 varieties of orchids available in
India, more than 500 varieties are found in Arunachal
Pradesh due to its favourable soil and climatic conditions.
In fact, approximately 200 varieties are unique to the
State and 60 per cent of these are ornamental in nature
with high demands in international markets. Thus,
Arunachal Pradesh can be a major exporter of orchids.
Horticultural Crops: Arunachal Pradesh is famous for
production of apple, orange, pineapple, banana, walnut,
kiwi and several spices (cardamom, black-pepper, ginger,
etc.) including 4500 species of flowering plants. Nearly
55,000 hectares of land is under horticultural crops
including spices. At present, Arunachal Pradesh is selling
some of these fruit crops only to Assam and neighbouring
North-eastern states, but its soil and climate are so rich
for flower and fruit crop plantation that it can be a major
exporter of flowers, fruits and fruit products even to the
neighbouring countries.
Major Forest Products: The vast area of forests of
Arunachal Pradesh covering 51,540 sq km, which forms
about 62 per cent of the total geographical area of the
State, are full of valuable timber trees like hollock, pine,
chir, teak, etc., which grow naturally. The commercial use
of these trees along with its scientific captive plantation
can earn substantial revenue for the State. Value added
products from such trees can also be exported to the
neighbouring countries.
The State’s forests are the natural habitat of several
species of wild animals some of which are of endangered
category. Arunachal Pradesh has two national parks and
ten wildlife sanctuaries which preserve and showcase
many endangered wild animals, birds and flowers. In
these parks and sanctuaries valuable wild animals and
birds, viz., tiger, hoolock gibbon, musk deer, serow, black
bear, takin, elephants, bison, hog, deer, hare, red panda,
capped langur, clouded leopard, hornbill, small cats, etc.,
are protected. If properly developed, these parks and
sanctuaries can attract tourists from all over the world.
Minor Forest Products (MFP)
(i) Herbal Plants: Arunachal Pradesh has a rich tradition
of herbal health care. The tribes have so far identified
over 500 species of plants, having medicinal
properties. However, some of these ‘medicinal’ plants
are yet to be authenticated by appropriate scientific
testing. Due to lack of awareness, the State is yet to
harness the full potentials of this wealth (State Forest
Research Institute Bulletin, 2003). Farming/plantation of
these plants would give a lot of advantages over their
present wild growth. Herbal medicines produced from
these plants could capture the world market and
compete out the chemical medicines currently
available in the world market because there is an
increasing international trend towards herbal
medicines from chemical ones.
(ii) Aromatic Plants: Arunachal Pradesh’s forests offer a
vast array of aromatic plants such as citronella,
lemon-grass, vanilla, patcholi, agaroo, etc., which can
be used in aromatic industry for the manufacture of
perfumes, incenses, etc., for export purposes. The

241Chapter 16 • BORDER TRADE AND ITS PROSPECTS
increasing international demand for natural perfumes
and room fresheners will facilitate the export
promotion of aromatic products from Arunachal
Pradesh.
(iii) Other Minor Forest Products (MFP): In addition to herbal
and aromatic plants Arunachal Pradesh is rich in
several other MFP which include bamboo, cane, reeds,
thatching-grass, sun-grass, rubber, honey, lac, shellac,
tendu leaf, charcoal, pole, etc. Dependence on MFP for
meeting their subsistence consumption and income
needs is commonly found in tribal societies. India’s
MFP exports are presently to the tune of $362 million,
comprising four per cent of the global trade. Emerging
global markets in South Asia and some Western
countries are yet to be tapped for these products.
Economic Mineral Resourcesof Arunachal Pradesh
Although a number of valuable economic minerals
have been recorded from several areas by the Geological
Survey of India (GSI), the mineral resources of Arunachal
Pradesh have not yet been properly assessed. Among the
valuable minerals spotted in Arunachal Pradesh are
petroleum, limestone, marble coal, dolomite, fuller’s earth
and natural gas reserves are worth mentioning. The total
reserves (proved + probable + possible) are coal—90.23
million tonnes, dolomite—58.36 million tonnes, fuller’s
earth—14.01million tonnes, and limestone/marble—
125.47 million tonnes and huge amount of graphite
(Indian Minerals Year Book, 1996). If properly assessed and
explored with required infrastructural development, the
products of some of these minerals can be used for
making several value-added products locally in small and
medium scale industries. Some of the value-added
products can be exported to the neighbouring countries.
Tourism Products
The State’s unique natural beauty, different species of
wildlife, religious places, historical and heritage sites,
diverse attractive tribal cultures, friendly and hospitable
people could make Arunachal Pradesh, the Switzerland of
the East. The sites which can be developed into world
class tourist spots are Tawang for religious, adventure
and eco tourists; Parusuramkunda and Malini Than, for
religious and eco tourists; Namdapha Tiger Project,
Mowling National Park, and ten wildlife sanctuaries of the
State for wildlife tourists; ‘Lake of No Return’ on the
border of Arunachal Pradesh and Myanmar near Phangso
Pass, Bhismark Nagar, Itafort, Second World War
Cemetery at Jairampur, Bomdila (Chinese aggression in
1962) for historical tourists, etc., are worth mentioning.
The multi-coloured seasonal festivals of the major tribes
of Arunachal Pradesh can also attract cultural tourists
from different parts of the world.
In spite of this vast tourism potential, inflow of
tourists in the State is not encouraging mainly due to:
(i) absence of value-added tourism products, (ii) lack of
transport and communication facilities, (iii) poor
infrastructure in and around the tourist spots, (iv) the
inner line permit system to enter Arunachal Pradesh, and
(v) lack of publicity/marketing.
However, to attract both domestic and foreign tourists
in large scale, these bottlenecks are to be removed. For
example, Tawang which is at present attracting a few
religious tourists for its famous Buddhist monastery can
be developed as a world class tourist resort attracting all
classes of tourists including health and adventure tourists.
For adventure sports all modern and state of the art
facilities, including skiing and gliding in Tawang slopes
should be built up. This will encourage adventure tourists
to visit Tawang (Goswami, 2002). The establishment of
an Institute of Indigenous Herbal Medicine and Research,
and modern medicare facilities can attract health-tourists
to these resorts. Another spot for adventure tourism can
be developed in the Lohit and other rivers of Arunachal
Pradesh. The steep gradients in this part of their courses
have made them excellent spots for water sports and
adventure tourism. The virgin environment of Arunachal
Pradesh can attract more tourists than the polluted tourist
spots like Shimla, Darjeeling, etc., for both domestic and
foreign tourists, provided proper development of
infrastructure and other facilities including new tourism
products are created for the tourists. To do so, the
multinational companies dealing in tourism, can be
invited. In a study made in Assam, it was found that
nearly 55 per cent of the foreign tourists visiting Assam
are adventure tourists. In the same study, the foreign
tourists are found to have preference for economy and
semi-deluxe accommodation rather than luxurious
accommodation and more than 60 per cent of them like to
travel by train (Sharma, 2006). Similar studies can also be
done in Arunachal Pradesh to assess the requirements of
tourists visiting the State. “If the vast tourism potential of
the North-East India is fully tapped and developed, within
20 years the region will receive more tourists than
Singapore or Bangkok” (Coopers and Lybrand, 1995).
Tea, Coffee, Rubber and Black Pepper
Tea cultivation in Arunachal Pradesh was started in
1978-79 by the Arunachal Pradesh Forest Corporation.

ARUNACHAL PRADESH DEVELOPMENT REPORT242
Being encouraged by the success of the Corporation, many
big and small private tea gardens have come up in recent
years. Besides tea, the Arunachal Pradesh Forest
Corporation is also growing coffee, rubber, and black
pepper in Tirap, Lohit and Changlang districts with
success. Considering the suitability of soil and climate of
the State, the cultivation of these crops is expected to
increase in near future. In that case these four products
can have an important place in the export items of
Arunachal Pradesh’s border trade with neighbouring
countries.
Hydro-electric Power
Arunachal Pradesh possesses immense potential of
powers, primarily in the form of hydel. But the progress
of this sector has not taken place on a scale proportionate
to resource availability. The total unexploited hydel
potential of the State is estimated to be 49000 MW. The
National Hydro Power Corporation (NHPC) has
undertaken survey and investigation works of Siang and
Subansiri basins for establishing mega hydro power
project with an installed capacity of 20700 MW. When
this project will be completed, Arunachal Pradesh can be a
major exporter of cheap hydel power not only to the
entire North-east, but also to its neighbouring countries
having power deficit like China and Myanmar.
Strategy
In spite of its high potentialities Arunachal Pradesh has
so far failed to derive the benefits as a producer of
exportable surplus. In order to facilitate the conduct of
cross-border trade the State as well as the Centre has to
overcome several impediments.
Physical Infrastructure Development
The border areas of Arunachal Pradesh on all sides,
except the south, lie in inaccessible mountains, dense
forests and turbulent rivers which stand in the way of
smooth conduct of border trade with the neighbouring
countries. Moreover, the internal transport and
communication network in the State is not at all
conducive for speedy growth of the State economy. This
calls for massive infrastructural development by way of
constructing all weather motorable roads including
bridges for uninterrupted movement of men and
materials. In this connection, the following border roads
having significant importance for border trade of
Arunachal Pradesh with China and Myanmar can be
developed.
(i) Tezpur-Bomdila-Towang-Bum La (China)
(ii) Lakhimpur-Daparijo-Nacho (China)
(iii) Jonai-Sadiya-Mekha-Malvinil-Tajobum (China)
(iv) Sadiya-Tezu-Chirangal-Kahao (China)
(v) Tinsukia-Winstong-Mogung (Myanmar)
(vi) Khonsa-Wakha (Myanmar)
(vii) Ledo-Pangsou Pass-Myitkyina-Bhamo-Kunming
(Myanmar and China)
Out of these seven old border trade routes of
Arunachal Pradesh, the most useful and economic route is
the Ledo-Pangsou Pass-Myitkyina-Bhamo-Kunming route,
popularly known as StilWell Road. This road which was
constructed during the Second World War, connects
Arunachal Pradesh not only with Myanmar and China but
also the South-east Asian countries. Out of its total length
of 1700 km between Ledo (Assam) and Kunming (China)
only a stretch of about 160 to 200 km between Ledo and
Myitkyina needs rebuilding. If this part of the road is
reconstructed, then in near future, Arunachal Pradesh, for
that matter the entire nation could have direct access by
road to the South-east Asian region. From the border
point of Arunachal Pradesh in the east, exports of
Arunachal could reach Kunming in South China within
two and a half days, Yangoon in Myanmar within three
days, Bangkok in four days and Singapore in five/six days.
This land route of trade would be shorter and cheaper in
comparison to the existing sea routes. India’s trade would
take a diametrically opposite direction from the West to
the East and with much more gains since the buyers and
sellers of these markets of the East are culturally and
racially more akin to the buyers and sellers of North-east
India (Goswami and Gogoi, 2004). This route will also
encourage the tourists visiting ASEAN region to extend
their tour programmes to Arunachal Pradesh/North-east
India, a few hundred miles away, for visiting the region’s
exotic biodiversity, heritage sites and for enjoying its
adventurous sporting events.
Besides development of road network, there are many
other infrastructures that need development for the
growth of border trade, such as, power, railway, ropeway,
telecommunication, cold-storages, weigh-bridges,
warehousing, customs clearing centres, currency exchange
centres, banking, hotels and restaurants, motels, etc.
(Alam, 2002).
Such developments in infrastructure require a huge
amount of fund. For this purpose, efforts must be made
to attract foreign direct investment (FDI) in certain

243Chapter 16 • BORDER TRADE AND ITS PROSPECTS
specific areas like tourism development, in addition to
approaching the World Bank and the Asian Development
Bank for investment in the development of transport and
communication of the State. To attract such investments,
the State and the Centre may engage well known
international consultancy firm for preparing project
reports.
Development of Social Infrastructure
The removal of bottlenecks in physical infrastructure
alone cannot encourage outward looking policy of
development through border trade in a subsistence tribal
economy. Several institutional arrangements are also
necessary of which four are the most important: (i) The
creation and recognition of well defined private property
rights as the exiting system of social ownership of land
cannot operate successfully in a market-oriented system.
(ii) An effective contract enforcement mechanism, by the
Government is essential as farmers are to be drawn into
contractual relation to ensure the timing homogeneity and
quality required by industrial users. It will lead to flexible
specialisation through employing footloose labourers
(Mishra, 2002). (iii) Development of knowledge industries
based on indigenous resources so that products, process
and patent could be exported. State-of-the-art R&D
Institutions are to be established to initiate research on
the efficacy and effectiveness of the locally available
medicinal and aromatic plants for production of life
saving drugs and perfumes respectively. (iv) In exploring
economic opportunities through external trade, utmost
caution needs to be taken to avoid harmful effects of trade
on the existing agrarian structure and food security
scenario of the State. Creation of a buffer stock of staple
food is necessary as the market-led and export-based
economy may lead to decline of availability of staple food
grains. The surplus crops produced by the big farmers will
be sold in the market and there will be no redistribution
of grain from the surplus to deficit farmers as found in a
peasant tribal society (Patnaik, 1996).
Techno-Economic Survey
A macro level techno-economic survey is necessary
before venturing into any major structural change in the
economy. The potentiality, technical feasibility, economic
viability and sustainability including cost and benefit of
each area of development are to be studied by
professional and competent agencies. Nothing should be
done on the basis of hypotheses.
Conclusion
Since the emergence of globalisation, India’s trade
relations with China, Myanmar and other ASEAN
countries have been growing at rapid strides. The
potentialities of further growth in India’s trade with these
countries are also immense. Arunachal Pradesh, a
resourceful State, can also be a partner of this emerging
trade scenario. The major impediment towards the growth
of border trade with India’s eastern neighbours is the
absence of efficient transport and communication
networks. To achieve benefits from border trade, the
physical linkages among the trading partners in the form
of trans-national highways, railways, waterways and
airways, wherever possible, are essential. A huge amount
of capital expenditure would be necessary to build such
infrastructural facilities in Arunachal Pradesh. It is
possible only through financial assistance from
international financial institutions and the participation of
multinational corporations. It is true that along with
bringing in lot of benefits, the outward looking
development strategy of Arunachal Pradesh, as suggested,
may also import a few vices such as erosion in social bond
in tribal society, emergence of economic inequality in the
initial stage, spread of HIV, drug addiction, women
trafficking, etc. These are the costs of development, one
has to bear with grace. What is necessary is to find out a
trade-off. The economic benefits of the market-oriented,
trade-led, outward looking economic strategy would
definitely outweigh the cost in the form of importation of
vices, imaginary or real.

Introduction
Arunachal Pradesh is well known for its vast forest
resources and rich biodiversity. As per the estimate of
Forest Survey of India, based on satellite imagery, forest
area in this State constitutes around 81.9 per cent of the
total area of the State, which is one of the highest among
the states of North-east India. The dense forest and rich
biodiversity of the State presents huge opportunities and
challenges. The conflict between development process and
protecting the biodiversity of the State is becoming
increasingly more apparent. Arunachal Pradesh has the
unique opportunity to map out a development path that is
sustainable and ecologically sound. In this background,
the promotion of nature-based tourism appears to be one
of the best ways of generating internal revenue,
employment and accelerating development. In addition,
the nature-based eco-tourism can play an important role
in the State’s strategy to conserve the rich forest resources
as well as cultural heritage.
Arunachal Pradesh has an enormous potential for
tourism and the tourists can enjoy its picturesque hills,
dales and seasonal climate, and meet its people with their
beautiful arts, crafts and colourful festivals. There are 11
identified tourist spots in the State (Annexure Table A-
17.1). These can be grouped as:
Heritage Tourism
Tawang, Bhismaknagar and Itanagar are historical and
heritage tourist spots. Tawang has more than 300-year-old
Buddhist monastery, which is one of the oldest
monasteries in Asia. So, Tawang can be developed as a
Buddhist tourist centre, which can attract Buddhist
tourists from Thailand, Japan, Korea, Sri Lanka, etc. The
Itafort of Itanagar, was built in the 14th century A.D. and
ARUN
ACH
AL PR
ADESH
Chapter 17
Tourism
is a historical site as also Bhismaknagar in Dibang Valley
district.
Pilgrimage Tourism
Malinithan and Parasuram Kund are pilgrim centres. In
fact, Malinithan is a unique site developed between the
10th and 12th centuries A.D. It has an ancient temple
housing sculptures of gods and goddesses. Parasuram
Kund is a place where Parasuram is believed to have
washed away his sin of matricide. During Makar Sankranti
thousands of pilgrims from all over the country come here
for a holy dip.
Nature-based Tourism
The rest of the tourist spots like Bomdila, Dirang,
Ziro, Along, etc., can be regarded as mountain resorts
which comprise natural beauty like valleys, snow-clad
mountains, plateaus on top of the hills, green forests, etc.
Cultural Tourism
Arunachal Pradesh is home to 26 major and numerous
minor tribes with rich cultural traditions. The added
attractions are the colourful festivals, which form an
essential aspect of the socio-cultural life of the people of
the State. Thus, Arunachal Pradesh is a wonderful
destination for the cultural tourists.
Adventure Tourism
Arunachal Pradesh has a rich potential to develop
adventure tourism. Tourist services like trekking, river
rafting and angling can be made available of and
developed in most of the tourist sports at the foothill
regions of the State. The interesting trek routes are given
in Annexure Table A-17.2.
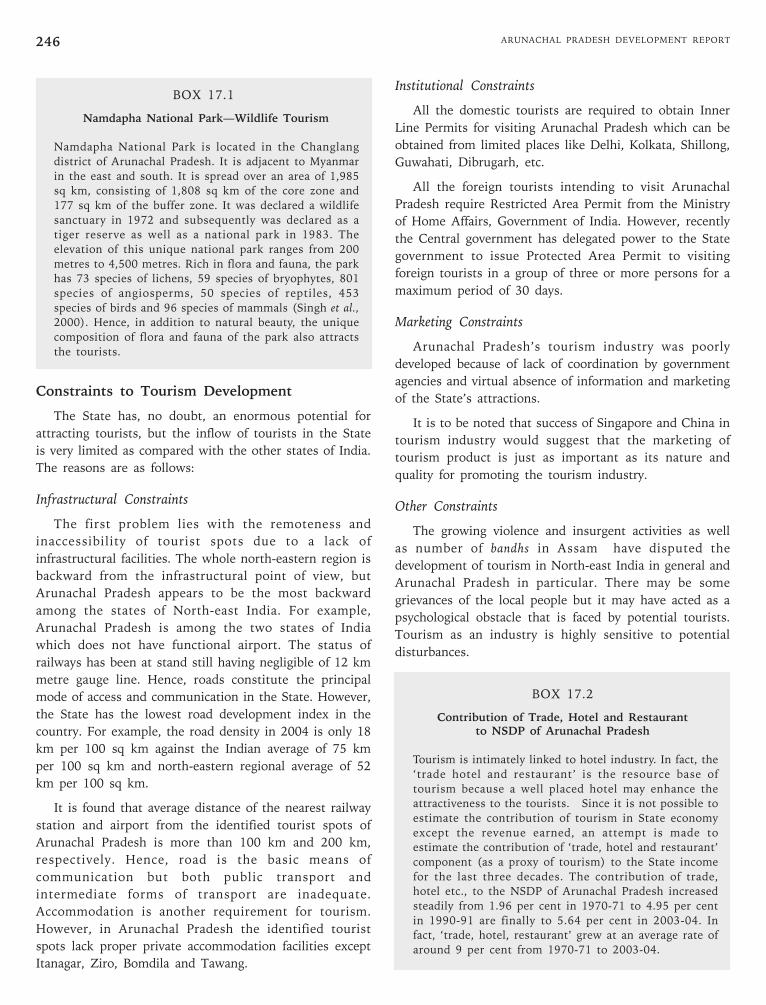
ARUNACHAL PRADESH DEVELOPMENT REPORT246
BOX 17.1
Namdapha National Park—Wildlife Tourism
Namdapha National Park is located in the Changlang
district of Arunachal Pradesh. It is adjacent to Myanmar
in the east and south. It is spread over an area of 1,985
sq km, consisting of 1,808 sq km of the core zone and
177 sq km of the buffer zone. It was declared a wildlife
sanctuary in 1972 and subsequently was declared as a
tiger reserve as well as a national park in 1983. The
elevation of this unique national park ranges from 200
metres to 4,500 metres. Rich in flora and fauna, the park
has 73 species of lichens, 59 species of bryophytes, 801
species of angiosperms, 50 species of reptiles, 453
species of birds and 96 species of mammals (Singh et al.,
2000). Hence, in addition to natural beauty, the unique
composition of flora and fauna of the park also attracts
the tourists.
Constraints to Tourism Development
The State has, no doubt, an enormous potential for
attracting tourists, but the inflow of tourists in the State
is very limited as compared with the other states of India.
The reasons are as follows:
Infrastructural Constraints
The first problem lies with the remoteness and
inaccessibility of tourist spots due to a lack of
infrastructural facilities. The whole north-eastern region is
backward from the infrastructural point of view, but
Arunachal Pradesh appears to be the most backward
among the states of North-east India. For example,
Arunachal Pradesh is among the two states of India
which does not have functional airport. The status of
railways has been at stand still having negligible of 12 km
metre gauge line. Hence, roads constitute the principal
mode of access and communication in the State. However,
the State has the lowest road development index in the
country. For example, the road density in 2004 is only 18
km per 100 sq km against the Indian average of 75 km
per 100 sq km and north-eastern regional average of 52
km per 100 sq km.
It is found that average distance of the nearest railway
station and airport from the identified tourist spots of
Arunachal Pradesh is more than 100 km and 200 km,
respectively. Hence, road is the basic means of
communication but both public transport and
intermediate forms of transport are inadequate.
Accommodation is another requirement for tourism.
However, in Arunachal Pradesh the identified tourist
spots lack proper private accommodation facilities except
Itanagar, Ziro, Bomdila and Tawang.
Institutional Constraints
All the domestic tourists are required to obtain Inner
Line Permits for visiting Arunachal Pradesh which can be
obtained from limited places like Delhi, Kolkata, Shillong,
Guwahati, Dibrugarh, etc.
All the foreign tourists intending to visit Arunachal
Pradesh require Restricted Area Permit from the Ministry
of Home Affairs, Government of India. However, recently
the Central government has delegated power to the State
government to issue Protected Area Permit to visiting
foreign tourists in a group of three or more persons for a
maximum period of 30 days.
Marketing Constraints
Arunachal Pradesh’s tourism industry was poorly
developed because of lack of coordination by government
agencies and virtual absence of information and marketing
of the State’s attractions.
It is to be noted that success of Singapore and China in
tourism industry would suggest that the marketing of
tourism product is just as important as its nature and
quality for promoting the tourism industry.
Other Constraints
The growing violence and insurgent activities as well
as number of bandhs in Assam have disputed the
development of tourism in North-east India in general and
Arunachal Pradesh in particular. There may be some
grievances of the local people but it may have acted as a
psychological obstacle that is faced by potential tourists.
Tourism as an industry is highly sensitive to potential
disturbances.
BOX 17.2
Contribution of Trade, Hotel and Restaurantto NSDP of Arunachal Pradesh
Tourism is intimately linked to hotel industry. In fact, the
‘trade hotel and restaurant’ is the resource base of
tourism because a well placed hotel may enhance the
attractiveness to the tourists. Since it is not possible to
estimate the contribution of tourism in State economy
except the revenue earned, an attempt is made to
estimate the contribution of ‘trade, hotel and restaurant’
component (as a proxy of tourism) to the State income
for the last three decades. The contribution of trade,
hotel etc., to the NSDP of Arunachal Pradesh increased
steadily from 1.96 per cent in 1970-71 to 4.95 per cent
in 1990-91 are finally to 5.64 per cent in 2003-04. In
fact, ‘trade, hotel, restaurant’ grew at an average rate of
around 9 per cent from 1970-71 to 2003-04.

247Chapter 17 • TOURISM
Structure of Tourist’s Demandand its Sectoral Linkages
Since there are a growing number of visitors recently,
an attempt was made to study the nature and structure of
tourist demand in Arunachal Pradesh in relation to the
tourist income, occupation, level and pattern of
expenditure, purpose of visit, demographic characteristics
such as age, based on the field survey which was
undertaken in 2002-03.
From the surveyed tourists it is found that around
88.49 per cent of the tourists of Arunachal Pradesh were
between ages 20 to 50. The average age of domestic
tourist was calculated at 35 years and that of foreign
tourists at 36 years. This fact emphasises the need to
organise more and more challenging adventures and
thrilling activities to attract energetic youthful tourists.
This calls for greater investment in activities like
mountaineering, trekking, hiking, river rafting and allied
sports along with fascinating cultural activities. In fact, in
order to develop tourism, there is need for more
investment i.e., capital expenditure. However, in the
budgets of Government of Arunachal Pradesh, the
revenue expenditure in tourism is found to be much
higher than that of capital expenditure.
An attempt is also made to identify the different heads
under which the tourists expenditures are made especially
in the selected tourist spots of Arunachal Pradesh. It is
found that 39.92 per cent of the total expenditure was
made on accommodation, followed by food and beverage
(30.06 per cent), and shopping (15.84 per cent).
Relatively, a low percentage (12.90 per cent) was spent on
local transport, which reflects the fact that the tourists
hired transport from outside the State since the local
transport system was not much developed and relatively
costly. This is supported by the fact that around 77.87 per
cent of the surveyed tourists are of the opinion that there
is need to improve the mode of transportation for
developing tourism in Arunachal Pradesh.
Regarding accommodation, it was found that the
majority of domestic tourists looked for cheaper
accommodation with reasonable comforts whereas luxury
accommodation in posh hotels were the privilege of the
rich domestic tourists and the majority of the foreign
tourists. Therefore, the planning for tourism development
should reflect the behaviour of tourists particularly while
formulating the investment programme for hotel industry.
Although the tourists spent a significant percentage of
their income on food and beverages yet a majority of them
were not satisfied with the quality of food available.
Around 78 per cent of the surveyed tourists were of the
opinion that the quality of food should be improved and
the price was relatively high. A good number of tourists
were also of the opinion that the local food should be
readily available in the hotels and tourist lodges. Around
one-sixth of the total expenditure was spent on shopping,
particularly the purchase of handicrafts, showing that
there is a good potential market for indigenous handicraft
products and this strengthens the case for their further
expansion.
The propensity to enjoy natural beauty was highly
pronounced in case of both domestic and foreign tourists.
As high as 75.72 per cent of the surveyed tourists came to
Arunachal Pradesh to enjoy natural beauty and recreation.
While some (15.15 per cent) came to know more about
the people and their culture, yet enjoyment of natural
beauty was also high on their agenda. Only 7.10 per cent
came for educational and other purposes. The operational
significance of these observations is that greater emphasis
should be laid upon the creation and motivation of the
tourism product to suit the needs and tastes of those
tourists whose purpose of visit is recreation and enjoying
natural beauty but not at the expense of other purposes of
tourist visit.
Furthermore, it was revealed that viewing natural
beauty was a satisfying experience and most of the
respondents (98.11 per cent) wanted to return to
Arunachal Pradesh provided transportation facilities and
institutional facilities were improved. At the same time, a
high proportion of respondents (98.75 per cent) informed
that they would talk to their friends and relatives about
their experience in Arunachal Pradesh and presumably
advise a visit to these places. This is also supported by the
fact that the recommendations of friends and relatives
have induced 79.4 per cent of the tourists to visit the
State as against the other factors such as publicity in
newspapers, TV, Internet, etc.
These factors demonstrate the existence of a large
market, particularly for eco-tourism in the State and also
strengthen the case for its further expansion and
development. However, the present publicity efforts were
found to be less effective in taking advantage of the
market. Hence, there is a need for strengthening the
publicity for marketing of the State’s tourism product.
Policy Implications
The following policies as well as action plan were
suggested for maintaining sustainable tourism:

ARUNACHAL PRADESH DEVELOPMENT REPORT248
• Tourism needs a proper organisational support for
coordination. It should give priority in total
planning of the State. Institutional arrangements for
proper coordination at the State level may be
evolved.
• A tourism master plan and identification of more
circuits may be prepared. The circuits should be
developed in terms of two primary categories. The
first category circuits should cover some of the
locally important attractions. Secondly, the circuits
which have more local importance may be linked to
other tourist centres of north-eastern region. More
specifically, the circuits of north-eastern region may
be divided into different categories like pilgrimage,
historical, cultural, recreation, wildlife etc., and the
identified tourist spots of Arunachal Pradesh may
be linked to those circuits accordingly. For example,
for wildlife tourism, the circuits in north-eastern
region may be like Manas National Park-Kaziranga
National Park-Namdapha National Park etc.
Tourism development will be more productive if it
is a part of north-east scenario. Detailed circuit
routes and location-specific recommendations
should be drawn with a phased approach.
Commercial viability and competitive advantage of
each route should be found out.
• Public-private partnership should be treated as an
essential ingredient of the policy for the
development of tourism in the State. The State
government can build up the infrastructural
facilities for tourism like tourist lodges and huts,
restaurants etc., but the private sector is best suited
for the management and delivering of the services.
The tourist lodges are not only few in number but
also are scattered in different parts of the State.
Tourist lodges will be basically constructed to
attract the economy class tourists. Hence, it is
proposed to construct tourist lodges in the selected
places like Itanagar, Ziro, Malinithan, Sela Pass,
Tipi, Yingkiong, Pasighat, Tuting, Anini, Daporijo,
Hayuliang, etc. At the same time, the State
government should also provide road, land, water
and electricity to private entrepreneurs for
constructing private hotels in different tourist spots
of the State.
• Air connectivity is a cost-intensive option but it
needs to be developed for promoting tourism.
Airports may be built up or developed in Itanagar,
Pasighat, Ziro and Tezu. In hilly places like
Bomdila, Tawang, Mechuka etc., the government
can build short landing facilities for small air crafts.
• Tourist clusters, especially in orange and apple
orchard areas, with landscaped huts strewn across
hill sides should be promoted which can be taken
up by private entrepreneurs.
• The State government should incorporate at least
one aerial passenger rope-way company with a
number of rope-ways at selected tourist spots of
Arunachal Pradesh like Ziro, Bomdila, Dirang,
Yingkiong, etc. However, the proposal for rope-way
should be based on economic viability.
• The government should also encourage adventure
tourism by building necessary infrastructure for
angling, river rafting, winter sports, etc. The angling
and river rafting can be developed in West Kameng,
Lower Subansiri, West Siang and East Siang
districts of Arunachal Pradesh. The winter sports
can be developed in Tawang, West Kameng and
Upper Siang districts.
• The tourism department should liaise with
industries department and set up shops for selling
handicrafts and local products for serving tourists in
the selected tourist spots.
• The participation of local people should be
encouraged. Local management skills must be built
so that local people can maintain their culture and
also improve tourist sites. For example, the tourist
destination has to be developed in consonance with
the local communities. It may be possible to provide
a unique experience to tourists by building low cost
infrastructure in the villages (with proper hygiene,
sanitation facilities and electricity) in adjoining
district headquarters, by using local materials and
local design inputs. There may also be arrangements
for showing the local cultural festivals, dances etc.
This will create employment opportunities. However,
the participation of local people should be systematic
and continuous. At the same time, guest-host
relationship needs to be well researched before an
appropriate policy can be evolved.
• One of the most crucial needs for tourism
development in the State is human resource
development. It should emphasise schemes for
capacity generation of local community, ‘training of
trainers’, etc., so that the well trained local man
power can adequately serve the tourism demands in
future.

249Chapter 17 • TOURISM
• All the developmental activities, particularly
infrastructure, for facilitating tourism in the
selected tourist spots should be planned with a
vision on environmental sustainability.
• A watchdog committee should be set up to monitor
the impacts of tourism on the physical, chemical
and biological entities as well as its socio-economic
implications. The committee can be constituted of
experts of various disciplines from academic and
research institutions and NGOs working on
environment to update the monitoring from time to
time.
• The government should develop an interactive and
properly managed website which should have links
with national websites, websites of private
industries, service providers etc. In fact, through the
website, intending travellers could not only get
information but also be able to make all
arrangements for the journey.
• The simplifying of the entry formalities can lead to
more tourists’ arrivals throughout the year. The
government may think seriously about simplifying
the entry formalities for tourists to Arunachal
Pradesh, so that more tourists can be attracted. For
example, the tourists may obtain the Inner Line
Permits for short duration at the various entry
points by doing the necessary formalities, there
itself, instead of facing the bureaucratic hazards
outside the State. In this connection it should be
noted that recently the Government of India has
allowed group A and B Central government
employees to travel by air from the place of posting
or nearest airport to a city in the north-eastern
region or nearest airport on LTC. Other categories
of employees will be entitled to travel by air to a
city in the north-eastern region from Guwahati or
Kolkata who intend to visit to north-eastern region.
All the Central government employees are allowed
conversion of one block of hometown LTC into LTC
destination in north-eastern region for a period of 2
years. The policy of Central government will
definitely help the development of tourism in
Arunachal Pradesh.
Thus, the study shows that sustainable policies and
guidelines for tourism could make Arunachal Pradesh one
of the most frequently visited tourist states in the entire
north-east region of India. This could provide a very
significant and much needed revenue and employment
source for Arunachal Pradesh in future. However, the
tourism development of the State must be integrated with
that of the north-eastern region.
BOX 17.3
Specific Objectives of the RecentTourism Policy of Arunachal Pradesh
The policy has the following objectives:
(1) Suitable planning for sustainable development of
tourism.
(2) Protection of its heritage (natural, cultural as well
as traditions and values of the people of the State).
(3) Reduction of poverty by income generating
facilities.
(4) Capacity building and creation of mechanisms in
support of small and medium enterprises.
(5) Formulation of strategies that will exploit
opportunities and potentialities of the State.
(6) Ensuring development policies (including public
works and transportation, bus and road networks)
that support and promote the various attractions of
the State.
(7) Securing involvement of the largest number of
stakeholders in the decision-making and resource
allocation and utilisation.
Source: Government of Arunachal Pradesh, Tourism Policy (Undated).

ARUNACHAL PRADESH DEVELOPMENT REPORT250
ANNEXURE TABLE A-17.1
Identified Tourist Spots in Arunachal Pradesh
Name of the Tourist Spot District Distance from theState Capital (in km)
Itanagar Papum Pare 0
Tawang Tawang 540
Bomdila West Kameng 360
Dirang West Kameng 403
Tipi West Kameng 210
Ziro Lower Subansiri 168
Malinithan West Siang 162
Along West Siang 335
Pasiaghat East Siang 280
Parasuram Kund Lohit 795
Namdapha National Park Changlang 640
Source: North East India Data Bank-Tourism, pp.5-6.
ANNEXURE TABLE A-17.2
Interesting Trek Routes in Arunachal Pradesh
Route Approximate Expected Duration Favourable TimeDistance (in km) (in days)
Bomdila-Daimara 100 6 September-October
Bomdila-Seppa 120 8 September-October
Along-Mechuka 85 7 September-October
Daporijo-Taksing 250 25 September-October
Pasiaghat-Tuting 80 7 December-January
Pasiaghat-Mariang 80 7 December-January
Source: North East India Data Bank-Tourism, p.13.
ANNEXURE TABLE A-17.3
Accommodation Capacity of Different Hotels/Guest Houses, etc., in Tourist Spots of Arunachal Pradesh
Sl. Name of Hotel/Guest Rooms DormitoryNo. House and Location Single Double
01 Donyi-Polo Ashoka, Itanagar 7 rooms with A/C 13 rooms with A/C
02 Hotel Blue Pine, Itanagar 08 17 6 beds @ Rs.75 per bed
03 Hotel Bomdila, Itanagar 10 10
04 Hotel Arun Subansiri, Itanagar - 14
05 Hotel Kameng, Itanagar - 16
06 Hotel Himalyan, Itanagar 01 10
07 Hotel Itafort, Itanagar 06 06
08 Hotel Alpine, Itanagar 10 05
09 Hotel Anne, Itanagar 04 12
10 Hotel Kosing, Itanagar 03 09
11 Hotel Jimsy, Itanagar 03 10
12 Hotel Hemika, Itanagar 03 04
13 Circuit House (PWD) Itanagar - 12
14 Hotel Arunachal, Naharlagun 10 13
15 Hotel Rajhans, Naharlagun 03 10
16 Hotel Simang, Naharlagun 05 06
17 Hotel Alena, Naharlagun 02 06
18 Hotel Ganesh, Naharlagun 04 05
19 Hotel Mummy, Naharlagun 04 04
20 Hotel Laxmi, Naharlagun 04 09
21 Hotel Chandni, Naharlagun 04 22
22 State Guest House, Naharlagun 03 02
23 Youth Hostel, Naharlagun - 04
24 Circuit House (PWD), Ziro - 05
25 Hotel Blue Pine, Ziro 01 13
26 Hotel Green View, Ziro - 10
27 Hotel Pine Ridge, Ziro - 03
28 Hotel Santanu, Ziro - -
29 Hotel Kanchanajanga, Ziro - -
30 Circuit House (PWD), Likhabali - 06
contd...

251Chapter 17 • TOURISM
...contd...
Sl. Name of Hotel/Guest Rooms DormitoryNo. House and Location Single Double
31 Forest Guest House, Likhabali - 04
32 Siang Guest House/Circuit House, Pasighat - 08
33 Hotel Donyi-Polo, Pasighat 06 14
34 Hotel Siang, Pasighat 03 07
35 Hotel East, Pasighat 04 04
36 Hotel Oman, Pasighat 04 04
37 Hotel Sangpho, Pasighat 01 03
38 Hotel Arun, Pasighat 09 07
39 Park Hotel, Pasighat 03 02
40 Tourist Lodge, Bomdila - 08
41 Circuit House, Bomdila - 07
42 Hotel Shipyang Pong, Bomdila 10 12
43 Hotel Dawa, Bomdila - 05
44 Hotel Bomdila, Bomdila 01 06
45 Hotel Pasang, Bomdila 01 05
46 Hotel Potola, Bomdila 01 04
47 LA Hotel, Bomdila 04 06
48 Sangrilla Hotel, Bomdila - 05
49 Tourist Lodge, Dirang - 04
50 Hotel Pemaling, Dirang - 04
51 IB (PWD) - 04
52 Tourist Lodge, Tawang - 16
53 Circuit House (PWD) - 05
54 Hotel Buddha, Tawang - 08 8 bedded @ Rs.100 per bed
55 Shangrila Hotel - 15
56 Hotel Paradise, Tawang - 05
57 Hotel NEFA, Tawang - 03 8 bedded @ Rs.160 per bed
58 Hotel Osen, Tezu - 08
59 Tourist Lodge, Tezu - 08
60 Hotel Mother, Tezu - 04
Source: North East India Data Bank-Tourism, pp.5-6.
ANNEXURE TABLE A-17.4
Annual Allocation of Tourism Sector in State Annual Plan (Rs. in lakh)
Annual Plan
2002- 2003- 2004- 2005-03 04 05 06
Direction and Administration 107.00 115.00 135.00 138.00
Tourist Information, 120.00 104.00 100.00 20.00Promotion and Publicity
Development of Tourist 160.00 153.00 118.00 195.00Centres/Infrastructures
Development of Adventure Tourism 15.00 2.00 6.00 20.00
Building 1.00 10.00 55.00 50.00
Fairs and Festival 30.00 50.00 50.00 10.00
Training Programme 5.00 12.00 14.00 12.00
Hospitality 6.00 8.00 12.00 10.00
Total 444.00 454.00 490.00 455.00
Source: Department of Planning, Government of Arunachal Pradesh.

ARUNACHAL PRADESH DEVELOPMENT REPORT252
ANNEXURE TABLE A-17.5
Allocation of Eleventh Finance Commission(EFC) Upgradation Grant during 2000-01
to 2001-05 (Rs. in lakh)
Head of Allocation 2000- 2000- 2001- 2002- 2003- 2004-2005 01 02 03 04 05
Tourism 75.65 40.43 15.00 20.22 ——— ———
Tawang Monastery 30.43 20.43 ——— 10.00 ——— ———
Parusuram Kund 20.00 10.00 10.00 ——— ——— ———
Gorsan Chorten 10.00 10.00 ——— ——— ——— ———
Lhagelah Gumpa 10.00 ——— 5.00 5.00 ——— ———at Morshi
Theda Veta, Itanagar 5.22 ——— ——— 5.22 ——— ———
Source: Department of Planning, Government of Arunachal Pradesh.
ANNEXURE TABLE A-17.6
Sanction Received For Projects under Centrally Sponsored Schemes, 2000-01 to 2005-06 (Rs. in lakh)
Heads(1) Amount Amount Status(4)Sanctioned(2) Spent(3)
2000-01
Arunachal Festival 0.92 0.46 Completed
Beatification of Sela lake at Tawang 25.00 7.50 On going. UC submitted
C/o Trekkers Huts at 2.11 0.60 DroppedTable Valley
C/o Tourist Dormitory at Malithan 12.24 3.60 Dropped (Rs.1.31 lakhs adjustedagainst C/o M/Hall Tawang)
C/o Cafeteria at Bitk Falls 4.48 3.58 On going. UC submitted
C/o CC steps, CC Footpath with Ms 5.00 4.00 OngoingRailing at Menga Cave, Daporijo
2001-02
Dev. of Angling facilities centre at Bodak 7.39 5.91 Completed UC/CC submitted
Procurement of angling facilities at Bodak 3.23 1.30 Completed. UC/CC submitted
IT for Noth-East 4.39 18.29 Completed
Brahmaputra Darshan at Pasighat 20.00 10.00 Completed
Purchase of Computers 7.00 3.50 Completed
Development of Website 7.79 7.01 Completed
Aero Sports Tourism at Pasighat 97.00 80.00 Panel of experts constituted.Work being undertaken
T/Lodge at Boleng 16.00 4.80 Site changed to Sangam UCto be submitted
Yatri Niwas at Roing 56.00 16.89 Completed. UC/CC submitted
Publicity Materials and 56.00 44.25 CompletedAdvt. Support
Solung Festival 2001 of Adi Festival 5.00 2.50 Completed
Buddha Mahotsava at Tawang 5.00 5.00 Completed
River Rafting Equipment 7.10 7.05 Completed. UC/CC
T/Lodge at Mebo 10.00 8.00 Submitted
2002-03
Buddha Mahotsava 10.00 8.00 Completed
Tawang Festival 10.00 5.00 Completed
Buddha Purnima 12.30 12.30 Completed
Solung Festival 4.00 3.20 Completed
contd...

253Chapter 17 • TOURISM
...contd...
Heads(1) Amount Amount Status(4)Sanctioned(2) Spent(3)
Publicity Literature 58.90 44.30 Completed
Angling Festival 5.00 4.00 Completed
2003-04
Solung Festival 5.00 5.00 Completed
Integrated dev. of Bhalukpong, Bomdila— 638.00 500.00 Work partially progress.Tawang Circuit Implemented by
ITDC, New Delhi
WSA at Kharsingsha 47.54 14.00 Completed
Dev. Of Ganga Lake 244.06 8.00 Completed
Ext.T/Lodge at Tawang 100.00 100.00 90% physical progress
2004-05
Const. of WSA at Kuporijo 65.40 52.32 90% physical progress
Dev. of Ganga Lake 243.00 243.00 Completed
Tourism Hut, Changlang 83.24 66.00 Completed UC/CC to besubmitted
Destination dev. of Along, West Siang 266.00 213.00 90% physical progress
Destination dev. of Zemithang 384.00 307.20 60% physical progress
2005-06
Destination dev. of Hot Spring, Jia at Lower 262.00 209.00 Work under progressDibang Valley
Celebration of Brahmaputra Darshan 15.00 12.00 Completed
Destination dev. of Geara Laketaraso 373.00 298.00 80% physical progress
Circuit dev. of Dibrugarh, Pasighat, 299.00 239.20 Work under progressD-Ering Wildlife Sanctuary
Intregated dev. of Siang Circuit 778.94 623.00 Work under progress
Celebration of Festival of Arunachal 2006 10.00 8.00 Completed
Const. of multipurpose hall at Pasighat Tourist 161.00 128.80 Work under progressLodge at Deomali/WSA at Deomali entry gate,Tirap
Source: Department of Planning, Government of Arunachal Pradesh.

Introduction
A reliable, efficient and universal access to electricity isvital for socio-economic transformation of any region. Itnot only stimulates commercial and industrial activitiesbut also facilitates a better living for the people. In thissense, electricity consumption has a cascading multipliereffect on the development process by way of boostingincome and employment generation, as also providingmore investible funds in the hands of government throughsale of power and other charges.
As such, power sector needs to be developed not onlyon priority basis but also to be linked with the broaderdevelopment and welfare goals in the background of localsettings. It needs to set its objectives around peoples’aspirations for uninterrupted and adequate power supplyat an affordable price while exporting the surplus, if any,to generating financial resources for developmentpurposes. While doing so, it should take into account thefinancial as well as social cost of exploiting powerpotential through alternative technologies. With thebenefits flowing in to the people, their participation andsupport to the sectoral initiatives would be moregenerously forthcoming, ensuring rapid socio-economictransformation of the region.
In this background, the chapter reviews state of powersector in Arunachal Pradesh and explore policy optionsfacilitating better utilisation of the power potential forsocio-economic transformation in long-term perspective.The chapter has been organised in three sections. The firstsection focuses on current scenario and performance ofthe sector in terms of key indicators, viz., consumption,
Chapter 18
Power Sector Development
generation, potential, transmission and distribution(T&D), losses and institutional set-up. In this process, italso attempt to identify constraints faced by the sector inthe State. The second section reviews State’s policies andreforms relating to power sector in the recent past.Finally, the last section attempts to highlight thechallenges ahead and makes policy recommendations forit.
With regard to data, it may be pointed out that both theDepartment of Power of Arunachal Pradesh government, aswell as the Ministry of Power/Central Electricity Authority(CEA) of Government of India provide data relating to theState’s power sector. However, there is a considerableinconsistency in the two sources. For the sake ofuniformity, the State sources have been broadly followed,unless otherwise specified in the chapter.
Current Scenario and Performanceof Power Sector in Arunachal Pradesh
Key Performance Indicators
The development of power sector in Arunachal Pradeshis a highly challenging task. The State is not onlycharacterised by underdevelopment and low per capitaincome (Rs.10266 in 2004-05 at 1993-94 prices1) but alsoby difficult geographical and ecological conditions, lowpopulation density and scattered load all across the State.It has mountainous landscape with several pockets whichare not easily accessible.
At the same time, the State enjoys huge hydropowerpotential, which is assessed to be in the tune of 50328MW as on 30th April 2006 by the CEA2 while the
1. Statistical Abstract of Arunachal Pradesh, 2006.
2. As a matter of fact, the State witnessed the largest hydropower potential among all the north-eastern states. As per the CEA estimate, the total hydropowerpotential of the north-eastern region is 63257 MW, of which only 1011 MW is developed so far.
AR
UNACHAL PRADESH

ARUNACHAL PRADESH DEVELOPMENT REPORT256
Department of Hydropower Development of theGovernment of Arunachal Pradesh has estimated suchpotential at 49126 MW.3
Prevailing key performance indicators of the sector, asdiscussed below, are to be viewed in this background.
Consumption and Energy Deficit
The aggregate maximum demand for electricity in theState was estimated at around 105 MW.4 The per capitaconsumption of electricity, excluding T&D losses, wasonly 76.2 MU in 2004-05 as against 75.2 MU in 2001-02.But, it rose sharply subsequently to 139 MU in 2006-07(Table 18.1).
It may be pointed out here that the local powerconsumption in the State was far smaller as compared to itsexports to other states. In the year 2004-05, for example, theformer was only 16.7 per cent of the latter (455.9 MU). Thisshows that the State could not consume a major chunk ofpower available. This was mainly due to inadequate T&Dinfrastructure, as discussed below, within the State.
Table 18.1 further shows category-wise powerconsumption in the State since 2001-02. It revealsconsiderable fluctuation in the consumption pattern in theearly years of the decade. This might be because of thefact that a large portion of supply in the State was
unmetered and wherever the meters were installed,majority of them were defective. This would have madegathering reliable consumption data difficult.5 However,some improvement in metering in the last few yearsmight have improved data quality and their reliability.
The available data show that in the year 2006-07largest consumption was in domestic sector (34.7 percent), which was followed by bulk users (33.9 per cent)and commercial and industrial establishments (20.3 percent). Given a low level of industrial development of theState, however, the share of industry was a mere 8.7 percent of the total. Incidentally, one may also note thedeclining share of domestic sector in the powerconsumption, which was a little more than one-third ofthe total in 2006-07, as against a little less than two-thirds (63.4 per cent) in 2001-02.
Despite low level of power consumption, the State didnot suffer from any energy deficit in the recent years6 asagainst a deficit as high as 70 per cent in 1996-97. Thisreflects upon underdevelopment of the State economybalancing demand-supply of power at a lower level. Giventhis, the State has sold increasingly more power to otherstates: 455.9 MU in 2004-05 as compared to 210.6 MU in2003-04.
As the availability of power in the State is likely toincrease considerably in coming years, many hydro
TABLE 18.1
Category-wise Power Consumption in Arunachal Pradesh over the Years
Year Domestic Public Lighting Commercial Public Water Works Industry Bulk/Other Totaland Irrigation
2001-02 47.67 4.7 5.29 2.8 1.72 12.99 75.17
% 63.4 6.3 7.0 3.7 2.3 17.3 100.0
2002-03 34.72 4.37 6.17 2.77 1.67 29.51 79.21
% 43.8 5.5 7.8 3.5 2.1 37.3 100.0
2003-04 36.3 2.51 9.47 2.86 2 32.67 85.81
% 42.3 2.9 11.0 3.3 2.3 38.1 100.0
2004-05 (RE) 37.34 2.97 10.32 3.31 2.26 20 76.2
% 49.0 3.9 13.5 4.3 3.0 26.2 100.0
2005-06 43.36 6.95 16.82 6.25 11.11 45.53 130.02
% 33.3 5.3 12.9 4.8 8.5 35.0 100.0
2006-07 48 7.15 17.5 6.85 12 47 138.5
% 34.7 5.2 12.6 4.9 8.7 33.9 100.0
Source: Resources Discussions Annual Plan 2005-06 and subsequent updates.
3. Department of Hydropower Development, Government of Arunachal Pradesh (vide letter no. CE/HPD/W-III/07/2005-06/6989-90 dated January 4, 2006).
4. Ibid
5. A possible inconsistency is reflected in the share of domestic sector: 63.4 per cent in 2001-02 and 43.8 per cent in 2002-03 and, that of bulk users, 38.1 percent in 2003-04 and 26.2 per cent in 2004-05.
6. This was the case in the year 2005-06. However, a marginal peak level deficit (1.6 per cent) was noticed in 2004-05. For details, see, www.cea.nic.in
257Chapter 18 • POWER SECTOR DEVELOPMENT
projects being under execution and planning, such exportscan be expected to grow further generating increasinglymore investible funds in the hands of government. It iswidely acknowledged that the State’s free powerentitlement would be more than sufficient to meet itsown demand leaving a significant surplus for trading.
Rural Electrification
Despite low level of domestic consumption, the Statehas made a noticeable progress towards ruralelectrification. It succeeded in electrifying 48.3 per cent ofthe inhabited villages (1867 out of 3863, as per 2001census) by 2006.7 In terms of households, 44.5 per cent ofrural households (73250 out of 1,64,501, as per 2001census) have been electrified, as on 31 March 2005.
Of the 1528 unelectrified villages, 1328 in 13 districtsand 56 blocks were to be electrified with a total cost ofRs.19.48 crore under the Rajiv Gandhi GrameenVidyutikaran Yojana (RGGVY) 8 and would benefit almostone lakh (91251) rural households. Still, there would be300 unelectrified villages.9
It needs to be highlighted here that despite noticeableprogress in rural electrification, the required quantum ofpower could not be delivered to the villages and ruralhouseholds. This was mainly due to lack of necessarydistribution infrastructure. As a result, success achieved inrural electrification could not produce the desiredeconomic gains to the society.
This limitation has also been addressed under theRGGVY, which has proposed to strengthen rural powerdistribution infrastructure by way of envisaging,
1. Establishment of rural electricity distributionbackbone with at least a 33/11KV sub-station,
2. Village electrification infrastructure with at least adistribution transformer in a village or hamlet, and
3. Standalone grids with generation where grid supplyis not feasible.
Such infrastructure would go a long way in satisfyingthe requirements of agriculture and other rural activities
including irrigation pump-sets, small and mediumindustries, khadi and village industries, cold chains, healthcare, education and information technology.
Again for rural electrification, some efforts were alsoinitiated by way of tapping non-conventional energysources. This has been taken up by the Arunachal PradeshEnergy Development Agency (APEDA), which worksunder the aegis of the Ministry of Non-conventionalEnergy Sources (MNES). It has introduced a RemoteVillage Electrification Programme10, under which 18remote villages have already been electrified throughinstalling Solar Home Lighting Systems. Additional 51villages have been sanctioned and were under progress.Further, biomass gasifier systems in the range of 10 to100 KW were also installed in 8 out of a target of 15villages.
Recently, the Prime Minister’s Economic Package(January-February 2008) for Arunachal Pradesh hasprovided Rs. 550 crore for providing electricity throughsolar power as well as small hydropower projects to allvillages along the State border within a span of two years.Towards this, the MNRE has already started interactionwith the State authorities for collecting detailedinformation about sites, size of systems, implementationstrategy etc., for the decentralised small hydro projectsand solar lighting systems.
Installed Generation Capacity
The installed generation capacity under the State sectorduring 1997-98 to 2005-06 has been presented in Table18.2. The table reveals that the capacity has remainedalmost static at around 60 MW over the years, as nosignificant capacity addition was made. It was mainly dueto inadequate investment by the State government in viewof severe resource crunch.11 Even in recent past, a verysmall sum, only Rs.23 crores in 2006-07, was allocated fordevelopment of hydropower. It was, though, raised to Rs.48.6 crores in 2007-08 but nowhere close to therequirement of the sectoral development (Table 18.3).
As such, the State has increasingly relied upon thecapacity allocations in the central sector generating
7. Source : Rajya Sabha Unstarred Question No. 1863, dated 09.03.2006 and Statistical Abstract of Arunachal Pradesh, 2006.
8. The RGGVY was launched in April 2005 by the Government of India. It replaced the existing schemes like, Kutir Jyoti Programme and AREP to speed uprural electrification. The scheme aims at providing access to electricity to all villages and habitations in four years. Under the scheme, subsidy towardscapital expenditure to the tune of 90 per cent will be provided through Rural Electrification Corporation Limited, which is a nodal agency for implementingthe scheme. Electrification of unelectrified Below Poverty Line (BPL) households will be financed with 100 per cent capital subsidy at Rs.1500 perconnection in all rural habitations. The Management of Rural Distribution is mandated through franchisees. The services of Central Public SectorUndertakings (CPSU) are also available to the states for assisting them in the execution of Rural Electrification projects.
9. http://powermin.nic.in/rural_electrification/states_unelectrified.htm (as accessed on 18 November 2005).
10. Under it, solar photo voltaic plants of varying capacity, 4.5 kW, 2.5 kW or 2.2 kW, are installed as per local conditions.
11. Economic Review of Arunachal Pradesh, 2004, Directorate of Economic Statistics, Government of Arunachal Pradesh.

ARUNACHAL PRADESH DEVELOPMENT REPORT258
Stations (CGS) by the Ministry of Power from time to time.Such allocations were 118.5 MW in 2004-05, as shown inTable 18.4, as against 43 MW in 2001-02, recording anincrease of 175 per cent.12 This has, thus, become a majorsource of power for meeting internal demand.
TABLE 18.4
State's Share in the Central SectorGenerating Stations: 2004-05
Plant Ownership % Share MW Share
Hydro Power Plants
Loktak NHPC 4.76 5.00
Kopili NEEPCO 4.00 6.00
Kopili Extension NEEPCO 6.00 6.00
Doyang NEEPCO 6.70 5.00
Ranganadi NEEPCO 18.30 74.00
Kopili II NEEPCO 6.00 1.50
Thermal Power Plants
Kathalguri CCGT NEEPCO 5.50 16.00
Agartala GT NEEPCO 6.00 5.00
Total 118.5 MW
Source: Planning Commission (2005).
Incidentally, it may be pointed out that the centralsector generation in the State is largely through megahydro projects while the State sector by mini and microprojects and by diesel generating sets. At the aggregate,85 per cent of generation in the State sector was fromhydro sources while the rest from diesel gen-sets.
Private sectors contribution to power generationcapacity in the State was minimal: 0.18 MW as on May31, 2005.13 There is no captive generation capacity of over1 MW.14
Energy Availability
Given the low and static installed generation capacityin the State sector, it could produce just 53.7 MW ofpower in 2001-02 which increased marginally to 65 MWby 2004-05 but again came down to 55 MW by 2006-07(Table 18.5). In contrast, the State’s share from CGS roseexponentially from 101 MW in 2001-02 to 511 MW by2004-0515 but downed to 320 MW by 2006-07. Suchfluctuation is attributable to the varying amount of powergenerated by those plants, which depend upon, inter alia,water availability.
TABLE 18.2
Total Installed Capacity (MW) of the State
Year Hydro (MW) Diesel (MW) Total (MW)
1997-98 23.83 30.05 53.88
1998-99 30.73 24.78 55.50
1999-2000 30.57 35.00 65.572000-01 31.83 27.12 58.95
2001-02 32.48 27.12 59.60
2002-03 32.28 27.12 59.402003-04 32.48 27.12 59.60
2004-05 33.00 27.12 60.12
2005-06 32.66 25.00 57.66
Source: Government of Arunachal Pradesh, Stastical Abstract of ArunachalPradesh 2006, Directorate of Economics and Statistics, Itanagar.
TABLE 18.2A
Key Timeline: Ongoing Small Hydel Projects (42 projects)
S.No. Item No. of Start FinishProjects
1 Completion of SHP 13 projects Already started 31.12.2008projects where the workis completed up to 90%
2 Completion of SHP 9 projects+ Already started 30.06.2009projects where the 3 R&Mwork is completed projectsup to 80%
3 Completion of SHP 17 projects Already started 31.12.2010projects where the workis completed up to 70%
4 SHP projects on Indo- 4 projects Already started 31.12.2010China border where thework is completed upto 50%
5 Project on “Decentralized 01.06.2008 31.12.2010micro hydel projects andsolar lighting systems”
Source: Department of Power, Government of Arunachal Pradesh(Unpublished).
TABLE 18.3
Power Sector Allotment by the State Government
Sl. No. Sub-head 2006-07 2007-08
1 Hydel Generation 2299.07 4863.07
2 Building 121.54 104.7
3 Survey & Investigation 1.00 0.304 Improvement 51.09 209.5
5 Maintainance of Assets 720.01 779.73
6 Direction & Administration 414.29 458.7Total 3607 6416
Source: Information supplied by the Department of Hydro PowerDevelopment, Government of Arunachal Pradesh on 17-06-2008.
12. Ministry of Power, Annual Report 2001/02.13. Source: Indian Electricity Scenario, Ministry of Power.14. All India Electricity Statistics, General Review 2005, CEA.15. The State has also started receiving its free power share from the Ranganadi hydro electric project (RHEP) since August 2004.

259Chapter 18 • POWER SECTOR DEVELOPMENT
TABLE 18.4A
Key Timelines for Dibang Power Project
S.No. Activity Likely Date of RemarksCompletion
1 DPR submitted by NHPC 29.12.2005 Completedto CEA
2 EIA & EMP reports finalised 01.11.2006 Completed
3 Implementation agreement 24.06.2007 Completedsigned between GoAP & NHPC
4 TEC accorded by CEA 23.01.2008 Completed
5 PIB meeting held 28.01.2008 Completed
6 Public hearing at project site 12.3.2008 By SPCB
7 Submission of report on public April 2008 By SPCBhearing by State PollutionControl Board
8 Submission of proposal for June 2008 By NHPCenvironment clearance toMoE&F
9 Consideration of environment July 2008 By MoE&F.proposal by EAC
10 Accord of environment Aug. 2008 By MoE&F.clearance by MoE&F
11 Formulation of forest proposal April 2008 By GoAPby concerned DFOs
12 Identification of land for May 2008 By GoAPcompensatory afforestation
13 Consolidation and submission June 2008 By GoAPof forest proposal by StateForest Dept. to MoE&F
14 Site inspection by July 2008 By MoE&Frepresentatives of MoE&F
15 Consideration of forest Sept. 2008 By MoE&Fproposal by FAC
16 Permission by Hon'ble Jan. 2009 -Supreme Court
17 Accord of in principle forest Feb. 2009 By MoE&Fclearance by MoE&F
18 CCEA Clearance April 2009 -
19 Award of major works April 2009 By NHPC
20 Construction of roads and March 2011 By NHPCbridges of project area
21 River diversion Nov. 2011 By NHPC
22 Completion of HRT Mar. 2016 By NHPC
23 Completion of power house Sept. 2016 By NHPCconcreting
24 Completion of dam concreting Aug. 2017 By NHPC
25 Commissioning of 1st and Oct. 2017 By NHPC2nd Units
26 Commissioning of IIIrd and Nov. 2017 By NHPCIVth Units.
27 Commissioning of Vth and Dec. 2017 By NHPCVIth Units
28 Commissiong of VIIth and Jan. 2018 By NHPCVIIIth Units
29 Commissioning of IX and Feb. 2018 By NHPCX Units
30 Commissioning of XIth and Mar. 2018 By NHPCXIInd Units
Source: Department of Power, Government of Arunachal Pradesh(Unpublished).
TABLE 18.5
Energy Availability: 2001-02 to 2006-07
Year States Net Free Power Share from Total EnergyGeneration from RHEP CGS Availability
(MU) (MU) (MU) (MU)
2001-02 53.66 - 101.32 154.98
2002-03 57.89 - 104.20 162.09
2003-04 59.04 112.00 302.00 473.04
2004-05 65.01 169.78 510.70 745.49
2005-06 45.00 168.78 333.47 547.25
2006-07 54.57 112.53 319.63 468.73
Source: Resources Discussions Annual Plan 2005-06 and informationsupplied by the Department of Power, Government of ArunachalPradesh on 17-06-2008.
TABLE 18.5A
Key Time Lines for Para H.E Project
S.No. Activity Likely Date of RemarksCompletion
1 DPR submitted by 26.12.2005 CompletedNEEPCO to CEA
2 Accord of environmental 13.09.2006 Completedclearance by MoE&F
3 Implementation agreement 21.09.2006 Completedsigned betweenGovernment of ArunachalPradesh and NEEPCO
4 TEC accorded by CEA 24.09.2007 Completed
5 Accord of in principle 11.01.2008 Completedforest clearane by MoE&F
6 PIB Meeting held 28.01.2008 Completed
7 Construction of approach April 2008 By NEEPCOroads in and aroundproject site
8 CCEA clearance June 2008 By MOP
9 Award of major works June 2008 By NEEPCO
10 River of diversion Feb. 2009 By NEEPCO
11 Completion of HRT April 2011 By NEEPCO
12 Completion of dam April 2011 By NEEPCOconcreting
13 Completion of power Sept. 2011 By NEEPCOhouse concreting
14 Completion of EM works Dec. 2011 By NEEPCO
15 Commissioning of Unit-I Jan. 2012 By NEEPCO
16 Commissioning of Unit-II Feb. 2012 By NEEPCO
Transmission and Distribution Network
Strengthening transmission and distribution networksin Arunachal Pradesh is a very challenging task in view ofits difficult terrain. As such, not much attention is paidtowards this so far. The development of intra-state grid isyet not taken up in a big way as the State could notallocate funds from its own budgetary sources in view ofresource scarcity. Some actions on this front has,

ARUNACHAL PRADESH DEVELOPMENT REPORT260
however, been taken with the help of non-lapsable centralpool of fund.
Further, the prevailing T&D networks do not workefficiently: while the maximum system voltage in the Stateis 33 kV, long distribution lines at 11 kV, and 415 voltsare unable to efficiently transmit power to the consumers.It results into huge energy losses.
Thus, there is an urgent need to develop efficient T&Dnetworks (i.e., the intra-state grid) across the State. In theabsence of the state grid, the State has to export surpluspower to other states rather than utilising it locally. Forexample, free power entitlement from Ranganadi HydroElectric Project (RHEP), which was available since August2004, has to be exported despite being needed byelectrified villages.
So far the high tension T&D networks is concern,some initiatives has been taken up by the Power GridCorporation but they were at the planning stage. Oncedeveloped, it would facilitate evacuation of power to theload centres outside the State by way of providingnecessary corridors for power export. It would generatesignificant amount of revenue for the State through powertrading.
Investment in Power Sector
Investment in power sector in the State largely camefrom the Central pool, both in hydropower generation aswell as in erecting transmission networks. The Stategovernment has made a marginal contribution in it inview of budgetary constraints.
Even private entrepreneurs took least interest, at leastup until 2005. This was partly due to difficultgeographical conditions, low population density andscattered load and, partly due to the State’s power policy,which envisaged private investment only in megaprojects.16 The private developers were less keen in megaprojects because of large investment requirement and longgestation period. Further, additionally large investmentwas also required for setting high voltage transmissionlines for power evacuation. The policy did not allow themin mini/micro projects despite low financial and timerequirements of such projects and less dependence onT&D networks. Moreover, they were eco-friendly,renewable and ideally suitable for the local requirement.
Growing Private Sector Participation
Of late, however, the government perception towardsprivate investment has changed drastically. Not onlyprivate developers are allowed in the smaller hydroprojects but the State government has also announced aseparate policy, the Small Hydro Power Policy-2007,opening newer investment avenues for them. The policyhas been discussed later in the chapter.
As a result, many private developers have negotiatedMoAs with the State government for participating in thehydropower development. As per latest information (June2008) available from the department of hydropowerdevelopment, as many as 65 projects have been signedduring February 2006 to March 2008 with 22 privatedevelopers, in the range of one (D.S. Construction Ltd. &GMR Energy Ltd.) to nine (KSK Electricity FinancingIndia Pvt. Ltd.) projects each (Table 18.6).17
The probable installed generation capacity of all these65 projects taken together was 15492.5 MW. Of them, 6were mega projects of 1000 MW or more of individualcapacity, 10 were of medium sized projects with 100 to700 MW of individual capacity each while the remaining49 were of individual capacities below 100 MW. Of them,12 were of the capacities below even 25 MW. Thesmallest capacity was just 7 MW of Saskang project inKameng basin to be developed by Patel Engineering Ltd.
This shows that the majority of private developers haveshown interest in the smaller to medium capacity projects,which can be expected to cater mostly to the localdemand, rural or urban.
No doubt, the six mega projects still accounted for asmuch as three-fifths of the total probable installedcapacity by all the private developers and, the 10 mediumsized projects for another almost one-fourth. This meansthat smaller projects, though large in number, would addjust 16 per cent of total capacity by all the privatedevelopers.
This development has marked the beginning of a newera of private investment in the power sector in ArunachalPradesh.
Hydropower Potential and its Exploitation
In the backdrop of huge hydropower potential, asnoted above, it is often argued that Arunachal Pradesh can
16. Other factors that adversely affected private investment include the security concerns and local hostile environment.
17. They also include projects which were earlier with the CPUs but later on taken over by the private developers like the GMR Group (160 MW Talong hydelproject) and the KSK Ventures (125 MW Dibbin hydel project and the 600 MW Kameng Dam hydel project).

261Chapter 18 • POWER SECTOR DEVELOPMENT
emerge as a ‘Power House’ of the country, if its hydro-potential is appropriately tapped.18
However, the hydro potential of the State has largelyremained untapped. As of now, less than one per cent ofthe potential, i.e., 435 MW, has been developed19, whileanother 2600 MW was under execution. This is also truein case of mini/micro hydel potential—a mere 2.13 percent (34 out of 1600 MW) of which has been developed20
even though it is expected to provide an efficientsolution21 for local energy needs in many pockets of theState.
In this background, the State government has setambitious targets, as detailed out in Table 18.7, to add asmuch as 38800 MW of generation capacity by 2022.Almost three-fifths of it shall be added in the Centralsector, around one-fifth in the private sector and the restin the State sector.
For realising such targets, several efforts have beenmade, of late, to tap the hydro potential, mega as well assmaller, of the State in a big way. For example, 42projects involving 27293 MW, as stated in Table 18.13,have been identified for development in ArunachalPradesh under the initiative launched by the PrimeMinister of India in May 2003.22 These included projectsranging from 4000 MW to 30 MW. In addition, the recentPrime Minister’s Economic Package has provided Rs.69.11crore in 2007-08 for timely completion of the ongoing 42small hydro projects (see Box 18.1).
Further, during February 2006 to March 2008, as manyas 72 MoAs were signed for the development of 25722MW of hydro potential at various locations in the State(Table 18.6). While 65 of them, involving 15492.5 MW ofprobable generation capacity, were with privatedevelopers, remaining seven, involving 10230 MW ofcapacity, were with the Central Power Utilities (CPUs)(See Table 18.8 for more details on these sevenprojects).23 While the projects with CPUs were mostlymega projects24, those with private developers, as analysed
above, were mixed ones ranging from 3000 MW to just 7MW.
In total, execution of these 72 projects would resultinto exploitation of more than half (42.2 per cent) of thetotal identified power potential of the State (Figure 18.1).In the process, power potentials of the three basins, viz.,Lohit, Dibang and Kameng, would be exploited to theextent of 77.7 to 85.4 per cent but only 36.2 per cent incase of Siang basin and a mere 0.8 per cent in case ofSubansiri basin. A considerable amount of capacityaddition (4982 MW) would also come from Tawangregion, at the bank of the river Tawang Tru (Table 18.9).
Energy Losses
The T&D losses in most Indian states were quite highin the pre-reform era, in which power sector assets weremainly owned by public utilities. Such losses wereattributable to lack of proper distribution, planning,
BOX 18.1
Prime Minister’s Economic Package
Item/Project Current status
Our Government is taking a 1) Planning Commissionprogramme of electrification has approved additionalof all the houses in the State. allocation of Rs.69.11An amount of Rs. 550.00 crore for the year 2007-crores will be spent to 2008 for Arunachal Pradeshprovide electricity through for power generationsolar power as well as small from on going Smallhydropower project to all Hydro projects.villages along the State border. 2) MNRE has startedOur effort will be to provide interaction with the Stateelectricity to these villages to collect detailedwithin a span of ‘two years.’ information about sites,
size of systems,implementation strategyetc., for decentralised SHPprojects and solarlighting systems. (As on3/3/2008)
18. Development of hydropower is all the more important for being a clean and renewable source of energy. For this, even the Central government has accordeda high priority to it and aimed at raising its share in total generation in the country from current 25 per cent to 40 per cent in next 20 years.
19. As the hydropower potential of the State has largely remained untapped, the installed generation capacity remained low.
20. Department of Hydropower Development, Government of Arunachal Pradesh (vide letter no. CE/HPD/W-III/07/2005-06/6989-90 dated January 4, 2006).
21. Exploiting such potential requires low investment and lesser dependence on state wide transmission network, which is yet to come up. Local distributionnetwork may be developed at a smaller cost to distribute power from such smaller projects.
22. The initiative in total has identified 162 hydroelectric projects across 16 states involving 27293 MW of generation capacity.
23. They collectively involve an estimated cost of around Rs. 42,242.66 crores and expected to produce 42 thousand MU of electricity annually. Of them, theDibang Multipurpose Project is a joint venture between NHPC and the State government while all others were under the BOO (Build, own and operate)arrangement.
24. Of them, the foundation stone of Dibang and Para Power Projects has been laid down by the Prime Minister during his visit to Arunachal Pradesh in Jan.-Feb. 2008. The six units of Dibang project of the NHPC shall be commissioned during Oct.-Dec. 2017 while the remaining six units by March 2018. Eachunit shall have a capacity of 250 MW. In case of Para project of NEEPCO, both the units shall be commissioned during Jan.-Feb. 2012.

ARUNACHAL PRADESH DEVELOPMENT REPORT262
inadequate investments in T&D networks, particularly insub-transmission and distribution, defective metering,unmetered supply and pilferage. With the reforms, suchlosses declined to a varying extent in majority of thestates and became 32.53 per cent of the total availabilityin 2003-04 at all India level.25 For the North-east, it was38.64 per cent.
In case of Arunachal Pradesh, such losses, excludingthose in energy exported/traded, were as high as 52 percent in 2001-02 but declined to 33.5 per cent in 2004-05.It, however, increased significantly up to 43.2 per cent in2006-07 (Table 18.10).26 The estimates for recent yearsare expected to be more reliable owing to improvement inmetering of the power consumption.
TABLE 18.6
MOUs Singed by Private Developers and CPUs inArunachal’s Power Sector
Sl. Name of the Developer Name of Project Basin ProbableNo. Installed
Capacity
1 Abir Construction Pvt. Ltd. Yamne Stage I Siang 60Yamne Stage II Siang 60
2 Adishankar Power Private Ltd. Simang-I Siang 67Simang-II Siang 39Simang-III Siang 44Khuitam Kameng 29
3 Athena Energy Venture Dermwe Lohit 3000Emra-II Dibang 390Emra-I Dibang 275
4 Bhilwara Energy Ltd. Nycharongchu Tawang 98State INycharongchu Tawang 97State IINycharongchu Tawang 95State III
5 D.S. Construction Ltd. Naying Siang 1000
6 ECI Engineering & Turu Dikrong 90Construction Company Ltd.
Tenga Kameng 8
7 Energy Development Company Pakke Bung I Kameng 15Ltd.
Pakke Bung II Kameng 15Pachuk I Kameng 60Pachuk II Kameng 60Majingla Kameng 60
8 GMR Energy Ltd. Talong Kameng 160
9 Indiabulls Real Estate Ltd. Phanchung Kameng 60Pichang Kameng 31Tarang Warang Kameng 30Sepla Kameng 46
10 Jai Prakesh Associates Ltd. Siang Lower Siang 1600Hirong Siang 500
11 KSK Electricity Financing Kameng Dam Kameng 600India Pvt. Ltd.
Utung Kameng 100Nazong Kameng 60Dibbin Kameng 125Jameri Kameng 50Dimijin Kameng 20Dinchang Kameng 90Dinen Kameng 10Dikhri Kameng 15
12 KVR Energy and Infrastructure Par Subansiri 65Ltd.
Dardu Subansiri 60
13 Mountain Fall India Pvt. Ltd. Hutong-II Lohit 1250Kalai-I Lohit 1450Bhareli II Kameng 600(Kameng II)
14 Patel Engineering Ltd. Gongri Kameng 90Saskang Kameng 7
15 Raajratna Metal Industries Ltd. Barpu Siang 70Kangtangshiri Siang 35Ropum Siang 40
16 Reliance Energy Ltd. Tato-II Siang 700Siang Middle Siang 1000(Siyom)
contd...
...contd...
Sl. Name of the Developer Name of Project Basin ProbableNo. Installed
Capacity
17 Sai Krishnodaya Industries Gimliang Lohit 31(P) Ltd.
Raigam Lohit 32Tidding-I Lohit 31Kamlang Lohit 22.5
18 Satyam (North East) Hydro Simen Siang 21Power Ltd. Dengzi Kameng 18
Lower Kameng 18NgorgumUpper Kameng 9Ngorgum
19 SEW Energy Nafra Kameng 96Nycharongchu Tawang 96Mago Chu Tawang 96
20 Soma Enterprise Ltd. Sissiri Dibang 222
21 Tuff Power Private Ltd. Rego Siang 70
22 Velcane Energy Ltd. Pauk Siang 50Heo Siang 90Tato-I Siang 80Hirit Siang 84
Total Private Developers (22) 15492.5
1 NHPC Ltd. Tawang I HEP Tawang 750
Tawang II HEP Tawang 750
Dibang Tawang 3000MultipurposeProject
2 NEEPCO Ltd. Kameng I HEP Kameng 1120
Pare HEP Dikrong 110
3 NTPC Ltd. Etalin HEP Dikrong 4000
Attunli HEP Dikrong 500
Total PSUs (3) 10230
Total all developers (25) 25722.5
Source: Information supplied by Government of Arunachal Pradesh,Department of Hydro Power Development, vide Letter No CE/HPD/W-III/7/2008-09/1447, dated 17th June 2008.
25. All India Electricity Statistics, General Review of various years, CEA
26. Data are from the Department of Power, Govt. of Arunachal Pradesh. It, however, differ significantly from those published by the CEA.

263Chapter 18 • POWER SECTOR DEVELOPMENT
The situation becomes more alarming if thecommercial losses are also added to it. The AggregateTechnical and Commercial losses (AT&C) were estimatedat 70.16 per cent in 2004-05 by the State source27,factoring in the collection efficiency that was less than 60per cent. In contrast, the Ministry of Development ofNorth Eastern Region reported such losses at 63 per centin 2003-04, which came down to 61 per cent in 2005-06.28
Whichever of them may be considered, the level ofAT&C losses in the State are quite high. As such, it is notsurprising to note that the average cost of supply in theState was Rs.3.25/kWh whereas the average revenuerealised was only Rs. 0.93/kWh.29 The high level of energylosses further explain why the Department of Power hasbeen losing a major chunk of its revenues which, in turn,affecting its finances severely30 endangering viability of theelectricity supply business in the State.
As mentioned above, low level of metering, both at thefeeder as well as at the consumer level, is one importantreason for the huge energy losses. While the feeders areby and large completely unmetered, around 59 per cent ofthe consumers are yet to be metered. What is more, alarge portion of installed meters at the consumers’ endare defective. Such a state of affairs not only made thecorrect assessment of energy losses difficult but alsopromoted inefficient usages of the electricity.
To reduce the level of energy losses, the State hasreceived central support under the Accelerated Power
FIGURE 18.1
Power Potential by Basins and Probable InstalledCapacity under the MoAs Signed
14924
6809 67904637
15477
15413
49126
5816.5 55873602
5610
1250
5000
10000
15000
20000
25000
30000
35000
40000
45000
50000
Lohit (85.4%)
Dibang (82.3%)
Kameng(77.7%)
Siang (36.2%)
Subansiri (0.8%)
TOTAL (42.2%)
Name of Basin and Share of Probable Installed Capaity in Total Potential
Total Potential (MW)
Probable Installed Capacity addition through MoAs singed (MW)
TABLE 18.7
Capacity Addition Targets with Respectto Hydro Generation
Plan Period State Central Private CaptiveSector Sector Sector Power Total(MW) (MW) (MW) (MW) (MW)
10th Plan (2004-2007) 38.63 - - - 38.63
11th Plan (2007-2012) 500.00 5000 2000 100 7600.00
12th Plan (2012-2017) 2000.00 8000 2000 200 12200.00
13th Plan (2017-2022) 5000.00 10000 3500 500 19000.00
Total 7538.60 23000 7500 800 38838.63
Source: Government of Arunachal Pradesh, Draft Master Power Plan.
TABLE 18.8
MoU between State Government and CPUs
Sr. Project Installed Annual Location Implementing Basis ofNo. Capacity Energy (District) Agency Funding
(mw) Generation(in MU)
I Tawang - I Hydro Electric Project 750 3156.1 Tawang N.H.P.C BOOII Tawang - II Hydro Electric Project 750 3480.4 Tawang N.H.P.C BOO
III Dibang Multipurpose Project 3000 12270 Lower Dibang N.H.P.C JV betweenValley State
Government& NHPC
IV Kameng - I (Bharali - I) Hydroelectric Project 1120 4112.4 East Kameng NEEPCO BOOV Pare Hydro Electric Project 110 491.74 Papum Pare NEEPCO BOO
VI Etalin Hydro Electric Project 4000 16071.6 Dibang Valley NTPC BOOVII Atunli Hydro Electric Project 500 2247.32 Dibang Valley NTPC BOO
Total 10230 41829.56
Note: NEEPCO: North Eastern Electric Power Corporation Ltd., N.H.P.C: National Hydroelectric Power Corporation Limited, NTPC: National Thermal PowerCorporation Ltd., BOO: Build, Own and Operate.
27. Draft Master Plan (Power), 2005-2022 and Beyond, Department of Power, Government of Arunachal Pradesh.28. http://www.mdoner.gov.in/writereaddata/eventimages/16.pdf, as accessed on 26 June 2008.
29. http://www.apdrp.com/apdrp/projects/revenue_gap_of_seb_ utilities.htm <accessed on 6th October 2005>
30. This is evident from the fact that the return on assets (Profit After tax/Net Fixed Assets) has been estimated at -0.082 per cent in 2004-05.

ARUNACHAL PRADESH DEVELOPMENT REPORT264
Development and Reform Programme (APDRP).31 Being aspecial category state, it is entitled to receive 90 per centof the total sanctioned amount as grants and remaining 10per cent as loans. Under the programme, four schemeswere sanctioned at the cost of Rs. 82.69 crores. Of this,Rs. 43 crores has been released and Rs. 24.88 crores hasalready been spent by November 2006. All the fourschemes were expected to be completed by April 2008.32
Institutional Setup
Currently, electricity in Arunachal Pradesh is suppliedby the Department of Power, which is a part of the Stategovernment and is funded from the State budgetarysources. The department also manages the T&D assets ofthe State. It is also a key agency for undertaking powersector reforms in the State. A separate department,namely Department of Hydro Power Development, hasbeen set up recently in order to oversee, coordinate and
monitor the activities relating to hydropower developmentin the State. Besides, there is also the Arunachal PradeshEnergy Development Agency (APEDA) which is the nodalagency to deal with all the programmes and schemesrelating to renewable and non-conventional energysources. It also contributes to the State’s share of centrallysponsored schemes of MNES.
At the same time, several central power utilities arealso engaged in a big way in the State. They includesNorth Eastern Electric Power Corporation (NEEPCO),National Hydroelectric Power Corporation (NHPC),National Thermal Power Corporation Ltd. (NTPC), andPower Grid Corporation of India Ltd. (PGCIL). Theprojects taken up by NHPC in the State, for example,includes the 2000 MW Subansiri Lower Project, 750 MWeach Tawang-I and Tawang-II projects, 1600 MWSubansiri Middle and 2000 MW Subansiri Upper Projects.These projects are in various stages of development. Oflate, it has also taken up the 3000 MW DibangMultipurpose project at a cost Rs. 16425 crore.
Overview
The above review of the power sector in ArunachalPradesh shows that the sector at present is not onlyunderdeveloped but the pace of development is also slow,at least up until 2005. Despite of the fact, the demand forpower and its availability was in equilibrium with novisible energy deficit, which is a case of a sub-optimalequilibrium. As such, several pockets of the State couldnot get power despite being electrified. Even the AT&Closses were alarmingly high as the T&D networks weregrossly underdeveloped.
Of late, however, tempo of development in the sectorrose significantly, especially with regard to exploiting itsimmense hydro-potential. Unlike past, private sector isfound to have taken a keen interest in it. But, with regardto T&D assets, as also the energy losses, not muchdevelopment was witnessed. This is often attributable todifficult topographical characteristics of the State.
The recent changes in the sectoral policies and reformsare, thus, to be viewed in this background.
Power Policy of the State and Sectoral Reform
Power Policy of the State
The Hydro Electric Power Policy of the State has
TABLE 18.9
Exploitation of Power Potential by Basins
Sl. Basin Total Potential Capacity Share Out ofNo. Addition by Total Potential
MoAs Singed
1 Dibang 6790 5587 82.28
2 Kameng 4637 3602 77.68
3 Lohit 6809 5816.5 85.42
4 Siang 15477 5610 36.25
5 Subansiri 15413 125 0.81
TOTAL 49126 20740.5 42.22
Tawang n.a. 4982
G. Total 25722.5
TABLE 18.10
Transmission and Distribution Lossesin Arunachal Pradesh
Year T&D loss (%)
2001-02 52.00
2002-03 51.00
2003-04 44.23
2004-05 33.54
2005-06 39.18
2006-07 43.21
Source: Resources Discussions Annual Plan, 2005-06 and Informationsupplied by the Department of Power, Government of ArunachalPradesh on 16-06-2008.
31. The APDRP is a redesigned version of Accelerated Power Development Programme (APDP). It was introduced in 2002 for assisting states to restore andsustain viability of the power sector by way of reducing energy losses. The strategy under the programme involves technical, commercial, financial and ITinterventions.
32. http://www.mdoner.gov.in/writereaddata/eventimages/16.pdf, as accessed on 26 June 2008.

265Chapter 18 • POWER SECTOR DEVELOPMENT
maintained that the topography of the State is ideallysuitable for development of run-of-the-river projects.Accordingly, to the extent possible, storage projectsinvolving high dams would be avoided.
The policy allowed private participation in the hydro,as also in the gas-based, power projects but with activeState involvement at various stages of project formulation.This has been envisaged in the following forms;
• The preliminary feasibility report (PFR) has to beprepared by the State Nodal Agency;
• Approval of the State Forest and EnvironmentDepartment has to be sought;
• The Detailed Project Report, to be prepared by thepotential developer, has to be approved by the StateNodal Agency;
• A formal Memorandum of Agreement (MoA) hasto be signed between the potential developer andthe State government for implementation of theproject.33 The State government has, however,promised to assist the private entities in obtainingdue statutory approvals for installation of powerplants.
In addition, as per the policy, the potential developershave to comply with the statutory regulations of theCentral and the state governments inclusive of the forestconservation rules, the labour laws and the Electricity Act,2003. The potential developers have also to pay the costof raising the compensatory afforestation includingpayment of the Net Present Value of the forest land beingdiverted for non-forest purposes. The policy also providedfor incentives to the potential developers, as per theMNES guidelines.
The policy entitles the State a 12 per cent free powerfrom all the projects as water royalty etc.34 The State alsoreserved the first right, after providing a paymentguarantee, to purchase electricity, if required, over andabove the royalty through Power Purchase Agreements(PPAs) with the developer.
As per the policy, developers would have to makeappropriate arrangements for power evacuation. For this,they have to liaison with the relevant authorities. In the
event of utilising State infrastructure, the necessarycharges, as mutually agreed upon between the developerand the State government, would be paid by thedevelopers to the State government.
The policy barred the developer to sell and transfer thepower plant to any other party without the consent of theState government.
Of late, the State government has announced a newpolicy, the Small Hydro Power Policy 2007. A need for itwas felt for providing power to remote villages at a lowertransmission cost. It has accorded due priority to smallhydro potential ranging from 1kW to 25 MW.
Small Hydro Power Policy 2007
The Small Hydro Power Policy, while continued manyof the earlier provisions, provided additional investmentopportunities to private and non-governmentalorganisations in the power sector development. This wasby way of opening projects of smaller capacities to them.The government has, however, reserved the right ofequity participation with the developers in such projects.
It proposed to offer power projects to non-governmental bodies on the basis of BOOT (Build, Own,Operate and Transfer). Towards this, it has classified allthe projects into three categories based on nature andcapacity. As such, it incorporated projects of all size andboth in grid and isolation mode, i.e., those supplying gridquality power as well as those dedicated to a village orcluster with or without connectivity to grid.35
Further, the policy identified three kinds of producers:Independent Power Producers (IPPs), producing andselling power to State utilities on the basis of PowerPurchase Agreement (PPA), Merchant Power Producers(MPPs), producing and selling power to limited numberof permitted pre-determined third parties (e.g., bulkusers), and Captive Power Producers (CAPs), producingpower for own consumption.
It also offers concessions and incentives to them. Fortimely completion of smaller hydro projects, the policyoffered a moratorium on free power from the schedulecommercial operation date (COD), and concessional ratethereafter, as shown in Table 18.11. The policy also offers
33. For bringing transparency and easy understanding of the terms and conditions, a model MoA has been appended in the policy.
34. As per the Central government guidelines, the state is entitled to 12 per cent of the total generation by the developer free of charge from such projects asa royalty to use its water resources, as also because such projects entail large-scale relief and rehabilitation efforts and costs to the local environment.
35. Category I (1 to 25 MW): They can operate in both grid and isolation mode. They shall have all the components and features of projects providing gridquality power; category II (more than 100 to 1000 MW): They shall operate in stand alone mode providing dedicated power to a village or a cluster withor without connectivity to grid. The supply to the consumers shall be provided either at high or low voltage systems; and category III (up to 100 MW):stand alone mode dedicated to a village or cluster directly distributed power to the households without high tension system. For details, see, The SmallHydro Power Policy 2007, The Arunchal Pradesh Gazette, Feb. 15, 2008, Part-I, p. 22-23.

ARUNACHAL PRADESH DEVELOPMENT REPORT266
a special treatment to local developers: indigenous tribalentrepreneurs are exempted from supplying free power tothe State for projects up to 5 MW capacities. Suchprovisions shall enhance employment opportunities forlocal population.
TABLE 18.11
Moratorium Period and Concessional Rate of Free Power
Sl. Category Moratorium Period Rate of freeNo. from Scheduled Power after
COD Moratorium Periodupto 50th Year
1 Projects up to 1000 KW Nil Nil
2 Projects above 1MW to 5 MW 3 Years 5%
3 Projects above 5MW to 10 MW 2 Years 8%
4 Projects above 10 MW to 25 MW 1 Years 10%
Source: The Small Hydro Power Policy 2007, The Arunchal Pradesh Gazette,Feb. 15, 2008, Part-I, p. 26.
For selecting private developer, it proposed a singlewindow selection system under a high level selectioncommittee. The committee examines proposals of theprospective developers and make recommendations to theState government. In the process, the committee takesinto consideration, among others, the employmentopportunities provided to bonafide Arunachalees andemployment offered to local ITI certificate holders. On itsrecommendation, government signs MoAs with therecommended developers. Subsequently, the developerhas to complete all the statutory clearances and take upproject development.
Strategies to Strengthen Transmissionand Distribution Networks
The State’s draft master plan for power sector (2005-2022) includes strategies to strengthen T&D networks.36
It provided for:
• Developing adequate transmission systems toevacuate power from generating stations to the loadcentres and to provide necessary corridors forexport of power to outside the region;
• Developing state grid to meet the local demand;
• Setting up new sub-transmission and distributioninfrastructure within the State to interface betweenrural and urban connectivity;
• Setting up distribution backbone for ruralelectrification works;
• Strengthening existing networks and buildingnecessary system improvement to reduce T&Dlosses; and
• Investing in for 100 per cent metering of allsystems and consumers with latest computerisedbilling and accounting systems.
These measures would go a long way in improving theT&D networks and, in turn, the overall health of powersystem of the State, subject to their timely implementation.
Status of Power Sector Reforms
Power sector reforms have been initiated across Indianstates to address the various constraints plaguing thesector.37 As a result, the structure, ownership patterns,and regulatory set-up relating to the sector have witnessedradical changes with the establishment of independentregulators, corporatisation, unbundling and privatisationin many states.
As a part of its commitment, the Government ofArunachal Pradesh had signed a MoA with the Ministry ofPower, Government of India in July 2002 to introducepower sector reforms. However, the state could notachieve any of the targets specified in the MoA. A reviewon power sector reforms by the Ministry of Developmentof North Eastern Region, as summarised in Table 18.12,indicates no visible progress towards reforms.
The State government has however, outlined a strategyfor restructuring and reforming its power sector in itsDraft Master Plan for 2005-2022 and beyond. It includes:
• Conversion of the Electricity Department into acorporate entity in 2005-06 (but, could not beimplemented so far),
• Unbundling of the Corporation into separateentities handling generation, transmission anddistribution in the year 2012.
• Privatising distribution function in two stages at anappropriate time in future. Distribution below 11kV to be privatised in the first stage while thesystems up to 33 kV would be privatisedsubsequently, after the 11th Plan (2007-2012). TheState Government would announce a separate policyfor this.
36. For details, see, the Draft Master Plan (Power) 2005-2022 and beyond.
37. They include: financial deterioration of State Electricity Boards, growing peaking and energy shortages, poor operational efficiency, irrational tariff structureand under investments in the sector.

267Chapter 18 • POWER SECTOR DEVELOPMENT
Challenges Ahead and Policy Suggestions
Developing Hydropower Potential
As discussed above, Government of Arunachal Pradeshhas, of late, taken several steps to tap its enormoushydropower potential aggressively. Both private developersand CPUs are to play an important role in this endeavour.As such, hydro generation in the State is likely to growconsiderably in years to come. In this regard, effortswould be needed to avoid delays and cost escalations,which has been a common occurrence in the past, becauseof which capacity addition has slipped from one plan tothe other. Realising the importance of timely completionof the projects, as mentioned above, the State’s powerpolicy has provided incentive to developers. But theincentives restricted to projects of smaller capacity only.Some incentives are also required for mega projects,especially those in private sector, for their timelycompletion.
Of the total generation from such projects, the Statewould get 12 per cent power free in the form of waterroyalty. In view of infrastructural constraints, the Stategrid being yet not fully ready, the free power share of theState used to be sold to other states for earning revenue.
In fact, such exports have grown considerably in therecent past and the State administration has been lookingforward to it as a major source of revenue in coming yearsas well.
For the fund starved Arunachal Pradesh, this could bean important source of development resources. The PrimeMinister, while laying down the foundation stone ofDibang Multipurpose Project on 1st February 2008, hashighlighted that the State could generate as much asrupees three to four thousand crore annually from bighydroelectric projects.38 Given this, one cannotrecommend that such projects aimed at power exportsshould not be taken up.
Still the fact remains that the local people at largemight get marginal direct benefits from such projects, asthe electricity is supplied outside the State, for whatsoeverreasons, bypassing the local aspirations. What is more,while fruits of such development are siphoned out, localsmay have to bear heavy social cost inclusive ofenvironmental damage, endangering biodiversity, anddisplacement of people in the case of reservoir-basedmega-dams. It is also feared that the mega projects couldaffect the socio-economic and socio-cultural identity of theregion. In the background of such apprehensions, the localpeople, at times, felt exploited and alienated from suchdevelopment. There were even reports of agitation bythem.39 Recognising such concerns, even the Stategovernment has stalled many such projects (around 25) inthe past and even approached the Supreme Court for thispurpose. All these are reflective of a feeling of discontent.One can, thus, argue that unless the local aspirations andconcerns are not appropriately addressed, peoples’ supportfor the sectoral initiatives may not be generouslyforthcoming.
In a nutshell, establishing a balance between localaspirations/concerns and revenue considerations is ofcritical importance. While mega hydropower projects maybe developed to earn revenue after appropriatelyaccounting for local concerns, local aspirations for powermay be met on priority basis either through them or byway of area specific smaller projects, hydro as well asthose based on alternative sources including therenewable ones.
Of late, a number of steps have been taken in thisdirection. For example, issues holding up hydropowerprojects by the State government have been resolvedpaving the way for signing a large number of MoAs for
38. The Dibang Multipurpose Project alone, for example, will earn Rs. 300 crore a year for the State.
39. For example, local people and students' body of Dibang basin staged a protest against Dibang Multipurpose Project at Itanagar in July 2007.
TABLE 18.12
Reform Status in Arunachal Pradeshwith Respect to the MoA
Provision Status
Constitution of State Electricity Not yet constituted. Accordingly,Regulatory Commission (SERC) the tariff fixation is done by the
Electricity Department, Governmentof Arunachal Pradesh.
Restructuring/ Corporatisation Not Yet
Formation of Reform Committee Yes
Metering up to 11 kV feeder level Out of total of 201 million feedersin the State, only 1 million feedershave been metered by June 2005[1] . But there were 219 workswere in progress.
Consumer metering In total 1.45 lakh consumers, 41per cent of the total, have beenmetered so far
New connection with meter Yes
AT&C losses (Aggregate The level of AT&C losses 61 perTechnical & Commercial Losses) cent in FY 2005-06
Franchising of billing/collection, Not yet startedConsumer indexing,Computerised billing
Source: http://www.mdoner.gov.in/writereaddata/eventimages/16.pdf, as accessedon 26 June 2008 and http://www.apdrp.com/apdrp/projects/metering_status.htm, Accessed on 10 June 2005.

ARUNACHAL PRADESH DEVELOPMENT REPORT268
TABLE 18.13
List of 42 Schemes in Arunachal Pradesh Under the Prime Minister’s Initiative, 2003
Sl. No. Scheme Agency for Installed Capacity Head (m) Annual TariffPreparing Pre- Energy (Rs./kWh)
Feasibility Report (GWH)
Nos. of Units Size (MW) Total (MW)
1 Agoline NHPC 3 125 375 163 1267.38 3.51
2 Amulin NHPC 3 140 420 132 1761.4 0.37
3 Ashupani NHPC 2 15 30 395 126.45 8.75
4 Attunil NHPC 4 125 500 264 2247.32 2.35
5 Badao NEEPCO 4 30 120 154.5 441 2.32
6 Bhareli-I NEEPCO 8 140 1120 97 4112.4 1.85
7 Bhareli–II NEEPCO 5 120 600 51 2345 1.67
8 Chanda NEEPCO 4 27.5 110 175.67 401.91 2.67
9 Demwe NHPC 12 250 3000 138 10823.82 1.97
10 Dengser NHPC 4 138 552 120 2666.71 3.26
11 Dibbin NEEPCO 2 50 100 151.24 335.72 2.23
12 Duimukh NHPC 3 50 150 65 551.48 8.5
13 Elango NHPC 3 50 150 363 583.14 5
14 Emini NHPC 4 125 500 125 1695.45 3.51
15 Emra–I NHPC 3 130 390 278 1648.09 3.02
16 Etabue NHPC 3 55 165 378 683.66 3.43
17 Etalin NHPC 16 250 4000 385 1607160 1.7
18 Hirong NHPC 4 125 500 285 2535.8 1.62
19 Hutong WAPCOS 12 250 3000 166.77 9901 1.28
20 Kalai WAPCOS 10 260 2600 193.21 10608.64 1.01
21 Kameng Dam WAPCOS 5 120 600 65 2345.55 2.29
22 Kapakleyak WAPCOS 4 40 160 245 627.95 1.74
23 Kurungl&II NHPC 3 110 330 151 1435.4 4.04
24 Mihumdon NHPC 4 100 400 286 1451.75 3.6
25 Mirak NHPC 3 47 141 136.4 748.44 3.42
26 Naba NHPC 4 250 1000 221 3995.25 2.14
27 Nalo NHPC 4 90 360 221 1733 3.27
28 Naying NHPC 4 250 1000 245 5077.15 1.18
29 Niare NHPC 4 200 800 205 3356.62 2.02
30 Oju-I NHPC 4 175 700 257 3291.58 2.08
31 Oju-II NHPC 4 250 1000 322 4629.93 1.46
32 Pakke NEEPCO 2 55 110 452.5 335.26 3.33
33 Papu NEEPCO 2 100 200 238 505 2.94
34 Phanchung NEEPCO 2 30 60 157.13 174.83 3.24
35 Ringong NHPC 3 50 150 166.5 659.07 3.61
36 Sebu NEEPCO 2 40 80 123 227.53 3.71
37 Simang NHPC 3 30 90 125 417.82 5.43
38 Talong NEEPCO 3 100 300 171.67 915.5 2.24
39 Tarangwarang NEEPCO 2 15 30 185.55 93.18 2.88
40 Tato-II NHPC 4 175 700 168 3465.9 1.48
41 Tenga NEEPCO 4 150 600 875 1046.5 3.52
42 Utung NEEPCO 3 33.3 100 291 359.13 3.1
Total (Arunachal Pradesh)-42 Scheme 182 27293
Source: Department of Power, Government of Arunachal Pradesh (Unpublished).
269Chapter 18 • POWER SECTOR DEVELOPMENT
new projects since 2006. They involved development of asmuch 25000 MW of the potential, as discussed above.Interestingly, many of these projects are smaller tomedium sized and can be used to feed local demand. Atthe same time, a few mega projects generating hugepower, as much as 1000 to 3000 MW, are also approvedthat can serve the purpose of earning revenue for theState.
Further, many MoAs with private developers havetaken local concerns into consideration by way ofincorporated rehabilitation package for people to beaffected, providing employment opportunities to the localsin C and D group jobs, in addition to setting up ofschools and hospitals and, constructing roads for thelocality as a part of their commitment to socialobligations.
Similarly, the MoAs with the CPUs for mega projectshave incorporated provisions for Local Area DevelopmentTrust, which would take up development activities for thepeople of affected areas. The MoAs ensured a contributionof one paise/unit of electricity generated from suchprojects to the trusts. For the same purpose, it has alsobeen suggested40 that the central power utilities, whichare among the major operators in the State, should set upexternal environment advisory group so as to buildgreater confidence in civil society about their commitmentto ecological issues and concerns.
With regards to smaller projects catering local demand,a closer association, financial or otherwise, by the localadministration (such as panchayat), will ensure theirsmooth implementation and success.
At the same time, greater emphasis may also be givento alternative technologies like solar, wind and biomass,in addition to mini/micro hydro-projects. Considering thegeography of the State, which includes a large number ofremote and isolated villages with small-scattered loadsand good availability of renewable energy resources,various decentralised options may be more suitable inmeeting the local demand. Some of such options are asfollows.
Solar: Solar energy has the potential for meeting energyrequirements related to lighting, heating, cooking andpower generation. Being modular in nature, these systemscould be installed in varying capacities depending uponthe requirement and potential of the locality. It should,however, be kept in view that this source of energy is
intermittent in nature and hence supplementary source ofsupply may also require for uninterrupted supply roundthe year. A few villages in the State have already beenelectrified through solar energy by the APEDA under theaegis of the MNES. More villages may be brought under itthough enhancing investment.
Biomass: As regard to biomass, a TERI study hasrecommended gasifier systems of different capacities for avariety of thermal applications as well as for ruralelectrification, depending upon current and future demandand, availability of biomass. It recommended standalonegasifier systems for each village as the inter-villagedistance in the village-clusters are 3-10 km in most cases.
The study further suggested a bamboo-wood mixbased gasifier as bamboo is available in plenty in almostall the village clusters. Though bamboo has yet not beentried for gasifier-based power generation, a demonstrationproject may be taken up in any cluster to assess thefeasibility of utilising bamboo as feed material. Thecommunity should be actively involved during theplanning and implementation phases of gasifierinstallation. Further, adequate capacity building should beprovided to the community for proper management of thesystems.
Wind: With regard to wind power, the MNES estimatedid not show any major potential in Arunachal Pradesh.However, a special study, undertaken in association withAPEDA, on long-term assessment of wind resource innorth-eastern region has been initiated by MNES, whichcovers Arunachal Pradesh as well. It includes fivelocations in the State.
Thermal Power: Policymakers may also explore thepossibilities of establishing thermal, both coal and gas-based power capacities in the State. This would help inreducing excessive dependence on hydropower.
In a nutshell, alternative technological options shouldbe utilised taking local conditions into account formeeting local energy needs in different parts of the State.
Infrastructure for Transmission and Distribution
Power sector development lumping towards large scaleexports requires development of adequate high voltagetransmission corridors for evacuation of power fromgenerating stations to load centres in other parts of thecountry. In the absence of it, benefits anticipated fromtrading of electricity would not be realised.
40. This suggestion was made by Shri Jairam Ramesh, Minister of State for Power, on May 5, 2008 at Shillong.

ARUNACHAL PRADESH DEVELOPMENT REPORT270
But, setting up of a huge T&D network in ArunachalPradesh would be a challenging task, economically as wellas administratively, given the difficult topographicalcharacteristics (vast hilly areas) of the state. It would notonly require huge investment but the T&D losses mightalso be on a higher side. Further, the entire high-voltagenetworks have to be established through the 22 kmSiliguri Corridor or the chicken’s neck (area betweenSiliguri and Bidhan Nagar in West Bengal) stretch whichmight be too narrow in the opinion of technical experts.The bunching of network in the narrow band might createa strong electromagnetic field requiring evacuating peoplefrom the area. Given the high risk involved in it, majorinvestments for this have to come from the centralsources, as the private developers may not be keen andthe State may not have sufficient resources for such a job.
Moreover, the State has to focus on developing intra-state grid so as to supply adequate electricity to localconsumers. For this, it needs to arrange resourcesthrough exploring different financing options involvingfinancial institutions and the Central schemes, in additionto allocating resources from its own budgetary resources.The intra-state grid should be the State government’spriority while development of high voltage networks maybe taken up by the Central power utilities, like the PowerGrid Corporation.
Energy Losses
Given that reliable and accurate estimates on energylosses in the State are still not available, there is anurgent need to institute proper system studies and circle-wise energy audits to arrive at a true picture of energylosses. For this, Geographic Information Systems (GIS)and Management of Information Systems (MIS) should beimplemented for appropriate energy audits. Appropriatestrategies, a mix of technological and policy interventions,for reducing energy losses could be developed only in thebackground of accurate and reliable estimates of theenergy losses.
Keeping reliability issues aside, curtailing such losseswould not only improve the viability of the organisationbut would also facilitate internal resource generation.Towards this, complete metering and strict enforcementof penalty provisions, as mandated in the Electricity Act,2003, could help in bringing down the electricity leakage
significantly. This will, in turn, also improve the collectionefficiency. The Department of Power should, therefore,step up its efforts on metering both at the feeders as wellas at the consumer level. The metering projects which arein progress should thus be expediently completed. Forimproving collection efficiency, the Department couldexplore the option of outsourcing. Further, in thisendeavour support from the local administration would beof great importance.
Resource Mobilisation
Mobilising resources for meeting the ambitiousgeneration targets and extensive T&D networks inclusiveof intra-state grid is a highly challenging task. Whileconsiderable investment has been committed by CPUs, asalso by the private developers to an extent, the State hasto find resources for its share in the development.Additional demand for resources would rise if the Statechooses to acquire equity stakes41 in the joint ventureprojects with the IPPs and CPUs.
In this regard, the State government is required to tapall possible options. It may consider converting 12 percent free power into an equity share. It may alsocontemplate central assistance for financing such equitystakes.42 Internal resource generation may be attempted byway of reducing energy losses. To the extent possible,resources may be allocated from its own budgetarysources. It may also explore possibility of project specificborrowing from financial institutions.
Appropriate incentives, wherever possible, may beextended to further step up private investment in thepower sector, especially in development of T&D networks.They should be strong enough to neutralise geographicaland ecological disadvantages in the State.
Establishment of State Electricity RegulationCommission (SERC)and Power Sector Reforms
Despite being committed, the State government hasyet not constituted the SERC. The Electricity Act, 2003,has incorporated provision for such a commission and itspower. Post-issuance of the Act, important functions suchas tariff determination, licensing, promotion ofcompetition, etc., has been vested with the SERC. It istherefore, essential to expedite the establishment ofSERC.
41. An equity stake of the State will not only give a sense of ownership but would also allow the state to leverage terms and conditions safeguarding thepeople's interests such as employment, environment etc., in the execution and operation of such projects.
42. While participating in the national workshop on hydropower development in the Himalayan Region in December 2006, the Chief Minister of ArunachalPradesh requested Planning Commission to allocate a special grant of about Rs. 8400 crores to facilitate equity participation by the State government in thejoint venture projects with the IPPs and CPSUs.

271Chapter 18 • POWER SECTOR DEVELOPMENT
At the same time, the State should considerintroducing other power sector reforms likecorporatisation, unbundling and privatisation at an earlydate. This would help in improving the health of powersector in the State.
Conclusion
To sum up, with the enormous hydropower potentialat its disposal, Arunachal Pradesh in all probability willemerge as a power house of the country in the longerterm perspective. To achieve such a goal smoothly, asuitable model of sectoral development, whichappropriately takes local concerns/aspirations intoaccount, needs to be adopted. Various decentralised
generation options could be of great help specifically formeeting the local demand. At the same time, T&Dnetworks, including the intra-state grid, need to bestrengthened considerably for evacuating power to theload centres without much energy losses, as also to supplypower to local population. This task is also not lesschallenging given the difficult local terrain.
All these are indicative of the fact that huge amount offinancial resources are required for the sectoraldevelopment in the State. For this, the State has to tap allpossible sources, central agencies, private developers aswell as its own resources. The State should also focus onsectoral reforms so as to reduce inefficiencies significantlyand generate internal resources.

Introduction
Access to a safe, affordable and convenient transport
and communications system is not only a basic
infrastructure need of the people for mobility and access
to livelihood services, it is also a prerequisite for
industrial development and overall economic growth,
especially in a remote state like Arunachal Pradesh.
This chapter discusses the status of transport and
communications (telecommunications and posts) in the
State. It highlights the constraints facing these sectors and
proposes strategies to overcome them. The first part of
this chapter discusses the transport sector, and the second
takes up the telecom and postal sectors.
Transportation
The provision of transport infrastructure and services in
Arunachal Pradesh is the responsibility of two
departments—Directorate of Transport and State Transport
Corporation. The former is entrusted with the
responsibility of implementing the provision of Motor
Vehicle Acts and Rules of State/Centre by issuing permits
and licences, and collecting taxes. Inland water
transportation, anti-vehicular pollution measures, and
implementation of road safety programmes are some of the
other functions of this department. The State Transport
Corporation, on the other hand, is responsible for the
provision of public transport services, which at present are
limited to bus services. The following sections discuss
transport sub-sectors in Arunachal Pradesh in detail.
Roads and Bridges
Roads constitute the principal mode of access and
communication in the hilly and difficult terrains of the
State. Presently, the State has the lowest road
development index in the country. The road density as on
ARUN
ACH
AL PR
ADESH
Chapter 19
Transport and Infrastructural
Development
March 2004 being almost 18 km per 100 sq km of area as
against the Indian average of 75 km per 100 sq km and
the north-eastern regional average of 52 km per 100 sq
km. Also, the lowest densities of national and state
highways are found here. The levels of rural connectivity
are also low as out of the total 3599 villages in Arunachal
Pradesh, roads connect only 1407, i.e., roughly 40 per
cent of the villages (Draft Annual Plan 2005-06). Table
19.1 gives the category-wise break-up of road lengths in
the State.
TABLE 19.1
Category-wise Length of Roads inArunachal Pradesh from 1998-2002
Length of (km) 1998 1999 2000 2001 2002
Total roads 17843 18272 18322 18362 18365
Surfaced 5290 5596 5659 5699 5689
Total Highways 16749 17178 17178 17218 17218
Surfaced 5196 5502 5583 5623 5612
Total National Highways 352 352 352 392 392
Surfaced 271 271 352 392 381
Total State Highways - - - - -
Surfaced - - - - -
Total Other PWD Roads 11740 12169 12169 12169 12169
Surfaced 4925 5231 5231 5231 5231
Total Village Panchayat 4657 4657 4657 4657 4657Roads
Surfaced - - - - -
Total Urban Roads 35 35 35 35 36
Surfaced 35 35 35 35 36
Total Military Engineering - - 33 33 34Surface Roads
Total Railway Roads - - 2 2 2
Total Project Roads 1059 1059 1109 1109 1111
Surfaced 59 59 41 41 41
Total Roads under Forest - - 1109 1109 1111Department
Surfaced - - 41 41 41
Source: Basic Road Statistics of India, Transport Research Wing, MoRTH,2005, GoI, New Delhi.

ARUNACHAL PRADESH DEVELOPMENT REPORT274
Table 19.2 indicates the growth of National Highways
amongst the north-eastern states of India. It can be seen
that after Sikkim, Arunachal Pradesh possesses the least
length of national highways (NH) in the region. Arunachal
Pradesh also exhibited the lowest compound annual growth
rate (CAGR) in comparison to the other states of the
north-east. In terms of growth of total length of roads also,
Arunachal Pradesh has exhibited a low annual growth rate,
as compared to other NE states (see Table 19.3).1
TABLE 19.2
Growth of National Highways in ArunachalPradesh and other North-eastern States (km)
Year 2000 2001 2002 2003 2004 CAGR(%)
Arunachal Pradesh 352 392 392 392 392 0.63
Assam 2706 2836 2836 2836 2836 -
Manipur 954 954 954 954 959 8.25
Meghalaya 717 717 717 717 810 5.96
Mizoram 857 927 927 927 927 5.06
Nagaland 369 369 369 369 494 15.90
Sikkim 62 62 62 62 62 1.58
Tripura 400 400 400 400 400 7.29
Source: http://morth.nic.in/motorstat/brs_table1.htm, accessed on 11.11.2005.
TABLE 19.3
Growth of Total and Surfaced Roads in Arunachal Pradeshand Other North-eastern States (km)
State Total (T)/ 1998 1999 2000 2001 2002 CAGRSurfaced (S) (%)
Arunachal T 17843 18272 18322 18362 18365 0.72Pradesh S 5290 5596 5659 5699 5689 1.83
Assam T 68523 85778 90727 87173 89486 6.90S 11723 12701 12753 12891 12882 2.38
Manipur T 10911 11434 11434 11434 11434 1.18S 3340 3816 3863 3863 3863 3.70
Meghalaya T 8751 9126 9360 9497 9565 2.25S 4439 4589 6248 6566 6560 10.26
Mizoram T 4484 4846 4731 4970 5075 3.14S 4265 4632 2743 2887 2877 -9.37
Nagaland T 19637 20337 21015 21021 21021 1.72S 5610 6236 6450 6451 6451 3.55
Sikkim T 1851 1851 1911 1992 2019 2.20S 1544 1544 1514 1546 1546 0.03
Tripura T 13802 15565 14801 14031 16296 4.24S 4320 4385 4391 4390 4393 0.42
Source: http://morth.nic.in/motorstat/brs_table2.htm, accessed on 24.11.2005.
As per the National Road Development Plan, 1981-
2001, the NH network should cover the whole country in
grids of 100 km, ensuring no part of the nation remains
more than 50 km away from a NH. As per the estimates
in the Draft Annual Plan 2005-06, the minimum length of
NH required in the State would be 1675 km, as against
the existing less than 400 km. The present NH network
touches only fringes of foothills of the State adjacent to
Assam, and as a result many districts of the State have
been deprived of good connectivity. Even today, the State
does not have lacteal road connectivity districts, sub-
divisions and circle headquarters, since roads run
vertically connecting places in Assam with districts or sub-
divisions with circle headquarters in Arunachal Pradesh.
Thus, has resulted a high transportation cost (Human
Development Report, Chapter 8).
The bridges in the State, mostly semi-permanent and
timber are currently in weak and distressed conditions.
The Department of Transport had proposed a project on
weighbridges in the year 2000 along with a list of
proposed locations.2 The rationale of the proposal, besides
preventing accident occurrences, was to raise revenue for
the State government by charging weighing fee on the
bridges. If successfully implemented, the system is
expected to generate revenue of approximately Rs.5.6 lakh
per year. Work on the project is likely to be started soon.3
According to the Draft Annual Plan (2005-06) for
Arunachal Pradesh, the major problems associated with
the road development in the State are:
• hilly terrain and challenging topography (roughly
only 17-18 per cent of the total State area falls in
the gentle-moderate slope gradient),
• young and weak geological formation of hills
susceptible to erosion,
• presence of a seismologically active zone
threatening the stability of slopes and safety of
roads,
• presence of rocky terrain with deep valleys and
gorges,
• presence of dense forest covers, and
• heavy rainfall making road maintenance difficult.
The following programmes have come up in the State
recently as a part of Government of India’s initiative to
enhance road development in the State:
1. It is observed that wide variation exists between total road length values expressed in state data sources like Draft Annual Plan (2005-06) and EconomicReview (2004) and central source like Basic Road Statistics of Ministry of Road Transport and Highways (MoRTH), the latter being much higher. Suchdiscrepancies need to be addressed and a consistent database established. Analysis for Table 19.3 has been done based on figures furnished by sourcementioned for Table 19.3.
2. Identified points for installation of weigh bridges (in Arunachal Pradesh). 2000, Naharlagun: Directorate of Transport, Government of Arunachal Pradesh
3. Information based on personal communication with the department.
275Chapter 19 • TRANSPORT AND INFRASTRUCTURAL DEVELOPMENT
1. Special Accelerated Road Development Programme
Recently the Government of India has initiated the
Special Accelerated Road Development Programme
(SARDP-NE) in the north-east region which aims at
improving/upgrading over 7600 km of roads. The specific
objectives of this programme are to: (i) connect all state
capitals with improved/upgraded National Highways,
(ii) provide connectivity to all district headquarters,
(iii) improve connectivity to the neighbouring countries,
and (iv) provide connectivity to backward or remote areas.
SARDP-NE envisages widening of 3,251 km of national
highways, improvement/widening of 2,500 km of State
roads and of 1,888 km of roads of strategic importance.
The programme is to be implemented in three phases.
The estimated cost of the SARDP-NE is Rs.12,123 crore,
with proposed budgetary support of Rs.9,952 crore and
Rs.2,171 crore mobilised through private sector
participation (MoF, 2006). During the year 2005-06, a
budgetary allocation of Rs. 450 crore for SARDP-NE was
made and further, for improvement of strategic roads in
Arunachal Pradesh, an additional allocation of Rs.100
crore was provided.4 Presently, improvement of the road
from Lumla to Tashigong via Dudunghar, with a length of
36 km, has been entrusted with BRO as part of Phase ‘A’
of SARDP-NE, at an estimated cost of Rs.38 crore.
Given the rapidly increasing shift towards public-
private partnerships in financing the road sector, its
viability however, gets challenged in most of the north-
eastern region due to relatively low traffic volumes and
prospects of toll collection in the future. Yet as a part of
SARDP-NE, under the NHDP Phase-III, 345 km of
National Highways no. 31, 52 and 52A falling under
Assam and Arunachal Pradesh, have been identified for
improvement. This will be done on a Build-Operate-
Transfer (BOT) basis, and the identified corridor is
Baihata Chariali (on EW corridor) to Itanagar.5
2. Connecting the Villages
The Pradhan Mantri Gram Sadak Yojna (PMGSY),
launched in December 2000, aims at providing
connectivity to unconnected habitations (having
population over 250 persons in the north-eastern hilly
states) in rural areas by means of all-weather roads
including proper drainage features. The Government of
Arunachal Pradesh completed 288.28 km road works in
2004-05 under PMGSY connecting 11 habitations. The
State completed 68.56 km roads in 2005-06 with central
assistance of Rs.53.81 crore.6
3. Bharat Nirman (2005-2009)
A ‘Four Year Business Plan for Rural Connectivity’,
aims to bring in connectivity of 2119 km for 298
habitations in Arunachal Pradesh.7
4. Other Projects
Projects worth Rs. 207.21 crore have been approved
under NCLPR which include: (i)Road from NH-52A
Nirjuli to Sagalee (SH-Doimukh to Toru 45 km); (ii)
improvement/construction road from Sagalee to Sakiang
(50 Km); (iii) Construction of Motorable Suspension
Bridge over river Siang at the site of Gandhi Bridge.8
Road Transport
The total number of vehicles in the State has been on
a rise. According to Economic Review (2004) of Arunachal
Pradesh, the total number of vehicles of all types
registered in the State during 2003-04 was 5703
(excluding Dibang Valley) as against 3586 vehicles
registered during 1999-2000, showing an increase of 55
per cent over four years. Amongst all registered vehicles,
two wheelers account for almost 72.5 per cent followed by
light motor vehicles, which included vans and Tata sumos.
The district-wise revenue collection from the registration
fee, fines, road taxes, etc., totalled up to Rs. 1.1 crore for
the year 2003-04. The total number of vehicles in
Arunachal Pradesh as on 31st March 2003 is given in
Table 19.4.9
As per the fuel quality norms prescribed for India by
the Mashelkar Committee Report in 2002, the State
should be following Bharat Stage II emission norms from
1st April 2005. Interactions with the concerned
departments revealed that the same is being more or less
followed, but the degree of enforcement is weak. As far as
vehicle inspection and maintenance procedures are
concerned, the status of compliance is negligible.
4. http://pib.nic.in/release/release.asp?relid=9286; accessed on 04.07.2006.
5. http://rajyasabha.nic.in/book2/reports/t_and_t/102ndreport.htm; accessed on 04.07.2006.
6. A detailed status of the ongoing and completed work in Arunachal Pradesh under the PMGSY can be found on the following PMGSY web link http://www.pmgsy.org/citizens/en/STL/09SRP/roadwiseprogress.asp?year1=0&RoadStatus=0&Stream=0&StreamTxt=All%20Streams&State=AR&ViewType=1
7. Details regarding the targets and achievements status of the Bharat Nirman programme district-wise can be found on the web link http://omms.nic.in/ASPNet/citizens/NAT/12BN/BharatNirman.aspx?state=AR&district=0
8. http://pib.nic.in/archieve/others/2006/may2006/upa_gov_20060521/UttarPradesh.pdf; accessed on 10.07.2006.
9. There exist certain discrepancies in the data reported in different sources on the actual numbers of vehicles, revenue collected and permits issued. Thisproblem of inconsistency in data reporting should be addressed.

ARUNACHAL PRADESH DEVELOPMENT REPORT276
TABLE 19.4
Total Numbers of Vehicles in ArunachalPradesh as on 31.03.2003
Category Two Passenger Goods Cars Jeeps Taxis BusesWheelers Three Three
Wheelers Wheelers
No. of 10605 1430 555 2340 2260 299 665Vehicles
Category Trucks and Tractors Trailers Other TotalLorries Vehicles
No. of 2323 333 155 179 21,144Vehicles
Source: http://morth.nic.in/motorstat/Table%20No%2013.htm; accessed on24.11.2005.
Tables 19.5 and 19.6 give the total road accidents that
occurred in Arunachal Pradesh in past few years. It can be
observed that in the past five years, there has been a
consistent increase in the number of fatalities in the State
(especially on account of heavy vehicles) and this is an
issue of major concern.
TABLE 19.5
Total Road Accidents in Arunachal Pradesh
Year National State Other Total Persons KilledHighway Highway Roads in Road
Accidents
1999-2000 8 24 31 63 86
2000-01 123 149 194 466 175
2001-02 70 78 108 256 89
2002-03 NA NA NA NA NA
2003-04 46 144 55 245 127
Source: Statistical Abstract of Arunachal Pradesh (2004).
TABLE 19.6
Number of Persons Killed and Injured byMotor Vehicles in Arunachal Pradesh
Motor Persons Killed Persons InjuredAccidents
Year 2000 2001 2002 2003 2000 2001 2002 2003
Arunachal 89 71 102 127 407 381 312 374Pradesh
Source: MoRTH (2005), Motor Transport Statistics of India 2002/03.
In terms of road safety initiatives, Arunachal Pradesh
has set up the State Road Safety Council and District
Road Safety Councils to monitor safety in road transport
operations. In collaboration with the police departments,
they carry out activities like training and eyesight check-
ups of drivers of heavy vehicles. There are enforcement
inspectors who are authorised to check vehicle
documentation at any time and enforce penalty under the
Motor Vehicles Act to non-compliant drivers. The Draft
Annual Plan 2005-06 for the State provides a specific
allocation for road safety programmes, including
replacement/purchase of new vehicles for mobility of
police personnel and traffic equipment, training
programme, publicity, etc.
Road safety must be given priority in the State due to
its steep hilly terrain and narrow roads which are mostly
single-laned and unsurfaced. Provision of safety features
like proper signage, road markings, reflectory paint
markings (for night time driving) and appropriate design
of roads must be ensured. High levels of precipitation in
the State also call for good drainage features (road side
drains, culverts, bridges, etc.) to prevent accumulation of
water on roads. Road safety audits should be undertaken
to identify gaps in the existing system.
Public Transport
The State Transport Department (STD) is officially
responsible for providing public bus services in Arunachal
Pradesh. Some private players (mostly Assam-based and
some local companies) are also engaged in the provision
of bus services though their services are limited to
lucrative routes.
The total fleet strength of the STD is about 236 buses
plying on 148 routes, out of which almost 30 per cent
routes lie in or pass through Assam (Economic Review
BOX 19.1
Prime Minister’s Economic Package forArunachal Pradesh: A Big Hope for Development
of Road and Transportation
The Prime Minister announced an economic package for
Arunachal Pradesh on 31st January 2008. The proposals for
development of road and transportation are as follows:
(i)A new Greenfield Airport will be constructed in
Itanagar to operalionalise Pasighat, Along, Daporijo, Ziro
and Tezu airports. (ii)Defence Ministry would improve
infrastructure of the advance Landing Grounds at Tuting,
Mechuka, Pasighat, Vijayanagar and Walong. (iii)Daily
helicopter facility between Guwahati and Tawang (iv) The
Central government is going to construct a two lane Trans-
Arunachal Pradesh Highways from Tawang to Mahadevpur.
This 1840 kms long highway will pass through Bomdila,
Nechipur, Seppa, Sagalee, Ziro, Daporijo, Along, Pasighat,
Roing, Tezu, Mahadevpur, Namchik, Changlang, Khonsa
and Kanubari. (v)Itanagar will be connected by four land
highways within four-five years and all district
headquarters will be connected with two lane roads. (vi)
Under Bharat Nirman, 500 small settlements will be
connected by roads.

277Chapter 19 • TRANSPORT AND INFRASTRUCTURAL DEVELOPMENT
2004). The STD also operates four railway out agencies at
Along, Naharlagun, Bomdila and Yingkiong to facilitate
advance reservations in long distance trains. Apart from
connecting district/sub-divisional and circle headquarters
of the State and extending bus services to neighbouring
states like Meghalaya, Assam and Nagaland, the STD
provides concessional services to certain groups of users,
sometimes with very high level of subsidies. STD buses
are also deployed during emergency periods like law and
order situations, and natural calamities. As a consequence
of various social obligations, the STD incurs huge losses.
The losses of the Department have increased to Rs. 12.05
crore in 2004-05 from Rs. 10.29 crore in 2003-04.10
Table 19.7 gives the operational, financial and physical
statistics of Arunachal Pradesh State Transport
Department. The bus fleet utilisations appear to be more
or less constant over the past few years. The average
number of passengers carried daily and total passengers
carried yearly have increased but the number of buses
plying on roads on a given day has reduced. Also the
number of passenger kilometres operated is far less than
what is scheduled. The main reasons for the poor
performance of the STD are as below:
• Operations are carried out under difficult terrain
and climatic conditions involving high operational
and maintenance costs;
• Tariff cannot be raised to neutralise losses in the
absence of any cheaper alternative of travel;
• Certain uneconomical routes have to be served for
the sake of providing connectivity to the rural
masses scattered over the entire State;
• Severe lack of funds with STD does not allow them
to upgrade;
• 34 per cent of the fleet is averaged with higher
maintenance costs;
• Low fleet utilisation (average 67 per cent); and
• Increase in salary bill of employees and increase in
fuel prices
The STD has identified and undertaken certain
administrative measures in 2004-05 to improve
operational efficiency of the department (Annual
Operating Plan 2005-06). These included inter alia:
1. periodical meetings to review performance of the
staff and achievements of targets,
2. identification of sources of revenue generation,
ways to reduce operational costs and check leakages
of revenue,
3. training programmes with the help of vehicle
manufacturers to promote skills and driving habits,
4. bus stations to be provided with basic
infrastructural facilities to undertake timely
maintenance of vehicle at minimum costs, and
5. expansion of management information systems.
A well-regulated and efficient public transport system
is an urgent requirement for the State. In the light of low
load factors, smaller buses or shared forms of paratransit
could be used as means of public transport. Old buses
need to be replaced in a phased manner and can be
replaced by smaller buses or lighter vehicles, which would
be more fuel-efficient and economical in the long run.
Efficient fare and pricing mechanisms based on low
subsidy should be designed and greater focus should be
placed on the improvement of quality of the services in
terms of reliability, comfort and safety. New institutional
initiatives such as restructuring of the existing state
transport undertaking, introduction of competition and
creation of public-private partnerships could go a long way
in improving the efficiency and productivity of the STD.
Intermediate Public Transport
As a result of the gap between levels of services
provided by the STD and the needs of the users,
intermediate forms of transport have found an important
place in Arunachal Pradesh. These intermediate forms of
transport are in the form of private operated vans, Tata
sumos and auto rickshaws, which provide a faster, more
personalised and ubiquitous service than public buses.
Recent years have witnessed a significant growth in the
number of Tata sumos and light vehicles in the state,
indicating their increasing demand and popularity.
Such modes should be integrated with the existing bus
system so that both modes operate as complementary to
each other. Adopting a gross cost model11 for private
sector participation in bus operations could achieve this.
The ‘informal’ vehicles could be registered and recognised
by the government, and the latter could set the routes to
10. Review of performance and assessment of financial resources of Arunachal Pradesh State Transport for the Annual Plan 2005-06. Transport Division,Planning Commission.
11. http://www.codatu.org/english/publications/proceeding/conference/codatu11/Papers/deb40.pdf; accessed on 12.07.2006.

ARUNACHAL PRADESH DEVELOPMENT REPORT278
be operated and fares charged. The fare revenue would
accrue to the government, which in turn could pay the
operators an agreed amount, irrespective of occupancy and
ridership. This way the private operators can ply on
prescribed routes without the threat of competition and
losing riders. This model is somewhat similar to the
kilometre scheme being practiced in Delhi and Bangalore,
where private buses are hired to run services as per
requirements of the State Road Transport Undertaking.
While in the gross cost scheme, the operator can bid for
the level of compensation based on type of route, service
quality expected, etc., in the kilometre scheme,
compensation is fixed regardless of type of route, time of
day, etc. Under the proposed model, the operators might
be unwilling to operate on crowded routes or may
compromise on ridership. This, however, could be tackled
by ensuring a varying compensation based on the nature
of services undertaken. Such a system would not only
serve the commuters well, but also find profitability and
sustenance. Designing a mutually acceptable operating
schedule where the more arterial and heavy traffic routes
are covered by bus services while the interior and remote
routes with lesser demand are covered by intermediate
public transport could achieve this. Similarly buses could
TABLE 19.7
Statistics on the State Transport Department of Arunachal Pradesh
Sl. No. Indicator Unit Operational Statistics
2001-02 2002-03 2003-04 2004-05 2005-06(L.E.) Estimate
1 Bus Route Coverage Nos. 147 147 148 - -
2 Distance Bus Route Coverage Km/bus/day 95 82 86 87 -
3 (a) Passenger kms Scheduled Lakh km - 157 154 153 -
(b) Passenger kms Operated Lakh km 67 69 73 72 74
4 Strength of Bus Fleet (at end of year) No. of buses 226 233 236 238 242
5 (a) Occupancy Ratio Per cent - 47 54 48 -
(b)Break Even Occupancy Lakh litre - 84 84 85 -
6 Traffic receipt Rs. (lakh) 754 705 691 - -
7 Bus Fleet Utilisation Per cent 67 65 68 67 66
8 Operational Expenditure Rs. (lakh) 1659 2600 2032 - -
9 Working Loss Rs. (crore) - 14.17 26.38 20.17 -
10 Fuel Efficiency HSD (litre)/km 3.15 3.10 3.40 3.14 3.15
11 Tyre Efficiency km 28000 28000 35000 - -
12 Bus Stations Nos. 12 12 13 13 -
13 Railway Out Agency Nos. 5 5 4 - -
14 Average Daily Passengers Carried Nos. 5479 5027 6275 - -
15 Average Buses on Road on a given Day Nos. 195 141 162 - -
16 Total Passengers Carried Nos. (lakhs) 21 22 22 27 23
17 Load Factor Per cent 52 47 43 53 54
18 (a) Average Revenue Rs. per km - 10.91 10.92 10.34 -
(b) Average Expenditure Rs. per km - 26.02 25.83 33.36 -
(c) Loss per km Rs. per km - 15.83 15.54 23.02 -
19 Bus Staff Ratio (on fleet operated) 4.48 5.40 4.35 5.02 5.08
20 Accidents Occurred Nos. 9 2 8 4 0
21 Persons Injured Nos. 21 0 0 0 0
22 Persons Killed Nos. 3 3 1 2 0
23 Total Staff Nos. 853 802 802 802 812
24 Staff Productivity Km/worker/day 21.56 24.56 24.93 24.25 33.26
25 Total Operating Revenue Rs. (crores) - 6.97 6.91 7.17 -
26 Total Operating Expenditure Rs. (crores) - 17.29 29.11 22.80 -
Note: The average life assumed of each of the buses is seven years and 1.35 lakhs in kilometres.
Source: Arunachal Pradesh State Transport Services Department, Review of Performance and assessment of financial resources of Arunachal Pradesh StateTransport for the Annual Plan 2005-06, Economic Review and Statistical Abstract of Arunachal Pradesh, 2004.

279Chapter 19 • TRANSPORT AND INFRASTRUCTURAL DEVELOPMENT
cater to peak demands, and intermediate transport to off-
peak hour traffic. This would avoid duplication of routes
and help in generating revenue and efficiency for both.
Freight Movement
The number of trucks and lorries has nearly doubled in
the past 10 years and are known to cause heavy
congestion on the highway stretches resulting in both
delays and safety hazards. This calls for widening of the
major roads in the State and regulations allocating
appropriate times and routes for plying of freight trucks.
Railways
For many years now, the status of railways in Arunchal
Pradesh has been at a standstill, with the state having a
negligible 1.26 km of metre guage railway line. This line
forms a part of the 34.04 km Balipara-Bhalukpong metre
guage section of the North with Bhalukpong being the
terminal point in Arunachal Pradesh. Table 19.8 gives a
state-wise description of railways in the north-eastern
region. Of the total 2453 km of railway route in the
north-eastern region, almost 2392 km lies in Assam itself.
TABLE 19.8
Railways in North-eastern Region—State-wiseDisposition (km)
State Broad Guage Metre Guage Total
Arunachal Pradesh - 1.26 1.26
Assam 1061.29 1330.47 2391.76
Tripura - 44.72 44.72
Nagaland 7.63 5.22 12.85
Manipur - 1.35 1.35
Mizoram - 1.50 1.50
Total 1068.92 1384.52 2453.44
Source: Perspective Transport Plan for North-Eastern Region (2003).
Work is currently in progress to construct new railway
lines in Arunachal Pradesh, for example the alignment
from Bedati to Itanagar (45 km), for which survey has
already been taken up (MoR, 2004). In 2007, the
Government of India decided to construct new railway
lines from Harmoti to Naharlagun which the survey is
being conducted and work has already been started.
According to the Perspective Transport Plan for North-
Eastern Region (2003) the cost of rail construction in the
region is higher at Rs.7-8 crores per km for the single
lane due to undulating terrain and rivers as compared to
plain areas (approximately Rs.3 crores per km of single
line and Rs. 5 crores for double line). This together with
insufficient travel demand makes the viability of railways
in the State difficult.
Water Transport and Ropeways
According to the Resource Atlas on Arunachal Pradesh
(1999), the State consists of five well-delineated river
systems—the Kameng, Subansiri, Siang, Dibang and
Lohit-Tellu, which form a part of the Brahmaputra system.
However, as far as inland navigation is concerned, it is
only viable in the southern plains of the State overlooking
the Brahmaputra river (Gopalakrishnan, 1994). Currently
some small-scale ferry services are in operation, carried
out mostly by private operators but no planned effort has
been made at developing an efficient means of water
transport system in the State. In fact, no budgetary
allocations have been made to this sub-sector (Table
19.9). In the NE region, only Assam has made some
progress in this region due to its geographical advantage.
Interaction with the State officials revealed that despite
geographical limitations, there is potential to develop
water transport systems at certain points in the medium
to long term for both passenger and freight movement.
This would not only be an environmentally friendly mode
of transport but also help in revenue generation for the
State. In 2000, the Directorate of Transport, Government
of Arunachal Pradesh, presented a proposal to the State to
streamline the water transport system for all navigable
rivers, swamps and lakes in the State.12 Such initiatives
need to be pursued more actively. Further investigations
and surveys need to be carried out to determine suitable
river stretches, potential travel demand of people and
cargo, technology options, development of terminal and
storage facilities, and fiscal incentives for infrastructure
development.
Ropeways are another transportation option in the
State, especially in locations where the cost of providing
roads or other means cannot be justified by the demand.
However, the safety concerns associated with ropeways
cannot be overlooked and technology options need to be
well planned before this option is developed further.
Civil Aviation
Arunachal Pradesh is only one of the few states in
India which does not have any functional airport. In 1995
only the Government of India decided to run Pawan Hans
Helicopter Services in Arunachal Pradesh on commercial
12. Notification No. TPT(B)16/97 dated Itanagar, the 3rd August 2000.

ARUNACHAL PRADESH DEVELOPMENT REPORT280
visits. The decision was a consequence of the limited
scope of surface transportation development and the need
to create a quick link between the capital and
administrative centres in various districts. Initially, Pawan
Hans Helicopter Services were started on two routes13 and
subsequently extended to other locations to be availed on
emergency situations like rescue operations during
roadblocks, landslides, etc., and rendering services to
government officials.
Presently there are 85 helipads, 11 advanced landing
grounds (ALGs) for transporting passengers and goods for
operation of Pawan Hans helicopter services and Army
sortie services (Draft Annual Plan, 2005-06).
Despite the emphasis on the improvement and
upgradation of ALGs in the Tenth Plan, the sector is
saddled with financial constraints. During the 9th Plan,
six airports (Itanagar, Pasighat, Ziro, Tezu, Along and
Daporizo) were identified in Arunachal Pradesh for
construction, but no major progress has been reported.
However, under the package announced by the Prime
Minister in 2000, fuel price and tax concession were
offered to encourage internal air services within the north-
east region (State Development Report for Assam).14 In
the light of this, some progress is expected in developing
civil aviation infrastructure in the region. There have been
recommendations to make Guwahati the central hub of air
transport for air connectivity with other Indian states and
perhaps also capitals of neighbouring countries.
Air connectivity with Arunachal Pradesh is vital not
only for strategic reasons but also for developing the
state’s economy and thriving tourism. Recently,
Government of India has decided for a greenfield airport
in Itanagar. The consultant appointed by Airport
Authority of India has submitted a Detailed Project
Report (DPR). The cost of the Project has been indicated
Rs.515.17 crore. The report is being reviewed. Table 19.9
throws light on the annual plan allocations for the State,
which indicate a slight decline in the overall share of the
transport sector in the past few years.
Telecommunications
Apart from people’s access to general telephony, the
benefits of good telecommunication facilities could be
realised through specific applications in sectors such as
agriculture, education, health care, and transport. The
remoteness of the region has affected the development of
the telecom sector in the State.
TABLE 19.9
Arunachal Pradesh-Annual Plan Allocations (lakh Rs.)
Sector 10th Plan Annual Plan 2002-03 Annual Plan 2003-04 2004-05 2005-06Projected Outlay
Revised Expenditure Revised Expenditure Revised ProjectedOutlay Outlay Outlay Outlay
1. Civil Aviation 1386 310 264.76 310 285.24 310 366
2. Roads & Bridges (a+b) 78898 9999 11899.27 12333.33 13119.44 10482.08 16868.50
a. Rural Roads 22090 568.79 568.83 2892.91 2388.86 899.32 3263.50
b. PWD Roads 56808 9478.31 11330.44 9466.42 107.30.58 9582.76 13605
3.Roads Transport 1982.40 450 373.76 450 420.5 450 531
4.Inland Waterways 0.0 0.0 0.0 0.0 0.0 0.0 0.0
5. Other Transport (c+d) 175.56 44 44 44 43.70 44 360
c. Directorate of Transport 138.60 35 35 35 34.70 35 50
d. Road Safety 36.96 9 9 9 9 9 310
6.Communications 0 0 0 0 0 0 0
Total (1 to 6) 82442 10803 12582 13163 13137 11286.08 18125.50
Total Budget allocation to the State - 67600 - 72300 - 75542 121212
Transport share as a %age - 16 - 16 - 15 15of the total state budget
Source: Draft Annual Plan (2005-06).
13. Naharlogan-Guwahati and Naharlogan-Mohanbari.
14. http://planningcommission.nic.in/plans/stateplan/sdr_assam/sdr_assch5.pdf; accessed on 20.10.2005.

281Chapter 19 • TRANSPORT AND INFRASTRUCTURAL DEVELOPMENT
Presently the north-eastern telecom circle has been
bifurcated into two circles:
1. NE-I Telecom Circle with its headquarters at
Shillong and comprising three telecom districts
Tripura, Meghalaya and Mizoram.
2. NE-II Telecom Circle with its headquarters at
Dimapur and comprising three telecom districts
Nagaland, Manipur and Arunachal Pradesh.
The north-east falls in the C’Circle of cellular phone
services in India, where there are three players operating
namely, Reliance Telecom, Bharti Cellular and BSNL. So
far, BSNL was the only player in Arunachal Pradesh. Now
some private companies such as Airtel and Aircel have
started their operation in the State. The State itself is
divided into eight telecom sub-divisions namely Itanagar,
Naharlagun, Bomdila, Tezu, Pasighat, Anini, Khonsa and
Changlang. Teledensity, defined as the number of
telephones per 100 persons is used to evaluate the tele-
penetration in any region. The summary of status of
teledensity and other parameters in Arunachal Pradesh is
given in Table 19.10.
TABLE 19.10
A Summary of the Current Status of theTelecom Sector in Arunachal Pradesh
Population
Urban Rural Total
222688 868429 1091117
Telephone connections as on 31.08.2005 29920 27056 56976
Mobile connections as on 31.08.2005 17381 4383 21764
WLL connections as on 31.08.2005 4145 294 4439
Teledensity as on 31.08.2005 23.1 3.65 7.62
Number of exchanges 13 88 101
Total exchange connection capacity 38300 44468 82768
Mobile connection capacity 21711 16527 38238
Source: Department of Telecommunications, Arunachal Pradesh (2005).
Compared to the all India status of teledensity—31.13
per cent in urban, 1.94 per cent in rural, and 9.86 per
cent in aggregate,15 the State appears to be doing well.
This, however, does not say anything about the locations,
accessibility and quality of services provided.
Table 19.11 gives the status of internet services in the
north-east region in the years 2002 and 2004. Clearly the
penetration of such services needs to be improved. There
exists a plan to lay optical fibre cables in Arunachal
Pradesh along with improved satellite connectivity.
Besides the existing telecom network, an additional police
telecommunications network exists which not only caters
to the needs of the State government and civil
administration (60 per cent of the total traffic share
belongs to this category) but also renders services to
other government departments like Public Works
Department (PWD), District Rural Development Agency
(DRDA), health, and education. It also carries out works
in remote areas, in absence of any public facility for
communication, and during times of natural calamities,
fire accidents and other exigencies.16 According to the
Economic Survey 2004-05 (MoF, 2005), Arunachal
Pradesh was not a recipient from the Universal Service
Obligation (USO) Fund (based on a 5 per cent levy on
adjusted gross revenue of telecom companies), created to
ensure provision of services at minimum costs in rural
areas through a system of open bidding. However, this
may change. Under the Bharat Nirman Programme of
providing Village Public Telephone (VPT) in over 60,000
revenue villages in India by 2007, 1074 villages in
Arunachal Pradesh have been identified for providing VPT
services by November 2007.17
TABLE 19.11
Internet Service in North-east India
Year onYear Growth
2002 2004 (%)
No. of % of Total No. of % of TotalSubscribers Subscribers Subscribers Subscribers
Arunachal Pradesh 380 0.01 1010 0.03 165.79
Assam 9899 0.31 14440 0.41 45.87
Manipur 630 0.02 1026 0.03 62.86
Meghalaya 1455 0.04 5285 0.15 263.23
Mizoram 743 0.02 959 0.03 29.07
Nagaland 452 0.01 2536 0.07 461.06
Sikkim 928 0.03 965 0.03 3.99
Tripura 816 0.03 1194 0.03 46.32
Source: Indian Telecommunication Statistics 2004, Ministry ofCommunications and IT, Department of Telecommunications,Government of India.
Remoteness and the scattered population, the lack of
adequate power supply and adequate voltage to run
telephone exchanges, and inadequate trained manpower
15. http://www.trai. gov.in/recom3oct05.pdf; accessed on 30.11.2005.
16. http://arunpol.nic.in/home/police_ tele.htm: accessed on 25.10.2005.
17. http://pib.nic.in/archieve/others/2006/may2006/upa_gov_20060521 /UttarPradesh.pdf; accessed on 10.07.2006.
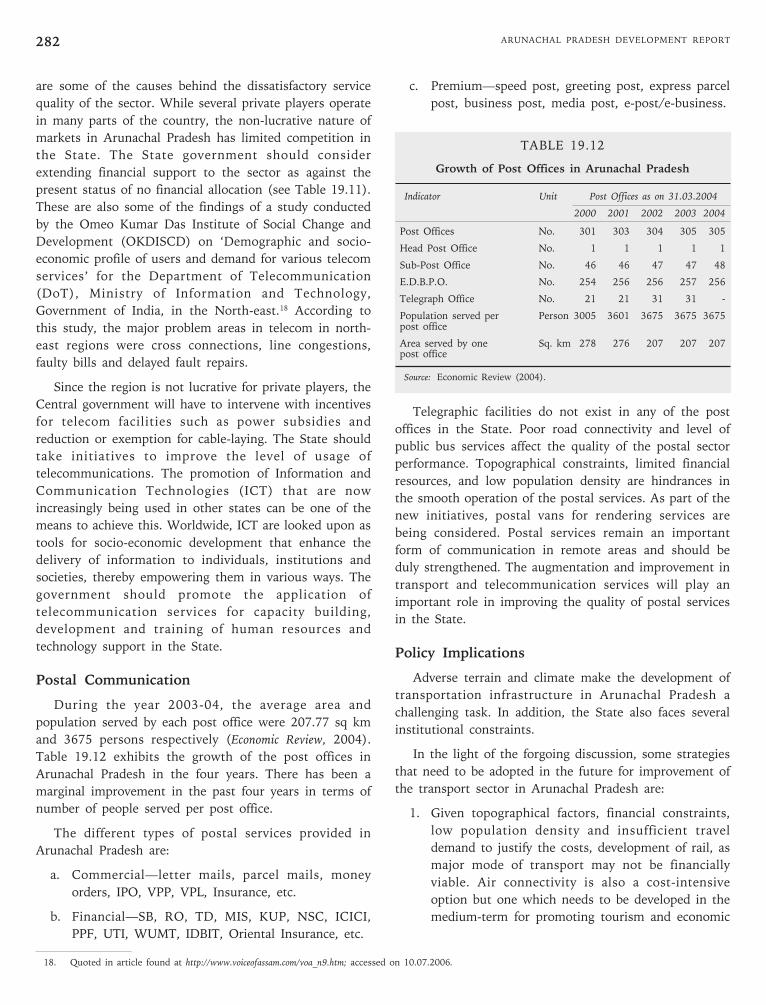
ARUNACHAL PRADESH DEVELOPMENT REPORT282
are some of the causes behind the dissatisfactory service
quality of the sector. While several private players operate
in many parts of the country, the non-lucrative nature of
markets in Arunachal Pradesh has limited competition in
the State. The State government should consider
extending financial support to the sector as against the
present status of no financial allocation (see Table 19.11).
These are also some of the findings of a study conducted
by the Omeo Kumar Das Institute of Social Change and
Development (OKDISCD) on ‘Demographic and socio-
economic profile of users and demand for various telecom
services’ for the Department of Telecommunication
(DoT), Ministry of Information and Technology,
Government of India, in the North-east.18 According to
this study, the major problem areas in telecom in north-
east regions were cross connections, line congestions,
faulty bills and delayed fault repairs.
Since the region is not lucrative for private players, the
Central government will have to intervene with incentives
for telecom facilities such as power subsidies and
reduction or exemption for cable-laying. The State should
take initiatives to improve the level of usage of
telecommunications. The promotion of Information and
Communication Technologies (ICT) that are now
increasingly being used in other states can be one of the
means to achieve this. Worldwide, ICT are looked upon as
tools for socio-economic development that enhance the
delivery of information to individuals, institutions and
societies, thereby empowering them in various ways. The
government should promote the application of
telecommunication services for capacity building,
development and training of human resources and
technology support in the State.
Postal Communication
During the year 2003-04, the average area and
population served by each post office were 207.77 sq km
and 3675 persons respectively (Economic Review, 2004).
Table 19.12 exhibits the growth of the post offices in
Arunachal Pradesh in the four years. There has been a
marginal improvement in the past four years in terms of
number of people served per post office.
The different types of postal services provided in
Arunachal Pradesh are:
a. Commercial—letter mails, parcel mails, money
orders, IPO, VPP, VPL, Insurance, etc.
b. Financial—SB, RO, TD, MIS, KUP, NSC, ICICI,
PPF, UTI, WUMT, IDBIT, Oriental Insurance, etc.
c. Premium—speed post, greeting post, express parcel
post, business post, media post, e-post/e-business.
TABLE 19.12
Growth of Post Offices in Arunachal Pradesh
Indicator Unit Post Offices as on 31.03.2004
2000 2001 2002 2003 2004
Post Offices No. 301 303 304 305 305
Head Post Office No. 1 1 1 1 1
Sub-Post Office No. 46 46 47 47 48
E.D.B.P.O. No. 254 256 256 257 256
Telegraph Office No. 21 21 31 31 -
Population served per Person 3005 3601 3675 3675 3675post office
Area served by one Sq. km 278 276 207 207 207post office
Source: Economic Review (2004).
Telegraphic facilities do not exist in any of the post
offices in the State. Poor road connectivity and level of
public bus services affect the quality of the postal sector
performance. Topographical constraints, limited financial
resources, and low population density are hindrances in
the smooth operation of the postal services. As part of the
new initiatives, postal vans for rendering services are
being considered. Postal services remain an important
form of communication in remote areas and should be
duly strengthened. The augmentation and improvement in
transport and telecommunication services will play an
important role in improving the quality of postal services
in the State.
Policy Implications
Adverse terrain and climate make the development of
transportation infrastructure in Arunachal Pradesh a
challenging task. In addition, the State also faces several
institutional constraints.
In the light of the forgoing discussion, some strategies
that need to be adopted in the future for improvement of
the transport sector in Arunachal Pradesh are:
1. Given topographical factors, financial constraints,
low population density and insufficient travel
demand to justify the costs, development of rail, as
major mode of transport may not be financially
viable. Air connectivity is also a cost-intensive
option but one which needs to be developed in the
medium-term for promoting tourism and economic
18. Quoted in article found at http://www.voiceofassam.com/voa_n9.htm; accessed on 10.07.2006.

283Chapter 19 • TRANSPORT AND INFRASTRUCTURAL DEVELOPMENT
growth. For the present, the thrust should
therefore, continue to remain on the improvement
and development of a basic road network, including
the national highway.
2. Public transport and intermediate transport services
need to be made more efficient. A functional, well-
regulated and integrated public transport system of
buses and private light vehicles should be
developed to provide easy mobility to people, at the
same time addressing road safety and
environmental concerns. Introducing competition,
profitable schemes and imparting manpower
training and skills to different levels of service
providers is also recommended to help the State
Transport Department overcome its operational and
financial difficulties.
3. In the long-run, the thrust of transport
development in the State should be based on the
utilisation of locally available natural resources and
manpower. Wherever possible, the potential of
water transport needs to be exploited. Further in-
depth studies should be carried out to examine the
feasibility of the option.
4. At the institutional level, different administrative
units need to come together on one platform and
formulate an integrated transport policy, wherein
their roles and contributions are clearly defined.
More autonomy needs to be given to the two
transport departments in terms of functioning and
decision-making.
5. The financial and budgetary allocations for the
transport sector in the State needs to be revisited in
accordance with the new and emerging needs. Work
on proposals such as weigh bridges, inland
waterways, and ropeways should be accelerated.
6. Finally, the data base on the transport sector needs
to be strengthened. This includes conduction of
traffic, geographical and household surveys to
understand travel needs, behaviour and possibilities.
The inconsistencies and gaps in existing datasets
should also be addressed.
7. Adequate attention needs to be given to the
provision of an institutional infrastructure especially
for market institutes. The institutional rigidities in
Arunachal Pradesh often inhabit the emergence of
factor markets (Human Development Report,
Chapter 8). Hence, it is necessary to develop the
institutional infrastructure along with physical
infrastructure for rapid economic development of
the State.
Introduction
Arunachal Pradesh requires a great deal of science and
technology (S&T) input for sustained development and
for improving the quality of life of its people. The present
status of S&T including research and development (R&D)
and the input needed for the overall development of the
State have been covered under the following heads:
• Information technology
• Biotechnology
• Telemedicine
• Tele-education
• Bamboo technology
• Biodiesel production
• Medicinal plants
• Establishment of an Arunachal Pradesh Institute of
Science, Technology and Environment (APISTE).
Information Technology
Arunachal Pradesh has so far established 55 CICs,
which are disseminating information on agricultural
market status, government schemes, air and railway
reservation, examination results, job opportunities,
election, etc., and are generating computer awareness.
The State should take full advantage of the scheme,
expand it to the fullest for wider coverage and educate the
people to benefit from it. There is also a GoI scheme to
develop processing and exchange of software in local
languages so that the benefits of IT can be brought to the
doorsteps of the masses. The State should keep itself
posted so that it is not left out of the culture of IT. The
nic.in website has already incorporated information on
sectors like agriculture, governance, orchids, forestry,
demography, geography, economy, job market, etc.
ARUN
ACH
AL PR
ADESH
Chapter 20
Science and Technology
However, many people do not yet seem to be IT savvy
and the gap has to be bridged by IT education and
training.
There are abundant international examples of the
effective use of kiosk technology to deliver government
information and services to the people. Many countries
where personal computer systems are not very popular,
have found it effective to establish multipurpose
community telecentres (Kiosks).
These, of course, need skilled and knowledgeable
human intermediaries to help the people in collecting
information. Gradually, the users get IT-literate and their
dependence on intermediaries reduces. A database on
agricultural and bio-resources of the State can be
developed for policy planning, trend analysis and
forecasting in these areas.
Apart from the public kiosks, to create widespread ICT
literacy and affinity for e-knowledge, the government
will have to make provisions for people to have computer
systems and Internet connectivity at affordable price.
Special schemes can be operated to spread PCs to as many
households as possible. This will lead to the spread of an
actual e-revolution with e-governance, e-banking, e-
shopping, e-medicine, e-education, e-entertainment, etc.
Digital Libraries and Traditional Knowledge Digital
Libraries: The Council of Scientific and Industrial Research
(CSIR) through its National Institute of Science
Communication and Information Resources (NISCAIR)
has established traditional knowledge digital libraries
(TKDL) to—as the name implies—digitalise traditional
knowledge available in the various societies in the country
to make it patent compatible. For this, a local unit of
TKDL connecting the central TKDL is essential. The
genetic (mt DNA-based) information about the ethnic
population in the State should also be preserved in TKDL-

ARUNACHAL PRADESH DEVELOPMENT REPORT286
ArP. The State will have to prepare and implement a
scheme for organising digital libraries at the community
level or in the village markets.
The government should formulate a comprehensive IT
policy like Assam to achieve the following:
• to accord primacy for the growth of information
technology industry in the state,
• to accelerate the use of information technology at
the government level with a view to providing
better services to the people of the state,
• to improve productivity and efficiency of the
government services to the people of the state,
• to serve as an important tool to enhance
employability as well as to absorb a major portion
of the educated unemployed in the state,
• to enable the state to reach an eminent position in
the information technology sector,
• to encourage and accelerate the growth of both the
domestic and the export-oriented IT units in the
state,
• to make the state an attractive destination for IT
investment from the rest of India and abroad, and
• to accelerate the use of information technology in
schools, colleges and educational institutions in the
state to enable the youth to acquire necessary skills
and knowledge in this sector making them highly
employable.
The government should also set up an Information
Technology Task Force under the Chairmanship of the
Chief Minister to review the implementation of the IT
policy. The policy should also aim to introduce IT literacy
in schools and colleges with basic courses designed to
provide employment opportunities in IT-enabled services.
BPO: In order to generate employment, training for
BPO or call centres may also be organised by the
Government for the youth of the State. Some model BPOs
may be opened through NGOs or through collaborative
schemes with private business houses. Gradually,
manpower can also be trained on software development
since this has a large worldwide market.
A Centre for Bioinformatics should also be established.
The Centre for Bioinformatics can also form a part of the
proposed Arunachal Pradesh Institute of Science,
Technology and Environment (APISTE), or the existing
arrangement of State Level Coordination for Biotechnology
Research and Development at SFRI, Itanagar.
Biotechnology
Considering the rich potentiality of the State and
keeping in view the urgency of conserving depleting bio-
resources and sustainably developing the same for
improving the socio-economic conditions of the rural poor
in the following thrust areas that require biotechnological
intervention—especially collection and selection of elite
germplasm, crop improvement and application of plant
tissue culture for mass propagation of quality planting
materials—have been identified:
• Agricultural crops,
• Horticultural crops,
• Floricultural crops including orchids,
• Medicinal and aromatic plants,
• Forestry—timber and non-timber species, and
• Sericulture.
Agricultural Crops
Important areas where biotechnology can help in
agriculture are:
• Development of high-yielding varieties of crops—
cereals, pulses and oil seeds with stress tolerance to
moisture, water logging, low temperature for hills,
pest and diseases,
• Development of micropropagation protocols for
selected elite clones for large-scale production and
distribution to farmers,
• Development of bio-fertilisers and biological control
of pests and diseases, and
• Application of genomics for molecular
characterisation of plants species, transgenic,
molecular breeding, etc.
The research establishments of the State in
collaboration with the Agriculture Department should
carry out research programmes on both field crops in use
and wild varieties and carry out selection, screening and
development applying biotechnology on the selected ones
and transfer the technology to the farmers and industries.
Further, with the organic food products gaining
importance all over the world and the traditional
agriculture in Arunachal Pradesh especially prevalent in
the Apatani Valley being considered as one of the
efficiently-managed systems of organic agriculture, such a
model should be propagated throughout the State.
Horticulture
Conventional horticultural crops like apple, banana,
guava, jackfruit, orange, pear, peach, pineapple, etc., need

287Chapter 20 • SCIENCE AND TECHNOLOGY
the following R&D interventions through biotechnological
approaches:
• Collection, selection, breeding and improvement of
indigenous fruits, vegetables and plantation crops
for both hills and plains of the region with a focus
on the production of high-yielding, disease- and
pest-resistant varieties,
• Clonal selection and development of package and
practice for cultivation/plantation activities,
• Application of tissue culture technology for large-
scale production and distribution of quality planting
materials of fruit and vegetable crops,
• Promoting organic farming and certification, and
• Development of post-harvest technology, improving
shelf life and value addition.
Floricultural Products Including Orchids
Under this programme, required biotechnological
interventions are:
• Germplasm collection, both native and exotic,
selection, breeding, plant improvement, and
isolation of superior clones/varieties of hybrids with
high-yielding, attractive vase quality, colour, shape,
longevity of bloom that are resistant to pests and
diseases,
• Tissue culture, induction of polyploidy, soma
cloning, protoplast fusion, production of haploids
through another culture, adopting molecular
approaches for improvement, etc.,
• Development of micropropagation protocols,
hardening and distribution of quality planting
materials,
• Mycorrhyzal studies and development of protocols
for biological hardening and improvement of tissue
cultured orchid plantlets,
• Development of cost-effective polyhouse or
greenhouse technology for the production of
disease-free quality flowers of selected clones, and
• Post-harvest technology to increase shelf life and
retain freshness.
In vitro multiplication of orchids is now a proven
technique and is a routine work in many laboratories
within the country and abroad. Micropropagation of
orchids would be facilitated through the establishment of
a few tissue culture laboratories across the State. Such
laboratories can be established both in public and private
sectors. In favourable climatic conditions, floritech villages
could be established promoting orchid farming in various
districts where communication is easy. These will open up
a new and wide marketing channel joining the region to
potential markets of the world.
Medicinal and Aromatic Plants (MAP)
Micropropagation protocols have been developed on
some important medicinal plants (Nandi et al., 2002) and
pharmaceutical industries like Dabur India have taken up
large-scale propagation of selected medicinal plants
adopting tissue culture technique. Further work, however,
is needed to develop protocols in vitro, micro-propagate
elite clones and undertake field trials and assess the
biochemical composition of the active compounds useful
in pharmaceutical industries on commercially important
medicinal plants like Andrographis paniculata, Coptis teeta,
Taxus buccata, Eleocarpus ganitrus, Gymnema sylvestris,
Gymnademia orchidis, Panax ginseng and other species of
Aconitum, Acorus, etc., besides, some aromatic plants like
Geranium, Citronella, Cymbopogon and Pachouli.
Arunachal Pradesh maintains incomparable reserve of
aromatic and medicinal plants. Immediate collection,
conservation and sustainable utilisation of MAP are
expected to bring a rapid economic gain to the region.
Moreover, collection and marketing of secondary
metabolites may pave the way for economic betterment of
the people. In this regard, collection of germplasms and
their molecular characterisation may be taken up. This
would help conserve the local germplasms and avoid
patent controversy.
Forestry—Timber and Non-Timber Species
In order to replenish the vanishing woods and heal the
wounds of environmental damages done over the years,
there is an immediate need to take up genetic
improvement of useful multipurpose tree species and
their fast regeneration by adopting various
biotechnological means. Besides trees, there are non-
timber forest produces (NTFPs), traditionally known as
minor forest produces (MFPs) from which rural
communities derive their sustenance and livelihood.
Standardised techniques could immediately be adopted for
commercial production of NTFPs in the State.
However, further research is needed on micro-
propagation, somatic hybridisation especially for silica free
(for industrial point of view), and pest and disease-free
bamboo on commercially important and threatened
species. Similarly, there are some important cane species
in the region, on which research needs to be taken up.

ARUNACHAL PRADESH DEVELOPMENT REPORT288
Sericulture
It is essential to take up biotechnological works on the
sericultural aspects for cooler hill regions of Arunachal
Pradesh. The programmes would be breeding, genetics,
rearing, seed technology, egg production, entomology,
etc., in addition to improving agronomy and cultivation,
packages of suitable clones of selected species of Quercus
griffithii (for tasar) and Ricinus communis (for muga) through
biotechnological approaches. Extension and training to the
farmers would help boost the industry throughout the
State.
The State should also take up:
(1) DNA fingerprinting of local germplasms,
(2) Molecular identification of biocontrol agents,
(3) Conservation and sustainable utilisation of local
bio-resources and generation of income and
employment to usher in a new dawn. (Talukdar,
2005), and
(4) Awareness and income-generation programmes.
Institute of Biotechnology
An institute in the line of the Institute of Bio-resources
and Sustainable Development, Imphal, may be established
in Arunachal Pradesh also. Alternatively, this area can
form a part of the proposed Arunachal Pradesh Institute
of Science, Technology and Environment (APISTE).
Bioinformatics
Bioinformatics, which is the integration of biology, IT
and computer science, helps integrate, manage, analyse
and visualise genetical and biological information. The
area has gained in importance and a state like Arunachal
Pradesh should try to catch up with it.
Telemedicine
To be really useful in a state like Arunachal Pradesh,
telemedicine must reach the unreached rather than merely
enhancing the facilities of those who already have better
means of obtaining medical service. But, certain amount
of infrastructural facility is a prerequisite to a telemedicine
system. These include elementary hospitals with
investigation facilities, manpower and devoted doctors.
With advances in telecommunications, information
processing capability and miniaturisation of health
diagnostic equipment, it has become possible to deliver
immediate and effective health care to the masses.
Some of the other important areas that can be covered
by telemedicine are: tele-diagnosis, tele-pathology, tele-
radiology, tele-cardiology, tele-endoscopy, tele-
dermatology, tele-therapy, tele-psychiatry, tele-care, tele-
education, tele-research and tele-measurement. Patients’
smart cards should also be introduced.
Telemedicine Network
The first telemedicine centre of Arunachal Pradesh
came up in the General Hospital, Naharlugun, in 2004,
under the programme Providing Urban Facilities in Rural
Areas (PURA) sponsored jointly by ISRO, NEC and the
Government of Arunachal Pradesh. It links the medicos of
the State to these in other states. The Second Centre of
telemedicine was established recently in the Ramakrishna
Mission Hospital, Itanagar. Tawang and Bomdila will be
taken up subsequently.
Centres of telemedicine are proposed in the eight
districts of the State but the names of the districts have
not yet finalised and this will depend totally on the
feasibility condition. In order not to lag behind in this
extremely important area, the State should adopt a
telemedicine plan (Saikia, 2005).
Tele-education
Tele-education programmes will be highly relevant and
extremely useful for the masses in the State. Sparsely
distributed as it is in a large geographical area, many parts
of which are difficult to cover under normal education
dissemination mechanism, the tele-education system can
be useful through:
1. A SITE-like programme,
2. Other television programmes designed specifically,
3. Internet with the help of
(a) Community Centres, and
(b) Home PCs.
• The Space Application Centre, North-east (SAC-
NE) may be specifically requested to design and
implement such a programme,
• The scope of the tele-education in the State
should include literacy drive, to career education
and to technology transfer,
• Vocational and community education must also
be included,
• Programmes must be developed for the
community on health, hygiene, nutrition,
agriculture, cottage industry, hazard mitigation,
environmental education, etc.,
289Chapter 20 • SCIENCE AND TECHNOLOGY
• Apart from the programmes of University Grants
Commission and the Education Technology
Centre, which can also be oriented to cater to
the needs of the State, collaborative schemes can
also be taken up with the National Institute of
Open Schooling.
Since language may be a barrier for the learners,
programmes in local languages/dialects will also have to
be developed for the various communities. Tele-education
units may be established at convenient locations in the
communities where expert guides will browse, search and
assist the interested registered learners in collating
information and educational materials.
Tele-education can also include activities under a well-
designed computer literacy programme by linking selected
educational institutes of the State with core centres like
IIT-Guwahati. IGNOU programmes can also be made
available to the target audience.
The educational satellite EDUSAT was launched on 20
September 2004 by the Indian Space Research
Organisation with the sole aim of disseminating education
to various levels of the Indian society through the ‘two-
way virtual classroom’ approach. Apart from the pre-
school, school, college and higher education, these
programmes may be extended to cover non-formal
education and developmental communication. Arunachal
Pradesh should also gear itself up to acquire these
facilities.
Bamboo Technology
Bamboo Mission
Considering the importance of bamboo in the economy
of the rural areas and the abundant resources available
within the country which is next only to China, Planning
Commission, Government of India, has launched a
National Mission on Bamboo Development for
employment generation, livelihood security and
environmental upgradation. Raising bamboo plantations
and regeneration of bamboo growing areas for consistent
supply of bamboo is the key to the growth and
development of this sector.
To be useful, logistics have to be ensured, local people
will have to be trained, their participation has to be
encouraged right from the beginning of raising of
plantations. Interests of the population have to be
sustained by undertaking extension and publicity works in
its proper perspective.
To meet these objectives it is essential to take up
extensive plantation programmes systematically in a
phased manner in tune with the objectives of the National
Mission for Bamboo Development.
Plantation activities will be taken up in various
locations. Community participation is crucial in successful
implementation of the policy through JFM model and also
as horticultural crops in farm lands. Plantation of bamboo
will require prioritisation of species based on industrial
demand.
Bamboo Resource
In spite of much potential for bamboo resources in the
State, it is observed that bamboo has depleted at an
alarming scale. A reliable strategy to ensure sustained
availability of bamboos for extensive use is the need of
the hour.
The strategies which are proposed for mass production
of bamboo and bamboo products are:
(i) Identification and study of important and useful
genotypes,
(ii) Mass-propagation of desired and improved
genotypes,
(iii) Standardisation of cultural practices,
(iv) Resource assessment and conservation,
(v) Genetic improvement,
(vi) Sustainable management of natural habitats,
(vii) Development of plantation technology,
(viii) Pests, diseases and post-harvest studies,
(ix) Development of harvesting technology,
(x) Socio-economic aspects of resource production
and management, and
(xi) Resource utilisation: Specific issues to be
addressed are properties and product relationship,
shoot utilisation for curry and pickles. It requires
R&D to include more species, proper
preservation, elimination of toxic chemicals, etc.
Use of the individual bamboo species is related to their
individual structural composition, but a synoptic review
about the properties, processing, products and their
relationships would widen the scope of uses, for which
the following criteria may be involved in R&D work:
(a) Quality improvement,

ARUNACHAL PRADESH DEVELOPMENT REPORT290
(b) Product research and development including design
of tools,
(c) Technologies for small-scale enterprises,
(d) Socio-economic studies including women in
development,
(e) Marketing studies.
If these R&D activities are properly executed bamboo
will certainly become a green gold for the State.
Detailed schemes from cultivation to product
development are:
(1) Domestic use of bamboo around the farm,
(2) Commercial production for construction, food and
art, and
(3) Ornamental landscape and conservation uses.
(Hazarika, 2005).
Product Development
A multi-level approach is necessary to address the
problems of product development right from the source to
destination. Apart from afforestation schemes, it is vital to
establish links between the rural artisans and the urban
consumers through development agencies.
Entrepreneurship by professional designers would help
identify new product areas. These could be communicated
to artisans to produce contemporary items and the
generation of a sustainable source of income. Marketing
and export of bamboo products would require mass
production by organising artisans with small equipment
and facilities.
Action Plan for Bamboo Resources
Database and Value Addition
(1) A database for bamboo in the State has to be
established.
(2) Knowledge bank should be developed and skills
promoted.
(3) Degraded bamboo plantations should be
rehabilitated.
(4) Community management of bamboo sites should be
encouraged.
(5) Backyard bamboo plantation should be encouraged.
(6) R&D activities on bamboo—including post-harvest
technology, seasoning, durability and manipulability
enhancement, value addition, protection from
cracking splitting and discolouration, etc.—should
be taken up.
(7) Awareness and training programmes should be
taken up for rural population on value addition,
technology transfer, skill development, protection
measures (in case of bamboo flowering), etc., with
the help of on-site training programmes and/or ICT
centres (Kiosks).
Biodiesel Production
In view of the topographic disadvantages, and the
communication bottleneck that hinders other income-
generating activities, the State should pay high priority to
cultivation of plants with better prospects—like the
biofuel-generating plants. Gradually more and more areas
of wasteland may be utilised for cultivation of this plant
and similar plants like Pongamia sp. and Paradise tree.
Apart from generating biomass energy, it will lead to
increase in rural economic activities from the plant
products.
Efforts should be made to create conditions that
encourage participation of the private enterprises in the
establishment of agro-based industries like that based on
oil-bearing trees. In order to attract more and more
farmers to this new line of agriculture (i.e., biofuel-plant
cultivation) and to utilise more and more unutilised land
and wasteland, an incentive scheme should be introduced
by the State government.
Self Help Groups should be promoted for the sole
purpose of cultivation of biofuel generating plants. A sound
market-support system should also be worked out for this.
For integrated development of cultivation of oil-bearing
plants and production of biodiesel, an autonomous
biodiesel board should be constituted in the State.
In this context, emphasis may be given to the
following aspects to add a new vista for generation of
biofuel:
1. Survey to identify and assess potential of different
tree-borne oil seeds in the State,
2. Analytical studies on characteristic of oil seeds/oil
yield, composition of oil,
3. Agro-technology development of marked species
and post-harvest operation,
4. Development of processing technologies, viz.,
multipurpose decorticator, improvement of oil
recovery and enhancing the value, and utilisation by
catalytic cracking.

291Chapter 20 • SCIENCE AND TECHNOLOGY
The Government should also give incentive for
plantation of biodiesel trees under the Employment
Guarantee Scheme. With a practical plan, the State can
attain leadership position in this sub-area (Firodia, 2005).
Collaborative scheme should also be taken up on
commercial cultivation of biodiesel plants with
experienced companies like Godrej Agrovet Pvt. Ltd. in
line with the model of Mizoram. (The Telegraph, 2005).
Medicinal and Aromatic (M&A) Plants
The cultivation of medicinal and aromatic plants have
great potential for employment generation and economic
development for a state like Arunachal Pradesh as it
possesses enormous diversity of M&A plants and the eco-
climatic conditions favour its mass cultivation. Further,
the economic efficiency ratio of these medicinal plants is
observed to be several-fold higher than those of
traditional cash crops and horticultural crops (Maikhuri et
al., 1998). However, the following points need to be
emphasised prior to a large scale cultivation:
1. Documentation of indigenous agronomic practices
and use of medicinal plants followed by the
farmers,
2. Preservation of intellectual property rights (IPR) of
the traditional societies as they are the main
cultivators and conservers of medicinal plants,
3. Strengthening of traditional techniques of medicinal
plants cultivation through cost effective and
appropriate technology (i.e., polyhouses, vegetative
propagation, bio-composting, etc.),
4. Exploration of avenues for value addition to the
medicinal plant products and research into their
potential market demand,
5. Establishment of processing or semi-processing
units dealing with medicinal plant extraction and
manufacturing of indigenous medicines in remote
and far-flung areas so as to provide employment
opportunities to locals while enhancing cultivation
and reducing the pressure on natural resources,
6. Promotion of village marketing cooperatives for
diverse medicinal plant products so as to avoid
exploitation by middlemen,
7. Medicinal plants cultivation on restored lands could
be encouraged under the management action plans
to increase peoples’ participation and improve local
economy,
8. Organisation of regular farmers-to-farmers training
programmes on medicinal plants cultivation to train
and to make them more aware about medicinal
plant cultivation (Maikhuri et al., 1999).
It is important that from cultivation to product
(including value-added product) development of the
medicinal and aromatic plant, the facilities should be
confined within Arunachal Pradesh, so that at every step
of its production, employment avenues remain open to
the people of Arunachal Pradesh. Therefore, to earn
monopoly of some unique medicinal and aromatic plant
products, the government with the aid of universities and
research institutions, should identify some prominent
M&A plants which are not only endemic to the region,
but also have a good national and international market.
In order to fully convert the potential of the available
medicinal plants into economic wealth, a very active R&D
programme is essential on the following aspects:
1. Optimising the most appropriate parameters for
conservation, especially for endangered or endemic
species and molecular methods for characterisation,
2. Studies on taxonomy both in molecular and
chemical level,
3. Ecological studies related to conservation in vivo,
and
4. Post-harvest operation.
The search for new drugs of plant origin yielded
fruitful result in the past. In terms of a modern research
endeavour, drug development from plants must
necessarily imply a multi-disciplinary approach. In general,
natural products that have come into modern medicine
are the result of research. The emphasis of R&D should
be on the following:
i) Development of technology for bulk production of
medicinal products.
ii) Quality control for the starting materials as well as
for the finished products.
iii) Assimilation of acquired technology and its
continuous improvement to make the products
competitive.
iv) Studies on bio-equivalence, bio-availability and
pharmacokinetics.
v) Search for new plant sources for known drugs and
for new drugs from locally available plants.
A multi-disciplinary approach to drug development
from medicinal plants used in traditional medicine is
required and this includes:

ARUNACHAL PRADESH DEVELOPMENT REPORT292
(a) Economic mapping of the flora,
(b) Selection and authentication of plant species,
(c) Collection of ethno-medical and ethno-botanical
data,
(d) Trial propagation to develop high-yielding varieties,
(e) Medium-scale plant propagation,
(g) Chemical studies on plant constituents,
(h) Pharma-ecological and toxicological studies,
(i) Pilot plant scale processing of plant extracts,
(j) Standardisation of extracts, and
(k) Formulation studies on extract into dosage forms.
Apart from the traditional use, some of these
medicinal plants can be effectively used for commercial
and industrial activities. There is huge demand for these
plants from pharmaceutical, aromatic and cosmetic
industries located outside the region. A few such plants
include Pipli, Boch, Tamen, Taxus, Aconite, Kutki,
Ginseng, Lissi, Oroxylum, Garcinia, Dioscorea, etc. A few
other high value plants like Rauvolfia serpentina, Withania
somnifera, Gloriosa superba, Artemesia annua, etc., can be
easily introduced and grown in the State as some of the
initial trials conducted by the State Forest Research
Institute (SFRI) suggest their suitability. This institute has
also explored the possibility of plantation of medicinal
plants, taking advantage of their habit like trees, shrubs,
herbs or climbers. Such plantations can enhance the
productivity and frequency of economic returns.
Combinations for such plantations suitable for different
altitude have been worked out. The Regional Research
Laboratory has also made extensive investigation into the
development of agro-technology for farming. However, a
full documentation of medicinal plants of the state and
protocols for farming of each species are yet to be
developed.
Recently, enthusiastic farmers have taken up
cultivation of medicinal plants and 632 farmers have
enrolled themselves with the State Medicinal Plants
Board. The Department of Environment and Forest, the
Regional Research Institute (Ayurveda), the Regional
Research Laboratory (Branch of RRL-Jorhat) are engaged
in survey and trials on growing medicinal plants. But it is
also important to note that a few of the promising NGOs
are currently cultivating and seriously working on the
medicinal plants sector with a good performance. The
requirement for the planting material is met by the
Regional Research Institute (Ayurveda), the State Forest
Research Institute and the Regional Research Laboratory.
Priorities
The people of the State have a strong interest in
medicinal plants. The following points must be kept in
focus:
(i) The ethno-medicinal studies in the State should be
given due importance in order to set out a very
effective strategy for the discovery of more and
potentially useful chemical compounds. Their
identification and conservation also deserve careful
attention.
(ii) Medicinal plants should be given the status of
national resources as their sustained availability is
essential to sustain the local health traditions and
the ever-expanding herbal and pharmaceutical
industry.
(iii) Formulation of regulations to avoid indiscriminate
harvesting of medicinal plants from the wild.
(iv) Setting up raw drug processing units/industry.
(v) Developing buy-back policy for the benefit of the
cultivators (Arunachal Pradesh State Medicinal
Plants Board, 2002).
Arunachal Pradesh Institute of Science,Technology and Environment (APISTE)
For all-round development based on science and
technology, the State would do well to establish an
Institute of Science, Technology and Environment
(APISTE).
The objectives of the institute may be:
(1) To carry out research and development for
utilisation of the natural resources of the State,
(2) To generate scientific manpower by on-job training
and exposure,
(3) To provide scientific and technical inputs for
industries by way of
(a) Technical consultancy services
(b) Analytical and testing services
(c) Facilities of a well-equipped industrial research
institute including pilot plants to entrepreneurs,
and
(4) To undertake basic and exploratory research in
areas where the scientists of the institute are
capable of making significant contributions towards
advancement of knowledge.

293Chapter 20 • SCIENCE AND TECHNOLOGY
Although a thorough plan of the institute will have to
be worked out, some areas of interest of the institute may
be:
(1) Biodiversity—survey, conservation, utilisation
(similar to the Institute of Bio-resources and
Sustainable Development, Imphal),
(2) Minerals—gradation, utilisation, etc.,
(3) Medicinal and Aromatic Plants—survey,
conservation, adaptation, utilisation,
(4) Energy—conventional and non-conventional,
More areas like information technology, bioinformatics,
seismic surveillance, etc., can be added gradually
depending on the assessed needs. Moreover, the institute
will coordinate R&D and S&T activities relevant to the
State with other institutes of excellence.
The institute may be established afresh or can be
developed at an existing institute by building
infrastructure and recruiting expert manpower. The
immediate aim of such an institute will, of course, be the
development of local experts who contribute to the
application of science and technology to satisfy all local
needs.

Introduction
The cost of provisioning of public goods is relatively
high in Arunachal Pradesh. For example, the unit cost of
provisioning of merit goods like education and health
facilities is two and a half times that of the plain area
(Sarma and Nayak, 2006). However, the own resource of
the State to finance its budget is very low, and the State is
highly dependent on the central inflow. Thus, the
budgetary policy of the government is constrained by
limited resources on the one hand, and high unit cost of
supply of public and merit goods, on the other. The
economic reform process initiated by the Central
government in the beginning of the 1990s has also
constrained the State in terms of access to soft central
resources. This has resulted in bulging of the public debt
which reached 54 per cent of the GSDP in 2000-01
(EPWRF, 2004). Further, easy access to market borrowing
(after the implementation of 12th Finance Commission
Report) has refuelled the process, and as a result,
outstanding liability of the State as shown in the budget
of 2007-08 climbed to 80.06 per cent of GSDP. It is with
this background that the finance and fiscal issues of the
State have to be considered. The chapter proposes to
analyse:
(i) Broad budgetary trend;
(ii) Growth and changing composition of revenue;
(iii) Growth and changing structure of public
expenditure;
(iv) Growth and sustainability of public debt; and
(v) Policy options.
ARUN
ACH
AL PR
ADESH
Chapter 21
Fiscal and Financial Issues
Broad Budgetary Trend1
From 1993-94 to 2006-07, except the years 2000-01
and 2004-05, the State had surplus in revenue account
(Table 21.1). However, the fiscal deficits in all the years
were positive. The State had to borrow from different
sources to finance its budgetary needs. The revenue
surplus averaged more than 10 per cent of the GSDP
during 1993-2000. Then it turned negative in 2000-01 and
2004-05. In the subsequent years, the surplus became
very small. However, from the fiscal year 2005-06,
revenue surplus has been substantial (Table 21.1).
Thus, in the initial seven years of the period under
review, low fiscal deficit is maintained because of a high
revenue surplus. In the years subsequent to 1999-2000
the revenue surplus declined drastically and fiscal deficit2
widened. The committed liability of the past borrowing,
stood very high after 1999-2000, and the loan repayment
became the main reason behind the bulging fiscal deficit
of the State. Over the period: (i) revenue receipts as a
percentage of GSDP has declined, while revenue
expenditure as a percentage of GSDP increased, (ii) non-
developmental capital expenditure has increased while
developmental capital expenditure has declined in the
State. The implication of this trend is that, financing of
the non-developmental expenditure has been done by
curtailment of developmental expenditure. This method of
financing revenue expenditure refuels the growth of public
debt and adds to the fast growing interest payment and
thus to revenue expenditure growth (Sarma, 2000: 3126).
In Arunachal Pradesh, the same thing has happened, and
the process has led to a drastic reduction in revenue
surplus and rise in fiscal deficit.
1. Data on GSDP of the State at current prices with 1993-94 base is available from 1993-94 to 2004-05. Therefore, the deficit calculation as a percentage ofGSDP is limited to the period 1993-94 to 2004-05 only. From the period 2005-06 onwards, GSDP refers to the base 1999-2000. For the entire analysis thesource of data is Annual Financial Statement of various years as presented to the Legislature.
2. Fiscal deficit is the difference between revenue receipts plus non-debt capital receipts and total expenditure.
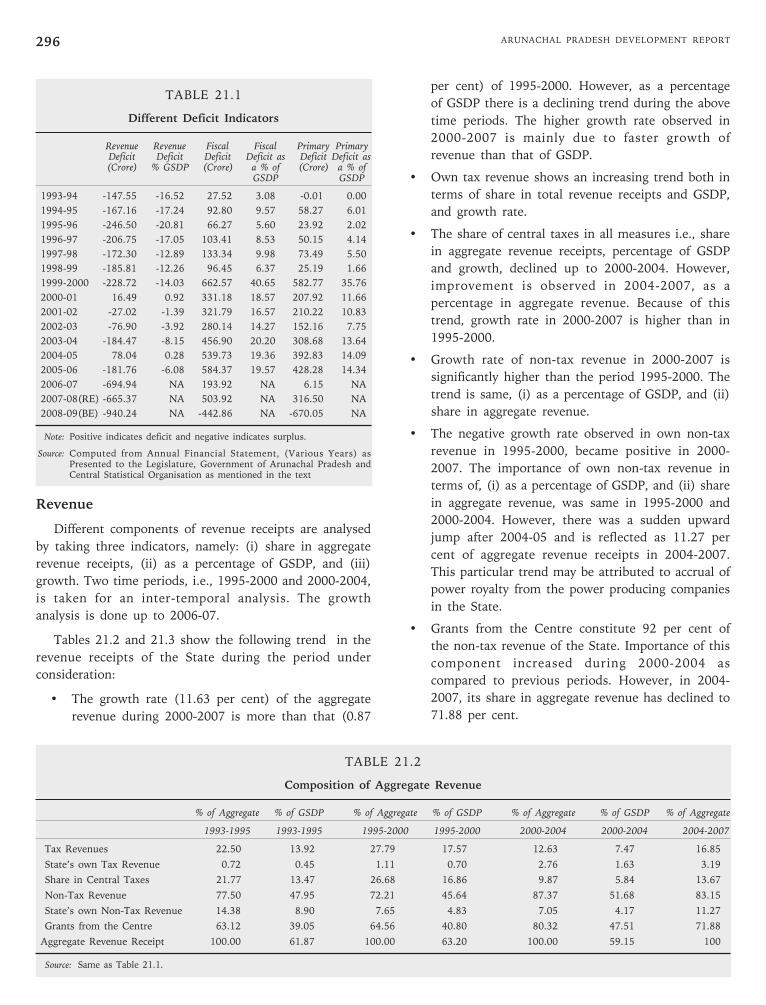
ARUNACHAL PRADESH DEVELOPMENT REPORT296
TABLE 21.1
Different Deficit Indicators
Revenue Revenue Fiscal Fiscal Primary PrimaryDeficit Deficit Deficit Deficit as Deficit Deficit as(Crore) % GSDP (Crore) a % of (Crore) a % of
GSDP GSDP
1993-94 -147.55 -16.52 27.52 3.08 -0.01 0.00
1994-95 -167.16 -17.24 92.80 9.57 58.27 6.01
1995-96 -246.50 -20.81 66.27 5.60 23.92 2.02
1996-97 -206.75 -17.05 103.41 8.53 50.15 4.14
1997-98 -172.30 -12.89 133.34 9.98 73.49 5.50
1998-99 -185.81 -12.26 96.45 6.37 25.19 1.66
1999-2000 -228.72 -14.03 662.57 40.65 582.77 35.76
2000-01 16.49 0.92 331.18 18.57 207.92 11.66
2001-02 -27.02 -1.39 321.79 16.57 210.22 10.83
2002-03 -76.90 -3.92 280.14 14.27 152.16 7.75
2003-04 -184.47 -8.15 456.90 20.20 308.68 13.64
2004-05 78.04 0.28 539.73 19.36 392.83 14.09
2005-06 -181.76 -6.08 584.37 19.57 428.28 14.34
2006-07 -694.94 NA 193.92 NA 6.15 NA
2007-08(RE) -665.37 NA 503.92 NA 316.50 NA
2008-09(BE) -940.24 NA -442.86 NA -670.05 NA
Note: Positive indicates deficit and negative indicates surplus.
Source: Computed from Annual Financial Statement, (Various Years) asPresented to the Legislature, Government of Arunachal Pradesh andCentral Statistical Organisation as mentioned in the text
Revenue
Different components of revenue receipts are analysed
by taking three indicators, namely: (i) share in aggregate
revenue receipts, (ii) as a percentage of GSDP, and (iii)
growth. Two time periods, i.e., 1995-2000 and 2000-2004,
is taken for an inter-temporal analysis. The growth
analysis is done up to 2006-07.
Tables 21.2 and 21.3 show the following trend in the
revenue receipts of the State during the period under
consideration:
• The growth rate (11.63 per cent) of the aggregate
revenue during 2000-2007 is more than that (0.87
per cent) of 1995-2000. However, as a percentage
of GSDP there is a declining trend during the above
time periods. The higher growth rate observed in
2000-2007 is mainly due to faster growth of
revenue than that of GSDP.
• Own tax revenue shows an increasing trend both in
terms of share in total revenue receipts and GSDP,
and growth rate.
• The share of central taxes in all measures i.e., share
in aggregate revenue receipts, percentage of GSDP
and growth, declined up to 2000-2004. However,
improvement is observed in 2004-2007, as a
percentage in aggregate revenue. Because of this
trend, growth rate in 2000-2007 is higher than in
1995-2000.
• Growth rate of non-tax revenue in 2000-2007 is
significantly higher than the period 1995-2000. The
trend is same, (i) as a percentage of GSDP, and (ii)
share in aggregate revenue.
• The negative growth rate observed in own non-tax
revenue in 1995-2000, became positive in 2000-
2007. The importance of own non-tax revenue in
terms of, (i) as a percentage of GSDP, and (ii) share
in aggregate revenue, was same in 1995-2000 and
2000-2004. However, there was a sudden upward
jump after 2004-05 and is reflected as 11.27 per
cent of aggregate revenue receipts in 2004-2007.
This particular trend may be attributed to accrual of
power royalty from the power producing companies
in the State.
• Grants from the Centre constitute 92 per cent of
the non-tax revenue of the State. Importance of this
component increased during 2000-2004 as
compared to previous periods. However, in 2004-
2007, its share in aggregate revenue has declined to
71.88 per cent.
TABLE 21.2
Composition of Aggregate Revenue
% of Aggregate % of GSDP % of Aggregate % of GSDP % of Aggregate % of GSDP % of Aggregate
1993-1995 1993-1995 1995-2000 1995-2000 2000-2004 2000-2004 2004-2007
Tax Revenues 22.50 13.92 27.79 17.57 12.63 7.47 16.85
State’s own Tax Revenue 0.72 0.45 1.11 0.70 2.76 1.63 3.19
Share in Central Taxes 21.77 13.47 26.68 16.86 9.87 5.84 13.67
Non-Tax Revenue 77.50 47.95 72.21 45.64 87.37 51.68 83.15
State’s own Non-Tax Revenue 14.38 8.90 7.65 4.83 7.05 4.17 11.27
Grants from the Centre 63.12 39.05 64.56 40.80 80.32 47.51 71.88
Aggregate Revenue Receipt 100.00 61.87 100.00 63.20 100.00 59.15 100
Source: Same as Table 21.1.
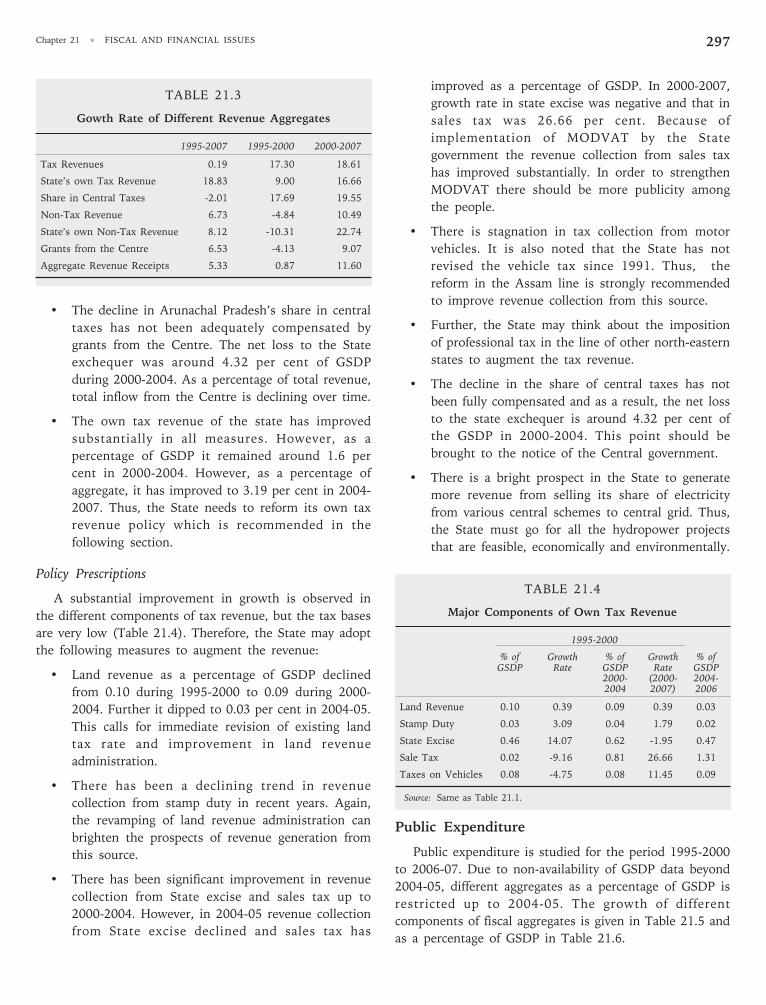
297Chapter 21 • FISCAL AND FINANCIAL ISSUES
• The decline in Arunachal Pradesh’s share in central
taxes has not been adequately compensated by
grants from the Centre. The net loss to the State
exchequer was around 4.32 per cent of GSDP
during 2000-2004. As a percentage of total revenue,
total inflow from the Centre is declining over time.
• The own tax revenue of the state has improved
substantially in all measures. However, as a
percentage of GSDP it remained around 1.6 per
cent in 2000-2004. However, as a percentage of
aggregate, it has improved to 3.19 per cent in 2004-
2007. Thus, the State needs to reform its own tax
revenue policy which is recommended in the
following section.
Policy Prescriptions
A substantial improvement in growth is observed in
the different components of tax revenue, but the tax bases
are very low (Table 21.4). Therefore, the State may adopt
the following measures to augment the revenue:
• Land revenue as a percentage of GSDP declined
from 0.10 during 1995-2000 to 0.09 during 2000-
2004. Further it dipped to 0.03 per cent in 2004-05.
This calls for immediate revision of existing land
tax rate and improvement in land revenue
administration.
• There has been a declining trend in revenue
collection from stamp duty in recent years. Again,
the revamping of land revenue administration can
brighten the prospects of revenue generation from
this source.
• There has been significant improvement in revenue
collection from State excise and sales tax up to
2000-2004. However, in 2004-05 revenue collection
from State excise declined and sales tax has
improved as a percentage of GSDP. In 2000-2007,
growth rate in state excise was negative and that in
sales tax was 26.66 per cent. Because of
implementation of MODVAT by the State
government the revenue collection from sales tax
has improved substantially. In order to strengthen
MODVAT there should be more publicity among
the people.
• There is stagnation in tax collection from motor
vehicles. It is also noted that the State has not
revised the vehicle tax since 1991. Thus, the
reform in the Assam line is strongly recommended
to improve revenue collection from this source.
• Further, the State may think about the imposition
of professional tax in the line of other north-eastern
states to augment the tax revenue.
• The decline in the share of central taxes has not
been fully compensated and as a result, the net loss
to the state exchequer is around 4.32 per cent of
the GSDP in 2000-2004. This point should be
brought to the notice of the Central government.
• There is a bright prospect in the State to generate
more revenue from selling its share of electricity
from various central schemes to central grid. Thus,
the State must go for all the hydropower projects
that are feasible, economically and environmentally.
TABLE 21.4
Major Components of Own Tax Revenue
1995-2000
% of Growth % of Growth % ofGSDP Rate GSDP Rate GSDP
2000- (2000- 2004-2004 2007) 2006
Land Revenue 0.10 0.39 0.09 0.39 0.03
Stamp Duty 0.03 3.09 0.04 1.79 0.02
State Excise 0.46 14.07 0.62 -1.95 0.47
Sale Tax 0.02 -9.16 0.81 26.66 1.31
Taxes on Vehicles 0.08 -4.75 0.08 11.45 0.09
Source: Same as Table 21.1.
Public Expenditure
Public expenditure is studied for the period 1995-2000
to 2006-07. Due to non-availability of GSDP data beyond
2004-05, different aggregates as a percentage of GSDP is
restricted up to 2004-05. The growth of different
components of fiscal aggregates is given in Table 21.5 and
as a percentage of GSDP in Table 21.6.
TABLE 21.3
Gowth Rate of Different Revenue Aggregates
1995-2007 1995-2000 2000-2007
Tax Revenues 0.19 17.30 18.61
State’s own Tax Revenue 18.83 9.00 16.66
Share in Central Taxes -2.01 17.69 19.55
Non-Tax Revenue 6.73 -4.84 10.49
State’s own Non-Tax Revenue 8.12 -10.31 22.74
Grants from the Centre 6.53 -4.13 9.07
Aggregate Revenue Receipts 5.33 0.87 11.60

ARUNACHAL PRADESH DEVELOPMENT REPORT298
TABLE 21.5
Growth Rate of Different Fiscal Aggregates
1995-2000 2000-2007
1 Revenue Expenditure 4.16 8.00
1 a Developmental Expenditure 1.75 9.33
1 a (i) Social Service 4.96 9.21
1 a (ii) Economic Service -0.91 9.43
1 b Non-Developmental Expenditure 9.57 5.20
1 b (i) Interest Payment 9.14 4.46
1 b (ii) Pension 29.67 6.00
1 b (iii) Establishments 6.18 6.00
2 Capital Expenditure 10.09 12.07
2 a Developmental -11.23 8.60
2 a (i) Social Service -24.9 14.75
2 a (ii) Economic Service -8.59 7.07
2 b Non-Developmental Expenditure 50.70 29.07
2 b (i) General Service 7.71 -3.67
2 b (ii) Loan and Advance -3.23 0.99
2 b (iii) Public Debt 55.92 36.12
Source: Same as Table 21.1.
TABLE 21.6
Broad Expenditure as a Percentage of GSDP(Average of the Period)
1995- 2000- 2004-2000 2004 2006
1 Revenue Expenditure 48.06 55.38 54.62
1 a Developmental Expenditure 33.46 36.87 37.69
1 a (i) Social Service 15.49 17.53 18.07
1a (ii) Economic Service 17.97 19.34 19.62
1 b Non-Developmental Expenditure 14.6 18.51 16.93
1 b (i) Interest Payment 4.46 6.43 5.57
1 b (ii) Pension 1.62 2.88 2.46
1 b(iii) Establishments 8.52 9.2 8.9
2 Capital Expenditure 37.23 28.87 22.52
2 a General Service 9.45 8.95 0.53
2 b Developmental 18.78 15.32 13.54
2 b (i) Social Service 3.14 2.4 2.81
2 b (ii) Economic Service 15.64 12.92 10.74
2 c Public Debt, Loan and Advance 8.89 4.60 8.45
2 c (i) Public Debt 8.89 4.45 8.35
2 c (ii) Loan and Advance 0.98 0.45 0.10
Source: Same as Table 21.1.
Macro Trend
• Over the period, revenue expenditure has increased
and capital expenditure has declined as a percentage
of GSDP.
• Growth rates of plan and non-plan expenditure are
3.69 and 5.45 per cent respectively, over the period.
During the first period, plan expenditure decelerated
(-2.15 per cent) and non-plan expenditure grew at a
rate of 4.05 per cent. Higher growth rate is observed
in plan expenditure (16.39 per cent) as compared to
non-plan expenditure growth rate of 6.02 per cent,
during the second period.
• During the whole period, non-plan revenue
expenditure stands around 99 per cent of the non-
plan expenditure. Plan revenue expenditure has gone
up from 38.64 per cent in 1995-96 to 56.13 per cent
in 2004-05. Thus, a declining trend in share is
observed in capital expenditure in the State.
• Developmental revenue expenditure (to put the
analysis in a temporal comparison, the period is
divided into three sub-periods: 1995-2000, 2000-
2004 and 2004-2007) increased both in terms of
growth and as a percentage of GSDP. In capital
expenditure, though growth rate is increased during
2000-2007, the base has declined.
• Non-developmental revenue expenditure as a
percentage of GSDP increased by four percentage
points in 2000-2004 as compared to 1995-2000,
and a marginal increase took place in 2004-05.
Thus, the overall increase is due to a substantial
rise in interest payment and pension.
• Capital expenditure in the form of public debt-
redemption, and loan and advance, has declined by
four percentage points between the first two time
periods. However it has gone up to 8.45 per cent of
GSDP in 2004-05.
Micro Trend
Developmental Expenditure on Social Services
The micro trend in developmental expenditure is
analysed by converting the value at the constant price of
1999-2000. Table 21.7 shows the trend of real
developmental expenditure in social services during 1995-
2000, 2000-2004 and 2004-2007.
• Average revenue expenditure in social service was
34 per cent higher in 2000-2004 than in 1995-2000.
Between 2000-2004 and 2004-2007 the increase
was 38.43 per cent. However, capital expenditure in
this sector declined by 13 per cent in the first two
periods and there was an increase of 80 per cent
between the period 2nd and 3rd.
• There is a consistent increase in average revenue
expenditure in education. Capital expenditure
declined between the first two time periods and
then increased in the 3rd.

299Chapter 21 • FISCAL AND FINANCIAL ISSUES
• In health sector, revenue expenditure consistently
increased. The increase in capital expenditure in the
first two time periods was only 12 per cent,
whereas between the second and third, the increase
was 137 per cent.
• In water supply, housing and information services,
revenue expenditure increased, whereas capital
expenditure declined in the first two time periods.
However, between 2nd and 3rd time periods, the
increase in capital expenditure in water supply was
67 per cent.
• In other social services, the trend is increasing in
both the accounts.
TABLE 21.7
Average Expenditure in Social Services atConstant Price (1999-2000 =100), (Rupees in Crore)
Revenue Expenditure Capital Expenditure
1995- 2000- 2004- 1995- 2000- 2004-2000 2004 2007 2000 2004 2007
Education 115.02 146.96 176.56 13.42 12.88 24.11
Health 46.44 55.53 63.50 5.13 5.75 13.67
Water Supply 45.44 60.46 116.94 31.35 20.35 33.99and Housing
Information, etc. 2.27 2.96 3.15 0.122 0.03 0.37
Other Social 28.05 53.59 82.15 0.25 4.83 7.33Service
Total 237.23 442.30 49.7 43.84 79.13
Source: Same as Table 21.1.
Impact on the Economy
The increasing revenue expenditure and declining
capital expenditure (particularly in the second period) has
adverse consequences on delivery of social services. In
many interior areas, doctors and school teachers find it
difficult to reside in the place of their posting because of
lack of residential accommodation, as a result of which (in
the absence of private accommodation facilities) they
remain absent from duties (GoA, 2006). This has adverse
impact on the functioning of health centres and schools.
Developmental Expenditure on Economic Services
Table 21.8 gives the comparative expenditure pattern
in both revenue and capital accounts during the periods
1995-2000, 2000-2004 and 2004-2007.
• Between the 1st and 2nd time periods, revenue
expenditure in economic services increased by 26.6
per cent whereas capital expenditure declined by
3.70 per cent. Between 2nd and 3rd revenue and
capital expenditure increased by 37.59 and 16.97
per cent respectively.
• In all the sub-sectors revenue expenditure has
increased, whereas capital expenditure has a mixed
trend between the 1st and 2nd time periods. Between
2nd and 3rd time periods revenue expenditure in all
sectors increased. The maximum increase was
observed in energy (almost six times in revenue).
• In agriculture, industry and minerals, rural
development, transport and general economic
services; capital expenditure declined between 1st
and 2nd time periods. Between 2nd and 3rd, except in
general economic services, capital expenditure
increased.
• Only in case of special area programme and rural
development, the trend is upward in both accounts.
TABLE 21.8
Average Expenditure in Economic Service atConstant Price (1999-2000 =100), (Rupees in Crore)
Revenue Expenditure Capital Expenditure
1995- 2000- 2004- 1995- 2000- 2004-2000 2004 2007 2000 2004 2007
Agriculture and 137.41 139.66 161.00 7.71 4.70 11.27Allied Sector
Rural Development 25.79 26.10 38.49 1.93 0.65 0.88
Special Area 6.57 9.68 22.54 9.22 27.92 41.50Programme
Irrigation, etc. 21.58 44.67 42.29 5.86 7.78 5.74
Energy 17.37 13.39 86.95 99.32 105.29 106.65
Industry and 11.21 13.44 12.65 0.55 0.49 1.11Mineral
Transport 38.53 51.92 67.51 117.60 86.22 107.44
General Economic 18.80 53.30 53.19 1.68 1.85 0.16Service
Total 277.28 352.19 484.60 243.87 234.90 274.76
Source: Same as Table 21.1.
Impact on the Economy
The impact of declining capital expenditure and
increasing revenue expenditure as a whole has been felt in
the growth pattern of GSDP in the State. In the post-
reform period in the economy of Arunachal Pradesh,
agriculture and industry sectors were able to grow at a
rate of 1.67 and 5.81 per cent respectively, which are
lower than those in the pre-reform rates. Contribution to
growth by agriculture sector has been negative and that by
industry has declined. The service sector has become the
driving force behind the growth and is contributing more
than 100 per cent to the growth of GSDP. The non-
infrastructure service sector is contributing more than 75
per cent to growth and a distorted growth pattern has
emerged in the economy of Arunachal Pradesh (Sarma
and Nayak, 2006). The distorted growth pattern has also

ARUNACHAL PRADESH DEVELOPMENT REPORT300
contributed to many inequalities and has thus, added
inefficiency to the productive capacities of the economy of
the State (Ibid).
Expenditure Pattern in Non-Developmental Activities
Non-developmental activities include expenditure in
different organs of the State, fiscal services, interest
payments, administrative services and pension. Table 21.9
shows the following trends during 1995-2000, 2000-2004
and 2004-2007.
• Of the total revenue expenditure in general services
the share of expenditure in organ of the State, fiscal
services and administrative service declined from
58.84 per cent in 1995-2000 to 45.15 per cent in
2000-2004. In 2004-2007, it was 46.66 per cent.
• The share of interest payment and pension in the
revenue expenditure in general services, increased
from 41.37 per cent in 1995-2000 to 50.32 per cent
in 2000-2004. It stood at 48.30 per cent in 2004-
2007. This is the dominant reason behind the
growth of non-developmental revenue expenditure
in the State.
• Non-developmental capital expenditure had a
declining trend between the 1st and 3rd time periods.
TABLE 21.9
Average Expenditure in General Services atConstant Price 1999-2000 =100), (Rupees in Crore)
Revenue Expenditure Capital Expenditure
1995- 2000- 2004- 1995- 2000- 2004-2000 2004 2007 2000 2004 2007
Organ of the State 12.86 15.27 20.46
Fiscal services 1.92 2.52 3.35
Interest payment 67.89 117.39 137.77
Administrative services 115.52 149.99 186.21
Pension etc. 24.05 52.54 58.46
Total 222.24 337.72 406.26 14.44 16.42 13.84
Source: Same as Table 21.1.
Impact on the Economy and Policy Options
The rising revenue expenditure in all fronts has
compelled the state to go for large scale reduction in
capital expenditure. The slow-growing agriculture, non-
growing industries and rising educated unemployment
have compelled the government to go for the creation of
more jobs in the government sector. The process has fed
on each other and expenditure on salaries relative to
revenue expenditure (excluding interest payment) has
gone up from 40.5 per cent in 1994-95 to 47.8 per cent in
2002-03 (12th Finance Commission Report p.487), which
is 10 percentage points higher than the national average.
• Identification and redeployment of excess
employees in meaningful ways can only bail out the
State from the present position.
• Enhanced capital expenditure in economic service
sector especially in expanding productive capacity of
the economy can ease out the government from the
pressure of creating more jobs in the public sector
which may be less productive.
Interest Burden
During 1994-1996, interest burden on the State
hovered between 3 and 3.58 per cent of GSDP and during
1996-2000, between 4 and 4.9 per cent. It jumped to over
6 per cent of the GSDP during 2000-2004. It stood at
around 5.61 per cent of GSDP in 2005-06. Thus, interest
burden of the State is one of the major contributors to
rising fiscal deficit.
Debt Problem
Over time the outstanding debt of the State has risen.
Aggregate outstanding liability which was 33.5 per cent of
the GSDP in 1995-96, rose to 41.5 per cent in 2000-01
and then to 80.06 per cent in 2007-08 (Table 21.10).
TABLE 21.10
State-wise Outstanding Liabilities (As a % of GSDP)
State 1995-96 2000-01 2005-06 2007-08(BE)
Arunachal Pradesh 33.5 41.5 80.08 80.06
Assam 32.6 32.2 39.1 38.2
Manipur 41.5 64.1 92 77.4
Meghalaya 24.6 37.2 45.5 46.9
Mizoram 57.4 77.7 102.8 92
Nagaland 43 43.6 45.3 41.8
Tripura 41.3 45.2 58.6 51.5
All India 21 28.3 32.7 29.8
Source: RBI Website on Study on State Finance.
Debt Position and Its Sustainability
During 1993-94 to 1998-99, the growth3 rates of
public debt, GSDP and interest payment in nominal terms
were 10.82, 10.37 and 18.96 per cent respectively. In the
periods 1999-2000 and 2000-2006, the growth rates of
the same variables stood at 21.73, 10.13 and 10.56,
respectively. Thus, the growth rate of interest liability was
3. Growth rate is calculated at current prices.
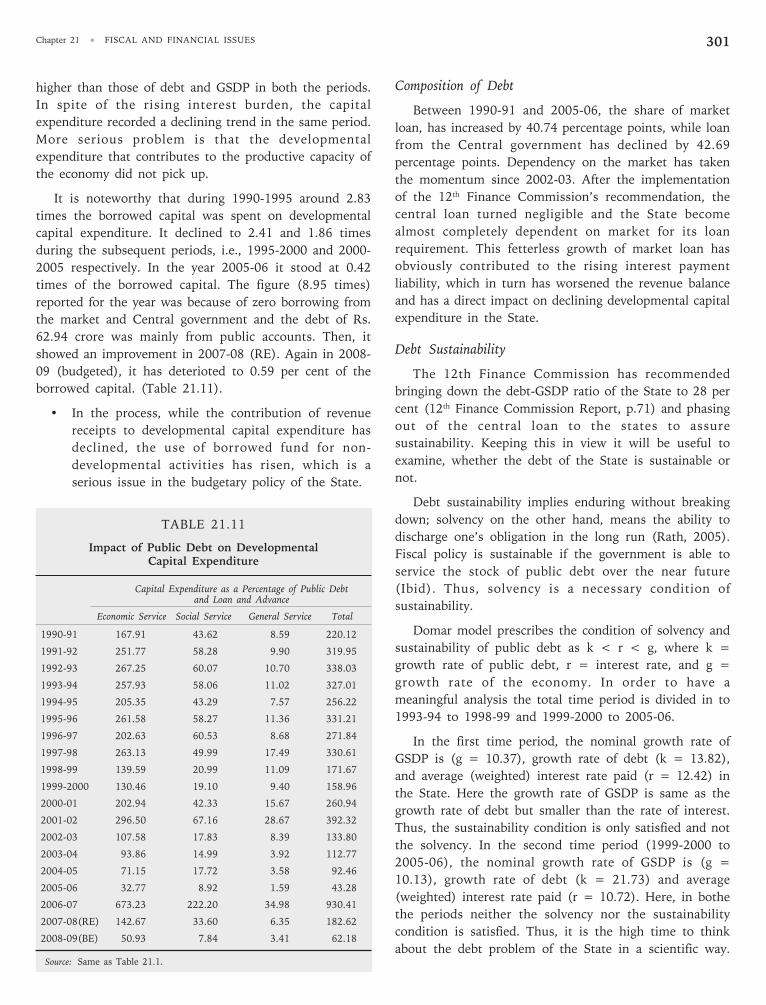
301Chapter 21 • FISCAL AND FINANCIAL ISSUES
higher than those of debt and GSDP in both the periods.
In spite of the rising interest burden, the capital
expenditure recorded a declining trend in the same period.
More serious problem is that the developmental
expenditure that contributes to the productive capacity of
the economy did not pick up.
It is noteworthy that during 1990-1995 around 2.83
times the borrowed capital was spent on developmental
capital expenditure. It declined to 2.41 and 1.86 times
during the subsequent periods, i.e., 1995-2000 and 2000-
2005 respectively. In the year 2005-06 it stood at 0.42
times of the borrowed capital. The figure (8.95 times)
reported for the year was because of zero borrowing from
the market and Central government and the debt of Rs.
62.94 crore was mainly from public accounts. Then, it
showed an improvement in 2007-08 (RE). Again in 2008-
09 (budgeted), it has deterioted to 0.59 per cent of the
borrowed capital. (Table 21.11).
• In the process, while the contribution of revenue
receipts to developmental capital expenditure has
declined, the use of borrowed fund for non-
developmental activities has risen, which is a
serious issue in the budgetary policy of the State.
TABLE 21.11
Impact of Public Debt on DevelopmentalCapital Expenditure
Capital Expenditure as a Percentage of Public Debtand Loan and Advance
Economic Service Social Service General Service Total
1990-91 167.91 43.62 8.59 220.12
1991-92 251.77 58.28 9.90 319.95
1992-93 267.25 60.07 10.70 338.03
1993-94 257.93 58.06 11.02 327.01
1994-95 205.35 43.29 7.57 256.22
1995-96 261.58 58.27 11.36 331.21
1996-97 202.63 60.53 8.68 271.84
1997-98 263.13 49.99 17.49 330.61
1998-99 139.59 20.99 11.09 171.67
1999-2000 130.46 19.10 9.40 158.96
2000-01 202.94 42.33 15.67 260.94
2001-02 296.50 67.16 28.67 392.32
2002-03 107.58 17.83 8.39 133.80
2003-04 93.86 14.99 3.92 112.77
2004-05 71.15 17.72 3.58 92.46
2005-06 32.77 8.92 1.59 43.28
2006-07 673.23 222.20 34.98 930.41
2007-08(RE) 142.67 33.60 6.35 182.62
2008-09(BE) 50.93 7.84 3.41 62.18
Source: Same as Table 21.1.
Composition of Debt
Between 1990-91 and 2005-06, the share of market
loan, has increased by 40.74 percentage points, while loan
from the Central government has declined by 42.69
percentage points. Dependency on the market has taken
the momentum since 2002-03. After the implementation
of the 12th Finance Commission’s recommendation, the
central loan turned negligible and the State become
almost completely dependent on market for its loan
requirement. This fetterless growth of market loan has
obviously contributed to the rising interest payment
liability, which in turn has worsened the revenue balance
and has a direct impact on declining developmental capital
expenditure in the State.
Debt Sustainability
The 12th Finance Commission has recommended
bringing down the debt-GSDP ratio of the State to 28 per
cent (12th Finance Commission Report, p.71) and phasing
out of the central loan to the states to assure
sustainability. Keeping this in view it will be useful to
examine, whether the debt of the State is sustainable or
not.
Debt sustainability implies enduring without breaking
down; solvency on the other hand, means the ability to
discharge one’s obligation in the long run (Rath, 2005).
Fiscal policy is sustainable if the government is able to
service the stock of public debt over the near future
(Ibid). Thus, solvency is a necessary condition of
sustainability.
Domar model prescribes the condition of solvency and
sustainability of public debt as k < r < g, where k =
growth rate of public debt, r = interest rate, and g =
growth rate of the economy. In order to have a
meaningful analysis the total time period is divided in to
1993-94 to 1998-99 and 1999-2000 to 2005-06.
In the first time period, the nominal growth rate of
GSDP is (g = 10.37), growth rate of debt (k = 13.82),
and average (weighted) interest rate paid (r = 12.42) in
the State. Here the growth rate of GSDP is same as the
growth rate of debt but smaller than the rate of interest.
Thus, the sustainability condition is only satisfied and not
the solvency. In the second time period (1999-2000 to
2005-06), the nominal growth rate of GSDP is (g =
10.13), growth rate of debt (k = 21.73) and average
(weighted) interest rate paid (r = 10.72). Here, in bothe
the periods neither the solvency nor the sustainability
condition is satisfied. Thus, it is the high time to think
about the debt problem of the State in a scientific way.

ARUNACHAL PRADESH DEVELOPMENT REPORT302
TABLE 21.12
Outstanding Debt Position
Total Rev. Interest Payment Gross State Interest Payment Outstanding Outstanding Debt Outstanding DebtReceipts (Rupees (Rupees Crore) Domestic Product as a Percentage Debt as on 31st as a Percentage of as a Percentage
Crore) (Rupees Crore) of GSDP March (Rupees Crore) Revenue Receipts of GSDP
1991-92 539.46 21.37 287 53.20
1992-93 615.13 21.83 262 42.59
1993-94 658.16 27.53 893.11 3.08 281 42.69 73.69
1994-95 731.06 34.53 969.65 3.56 319 43.64 75.39
1995-96 859.51 42.35 1184.4 3.58 397 46.19 72.57
1996-97 965.00 53.26 1212.29 4.39 480 49.74 79.60
1997-98 1045.16 59.85 1336.52 4.48 477 45.64 78.20
1998-99 1182.60 71.26 1515.16 4.7 559 47.27 78.05
1999-00 1319.43 79.80 1615.39 4.94 728 55.18 81.68
2000-01 1084.78 123.26 1806.07 6.82 718 66.19 60.06
2001-02 1057.84 111.57 2126.84 5.25 769 72.70 49.74
2002-03 1108.29 127.98 2103.18 6.09 945 85.27 52.70
2003-04 1576.37 148.22 2407.74 6.16 1736 110.13 65.47
2004-05 1501.84 154.30 2787.94 5.53 1973 131.37 53.87
2005-06 1849.41 167.53 2987.14 5.61 2150 116.25 61.91
2006-07 2592.18 200.52 NA 2314 89.27 NA
2007-08(RE) 3307.24 199.82 NA 2614 79.04 NA
2008-09(BE) 3903.55 241.19 NA 2839 72.73 NA
Note: The outstanding debt is computed from RBI (2008) by deducting Ways and Means Advance from RBI from the total outstanding liability of the State asgiven in Statement 27, page 184.
Source: (1) Annual Financial Statements of Arunachal Pradesh (Various years), Website Central Statistical Organisaion (www.mospi.nic.in) and RBI (2008).
TABLE 21.13
Composition of Total Debt
Internal Debt Loan from the Provident Fund,as a % of Central Govt. as etc. as a % ofTotal Debt % of Total Debt Total Debt
1990-91 17.53 62.79 19.68
1991-92 20.47 54.18 25.35
1992-93 19.95 59.50 20.54
1993-94 19.78 55.06 25.16
1994-95 47.49 35.94 16.56
1995-96 35.38 43.77 20.85
1996-97 35.86 43.46 20.68
1997-98 17.41 55.14 27.45
1998-99 38.07 42.32 19.61
1999-2000 45.62 16.97 37.41
2000-01 15.87 17.94 66.19
2001-02 20.62 27.29 52.09
2002-03 47.72 30.91 21.37
2003-04 49.39 30.24 20.37
2004-05 59.09 17.54 23.37
2005-06 58.27 20.10 21.63
2006-07 0.00 0.00 100.00
2007-08(RE) 64.25 0.10 35.65
2008-09(BE) 59.90 0.31 39.79
TABLE 21.14
Interest Paid and Outstanding Debt
Year Interest Paid Debt in time Rate of Interest1
(Rs. Crore) (t-1) in time t (r)(Rs. Crore)
1991-92 21.37
1992-93 21.83 287 7.61
1993-94 27.53 262 10.51
1994-95 34.53 281 12.29
1995-96 42.35 319 13.28
1996-97 53.26 397 13.42
1997-98 59.85 480 12.47
1998-99 71.26 477 14.94
1999-00 79.80 559 14.28
2000-01 123.26 728 16.93
2001-02 111.57 718 15.54
2002-03 127.98 769 16.64
2003-04 148.22 945 15.68
2004-05 154.30 1736 8.89
2005-06 167.53 1973 8.49
2006-07 200.52 2150 9.33
2007-08(RE) 199.82 2314 8.64
2008-09(BE) 241.19 2614 9.23
Source: (1) Annual Financial Statements of Arunachal Pradesh (Variousyears) and RBI (2008).

303Chapter 21 • FISCAL AND FINANCIAL ISSUES
The policy option for the State is to increase the growth
rate of the economy and to find out loans at low interest
rate. The second option is difficult to exercise as the
interest rate is likely to rise in the inflationary situation.
So the alternative is to increase the productive capacity of
the economy such that dependency on debt is reduced.
This is possible through, among others, increasing
developmental capital expenditure of the State in a
situation of low private investment.
Policy Options
There has been a shift in the use of public debt from
productive to non-productive sectors, and at the same
time the State has moved from a low interest debt to high
interest public debt regime. Therefore, it is high time for
the State government to focus on the use of public debt
for sustainable development. Further, timing of the
creation of capital assets is also a crucial issue. Most of
the developmental capital expenditure is undertaken in
the month of March and the rainy season starts just after
that. Heavy rainfall and frequent landslides tend to wash
away the assets created hurriedly to utilise the allocated
funds. Thus, the full benefit of the created asset is not
realised and the productivity of the economy does not rise
(it is true mainly in case of road). Therefore, Central
inflow should be streamlined such that it reaches the
State in an even manner and asset creation is made in a
uniform way over the year.
Conclusion
To sum up, Arunachal Pradesh finance has witnessed
rising interest and pension burden, and non-
developmental expenditure in the revenue expenditure
side, while on revenue side, small own tax and non-tax
revenue and declining central inflow of funds. This has
shown up in declining revenue surplus and rising fiscal
deficit. The Supreme Court restriction on felling of trees
in 1996 has further refuelled the process. Because of the
above process, the State has resorted to debt as a source
of financing its fiscal deficit and the result is non-
sustainability of the debt burden. The State in the
beginning of the new century has taken many steps (GoA,
2006). The power royalty has improved the non-tax
revenue of the State. These initiatives have resulted in
improvement in own tax and non-tax revenue, but the
rising revenue expenditure is persisting.
The most disturbing trend is the reduction in the share
in central taxes. Since the State is moving fast to the
tertiarisation process, tax accrual from goods is very
limited. Therefore, a serious thinking is needed, apart
from the policy measure prescribed above, on how to
mobilise more revenue from the tertiary sector which is
the most dominant sector of the State economy.
Further, rising outstanding debt has put the State
under insolvency. The proper use of the borrowed fund in
productive way is the call of the hour. e-Governance in
the finance department may help the State in using the
existing resource in a more productive way.

ARUNACHAL PRADESH DEVELOPMENT REPORT304
APPENDIX A-21.1
Ministry of DONER
Department of north-eastern region was created in the first week of September 2001, and was formally inaugurated on 1st
November 2001. The main activities of the department are dealt with under the following heads:
• Non-lapsable central pool of resources,
• North-east Council,
• Coordination with Central ministries and State government of north-east region,
• Advocacy and publication,
• Capacity building,
• Hill area development project, and
• International cooperation
Objectives
The objectives of the DONER ministry are as follows:
• Accelerate the pace of socio-economic development in the N.E. region.
• Synergies the effort of Central/State government and other stakeholder for balanced development of the region.
• Evolve a common approach for all the agencies working for the development of the region.
• Formulating policy for the rapid development of the region.
Achievements
As on 31-12-2006, a cumulative sum of Rs.5,823.64 crore (in 827 project) has been sanctioned under Non-Lapsable Central Pool
Resources (NLCPR) through DONER ministry for the entire NE region. Arunachal Pradesh’s share is Rs. 679.70 crore (11.67 per
cent) in 78 projects. The infrastructure sector (namely power, road and bridges, irrigation and flood control) amounts to 61.91 per
cent of the total allocation. However, Rs. 418.22 crore has been released so far up to 31st December 2006 which comes to 61.53 per
cent of the total allocation.
North-Eastern council
North-eastern council was set-up in 1971 under NEC Act of 1971 for securing balanced development of the north-east region with
seven states namely (Arunachal Pradesh, Assam, Manipur, Meghalaya, Mizoram, Nagaland, Tripura). Till then it was under Ministry of
Home. After an amendment of the NEC Act in 2001, Sikkim was included as a new member. In 2004, the NEC was revitalised and
came under the purview of the DONER ministry and minister of DONER became the chairman of NEC. Some of the salient activities
of NEC in Arunachal Pradesh are:
• Establishment of duck, pig and poultry breeding farm,
• Extending financial support for marketing agricultural product,
• Capacity building of the farmer through strengthening agriculture training institute,
• Assisting the State for survey and investigation of hydropower projects,
• Providing support for e-governance, and
• Helping NGOs for imparting training to women entrepreneurs.
From 1996-97 to 2005-06, Arunachal Pradesh received Rs. 27.61 crore as financial assistance from NEC under different schemes.
However, there is a huge gap between amount sanctioned and disbursement over time. During 1996-2006, the disbursement is 55.97
per cent of the allocation amount.
Source: Government of India, Annual Report 2006-07, Ministry of Development of north-east Region, Delhi.
Introduction
Arunachal Pradesh is richly endowed with a variety of
natural resources. In spite of that, its level of development
is very low. The inability of the State to transform its rich
natural endowments into the flow of income and other
forms of social well-being is usually traced to its historical
legacy of semi-seclusion and sparse settlement of
population. The policy of seclusion practised by the
British caused a wide socio-economic and technological
gap between Arunachal Pradesh and the rest of the
country. After Independence, the Government of India
launched the programme of planned development which
shifted upward the growth trajectory of Arunachal
Pradesh’s economy and brought about dynamism in the
socio-economic life of the people. The initial strategy of
development, the one followed in the 1950s, was based
on gradualism. This strategy got discredited after the
Chinese aggression and was replaced by an activist one.
This chapter evaluates the past strategies and formulates a
new one based on the contextual factors.
Review of Past Strategies
Elwin Strategy
The seminal research laying the foundation for
government’s strategy of development in Arunachal
Pradesh, then called North East Frontier Agency (NEFA),
was done by Verrier Elwin. His A Philosophy for NEFA,
incorporating this strategy was taken to be the Bible of the
policymakers and officials associated with the
administration of NEFA (Rustomji, 1983). Apart from
building a strategy of development for NEFA, Elwin who
called himself the missionary of “Mr. Nehru’s gospel for
the tribes” (Guha, 1988: 326) played a leading role in the
implementation of the policy. With a deep understanding
of tribal society, Elwin prescribed a gradualist approach to
ARU
N
ACHAL
PRA
DESH
Chapter 22
Looking Ahead: Strategy for
Development
development. The basic thrust of this strategy was to
avoid—in realms of technology and institutions—abrupt
changes, the changes which in the special circumstances
of NEFA (Arunachal Pradesh) were supposed to carry
disruptive potentialities.
Underlying Elwin’s phobia of abrupt changes was his
implicit assumption of cultural invariance in the short
run. His strategy of tribal development thus ruled out the
large-scale industrialisation in Arunachal Pradesh, at least
in the short run. It supported autarky of a tribal economy
through promotion of traditional arts and crafts, and
provision of public goods.
In order to put the development policy followed in
Arunachal Pradesh into the national perspective, the Elwin
strategy can be compared with the Mahalanobis model
incorporated in the country’s Second Five Year Plan. The
Second Five Year Plan strategy of development based on
the priority of basic and heavy industries, the commanding
heights of the economy, is also known as Nehruvian
strategy or Nehru-Mahalanobis strategy. The Elwin model
intersects the Mahalanobis strategy on a number of points,
but there are also differences between them.
An important point of intersection between Elwin and
Mahalanobis strategies is their inward orientation—both
are based on closed economy models. Export pessimism,
widespread in the 1950s, motivated Mahalanobis to model
an insular economy and the fear of exploitation of tribals
by the non-tribals is the motivation behind Elwin’s
modelling an insular tribal economy. Mahalanobis strategy
aims at the achievement of autarky in the production of
capital goods, an objective to be achieved through import
substitution, and Elwin strategy stresses the achievement
of autarky at community level through promoting the
traditional tribal industries. Thus, both the models use
protectionism as the instrument of goal achievement.

ARUNACHAL PRADESH DEVELOPMENT REPORT306
Another point of intersection is that these strategies do
not provide any room for price-guided resource allocation.
In Mahalanobis strategy, capital goods sector receives top
priority because of its relatively high contributions to
growth in the long run; in the assignment of priority,
expected profit and international market potentiality play
hardly any role. In Elwin strategy, price mechanism does
not play any role. Production in a tribal economy is seen
not being motivated by profit but mainly by demand for
home consumption and partly by the possibility of sale
locally.
Both Mahalanobis and Nehru-Elwin strategies
recognise an active government role in the economic
sphere. In Mahalanobis strategy, the economy remains
slow-moving till the government boosts investment and
directs it towards basic industries, which propels the
economy to a higher growth trajectory. In Elwin strategy
the economy remains in stagnation and it is the
enlightened intervention of the government, which sets
the economy in motion.
As to the points of difference, Mahalanobis strategy is
forward looking—it tries to break with the past. Big
industries, modern technology and government efforts are
the sine qua non for a rapid growth. Elwin strategy is
Janus-faced, looking simultaneously forward and
backward. It wants to build the future on the tradition of
the past. It rules out the possibility of rapid
modernisation. By prescribing caution in undertaking
administrative and development projects and allowing
only small changes, Elwin strategy pre-empts the
possibility of hasty decisions.
An evaluation of Mahalanobis is irrelevant here but a
very brief evaluation of Elwin strategy is a necessary step
to put the later strategies on Arunachal Pradesh’s
development in order. North-East Frontier Tracts, now
Arunachal Pradesh, which was till 1947 administered only
politically with almost all offices situated in the plains of
Assam saw in the 1950s an extension of regular
administration right up to the McMahon Line. The
peaceful spread of administration, the smooth
consolidation of the tracts into a unit called North-East
Frontier Agency (NEFA) in 1954 and successful launch of
development programmes causing no adverse reaction are
the fruits yielded by the Elwin approach. Specific
outcomes of this strategy can be summarised as:
i. Techno-cultural continuity and stability: The
strategy did not try to introduce new mode of
organisation of production nor did it disturb the
cultural heritage of different communities. The
maintenance of cultural continuity was instrumental
in ensuring stability. In North-east India instability
seems to be the norm and stability an exception.
Even Assam is being consumed by the fire of
instability. The factor contributing to Arunachal
Pradesh being an exception was the systematic
effort undertaken by the government to preserve all
traditions and cultural ethos of the people.
ii. No modern industry: No modern industry was
established in the 1950s and 1960s. However, an
elaborate programme was undertaken to modernise
the traditional arts and crafts.
iii. Sentinelism: The caring and preservationist
approach of the government nourished nationalistic
fervour in the State and the people got the
impression of having the responsibility of standing
sentinel over the vast international borders.
The Elwin approach was followed without being
questioned till 1962, the year which witnessed NEFA
being invaded by China. The Indian reverses in the war
with China tended to discredit gradualism and gave rise to
an activist-integrationist policy (Das, 1995).
Shift in Strategy: Integrationism
In order to frame a new strategy, the Government of
India commissioned after 1962, National Council of
Applied Economic Research (NCAER) to conduct a
techno-economic survey of NEFA (NCAER, 1967). The
spirit of the time—the integrationist mood—coloured the
NCAER’s study. Apart from this, the conceptual
framework of the study was based on pre-Solow growth
models which place singular importance on physical
capital as the determinant of growth. Though by the
middle of the 1960s a good number of studies on growth-
accounting (for example, Solow, 1957; Denison, 1962,
etc.) had showed that the contribution of physical capital
to growth was much less than what was expected in
traditional models and consequently human capital model
as formulated by Schultz (1961) and Becker (1964) had
become a new paradigm of development, yet the NCAER
study was not informed by this paradigmatic shift. With
an in-built bias towards physical capital, the study
neglected the problems of human capital formation in the
State.
Moreover, being techno-economic in scope, the study
did not find it necessary to take into account contextual
factors of mainly socio-cultural origins having bearing on
economic behaviour. In this respect its approach was quite
opposite to Elwin’s which is thoroughly context-bound.
(NCAER’s study differs from Elwin’s on suggestion also.

307Chapter 22 • LOOKING AHEAD: STRATEGY FOR DEVELOPMENT
While Elwin suggested a reduced investment for
Arunachal Pradesh, NCAER (1967) suggested an enlarged
flow).
NCAER (1967) made an appraisal of the resources
available in the State. Considering sparseness of
population, the study suggested settlement of farmers
from outside the State in order to raise agricultural
production and modernise agriculture dominated by jhum
cultivation. It did not ponder over the plight of the jhum
cultivators, and ways of improving their conditions. On
the industrial front the study suggested establishment of
two pulp and paper mills, and a few timber mills based on
the vast forest resources available in the State. It was the
defence and internal security which seem to have pre-
empted all other considerations in the formulation of the
new strategy. Settling people (from the rest of the
country) in the unpopulated border areas, rapid
development of infrastructural facilities mainly roads,
transport and communication systems, industrialisation
and modernisation were ingredients of the new policy.
Implementation and Outcomes
The construction of roads and development of
transport and communication facilities enhanced the
much-needed connectivity in the State and preparations
were made in the 1960s and 1970s to set up a number of
medium and small-scale industries based mainly on the
locally available raw materials. In order to populate the
unpopulated border areas, ex-servicemen and Chakma and
Hajong refugees from East Pakistan were settled.
However, the settlement policy incurred a heavy local
reaction leading to its termination. A good number of
industries such as cement, timber, veneer, food, etc., were
established in the 1970s. Most of these industries were
owned and managed by the government. Almost all the
government-owned industries, except those based on
timber, started incurring losses and when losses piled up
into huge amounts in the 1990s they were closed down.
The timber-based industries were spared only for a short
time. In 1996 came the Supreme Court’s restrictions on
the felling of trees and it led to the closure of all timber-
based industries.
Sickness affected not only the industries but spread in
an attenuated form in other sectors especially the banking.
Co-operative Apex Bank, the symbol of the development
of the local banking and cooperative plunged into financial
doldrums because of the poor recovery of loans. The
industrial and financial sickness resulting from the
government’s management failures has brought realism
into the framing of economic policy in recent years. The
new policy de-emphasises the government’s role in the
economic sphere and tries to promote local
entrepreneurship. In order to reconstruct a new strategy it
is necessary to deconstruct the old ones pursued till
recently.
Deconstruction
The policy pursued after the Chinese invasion in 1962
aimed at the rapid development of the State by boosting
investment and bringing administrative and institutional
uniformity. Defence warranted national unity which was
thought to be promoted by homogenisation in the realms
of technology and institutions, and removal of economic
disparity between Arunachal Pradesh and the rest of the
country. It was this project, usually called the project of
modernisation, which entailed an increasing inflow of
central funds, migration of both skilled and unskilled
labour and inflow of most of the inputs from the rest of
the country. Arunachal Pradesh’s economy grew rapidly
and the per capita net state domestic product (NSDP)
approached the national average by the end of the 1980s.
Literacy spread and health conditions of the people
improved. Changes came in the realm of institutions. The
process of individualisation tended to replace the
traditional community ownership of land and other
resources. Individual property rights became well-
established in areas practising sedentary (permanent)
cultivation. With the emergence of monetised transactions
different community-level institutions such as mutual
insurance communal mobilisation of labour, etc., tended
to be attenuated, and social capital suffered erosion.
Inequalities in the distribution of income, land and
different assets emerged in scale unprecedented in the
State. Arunachal Pradesh’s economy has grown, but the
growth has not strengthened the economy to be self-
sustaining. Still the economy depends on the central funds
for its sustenance. Table 22.1 shows the inflow of funds
from the Centre as the percentage of the NSDP of
Arunachal Pradesh. Over time, the ratio of inflow to
NSDP has fallen but the fall is not very high.
In the State, the government expenditure constitutes a
high proportion of NSDP. In 1986-87, the government
expenditure constituted 139.83 per cent of the NSDP; the
size of the government has exceeded the size of the
economy in some years. During 1986-87 to 2003-04, the
lowest value of the government expenditure as the
percentage of NSDP was 70.79 in 1993-94. In spite of a
high expenditure of the government the economic growth
in the State is not high.
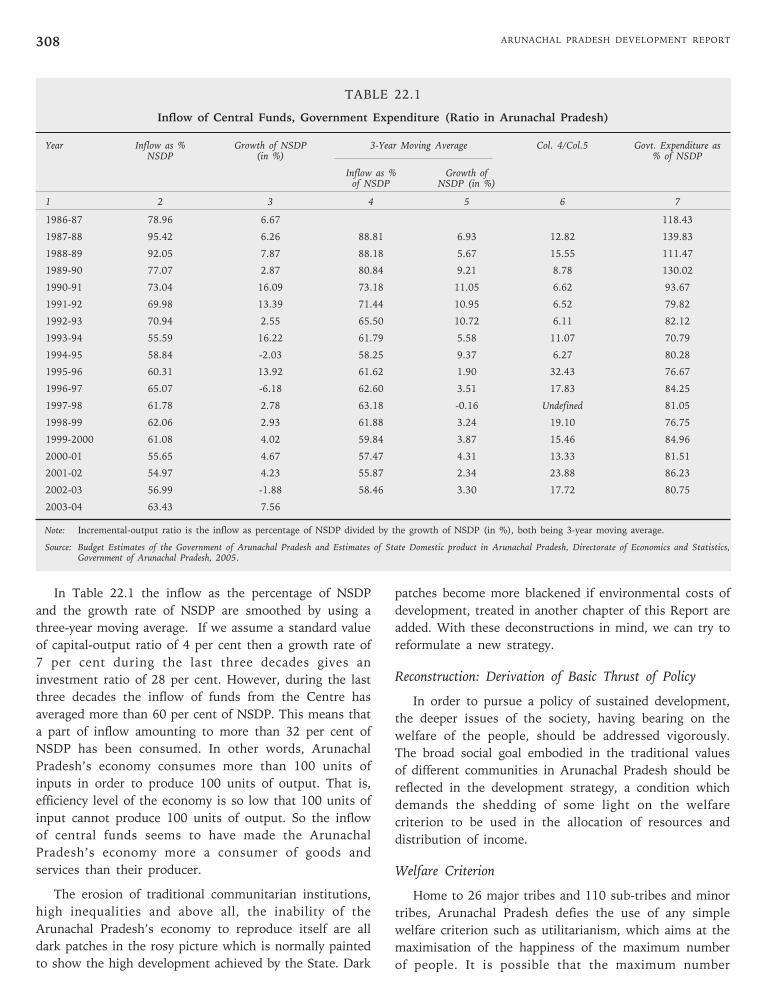
ARUNACHAL PRADESH DEVELOPMENT REPORT308
In Table 22.1 the inflow as the percentage of NSDP
and the growth rate of NSDP are smoothed by using a
three-year moving average. If we assume a standard value
of capital-output ratio of 4 per cent then a growth rate of
7 per cent during the last three decades gives an
investment ratio of 28 per cent. However, during the last
three decades the inflow of funds from the Centre has
averaged more than 60 per cent of NSDP. This means that
a part of inflow amounting to more than 32 per cent of
NSDP has been consumed. In other words, Arunachal
Pradesh’s economy consumes more than 100 units of
inputs in order to produce 100 units of output. That is,
efficiency level of the economy is so low that 100 units of
input cannot produce 100 units of output. So the inflow
of central funds seems to have made the Arunachal
Pradesh’s economy more a consumer of goods and
services than their producer.
The erosion of traditional communitarian institutions,
high inequalities and above all, the inability of the
Arunachal Pradesh’s economy to reproduce itself are all
dark patches in the rosy picture which is normally painted
to show the high development achieved by the State. Dark
patches become more blackened if environmental costs of
development, treated in another chapter of this Report are
added. With these deconstructions in mind, we can try to
reformulate a new strategy.
Reconstruction: Derivation of Basic Thrust of Policy
In order to pursue a policy of sustained development,
the deeper issues of the society, having bearing on the
welfare of the people, should be addressed vigorously.
The broad social goal embodied in the traditional values
of different communities in Arunachal Pradesh should be
reflected in the development strategy, a condition which
demands the shedding of some light on the welfare
criterion to be used in the allocation of resources and
distribution of income.
Welfare Criterion
Home to 26 major tribes and 110 sub-tribes and minor
tribes, Arunachal Pradesh defies the use of any simple
welfare criterion such as utilitarianism, which aims at the
maximisation of the happiness of the maximum number
of people. It is possible that the maximum number
TABLE 22.1
Inflow of Central Funds, Government Expenditure (Ratio in Arunachal Pradesh)
Year Inflow as % Growth of NSDP 3-Year Moving Average Col. 4/Col.5 Govt. Expenditure asNSDP (in %) % of NSDP
Inflow as % Growth ofof NSDP NSDP (in %)
1 2 3 4 5 6 7
1986-87 78.96 6.67 118.43
1987-88 95.42 6.26 88.81 6.93 12.82 139.83
1988-89 92.05 7.87 88.18 5.67 15.55 111.47
1989-90 77.07 2.87 80.84 9.21 8.78 130.02
1990-91 73.04 16.09 73.18 11.05 6.62 93.67
1991-92 69.98 13.39 71.44 10.95 6.52 79.82
1992-93 70.94 2.55 65.50 10.72 6.11 82.12
1993-94 55.59 16.22 61.79 5.58 11.07 70.79
1994-95 58.84 -2.03 58.25 9.37 6.27 80.28
1995-96 60.31 13.92 61.62 1.90 32.43 76.67
1996-97 65.07 -6.18 62.60 3.51 17.83 84.25
1997-98 61.78 2.78 63.18 -0.16 Undefined 81.05
1998-99 62.06 2.93 61.88 3.24 19.10 76.75
1999-2000 61.08 4.02 59.84 3.87 15.46 84.96
2000-01 55.65 4.67 57.47 4.31 13.33 81.51
2001-02 54.97 4.23 55.87 2.34 23.88 86.23
2002-03 56.99 -1.88 58.46 3.30 17.72 80.75
2003-04 63.43 7.56
Note: Incremental-output ratio is the inflow as percentage of NSDP divided by the growth of NSDP (in %), both being 3-year moving average.
Source: Budget Estimates of the Government of Arunachal Pradesh and Estimates of State Domestic product in Arunachal Pradesh, Directorate of Economics and Statistics,Government of Arunachal Pradesh, 2005.

309Chapter 22 • LOOKING AHEAD: STRATEGY FOR DEVELOPMENT
belongs to a few communities, and the people of other
communities who are in a minority are left in
deprivations. The immediate concern of the utilitarian
principle is not to address the problems of this minority
plunged in sufferings; rather its concern is the aggregate
happiness. But in a multi-ethnic society, total welfare may
not be defined because of the non-additive nature of the
ethnic-level welfare. In this Report the chapter on social
transformation has highlighted the type of socio-economic
inequality that has emerged in Arunachal Pradesh. Taking
care of inequality within a tribe may be somewhat easy
because of the operation of some redistributive
mechanisms, but taking care of inter-tribal inequality is
very difficult in view of the fact that in the first place the
traditional redistributive mechanisms do not work from
one tribe to the others and secondly, inter-tribal
competition tends to clog the government’s redistributive
channels. This makes utilitarianism as well as the
aggregate level of income and its growth unsatisfactory as
the criterion of welfare. Given the multi-ethnic nature of
society in Arunachal Pradesh, Rawlsian maximin principle
appears to be the most attractive welfare criterion. Since
this principle is concerned with the maximisation of
welfare of the most deprived, its operationalisation is
relatively simple and its acceptability, as an ethical
category is more widespread than any other.
Applied to the formulation of a strategy this implies
that the allocative and redistributive policy of the
government should be reoriented to make the conditions
of the most deprived communities better off. Tribe-wise
data on the distribution of income are not available. The
closest approximation is given by the inter-district
distribution of income as shown in Table 22.2. There is a
high inequality in the inter-district distribution of income.
One way of reducing this inequality is to spread the
government expenditure more equitably among the
districts and their backward regions.
Income inequality-based resource allocation is narrow.
A better perspective can be obtained by using human
development index. As discussed in another chapter of
this Report, the inter-district difference in human
development is very high. This difference must be reduced
to make development sustainable and socially desirable.
A Criterion of Resource Allocation
In North-east the factor which is retarding
development is instability. Arunachal Pradesh is not fully
free from this scourge; already two of its districts,
Changlang and Tirap, are badly affected by it. The most
important factor behind instability is unemployment,
especially of the educated youth. So in the selection of
investment projects, the employment generating potential
can be assigned the singular importance. In what follows
the employment elasticity of different sectors of the
Arunachal Pradesh’s economy is discussed.
Sectoral Employment Elasticity
The estimated employment elasticity for different
sectors of the Arunachal Pradesh’s economy is provided in
Table 22.3. The values of employment elasticity for some
sectors in this State are quite unexpected. Commonly,
elasticity of employment in the secondary sector in
general and the manufacturing sector in particular is lower
than that in agriculture. The estimates of elasticity for the
1970s and 1980s show that in both the decades the
elasticity of employment is lower in the primary sector
than in the secondary sector. A surprising, rather a bizarre
situation, is in the tertiary sector in the 1970s ‘other
services’ and the tertiary sector as a whole experienced a
very high growth in output—in the ‘other services’ output
grew at 10.43 per cent per annum and in the entire
tertiary sector the yearly growth of output was as high as
11.39 per cent. But neither in ‘other services’ nor in the
whole of tertiary sector the number of workers increased.
In the ‘other services’ the number of workers rather
TABLE 22.2
Gross District Domestic Product (GDDP) inArunachal Pradesh at Constant Prices of 1993-94
Sl. Districts 2000- 2001- 2002- Average % of RankNo. 01 02 03 Average
GSDP
1. Tawang 10782 10455 10661 10633 104.37 4
2. West Kameng 12093 11917 12283 12131 119.08 1
3. East Kameng 9493 8942 9440 9292 92.21 11
4. Papum Pare 9737 9633 10361 9910 97.28 8
5. Lower Subansiri 8772 8294 8783 8616 84.58 13
6. Upper Subansiri 10204 9764 10179 10049 98.65 7
7. West Siang 9914 9534 9983 9810 96.30 9
8. East Siang 9285 9059 9440 9261 90.91 12
9. Upper Siang 9900 9153 9791 9615 94.38 10
10. Dibang Valley 11388 11100 11437 11308 111.01 2
11. Lohit 10461 10240 10669 10457 102.65 5
12. Changlang 10468 10002 10403 10291 101.02 6
13. Tirap 11320 10975 11410 11235 110.29 3
Arunachal 10255 9921 10384 10187 100.00Pradesh
Note: Rank is calculated from the average.
Source: Estimates of District Domestic Product of Arunachal Pradesh 2000-2001 to 2002-03, Directorate of Economics and Statistics,Government of Arunachal Pradesh, Itanagar.

ARUNACHAL PRADESH DEVELOPMENT REPORT310
decreased significantly. In the 1980s no such things
happened. So we take up the 1980s for analysis.
TABLE 22.3
Sectoral Employment Elasticity in Arunachal Pradesh
Growth of Growth of EmploymentWorkers (in %) Output (in %) Elasticity
Sectors 1971- 1981- 1971- 1981- 1971- 1981-1980 1990 1980 1990 1980 1990
Agriculture 0.66 1.02 6.4 9.18 0.10 0.11
Forestry, 25.62 3.77 0.38 4.84 67.42 0.78Logging, Fishingand Hunting
Mining and 23.03 26.5 14.39 37.26 1.60 0.71Quarrying
Primary Sector 0.85 1.11 4.61 8.48 0.18 0.13
Manufacturing 18.82 5.35 14.2 7.85 1.33 0.68
Construction 44.19 0.69 7.7 6.26 5.74 0.11
Secondary Sector 31.52 1.91 8.03 6.43 3.93 0.30
Trade and 15 6.2 15.97 8 0.94 0.78Commerce
Transport, Storage 47.68 12.27 9.77 13.31 4.88 0.92and Communication
Other Services -1.91 6.12 10.43 7.17 -0.18 0.85
Tertiary Sector -0.4 6.35 11.39 7.62 -0.04 0.83
Total 1.508 2.21 7.07 7.81 0.21 0.28
Note: The data on workers are from Population Censuses of India(Arunachal Pradesh); Economic Tables, 1971, 1981 and 1991. Thedata on output are from Estimates of Domestic Product, ArunachalPradesh, Directorate of Economics and Statistics.
In terms of elasticity, the tertiary sector is more
labour-intensive than the secondary sector. In case of sub-
sectors the employment elasticity in agriculture is almost
the same as in construction and is the lowest among all
the sub-sectors. The low elasticity in agriculture is due
mainly to the steady extension of permanent cultivation
and the associated technological change which generated a
high growth of output but the employment did not
increase much because of an intensive use of plough,
mainly bullock-driven and partly power tillers and
tractors. There was also the expansion in horticulture,
which is land-using and labour-saving contributing to a
low elasticity in agriculture. The manufacturing sector’s
relatively high employment elasticity is due to its low rate
of adoption of new technology. Industrial units in
Arunachal Pradesh are mainly small; very few are of
medium-scale. Not a single large-scale industry has been
established in this State. There are also handicrafts which
are highly labour-intensive. The high employment
elasticity in manufacturing is indeed reassuring holding a
great promise of its expansion without curtailing the
growth in employment. The investment in mining and
quarrying, in livestock-raising, in fishing, etc., would also
ensure the creation of more employment. The expansion
of horticulture along with the establishment of fruit-
processing industries holds promises of creating more
employment for the educated youths.
Reduction of Transaction Costs
That the Arunachal Pradesh’s economy cannot
reproduce itself is a measure of the amount of its
operational inefficiency. There are many factors working
in unison to keep the efficiency level low. The factor
which can be singled out is the transactions cost which in
the language of Kenneth Arrow, is the cost of running the
economy. The high transactions cost can be reduced by
reforming the institutional structure of the economy, a
task whose accomplishment requires much care,
judiciousness and a strong information base for actual
decision making. At the same time to enhance efficiency,
new technologies must be introduced.
Strengthening Legal-Judicial Infrastructure
In this State monetised transactions are new. Unlike
barter, which operates mainly within a community whose
members know each other, the monetised transactions
involve people who too often belong to different
communities. In commodity market the transactions are
simple contracts, which do not require that the parties
concerned should know each other prior to transacting the
business. The factor markets, especially the credit and
labour markets, are more complex requiring elaborate
contract to be made prior to transaction.
In Arunachal Pradesh, organised credit market started
growing in the 1970s and the legal framework regulating
the credit is yet to be institutionalised. The customary
laws are used by the local bodies in the administration of
justice. The Indian contract law, the penal code, etc., are
used mainly by the judiciary which, however, has not yet
been separated from the executive branch of the
government. The operational bases of the local customary
laws and the all-India codes are yet to be defined clearly.
There are instances where the court refers back the cases
to the local bodies for adjudication.
The successful operation of the factor markets,
especially the credit and labour markets, warrants that the
legal framework should be well-defined to protect the
parties to the contract. A significant sub-set of relations in
the modern sector—approximately in the urban society—
is the contractual relations. One can say in the language of
Henry Maine that the urban society in Arunachal Pradesh
has made a transition from status to contract (Maine,
1906). A steady growth of the modern sectors of the

311Chapter 22 • LOOKING AHEAD: STRATEGY FOR DEVELOPMENT
economy requires a healthy growth of institutions
supporting and ensuring the observance of all contracts.
From the very beginning of planned development in
Arunachal Pradesh, the building of physical infrastructure
has been emphasised. However, the provision of
institutional infrastructure, more specifically the legal-
judicial infrastructure seems to be lagging. Thus, banks
have been established but sufficient care has not been
taken to establish contract-enforcing institutions. The
banking system cannot work successfully unless supported
by such institutions. The provision of adequate judicial
services will pave the way for better enforcement of
contracts and reduce the transactions costs.
As long as transactions cost remains high private
investment from the rest of the country can hardly be
attracted. Different studies conducted through out the
world show the primary role of institutions in the
promotion of investment (World Bank, 1997). In
Arunachal Pradesh the task of institution-building is really
difficult because an important subset of institutions is
informal which can hardly be made amenable to
government’s policy actions. Again the expansion of
judicial services is not a guarantee that the contract
enforcing mechanisms will improve. Inefficiency in the
judicial services may raise the transactions cost instead of
lowering it. Raising the amount as well as the efficiency
level of judicial services and removal of legal opacity can
improve investment climate in the State.
Development of Market
Government, market and community are three
institutions facilitating production, exchange and
distribution. Government works through coercion, market
through competition, and community through cooperation
(Hayami, 2003). The spaces of human actions occupied by
these institutions are not well-demarcated; too often one
acts as the substitute of the others. A large-sized
government may crowd out both the market and the
community. In the context of Arunachal Pradesh, the
fundamental problem is to expand the institution of
market. It is sometimes thought that it is the government
which should try to develop this institution through
strengthening its contract enforcement mechanism. True
that the contract enforcing role of the government is
universally taken to be a primary one, independent of the
government form or of the type of the society, but the
government has its own limitations.
To highlight the limitations of the government, one
can point out the paramount influence of social norm.
When the social norms and values do not accommodate
the principle of market, there may be too many infractions
of formal contract, and whatever be the efficiency level of
the government, it will fail to enforce all contracts. What
is necessary is to instill the value or norm of market in
the society, a task which the government may not perform
very satisfactorily because of the limitations coming from
its own operational principle.
A government does not operate on quid pro quo, the
principle followed in the market. A government official
cannot sell his services to the people. Similarly, a voter is
not supposed to sell his vote to the highest bidder in
elections. The operational principle in government being
diametrically opposed to what forms the norm of the
market, the government’s success in spreading the norm
or ethics of market may be limited. Under the
circumstances, the development of community level
organisations and the growth of social capital may
promote the market. Being based on cooperative
exchanges and mutualism, the community initiatives seem
to be a stronger agent than the government in propagating
the underlying principle of market.
At the more concrete level, the problem with the
development of market is the low amount of surplus
scattered over a wide area not connected by motorable
roads. This problem can partly be solved by introduction
of less bulky but high valued crops, plants and fruits.
Some medicinal plants valued highly not only locally but
globally are on the way to being extinct in the State. Their
cultivation can solve not only the problem of extinction,
but raise the income of the farmers and spread marketing
mechanism. The government intervention in the form of
technological package is, however, crucial not only in the
supply side but also in the demand side—in the provision
of marketing infrastructure.
New Technology and Organisation of Production
Along with the restructuring and strengthening of the
institutions and development of physical infrastructure,
concerted efforts should be made to introduce new
technologies and organisation of production. This is
because heavy industries which are sources of innovation
in both technology and organisation cannot be established
in the State due to hilly topography, non-availability of
basic raw-materials and low demand. Only medium and
small-scale industries based on non-timber forest
products, fruits, orchids, etc., should be promoted. Since
local technological know-how and organisational capability
are limited, firms equipped with the latest technology
should be invited to set up their enterprises. Necessary
incentives should be provided to these firms to employ

ARUNACHAL PRADESH DEVELOPMENT REPORT312
local youths so that they can learn by doing and in future
establish their own enterprises. Experiences of different
countries show that learning from the best is the secret of
being innovative.
Heavy Investment Requirement and Government
As stated before, Arunachal Pradesh depends heavily
on the Central funds. This is a paradoxical situation in
view of the fact that the State has huge resources
especially water resources which can be exploited to
generate electricity. The forest resources in the State are
also vast, and these resources can be used subject, of
course, to replanting. The development of hydropower
which can reduce the State’s financial dependence on the
Centre requires an investment too big to be provided by
the State government. The central assistance is the only
way to exploit the water and other natural resources. The
necessity of the resource exploitation for a sustained
development of the State is also derived from the strategic
importance of the State, an aspect which demands central
care.
Strategy of High Growth: Himachal Pradesh as the Model
Topographically Arunachal Pradesh has many
similarities with Himachal Pradesh but that is the end,
beyond topography there are only dissimilarities. The
socio-economic level of Himachal Pradesh is much higher
than that of Arunachal Pradesh. Though both the states
belong to what is called ‘special category’; yet Himachal
Pradesh has been able to build up a strong economy
utilising its agro-climatic endowments and other
resources, and Arunachal Pradesh is lagging behind not
only Himachal Pradesh but many other states in
utilisation of its vast natural endowments. Himchal
Pradesh’s advanced economic status is reflected in its level
of per capita income. During the triennium ending in
2005-06, Himachal Pradesh’s per capita NSDP was 41 per
cent higher than Arunachal Pradesh’s and 34 per cent
higher than the national average (Table 22.4).
Himachal Pradesh has a fast growing economy. During
the decade ending 2002-03 its per capita NSDP grew at
the average rate of 4.5 per cent per annum. No doubt
Arunachal Pradesh’s economy grew rapidly in the 1970s
and 1980s but in the 1990s its economy suffered a severe
stagnation due mainly to the closure of many industries.
During 1993-94 to 2002-03 Arunachal Pradesh’s per
capita NSDP growth averaged only 0.3 per cent per
annum. Later, the growth rate increased; during 1999-
2006 per capita NSDP in the State grew at 4.8 per cent
per annum which is almost the same as the long-term
growth rate experienced since 1970-71.
TABLE 22.4
NSDP of Arunachal Pradesh: A Comparisonwith Himachal Pradesh
State/Country Average NSDP (Rs.) Index Indexduring TrienniumEnding 2005-06
Arunachal Pradesh 22012 100 95
Himachal Pradesh 31093 141 134
India 23199 105 100
Note: NSDP is at current price. Indian figure is GDP.
Source: Government of India, Economic Survey, 2007-08.
If Arunachal Pradesh’s economy wants to catch up
with Himachal Pradesh’s by 2018 then the economic
growth in the State must be higher than what has been
achieved. During 2005-06 Arunachal Pradesh’s per capita
NSDP at constant prices was Rs.20037 and Himachal
Pradesh’s Rs.28252. If Himachal Pradesh a grows at 4.5
per cent, the rate experienced during 1993-94 to 2002-03,
then in 2018 its per capita NSDP would turn out to be
Rs.48,481 (at constant prices of 1999-2000). Arunachal
Pradesh achieving the same level of per capita NSDP in
2018 requires a per capita NSDP growth of 7.36 per cent
per annum, the rate which exceeds that achieved before.
Given the high population growth in the State, the per
capita NSDP of that order would warrant a NSDP growth
rate of about 10 per cent per annum, a rate which is
achievable if only the rate of investment can be increased
commensurately. This is indeed a difficult task because
the capital-output ratio in the State is much higher than
that in the country as a whole. With a capital-output ratio
of 6, the warranted rate of investment is 60 per cent of
NSDP.
Investment of this order can be made possible
especially in terms of the output if large scale hydropower
projects are undertaken along with the investment in
horticulture, floriculture and plantation crops. The success
achieved by Himachal Pradesh, especially in horticulture,
appears to be a worthy model that can be followed by
Arunachal Pradesh with all desirable outcomes.
Conclusion
Arunachal Pradesh has achieved significant progress in
all indicators of development. Given a very low base from
which the process of development started, the level of
achievement is really outstanding. But when development
is deconstructed, the picture turns somewhat pale. The
basic inputs of development have come from the rest of
the country, propelled by the inflow of Central funds. The
Arunachal Pradesh’s economy has not yet been able to

313Chapter 22 • LOOKING AHEAD: STRATEGY FOR DEVELOPMENT
attain the capacity to reproduce itself, an incapacity
caused, among others, by high transactions cost. Apart
from its generalised inefficiency the economy suffers from
high inequalities and growing unemployment both of
which are unprecedented in a society, which not long ago,
were ruled by the principle of communitarianism.
The new strategy should assign utmost importance to
the generation of employment and reduction of
inequalities in the distribution of income and assets.
Rawlsian maximin principle appears relevant in this
respect. In order to reduce the transactions cost,
institutions should be strengthened and their opacity
removed. Induction of new technology and new
organisation of business activities should be the guiding
principle of the new policy and since success in
innovations comes from learning by doing from the best
firms, necessary incentives should be provided to induce
the most efficient firms to locate their operations in
Arunachal Pradesh. A heavy investment in the
development of hydro-electric capacity can reduce the
State’s dependence on the Centre.
The Sectoral priorities which emerge from the strategy
of a stable development can be summarised as below:
• To speed up the development of hydro-electric
projects. Public-private partnership may be
encouraged in this sector.
• Provision of infrastructural facilities in the backward
districts.
• Expansion of horticulture and plantations especially
in districts still dependent largely on jhumming.
• Agro-processing industries, in general, and fruit
processing in particular should be promoted in the
poor districts in order to create necessary backward
linkages.
• Cooperative mode of organisation should be
encouraged. The fruit and agro-products may be
provided necessary administrative support to form
cooperatives in order to set up manufacturing units.

Ahluwalia, M.S. (1978). “Rural Poverty and Agricultural Performance in India”,Journal of Development Studies 14: 298-323.
Alam, K. (2002). “The Prospect of Cross-Country Border Trade of ArunachalPradesh”, in S. Dutta(ed.), Cross-Border Trade of North-Eastern India.Kolkata: Hope India Publication. pp.56-168.
Anand, Sudhir and A. Sen (1994). Sustainable Human Development: Concepts andPriorities. New York: UNDP.
Anderson, John (1871). "The Stone Implements of Yunnan etc.". Report on theExpedition to Western Yunnan via Bhamo, Appendix C, Calcutta.
Anderson, J.R. (1971). “Land-use Classification Schemes used in SelectedRecent Geographic Applications of Remote Sensing”, Photogramm.Eng.37(4): 379-87.
Anderson, J.R., E.E. Hardy and J.T. Roach (1972). “A Land-use ClassificationSystem for Use with Remote-sensor Data”, U.S. Geol. Survey Circular 671:16.
Anonymous (1997). The Indian Forest Act, 1927 along with Forest Conservation Act,1980. Consolidated guidelines for diversion of forest.
————. (1998). Wildlife Trade- A Handbook for Enforcement Staff. New Delhi:WWF-India.
Apang, Gegong (2003). “Foreword”, Field Manual for Propagation and Plantationof Medicinal Plants. Itanagar: State Forest Research Institute, Departmentof Environment and Forest, Government of Arunachal Pradesh.
Arrow, Kenneth J. (2000). “Economic Transition, Speed and Scope”, Journal ofInstitutional and Theoretical Economics 156: 9-88, March.
Arunachal Forest News (2001). Arunachal Forest News 19(1&2).
Arunachal Pradesh State Medicinal Plants Board (2002). Herbs for Better Health.Naharlagun. Arunachal Pradesh: State Medicinal Plants Board. pp.1-41.
Arunachalam, A., U. Melkania, K. Arunachalam and G. Ghosh (2001).“Protected Area Management in Arunachal Pradesh: Issue and Ooptionsfor Biological Conservation”, Himalaya Biosphere Reserve 3(1&2): 62–66.
Asraf A.A. (1990). Prehistoric of Arunachal. Itanagar, Department of Research,Government of Arunachal Pradesh.
Atte. O.D. (1992). Indigenous Knowledge and Local level Development: TheParticipatory Approach, IDS Reading Room. Brighton: IDS.
Bagra, T. and P.C. Srivastava.(1998). Status of Soil and Land Survey of ArunachalPradesh. Soil Survey and Land Use Board, Naharlagun, Government ofArunachal Pradesh.
Baishya, A.K., B. Balodi and G.D. Pal (2002). “Floristic Diversity of ArunachalPradesh: An Overview”, in R.C. Sundriyal, Trilochan Singh and G.N.Sinha (eds.), Arunachal Pradesh: Environmental Planning and SustainableDevelopment. HIMAVIKAS Occasional Publication 16: 73-206. Dehradun:G.B. Pant Institute of Himalayan Environment and Development.
Banerjee, R.D. (1924). Neolithic Implements from the Abor Country. Annual Report,Archaeological Survey of India, New Delhi.
Barthakur, J.K. (1975). Census of India, 1971: Portrait of Population, ArunachalPradesh. New Delhi: Controller of Publications.
Barua B.K. (1968). A Cultural History of Assam (Early Period), Vol.1. Delhi.
Baruah S.K. (1985). A Comprehensive History of Assam, New Delhi.
References
ARUN
ACH
AL PR
ADESH
————. (1993). “The Indian Historical Evidence on the Southern Silk Route:The Route of Migration to Assam”, Paper presented at the 34th Session ofICANAS. Hong Kong, 22-28 August.
Baruah, S. (2000). “Certain Observations on Informal Border Trade withNeighbouring Countries and Economic Prospects of the North East”, inG. Das and R.K. Purkayastha (eds.), Border Trade: North East andNeighbouring Countries. New Delhi: Akansha Publishing House.
Baishya, A.K, Sarfraj Haque, P.J. Bora and N. Kalita. (2001). “Flora ofArunachal Pradesh—An Over view”, Arunachal Forest News 19(1&2): 1-25.
Baviskar, A. (2005). “Adivasi Encounters with Hindu Nationalism in MP”,Economic and Political Weekly: 5105-113, November 26.
Becker, G.S. (1960). “An Economic Analysis of Fertility”, in Demographic andEconomic Change in Developed Countries. Princeton: Princeton UniversityPress. pp.209-231.
————. (1964). Human Capital. New York: Columbia University Press.
Begi, J. (ed.) (200). Itanagar—A Profile. Guwahati: D.D. Associates.
Behera, M.C. (1994). Planning and Socio-Economic Development of the Tribals. NewDelhi: Commonwealth Publishers.
————. (1999). Impact of Orange Cultivation on Traditional Role of Galo Women.Minor Project of UGC.
————. (2001). “Sex-based Division of Labour, Responsibility andAccountability: A Case Study of Traditional Role Set of Galo Women”South East Asian Anthropologist, New Series, Vol. I: 45-50.
————. (ed). “Globalisation: Whither Rural Development-Introduction”, inM.C. Behera (ed.), Globalizing Rural Development. Sage (forthcoming).
Behera, M.C. and N.C. Roy (ed). (1997). Trends in Agrarian Structure in Hills ofNorth East India. New Delhi: Commonwealth.
Bejbarua, M. (1999). "Village Economy in Transition: A Case Study of Nyishisunder Papumpare District of Arunachal Pradesh", M.Phil Thesissubmitted to Department of Tribal Studies (unpublished), ArunachalUniversity.
Belshaw, Deryke (1979). “Taking Indigenous Technology Seriously: The Case ofIntercropping Techniques in East Africa”, IDS Bulletin 10(2): 24-27.
Bhagabati, A.C. (1998). An Anthropological View of Social Structure of ArunachalPradesh. Manuscript of Talk for All India Radio, Itanagar.
————. (2004). “The Tribe as a Social Formation: The Case of the Tangsa ofArunachal Pradesh”, in Anthropology for North-East India: A Reader.Kolkata: INCAA. pp.177-180.
Bhardwaj, R.K. (1974). Urban Development in India. New Delhi.
Bhattacharjee, R.K. (2002). “Identifying a Core Sector for Planning Process inArunachal Pradesh”, in Arunachal Pradesh: Environmental Planning andSustainable Development, (ed.), Sundriyal, R.C., Trilochan Singh, and G.N.Sinha, HIMAVIKAS Occasional Publication 16: 537-548. Dehradun: G.B.Pant Institute of Himalayan Environment & Development. Published byBishen Singh and Mahendra Pal Singh.
Bhattacharjee, R.P. (2000). Economic Development of Arunachal Pradesh. Itanagar:Himalayan Publishers.
ARUNACHAL PRADESH DEVELOPMENT REPORT316
Binayak Rajbhandari (eds). “Sustainable Livelihood and Rural Development inSouth Asia: Issues, Concerns and General Implications”, in Behera, M.C.(ed): Globalizing Rural Development. Sage (forthcoming).
Bisht, N.S. and A. Sarma (2002). “Development of bamboo resource ofArunachal Pradesh: a case study of supply of raw material to NagaonPaper Mill,” in Arunachal Pradesh: Environmental Planning and SustainableDevelopment, (eds.) Sundriyal, R.C., Trilochan Singh, and G.N. Sinha,Himavikas Occasional Publication 16: 387-397. G.B. Pant Institute ofHimalayan Environment & Development. Published by Bishen Singh andMahendra Pal Singh, Dehradun.
Bloc, E. (1970). Philosophy of Future. New York: Harder & Hardert.
Bopardikar, B.P. (1972). "Prehistoric Investigation—Daphabhum ScientificSurvey Expedition (NEFA)", in S.B. Deo (ed.), Archaeological congress andSeminar Papers. Nagpur. pp.1-8.
Bordoloi, B.N. (1998). “Tribal land Tenure System and Land Alienation inArunachal Pradesh: An Analysis”, in Antiquity to Modernity in Tribal India,Vol. II, S.N. Mishra (ed.), New Delhi: Inter-India.
Bose M.L. (1997). History of Arunachal Pradesh. New Delhi.
Bose, A. (1974). A Study in India’s Urbanisation 1901-71. New Delhi.
Brass, T. (1995). “Post Scripts; Populism, Peasants and Intellectuals or What’sLeft in the Future?”, in New Farmers Movements in India, T. Brass (ed.).Esseex: Frank Class.
Breman, J. (2001). “An Informalised Labour System: End of Labour MarketDualism”, Economic and Political Weekly 36: 52.
Brokensha, David W., D.M. Warren and Oswald Werner (eds.) (1980).Indigenous System of Knowledge and Development, University Press ofAmerica. USA: Lanham.
Brouwer, Jan, (1999). “Modern and Indigenous perceptions in SmallEnterprises”, Economic and Political Weekly: M-152-56. November 27.
Buiter, W.H. and U.R. Patal (1992). “Debt Deficits and Inflation: AnApplication to Public Finance of India”, Journal of Public Economics 47:172-205.
Butler, R.W. (1991). Tourism, Environment and Sustainable Development,Environmental Conservation 18: 201-218.
Central Electricity Authority (CEA) (2005). All India Electricity Statistics, GeneralReview 2005. New Delhi: CEA, Ministry of Power, Government of India.
Central Ground Water Board (2004). Ground Water Resources of ArunachalPradesh. NE Region. Guwahati: Central Ground Water Board. p.10.
————. (2005). Report on Dynamic Ground Water Resources of Arunachal Pradeshas on March 2004. Guwahati: Central Ground Water Board, north-easternregion.
Central Pollution Control Board (2000). Management of Municipal Solid Waste,New Delhi: Central Pollution Control Board. pp.19.
————. (1999). Status of Solid Waste Generation, Collection, Disposal in MetroCities. New Delhi: Central Pollution Control Board (Central UrbanPollution Series: Cups/46/1999/2000 for 1994).
————. (2003). Annual Report 2002/03. New Delhi: Central Pollution ControlBoard, Ministry of Environment and Forests.
————. (2004-2005). Municipal Solid Waste. New Delhi: Central PollutionControl Board, Ministry of Environment and Forests.
Chadha, G.K. (2002). “Rural Non-farm Employment in India: What does RecentExperience Teach us?”, The Indian Journal of Labour Economics 45: 4.
Chakravarti, P.K. (1995). “Mountain Tourism”, in Pal, A. (eds.), TheHimalayas—Environment, Economy and Society. New Delhi: VikashPublishing House.
Chakravorty, L.N. (1977). Glimpses of Early History of Arunachal Pradesh. Shillong.
Chambers, R. (1983). Rural Development: Putting the Last First. Harlow:Longman.
Chambers, R. (1987). “Sustainable Rural Livelihoods: A Strategy for People,Environment and Development”, Commissioned Study 7. Brighton:Institute of Development Studies. Sussex.
————. (1993). Challenging the Professions. London: Intermediate Technology(1998 Reprint). pp. 1-14.
Champion, H.G. and S.K. Seth (1968). A revised survey of the Forest types of India.New Delhi: Manager of Publication.
Chatterjee, S.K. (1974). Kirata Jana-kriti. Calcutta.
Chattopadhyay, K. (1995). Economic Impact of Tourism Development. An IndianExperience. New Delhi: Kanishka Publishers.
Chaudhari, S. (2002). “Mineral resources of Arunachal Pradesh : theirproperties and prospects”, in Arunachal Pradesh: Environmental Planningand Sustainable Development, (eds.) R.C. Sundriyal, Trilochan Singh, andG.N. Sinha, HIMAVIKAS Occasional Publication 16: 87-102. Dehradun:G.B. Pant Institute of Himalayan Environment and Development.Published by Bishen Singh and Mahendra Pal Singh.
Chaudhuri, D.P. (2002). “Poverty and Equity Issues in Indian Agriculture”, inS.S. Acharya, S. Singh and V. Sagar (eds.). Sustainable Agriculture, Povertyand Food Security. Delhi: Rawat Publications.
————. (1971-72). “Economic Life in North East Frontier of India in the 19th
and 20th Century”, Quarterly Review of Historical Studies 11: 3.
Chaudhuri, S.K. (2002). “Dormitories in the Life of the Wanchos: Structuraland Functional Implications”, unpublished paper presented in thenational conference on Cultutal heritage and Traditional knowledge base ofthe Indigenous communities of NorthEast India, organised by the IGNA (NEYfield station) at Guwahati on 9-10 December.
————. (2003). “The Anthropology of Lesser Known Tribes”, The Anthropologyof North-East India: A text book,(eds.) T.B. Subba and G.C. Ghosh. NewDelhi: Orient Longman. pp.277-292.
————. (2005). “From IGU to Intiya: Emerging Realities of the IDU Mishmisof Arunachal Pradesh”. Paper presented in a seminar on ‘ReligiousHistory of Arunacahl Pradesh’, organised by the Dept. of History, RajivGandhi University in October.
Chaudhuri, S.S. (2004). “Codification of the Customary Law and TribalWomen: A Study on Some Issues and Concerns”, Unpublished paperpresented in the orientation programme organised by the JNU AcademicStaff College, New Delhi, November.
Chiang, Te-Kun (1942). "The Lithic Industries of Prehistoric Szechwan", Journalof West China Border Research Society 14: 1-16.
Chibb, S.N. (1983). Perspectives of Tourism in India, Publication Division,Ministry of Information and Broadcasting, Government of India, NewDelhi.
Chobin, Dani (2002). Prospects and Problems of Industrial Development in ArunachalPradesh (A study of Lower Subansiri and Papum Pare District), UnpublishedPh.D Thesis, Arunachal University.
Chopra, K. et al., (1997). Economic Valuation of Biodiversity, A Case Study ofKeoladeo National Park, Bharatpur, Part-I & II. Delhi: Institute of EconomicGrowth.
Choudhury, D.P. (1971-72). “Economic Life in North East Frontier of India inthe 19th and 20th Century”, Quarterly Review of Historical Studies XI: 3.Kolkata.
Clawson, M. and J.L. Knetsch (1966). Economics of Outdoor Recreation. Baltimore:John Hopkins University Press.
CMIE (2003). Foreign Trade and Balance of Payments, September. Mumbai.
CMPDIL (1991). Compendium on the Coal Occurrences of NE Region. Ranchi:Central Mine Planning and Design Institute.
Coopers & Lybrand (1995). Report Submitted to Government of Assam.
Council for Social Development (2006). India: Social Development Report. NewDelhi: Oxford University Press.
Dai, M. (2005). Mountain Harvest: The Food of Arunachal Pradesh. Guwahati:Anwesha.
Danda, A.K. (1994). “Shifting Cultivation in North East India”, Journal of IndianAnthropological Society 29(1&2): 59-74.
Dandekar, V.M. and N. Rath (1971). “Poverty in India”, Economic and PoliticalWeekly, 2nd and 9th January.
Dani A.H. (1960). Pre- and Proto-History of Eastern India. Calcutta.
Das, G. (1995). Arunachal Pradesh Tribes in Transition. Delhi: Vikas PublishingHouse.
————. (1997). “Features of Peripheral Urbaniation (A Study of the Nature ofGrowth of Urban Settlements in Arunachal” in J.B. Ganguly (ed.)Urbanisation and Development in North East India. New Delhi: Deep andDeep Publication.
Das, Gurudas (2002). Geo-economy of Arunachal Pradesh, in Cross Border Trade ofNorth East India, S. Dutta (ed.). Kolkata: Hope India Publication. pp.206-214.
————. (1992). “Structural Change in the Economy of Arunachal Pradesh”,Journal of NEICSSR 16(2): 37-46.

REFERENCES 317
————. (1991). “Traditional Handicrafts of the Tribes of Arunachal Pradeshbefore Independence”, Journal of NEICSSR 15(2): 26-38.
Das, J.N. (1989). Land Systems in Arunachal Pradesh. Guwahati: Law ResearchInstitute.
De, Bimalendu (2002). “Georesources for Sustainable Development ofArunachal Pradesh”, in Arunachal Pradesh: Environmental Planning andSustainable Development (eds.), R.C. Sundriyal, Trilochan Singh, and G.N.Sinha, Himavikas Occasional Publication. 16: 387-397. Dehradun: G.B.Pant Institute of Himalayan Environment and Development. Publishedby Bishen Singh and Mahendra Pal Singh.
Deaton, A. and A. Tarozzi (1999). “Prices and Poverty in India”, PrincetonUniversity, Research Programme in Development Studies, December 13(mimeo.).
Debroy, B. and Laveesh Bhandari (ed.) (2004). District Level Deprivation in theNew Millennium. Delhi: Konark Publishers.
Denison, E.F. (1962). “United State’s Economic Growth”, Journal of BusinessXXXV: 2.
Department of Environment and Forest (1990). Arunachal Pradesh ForestStatistics. Itanagar: Government of Arunachal Pradesh.
————. (2005). Arunachal Pradesh State Bamboo Policy and Action Plan.Government of Arunachal Pradesh.
————. (1995). State Forestry Action Programme Report (Draft). Itanagar:Government of Arunachal Pradesh.
Department of Hydropower Development (2006). Vide Letter No. CE/HPD/W-III/07/2005-06/6989-90 dated January 4, 2006. Government ofArunachal Pradesh.
Department of Industries (1994). Industrial Policy of Arunachal Pradesh. Itanagar:Government of Arunachal Pradesh.
————. (2001). New Industrial Policy of Arunachal Pradesh. Itanagar: Governmentof Arunachal Pradesh.
————. (2001a). New Industrial Policy 2001: Arunachal Pradesh. Itanagar:Government of Arunachal Pradesh.
————. (2002). Third SSI Census 2001-02. Itanagar: Government of ArunachalPradesh.
Department of Planning (2005). Draft Annual Plan (2005-2006). Itanagar:Government of Arunachal Pradesh pp.122.
Department of Power (2005). Annual Plan 2005-06. Itanagar: Government ofArunachal Pradesh.
————. (2005). Draft Master Plan (Power) 2005-2022 and Beyond. Itanagar:Government of Arunachal Pradesh.
Devi, Lakshmi (1968). Ahom—Tribal Relations (A Political Study). GuwahatiLawyer's Book Stall.
Dholakia, Archana R. (2000). “Fiscal Imbalance in Gujarat: Non-Tax Revenueand Subsidies”, Economic and Political Weekly: 3127-3227, August 26.
Dietz, T. (1987). “Methods for Analyzing Data from Delphi Panels: SomeEvidence from a Forecasting Study”, Technological Forecasting and SocialChange 31: 79-85.
Directorate of Economics & Statistics (2004). Economic Review of ArunachalPradesh. Itanagar: Government of Arunachal Pradesh.
————. (1977). Report on Economic Census. Itanagar: Government of ArunachalPradesh.
————. (1980). Report on Economic Census. Itanagar: Government of ArunachalPradesh.
————. (1990). Report on Economic Census. Itanagar: Government of ArunachalPradesh.
————. (1997). Statistical Abstract of Arunachal Pradesh. Itanagar: Governmentof Arunachal Pradesh.
————. (1997a). 50 Years Pace of Development in Arunachal Pradesh. Itanagar:Government of Arunachal Pradesh.
Directorate of Economics and Statistics (1998). Report on Economic Census.Itanagar: Government of Arunachal Pradesh.
————. (2002). Statistical Abstract of Arunachal Pradesh. Itanagar: Governmentof Arunachal Pradesh.
————. (2002). Estimates of Domestic Product, Arunachal Pradesh. Itanagar:Government of Arunachal Pradesh.
————. (2004). Statistical Abstract of Arunachal Pradesh 2003-2004. Itanagar:Government of Arunachal Pradesh.
————. (1999). Arunachal Pradesh at a Glance. Itanagar: Government ofArunachal Pradesh.
————. (2003). Economic Review of Arunachal Pradesh 2003. Itanagar:Government of Arunachal Pradesh.
Directorate of Tourism (2003). Tourism Policy. Itanagar: Government ofArunachal Pradesh.
Directorate of Transport (2005). Final Annual Operating Plan (2004-2005).Naharlagun: Government of Arunachal Pradesh.
D.N. and G.K. (1989). “Sexual Division of Labour”, Economic and Political WeeklyXXIV: 1949-50.
Dondinya (1985). Monastic Buddhism Among the Khamptis of North East India.Delhi.
Dreeze, Jean and Amartya Sen (1995). India: Economic Development and SocialOpportunity. New Delhi: Oxford University Press.
Dubey, A. (2002). Calorie Consumption and Nutritional Deficiency in India: ADisaggregated Analysis (1993-94 and 1999-00). New Delhi: World Bank.
Dubey, A. and V. Pala (2008). “Poverty, Hunger and Calorie Deficiency inArunachal Pradesh”, Background paper prepared for Arunachaldevelopment Report, Rajiv Gandhi University.
Dubey, A. and R. Palmer-Jones (2005). “Poverty in India Since 1983: NewPoverty Counts and Robust Poverty Comparisons”, Arth Vijnana 47(3-4):223-58.
————. (2005a). “Prices, Price Indexes and Poverty Counts in India during1980s and 1990s: from CPIs to Poverty Lines?”, Arth Vijnana 47(3-4):259-86.
————. (2005b). “Prices, Price Indexes and Poverty Counts in India” during1980s and 1990s: Calculation of UV CPIs, Arth Vijnana 47(3-4): 287-28.
Dubey, A. and S. Gangopadhyay (1998). “Counting the Poor: Where are thePoor in India”, Sarvekshan, Analytical Report No. 1, February.
————. (1998a). “Occupational Structure and Incidence of Poverty in UrbanSector by Size Class of Towns”, in Agarwal, M., A. Barua, S.K. Das, andM. Pant (eds.), Indian Economy in Transition. New Delhi: Har-AnandPublications. pp.92-106.
Dubey, A., S. Gangopadhyay and W. Wadhwa (1999). “Female-HeadedHouseholds In India: Incidence, Poverty and SocioeconomicCharacteristics”, PPRU Papers. Delhi Centre: Indian Statistical Institute.March (Mimeo).
Durand, A. (1975). The Labour Force in Economic Development: A Comparison ofInternational Census Data, 1946-1966. Princeton: Princeton UniversityPress.
Dutt, G. (1998). “Poverty in India and Indian States: An Update”, Indian Journalof Labour Economics 41: 191-211.
Dutta Chaudhury, S. (1978). Gazetteer of Arunachal Pradesh: Lohit dist. Gazetteer.Shillong.
Dutta, Parul (1978). The Noctes. Shillong.
Easterlin, R.A. (1975). “An Economic Framework for Fertility Analysis”, Studiesin Family Planning 6: 54-63.
EduGreen (2005). http://edugreen.teri.res.in
Elwin, V. (1957). A Pholisophy for NEFA (Arunachal Pradesh). Directorate ofResearch. Itanagar: Government of Arunachal Pradesh. (Reprint: 1999).
————. (1958). The Art of the North-East Frontier of India, Directorate ofResearch. Itanagar: Government of Arunachal Pradesh. (Reprint, 1988).
————. (1959). India’s North East Frontier in the Nineteenth Century. London.p.306.
————. (1988, Reprint). The Art of North-East Frontier of India. Itanagar:Directorate of Research, Government of Arunahcal Pradesh. pp.8-9.
EPW Research Foundation (2004). “Finances of State Government”, Economicand Political Weekly: 1941-76, May 8.
Escobar A. (1995). Encountering Development; The Making and Unmaking of theThird World. Princeton: Princeton University Press.
Eshi, K. (1998). Changing Agrarian Economy of the Galos: A study of two VillagesUnder West Siang District of Arunachal Pradesh, unpublished dissertationsubmitted in the Dept. of Tribal Studies for M.Phil degree, ArunachalUniversity.

ARUNACHAL PRADESH DEVELOPMENT REPORT318
Ete, Minto. (1998-99). “Problems and Prospects of Fruits Processing Industryin Arunachal Pradesh (A Case Study of Arunachal HorticulturalProcessing Industries Limited, Nigmoi)”, Unpublished M.Phil.Dissertation. Itanagar: Arunachal University.
Firodia, Arun (2005). “The Many Colours of Green Fuel”, The Times of India 4,13 July.
Forde, Daryll and Marry Douglas (1956). “Primitive Economics”, in Shapiro,Harry L.(ed), Man, Culture and Society. OUP, Inc.
Furer-Haimendrof, C.V. (1980). A Himalayan Tribe: From Cattle to Cash. Delhi:Vikas Publishers.
Gait, E.A. (1926). A History of Assam. Calcutta.
Ganguly, J.B. (1971). A Pilot Survey of Pasighat, Census of India. Delhi:Controller of Publications.
————. (1986). "Presidential Address NEIHA", in J.B. Bhattacharji (ed.),Proceedings of NEIHA (North East India History Association). Shillong. pp.1-10.
————. (2004). “The Economics of Transition from Shifting to SettledCultivation”, in Anthropology for North-East India: A Reader. Kolkata:INCAA. pp.111-119.
Gasper, D. (1996). “Culture and Development Ethics: Needs, Women’s Rightsand Western Theories”, Development and Change 27: 627-661.
Gautam, N.C., V. Raghanswamy, R. Nagaraja and G.R. Shankar (1994).“Satellite Remote Sensing for Survey, Mapping, and Monitoring of LandUse/Land Cover: A Few Examples”, Space Techonology and Geography,Hyderabad: NRSA. pp. 227-250.
Ghanashyam A.R. (2001). Cross-Country Trade of Arunachal Pradesh: Retrospect andProsec’t, paper presented at the seminar on “Cross-Country Trade ofArunachal Pradesh-Retrospect and Prospects”, Arunachal University,Itanagar, held on 28-29 September.
GoAP (2006). Arunachal Pradesh Human Development Report, 2005. Itanagar:Government of Arunachal Pradesh.
Gogoi Lila (1978). “Tai Khamptis of North East India”. Guwahati.
Gopalakrishnan R. (1994). Arunachal Pradesh: Land and People. New Delhi:Omsons Publications.
Gopalan, C., B.V. Ramashastri and S.C. Balasubramanian (1993). Nutritive Valueof India Foods. Hyderabad: National Institute of Nutrition.
Goswami, H. (2002). “Transborder Trade of Arunachal Pradesh: Exploring NewFrontiers”, in Cross Border Trade of North East India, Dutta, S. (ed.), op citpp.149-55.
Goswami, H. and J.K. Gogoi (2001). “Inter-State Disparities in EconomicDevelopment of India with Special Reference to North Eastern States”,Assam, Economic Journal XIV: 89-99.
————. (2004). “Economic Integration Among Bangladesh, China, India andMyanmar (BCIM): Problems and Prospects”, paper presented inInternational Seminar on Towards Cross Border Cooperation Between Southand South-East Asia: The Importance of India’s North East Playing Bridge andBuffer Role, organised by OKD Institute of Social Change andDevelopment, Guwahati, held on 16-19 November.
Government of Arunachal Pradesh (2004). “Memorandum to the TwelfthFinance Commission”, Finance Department, Itanagar.
————. (2005). Annual Operating Plan 2005-2006, State Transport Services,pp.29.
————. (2005). Human Development Report Arunachal Pradesh.
————. (2007). Arunachal Agriculture 2006 Brochure, Department ofAgriculture, Itanagar.
Government of India (1971). Census of India: Arunachal Pradesh (1971) Series-24,Part II (B).
————. (1979). Report of the Task Force on Projections of Minimum Needs andEffective Consumption Demand, Planning Commission, Perspective PlanningDivision, New Delhi.
————. (1981). Census of India: Arunachal Pradesh (1981) Series-24, Part-III(A&B).
————. (1991). Census of India 1991, Arunachal Pradesh District Profile 199.
————. (1991). Census of India 1991, Series—3, Arunachal Pradesh.
————. (1991). Census of India: Arunachal Pradesh (1991) District CensusHandbook, 1991, Series-3.
————. (1991). Census of India. 1991: Provisional Population Totals, Series-1.
————. (1993). The State of Forest Report, Forest Survey of India. Dehradun.
————. (1993). Report of the Expert Group on Estimation of Proportion and Numberof Poor, Planning Commission, Perspective Planning Division, July.
————. (1996). Indian Minerals Year Book. New Delhi.
————. (1997). High Level Commission Report on Transforming the North East.New Delhi.
————. (1997). “Estimates of Poverty”. New Delhi: Press Information Bureau,March.
————. (2001). “Poverty Estimates for 1999-2000”. New Delhi: PressInformation Bureau.
————. (2001). Census of India, 2001, Series-13, Arunachal Pradesh, ProvisionalPopulation Total. p.3.
————. (2001). Census of India 2001, Provisional Population Totals, Series-1.
————. (2002). Annual Report 2001/02, Ministry of Power. New Delhi.
————. (2004). “Report of the Eleventh Finance Commission”.
————. (2005). Annual Report 2004/05, Ministry of Power. New Delhi.
————. (n.d.). Census of India, 1981, Part XB, Series 25, Town Survey Report.Tezu.
————. (n.d.). Census of India, 1991, Migration Table, Series 3. ArunachalPradesh.
————. (n.d.). Census of India, 2001, Provisional Population Totals, Paper 2.
————. (n.d.). Census of India, 2001, Tables on Houses, Household Amenitiesand Assets.
————. (2007). “Poverty Estimates for 2004-05”. New Delhi: PressInformation Bureau. March.
Green, H., Colin Hunter and B. Moore (1990). “Application of the DelphiTechnique in Tourism”, Annals of Tourism Research 17: 270-79.
Guha, Ramchandra (1988). “Between Anthropology and Literature. TheEthnographies of Verrier Elwin”, The Journal of the Royal AnthropologicalInstitute 4(2): 325-343.
Gupta, S. (2005). “Fiscal Policy and Development in Madhya Pradesh”, Economicand Political Weekly: 1774-82, April-23.
Haridasan, K., Sarmah, Anupan, L.R Bhuyan, S.N. Hegde, and S.P. Ahlawat(2003). Field Manual for Propagation and Plantation of Medicinal Plants, StateForest Research Institute, Department of Environment and Forest.Itanagar: Government of Arunachal Pradesh. pp.1-2.
Harley, D.C. and N.D. Hanley (1989). Economic Benefit Estimates for NatureReserves: Methods and Results, Discussion. Scotland: University of Stirling.p.16.
Harrington, J.W. and Barney Warf (1995). Industrial Location: Principles, Practice,& Policy. London: Routledge.
Hayami, Yujiro (2003). Development Economics. New Delhi: Oxford UniversityPress.
Hazarika, Proshanta (2005). Pre-Publication Draft Paper, Rain Forest ResearchInstitute, Jorhat, Assam.
Hegde, S.N. (1996). “Orchid Wealth of India”, Arunachal Forest News 14(1),SFRI. Itanagar: Government of Arunachal Pradesh.
————. (2000). “Conservation of North East Flora”, Arunachal Forest News18(1&2): 5-26.
————. (2001). Orchids: Conservation, Culture, Farming and Trade, OSA. Itanagar.
————. (2002). Arunachal Pradesh Biodiversity, Strategy and Action Plan, ForestDepartment, Itanagar.
————. (2005). “Contributions Towards Evolving A People Centered LandUse Development in the Shifting Agriculture (Jhum) Affected BufferZone of Namdapha National Park in Arunachal Pradesh”, ProceedingNational Conference on Arunachal Pradesh: Tradition in Transition, NERIST,Nirjuli.
————. (1991). “Orchids From Lab to Field in Arunachal Pradesh”, ArunachalForest News 9(1): 23-37.
————. (1984). Orchids of Arunachal Pradesh. Itanagar: Government ofArunachal Pradesh.
————. (1998). “Twenty-Five Years of Orchid Research and Development inArunachal Pradesh”, in International Festival of Orchids: Articles & Abstracts,(eds.), S.N. Hegde. Itanagar: Orchid Society Arunachal. pp.32-56.
REFERENCES 319
————. (2000b). “Commercial Cultivation of Floricultural and MedicinalPlants in Hills”. Proceeding 5th Agricultural Science Congress. Guwahati.p.1-16.
————. (2002a). “Conservation & Sustainable Use of Bio-resources throughBiotechnological Means in Arunachal Pradesh”, in Arunachal Pradesh:Environmental Plannig and Sustainable Development. (eds.), Sunderyal et al.,GBPIHED, Almorah.
————. (2002b). “Arunachal Pradesh State Biodiversity, Strategy and ActionPlan”, Forest Department. Itanagar.
Herkovits, M.J. (1952). Economic Anthropology. Alfred A. Knopf. New York.
Howes, M. and R.Chambers (1979). “Indigenous Technical Knowledge:Analysis, Implications and Issues”, IDS Bulletin 10(2): 12-13.
Howes, Michael (1979). “The Uses of Indigenous Technical Knowledge inDevelopment”, IDS Bulletin 10(2): 5-11.
IAMR (2005). Human Development in Arunachal Pradesh, Draft Report. New Delhi:Institute of Applied Manpower Research.
Indian Institute of Remote Sensing (2003). “Biodiversity Characterisation atlandscape Level in North-East India using Satellite Remote Sensing andGeographic Information System”. Dehradun: IIRS. p.296.
Industrial Development Bank of India (1972). Industrial Potential Survey.Arunachal Pradesh.
International Institute of Population Studies (IIPS) and Macro International(2007). National Family Health Survey (NFHS-3): India Volume I. Mumbai:IIPS.
————. (2002). National Family Health Survey (NFHS-2). North Eastern States.Mumbai.
IRCC (2005). Newsletter of IRCC, http://www.ircc.iitb.ac.in
Jain, Ashis (2005). “Promoting Distance Learning and Interactive Education:Role of MCBS”, http://www.edusatindia.com/rol-mcbsl.html
Jha, B.N. (2002). British Colonial Intervention and Tribal Responses in the North EastFrontier of Assam (1825-1947), Unpublished Ph.D. Thesis, ArunachalUniversity.
Jha, S.D. (1985). The Wealth of Arunachal Pradesh. New Delhi: MittalPublications.
Kakoti. B. (1983). “Geochemical Prospecting for Base Metals in the RangaValley, Subansiri District”, Arunachal Pradesh. Geological Survey ofIndia, Misc. Publication. 43: 96-99.
Kalen Lego (2003). “The Production, Exchange and Distribution System in AdiVillage: A Case Study of Ngopok Village under Mebo Circle, East SiangDistrict, Arunachal Pradesh”, Unpublished M.Phil. Dissertation,Arunachal University.
Kanjilal, P.B. (2005). Personal Communication.
Kapoor, K.C. and T. Lhungdim (2007). SSA in Arunachal Pradesh: Third HalfYearly SSA Monitoring Report (1st April to 30th September 2007), Departmentof Education. Itanagar: Rajiv Gandhi University. (processed).
Karnik, Ajit (2002). “Fiscal Policy and Growth”, Economic and Political Weekly:829-831. March 2.
Kaul R.N. and Haridasan K. (1987). “Forest Types of Arunachal Pradesh aPreliminary Study”, J.Econ.Tax. Bot. (9): 397-389.
Kayal, J.R., R. De and S. Ram (1992). “Study of Seismicity in North East Indian(Phase-I): A Micro earthquakes Survey around the Proposed Dam, RangaNadi Hydroelectric Project, Lower Subansiri District”, ArunachalPradesh. Rec. Geol. Surv. India 125(4): 136-139.
King, E.M. and M.A. Hill (eds.) (1999). Women's Education in DevelopingCountries: Barriers, Benefits and Policies. Baltimore: The Johns HopkinsUniversity Press for the World Bank.
Kondinya, Bhikhu (1985). Monastic Buddhism Among the Khamptis of North EastIndia. Delhi: National Publishing House.
Kumar, S. and Trilochan Singh (1996). “Structure, Tectonics and AssociatedOre Deposits of Subansiri District, Arunachal Pradesh, EasternHimalaya”. Jour. Geol. Soc. India 47(3): 293-302.
Kundu, A. (1983). “Theories of City, Size and Indian Urban Structure—AReappraisal”, Economic and Political Weekly 18(31): 1361-68.
Kundu, A. and A.N. Sharma (2001). Informal Sector in India: Perspectives andPolicies. (ed.), New Delhi: Institute of Human Development and Instituteof Applied Manpower Research.
Labiri, Ashok. K. (2000). “Sub-National Public Finance in India’, Economic andPolitical Weekly: 1539-49. April 29.
————. (2000). “Budget Deficits and Reforms”, Economic and Political Weekly4048-55. November 11.
Laskar, B. (1983). “Coal Measures and Resources of Coal in ArunachalPradesh—a Review” Geological Survey of India, Misc. Publication 43:110-112.
Le Clair, E.E. Jr. (1968). “Economic Theory and Economic Anthropology” inE.E. Le Clair, Hr. & H.K. Schneider, (eds.), Economic Anthropology,Readings in Theory and Analysis. New York: Holt, Rinehart and Winston.pp.187-207.
Lele, Satish (2005). “The Cultivation of Jatropha Curcas”, http://www.svlele.com
Lipton, M. and M. Ravallion (1995). “Poverty and Policy”, in Handbook ofDevelopment Economics Vol. III, J. Behrman and T.N. Srinivasan, (ed.),Elsevier Science. pp. 2551-57.
Lollen, M. (2005). The Economic Activities of the Galos. A study of Zirdo Village,West Siang Village, unpublished M.A dissertation, Arunachal University.
Lubbock, Sir John (1867). "The Stone Age: Stone Tools in Upper Assam",Athenaeum 2069: 822, June 22. London.
Luthra, P.N. (1971). Constitutional and Administrative Growth of NEFA. Shillong.
M'Cosh, J. (1937). Topography of Assam. Calcutta. p.10.
Mackenzie, A., M. (1884). History of the relations of the Government with the HillTribes of the Northeast Frontier of Bengal. Calcutta.
Mahanti, Tushar, K. (2002). “How Interest Rate Regime Makes States Step upMarket Borrowing”, Economic Times. Kolkata. p.12.
Maihu, M. (2003). Rangfra: A Study on the Institutionalization of indigenous Faith,unpublished M.Phil dissertation, Arunachal University.
Maikhuri, R.K., S. Nautiyal, K.S. Rao, and K.G. Saxena (1998). “MedicinalPlants Cultivation and Biosphere Reserve Management: A Case Studyfrom Nanda Devi Biosphere Reserve”, Current Science 14(2): 157-163.
————. (1999). “Management Planning for the Nanda Devi BiosphereReserve”, Himalayan Biosphere Reserve 1(1&2): 73-63.
Maine, Henry Summer (1906). Ancient Law, Its Connection with Early History ofSociety and its relation to Modern Ideas. London: John Murray (With anintroduction and notes by Frederick Pollock). First Published. 1861.
Manorama Yearbook (2005). “Telemedicine”, Malayala Manorama. Kottayam.pp.203-205.
Marsden, T, J. Banks, H. Renting, J.D. Van der Ploeg (2001). “The RoadTowards Sustainable Rural Development: Issues of Theory, Policy andResearch Practice”, Journal of Environmental Policy and Planning 3: 75-83.
McDougall, Lori. (2000). "Gender Gap in Literacy in Uttar Pradesh: Questionsfor Decentralised Educational Planning", Economic and Political Weekly35(19): 1649-58.
MECL (1984). Exploration Report for Coal, Namchik-Namphuk Coalfields, ArunachalPradesh, Report vol.I, Mineral Exploration Corporation Ltd. Calcutta.p.59.
MECL (1997). Appraisal of Selected Limestone and Graphite Deposits in ArunachalPrades, Cons, Report, Stage 1, Mineral Exploration Corporation Ltd.,Nagpur. p.57.
————. (2000). Geological Report on Exploration for Ferro-silicon Grade Quartzite,Kalaktang Area, West Kameng, Arunachal Pradesh, Report of the MineralExploration Corporation Ltd. Ranchi. p.25.
Mehta, S.R., M.L. Deori, and K. Haridasan (2002). “Strategies for ForestBiodiversity Conservation in Arunachal Pradesh”, in Arunachal Pradesh:Environmental Planning and Sustainable Development, edited by R.C.Sundriyal, Trilochan Singh, and G.N. Sinha, Himavikas OccasionalPublication. G.B. Pant Institute of Himalayan Environment &Development Published by Bishen Singh and Mahendra Pal Singh,Dehradun. 16: 241-247.
Meyres, N., R.A. Mittermeier, G. Mittermeier, G.A.B. da Fonseca, and J. Kents(2000). “Biodiversity Hotspots for Conservation Priorities” Nature 403:853-858.
Mibang, Tabang (2004). “Riglap (Reciprocal Cooperation) in Bilat—An AdiVillage”, in Dynamics of Tribal Villages in Arunachal Pradesh- EmergingRealities, (eds.), Tamo Mibangand M.C. Behera. New Delhi: MittalPublications. pp.115-124.
Minhas, B.S, L.R. Jain, and S.D. Tendulkar (1991). “Rural and Urban Cost ofLiving: 1983 to 1987-88, State-wise and All India”, Journal of Indian Schoolof Political Economy 3: 420-442.
Minhas, B.S., and L.R. Jain (1989). “Incidence of Rural Poverty in DifferentStates and All-India: 1970-71 to 1983”, in Agricutural Development Policy,

ARUNACHAL PRADESH DEVELOPMENT REPORT320
Adjustment and Reorientation (Golden Jubilee volume of Journal of IndianSociety of Agricultural Economics). New Delhi: Oxford and IBH. pp.342-81.
Minhas, B.S., L.R. Jain, S.M. Kansal and M.R. Saluja (1988). “Measurement ofGeneral Cost of Living for Urban India, All-India and Different States”,Sarvekshana. 12: 1-23.
Ministry of Environment and Forest (1999). State of Forest Report 1999:Arunachal Pradesh. Forest Survey of India. Dehradun: Government ofIndia.
Ministry of Finance (2005). Economic Survey (2004/2005). New Delhi:Government of India.
Ministry of Finance (2006). Economic Survey (2005/2006). New Delhi:Government of India.
————. (2004). Economic Survey 2003-04, Ministry of Finance. New Delhi:Government of India.
Ministry of Home Affairs( 2003). Perspective Transport Plan for Development ofNorth Eastern Region-Final Report 2003. North Eastern Council. Shillong.
Ministry of Non-conventional Energy Sources (MNES) website http://mnes.nic.in/annualreport/2004_2005_English/ch6_pg1.htm <last accessed inNovember 2005>
Ministry of Power (2005). website www.powermin.nic.in. Last accessed inOctober, November.
————. (2005). http://www.apdrp.com/apdrp/projects/revenue_gap_of_seb_utilities.htm. Accessed on 6th October.
Ministry of Railways (2004). Annual Report & Accounts 2003-04. Railway Board.New Delhi: Government of India.
Mishra, B.P. (1979). “Kirata Karyokinesis: Mode of Production in TribalCommunities of North East India”, in Agrarian Relations in India, (eds.),A.N. Das and V. Nilakanth. Delhi: Manohar.
Mishra, Deepak K. (2001). “Political Economy of Agrarian Change inArunachal”, Man and Development 23(3).
————. (2002). “Trade Liberalization and Subsistence Agriculture: iplicationsfor Arunachal Pradesh”, in Cross-Border Trade of North-Eastern India, (eds.),S. Dutta. Kolkata: Hope India Publication. pp.191-196.
————. (2002a). “Agrarian Structure and Labour-Use Patterns in RuralArunachal Pradesh: A Case Study”, Arunachal University Research Journal5(2): 31-56.
————. (2002b). “Institutional Arrangements and Agrarian Structure DuringPeriods of Transition: Evidences from Rural Arunachal Pradesh”, inSustainable Agriculture, Poverty and Food Security: Agenda for Asian Economies(eds.), S.S. Acharya et al., Vol.2, Asian Society of Agricultural Economists.Jaipur: Seoul and Rawat Publications.
————. (2003). “Gender and Agrarian Relations in Arunachal Pradesh: AStudy on West Kameng District”, Assam Economic Journal 16: 71-81.
————. (2003a). “Gender and Agrarian Relations in Arunachal Pradesh: AStudy on West Kameng District”, Assam Economic Journal 16: 71-81.
————. (2003b). “Environmental Degradation and Changing LivelihoodStrategies in Rural Arunachal Pradesh” Paper presented at the 45th
Annual Conference of the Indian Society of Labour Economics. Kolkata:Jadavpur University.
————. (2004). “Institutional Sustainability in Natural Resource Management:A Study on Arunachal Pradesh (India)”, Asian Profile 32(6): 583-594.
————. (2006). Rural Non-farm Employment in Arunachal Pradesh: Growth,Composition and Determinants. Project Report submitted to the V.V. GiriNational Labour Institute, Noida.
Mishra, Deepak K. and Vandana Upadhyay (2004). “Governance andDevelopment in Arunachal Pradesh: The Emerging Challenges”, DialogueQuarterly 5(4): 73-96.
————. (2007). “In the Name of the Community: Gender, Development andGovernance in Arunachal Pradesh”, in Sumi Krishna (ed.), Women’sLivelihoods Rights: Recasting Citizenship for Development. New Delhi: SagePublications India. pp.167-208.
Mishra, S.N. (1987). “Private Property Rights Formation among the High LandTribal Communities of North East India”, Social Science Probings 1.4(4).
Mithi, Mukut (2002). “Presidential Speech” in Arunachal Pradesh: EnvironmentalPlanning and Sustainable Development, edited by R.C. Sundriyal, TrilochanSingh, and G.N. Sinha, Himavikas Occasional Publication. 16: 35-38.Dehradun: G.B. Pant Institute of Himalayan Environment &Development. Published by Bishen Singh and Mahendra Pal Singh.
Mitra, A. (1997). “The Trends and Pattern of Urbanisation of ArunachalPradesh (A District-wise Study) 1971-81”, in Urbanisation and Developmentin North East India, (ed.), Ganguly, J.B. New Delhi: Deep and DeepPublication.
————. (1997). Internal Migration and Economic Development in the Hills. NewDelhi: Omsons.
————. (1998). “Environment and Sustainable Development in the HillyRegions of North East India: A Study in Arunachal Pradesh”, InternationalJournal of Social Economics 25: 196-206.
————. (1998). “Tourism Development in Hilly Regions of North East India—A Study in Arunachal Pradesh,” in Tourism in India,(eds.) K.C. Roy andC.A. Tisdell. New York: Nova Science Publishers. pp.175-186.
Mitra, A. et al. (2003). Environment and Nature-Based Tourism—An Endeavour atSustainability. New Delhi: Kanishka Publisher.
Muhammod, K.M. Anil (2005). “A Handicrafts Village Telling the Saga ofDevelopment”, Kurukshetra 53(5): 44-45, March 2005.
Mumtaza, I.S. and M. Taher (1997). “North Eastern Duars of the AhomKingdom: A Study in Historical Geography”, in Studies in the History,Economy and Culture of Arunachal Pradesh, (eds.). Dutta, Delhi.
Murty, M.N. and Susan M. Menkhaus (1994). Economic Aspects of WildlifeProtection in the Developing Countries: A Case Study of Keoladeo National Park,Bharatpur, India. Mimeo. Delhi: Institute of Economic Growth.
N.S.S.O. (1996). Employment: Key results on Employment and Unemployment,Ministry of Statistics and Programme Implementation. New Delhi:Government of India. pp.2341-50.
————. (2001). Employment and Unemployment Situation in India Part-I and Part-II, Ministry of Statistics and Programme Implementation. New Delhi:Government of India.
Nandi S.K., L.M.S. Palni and A. Kumar (eds.) (2002). Role of Plant Tissue Culturein Biodiversity Conservation and Economic Development. Nainital: GyanodayaPrakashan. p.646.
Narayan, B.N. (1997). Industrial Economics. New Delhi: Anmol Publications.
National Bureau of Soil Survey & Landuse Planning (1993). Soil Resource Atlas.Regional Centre, Jorhat in cooperation with Rural Works Department,Government of Arunachal Pradesh. Nagpur.
National Council of Applied Economic Research (1967). Techno-Economic Surveyof NEFA. New Delhi.
National Environmental Engineering Research Institute (1996). Strategy Paperon Solid Waste Management in India. Nagpur. pp.1-7.
National Institute of Open Schooling (2005). http://www.nios.ac.in/
National Sample Survey Organisation (1996). Ministry of Statistics &Programme Implementation, Government of India, Nutritional Intake inIndia, NSS 50th round, July 1993 to June 1994, Report No. 405. New Delhi,October.
————. (2007). Ministry of Statistics & Programme Implementation,Government of India, Nutritional Intake in India, 2004-2005, Report No.513(61/1.0/6). New Delhi. May.
Navrud, S. and E.D. Mungatana (1994). “Environmental Valuation inDeveloping Countries: The Recreational Value of Wildlife Viewing,”Ecological Economics 11: 135-151.
North Eastern Council Secretariat (2002). Basic Statistics of North Eastern Region2002. Shillong: Government of India.
North Eastern Regional Institute of Water and Land Management (2000).Souvenir on Seminar on Resources Management for Self Reliant AgriculturalEconomy of NE Region. Tezpur.
North, Douglass, C. (1994). “Economic Performance through Time”, AmericanEconomic Review 84(3): 359-68.
NRSA (1990). “Description and Classification of Land Use/Land Cover”Technical Report 01/90, NRSA: 1-81, July 1990.
Nussbaum, Martha (2000). Women and Human Development: The CapabilitiesApproach. New Delhi: Kali for Women.
Pamberton, B.R. (1835). Report on the Eastern Frontier of British India. Calcutta.pp.152-193.
Panda, B. (1999). “Growth, Composition and Determinants of Rural Non-FarmEmployment in Arunachal Pradesh”, The Indian Journal of Labour Economics42(2).
Parikh Jyoti and Kirit Parikh (1999). Sustainable Land and Forest Regeneration,Environmental Governance—3. Mumbai: IGIDR.

REFERENCES 321
Paroda, R.R. and R.K. Arora (1991). Plant Genetic Resources—Conservation andManagement. New Delhi: N.B.P.G.R.
Patel Surendra J. (1992). “Social Technology: A New Factor in Development”,Economic and Political Weekly: 1871-75, August 29.
Patnaik, Utsa (1996). “Export Oriented Agriculture and Food Security in Indiaand Developing Countries”, Economic and Political Weekly 31(35-37): 2429-49.
Phukan, J.N. (2002). “Arunachal’s Trade with its Neighbours during the Pre-colonial Days”, in Cross Border Trade of North East India, (ed.), S. Dutta.New Delhi: Hope India Publication.
Phukan, Purneswar, (1999-2000). A Study of Employment Structure and Income inan Arunachal Village (A case study of Rayang village under Ruksin Circle ofEast Siang District of Arunachal Pradesh, Unpublished M.Phil Dissertation,Arunachal University.
Phuken J.N. (2002). “Arunachal Trade with its Neighbours”, in Cross BorderTrade of North East India, (ed.), S. Dutta. New Delhi: Hope IndiaPublication.
Planning Commission (1993). Report of the Expert Group on Estimation ofProportion and Number of Poor, Government of India, PerspectivePlanning Division, July.
————. (2002). National Human Development Report 2001, Government of India.New Delhi: Oxford University Press.
————. (2002). Special Group on Targeting Ten Million Employment Opportunity perYear: Employment Generating Growth, available online.
————. (2002). The National Human Development Report 2001, PlanningCommission, New Delhi.
————. (2005). Personal Communication. New Delhi: Government of India.
Polanyi, Karl. (1957/1968). “The Economy as Instituted Process”, in EconomicAnthropology—Readings in Theory and Analysis, (eds.) Edward E. Leclair, Jrand Harold K. Schneider. New York: Holt Rinehart & Winston Inc.pp.122-143.
Pradhan, B.K. and M.R. Saluja (1998). “An Assessment of Poverty Studies inIndia with Special Reference to Economic Reforms”, Pakistan DevelopmentReview 37: 1081-1102.
Pradhan, B.K., D.K. Rath and Atul Sarma (1990). “Complementarily betweenPublic and Private Investment in India”, Journal of Development Economics33.
Prakash, Anand and T. Singh (2000). “Nature, Composition, Rank(Maturation) and Depositional Environment of Siwalik Coals fromArunachal Himalaya”, Himalayan Geology 21(1&2): 7-29.
Premi, M K., D.B. Gupta, and A. Kundu (1977). “The Concept of Urban Areasin the 1961-71 Census”, in Population Statistics in India,(eds.) A. Boseet al. New Delhi. pp.352-353.
Press Information Bureau (1997). “Estimates of Poverty”, Government of India,March 11.
Rajan, S. Irudaya and P. Mohanachandran (1998). “Infant and Child MortalityEstimates, Part-I”, Economic and Political Weekly 33(19).
Rajan, S. Irudaya and P. Mohanachandran (2001). "Infant and Child MortalityEstimates for Scheduled Castes and Scheduled Tribes", Economic andPolitical Weekly 36(48).
Rama Shankar and M.S. Rawat (2002). “Medicinal Plants and Their Potential inthe Economic Development of Arunachal Pradesh”, in Arunachal Pradesh:Environmental Planning and Sustainable Development, edited by R.C.Sundriyal,, Trilochan Singh, and G.N. Sinha, Himavikas OccasionalPublication. 16: 217-23. Dehradun: G.B. Pant Institute of HimalayanEnvironment & Development. Published By Bishen Singh and MahendraPal Singh.
Ramakrishnan, P.S. (1972). Shifting Agriculture and Sustainable Development: AnInterdisciplinary Study from North-east India, UNESCO-MAB Series. Paris,Carnforth, Lanes UK: Parthenon Publishing Group. pp.424.
————. (1992). Shifting Agriculture and Sustainable Development of North-EasternIndia, UNESCO-MAB series. Paris, Carnforth: Parthenon Publications.Indian Reprint. Delhi: Oxford University Press.
————. (1993). Shifting Agriculture and Sustainable Development: AnInterdisciplinary Study from North-eastern India. MAB Series 10. NewDelhi: Oxford University Press.
Rangarajan, C. and D.K. Srivastava (2005). “Fiscal Deficits and GovernmentDebt: Implications for Growth and Stabilization”, Economic and PoliticalWeekly: 2919-34, July 2.
Rao, D.P., N.C. Gautam, R. Nagaraja and P. Ram Mohan (2002). “IRS-1CApplications in Land US Mapping and Planning”, Current Science 70(7):575-81.
Rao, D.P.; N.C. Gautam, R.L. Karale and B. Sahai (1991). “IRS-1A Applicationfor Land Use/Land Cover Mapping in India”, Current Science Special issue61(3&4): 153-161.
Rao, M. Govinda and Tapas Sen (1996). Fiscal Federation in India: Theory andPractice. India: NIPFP, MacMillan.
Rath, S.S. (2005). “Fiscal Development in Orissa: Problems and Prospects”,Working paper No. 32. New Delhi: National Institute of Public Financeand Policy.
Ray, Christopher. (1999). “Towards a Meta-framework of EndogenousDevelopment: Repertoires, Paths, Democracy and Rights”, SociologiaRuralis 39(4): 521-537.
Ray, Harprasad (2005). “The Silk Route from Northeastern India to China andthe Bay of Bengal: Some New Lights” in India’s North East—DevelopmentalIssues in Historical Perspective (ed.), Barua, Alokesh. New Delhi.
RBI (2008). State Finances: A Study of Budgets of 2008-09. Mumbai.
Regional Research Laboratory (2004). Seismological Bulletin NE India–2003.Assam: Jorhat.
Registrar General, India (2005). SRS Bulletin. Also other Bulletins 39(1): 1,April.
Research, Reference and Training Division (2004). India 2004. PublicationDivision, Ministry of Information and Broadcasting, Government ofIndia. pp. 617-622.
Riba Tomo (2004). “Reciprocity during House Construction, A Bond ofSolidarity among Galo Society—A study in Disi Village of West Siangdistrict, Arunachal Pradesh” in Dynamics of tribal Villages in ArunachalPradesh- Emerging Realities(eds.), Mibang, Tamo and M.C. Behera. NewDelhi: Mittal Publications. pp.83-102.
Riba, Mibi (2005). Religious Ideologies Among the Galos under Likabali Areas,Unpublished MA dissertation for the degree in Anthropology, ArunachalUniversity.
Richardson, H.W. (1971). Urban Economics. London: Penguin.
Ringu, P. (2002). “An Action Plan for Strengthening Protected Area Networkand Eco-Development”, in Arunachal Pradesh: Environmental Planning andSustainable Development (ed.), R.C. Sundriyal, Trilochan Singh, and G.N.Sinha, Himavikas Occasional Publication 16: 249-54. Dehradun: G.B.Pant Institute of Himalayan Environment & Development. Published byBishen Singh and Mahendra Pal Singh.
Rodgers, W.A., H.S. Panwar and V.B. Mathur (2000). Wildlife Protected AreaNetwork in India: A review. Dehradun: Wildlife Institute of India.
Rowe Gene, George Wright and F. Bolger (1991). “Delphi: A Reevaluation ofResearch and Theory”, Technological Forecasting and Social Change 39: 235-251.
Rowe, Gene and George Wright (1999). “The Delphi Technique as aForecasting Tool: Issues and Analysis”, International Journal of Forecasting15: 353-375.
Roy, N.C. (2005). “A Study of Inflow of Funds from the Centre and EconomicDevelopment of Arunachal Pradesh”, Project Report submitted to ICSSR.New Delhi.
————. (2005). “Sources of Growth in the Arunachal Economy”, ArunachalUniversity Research Journal, in press.
Roy, N.C. and P.K. Kuri (2001). Land Reform in Arunachal Pradesh. New Delhi:Classical Publishing Company.
————. (1999). “Inequalities in Land Ownership and the Problems of landReforms” in A. Banerjee and B. Kar (eds.), Economic Planning andDevelopment of North-Eastern States. Delhi: Kaniska.
Royal Government of Bhutan (2001-02). Department of Revenue and Customs.
Rustagi, Preet (2000). “Identifying Gender Backward Districts Using SelectedIndicators”, Economic and Political Weekly 35(48): 4276-86.
Rustomji, Nari (1983). Imperiled Frontiers, India’s North-Eastern Border Lands.Delhi: Oxford University Press.
Saikia, A.K. (2005). Personal Communications and newspaper articles.
Saikia, P. (2003). Problems of Girls’ Education: A Case Study, Unpublished M.Phildissertation, Arunachal University.
Sangma, L., R.N. Mukhopadhyay, and S.C. Kaura (1983). A Note on the BaseMetal Investigation in Ranga Valley, Subansiri District, Arunachal Pradesh.Geological survey of India, Misc. Publ. 43: 100-109.

ARUNACHAL PRADESH DEVELOPMENT REPORT322
Sarkar Niranjan (1980). Buddhism among the Monpas and Sherdukpens. Shillong.
Sarkar, S.C. (2002). “Role of the Banking Sector in the Development ofArunachal Pradesh: Opportunities and Constraints”, in Arunachal Pradesh:Environmental Planning and Sustainable Development (eds.), Sundriyal, R.C.,Trilochan Singh, and G.N. Sinha, Himavikas Occasional Publication 16:493-98. Dehradun: G. B. Pant Institute of Himalayan Environment &Development. Published by Bishen Singh and Mahendra Pal Singh.
Sarkar, Sandip and Anup K. Karan (2005b). “Status and Potentials of VillageAgro-processing Units/Industries”, Occasional Paper-37, Department ofEconomic Analysis and Research, National Bank for Agriculture andRural Development. Mumbai.
————. (2005a). “Status and Potentials of Village Agro-Processing Units/Industries”, Occasional Paper 37, Department of Economic Analysis andresearch, NABARD, Mumbai.
Sarma, Atul (2000). “Gujarat Finances: Reform of Budgetary Management”,Economic and Political Weekly: 3125-3136, August 26.
————. (2005). “Why the North-eastern States Continue to Decelerate”, Manand Society 1(2).
————. (2006). Comments on the “Report on the Extension of BankingServices, and the Flow of Credit in the North East Region (NER)”,unpublished.
Sarma, Atul and S.K. Nayak (2006). “Growth and Equity in the Post-ReformPeriod: Experience of the North Eastern States”, Paper presented in theSilver Jubilee Conference of the CESS, Hyderabad, January 7-8.
Schultz, T.W. (1980). “Nobel Lecture: The Economics of Being Poor”, Journal ofPolitical Economy 88: 639-51.
————. (1961). “Investment in Human Capital”, American Economic Review51: 1-17.
————. (1964). Transforming Traditional Agriculture. New Haven: YaleUniversity Press.
Sharma, Mayuri (2006). An Analytical Study of Cost, Volume, Profit (CVP) of theTourism Industry in Assam with Special Reference to Kaziranga National Park,unpublished Ph.D thesis, Dibrugarh University.
Sharma, T.C. (1980). "Prehistoric Archaeology in North East India—A Reviewof Progress" in T.C. Sharma and D.N. Majumdar (eds.), Eastern Himalaya.New Delhi: Cosmo Publication. pp.102-35.
————. (1981). "The Neolithic Pattern of North Eastern India" in M.S.Nagaraja Rao (ed.), Madhu: Recent Researches in Indian Archaeology and ArtHistory. Delhi Agamkala Prakashan. pp.41-52.
————. (1991). “Prehistoric Situation in North East India”, in Archaeology ofNortheastern India (eds.), Singh, J.P. and Gautam Sengupta. New Delhi.
Sinclair, M.T. (1998). “Tourism and Economic Development: A Survey”, TheJournal of Development Studies 34(5): 1-51.
Singh S. (1999). A Resource Atlas of Arunachal Pradesh. Itanagar: Government ofArunachal Pradesh.
Singh, B.W.P. (2004). Indian Economy Today. New Delhi: Deep and DeepPublicaitons.
Singh, D.N., S.S. Chandiramani and A. Gupta Choudhury (2000). Biodiversity ofNamdapha—A Profile. Namdapha Tiger Reserve, Miao.
Singh, Gopal S. (2005). “Functional Attributes of Tribal People of WesternHimalayas: Need for Indigenous Knowledge Bases Sustainable Planning”,Journal of Human Ecology 17(4): 307-12.
Singh, K.A. (2002). “Resorce Management Perspective of ArunachalAgriculture”, ICAR, Basar, Arunachal Pradesh.
Singh, K.A. and Bag, T.K. (2002). “Options for Sustained AgriculturalProduction in Arunachal Pradesh”, in Arunachal Pradesh: EnvironmentalPlanning and Sustainable Development (eds.), Sundriyal, R.C., TrilochanSingh, and G.N. Sinha, Himavikas Occasional Publication 16: 311-330.Dehradun.: G.B. Pant Institute of Himalayan Environment &Development. Published by Bishen Singh and Mahendra Pal Singh.
Singh, K.A. and Pathak, P.S. (2000). “Productive Conservation of BambooResources and Palm Group of Plants in Eastern Himalayan Region”, inNatural Resources Conservation and Management for Mountain Development(eds.), Tiwari et al. New Delhi: Research Co. Publishing Company.
Singh, K.D. (1998). “Forest as Wealth”, Frontline 15(1): 101-102, January 10-23.
————. (2002). “Development of Natural Resources in Arunachal Pradesh,Prospects and Problems’, in Arunachal Pradesh: Environmental Planning andSustainable Development (eds.), Sundriyal, R.C., Trilochan Singh, and G.N.Sinha, Himavikas Occasional Publication 16: 109-115. Dehradun: G.B.Pant Institute of Himalayan Environment & Development. Published byBishen Singh and Mahendra Pal Singh.
Singh. S., T.P. Singh and G. Srivastava (2005). Vegetation Cover Type Mapping inMouling National Park in Arunachal Pradesh, Eastern Himalayas: An IntegratedGeospatial Approach.
Singh, Trilochan (2003). “Geological and Geomorphological Features inItanagar Capital Complex, Arunachal Pradesh”, in Itanagar: A Profiled,Joram Begi, Bhartiya Itiyhaas Sanklan Samithi, Arunachal PradeshChapter, Itanagar, pp.111-138.
————. (2005). “Landslide Hazards in North Eastern India: Perspective,Hhazard Quantification, and Knowledge Products for Design ofMitigation Strategies”, in Science and Technology for Regional Development:Case for North-East India(eds.), S.K. Dolui and C. Mahanta. TezpurUniversity, pp.46-56.
Singh, Trilochan and Tewari, P. (2005). “Impact of Earthquake Disasters onNew Urbanization Pattern in North East Region of India”, in AbstractVolume of the International Conference on Energy, Environment and Disaster(ed.), H.I. Inyang (INCEED, 2005). Charlotte, NC, USA, July 24-30.
Sinha, J.N (2008). "Forest and Forestry in Arunachal Pradesh", SFRI Bulletin.Itanagar: State Forest Research Institute.
Sitaram, M.V.D. (2003). “Recent Earthquake Activity in North-East India andits Vicinity” in Report on Disaster Management in NE Region: Floods andEarthquakes organized by Department of Revenue. Kolkata: Governmentof Assam and UNICEF. pp. 35-45, 28-29 June 2003.
Sivaramakrishnan, K.C., A. Kundu, et al. (2005). Handbook of Urbanisation inIndia. Oxford.
Solow, Robert M. (1957). “Technical Change and the Aggregate ProductionFunction”, The Review of Economics and Statistics 39: 312-320.
Srivastav, Nirankar and A. Dubey (2004). “How and Why the Access to PublicDistribution System does not Enhance the Food Security among thePeople of North-East India”, in Globalisation and Development Dilemma:Reflection from North East India (ed.), M.C. Behera. New Delhi: MittalPublications.
State Bank of India (2005). State Level Bankers Committee Meeting for ArunachalPradesh, Agenda-cum-background papers, SBI Lead Head Office (N.E. Circle).Guwahati: Lead Bank Department.
State Forest Research Institute Bulletin (2003). Field Manual for Propagation andPlantation of Medicinal Plants, No. 15.
State Planning Department (2002). Draft Tenth Five Year Plan and Annual Plan2002-2003. Itanagar: Government of Arunachal Pradesh.
Statistical Abstract of Arunachal Pradesh (2004). Directorate of Economics &Statistics. Itanagar: Government of Arunachal Pradesh.
Steel, E.H. (1870). "Celt Found among the Namsang Nagas", Proceeding ofAsiatic Society of Bengal (PASB). Calcutta. pp.267-68.
Sunderyal et al. (Undated). “Biotechnological Means in Arunachal Pradesh”,Arunachal Pradesh: Environmental Planning and Sustainable Development.Almorah: GBPIHED.
Taidong, W. (2005). Agrarian Economy of the Longchang: A Study on the VillageRangkatu, unpublished dissertation submitted for MA degree inAnthropology to Arunachal University.
Talukdar, A. (2005). Personal Communications. Research, Reference and TrainingDivision (2004). “India 2004”, Publication Division, Ministry ofInformation and Broadcasting, Government of India. p.638.
Talukdar, A.C. (2000). Keynote address in a seminar on “Society andGovernance in Arunachal Pradesh”, organised by the department ofTribal Studies, Arunachal University, sponsored by Omeo Kumar DasInstitute of Social Studies, Guwahati.
Tata Consultancy Service (1997). A Report on Master Plan for Industrial Sector,Arunachal Pradesh. Vol. I and II. Calcutta.
The Telegraph (2005). “The Future is Here”, p.19, 1 September.
————. (2005). “Green Fuel Boost to Mizoram”, p.18, 23 November.
Tisdell, C.A. (1991). Economics of Environmental Conservation. Amsterdam:Elsevier Science Publications.

REFERENCES 323
————. (1997). “Ecotourism: Aspects of its Sustainability and Compatibility”,Working Paper No.20. Australia: The University of Queensland.
Tisdell, C.A. and Clevo Wilson (2000). “Economic Educational andConservation Benefits of Sea Turtle Based Ecotourism: A Study Focusedon Mon Repos”, Working Paper No.52. Australia: University ofQueensland.
Todaro, M. P. (1997). “Urbanization and Rural-Urban Migration: Theory andPolicy”, in Economic Development, Michael P. Todaro, Edition: Sixth,London: Addison Wesley Longman. pp.263-94.
United Nations Development Programme (1990). Human Development Report.New Delhi: University Press.
Upadhyay, V. (2005). “Women as Micro-Entrepreneures: Towards anAlternative Strategy of Poverty Reduction in Arunachal Pradesh”, RajivGandhi University Research Journal 8(2).
————. (2006). Project Report on “Employment and Earnings in UrbanInformal Sector: A Study on Arunachal Pradesh”, submitted to V.V. Giri.Noida: National Labour Institute.
————. (2002). “Labour Migration in Arunachal Pradesh: The GenderDimension”. Arunachal University Research Journal l.5(1): 77-86.
Upadhyay, V. and Deepak Mishra (2004). “Micro Enterprises in HillEconomies: A Study on Arunachal Pradesh”, The Indian Journal of LabourEconomics 47(4).
————. (2005). A Situational Analysis of Women and Girls in Arunachal Pradesh.New Delhi: National Commission for Women.
Vaidyanathan, A. (1994). “Labour-Use in Rural India: A Study of Spatial andTemporal Variations”, in Non-agricultural Employment in India: Trends andProspects (eds.) P. Visaria and R. Basant. New Delhi: Sage.
Valdiya, K.S. (2002). “Geodynamic perspective of Arunachal Pradesh: Bearingon Environmental Security and Planning for Development”, in ArunachalPradesh: Environmental Planning and Sustainable Development (eds.),Sundriyal, R.C., Trilochan Singh, and G.N. Sinha, Himavikas OccasionalPublication 16(1-5). Dehradun: G.B. Pant Institute of HimalayanEnvironment & Development. Published by Bishen Singh and MahendraPal Singh.
Verma, R.K., G.S. Roonwal and Y. Gupta (1993). “Statistical Analysis ofSeismicity of NE India and Northern Burma during the Period 1979-1990”, Jounal of Himalayan Geology 4(1): 71-79.
Vijaya Raghavan, G. and Nair, V.S.M. (2004). “E-Governance: Leveraging IT forReinventing the Government”, Manorama Yearbook: 130-138.
Virmani, Arvind (1982). “Credit Markets in Developing Counties: Myth andReality”, Greek Economic Review 11(1).
————. (2005). “Institutions, Governance and Policy Reforms: A Frameworkfor Analysis”, Economic and Political Weekly, May 28–June 4.
Walsh, R.G. (1986). Recreation Economic Decision: Comparing Benefits and Costs.USA: Venture Publishing.
Wheeler, R.E.M. (1959). Early India and Pakistan. London: Thames and Hudson.
World Bank (1990). World Development Report. New Delhi: Oxford UniversityPress.
————. (1997). World Development Report. New Delhi: Oxford University Press.
World Health Organization (2005). “FactSheetJune-2005”, http://www.who.int /mediacentre/factsheets/fs292/en/index.html
Worman, E.C. (1949). "The Neolithic Problem in the Prehistory of India",Journal of Wahington Academy of Science 39(6): 181-201. Washington.
www.cea.nic.in, last accessed in October-December 2005. New Delhi: CEA.Ministry of Power, Government of India.

ARUNACHAL PRADESH DEVELOPMENT REPORT324