arts, culture & libraries committee - dallasdallascityhall.com/government/council meeting...
TRANSCRIPT


Arts, Culture & Libraries Committee Meeting Record
DRAFT
Page 1 of 2
Meeting Date: January 20, 2015 Convened: 3:00 p.m. Adjourned: 3:59 p.m.
Committee Members Present:
Philip T. Kingston, Chair Monica R. Alonzo, Vice Chair Jerry R. Allen Vonciel Jones Hill Carolyn R. Davis Jennifer Staubach Gates Council Members Present:
Committee Members Absent:
Briefing Presenters:
Kjerstine Nielsen, Assistant Director, Dallas Public Library Juanita Ortiz, Assistant Director, Dallas Public Library David Fisher, Interim Director Office of Cultural Affairs
Staff Present: Joey Zapata, David Fisher, Kjerstine Nielsen, Juanita Ortiz, Malachy Udoh, Chris Soto, Eric Izuora
Special Guests
AGENDA:
1. Approval of November 17, 2014 Minutes Presenter(s): Information Only: Action Taken/Committee Recommendation(s):
A motion was made to approve the minutes of November 17, 2014
Motion made by: Monica R. Alonzo Motion seconded by: Vonciel Jones Hill Item passed unanimously: Item passed on a divided vote: Item failed unanimously: Item failed on a divided vote:
2. Expanded Library Hours and Services
Presenter(s): Juanita Ortiz & Kjerstine Nielsen Information Only:

Arts, Culture & Libraries Committee Meeting Record – January 20, 2015
Page 2 of 2
Action Taken/Committee Recommendation(s):
This briefing updated the Committee on newly implemented operating hours and services at Dallas Public Library locations.
CM Davis requested a meeting to discuss programs at the Martin Luther King Jr. branch library.
3.
WRR Radio Update
Presenter(s): David Fisher Information Only:
Action Taken/Committee Recommendation(s):
This briefing provided the committee an overview of the history, current activities, and future direction of WRR 101.1.
4. Authorize a Memorandum of Understanding with the State Energy Conservation Office for Energy Projects at Office of Cultural Affairs Facilities – January 28, 2015 Council Agenda
Presenter(s): Information Only: Action Taken/Committee Recommendation(s): Motion for approval on the January 28, 2015 Council
Agenda.
A briefing memo was provided for this item.
A motion was made to approve this item.
Motion made by: Monica R. Alonzo Motion seconded by: Vonciel Jones Hill Item passed unanimously: Item passed on a divided vote: Item failed unanimously: Item failed on a divided vote:
________________________________________________ Councilmember Philip T. Kingston Chair


February 17, 2015
Building Tech Careers for U.S. Veterans
Benefit Concert Hosted by NPower, 7-Eleven
and PepsiCo
Presentation to Arts, Culture & Libraries
Committee

NPower / Proprietary and Confidential / Not for Distribution 2
About NPower
• Mission : Mobilize the tech community and provide individuals, nonprofits and schools opportunities to build tech skills and achieve their potential
• Regional offices in North Texas located in DCCCD Bill J. Priest Center
• Two core programs to fulfill mission
• The Community Corps (TCC), a skills-based volunteering program connecting technology professionals with high impact nonprofits and innovative education partners
• Technology Service Corps (TSC) a technology-focused, workforce development program meeting the needs of young adults and veterans.
• Board Leadership from Fortune 500 Companies
• Representation from Bank of America, Citi, Merck, Morgan Stanley, JP Morgan Chase, PepsiCo, 7-11, World Wide Technology and more

NPower / Proprietary and Confidential / Not for Distribution 3
NPower Supporters

NPower / Proprietary and Confidential / Not for Distribution 4
About NPower Jazz Dallas Benefit Concert
Building Tech Careers for U.S. Veterans Benefit Concert
Hosted by NPower, 7-Eleven and PepsiCo
Featuring Terence Blanchard + Friends
DATE: TUESDAY, APRIL 7, 2015 at 8:00PM
MORTON H. MEYERSON SYMPHONY CENTER
Tickets available NOW:
TicketDFW.com or Call 214-871-5000

NPower / Proprietary and Confidential / Not for Distribution 5
About NPower Dallas Technology Service Corps - VIDEO
Watch Full Video on www.youtube.com/NPowerOrg

How You Can Help:1. Spread The Word
a. Add our Benefit Concert to your constituent newsletter blasts
b. Post Event details across social mediac. Mention to your local veteran contacts &
organizationsd. Include event in upcoming
speeches/interviews2. Buy a Ticket / Attend the concert3. Visit www.npower.org

Destination 2020
Comprehensive Plan
DRAFT Revised – 3 Feb 2015

2
Table of Contents Comprehensive Plan
“Our Needs, Our Kids” pp. 3-4 The Board’s Charge: A Comprehensive Plan p. 5 Destination 2020: Goals and Outcomes p. 6 Narratives of Key Future Academic Programs pp. 7-28
Early Childhood p. 7 Public School Choice p. 12 Career and Technical Education p. 20
Overall Districtwide Facilities Needs pp. 25-28 School-by-School DRAFT Facilities Plans pp. 29-51 Funding Implications pp. 52-53 Appendix pp. 54-62

3
“Our Needs, Our Kids”
"My interest is in the future because I am going to spend the rest of my life there."
- Charles F. Kettering, American inventor
A skilled and educated population has never been more critical to a city’s overall success than it is today. A strong public education system enables almost everything that makes a city worth living in – economic competitiveness; a capable workforce that can meet the demands of desirable employers; increased productivity; higher incomes; less poverty; an active and engaged democracy; a dynamic citizenry. Education is the bedrock for a thriving, happy city.
As Dallas continues to grow and transform into a city of tomorrow, so too must its public education system. Dallas ISD needs to prepare its students to thrive in a future world that will continue to change rapidly and at times unpredictably. Thriving, not just surviving, in the future requires the ability to think critically and creatively, solve problems with no obvious solutions, make judgments about alternative points of view, communicate effectively, work collaboratively with people from diverse backgrounds, and navigate unprecedented levels of information. It demands that students are resilient, imaginative, and curious about the world around them.
To build a learning environment that produces these outcomes, we must think about the future in innovative and transformative ways. Doing the same things we have always done and expecting different results is not a recipe for success. By implementing our district’s strategic plan, Destination 2020, we have laid a solid foundation for success through a laser-like focus on the quality of instruction our students receive. While this focus will never cease, we are now poised to move from a good system to a great system through bold steps:
The first step in this transformation process is to invest heavily in Early Childhood Education. A growing body of national research continues to prove that even one year of high-quality Pre-Kindergarten delivered to 4 year olds has enormous educational, social, and economic returns. With 85% of a child’s brain development taking place before a child reaches age 5, the early years build the foundation for life-long success. Study after study shows that there is no greater educational investment than early childhood.
The second step is to invest heavily in Public School Choice. As we seek to ensure all students graduate from high school ready for college and/or career, Public School Choice will be a mechanism for growing the range of options so that all students can (if they and their families choose) attend a “best-fit” school – more specifically, a school where educators can deeply engage students by tapping into their individual interests, aspirations, and learning styles. New choice schools – whether they be Montessori schools, International Baccalaureate (IB) schools, fine arts schools, or science/technology/engineering/math (STEM) schools – will offer instructional approaches and themes attractive to families from all backgrounds and walks of life.

4
Ideally, this leads to more economically diverse student bodies in these choice schools, which research shows benefits students academically and socially.
The third step is to invest heavily in Career and Technical Education (CTE). The district seeks to align its career programs with regional workforce projected demand. College and Career Readiness staff members will continue to work closely with higher education and workforce partners to identify regional workforce needs. They will create aligned secondary and postsecondary education and training programs that prepare Dallas ISD graduates for living wage positions in fields that offer career advancement opportunities. Essentially, the district’s goal is to create a “career ladder” for students starting in secondary school so that they may “climb” to a living wage career.
As we continue to plan for current and future academic needs, including Early Childhood Education, Public School Choice, and CTE, we must also remember that all student learning happens in a “built environment” which requires periodic investment from the community. Over the coming years we will need more facilities to house our earliest youngsters; we will need more facilities conducive to the instructional approaches and themes of our new choice schools; and we will need more facilities that can efficiently offer career and technical programs, particularly those that require specialized equipment. Moreover, we must tackle our general facilities’ needs, especially school buildings which are seriously over-crowded and/or in poor condition.
Clearly, addressing our many academic and facilities needs is critical for the future. It goes without saying that resources are finite. The challenge is to balance all of these needs – from traditional renovations to future choice schools – in a way that keeps student achievement at the forefront. To that end, the administration has compiled this DRAFT Comprehensive Plan, as requested by the Board of Trustees. The draft suggests approximately $1.5 billion in possible investments. We believe that it is a bold, transformative, data-driven plan in which our students’ academic needs drive the facilities investments in an aligned way.
At the same time, we acknowledge that we do not have all of the answers, which is why this document is simply a draft that is open to revision. Over the coming months, the Future Facilities Task Force (FFTF), which is comprised of 27 community members from across the city, will take this draft plan, review it for alignment with district priorities, gather deep input from community stakeholders, and revise the plan to ensure that it creates a “built environment” conducive to our students’ academic needs. Our hope is that this document serves as a helpful starting point for the FFTF to begin its work.
Ultimately, investments of this size and scope require the support of the voters – a responsibility that we do not take lightly. Throughout history, education has proved to be the ultimate return on investment. It will enrich our city in ways we cannot yet imagine and give our children a brighter future. To keep pace with Texas, with the nation, and with the world, we must continue to invest in the future of this great city: our children. What we invest in today, we will reap the benefits from tomorrow and for years to come.

5
The Board’s Charge: A Comprehensive Plan Dallas ISD’s strategic plan, Destination 2020, describes how the administration plans to transform the district into one that significantly improves the ability of the district to graduate students who are college and career ready. It also outlines the key goals and objectives for the district over the next several years. While the Destination 2020 plan is comprehensive and includes numerous initiatives, most of those initiatives will be paid for with existing district funds. However, there are key priorities which require significantly greater investments in order to accomplish the type of ground-breaking reforms called for by Destination 2020. In the spring of 2013, the Dallas ISD Board of Trustees tasked the administration with developing a long-term comprehensive plan that aligns with Destination 2020. To that end, the administration is now proposing this initial DRAFT Comprehensive Plan to the Future Facilities Task Force (FFTF) for their review and revision and to ultimately make a final recommendation to the Board. This draft Comprehensive Plan describes the major investments in programs and facilities that the district will have to make over the next five years in order to accomplish our goals. This document proceeds in five major sections.
The first section is a brief overview of major goals and outcomes included in the district’s strategic plan, Destination 2020.
The second section provides detailed narratives of key future academic programs which will require significantly greater investments in order to be accomplished.
The third section presents an overview of the district’s overall future facilities needs, which will ultimately need to be aligned with the district’s future programmatic needs.
The fourth section lays out in detail the DRAFT school-by-school facilities plan. The fifth section outlines funding implications of both the programs and facilities.

6
Destination 2020: Goals and Outcomes
Our picture of success features high school graduates who are entering college straight from high school or entering the workforce prepared for a Year 2020 workplace. We resolve to have the highest college- and career-ready percentage of graduates of any large urban district in the nation. Specifically, by September 2020, we expect:
90% of our students to graduate on time. 40% of our students to attain a 21 or higher composite
score on the ACT exam or SAT of 990 on Reading/Math.
75% of our students to be proficient on the “Year 2020 workplace readiness assessments.”
80% of our students to enter college, the military, or a “career-ready job” straight from high school.
Achieving these goals requires significant changes in the way the district has operated in the past and a sense of urgency with regard to raising student achievement. The distance we have to travel combined with the numerous systemic problems facing the district necessitated the initiation of reform efforts on multiple fronts. The plan is designed with the understanding that any organization can only sustain change commensurate with its capacity, resources, and leadership density. To this end, we prioritized the key actions we will take under five core domains which have guided our actions from the beginning:
1) Reinforcing Core Beliefs 2) Investing in People 3) Focusing on the Classroom 4) Strengthening our Systems 5) Engaging Parents and the Community.

7
Narrative of Key Future Academic Programs As Destination 2020 moves forward into the future, we will be asking the community to support a large investment in the following key academic programs: 1) Early Childhood Education; 2) Public School Choice; and 3) Career and Technical Education.
With 85% of a child’s brain development taking place before a child reaches age 5, the formation of cognitive and character skills during the early years of a child’s life will provide the foundation necessary for future school, college, career, and life success. Through an intensified commitment to provide necessary developmental interventions to our children during the 0 to 5 years, the district can change the odds in the favor of even our most “at-risk” students before they begin their first day of kindergarten. Early Childhood Education (ECE) Strategic Vision Dallas ISD's Early Childhood Education strategic vision is to maximize the number of children who enter kindergarten ready to learn and excel. The district will work with the local community to provide quality education experiences to children as young as birth in order to better prepare them. As part of this strategy, the district will provide pre-kindergarten to eligible three and four year olds and set an anchor vision to collaborate with partner organizations to drive school readiness for children and their families from age 0 to 5. Currently, only 38% of Dallas ISD students begin kindergarten “school ready.” Destination 2020 early childhood investments will focus on the goal of dramatically increasing our district’s kindergarten readiness rate. The strategic priorities necessary to accomplish this include:
Serving all eligible 4 year olds and a meaningful percentage of eligible 3 year olds by investing in infrastructure and generating parental demand for Pre-K.
Dramatically improving quality standards across the Pre-K program. Aligning resources throughout the community to create a wall of support for children
beginning as early as birth. Pre-Kindergarten A growing body of national research continues to prove that even just one year of high quality Pre-K delivered to 4 year olds can have enormous educational, social, and economic returns. Acting on the research, the district has led efforts to align local organizations and advocates from across the community in promoting the long-term value of quality Pre-K for our students. By continuing
1. Early Childhood Education

8
to create awareness for the importance of early learning, more families than ever will seek high-quality preschool opportunities for their children in the years to come. This is encouraging news as statistical modeling of local student achievement data illustrates that a child attending Pre-K in Dallas ISD is approximately 350% more likely to reach kindergarten “school ready” than a child not attending Pre-K in the district. Yet, in order for our children to realize the full returns promised by the research, the district must place significant focus and investment towards raising the quality of our pre-kindergarten classrooms. Despite the clear benefits, children with the advantage of currently attending Dallas ISD Pre-K still have less than a 50% chance of being “school ready” by kindergarten.
This is not surprising for a Texas school district when one considers that, in the most recent “State of Preschool” report released by the National Institute of Early Education Research (NIEER), only 20% of best-practice quality benchmarks were met by the State of Texas pre-kindergarten program. In Dallas ISD, we can and will do better. By maintaining our commitment to full-day Pre-K for 4 year olds (despite only receiving funds for a half-day
program from the state) and increasing our standards for classroom quality, the district will meet the key quality benchmarks necessary to transform kindergarten readiness rates by 2020, including improved specialized teacher (and teaching assistant) training, adult to student ratios, and on-site classroom monitoring from content specialists. In addition to the programmatic investments necessary to significantly improve access and quality of Dallas ISD Pre-K for 4 year olds, research in recent years highlights great benefits to short-term and long-term student achievement of providing children with two years of quality Pre-K beginning at 3 years old. With more than 13,000 estimated eligible 3 year olds unable to take advantage of the opportunity for state-funded Pre-K due to the lack of district infrastructure necessary to serve them, Dallas ISD must focus attention on establishing stronger partnerships with private child care centers throughout the area. Through the creation of smart public-private partnership models, the district can help incentivize private child care operators to improve educational quality standards. This allows our community to reach even more children with educational interventions that will impact school readiness levels of our early learners. Program improvements of such magnitude will require aggressive investment, and we estimate that our annual commitment to Pre-K education must grow $45 million by the Year 2020. (See Table 1; this is the amount that we would spend beyond current expenditures and beyond the amount provided by the state for Pre-K education.)

9
Table 1 Birth to 5 – Parent & Community Engagement To best support our kids during their most formative years, Dallas ISD must partner with parents and community organizations that recognize the importance of early education. Historically, the district operated the Home Instruction For Parents of Preschool Youngsters (HIPPY) program to help parents meet the developmental needs of their children within the home environment. However, the district can do more, which means strategically investing in research-based home visitation programs and curriculum-aligned parent engagement and resources. As part of the Destination 2020 plan, Dallas ISD will:
(1) Anchor the community with a simple, unifying focus on kindergarten readiness around which everyone can rally.
(2) Measure and report data to the public to advocate for quality across birth to 5 early education services, regardless of institution or program.
(3) Scale and align parental engagement programs to provide systemic and continuous alignment of family needs to support children beginning at birth.
To this end, the district will ramp up efforts to build a strong coalition among community leaders and area service providers to raise awareness for families of the tools and opportunities they have throughout the community to support the healthy development of their children during the most formative years. By the Year 2020, we plan to increase our investment in these efforts by more than sevenfold (see Table 2).
Investment in Pre-K Programs
Year # of students Kindergarten Ready Amount
2014 – 2015 4850 $5,000,000
2015 – 2016 5000 $7,000,000
2016 – 2017 5400 $11,000,000
2017 – 2018 6400 $22,000,000
2018 – 2019 7500 $35,000,000
2019 – 2020 8400 $45,000,000

10
Table 2
Investment in Birth to 5 – Parent & Community Engagement
Year # of Families Reached Amount
2014 – 2015 +600 $1,000,000
2015 – 2016 +1800 $3,000,000
2016 – 2017 +3000 $5,000,000
2017 – 2018 +4800 $8,000,000
2018 – 2019 +6500 $10,000,000
2019 – 2020 +10000 $15,000,000
Early Childhood Facilities The Destination 2020 early childhood strategy requires that all eligible 4 year olds and a meaningful number of 3 year olds be able to access Pre-K within their home neighborhood’s elementary school attendance zone. To best meet the growing demand in the short-term, while also ensuring the level of quality necessary to meet Destination 2020 goals, the district recommends making initial investments for improvements and new Pre-K classrooms at elementary schools that (A) are currently so far above utilization that preschool students are forced to attend class in what will soon be outdated portables, and/or (B) have insufficient space to serve large numbers of preschool-aged children in the surrounding neighborhood, and/or (C) will have insufficient space in the near future to serve large numbers of preschool-aged students in the surrounding neighborhood based on our best population growth estimates. Figure 1 provides estimated shifts in the population of eligible 4 year olds by elementary attendance zone between now and 2018. While the overall population of 4 year olds within the entirety of Dallas ISD boundaries is expected to remain flat, there will be a significant redistribution of population from the inner city to the outer perimeter of the district. By aligning planning for new facilities to these population projections, the district can ensure our 4 year old students will not have to travel across town to access high quality Pre-K.

11
Figure 1 By 2018, the Pre-K population is expected to move away from the center of the city and towards the perimeter areas. Red attendance zones are predicted to have shortages of Pre-K classrooms and green attendance zones are predicted to have surpluses of Pre-K classrooms.
In the short term, we will address Pre-K needs with additions to our elementary school buildings. Additionally, plans for new elementary schools will include adequate space to serve our early learners.
# Classrooms -4; -5; -6 -3 -2 -1 1 2 3; 4

12
Families have an increasing number of choices for the type of K-12 education their students receive. The educational ecosystem continues to see different types of schools and instructional choices offered by private schools, charter organizations, online learning institutions, and even some traditional public school districts. However, public education as a whole needs to adapt much quicker in order to compete by providing its own options and a differentiated menu of instructional methodologies. Students in Dallas ISD currently exercise choice through a number of mechanisms. In 2013-14, 19,4021 students transferred away from their zoned school to another Dallas ISD school by choice: 10,286 exercised a magnet transfer, 6,959 exercised a hardship transfer, and the remaining 2,157 exercised parent public school choice through No Child Left Behind, Public Education Grant transfers, etc. Although 12% of the student population are exercising choice, the current system of choice has inequities:
Magnet school admission criterion preclude some students from accessing a desired instructional program,
Magnet school admission and enrollment do not reflect districtwide student demographics (among students admitted to a magnet program for 2013-14, 59% were Latino, 19% were black, 12% were white; districtwide, 70% of students are Latino, 24% are black, 5% are white),
Demand exceeds capacity in the 20 highest-enrollment programs (72% of applicants to the 20 most popular programs were either denied admission or placed on a waitlist for 2013-14), and
Only 34 students took advantage of a PEG transfer in 2013-14, although there were 35 Dallas ISD campuses on the 2013-14 PEG list.
As Dallas ISD seeks to ensure all students graduate from high school ready for college and career, Public School Choice will be a mechanism for growing the range of options so that all Dallas ISD students can attend a best-fit school. These are schools where educators more meaningfully and deeply engage students intellectually by tapping into their specific interests, aspirations, preferred learning styles, personal circumstances, and values. In this sense, choice can be a game-changer for many, many students. It can change the lens through which they look at their own education.
1 This excludes another ~10,000 students who transfer for other reasons, e.g., special education placement, Pre-K, alternative education placement.
2. Public School Choice
Choice can be a game-changer for many, many students. It can change the lens through which they look at their own
education.

13
Currently in Dallas ISD, choice manifests primarily through a number of magnet schools, which are among the best public schools in the entire country. However, as mentioned earlier, admission criterion and space limitations preclude many students from attending.2 Over the coming years, the Dallas ISD Office of Transformation and Innovation will help expand Public School Choice options for all students, regardless of their academic abilities or geographic constraints. Future choice schools offered by Dallas ISD will include a variety of instructional approaches and content/themes, such as the following:
Montessori schools International Baccalaureate (IB) schools Single-gender schools Early college schools Community schools Personalized learning schools Military/Leadership academies Schools for STEM, visual and performing arts, business/entrepreneurship,
government/world affairs, health, humanities, and communications Dual-language schools
By 2020, Dallas ISD would have launched 35 new choice schools that reflect student, parent, educator, and community demand. Some choice schools will be original, start-up, open enrollment schools that open in previously vacant or new school buildings or in non-traditional spaces. Other choice schools will be existing neighborhood schools that stay in their existing facilities and keep their traditional attendance boundaries. Although the district will provide broad parameters on the new offerings, school leadership teams will voluntarily self-select to design and launch a new choice program through a competitive application process. The district will widely publicize opportunities to apply and adhere to strict application and selection timelines to ensure that selected teams have ample time to prepare. Public School Choice will grow from the ground-up to ensure a high-degree of local ownership, investment, and input.
New Dallas ISD choice schools will have high expectations for student achievement but also greater autonomy to realize student achievement targets. Depending on the flexibility needed to successfully implement proposals, schools may be supported with autonomies in budget/allocation of funds, the structure of the school day, the use of time and talent, etc. From the schools’ planning year to initial launch and beyond, the Office of Transformation and Innovation, along with other district departments, will provide tailored academic and operational support to ensure success of all choice schools.
The theory of action is clear: if all students are in a high-quality, best-fit school, then they will realize their full academic potential.
2 Click here to see the various magnet academic admissions requirements: http://www.dallasisd.org/cms/lib/TX01001475/Centricity/Domain/2738/magnet_requirements.pdf

14
Three Categories of Choice Schools New Dallas ISD choice schools that come out of the competitive application process will be unique and nuanced in their instructional approaches and content/themes. We will likely see a wide array of offerings that are approved, from Montessori schools to STEM schools to single-gender schools. However, no matter how different they look in practice, they will all fit into one of three categories:
Transformation Schools Innovation Schools Expansion Schools
Transformation Schools
Dallas ISD has several vacant school buildings that with some renovations could become schools again, as well as new building projects on the horizon over the coming years. Additionally, there are non-traditional spaces throughout the district that could and should be utilized (e.g., additional space at a local community college; unused corporate office space; etc.). In these vacant/new school buildings and non-traditional spaces, Transformation Schools will find a home. Transformation Schools will be new, start-up, open enrollment schools. No Transformation School will be able to institute academic admissions requirements – in other words, they remain open to all students regardless of their academic abilities. Beginning in August 2016, the goal is to launch four (4) Transformation Schools equitably across the district, assuming the availability of acceptable facilities. Transformation Schools will be open enrollment for students across the entire district, though there will likely be a priority enrollment window for students within a particular mileage radius. Transportation will be provided. Transformation Schools should seek to offer instructional approaches, content, and themes that are attractive to Dallas ISD families of all backgrounds, which would lead to more economically diverse student bodies. Research substantiates civic, social, and cognitive benefits for all students who learn in economically diverse settings.3 Two types of school leadership teams are eligible to apply to become a Transformation School:
Existing Dallas ISD school leadership teams that want to open a new school. Proposed Dallas ISD school leadership teams that meet certain criteria.
3 See Richard Kahlenberg, All Together Now, Brookings Institution Press, 2001.
Transformation Schools should seek to offer
instructional approaches, content, and themes that
are attractive to Dallas ISD families of all backgrounds,
which could lead to more economically diverse
student bodies.

15
Because Transformation Schools will be entirely new from the ground up, there will not be any existing staff. As such, leadership teams of Transformation Schools will be able to hire and select their own staff.
Innovation Schools Innovation Schools will be existing neighborhood schools that want to do their academics differently but stay in their current facility and keep their traditional attendance boundaries, which will allow them to exercise choice autonomies while maintaining their neighborhood identity. The Innovation School pathway enables neighborhood schools to raise their hands and be heard in a meaningful way when submitting an application to become a Dallas ISD choice school. No Innovation School will be able to introduce academic admissions requirements, and no existing neighborhood school will be repurposed into a full open enrollment school. To be considered for the Innovation School pathway, the school will need to propose a “strategic re-design” of their traditional school, rather than simply proposing the addition of a few small-scale programs. By definition, choice schools will showcase a single “anchor model” around which all teaching and learning happens. Innovation Schools would keep their traditional attendance zones with the understanding that any additional seat capacity would be filled with the following priorities:
Students that are both in the feeder pattern and in an “Improvement Required” school Students in the feeder pattern only Students in “Improvement Required” schools outside of the feeder pattern Students districtwide
Every child within the traditional attendance boundary will have a seat at the Innovation School, if the student and family wish. If a family zoned to an Innovation School does not prefer the repurposed program and wishes to opt-out, the district will provide transportation for the child to attend another nearby school. Campuses currently identified as “Improvement Required” under state accountability standards will not be eligible to apply. Only an existing neighborhood school leadership team can apply for its current school to become an Innovation School. Innovation Schools will have existing staff. Leadership teams of Innovation Schools will be required to communicate the repurposed programming to all staff members along with ensuring staff buy-in within the Public School Choice Proposal. If a staff member chooses to stay at the repurposed choice school, they will be allowed to remain and receive the necessary professional development. If a staff member is uncomfortable with the new approach and would like to transfer elsewhere, the district will allow him/her the opportunity to apply for other positions in the district.
16
Expansion Schools Dallas ISD has existing public choice options that manifest in the form of Magnet schools. Some of these schools may wish to expand their offerings to more students. Magnet schools with track records of success should be allowed to expand. Proposals for expansion will be evaluated on a case-by-case basis, depending on various factors such as the quality, feasibility, and cost of the proposal itself, facility availability, transportation implications, enrollment patterns, etc. Existing Magnet schools with academic admissions requirements can keep them. Guiding Principles
Substantial unlocked potential exists within Dallas ISD to empower all students and families with an array of attractive public schooling options, regardless of academic ability or geographic constraints.
The ground-up application process allows everyone a chance to raise their hand and be heard in a meaningful way. What comes out of the application process is a manifestation of student, parent, school, and community interests, desires, values, and needs.
Neighborhood schools should be able to exercise choice autonomies while maintaining traditional neighborhood identities and attendance boundaries.
Quality matters. The quality of choice schools is just as important as bringing them into existence. This is why the application process is rigorous and competitive. Applicant teams that stand the best chance of approval will be those that have a prior track record of success and already have the right foundations to launch a re-design under an anchor model. This means having a trend in student growth, a data-driven culture, strong evidence of buy-in, and a sophisticated level of instruction, collaboration, and professional development. Also, once launched, choice schools’ performance will be continually monitored and evaluated.
Dallas ISD is committed to an equitable distribution of choice offerings across the district. That means equity in the number of choice schools and equity in the types of instructional approaches/content/themes.
Parents and communities will be regularly informed about their various choice options and the performance record of these options.
The instructional approaches, content, and themes offered should be attractive to Dallas ISD families of all types of backgrounds.
District Support For applications that are approved, the Office of Transformation and Innovation will work closely with subject matter experts in other district departments, such as School Leadership and Teaching and Learning, to provide tailored support to each school leadership team during their planning year (i.e., designing workshops, facilitating coaching sessions, identifying local exemplars, curating national models, organizing site visits, etc.). Moreover, the district will provide tailored support as choice schools prepare for official launch and beyond (i.e., assisting with staff recruitment, conducting beta tests of proposed instructional models, assisting with resource procurement, and

17
coordinating start-up operations). The type and intensity of district support will depend largely on the proposed model itself and the needs of the school leadership team. Scaling Choice Schools By 2020, Dallas ISD will have launched 35 new choice schools that reflect student, parent, educator, and community demand. Table 4 includes estimates on the number and types of schools that will likely be created year over year. Table 4: Scaling Choice Schools Estimates
Date # of Transformation Schools
# of Innovation Schools
# of Expansion Schools4
Aug 2015 4 will begin planning year 75 TBD
Aug 2016 4 3-4 TBD Aug 2017 4 3-4 TBD Aug 2018 3-4 3-4 TBD Aug 2019 3-4 3-4 TBD NEW SCHOOLS TOTAL 14-16 19-23 TBD
GRAND TOTAL OF NEW SCHOOLS = 33-39 Community Schools Under the Public School Choice umbrella, this plan proposes the development of four community schools by the Year 2020. At community schools, public schools partner with other organizations throughout the community, such as non-profits, health clinics, and businesses. Together, they provide various programs and services to promote academic success for diverse learners, youth development, family support, and health and wellness. They are designed to be the “hub” of a community. Community schools would fall into the broad category of Transformation Schools. Schools of the future should closely coordinate with the city and community. The district should continue to build schools that work in reinforcing ways with city and community services. Libraries should be built contiguous to a school so they can be used by students and parents alike and on weekends. The city should provide a wireless environment for the school that captures the entire attendance zone. In some areas, a child and family medical clinic should also be part of the school community. Social services might also be coterminous with a school, managed by a backbone non-profit partner.
4 Depending on how big the expansions are, the district may count them toward the overall grand total. 5 Includes the three personalized learning schools that are already in motion.

18
With this plan, Dallas ISD has an opportunity to build a few community schools to meet the needs of our students and work with stakeholders to enhance services. This plan proposes four: 1) HS Thompson, elementary community school; 2) Macon ES, K-8 community school; 3) Near Hope ES, K-8 community school; and 4) North of LBJ freeway, K-8 community school. We would conduct a city-wide competition for proposals to design community schools that would bring a consortium of service-providers and stakeholders together to help fund the construction of the school and maximally benefit the students and the community. Outreach and Communications If the Public School Choice plan is to work, parents must be fully aware of the choice options that exist in Dallas ISD. To that end, the district will consider developing various mechanisms to reach all parents within district boundaries with useful and actionable choice information. An example of this is a comprehensive, one-stop-shop website for all things choice and partnerships with external entities to help parents navigate their various choice options. Programmatic Costs Initial programmatic costs to launch a new choice school will include a planning year and start-up needs (e.g., professional development, devices and software, etc.). Programmatic costs will vary depending on the type of model launched, but anticipated district net cost listed in Table 5 represents an informed estimate based on the cost of programs and new schools launched to-date in Dallas ISD. The expectation for all choice schools is to develop financially sustainable models so that – beyond start-up costs and on-going transportation costs – campuses are eventually operating within the bounds of our funding structure. Over the next five years, the total programmatic cost to launch and sustain 35 new choice schools would be $17.4 million. Table 5
Estimated Programmatic Costs6 Year # of Choice
Campuses Planning Year & Start-Up Needs
Sustainability Costs (Year 1)
Sustainability Costs (Year 2)
Sustainability Costs (Year 3)
Total Costs by Year
2015-16 7 $2.4mil (Cohort 1) N/A N/A N/A $2.4mil
2016-17 14 (7 new) $2.4mil (Cohort 2) $0.612mil (Cohort 1) N/A N/A $3.0mil
2017-18 21 (7 new) $2.4mil (Cohort 3) $0.612mil (Cohort 2) $0.612mil (Cohort 1) N/A $3.6mil
2018-19 28 (7 new) $2.4mil (Cohort 4) $0.612mil (Cohort 3) $0.612mil (Cohort 2) $0.612mil (Cohort 1) $4.2mil
2019-20 35 (7 new) $2.4mil (Cohort 5) $0.612mil (Cohort 4) $0.612mil (Cohort 3) $0.612mil (Cohort 2) $4.2mil
TOTAL $17.4mil
6Planning year needs (i.e., professional development, salaries for planners, etc.) are estimated at $100,000 per campus and the start-up needs (i.e., professional development, staffing, devices, software, etc.) are estimated at $250,000 per campus, which would be a grand total of $350,000 per campus. The estimated number of students per campus is 500. The total planning year and start-up cost per student is $700. Sustainability costs are the additional expenditures that choice schools will need before they are fully sustainable on recurring per pupil allotments (i.e., a new Transformation School which decides to scale up one grade at a time will not be fully sustainable on per pupil allotments for several years after launch). We estimated that half of the new campuses each year (3.5 campuses) will require sustainability funds and that those funds will be approximately half of the total planning year and start-up costs ($175,000), which equals $612,500 in sustainability costs per year. We estimated that sustainability costs will be required for a period of three (3) years.

19
Transportation Costs Transportation will be a large new expenditure area for the Public School Choice initiative. Though there are many unknown variables involved, the estimated new transportation costs can be seen in Table 6 below. Based on numbers provided by the transportation department, the current per student transportation cost is $1,165. However, this number typically involves transporting students within their traditional attendance zones. Under this choice plan, some students would be transported from increased distances. As such, the transportation costs for students transported outside of their normal attendance zones are likely to be higher. In an abundance of caution, we have operated under the assumption that the cost per student traveling outside his/her normal attendance zone will be approximately $2,000, which is almost double the traditional cost per student. Therefore, the amount of new expenditure per student who travels outside of his/her normal attendance zone would be $835 ($2,000 minus the existing $1,165). Our estimate is that 70% of students attending Transformation Schools will be coming from outside of the normal attendance zone, while 20% of students attending Innovation Schools will be coming from outside of the normal attendance zone. For Transformation and Innovation Schools, we estimate 500 students per campus. Over the next five years, the total new transportation cost would be $19.7 million. Note that Table 6 shows the amount that we would spend beyond current transportation expenditures. Table 6
Year # of Choice Campuses in the District
Total Additional Transportation Cost Per Year
2015-16 7 (assume 3.5 Transformation Schools and 3.5 Innovation Schools)
$1.3mil
2016-17 14 (assume 7 Transformation Schools and 7 Innovation Schools)
$2.6mil
2017-18 21 (assume 10.5 Transformation Schools and 10.5 Innovation Schools)
$3.9mil
2018-19 28 (assume 14 Transformation Schools and 14 Innovation Schools)
$5.3mil
2019-20 35 (assume 17.5 Transformation Schools and 17.5 Innovation Schools)
$6.6mil
TOTAL $19.7mil

20
CTE Programs Overview Dallas ISD seeks to be a premier urban school district that educates all students for success. The Destination 2020 target is for 80% of students to graduate on time ready to enter college, the military, or a job/career track. Strategically, the district seeks to align its career programs with regional workforce projected demand. College and Career Readiness staff members work closely with higher education and workforce partners to identify regional workforce needs and create aligned secondary and postsecondary education and training programs that lead Dallas ISD graduates to living wage positions in fields that offer career advancement opportunities. In essence, the district’s goal is to create a “career ladder” for students that start in secondary school so that they may “climb” to a living wage career. The national definition of “college” has broadened to include any postsecondary training or education that leads to industry-recognized certifications, licensures, associate’s degrees or higher. The district has just begun to articulate this concept within its culture and to build the systemic student programs that will lead to completion. Figure 2 is used by the district, Dallas County Community College District, Dallas Regional Chamber, Commit!, Workforce Solutions Greater Dallas, and other partners to guide the alignment of career education programs.7 Job projections aid the district in building “career ladders” that are aligned with actual regional livable wage jobs. Figure 2
The Carl D. Perkins Career and Technical Education Act of 2006 (Perkins IV) provides grant support to the district for Career and Technical Education (CTE) programs, including the purchase 7 Source: BLS projections for Dallas Workforce Development Area Source for livable wage: www.familybudgets.org
3. Career and Technical Education (CTE)

21
of specific industry-recognized certification exams. CTE students are categorized into two groups. High school students who have taken two or more courses for three or more credits within a specified pathway are classified as Career Pathways students. Elective students are those enrolled in one or more CTE courses. All middle school CTE students are elective students.
In 2012-13, out of 20,579 7th and 8th grade students, 6,206 (30.2%) were enrolled in elective CTE courses at the fall PEIMS snapshot date. 26,118 out of 38,372 9th through 12th grade students participated in CTE (68.1%). Among these, 6,967 (18.2%) of all high school students were Career Pathways students. In an effort to improve the quality of the Texas workforce, House Bill 3485 (2006) required a radical transformation of CTE. Beginning in 2006-07, TEA organized CTE courses into 16 career pathways as defined by the National Career Clusters® Framework. Currently, Dallas ISD high schools offer more than 115 coherent career programs representing all sixteen pathways (see Appendix A for listing of programs). The 16 Career Clusters are shown below.
Agriculture, Food and Natural Resources Architecture & Construction Arts, A/V Technology and Communications Business Management and Administration Education and Training Finance Government and Public Administration Health Science Hospitality and Tourism Human Services Information Technology Law, Public Safety, Corrections and Security Manufacturing Marketing Science, Technology, Engineering and Mathematics Transportation, Distribution and Logistics
In the state of Texas, more than 250 industry-recognized certification programs are approved as “End of Program Certifications/Licensures.” Appendix B shows student completion of industry-recognized certifications from 2009-10 through 2013-14.
House Bill 5 Mandates House Bill 5 (2013) created comprehensive change of PK-12 education that affects curriculum, assessment, accountability, and higher education. This section is concerned primarily with HB5’s focus on career education and does not cover several topics included in the law (i.e., Performance Acknowledgements on transcripts, new state reporting requirements, assessment rules, and others).

22
House Bill 5 (HB 5) reduced the number of End of Course (EOC) exams needed for graduation to five (English I and II, Algebra I, Biology, and U.S. History). It also created new graduation plans for students entering high school in the 2014-15 school year. (Students already in high school are permitted to graduate under the new Foundation Plan as well as the existing Minimum, Recommended, and Distinguished plans.) Only students who complete the New Distinguished Plan below—26 credits including Algebra II—are Eligible for automatic admission to a Texas four-year college or university under top 10% rule and the Texas grant. At its February 2014 meeting, the Dallas ISD Board of Trustees adopted the New Distinguished Plan as the default graduation plan for students. Its requirements closely mirror the Recommended Graduation Plan from which most district students already graduate (see Table 8). Table 8
NEW Distinguished Plan
Foundation Plan + Endorsements
Foundation Plan
Discipline Credits Credits Credits English 4 4 4 Math 4 4 (+ 1 STEM, Option C) 3 Science 4 4 (+ 1 STEM, Option D) 3 Social Studies 3 3 3 Language Other Than English
2 2 2
Fine Arts 1 1 1 Physical Education 1 1 1 Health (Dallas ISD Local) .5 .5 .5 Electives 6.5 6.5 4.5 Total Credits for Graduation:
26 26 22
An underlying goal of Texas HB-5 is to prepare students to be successful in future careers, and to align Texas educational systems with workforce needs. Revisions of Texas high school graduation requirements mandated by HB-5 place new emphasis on coherent sequences of career courses. Beginning in 2014-15, every 9th grade student will select at least one Endorsement from the following five categories: Arts and Humanities; Business and Industry; Multidisciplinary Studies; Public Services; and Science, Technology, Engineering, and Math (STEM). Table 9 illustrates the career fields and 20 rules associated with each of the five Endorsements.

23
Table 9
ARTS and HUMANITIES
BUSINESS and INDUSTRY
MULTIDISCIPLINARY STUDIES
PUBLIC SERVICES
STEM (Science, Technology, Engineering, Math)
Six options: (A) five social studies credits. (B) four levels of the same language in a LOTE. (C) two levels of the same language in a LOTE and two levels of a different language in a LOTE. (D) four levels of American sign language. (E) a coherent sequence of four credits by selecting courses from one or two categories or disciplines in fine arts or innovative courses approved by the commissioner. (F) four English elective credits by selecting from the following: English IV; or Independent Study in English; or Literary Genres; or Creative Writing; or Research and Technical Writing; or Humanities; or Communication Applications; or AP English Literature and Composition; or IB Language Studies A1 Higher Level
Four options: (A) a coherent sequence of courses for four or more CTE credits with at least two courses in the same career cluster, including at least one advanced CTE course. The final course in the sequence must be obtained from one of the following: Agriculture, Food, and Natural Resources; or Architecture and Construction; or Arts, Audio/Video Technology, and Communications; or Business Management and Administration; or Finance; or Hospitality and Tourism; or Information Technology; or Manufacturing; or Marketing; or Transportation, Distribution, and Logistics. (B) four English elective credits to include three levels in one of the following areas: public speaking; or debate; or advanced broadcast journalism; or advanced journalism: newspaper; or advanced journalism: yearbook. (C) four technology applications credits. (D) a coherent sequence of four credits from subparagraph (A), (B), or (C).
Three options: (A) four advanced courses that prepare a student to enter the workforce successfully or postsecondary education without remediation from within one endorsement area or among endorsement areas that are not in a coherent sequence. (B) four credits in each of the four foundation subject areas to include English IV and chemistry and/or physics. (C) four credits in Advanced Placement, International Baccalaureate, or dual credit selected from English, mathematics, science, social studies, economics, languages other than English, or fine arts.
Two options: (A) a coherent sequence of courses for four or more CTE credits with at least two courses in the same career cluster, including at least one advanced CTE course. The final course in the sequence must be obtained from one of the following: Education and Training; or Government and Public Administration; or Health Science; or Human Services; or Law, Public Safety, Corrections, and Security. (B) four courses in Junior ROTC (JROTC).
Five options: (A) a coherent sequence of courses for four or more CTE credits including at least two courses in the same career cluster, and at least one advanced CTE course, which includes any course that is the third or higher course in a sequence. The final course in the sequence must be obtained from one of the CTE career clusters relating to Science, Technology, Engineering, and Mathematics. (B) a coherent sequence of four credits in computer science. (C) three credits in mathematics by successfully completing Algebra II and two additional mathematics courses for which Algebra II is a prerequisite. (D) four credits in science by successfully completing chemistry, physics, and two additional science courses. (E) in addition to Algebra II, chemistry, and physics, a coherent sequence of three additional credits from no more than two of the categories or disciplines represented by subparagraphs (A), (B), (C), and (D).
24
In March 2014 the Education Commissioner and State Board of Education adopted rules upon which Texas school districts may build their selection of Endorsement programs; each section has variations. Appendix C provides a few examples of how the rules affect each of the Endorsements.
There are hundreds of combinations of programs available to Dallas ISD students, and the CCR departments are working closely with Information Technology and Counseling Services to integrate the complex rules and Endorsement possibilities at each campus into the Naviance college and career platform.
Career Centers The Comprehensive Plan must take into account the need to efficiently offer career programs requiring specialized equipment and facilities for high-demand, high-wage fields, including engineering; health sciences; architecture and construction (including trades such as HVAC, electrical, welding, and plumbing); and logistics to students throughout the district. These regionally-located Career Centers would primarily teach upper level courses in the subjects named above; students would take prerequisites at their home campuses. In this plan, business, communications, education, arts, public safety, and/or other career programs would remain on individual high school campuses. We will concentrate the more expensive, upper level (grades 11 and 12) resource programs at Career Centers and provide transportation of students from comprehensive high schools to these “hub” centers. Dallas ISD will work closely with Dallas County Community College District (DCCCD), technical schools, employers, and other government agencies where possible to jointly plan and pool resources. Programmatic Costs We expect that a significant source of future CTE equipment and supplies funding can be provided through a reallocation of the annual CTE allocation funding received from the state every year. These funds are intended by the state to cover CTE teachers, equipment, and supplies. On top of state funds, we estimate that $16 million in additional programmatic costs would be required over the course of the next five years, breaking down to $3.2 million per year.

25
Overall Districtwide Facilities Needs The ongoing Future Facilities Task Force (FFTF) will help review the draft Comprehensive Plan, gather deep input from stakeholders in each area of the district, and ultimately make recommendations. The FFTF will make those recommendations to the Administration in April 2015 and will co-present the final Comprehensive Plan to the Board with the Administration in May 2015. The FFTF has been operating and will continue to operate under a simple guiding principle: as Dallas ISD continues to work to achieve the goals of Destination 2020, students' academic needs should drive our academic program design, and our academic program design should drive our future facilities planning. Academic needs, academic program design, and facilities planning must be aligned. A world-class 21st Century education system demands robust early childhood opportunities, expanded public school choice options, and expanded career pathways for high school students. The FFTF is tasked with developing a plan to meet those lofty challenges.
The accomplishment of aggressive educational targets outlined in the Destination 2020 plan is made more complicated by aging facilities and the backlog of maintenance projects. According to the Dallas ISD 2013 Facilities Condition Assessment (also referred to as the Parsons Report), the district has $1.8 billion in deferred maintenance needs. Moreover, it will cost $2.6 billion to keep current facilities in good repair over the next eleven years.8 Thus, attempts to expand public school choice, expand career pathways, and invest in early childhood must be made systemically and in the context of other facility needs. Criteria The following criteria should form the basis for future facilities planning:
Programmatic Goals:
o Pre-kindergarten needs. By 2020 our district must (1) ensure that all pre-kindergarten classrooms meet the necessary physical conditions for safe and developmentally-appropriate learning, and (2) strategically place additional classrooms in high demand neighborhoods to increase enrollment of eligible pre-kindergarten students by more than 60%.
8 See DISD 2013 Facilities Condition Assessment, Parsons Environment and Infrastructure Group Inc., December 2013.

26
o Public School Choice. The district’s Public School Choice goals require us to be purposeful about expanding choice options for students. As a result, we should consider repurposing some vacant buildings and renovating or constructing others to allow for the growth of choice schools.
o House Bill 5/ Career Academies. We must develop a plan to ensure high school
students would have access to all of the endorsement areas outlined in House Bill 5 (2013).
Condition of the facility. Specifically, the facility condition index (FCI) should be considered, which describes whether a building is in good shape or needs significant renovation to keep it safe and operating well. A building with an FCI of greater than 30 is considered in poor condition.
Utilization. We should consider the current capacity of the building and whether it has space for more students (under capacity) or is currently at or over capacity.
Additionally, demographic trends will need to be considered for each of the criteria while anticipating growth in enrollment and shifts in populations. Ultimately, the plan has to be affordable and support the goals outlined in Destination 2020. Demographic Considerations In the late 1990s and through the turn of the century, Dallas ISD grew to enrollment levels over 160,000 which had not been seen for two decades. Around 2003, the District’s enrollment began to decline, but by 2011 was again on the rise. Within two years, the District increased by over 2,000 students. Enrollment is expected to continue growing at a steady rate, as referenced by the map in Figure 3 which shows Pre-K through 12th grade resident student growth (enrolled in Dallas ISD) from 2010 to 2013 by high school feeder area. This growth surpasses the “high growth” projection scenario provided by Population and Survey Analysts in a demographic study completed spring of 2012, which projects the district to be about 165,000 by 2020. The National Center for Education Statistics supports the rising trend, expecting public school enrollment to increase by 7% from 2010 to 2021.

27
Figure 3
Based on Census 2010 data, and projections formulated by ESRI (Environmental Sciences Research Institute) Inc., the expectation is that most areas that have already experienced growth will continue to increase in overall school-aged population. Reports by ESRI of population ages 5 to 19, projected to 2018, show that the Jefferson, Bryan Adams, White, and Wilson high school feeder areas will increase by more than 1,000 in this age range over the next 5 years. The Hillcrest, Spruce, and Conrad feeder areas are forecasted to increase by about 900, 800, and 650 respectively during the same time period.

28
According to the ESRI, Inc. forecasting model, total expected school-aged (5-19) population growth for the Dallas ISD area from 2013 to 2018 is approximately 12,400. As Dallas ISD serves an estimated 75%-78% of the school-aged population who reside within the district boundaries, district enrollment between now and 2018 is likely to grow by about 9,000 students. (See Appendix D for a high school feeder pattern breakdown of expected growth).
29
School-by-School DRAFT Facilities Plan In the spring of 2013, the Dallas ISD Board of Trustees tasked the administration with developing a long-term comprehensive plan. To that end, the administration is proposing an initial draft long-term Comprehensive Plan to the Future Facilities Task Force (FFTF) for their review and revision and, ultimately, to make a final recommendation to the Board. This draft long-term plan is merely a starting point for the FFTF to do its work. The charge of the FFTF is threefold:
(1) Review the draft for alignment with district priorities and plans; (2) Gather input from stakeholders in each area of the district; and (3) Revise the plan to ensure that it will create a “built environment” conducive to the
achievement of the academic vision of Destination 2020.
A central theme of the FFTF’s work is that as we work to achieve the goals of Destination 2020, our students' academic needs must shape and drive our future facilities plan. Academic needs and facilities planning cannot happen in silos; we must first outline what it will take to design a world-class 21st Century education system and then design facilities to meet those needs.
Generally speaking, the draft long-term Comprehensive Plan constitutes facilities investments in four key priority areas: 1) investments in general high-need areas based on facility utilization percentages and facility conditions; 2) investments in Early Childhood; 3) investments in Public School Choice; and 4) investments in Career and Technical Education (CTE). Though there are sizeable investments in all four areas, please note that there is a significant overlap in needs amongst the areas. For example, early childhood investments are often proposed at campuses that are also in need of repair and/or alleviation of overcrowding; over- or under-subscribed campuses will be addressed through Public School Choice; etc.
The district used the following criteria for developing the draft Comprehensive Plan:
For the general high-needs priority area, the administration looked at the most over-crowded schools in the district and the worst Facility Condition Index (FCI) scores in the district. The administration worked to develop tailored solutions for each campus identified.
For the Early Childhood priority area, the administration looked at areas that are currently so far above utilization that preschool students are forced to attend class in what are, or will soon be, outdated portables, and/or have insufficient space to serve large numbers of preschool-aged children in the surrounding neighborhood, and/or will have insufficient space in the near future to serve large numbers of preschool-aged students in the surrounding neighborhood based on our best population growth estimates.
For the Public School Choice priority area, the administration examined and budgeted for potential locations for new choice campuses (i.e., vacant school buildings, non-traditional

30
spaces, and new school buildings) and budgeted for existing neighborhood schools that repurpose into a choice school in the future.
For the Career and Technical Education (CTE) priority area, the administration took into account the need to efficiently offer career programs that require specialized equipment and facilities for high-demand, high-wage fields, including engineering; health sciences; architecture and construction (including trades such as HVAC, electrical, welding, and plumbing); and logistics to students throughout the district.
Also, as part of the draft Comprehensive Plan, the FFTF will be charged with considering the most appropriate solution for a consolidated administration facility. Today, the central administrative offices are in geographic silos, with the staff members of the various divisions and departments located in more than 12 different facilities spread over more than 75 square miles. As part of Destination 2020, Dallas ISD is working to build an effective central administration that efficiently provides campuses with consistent, high-quality service and support. We believe that this requires closer physical proximity of staff and an increase in cross-functional collaboration. Building a new facility from scratch would cost approximately $200 million, but that cost could be dramatically reduced if a suitable existing facility was identified and could be renovated to fit central office needs.
When reviewing and revising the draft Comprehensive Plan, the FFTF is asked to consider several other contextual variables that exist outside the purview of the FFTF but would nevertheless impact its work:
QSCB: The district is currently executing a $143 million facilities improvement program via Qualified School Construction Bonds (QSCB). With Board approval, the district took advantage of this federal program to renovate middle school science labs and to perform hydronic conversion updates on campuses with the most outdated HVAC systems. QSCB allowed the district to address immediate needs that required attention prior to a future bond program or tax ratification election. Approximately 47 campuses were involved.
Interim Bridge Plan: In line with leveraging alternative funding vehicles to address immediate facility needs, the administration plans to seek Board approval in the near future to proceed with a $172 million interim bridge plan to support additional immediate needs that cannot wait for a tax ratification or bond election. To ensure the success of Destination 2020, this interim bridge plan would need to begin in the very near future. The district proposes to use debt vehicles that can be lawfully issued and paid from proceeds of the levy of its Maintenance and Operations (M&O) property tax revenues. The interim bridge plan can be implemented at no additional increase to the taxpayer’s taxes. o Roughly 53% of the interim plan ($90 million) will be used to support forward-
looking initiatives, such as Pre-K and Public School Choice. o After identifying these forward-looking needs, the administration will then use the
remaining 47% of funds ($82 million) to tackle the most pressing general facility

31
needs. To identify the most pressing general facility needs, the administration ranked all campuses based on their Combined Percentage Score (utilization percentage plus FCI percentage). Campuses that were identified through this process are all seriously over-capacity and have FCI scores of either “fair” or “poor.” Also, for each of the campuses that were identified in the general needs
area, the administration looked at the five categories of critical systems from the 2013 FCA Report (Roofing, HVAC, Windows, Plumbing, and Electrical). For each of these campuses, the administration identified the single most critical system for the functionality of the facility and dedicated full funding to address the issue.
o As with the long-term draft plan, the interim bridge plan also has a significant overlap in needs amongst the various categories.
Enrollment Caps: Beginning August 2015, to address over-crowding concerns across the district, the administration will propose district-wide enrollment caps. These caps, if enacted, would likely take effect for the 2017-18 school year. The details have yet to be worked out, but it is widely acknowledged that over-crowding is a districtwide problem and should be addressed. As the administration moves forward with this, we must keep in mind that current students in a campus, no matter how over-crowded, should be allowed to remain in place until they graduate from that campus.
Even with the QSCB program and the proposed interim bridge plan, the myriad of identifiable needs within Dallas ISD remains great. The Parson’s Report recommended $2.6 billion in regular maintenance, which is a daunting number in and of itself. However, there are also important academic programs which require major investments to achieve the types of ground-breaking reforms included in Destination 2020, such as Early Childhood and Public School Choice. The challenge for the FFTF is to consider the administration’s draft, weigh all of the extant needs within the district, incorporate community feedback and insight, and propose a finalized long-term Comprehensive Plan that will support the greatest academic outcomes for students with the finite resources available to the district.

The following pages display the DRAFT $172 million “Interim Bridge Plan,” which should begin immediately without additional tax increases to the taxpayer. Please note that cost estimates are total facility program dollars (i.e., construction, design fees, consultant fees, program management fees, land acquisition, insurance, furniture, technology, etc.).
Table 11: Interim Bridge Plan (General High-Need Areas, as determined by Combined Utilization and FCI Percentages) Table 12: Interim Bridge Plan (Public School Choice) Table 13: Interim Bridge Plan (Early Childhood)
Table 14: Interim Bridge Plan (Miscellaneous)Table 11
Interim Bridge Plan
(General High‐Need Areas, as determined by Combined Utilization and FCI Percentages)
Year TEA #
Trus. Dist.
Type Location Util. FCI
(main)
FCI (main) + Util.
Recommended solution
Cost ($M) Notes
16‐17 180 4 ES Macon ES 165% 36% 201% Renovation/Modulars $4.90
#1 on Combined Percentage list. Also on Top 20% Utilization list. Modulars in short term; FFTF may consider building a new K‐8 school in the long term. 12,330 SF for additional facility capacity. Current enrollment is 541 and facility capacity is 328. Cost includes $800,000 to fix the 2013 FCA Most Critical System Identified (Roofing ‐‐ Main and Addition only)
16‐17 216 4 ES Titche ES 147% 51% 198% Renovation/Modulars $10.80
#2 on Combined Percentage list. Also on Top 20% Utilization list. Modulars in short term; FFTF may consider building a new school in the long term. Modulars to alleviate over‐crowding and Pre‐K needs. Current enrollment is 990, facility capacity is 673 and there is a need for 184 Pre‐K students. Cost includes $1,000,000 to fix the 2013 FCA Most Critical System Identified (Roofing ‐ Main only)
16‐17 144 8 ES Tom Field
ES 150% 37% 187% Renovation/Modulars $2.20
#3 on Combined Percentage list. Also on Top 20% Utilization List. 2,740 SF for additional facility capacity for needed Pre‐K, which is 39 students. Some core classrooms may be relieved by Joe May ES. Cost includes $600,000 to fix the 2013 FCA Most Critical System Identified (Roofing ‐ Main only)

Interim Bridge Plan cont.
Year TEA #
Trus. Dist.
Type Location Util. FCI
(main)
FCI (main) + Util.
Recommended solution
Cost ($M) Notes
16‐17 021 1 HS White HS 145% 41% 186% Renovation/Addition $21.70
#4 on Combined Percentage list. Also on Top 20% Utilization list. New addition open in 16‐17; FFTF may consider additional measures. 39,045 SF addition for additional facility capacity. Current enrollment is 2,361 and facility capacity is 1,629. Costs include $3,300,000 to fix the 2013 FCA Most Critical System Identified (Windows ‐ Main only)
16‐17 162 2 ES S. Jackson
ES 156% 27% 183% Renovation/Addition $5.30
#5 on Combined Percentage list. Also on Top 20% Utilization list. New addition, including PreK wing, which will open in 16‐17. 13,563 SF addition for additional facility capacity. Current enrollment is 619 and facility capacity is 397. Costs include $700,000 to fix the 2013 FCA Most Critical System Identified (Plumbing ‐ Main only)
16‐17 015 4 HS Seagoville
HS 145% 38% 183% Renovation/Addition $13.70
#6 on Combined Percentage list. Also on Top 20% Utilization list. New addition open in 16‐17; had an addition in 2010. 20,824 SF addition for additional facility capacity. Current enrollment is 1,244 and facility capacity is 858. Costs include $2,700,000 to fix the 2013 FCA Most Critical System Identified (Windows ‐ Main only)
16‐17 171 2 ES Lakewood
ES 155% 26% 181% Renovation/Addition $12.60
#7 on Combined Percentage list. Also on Top 20% Utilization list. Remove portables and modulars to build addition. This addition is for the LEEF design. Includes costs for a cafeteria expansion and renovations to existing campus. Costs include $600,000 to fix the 2013 FCA Most Critical System Identified (Windows ‐ Main only)

Interim Bridge Plan cont.
Year TEA #
Trus. Dist.
Type Location Util. FCI
(main)
FCI (main) + Util.
Recommended solution
Cost ($M) Notes
16‐17 233 1 ES Nathan Adams ES
145% 32% 177% Renovation/Addition $8.10
#8 on Combined Percentage list. Also on Top 20% Utilization list. New addition open in 16‐17. 15,207 SF addition for additional facility capacity and Pre‐K needs. Current enrollment is 577, facility capacity is 397 and there is a need for 83 Pre‐K students. Costs include $1,600,000 to fix the 2013 FCA Most Critical System Identified (HVAC ‐ Main only)
16‐17 49 7 MS Greiner MS
154 % 20% 174% Renovation $3.00
#9 on Combined Percentage list. Also on Top 20% Utilization list. $3million is for new roof. New addition for additional classrooms is currently in construction. $16.6million which is NOT included in the total because the addition is currently being constructed using 2008 Bond Funds.
TOTAL $82.30

35
Table 12
Interim Bridge Plan (Public School Choice)
Year TEA #
Trus. Dist.
Type Location Util. FCI
(main)
FCI (main) + Util.
Recommended solution
Cost ($M) Notes
14‐15 9 ES
HS Thompson Choice School
vac. 56%
Demolish and build new K‐8
Choice Community
School
$36.50
Based on community input, build choice school with wrap‐around services. Will serve as home of future Transformation School. Demolish in 14‐15 and open in 17‐18
15‐16 6 MS Hulcy (6‐8) vac. 43% Renovation $3.20 May serve as home for new choice Transformation School; begin opening in 15‐16
15‐16 150 5 ES Harllee ES vac. 37% Renovation $4.00 Possible home for Transformation School launching in 2016; possible space for early childhood center on 1st floor
15‐16 MS Choice School
Non‐traditional space for choice school
Personalized Learning
Transformation School
$1.00
Could serve as home for the new Gates‐funded personalized learning Transformation School. Might potentially lease a TBD non‐traditional space as the school scales up one grade at a time.
15‐16 119 1 ES Cabell ES 84% 30% 114%
Personalized Learning Innovation School
$2.50 Repurposed neighborhood school which will require renovations
15‐16 203 2 ES Rogers ES 108% 35% 143%
Personalized Learning Innovation School
$2.50 Repurposed neighborhood school which will require renovations

36
Interim Bridge Plan (Public School Choice) cont.
Year TEA #
Trus. Dist.
Type Location Util. FCI
(main)
FCI (main) + Util.
Recommended solution
Cost ($M) Notes
15‐16 054 1 MS Marsh MS 125% 30% 155%
Personalized Learning Innovation School
$2.50 Repurposed neighborhood school which will require renovations
15‐16 TBD Choice School
Renovation $2.10 Innovation School, launch in 15‐16 (if there is a need for renovation)
15‐16 TBD Choice School
Renovation $2.10 Innovation School, launch in 15‐16 (if there is a need for renovation)
16‐17 106 8 ES Arlington Park
vac. 72% Renovation $3.20 May serve as home for new choice Transformation School; begin opening in 16‐17.
16‐17 TBD Choice School
Renovation $2.10 Innovation School, launch in 16‐17 (if there is a need for renovation)
16‐17 TBD Choice School
Renovation $2.10 Innovation School, launch in 16‐17 (if there is a need for renovation)
16‐17
TBD Downtown Choice School
Renovation/ Lease
$3.20 May serve as home for new downtown Transformation School. Open in 16‐17.
16‐17 TBD Choice School
Non‐traditional space for choice school
New Choice School in non‐traditional space
$1.00 May serve as home for new Transformation School. Open in 16‐17.
16‐17 TBD Choice School
Non‐traditional space for choice school
New Choice School in non‐traditional space
$1.00 May serve as home for new Transformation School. Open in 16‐17.
TOTAL $69.00

37
Table 13
Interim Bridge Plan (Early Childhood)
Year TEA #
Trus. Dist.
Type Location Util. FCI
(main)
FCI (main) + Util.
Recommended solution
Cost ($M) Notes
15‐16 116 8 ES Burnet ES 133% 17% 150% Pre‐K Wing $1.50
Top 20% Utilization list. There is a need for 79 Pre‐K students. Core classrooms and 3 Pre‐K classrooms may be relieved by new Joe May ES.
15‐16 280 1 ES Near Ann Frank ES/Junkins/Bush
126% 10% 136% Pre‐K Center $6.80
Top 20% Utilization list. There is a need for 108 Pre‐K students. Would include an early childhood center between Junkins and Frank; FFTF may want to consider possible relief by creating a K‐8 expansion at Bush ES.
15‐16 154 3 ES Smith ES 106% 0% 106% Pre‐K Wing $3.20 There is a need for 86 Pre‐K students.
15‐16 240 9 ES Guzick ES 105% 0% 105% Pre‐K Wing $2.80 There is a need for 85 Pre‐K students.
15‐16 301 5 ES W‐Hutchins ES 126% 0% 126% Pre‐K Wing $4.70 Top 20% Utilization list. There is a need for 185 Pre‐K students.
15‐16 206 3 ES Sanger ES 101% 19% 120% Pre‐K Wing
and 6th Grade Modulars
$0.70
Current Pre‐K is in outdated portables and do not meet state compliance standards for classroom size. 6th, 7th, and 8th grade modulars are a pre‐existing commitment to expand Sanger into K‐8
15‐16 178 5 ES Holland at Lisbon ES
98% 4% 102% Pre‐K Wing $1.50 Current Pre‐K is in outdated portables and do not meet state compliance standards for classroom size.
TOTAL $21.20

38
Table 14
Interim Bridge Plan (Miscellaneous)
Year TEA #
Trus. Dist.
Type Location Util. FCI
(main)
FCI (main) + Util.
Recommended solution
Cost ($M) Notes
15‐16 146 9 ES Frazier vac. 43% Possible sell for repurposing
N/A
DISD proposes to discuss ownership of the Frazier building with a 501(c)3 lead agency. This lead non‐profit agency must submit a draft proposal that meets specific criteria outlined by the District.
OVERALL INTERIM BRIDGE PLAN TOTAL $172.50

39
The following pages showcase the DRAFT long-term comprehensive facilities plan. Please note that this is simply a starting point for the Future Facilities Task Force (FFTF) to do its work. We fully expect that changes will be made. Please note that cost estimates are total facility program dollars (i.e., construction, design fees, consultant fees, program management fees, land acquisition, insurance, furniture, technology, etc.).
Table 15: Long Term Facilities Investments (General High Needs Areas, as determined by Utilization and FCI percentages) Table 16: Long Term Facilities Investments (Public School Choice) Table 17: Short Term Facilities Investments (Early Childhood) Table 18: Long Term Facilities Investments (CTE)
Table 15
Long Term Facilities Investments
(General High‐Need Areas)
Year TEA #
Trus. Dist.
Type Location Util. FCI
(main)
FCI (main) + Util.
Recommended solution
Cost ($M) Notes
18‐20 180 4 ES Macon ES
165% 36% 201% New K‐8
Community School
$35.00 Top 20% Utilization list. Making it a K‐8 will help provide relief for Balch Springs MS.
18‐20 216 4 ES Titche ES 147% 51% 198% New ES $46.10
Top 20% Utilization List and Top 5% Worst FCI list. New 124,670 SF ES based on current enrollment & Pre‐K needs. Current enrollment is 990 and there is a Pre‐K need for 216 students.
18‐20 6 2 HS Hillcrest
HS 111% 38% 149%
Replace 1920s and 1950s portion w/ new addition
$60.80 Top 20% Utilization list. Replace 1920s and 1950s portion of school with new addition.

40
Long Term Facilities Investments cont.
Year TEA #
Trus. Dist.
Type Location Util. FCI
(main)
FCI (main) + Util.
Recommended solution
Cost ($M) Notes
18‐20
21 1 HS White HS 145% 41% 186% Renovation $4.40
Top 20% Utilization list. The interim bridge plan is sized to address over‐capacity issues. This renovation would help address critical FCI issues (electrical switch gear and lighting improvements). Current enrollment is 2,361 and facility capacity is 1,629.
18‐20 164 7 ES Jones ES 111% 62% 173% New ES $32.10
Top 20% Utilization list and Top 5% Worst FCI list. New 85,214 SF ES based on current enrollment & Pre‐K needs. Current enrollment is 730 and there is a Pre‐K need for 12 students.
18‐20 211 7 ES Stevens Park ES
118% 50% 168% New ES $34.20
Top 20% Utilization list and Top 5% Worst FCI list. New 91,516 SF ES based on current enrollment & Pre‐K needs. Current enrollment is 772 and there is a Pre‐K need for 45 students.

Long Term Facilities Investments cont.
Year TEA #
Trus. Dist.
Type Location Util. FCI
(main)
FCI (main) + Util.
Recommended solution
Cost ($M) Notes
18‐20 126 4 ES Central ES
136% 31% 167% Addition $3.00
Top 20% Utilization list. 7,398 SF addition for additional facility capacity and Pre‐K needs. Current enrollment is 493 and facility capacity is 362.
18‐20 25 9 HS Skyline HS
117% 48% 165% Renovation $16.50 Top 20% in Utilization list. Relief from a new high school near Bayles.
18‐20 125 3 ES Casa
View ES 136% 28% 164% Addition $5.30
Top 20% Utilization list. 12,467 SF addition for additional facility capacity and Pre‐K needs. Current enrollment is 749, facility capacity is 552 and there is a need for 31 Pre‐K students.
18‐20 218 9 ES Truett ES 149% 15% 164% NA ‐ Top 20% Utilization list. $14.5 million addition already being built using 2008 Bond Funds.
18‐20 22 2 HS Wilson HS
140% 23% 163% Modulars $4.70
Top 20% Utilization list. Modulars could replace portables; gets relief from new HS near Bayles. Addition made last year. Current enrollment is 1,678 and facility capacity is 1,201.
18‐20 59 6 MS Stockard
MS 112% 50% 162% Renovation $8.00
Top 20% Utilization list and Top 5% Worst FCI list. Relief from New K‐8 near Hooe ES.
18‐20 54 1 MS Marsh MS
125% 30% 155% New School $75.60 Top 20% Utilization list. New 184,728 SF MS per Ed Specs. Current enrollment is at 1,172. No relief school in the area.

42
Long Term Facilities Investments cont.
Year TEA #
Trus. Dist.
Type Location Util. FCI
(main)
FCI (main) + Util.
Recommended solution
Cost ($M) Notes
18‐20 197 7 ES Reagan
ES 119% 35% 154% Addition $2.40
Top 20% Utilization list. 6,165 SF addition based on enrollment and facility capacity.
18‐20 110 4 ES Blanton
ES 96% 49% 145% New ES $34.10
Top 5% Worst FCI score. New ES based on New 91,098 SF ES per Ed Specs.
18‐20 74 5 MS Edison MS
42% 56% 98% New K‐8 $73.10
Top 5% Worst FCI score. New K‐8. New 184,728 SF MS per Ed Specs. Current enrollment is 654. Would give relief to Gabe Allen and Quintanilla.
18‐20 18 7 HS Sunset HS
127% 29% 156% NA ‐ Top 20% Utilization list. Relief from new Pinkston HS; possibly change boundaries.
18‐20 271 8 ES Saldivar
ES 135% 3% 138% NA ‐
Top 20% Utilization list. Relief from new Joe May ES.
18‐20 103 7 ES Gabe Allen
ES 120% 14% 134% NA ‐
Top 20% Utilization list. Relief from new addition to revamped Edison (K‐8).
18‐20 68 7 MS Quintanilla
MS 117% 11% 128% NA ‐
Top 20% Utilization. Relief from new K‐8 at Edison and Hooe.
18‐20 052 9 MS Hood MS
70% 48.97% 119% Renovation $3.6 Top 5% Worst FCI score. Primarily roofing.
18‐20 380 5 ES
Near Wilmer‐Hutchins
ES
126% 0% 126% New ES $31.60
Top 20% Utilization list. South of Wilmer‐Hutchins ES. Will provide relief to Wilmer‐Hutchins ES. Assumed New 91,098 SF ES per Ed Spec.

43
Long Term Facilities Investments cont.
Year TEA #
Trus. Dist.
Type Location Util. FCI
(main)
FCI (main) + Util.
Recommended solution
Cost ($M) Notes
18‐20 5 7 HS Molina HS
119% 0% 119% NA ‐ Top 20% Utilization. Relief from New Choice HS near Arcadia Park.
18‐20 352 4 MS Balch Springs MS
118% 0% 118% NA ‐ Top 20% Utilization list. Relief from new K‐8 at Macon and Lagow.
18‐20 170 4 ES Lagow ES
87% 23% 110% Addition/K‐8 $6.00
6‐8 addition may provide relief to Balch Springs MS (which is on the Top 20% Utilization list). 12,330 SF addition for additional capacity and Pre‐K needs. Pre‐K need is currently 8 students. Also, assumes an additional need of 10 core classrooms
18‐20 198 3 ES Reilly ES 77% 25% 102% Addition/K‐8 $6.50
May provide relief for Hexter and Highland Meadows (which are both on the Top 20% Utilization list). 13,700 SF addition for additional capacity and Pre‐K needs. Pre‐K need is currently 29 students. Also, assumes an additional need of 10 core classrooms
18‐20 304 1 ES Bush ES 96% 0% 96% Addition/K‐8 $7.00
May provide relief for Anne Frank ES (which is on the Top 20% Utilization list). 15,070 SF addition for additional capacity and Pre‐K needs. Pre‐K need is currently 53 students. Also, assumes an additional need of 10 core classrooms
18‐20 206 3 ES Sanger ES
101% 19% 120% Addition/K‐8 $31.60 Pre‐existing commitment to expand Sanger into K‐8.
18‐20 145 8 ES Foster ES
95% 50.83% 145% Renovation $3.00 Top 5% Worst FCI list.

44
Long Term Facilities Investments cont.
Year TEA #
Trus. Dist.
Type Location Util. FCI
(main)
FCI (main) + Util.
Recommended solution
Cost ($M) Notes
18‐20 156 4 ES Hawthorne
ES 105% 55% Renovation $1.10
Top 5% Worst FCI list *Most critical item chosen from the 2013 FCA Report (Roofing)
18‐20 047 2 MS Franklin MS
80% 56.42% Renovation $2.50 Top 5% Worst FCI list *Most critical item chosen from the 2013 FCA Report (Roofing)
18‐20 056 1 MS Walker MS
80% 53.70% Renovation $3.20 Top 5% Worst FCI list *Most critical item chosen from the 2013 FCA Report (HVAC)
18‐20 105 7 ES Arcadia Park
77% Demolish/Sell $1.50 ABE Location
18‐20 Seagoville Alternative
64% Demolish/Sell $1.50
18‐20 216 4 ES Titche Annex
57% Demolish/Sell $1.50 ABE Location
18‐20 9 ES Harris vac. 51% Demolish/Sell $1.50 Currently vacant
18‐20 9 MS Otto
Alternative vac. 68% Demolish/Sell $1.50 Currently vacant
18‐20 9 ES Wheatley vac. 46% Repurpose/Sell ‐ Currently vacant
18‐20 5 HS Lacey
Alternative vac. 62% Demolish/Sell $1.50 Currently vacant

45
Long Term Facilities Investments cont.
Year TEA #
Trus. Dist.
Type Location Util. FCI
(main)
FCI (main) + Util.
Recommended solution
Cost ($M) Notes
18‐20 9 MS Billy Dade
(old) vac. 52% Demolish/Sell $1.50 Currently vacant; consider selling.
18‐20 9 ES City Park
vac. 17% Lease Lease to Vogle Alcove
18‐20 6 Nolan Estes Plaza
32% Demolish $3.90 This facility is a former shopping mall and not designed as a school. Site could be good for a future repurposing.
TOTAL $545.80

46
Table 16
Long Term Facilities Investments (Public School Choice)
Year TEA #
Trus. Dist.
Type Location Util. FCI
(main)
FCI (main) + Util.
Recommended solution
Cost ($M) Notes
17‐18
TBD Choice School
Renovation $2.10 Innovation School, launch in 17‐18 (if there is a need for renovation)
17‐18
TBD Choice School
Renovation $2.10 Innovation School, launch in 17‐18 (if there is a need for renovation)
17‐18 8 ES Bonham
ES vac. Renovation $2.10
May serve as home for new Transformation School. Open in 17‐18.
17‐18
TBD Downtown Choice School
Non‐traditional space for choice school
New Choice School in a non‐traditional space
$35.00 Could serve as home for new Transformation School. Open in 17‐18. Options need to be explored.
18‐20 108 3 HS Near Bayles
Build New Choice HS
$138.30 Choice HS; will also relieve students at Skyline. Assumed New 325,494 SF HS per Ed Spec. Will be a Transformation School
18‐20 158 7 K8 Near
Hooe ES
Build New Choice K‐8 Community
School
$34.60 Assumed New 91,098 SF ES per Ed Spec. Will be home to a Transformation School
18‐20 1 K8 North of
LBJ
Build New Choice K‐8 Community
School
$35.00 Will be home to a Transformation School
18‐20 105 7 HS Near
Arcadia Park
Build New Choice HS
$139.30 Assumed New 325,494 SF HS per Ed Spec. Will be home to a Transformation School.

47
Long Term Facilities Investments (Public School Choice) cont.
Year TEA #
Trus. Dist.
Type Location Util. FCI
(main)
FCI (main) + Util.
Recommended solution
Cost ($M) Notes
18‐20 9 MS Pearl C. MS
Demolish and build new Choice HS
$139.30 Assumed New 325,494 SF HS per Ed Spec. Will be home to a Transformation School
18‐20 TBD Choice School
Renovation $2.10 Innovation School, launch in 18‐19 (if there is a need for renovation)
18‐20 TBD Choice School
Renovation $2.10 Innovation School, launch in 18‐19 (if there is a need for renovation)
18‐20 TBD Choice School
Renovation $2.10 Innovation School, launch in 18‐19 (if there is a need for renovation)
18‐20 TBD Choice School
Renovation $2.10 Innovation School, launch in 19‐20 (if there is a need for renovation)
18‐20 TBD Choice School
Renovation $2.10 Innovation School, launch in 19‐20 (if there is a need for renovation)
18‐20 TBD Choice School
Renovation $2.10 Innovation School, launch in 19‐20 (if there is a need for renovation)
TOTAL $540.40

48
Table 17
Long Term Facilities Investments (Early Childhood)
Priorities are those that are currently so far above utilization that preschool students are forced to attend class in what will soon be outdated
portables and/or have insufficient space to serve large numbers of preschool‐aged children in the surrounding neighborhood.
Year TEA #
Trus. Dist.
Type Location Util. FCI
(main)
FCI (main) + Util.
Recommended solution
Cost ($M) Notes
16‐17 TBD Pre‐K Wing $4.80
16‐17 TBD Pre‐K Wing $4.80
17‐18 TBD Pre‐K Wing $4.80
17‐18 TBD Pre‐K Wing $4.80
17‐18 TBD Pre‐K Wing $4.80
18‐20 182 1 ES Marcus
ES 129% 21% 150%
Addition/Pre‐K Wing
$5.60
15,070 SF addition for additional facility capacity and Pre‐K needs. Current enrollment is 978, facility capacity is 759 and there is a need for 39 Pre‐K students.
18‐20 190 7 ES Peabody
ES 117% 32% 149%
Addition/Pre‐K Wing
$2.50
6,302 SF addition for additional facility capacity and Pre‐K needs. Current enrollment is 577, facility capacity is 492 and there is a need for 39 Pre‐K students.

49
Long Term Facilities Investments (Early Childhood) cont.
Year TEA #
Trus. Dist.
Type Location Util. FCI
(main)
FCI (main) + Util.
Recommended solution
Cost ($M) Notes
18‐20 159 3 ES Hotchkiss
ES 132% 15% 147%
Addition/Pre‐K Wing
$6.00
May move attendance boundary. 16,166 SF addition for additional facility capacity and Pre‐K needs. Current enrollment is 1016, facility capacity is 768 and there is a need for 27 Pre‐K students.
18‐20 169 1 ES Kramer
ES 116% 25% 141%
Addition/Pre‐K Wing
$2.40
Top 20% Utilization list. 6,302 SF addition for additional facility capacity and Pre‐K needs. Current enrollment is 551, facility capacity is 474 and there is a need for 34 Pre‐K students.
18‐20 193 1 ES Pershing
ES 119% 18% 137%
Addition/Pre‐K Wing
$2.90
Top 20% Utilization list. 7,672 SF addition for additional facility capacity and Pre‐K needs. Current enrollment is 533, facility capacity is 449 and there is a need for 37 Pre‐K students.
18‐20 147 3 ES Gill ES 113% 14% 127% Addition/Pre‐K
Wing $3.40
Top 20% Utilization list. New addition at Casa View will also help. 8,905 SF addition for additional facility capacity and Pre‐K needs. Current enrollment is 770, facility capacity is 681 and there is a need for 48 Pre‐K students.
18‐20 187 4 ES Moseley
ES 116% 16% 132%
Addition/Pre‐K Wing
$3.90
Top 20% Utilization list. Relief from (K‐8) at Lagow. 10,275 SF addition for additional facility capacity and Pre‐K needs. Current enrollment is 763, facility capacity is 656 and there is a need for 68 Pre‐K students.
18‐20 153 3 ES Hexter ES
120% 11% 131% Addition/Pre‐K
Wing $2.40
Top 20% Utilization list. Relief from Reilly new K‐8. 6,165 SF addition for additional facility capacity and Pre‐K needs. Current enrollment is 592 and facility capacity is 492.

50
Long Term Facilities Investments (Early Childhood) cont.
Year TEA #
Trus. Dist.
Type Location Util. FCI
(main)
FCI (main) + Util.
Recommended solution
Cost ($M) Notes
18‐20 284 3 ES Highland Meadows
ES 121% 0% 121%
Addition/Pre‐K Wing
$3.30
Top 20% Utilization. Relief from Reilly new K‐8. 8,631 SF addition for additional facility capacity and Pre‐K needs. Current enrollment is 869 and facility capacity is 716.
18‐20 274 7 ES Bethune
ES 119% 1% 120%
Addition/Pre‐K Wing
$3.80
Top 20% Utilization list. 10,138 SF addition for additional facility capacity and Pre‐K needs. Current enrollment is 741, facility capacity is 621 and there is a need for 51 Pre‐K students.
TOTAL $60.20

51
Table 18
Long Term Facilities Investments (CTE)
Year TEA #
Trus. Dist.
Type Location Util. FCI
(main)
FCI (main) + Util.
Recommended solution
Cost ($M) Notes
18‐20 17 4 HS Spruce HS
80% 14% 94% New CTE HS $90.00 New CTE HS. Could serve as regionally‐located career center "hub" for all high school students in the area.
18‐20 12 5 HS Pinkston
HS 50% 51% 101% New CTE HS $137.70
Top 5% Worst FCI score. New CTE HS; new 325,494 SF HS per Ed Specs. Current enrollment is 955. Could serve as regionally‐located career center "hub" for all high school students in the area.
TOTAL $227.70
OVERALL LONG TERM TOTAL $1,374.00

Funding Implications Table 20 describes the overall programmatic and facility needs over the next several years. Programmatic requirements are focused on three areas: Early Childhood Education, Public School Choice, and CTE. The programmatic costs listed are the estimated amount the district would spend beyond funding provided by the state and current district expenditures. Capital projects include construction of new campus facilities, renovation of existing campus facilities, and the acquisition of a variety of equipment and furnishings, including the purchase of modular buildings and technology. To implement the programs to scale and have the facilities necessary to provide a Year 2020 education for our students, the district will need a significant long term increase in revenue. To accomplish the finance of programmatic and facilities needs, the administration recommends we use the current funding tool of a Tax Ratification Election (TRE). A TRE will allow us to fund not only our capital needs, but also our programmatic needs which are equally essential to student success. By contrast, the revenues from a bond election could only be used on capital needs. The best strategy, then, is to use a TRE for both the facilities and programmatic needs. The alternative would require using two separate funding vehicles – a bond election for the facilities and a TRE for the programs – which we believe would be confusing to the public and would, of course, require two separate elections. In all, the Comprehensive Plan proposes a possible $1.5 billion TRE. This includes a possible $1.37 billion in facility needs (2017-2020) and a possible $172 million in programmatic needs (2017-2020). Table 20
Funding for Key Academic Programs
Year Item Total Source
2015‐2016 Key programs $16,900,000 M&O
2016‐2017 Key programs $24,800,000 M&O
2017‐2018 Key programs $40,700,000 TRE/M&O
2018‐2019 Key programs $57,700,000 TRE/M&O
2019‐2020 Key programs $74,000,000 TRE/M&O
Funding for Future Facilities
Year Item Total Source
2015‐2017 Short term facility needs (Interim Bridge Plan)
$172,500,000 Short‐Term Funding
Vehicle
2017‐2020 Long term facility needs (Comprehensive Plan)
$1,374,000,000 TRE

53
Table 21 shows the total programmatic and facilities costs by each key academic initiative. It only refers to what would need to be included in the TRE (2017-2020). Please note that these are rough categorizations because there are significant overlapping needs. It does not include the general facilities investments that are included in the Comprehensive Plan.
Table 21
9 Overlapping needs between priority areas were extracted. For example, the general facility needs area included Pre-K additions. These Pre-K additions were extracted from the general needs area and public school choice area for purposes of this chart. Facility costs that are not included in this chart are just general facilities investments which are not attached to one of the three key academic initiatives.
Program and Facility Costs Involved in the TRE, By Key Academic Initiative
Year Key Initiative Total Program
Costs Total Facility
Costs9 Total Program and
Facility Costs 2017‐2020 Early Childhood $135,000,000 $111,500,000 $246,500,000
2017‐2020 Public School Choice $27,800,000 $529,600,000 $557,400,000
2017‐2020 Career and Technical Ed $10,000,000 $228,000,000 $238,000,000

54
Appendix
Appendix A CTE by Career Cluster
Appendix B Industry Recognized Certifications (2009-10 to 2013-14)
Appendix C Endorsement Variations
Appendix D School by School Breakdown of Projected Growth
Appendix E Total Programmatic Costs
Appendix F Cost Estimate Formula Categories

55
Appendix A
CTE By Career Cluster NAF = National Academy Foundation
Business and Industry Public Services STEM
Agriculture
Architecture/
Construction
Arts/
Communicatio
Business/
Marketing
Finan
ce
Hospitality/
Tourism
Inform
ation
Technology
Tran
sportation
Logistics
Man
ufacturing
Education
Governmen
t/
PA
Health Scien
ce
Human
Services
Law/Public
Safety
Engineering
Computer
Science
Bryan Adams • • NAF • NAF
Adamson • NAF • • Carter • • Conrad NAF NAF
+ NAF NAF NAF
Garza ECHS (Mountain View) Gilliam ECHS (Cedar Valley) Hillcrest NAF
Jefferson • NAF NAF
+ NAF
Kimball NAF NAF
Lassiter ECHS (El Centro) Lincoln • • • NAF
Madison NAF Molina • 2 • North Dallas NAF NAF NAF
Obama • Pinkston • • • Rangel Roosevelt NAF
+
Samuell 2 • • Samuell ECHS (Eastfield) Sanders Public Service, Law • • School of Business and Management • School of Health Professions • • School of Science and Engineering School for the Talented and Gifted • Seagoville • • • • Skyline • 3 5 2 NAF
+NAF
+4 • • •
Smith New Tech • Sorrells Education and Social Services • South Oak Cliff • NAF • • Spruce • NAF • • NAF Spruce CTE ECHS (Eastfield) • 2 • Sunset • • NAF • • NAF • Washington for the PVA White • • • NAF Wilmer‐Hutchins • • • NAF 2 Wilson • NAF NAF NAF Subtotal NAF (32) 7 5 6 4 10
TOTAL (115) 2 10 18 11 8 12 12 9 1 6 2 6 1 5 11 1

56
Appendix B
BUSINESS AND COMPUTING Microsoft Office Specialist (includes Word, Excel, Access, and/or PowerPoint); Network Pro; PC Pro; Adobe Certified Associate; Adobe InDesign; Internet Computing Core Certification; A+; Auto Cad; Autodesk; Wise Financial Literacy; Typing Certification; Career Prep 2009-10 2010-11 2011-12 2012-13 2013-14 107 289 421 576 646 HEALTH AND SAFETY Patient Care Technician; Phlebotomy; Pharmacy Tech; Nurse Aid; Dental Assistant; Law Enforcement 2; 911 Dispatch Certification; CPR Heart Saver (AHA); First Aid; FEMA (11 certifications); OSHA; CareerSafe Cyber Safety Awareness
2009-10 2010-11 2011-12 2012-13 2013-14 46 25 140 404 HOSPITALITY AND TOURISM ServSafe Food Handler; Certified Tourism Ambassador 2009-10 2010-11 2011-12 2012-13 2013-14 482 TRADES I-CAR (automotive bonding, welding, or metal); Cosmetology Operator License; Interior Design Fundamentals; Floral Design 2009-10 2010-11 2011-12 2012-13 2013-14 24 21 43 64 151 TOTAL CERTIFICATIONS EARNED2009-10 2010-11 2011-12 2012-13 2013-14 177 310 489 780 1,683

57
Appendix C
STEM Endorsement Program of Study 9th 10th 11th 12th
CTE Career Cluster (Option A), such as Engineering (Project Lead The Way) A coherent sequence of courses of four or more credits in CTE
Introduction to Engineering Design
Principles of Engineering
Aerospace Engineering or Biotechnical Engineering or Digital Electronics or Computer Integrated Manufacturing or Civil Engineering and Architecture
Engineering Design and Development
Science (Option D) A total of five credits in science by successfully completing Biology, Chemistry, Physics, and two additional science courses
Biology or Physics
Biology or Physics or Chemistry
Physics or Chemistry or Aquatic Sciences or Astronomy or Earth and Space Science or Environmental Systems or AP/IB Science or Advanced Animal Science or Advanced Plant and Soil Science or Anatomy and Physiology
Physics or Chemistry or Aquatic Sciences or Astronomy or Earth and Space Science or Environmental Systems or AP/IB Science or Advanced Animal Science or Advanced Plant and Soil Science or Anatomy and Physiology

58
Appendix C cont. Business and Industry Endorsement
Program of Study 9th 10th 11th 12th
Business Management A coherent sequence of 3 or more courses for 4 or more credits in CTE that includes at least 2 courses in the same career cluster and at least 1 advanced CTE course (the third or higher course in a sequence)
Principles of Business, Marketing and Finance
Business Information Management I or Accounting I
Business Information Management II or Accounting II
Banking and Financial Services (.5 credit) or Securities and Investments (.5 credit) or Career Prep (2 credits) or Career Prep (3 credits)
Public Services Endorsement
Program of Study 9th 10th 11th 12th
Junior Reserve Officer Training Corps (JROTC)
Four courses in JROTC
Law Enforcement A coherent sequence of 3 or more courses for 4 or more credits in CTE that includes at least 2 courses in the same career cluster and at least 1 advanced CTE course (the third or higher course in a sequence)
Principles of Law, Public Safety, Corrections and Security
Forensic Science or Court Systems and Practices
Law Enforcement I
Law Enforcement II or Practicum, Law, Public Safety, Corrections and Security
Education and Training A coherent sequence of 3 or more courses for 4 or more credits in CTE that includes at least 2 courses in the same career cluster and at least 1 advanced CTE course (the third or higher course in a sequence)
Principles of Education and Training
Human Growth and Development
Instructional Practices in Education and Training
Practicum in Education and Training

59
Appendix C cont. Arts and Humanities Endorsement
Program of Study 9th 10th 11th 12th
Band Symphonic Band
Wind Symphony Wind Symphony Wind Symphony
Visual Art A coherent sequence of four fine arts credits
Art I Art II - Drawing or Art II - Painting or Art II - Ceramics or Art II - Sculpture or Art II - Photography or Art II - Electronic Media or Art II - Jewelry or Art II - Printmaking
Art III - Drawing or Art III - Painting or Art III - Ceramics or Art III - Sculpture or Art III - Photography or Art III - Electronic Media or Art III - Jewelry or Art III - Printmaking
AP 2D Design Studio Art or AP 3D Design Studio Art or AP Drawing Studio Art or AP Art History
Multidisciplinary Studies Endorsement (Minimum Requirements)
Program of Study 9th 10th 11th 12th
College/Career-Oriented Four Advanced courses either within one Endorsement area or among Endorsement areas
Foundation Subject Areas English I Algebra I Biology World History OR World Geography
English II Geometry ChemistryU.S. History
English III Algebra II Physics Government/Economics
English IV Advanced Math Advanced Science Advanced Social Studies
Four total credits in: Advanced Placement (AP) OR Dual Credit OR International Baccalaureate (IB) (Woodrow Wilson HS 2014-15)
AP or IB or DC English + AP or IB or DC Math + AP or IB or DC Science + AP or IB or DC Social Studies + AP or IB or DC Economics + AP or IB or DC LOTE + AP or IB or DC Fine Arts

60
Appendix D

61
Appendix E
Total Programmatic Costs by Program Type
Program Type 2015-2016 2016-2017 2017-2018 2018-2019 2019-2020
Total Programming
Costs
Early Childhood $10mil $16mil $30mil $45mil $60mil $161mil
Public School Choice
$3.7mil $5.6mil $7.5mil $9.5mil $10.8mil $37.1mil
Career & Technical Education
$3.2mil $3.2mil $3.2mil $3.2mil $3.2mil $16mil
Total Costs $16.9mil $24.8mil $40.7mil $57.7mil $74mil $214.1mil

62
Appendix F
The cost estimates in the interim bridge plan and Comprehensive Plan are formula driven. Below are the categories which are included in the formula that makes up a project’s budget estimate.
- Escalated CCL - Construction Estimate w/GC OH&P - Offsite Development - Temporary Buildings - Project Contingency - FF&E for Campus (Additions & New only) - FF&E Contingency (Additions & New only) - Base Design Fee – AE - Add Services for Design AE - AE Reimbursable - Haz-Mat Abatement - Haz-Mat Sample/Monitoring & Hazmat Design Fee - Land Survey for Existing Campus - GeoTech - Material Testing, Text & Bal, Roof Insp, TAC, Comm. - Test & Balance - Roof Inspection - Energy Mgt Design, Energy Audit Permit Review - Energy Mgt Contracted Work - Energy Mgt Contracted Work Contingency - Printing / Miscellaneous Costs - Bid Advertisements - Permits & Fees - Moving Expenses - Overtime-Custodial Support - Program Manager Fee - Program Manager Reimbursable - DISD Program Costs - Program Contingency


www.smu.edu/artsresearch
Using Data to Foster Thriving Arts Organizations
Zannie VossDirector, NCARProfessor and Chair of Arts Management and Arts EntrepreneurshipMeadows School of the Arts & Cox School of Business
Arts, Culture &
Libraries Committee
February 17, 2015

www.smu.edu/artsresearch
Using Data to Foster Thriving Arts Organizations
Zannie VossDirector, NCARProfessor and Chair of Arts Management and Arts EntrepreneurshipMeadows School of the Arts & Cox School of Business
NCAR DALLAS ARTS ORGANIZATIONS: A NATIONAL COMPARISON
2
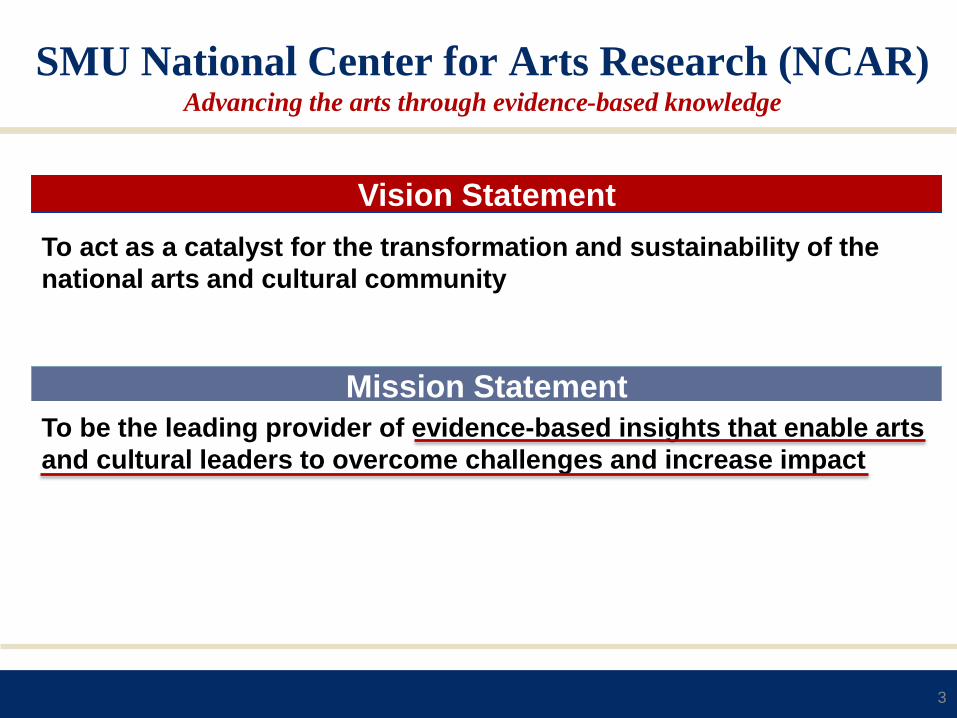
SMU National Center for Arts Research (NCAR)Advancing the arts through evidence-based knowledge
To act as a catalyst for the transformation and sustainability of the
national arts and cultural community
Vision Statement
Mission Statement
To be the leading provider of evidence-based insights that enable arts
and cultural leaders to overcome challenges and increase impact
3

Partners
Strategy
Data
Indices &
Dashboard
Creation
14,000+ arts &
cultural
organizations
IRS 990’s on 40,000+ arts
organizations
400+ theaters nationally
4

Modeling the Arts & Culture Ecosystem
Public Arts Funding*• NEA
• IMLS
• NASAA
•Cultural Data Project
Community
Arts Dollar Activity*
Arts & Culture Providers*
Other Leisure Activities
Socioeconomic & Demographic
characteristics• Census Bureau
• Cultural Data Project
Arts & Cultural
Organizations
Operating characteristics,
Decisions & Outcomes• Cultural Data Project
• Theatre Communications Group
• NCCS – IRS 990s
*These form the basis of our Arts Vibrancy Index metrics
5

SMU National Center for Arts Research (NCAR)Advancing the arts through evidence-based knowledge
Mission Statement
To be the leading provider of evidence-based insights that enable arts and
cultural leaders to overcome challenges and increase impact
What are the Important Questions to Ask about Health & Impact?
Contributed
revenue
Earned
revenue
Expenses Marketing
Impact
Bottom Line
Balance Sheet Community
Engagement
Program
Activity
What outcomes should we examine in order to answer the questions?
Staffing
Do we have data on those outcomes?
6

Dallas County compared with all 3,144 U.S. counties
7

Dallas County, TX (95)(100=top market)
Arts dollars ranking: 97
Arts providers ranking: 92
Government grant activity: 65
Program revenue: 97Contributed revenue: 97Total expenses: 97Total compensation: 95
Arts organization employees: 96Independent artists: 74Arts & entertainment employees: 93Arts organizations: 84
State government dollars: 21State government number: 52Federal government dollars: 82Federal government number: 77
Dallas County compared with all 3,144 U.S. countiesA ranking of 95 means Dallas County is in the top 5%. That means
there are about 157 counties that rank higher.
8

Dallas-Plano-Irving (91)(100=top market)
Arts dollars ranking: 94
Arts providers ranking: 84
Government grant activity: 57
Program revenue: 93Contributed revenue: 94Total expenses: 94Total compensation: 91
Arts organization employees: 94Independent artists: 68Arts & entertainment employees: 84Arts organizations: 78
State government dollars: 20State government number: 54Federal government dollars: 75Federal government number: 62
Dallas-Plano-Irving Metro Division compared with
937 U.S. MSAs and Metro Divisions
Dallas County, TX (95)(100=top market)
Arts dollars ranking: 97
Arts providers ranking: 92
Government grant activity: 65
Program revenue: 97Contributed revenue: 97Total expenses: 97Total compensation: 95
Arts organization employees: 96Independent artists: 74Arts & entertainment employees: 93Arts organizations: 84
State government dollars: 21State government number: 52Federal government dollars: 82Federal government number: 77
Ranking of 91 means there are about 87 MSAs that rank higher.
9

Chicago
Atlanta
Dallas
PhoenixRiverside
Santa Ana
San Diego
Minneapolis/
St. Paul.
Houston
Market Clusters: Other Large Markets*, Dallas, and Chicago
*CDP Markets, only
59.5%
38.3%
Chicago
(pop. 7.3 million)7 Other Large Markets
(ave. pop. 3.8 million)
Dallas
(pop. 4.4 million)
There is annual data on 401 organizations in Chicago, 40 in Dallas, and 345 total from the 7 Other Large
Markets (an average of 49/market).
10

Chicago
Market Clusters: Other Large Markets*, Dallas, and Chicago
*CDP Markets, only
59.5%
38.3%
Chicago
(pop. 7.3 million)7 Other Large Markets
(ave. pop. 3.8 million)
$0
$5,000
$10,000
$15,000
$20,000
$25,000
$30,000
$35,000
$40,000
$45,000
Median Income
$39,086 $39,080 $40,578
0
10
20
30
40
Median Age
35 34 35
Dallas
(pop. 4.4 million)
0%
5%
10%
15%
20%
25%
Percentage ofhouseholds withmedian income
>$200k
Percentage ofhouseholds in
poverty
Percentage ofpopulation with
a bachelor'sdegree or
higher
7%
17%
22%
8%
18%21%
10%16%
22%
Income Distribution, Education
7 Other Large Markets: Atlanta, Houston, Minneapolis/St. Paul, Phoenix, Riverside, Santa Ana, San Diego
11
Market Clusters: Other Large Markets*, Dallas, and Chicago
*CDP Markets, only
59.5%
38.3%
Chicago
(pop. 7.3 million)7 Other Large Markets
(ave. pop. 3.8 million)
0%
5%
10%
15%
20%
25%
Percentage ofhouseholds withmedian income
>$200k
Percentage ofhouseholds in
poverty
Percentage ofpopulation with abachelor's degree
or higher
7%
17%
22%
8%
18%21%
10%
16%
22%
Income Distribution, Education
Dallas
(pop. 4.4 million)
7 Other Large Markets: Atlanta, Houston, Minneapolis/St. Paul, Phoenix, Riverside, Santa Ana, San Diego
0%
5%
10%
15%
20%
25%
30%
35%
Percentage of thepop. Asian-American
Percentage of thepop. African-
American
Percentage of thepop.
Hispanic/Latino
8%10%
22%
6%
18%
34%
8%
20%
25%
Ethnic/Cultural Diversity
12

Chicago
Atlanta
Dallas
PhoenixRiverside
Santa Ana
San Diego
Minneapolis/
St. Paul.
Houston
Market Clusters: Other Large Markets*, Dallas, and Chicago
*CDP Markets, only
59.5%
38.3%
Chicago
(pop. 7.3 million)7 Other Large Markets
(ave. pop. 3.8 million)
0%
20%
40%
60%
80%
100%
OtherLarge
Markets
Dallas Chicago
41% 46%66%
31% 29%
20%28% 25%
14%
Distribution of Arts Organizations by Size
Large (over $1million)
Medium ($250,000to $1 million)
Small (under$250,000)
0%
5%
10%
15%
20%
25%
Percentage ofhouseholds withmedian income
>$200k
Percentage ofhouseholds in
poverty
Percentage ofpopulation with a
bachelor'sdegree or higher
7%
17%
22%
8%
18%21%
10%
16%
22%
Income Distribution, Education
$0
$1
$1
$2
$2
$3
Ave. totalexpenses (before
depr.)
Ave. unrestrictedcontributed
revenue
Ave. earnedrevenue (before
cap. Gains)
$2.34
$1.36 $1.12
$2.25
$1.31 $.86
$1.37
$.73 $.67
Mill
ions
Average Organizational Expenses & Revenues
Dallas
(pop. 4.4 million)
13
To what extent does unrestricted support from
each of these sources cover expenses?
Dallas organizations tend to cover more of their expenses with trustee giving, united fund and
related organization support than Other Large Markets or Chicago, ...
0% 10% 20% 30% 40% 50% 60%
Unrestricted contributions
Trustees
Individuals
Corporations
Foundations
Government
Special Events
United Arts, Parent, andRelated Org. Support
In-kind
NARTR
56.0%59.5%
53.5%
Other Large Markets Dallas Chicago
4%
6%
4%8%
7%
7%3%
4%
2% 4%
4%
5%6%
2%
5%4%
3%
5%3%
14%
4%3%
3%
3%21%
15%
19%
14
To what extent does unrestricted support from
each of these sources cover expenses?
Dallas organizations tend to cover more of their expenses with trustee giving, united fund and
related organization support than Other Large Markets or Chicago, ...…whereas Other Large Markets and Chicago cover more government support and NARTR than Dallas.
There was 1% or less difference in individual, corporate, foundation, special event, and in-kind support.
0% 10% 20% 30% 40% 50% 60%
Unrestricted contributions
Trustees
Individuals
Corporations
Foundations
Government
Special Events
United Arts, Parent, andRelated Org. Support
In-kind
NARTR
56.0%59.5%
53.5%
Other Large Markets Dallas Chicago
4%
6%
4%8%
7%
7%3%
4%
2% 4%
4%
5%6%
2%
5%4%
3%
5%3%
14%
4%3%
3%
3%21%
15%
19%
15

What percentage of Unrestricted Contributed
Revenue comes from each Government source?
Dallas arts organizations have comparatively less support from all levels of government,
particularly local and state.
0.0% 1.0% 2.0% 3.0% 4.0% 5.0% 6.0% 7.0%
Local
State
NEA/IMLS
6.0%
3.2%
0.6%
3.2%
0.5%
0.3%
5.6%
1.5%
2.0%
Other Large Markets Dallas Chicago
16

What is the Fundraising Return on Investment
and Marketing Return on Investment*?
*Return on marketing includes all revenue earned due to people participating in program activity.
Return on Fundraising is very similar for organizations in Dallas and Other Large Markets and
higher in these markets than in Chicago. However, Return on Marketing is lowest in Dallas.
$0
$1
$2
$3
$4
$5
$6
$7
$8
$9
Return on Fundraising Return on Marketing
$8.88
$6.09
$8.63
$3.68
$7.12
$8.49
Other Large Markets
Dallas
Chicago
17

$0 $5 $10 $15 $20 $25
Other LargeMarkets
Dallas
Chicago
$3.76
$7.98
$3.29
$16.35
$23.19
$19.28
Marketing Expenses per Attendee Program Revenue per Attendee
How much Marketing Investment does it take to
bring in one person, and how much Program
Revenue is earned per attendee?
Dallas organizations spend twice as much to bring in each attendee than organizations in Other
Large Markets or Chicago but they then earn more per attendee once someone attends.
18

$0 $5 $10 $15 $20 $25
Other LargeMarkets
Dallas
Chicago
$3.76
$7.98
$3.29
$16.35
$23.19
$19.28
Marketing Expenses per Attendee Program Revenue per Attendee
How much Marketing Investment does it take to
bring in one person, and how much Program
Revenue is earned per attendee?
$15.21
$12.59
Dallas organizations spend twice as much to bring in each attendee than organizations in Other
Large Markets or Chicago but they then earn more per attendee once someone attends.
The result is that Chicago organizations earn more net program revenue per attendee than those in
Dallas, which earn more than organizations in Other Large Markets.
$15.99
19

How many people are engaged per offering and
what is the amount of total unrestricted operating
revenue generated per program offering?
People per offering
Revenue per offering
Organizations in Other Large Markets and Chicago engage twice as many people per
programmatic offering than do organizations in Dallas. They also generate higher revenue per
offering.
$25,141
$18,788
$28,636
Other Large Markets Dallas Chicago
585
286
654
20

How much is the total cost of serving each
person (not including virtual attendance)?
Dallas organizations spend 1/3rd more in total on programming, fundraising, and general
administrative expenses for every attendee than organizations in Other Large Markets and
Chicago.
$42.36
$67.27
$45.73
$0 $10 $20 $30 $40 $50 $60 $70 $80
Other Large Markets
Dallas
Chicago
21

How much revenue is directly invested in
programs, considering all direct costs related to
programs and then only the costs of paying artists
and program personnel?
Dallas organizations spend more resources on program than those in Other Large Markets and
Chicago. They invest much more in artists and program personnel.
36.2%
53.0%
40.1%
58.6%
68.8%
60.2
0%
10%
20%
30%
40%
50%
60%
70%
80%
Other Large Markets Dallas Chicago
Investment inProgram
Investment inProgram Personnel
22

What is the Bottom Line relative to Expenses?
Dallas organizations average a negative bottom line regardless of how it is calculated. The effect
of depreciation expenses heavily impacts organizations in Other Large Markets and Chicago.
4.6%
-1.3%
1.2%
6.0%
-2.0%
0.3%
-1.4%
-3.5%
-7.0%-8.0%
-6.0%
-4.0%
-2.0%
0.0%
2.0%
4.0%
6.0%
8.0%
Other Large Markets Dallas Chicago
Unrestricted net surplus/deficit
Operating surplus/deficit (before depr.)
Operating surplus/deficit (after depr.)
23

What is the Bottom Line relative to Expenses?
However, Small and Medium organizations in Dallas average a positive bottom line across all
measures. Across all markets: 1) Small organizations ran a positive average bottom line, and 2)
the larger the organization, the more likely it is to run a deficit.
4.6%
-1.3%
1.2%
6.0%
-2.0%
0.3%
-1.4%
-3.5%
-7.0%-8.0%
-6.0%
-4.0%
-2.0%
0.0%
2.0%
4.0%
6.0%
8.0%
Other Large Markets Dallas Chicago
Unrestricted net surplus/deficit
Operating surplus/deficit (before depr.)
Operating surplus/deficit (after depr.)
24

How many months of working capital does the
organization have? What is the relationship
between its access to readily available cash and
its annual budget?
-5.0
0.0
5.0
10.0
15.0
20.0
Other Large Markets Dallas Chicago
3.1
-0.6
1.6
11.2
3.6
19.8
Months of Working Capital Months of Available Cash
Dallas organizations have fewer months of working capital and access to available cash than
organizations in Other Large Markets and Chicago.
26%
94%
-5%
30%13%
165%
25

SUMMARY OF KEY TAKE-AWAYS
• Benefit from higher trustee giving and related organization (i.e., TACA) funding.
• Have lower public funding at every level and lower NARTR, so less funding given in
a prior year for future activity. Generate higher return on fundraising than Chicago
but lower return on marketing than either Chicago or Other Large Markets.
• Spend twice as much to bring in each attendee than organizations in Chicago or
Other Large Markets and earn more per person once someone attends. Chicago
organizations net more program revenue per person than other markets.
• Attract fewer people per offering and revenue per offering, and serve fewer people
relative their budget size.
• Invest more of their budgets in program and program personnel.
• Struggle to break even, keep up with cash flow needs and maintain access to cash,
especially large organizations.
Dallas arts organizations in the CDP:
26

FOOD FOR THOUGHT
• What could we imagine for the arts in the city if we had current support
AND strong public arts funding?
• The marketing nut is critical to crack.
• What are the opportunities for programming that is compelling to
Hispanics/Latinos, African-Americans and Asian-Americans in our
community? They are the majority.
These areas presents big opportunities for growth.
27

www.smu.edu/artsresearch
Thank you!
28


