artist: than trong dzung
TRANSCRIPT

11 PCI 2019THE VIET NAM PROVINCIAL COMPETITIVENESS INDEX

Artist: Than Trong Dzung

141.000respondents
300.000PCI website users and
2.500.000web visits
PCI reports produced15
63/63provinces enactedPCI improvement
action plans
65.000cadres and local leaders
at PCI diagnosticworkshops and events
25
200domestic and foreign
research studiesreferenced PCI findings
EMPOWER
INSPIRE
16 countries put in place a PCI-like index
TAKE ACTION
1.500central and locallegal documentsemployed PCI scores
500workshops aboutPCI organized by provinces
500provincial Party Congress
documents forthe term 2015-2020
set PCI a key task
provincial People’s Councils’ resolutionsand documents set PCI on the monitoring and debate agenda

15 YEARS’ ACHIEVEMENTS
Wait time to register business dropped dramatically
Wait time for Land Use RightsCertificates decreased considerably
Time for implementing administrative procedures
faster than regulation
Information quality of provincial websites
improved significantly
Provincial authorities are flexiblewithin the legal frameworkto create favorable business
environment for nonstate firms
Firm agrees that legal systemwill uphold property rights
and contracts
Business associations playan important role in provincial
policy consultation and advocacy
More state officialshandled work effectively
52.5065.18
2006
202006 2019
days
75%2013*
Inspections and examinationsless redundant
26%2015*
11%2019
36%2009*
74%2006
80%2019
46%2019
62%2006
88%2019
67%2017*
73%2019
81%2019
5 days2019
All 63 provinces improved economic governance
1212006
days
92006points 35
2019points
201930 days
(medianPCI scores)
* The year in which the indicator was introduced


Primary Author and Lead Researcher Edmund J. Malesky, Ph.D
Research TeamDau Anh TuanPham Ngoc ThachLe Thanh HaTran Minh ThuNguyen Thi Le NghiaNguyen Le HaTruong Duc Trong

FOREWORD
We are honored to present the fifteenth edition of the Provincial Competitiveness Index (PCI), which represents the collective perceptions of businesses across Vietnam on provincial governance. Over the course of 15 years, the PCI surveys have unfailingly conveyed important assessments from the business community to Vietnamese authorities at different levels to inform policy making and governance reforms, building a more enabling business climate in Vietnam.
The PCI is proud to have been a part of this monumental journey of transition in Vietnam. Reform of administrative procedures has gone a long way - from being overlooked to becoming central of provincial governance agenda in almost all the provinces. Starting modestly in size and scale, private firms in Vietnam have grown dramatically and are heading to reach one million operations. More importantly, they have become priority sector for achieving the country’s growth potential by the Party and Government. At the same time, the Vietnam business environment has risen in international rankings, and is heading to enter the Top 4 ASEAN countries in the Ease of Doing Business Index (DB) - a benchmark study annually published by the World Bank.
However, what makes PCI most proud is to have empowered businesses to speak up, made their voices heard, and catalyzed governance change in ways that improve business performance. The PCI survey informs provincial authorities with comprehensive, quantitative findings to help them define problems, and navigate reform agendas to fulfill the practical needs of businesses. Evidence-based policy-making, facilitated by high quality data, has become a common practice in many provinces in Vietnam. The PCI played a role in that diffusion.
Inspired by the PCI, many reform models and best practices have grown and been replicated across the country. The model “Café Doanh nhân” (Coffee with Entrepreneurs) initiated by Dong Thap Province has increased its presence to more than 40 provinces and cities, providing an informal setting for firms to dialogue with provincial authorities. The DDCI survey, a PCI

version at departmental and district levels which was pioneered by Quang Ninh, has been replicated to nearly 50 other provinces and cities. All these are intended to hear firms’ voices and address practical issues. There are a lot of similar reform stories to be told about the 15-year journey that VCCI and USAID have found and walked together.
This year’s PCI Report marks the 15th anniversary with positive changes in the Vietnamese business environment, as perceived by businesses around the country. The reform efforts have paid off, bringing demonstrable successes after long-standing efforts. This is illustrated by the cover picture of PCI 2019 Report from Vietnamese artist Than Trong Dzung, which depicts fishermen with full catch, signaling a fine season forthcoming. Challenges will certainly arise to come but we are confident the Vietnamese government and provincial governments will similarly reap the benefits of the governance reforms that they have cast out since 2005.
Vu Tien Loc, Ph.D.
Chairman and PresidentViet Nam Chamber of Commerce and Industry
Michael Greene
Mission DirectorUnited States Agency for International
Development in Viet Nam

The Provincial Competitiveness Index (PCI) is the result of a long-standing collaborative effort between the Viet Nam Chamber of Commerce and Industry (VCCI) and the U.S. Agency for International Development (USAID) to enhance provincial economic governance to create a business-enabling environment in Vietnam.
The PCI 2019 Report was developed under the overall direction of Vu Tien Loc, Chairman and President of VCCI, Vice Chairman of the Prime Minister’s Administrative Procedures Reform Advisory Council, Head of the Steering Committee of the PCI Program, and Dau Anh Tuan, General Director of VCCI’s Legal Department, and benefited from important support and input provided by Michael Greene, USAID Viet Nam Mission Director. Gregory Leon, Director of Economic Growth and Governance for USAID/Viet Nam and Nguyen Thi Cam Binh, Program Management Specialist, USAID/Viet Nam, provided comments for the report, and strong managerial support for the program.
Edmund Malesky, Professor of Political Economy at Duke University, led the formulation of the PCI research methodology and was primarily responsible for the presentation of its analytical findings. Pham Ngoc Thach, Deputy Director of VCCI’s Legal Department led the data collection, index construction and data analysis. The entire process of the PCI survey and research was supported and coordinated by a competent PCI research team. Le Thanh Ha, Division Head, VCCI’s Legal Department and Tran Minh Thu, PCI Project Coordinator managed the PCI research and report schedule and outputs. Layna Mosley, Professor at the University of North Carolina at Chapel Hill, provided valuable advice on Chapter 3. Renate Kwon improved the report with excellent copyediting.
The PCI 2019 report was based on data collected through a rigorous business survey process, implemented by fifty students under the management and coordination of Nguyen Le Ha, Nguyen Vu Quang, and Luu Ngoc Anh at VCCI. The survey process and report development was effectively supported by Nguyen Thi Le Nghia, Bui Linh Chi, Truong Duc Trong, and Vu Ngoc Thuy from VCCI.
Our special thanks to Than Trong Dzung, a Vietnamese painter, for giving us permission to use his set of paintings “Fisher” as the theme for the report design.
ACKNOWLEDGEMENTS

On the 15th anniversary of the PCI, we would like to express our sincere thanks to all the people who have contributed to the development and refinement of the PCI over the years, and who have made efforts to spread the PCI findings. Our special thanks to the ex-members of the Prime Minister’s Advisory Board that served between 2004 and 2005 for their support to this groundbreaking and sensitive initiative. We would like to thank the Prime Minister’s Advisory Board for co-hosting the first PCI launch. Our appreciation goes to those who made important contributions to the development and implementation of the PCI, including Mr. Tran Xuan Gia, former Head of the Prime Minister’s Advisory Board, Madam Pham Chi Lan, Senior Economist, former member of the Prime Minister’s Advisory Board; Dr. Le Dang Doanh, Senior Economist, former member of the Prime Minister’s Advisory Board; Vu Quoc Tuan, Senior Economist, former member of the Prime Minister’s Advisory Board; [Nguyen Ky], Senior Economist, former member of the Prime Minister’s Advisory Board; Tran Huu Huynh, Chairman, Vietnam International Arbitration Center, former General Director of VCCI’s Legal Department; Prof. Dr. Nguyen Van Thang, National Economics University; Dr. Nguyen Dinh Cung, former Director and Phan Duc Hieu, Vice Director, Central Institute for Economic Development (CIEM), Ministry of Planning and Investment; Prof. Dr. Tran Dinh Thien, former Director, Vietnam Institute of Economics, Vietnam Social Sciences Academy; Prof. Dr. Tran Tho Dat, Chairman of the Council of National Economics University; Dr. Nguyen Minh Phong, Vice Director, Communication and Theory Committee, People’s Newspaper; Dr. Vo Hung Dung, former Director, VCCI Can Tho branch; Tran Thi Lan Anh, Vice Secretary-General cum Director General of Bureau for Employers’ Activities, VCCI; Dr. Nguyen Thi Thu Trang, Director of VCCI’s WTO Center and Integration; Pham Hoang Tien, Director, VCCI’s Small and Medium Enterprise Support Center; Nguyen Phuong Lam, Director, VCCI Can Tho; Nguyen Tien Quang, Director, VCCI Da Nang; Nguyen Dien, Director, Center for Enterprise Support and Consultancy, former Director, VCCI Da Nang; Nguyen Thi Cuc, Chairman, Vietnam Tax Consultants’ Association, former Vice Director, General Tax Authority, Ministry of Finance; Nguyen Huu Thap, Chairman, Tuyen Quang Province Business Association; Nguyen Van Thoi, Chairman, Thai Nguyen Province Business Association; Tran Thi Dep, former Chairman, An Giang Province Business Association; Nguyen Van De, Chairman, Thanh Hoa Province Business Association, Chairman, Vietnam Private Hospitals Association; Duong Trong Khang, Standing Vice Chairman, Vinh Phuc Province Business Association; Nguyen Duc Lam, Department Director, Training Center for Elected Representatives; Deputies’ Affairs Committee, Standing Committee of the National Assembly; Le Van Quan, Director, Hanoi Center for Small and Medium sized Enterprise Support, Hanoi Department of Planning and Investment; Pham Binh An, Director, Ho Chi Minh City Center for International Integration Support; Phan Trung Can, former Director, Binh Thuan Province Center for Small and Medium sized Enterprise Support; Vu Thi Kim Chi, Vice Director, Quang Ninh Investment Promotion Agency; Le Xuan Hien, Director, Division of Bidding, Appraisal and Investment Supervision, Hai Duong Department of Planning and Investment; Vo Van Hung, Director, Quang Nam Center of Public Administration and Investment Promotion; Le Xuan Vinh, Director, Center for Investment and Start-up, Ben Tre Department of Planning and Investment; Dr. Nguyen Phuong Bac, Director, Bac Ninh Institute of Socio-economic Studies; Dr. Nguyen Van Hung, Vice Director, Da Nang Institute of Socio-economic Studies; Dr. Cung

Trong Cuong, Director, Thua Thien-Hue Institute of Development Studies; Ngo Vinh Bach Duong; Director, Department of Economic Law, Institute for State and Law, Vietnam Academy of Social Sciences; Dr. Le Duy Binh, Director, Economica Vietnam; Truong Thanh Duc, Chairman, Members’ Council of BASICO Law Firm; and many other experts from provinces, cities, research institutes, associations, and businesses that we cannot list here.
The PCI reports would not be possible without the contributions over the years from those who inputted in the development of the PCI. These include: Prof. Dr. Christian Ketels, Business School, Harvard University, who led the research team of Prof. Dr. Michael E. Porter at the Institute for Strategy and Competitiveness; Asst. Prof. Dr. Dimitar Gueorguiev, Maxwell School of Citizenship and Public Affairs at Syracuse University; Matthias Duhn, former Director, Eurocham Viet Nam; Asst. Prof. Dr. Weiyi Shi, School of Global Strategy and Policy, UC San Diego; Asst. Prof. Dr. Pham Anh, School of Policy and Government, George Manson University; Asst. Prof. Dr. Benjamin Graham, Lecturer of International Relations, University of Southern California; Prof. Dr. Layna Mosely, Lecturer of Political Science, University of North Carolina Chapel Hill; Dr. Trang (Mae) Nguyen, U.S.-Asia Law Institute, New York University School of Law.; Prof. Dr. Markus Taussig, Rutgers Business School, Rutgers University; Dr. Le Quoc Anh, R&D Specialist, Facebook; Prof. Dr. Soo Yeon Kim, Political Science Faculty, National University of Singapore; Prof. Dr. Helen Milner, Princeton University; Phan Tuan Ngoc, Ph.D. candidate, Duke University; Prof. Dr. Tran Ngoc Anh, Indiana University and Harvard University; Dr. Neil McCulloch, Institute of Development Studies, University of Sussex, Britain, and Director, Economic Policy Program, Oxford Policy Management Consulting, Britain; Doan Hong Quang, Senior Economist, The World Bank Viet Nam; Adam Sitkoff, CEO, AmCham Viet Nam; Virginia Foote, AmCham Viet Nam, Co-chair, Vietnam Business Forum (VBF) 2019; Ass. Prof. Pham Duy Nghia, Director, Law and Public Governance Program, Fulbright School of Public Policy and Management, Viet Nam; Dr. Vu Thanh Tu Anh, Fulbright University, Viet Nam; Dr. Kim Ninh, former Chief Representative, The Asia Foundation Viet Nam; Ha Thanh Tu, former Programme Officer, The Asia Foundation Viet Nam; Dr. James Winkler, former Director of Vietnam Competitiveness Initiative (VNCI), Development Alternatives Inc. in Viet Nam (DAI); Dr. David Ray, former Deputy Director, VNCI, Development Alternatives Inc. in Viet Nam; Do Hoang Anh, former Deputy Director, VNCI, DAI; Huynh Mai Huong, VNCI’s PCI Project; Dr. Dang Quang Vinh, VNCI and former PCI Economist; Le Thi Thu Hien, VNCI PCI Project Manager; Nguyen Ngoc Lan, VNCI and PCI Project Manager; Nguyen Thi Thu Hang, VNCI and former PCI Project Coordinator.
We would like to express our gratitude to the UPS Foundation and Coca-Cola Viet Nam for their partnership with the PCI program in 2019.
The PCI survey would be incomplete without enthusiastic support from foreign business associations in Viet Nam. These include: American Chamber of Commerce in Viet Nam (AmCham), European Chamber of Commerce in Viet Nam (EuroCham), Japan Chamber of Commerce and Industry (JCCI), Korea Chamber of Commerce in Viet Nam (KoCham), British Business Group Vietnam (BBGV), Australian Chamber of Commerce in Viet Nam (AusCham), Canadian Chamber
Please use this suggested citation when referencing the report or data: Malesky, Edmund and Pham Ngoc Thach, 2020. The Vietnam Provincial Competitiveness Index: Measuring Economic Governance for Private Sector Development, 2019 Final Report, Vietnam Chamber of Commerce and Industry and United States Agency for International Development: Hanoi, Vietnam.
The opinions expressed herein are the authors’ own and do not necessarily reflect the views of the Viet Nam Chamber of Commerce and Industry (VCCI) and the U.S. Agency for International Development, the United States Government, the aforementioned individuals, or their agencies.
of Commerce in Viet Nam (CanCham), Indian Chamber of Commerce in Viet Nam (InCham), Hongkong Business Association in Viet Nam (HKBAV), Singapore Business Group, Swiss Business Association in Viet Nam (Swiss Business), The Council of Taiwanese Chambers of Commerce in Viet Nam (CTCVN), The Thai Business Association in Viet Nam (TBA), Nordic Chamber of Commerce Vietnam (Nordic Chamber).
Last, and most importantly, we would like to thank businesses for spending their valuable time to answer the PCI 2019 survey in a complete, candid, and objective way. Your inputs are crucial to the PCI report, as they help us capture the business environment to a broad spectrum to inform policy making, thereby bringing about benefits for the development of the business community.


35 Chapter 1 3735
Business Thermometer
Introduction
71 Chapter 238 Provincial Competitiveness Index
2019
123 Chapter 3
154 References
44 Key Features in Provincial Economic Governance over Time
63 What Challenges are Business Operations Facing?
64 Infrastructure Index 2019
68 Conclusion
Summary
Chapter 1Survey of Domestic Firms and the 2019 Provincial Competitiveness Index

77 Changing Sector and Size of Foreign Investment Composition
85 Prospects for Expansion of Existing Operations
89 Strong Improvement in All Entry Procedures
93 Concerns about Post-Entry Regulatory Enforcement and Tax Audits
102 Land Acquisition and Security of Tenure
115 Conclusions
117 Appendix
108 Corruption
127 Scale of Automation Ambitions
134 Motivation for Automation
142 The Impact of Automation on Employment
147 Policy Recommendations
149 Statistical Appendices
Chapter 2The Foreign Investment Survey
Chapter 3Robots on the Factory Floor: The Impact of Automation on Firms in Vietnam

10 PCI 2019 THE VIET NAM PROVINCIAL COMPETITIVENESS INDEX
LIST OF FIGURES
Figure 1.1 PCI Business Thermometers over time ...................................................................... 38
Figure 1.2 Weighted Provincial Competitiveness Index 2019 .................................................... 39
Figure 1.3 PCI 2019 Map....................................................................................................................40
Figure 1.4 Star Diagram of the PCI 2019 Subindices.................................................................... 43
Figure 1.5 Box plots of the PCI and Core Index over Time .......................................................... 45
Figure 1.6 Trends of Change in the Core PCI Index over Time ....................................................46
Figure 1.7 Average Annual Change in Core PCI Scores ................................................................ 47
Figure 1.8 Changes in Scores of the PCI Subindices 2006-2019 ...............................................48
Figure 1.9 A Sample of Indicators in the Policy Bias Subindex over Time .................................51
Figure 1.10 A Sample of Indicators About Informal Charges over Time ..................................... 58
Figure 1.11 Share of Firms Facing Difficulties Completing Construction-related Administrative Procedures ........................................................................................... 62
Figure 1.12 Major Challenges Faced by Firms ................................................................................. 63
Figure 1.13 The Infrastructure Index 2019 ...................................................................................... 65
Figure 1.14 Correlation between Quality of Governance and Infrastructure ........................... .67
Figure 2.1 Evaluation of Governance by Policy Arena ................................................................. 76
Figure 2.2 Change in Sectoral Composition of FDI over Time..................................................... 78
Figure 2.3 Downward Trend in Average Employment Size Halts ............................................... 79
Figure 2.4 Average Firm Employment Size by Sector in 2019 ....................................................80
Figure 2.5 Employment Growth by Sector since 2016 .................................................................81
Figure 2.6 Average Investment Size Increases after 10-Year Low ............................................ 82

1111 PCI 2019THE VIET NAM PROVINCIAL COMPETITIVENESS INDEX
Figure 2.7 Average Investment Size per Sector ........................................................................... 83
Figure 2.8 Investment Growth by Sector over Time ...................................................................84
Figure 2.9 PCI-FDI Business Thermometer ................................................................................... 85
Figure 2.10 Thermometer is a Lead Indicator for Actual Expansion ........................................... 86
Figure 2.11 PCI-FDI Thermometer by Sector in 2019 ..................................................................... 87
Figure 2.12 PCI-FDI Thermometer by Province ............................................................................... 88
Figure 2.13 Wait to Begin Operations ............................................................................................... 89
Figure 2.14 Wait Times by Document ..............................................................................................90
Figure 2.15 Increasing Share of Firms Entering as Domestic Companies ..................................91
Figure 2.16 Entry Times by Registration Form ............................................................................... 92
Figure 2.17 Inspection Burden by Agency ....................................................................................... 95
Figure 2.18 Distribution of Inspections and Tax Audits (by Visits) ............................................. 96
Figure 2.19 Distribution of Inspections and Tax Audits (by man hours lost) ............................ 97
Figure 2.20 Regulatory Inspections and Audits Were Fair ............................................................ 98
Figure 2.21 Audit Experience by Sector .......................................................................................... 99
Figure 2.22 Audit Experience by Sector Combined ...................................................................... 100
Figure 2.23 Audit Experience by Province ...................................................................................... 101
Figure 2.24 Audit Experience by Province Combined ...................................................................102
Figure 2.25 Type of Land Tenure ......................................................................................................103
Figure 2.26 Use of Industrial Zones over Time ............................................................................. 104
Figure 2.27 Increasing LURC Acquisition in Industrial Zones ...................................................... 105
Figure 2.28 Expropriation Risk over Time ...................................................................................... 106
Figure 2.29 Expropriation Risk over Time by Tenure Type ...........................................................107

12 PCI 2019 THE VIET NAM PROVINCIAL COMPETITIVENESS INDEX
Figure 2.30 Costs of Bribery over Time........................................................................................... 110
Figure 2.31 Calculation of Share of Foreign Firms Bribing for Construction Permits ............. 113
Figure 2.32 Calculation of Cost of Bribes for Construction Permits .......................................... 114
Figure 2.33 PCI-FDI Respondents by Country of Origin .................................................................117
Figure 2.34 Number of Firms Surveyed in Each Province over Time ......................................... 118
Figure 3.1 Frequency and Depth of Automation among Vietnamese Firms ..........................128
Figure 3.2 Share of Tasks Automated by Two-Digit Sector .......................................................130
Figure 3.3 Planned Automated Tasks by Sector .........................................................................132
Figure 3.4 Comparison of Current vs. Planned Automation ......................................................133
Figure 3.5 Perceived Drivers of Automation According to Firms .............................................136
Figure 3.6 Determinants of Automation of Foreign Firms (Regression Analysis) .................139
Figure 3.7 Determinants of Automation for Domestic Firms (Regression Analysis) ............ 141
Figure 3.8 Impact of Automation on Employment Decisions ...................................................143
Figure 3.9 Companies Hiring More Workers (by Sector) ........................................................... 144
Figure 3.10 Companies Planning to Reduce Employment by Sector ........................................ 145
Figure 3.11 Impact on Average Skill Level on Hiring Strategy.................................................... 146

1313 PCI 2019THE VIET NAM PROVINCIAL COMPETITIVENESS INDEX
LIST OF TABLE
Table 1.1 Top and Bottom Performers in the PCI 2019 Subindices ..............................................44
Table 1.2 A Sample of Indicators on Proactivity over Time ..........................................................49
Table 1.3 A Sample of Transparency Indicators Over Time .......................................................... 52
Table 1.4 A Sample of Indicators in Law and Order Subindex over Time .................................... 55
Table 1.5 Troublesome Administrative Procedures .......................................................................60
Table 1.6 A Sample of Indicators of the Infrastructure Index over Time ................................... 66
Table 2.1 Post-Entry Regulatory Costs over Time .........................................................................94
Table 2.2 Bribe Payments over Time .............................................................................................. 109
Table 2.3 List Experiment to Measure Bribery in Construction Permits .................................... 111
Table 2.4 Size of Foreign Firms over Time by Employment and Investment ............................ 119
Table 2.5 Performance of FIEs over Time .......................................................................................120
Table 2.6 Customers of FIEs over Time ...........................................................................................120
Table 2.7 Suppliers of FIEs over Time .............................................................................................. 121
Table 3.1 Survey of Automation Incentives ...................................................................................135
Table 3.2 Descriptive Statistics of Regression Variables (Foreign Firms) ............................... 149
Table 3.3 Descriptive Statistics of Regression Variables (Domestic Firms) ............................ 149
Table 3.4 Correlates of Automated Tasks (OLS with Foreign Investor Sample) ...................... 150
Table 3.5 Correlates of Planned Automation (OLS with Foreign Investor Sample) ................. 151
Table 3.6 Correlates of Automated Tasks (OLS with Domestic Investor Sample) ...................152
Table 3.7 Correlates of Planned Automation (OLS with Domestic Investor Sample) ..............153

ASEAN Association of Southeast Asian Nations
BRVT Ba ria-Vung Tau Province
CEO Chief Executive Officer
CPTPP Comprehensive and Progressive Agreement for the Trans-Pacific Partnership
DDCI Department and District Competitiveness Index
FDI Foreign Direct Investment
FIEs Foreign Invested Enterprises
GDP Gross Domestic Product
GSO General Statistical Office
GTD General Tax Department
IRC Investment Registration Certificate
ISIC International Standard Industrial Classification
IZ Industrial Zone
JV Joint Venture
LURC Land Use Rights Certificate
MNC Multi-national Corporation
OECD Organization for Economic Co-operation and Development
OLS Ordinary Least Square regression
PCI Provincial Competitiveness Index
SOE State-owned Enterprise
USAID United States Agency for International Development
USD United States Dollar
VCCI Vietnam Chamber of Commerce and Industry
VND Vietnamese Dong
ABBREVIATIONS AND ACRONYMS
14 PCI 2019 THE VIET NAM PROVINCIAL COMPETITIVENESS INDEX

ABBREVIATIONS AND ACRONYMS
1515 PCI 2019THE VIET NAM PROVINCIAL COMPETITIVENESS INDEX

16

17

18 PCI 2019 THE VIET NAM PROVINCIAL COMPETITIVENESS INDEX
The PCI is designed to assess the ease of doing business, economic governance, and the administrative reform efforts by local governments in Vietnam’s 63 provinces and cities. This year, the PCI marks its fifteenth anniversary with the 2019 PCI report. Based on a rigorous survey of the perceptions of domestic and foreign firms operating across Vietnam, the PCI report endeavors to augment the collective voice of private entrepreneurs in their interaction with policy-makers in provinces where they invest and in the country as a whole.
We summarize the main tools and findings in this Executive Summary, which is divided into two main parts. The first section describes the seven surveys and datasets which we use to formulate the index and analyze governance reforms in Vietnam. Over 15 years, the PCI has added more precise research instruments. When reading the report, readers often conflate these very different resources. Below, we step back and delineate our data sources and the purposes for which we use them. In the second section, we present our primary research products. Each year, the PCI research explores topics beyond our signature index. We also survey foreign investors, gauge business confidence, rank provincial infrastructure improvements, and inspect one particular and urgent research topic. Our core findings and conclusions from each research component are subsequently summarized for the reader’s ease of reference.
This year, readers will be particularly excited about our survey module that measures the impact of automation and digital technologies on firms in Vietnam, which we devised for this year’s Chapter 3 - the section of the report we devote annually to rigorous analysis of critical policy issues. We find that rising labor costs and tightening labor markets, combined with pressure from international competitors and demands from international buyers, have led many companies to contemplate enhancing productivity by investing in labor-saving automation. And we explore the implications of potential automation for the Vietnamese labor force.
I. PCI SURVEY AND DATASETS USED IN RESEARCH
Analysis in the report is based on seven datasets that the PCI collects and adds to each year as part of its research enterprise:
࠸ Annual survey of over 8,500 existing domestic private businesses. In 2019, 8,773 domestic private firms in all 63 provinces answered the full survey. Firms are selected using random sampling to mirror provincial populations. Stratification is used to make sure that firm age, size, legal type, and sector are accurately represented. The adjusted response rate for the
THE 15TH PROVINCIAL COMPETITIVENESS INDEX (PCI) REPORT
18 PCI 2019 THE VIET NAM PROVINCIAL COMPETITIVENESS INDEX

1919 PCI 2019THE VIET NAM PROVINCIAL COMPETITIVENESS INDEX
survey is 29 percent. Moreover, the Chief Executive Officer (CEO) or General Director filled out 70 percent of all surveys. Throughout the report, we refer to these data as the “PCI survey.”
࠸ Annual survey of over 2,000 newly established enterprises. This year, we identified 11,000 businesses in all 63 provinces that started operations in 2018 and 2019. Among these new entrants, enumerators were able to verify the locations and contact information of 6,099 firms and from this group 2,073 responded, leading to an overall response rate of 34 percent. The research teams use these answers exclusively to calculate the first PCI subindex on experiences with business registration and licensing. In the report, we call this the “New Business Survey.”
࠸ Annual survey of over 1,500 foreign-invested enterprises (FIEs). This section reports on data collected from the 21 provinces and cities with the highest concentration of foreign direct investment (FDI). These firms are also selected using stratified random sampling. The adjusted PCI-FDI response rate is 26 percent, which is extremely high for research published in high quality refereed management journals.1
The survey includes 1,583 FIEs from 52 different countries with the highest concentration from Asia, especially South Korea (471), Japan (409), Taiwan (172). We refer to this throughout as the “PCI-FDI survey.”
࠸ Provincial-level panel data on 63 provinces between 2006 and 2019.2 This dataset records average levels on 360 measures of economic governance and business performance since the beginning of the PCI for each province. The research teams use these data to track progress over time on governance reforms and the economic outcomes of those endeavors. We refer to this throughout as “PCI panel data.”
࠸ Core PCI dataset. These are data collected for each respondent of the PCI domestic survey between 2006 and 2019. These data contain 125,162 individual responses to questions asked each year in the annual PCI survey. Over 1,078 unique variables are covered.
࠸ Core PCI-FDI dataset. This covers data for each respondent of the PCI-FDI survey between 2010 and 2019. These data contain 15,849 individual FIEs’ answers to over 160 questions asked annually in the annual PCI survey.
࠸ Panel data on domestic, private firms. Small sample of firms that have answered the PCI every year since 2006.
1 Anseel, F., Lievens, F., Schollaert, E., & Choragwicka, B. (2010). Response rates in organizational science, 1995–2008: A meta-analytic review and guidelines for survey researchers. Journal of Business and Psychology, 25(3), 335-349; Mellahi, K., & Harris, L. C. (2016). Response rates in business and management research: An overview of current practice and suggestions for future direction. British Journal of Management, 27(2), 426-437.
2 In statistics and econometrics, panel data or longitudinal data are multi-dimensional data involving measurements over time. Panel data contain observations of multiple phenomena obtained over multiple time periods for the same provinces or respondents.
1919 PCI 2019THE VIET NAM PROVINCIAL COMPETITIVENESS INDEX

20 PCI 2019 THE VIET NAM PROVINCIAL COMPETITIVENESS INDEX
II. RESEARCH OUTPUTS
Each year, the PCI research report delivers seven intellectual products to assist Vietnamese businesses, policy-makers, local government officials, development practitioners, and academic researchers. Below, we describe each of the outputs and the key findings for 2019 from each.
i. The Signature Provincial Competitiveness Index (PCI). Since 2005, this index has ranked Vietnam’s 63 provinces based on economic governance areas that affect private sector development (see Figure 1.2 in Chapter 1).
○ What does the index measure? The overall PCI index score comprises ten subindices. A province that is considered as performing well on the PCI is one that has: 1) low entry costs for business start-ups; 2) easy access to land and security of business premises; 3) a transparent business environment and equitable business information; 4) minimal informal charges; 5) limited time requirements for bureaucratic procedures and inspections; 6) minimal crowding out of private activity from policy biases toward state, foreign, or connected firms; 7) proactive and creative provincial leadership in solving problems for enterprises; 8) developed and high-quality business support services; 9) sound labor training policies; and 10) fair and effective legal procedures for dispute resolution and maintaining law and order.
○ How is the index created? The index is produced in a three-step sequence, referred to as the “three Cs”: 1) collect business survey data and published data sources, 2) calculate ten subindices and standardize them on a 10-point scale, and 3) calibrate the composite PCI as the weighted mean of ten subindices with a maximum score of 100 points (see Section 1.5 in the 2017 PCI Report for a full discussion of the methodology).3
○ How does the index address changes in economic reform policies? To ensure the PCI reflects recent changes in the business environment of Vietnam as perceived by businesses, and provides a useful tool for policy makers, every four years, the PCI re-evaluates its methodology and recalibrates the index. The current PCI has been adjusted in the most recent re-calibration in 2017, preceded by the ones in 2013 and 2009. PCI 2019 consists of ten subindices and a set of 128 indicators that were used in 2017 and 2018, and will be maintained in next year’s report.
○ Which are the top provinces according to this year’s PCI? Quang Ninh Province maintains the top ranking with 73.40 points for the third year in succession. Second in this year’s ranking is Dong Thap, which once again broke its own record on the aggregate PCI
3 Malesky, Edmund., Phan Tuan Ngoc, and Pham Ngoc Thach. (2018). The Vietnam Provincial Competitiveness Index: Measuring Economic Governance for Private Sector Development, 2017 Final Report, Vietnam Chamber of Commerce and Industry and United States Agency for International Development: Hanoi, Vietnam. <http://pcivietnam.org/an-pham/bao-cao-pci-2017>
20 PCI 2019 THE VIET NAM PROVINCIAL COMPETITIVENESS INDEX

2121 PCI 2019THE VIET NAM PROVINCIAL COMPETITIVENESS INDEX
score with 72.10 points and continues its twelve-year run in the top five. Coming in third and fourth place, respectively, are Vinh Long (71.30 points) and Bac Ninh (70.79 points). Making up the remaining part of the Top 10 are Da Nang (70.15 points), Quang Nam (69.42 points), Ben Tre (69.34 points), Long An (68.82 points) and Ha Noi (68.80 points), and Hai Phong (68.73 points).
ii. The Core PCI. To measure economic governance over time, the PCI has developed a second tool, which we call the “Core PCI,”4 constructed from a smaller set of 45 indicators that have remained fixed for 14 years (2006-2019). The Core PCI follows the 2006 PCI methodology in its entirety and is never recalibrated, so each indicator and subindex remain comparable over the entire PCI - unlike the signature PCI index, which is recalibrated every four years.
Improvement over time. According to the Core PCI, there has been continuous improvement in governance over time. In 2019, the Core PCI reached a score of 63.25, breaking its own record in 2018 to become the highest score achieved since we began the exercise in 2005.
○ Growing convergence among provinces after 15 years of PCI. The gap between the best and worst performing provinces in both the annual PCI and core PCI rankings is narrowing. There is a broad trend of positive improvement. While the improving scores of low-ranked provinces is reason for celebration, there are signs that the top performers are succeeding only easy-to-reform areas. They have yet to identify policy and institutional solutions to tougher governance problems. Importantly, some provinces that are both important investment destinations and top PCI performers have achieved relatively low rates of change on their PCI scores over time. On the one hand, this indicates that businesses still value governance reforms that simply represent the reduction in state interference, such as reduced entry barriers and administrative burdens. On the other hand, the inability of top provinces to develop the policies and institutions to fully tackle more complex governance problems, such as limited access to information and petty bribery, places limit on their ability to reach their full growth potential.
○ Key governance trends to watch. Beyond these broader changes (described in Section 1.3, Chapter 1), we also highlight seven critical trends that reflect progress on policies begun by the new Vietnamese leadership in 2016.
� Provincial authorities demonstrate more proactivity and creativity in policy implementation: In 2019, 54.1 percent of respondents rated provincial authorities’ attitude towards the private sector as “positive.” This aspect of governance continued to grow from its low of 35.1 percent in 2015.
4 For the List of Indicators of the Core PCI, see Annex 2, e-version of the 2017 PCI report. <http://pcivietnam.org/an-pham/bao-cao-pci-2017>
2121 PCI 2019THE VIET NAM PROVINCIAL COMPETITIVENESS INDEX

22 PCI 2019 THE VIET NAM PROVINCIAL COMPETITIVENESS INDEX
○ 80 percent of firms agreed with the statement “my provincial People’s Committee is very flexible, within the scope of laws, to create a favorable business environment,” the highest level over the 15 years of the PCI survey.
○ 65.8 percent of firms recognized provincial People’s Committees’ proactivity and creativity in dealing with newly arising problems, the highest such approval rating since 2006.
○ There are considerable improvements in indicators measuring how authorities handled business concerns and problems. About 74 percent of firms acknowledged their problems were addressed through business dialogues and meetings with provincial authorities (67 percent and 68.5 percent in 2017 and 2018 respectively).
○ The share of firms reporting that their concerns and complaints were responded to remain at 94.9 percent, as in 2018, and is up slightly over 2017 (94.1 percent). 82.5 percent of respondents reported being satisfied with the way provincial agencies solved their concerns, significantly higher than 77.4 percent and 76.7 percent in 2018 and 2017 respectively.
� Less favoritism toward state and foreign investors: Overall, favoritism toward particular businesses appears to have declined this year.
○ The percentage of private firms agreeing with the statement “state-owned enterprises find it easier to win state contracts” dropped to 21 percent from 27 percent in 2015. 2019 also witnessed only 19.1 percent of firms stating “administrative procedures are faster and more easily processed” for SOEs (compared with 23 percent in 2015).
○ There are also signs of declining favoritism towards large and connected firms. About 63.4 percent of respondents agreed that “government procurement contracts, and other business resources mostly fall into the hands of enterprises that have strong connections with the provincial authorities” (versus 76.9 percent in 2015). 51.1 percent of firms affirmed their perception that favoritism towards big companies posed obstacles to their business operations (down from 56.5 percent in 2015).
○ In spite of this more balanced business environment, favoritism towards large and connected firms remains high, requiring yet more efforts by provincial authorities to create a fair playing field for the private sector.
� Transparency shows signs of growth: Access to planning documents has grown, but adequate access to other important information has room for improvement.

2323 PCI 2019THE VIET NAM PROVINCIAL COMPETITIVENESS INDEX
○ On a scale of 1-5 (ranging from Impossible (1) to Very Easy (5)), access to planning documents was rated 2.50 points in 2019 (versus 2.38 points in 2018)
○ The share of firms affirming negotiations with tax officials were essential in doing business also declined drastically from 53.2 percent in 2018 to 47.1 percent in 2019.
○ There are also enhancements in provincial website quality, with provincial authorities’ websites both being scored higher and having an increase in the number of firms using websites as part of their business activities. These indicators have shown steady improvements since 2015, indicating provincial efforts are beginning to pay off.
○ Despite this improved openness, transparency in public services has room for improvement. Many indicators, such as “relations” being needed to access provincial planning documents, negotiations on tax rates, and predictability of provincial implementation of centrally issued policies, still remain worryingly high.
○ There are even disconcerting reversals in several important dimensions of transparency. Only 65 percent of firms stated they received information requested from provincial authorities, a considerable fall from 71.4 percent in 2017 and 68.8 percent in 2018.
○ The share of firms reporting accessibility to information on procurement contracts in their provinces via open public channels was only 42.9 percent, a significant decline from 55 percent in 2018.
� Law and order improved: Quality of court proceedings regarding private business issues appears to have improved, while law and order have been enhanced.
○ 87.8 percent of firms expressed confidence in 2019 that the provincial courts will protect their contracts and property rights in case of disputes, compared to 81.2 percent in 2015.
○ Similarly, 34.5 percent of respondents affirmed that “the legal system provided mechanism for firms to appeal against officials’ corrupt behaviors,” a sharp increase over the 19.1 percent who agreed in 2015.
○ 90.7 percent of respondents felt provincial courts judged economic cases by the law, compared to 87.9 percent in 2015.
○ The share of firms concurring with the statement “provincial courts resolve economic cases quickly” increased to 72.4 percent over 63.4 percent in 2015.

24 PCI 2019 THE VIET NAM PROVINCIAL COMPETITIVENESS INDEX
○ The number of firms agreeing court judgements were fair continued high at 86.7 percent (compared to 82 percent in 2015).
○ Nearly 56 percent of firms underwent disputes and expressed willingness to bring disputes to court in 2019, marking a resurgence for the second consecutive year after continuous drops over the period 2015-2017.
○ The share of firms rating local security and order as good or very good has steadily risen from 56.5 percent in 2017 to 57.7 percent in 2018 and 60.5 percent in 2019.
○ The share of firms experiencing break-ins or theft slid from 13.6 percent in 2017 to 12 percent in 2018 and 11.4 in 2019.
○ It is additionally noteworthy that the percentage of firms having to pay “protection” money to gangsters dropped from 2.9 percent in 2017 to 1.7 percent in 2018 and 1.6 percent in 2019.
� Informal charges decline at a slow rate. Positive perceptions of the private sector about the fight against corruption and informal charges at the provincial level continue to increase.
○ Only 21.6 percent of PCI respondents were concerned that “paying bribes is common to influence court decisions in legal proceedings,” compared to 31.6 percent in 2017 and 28.8 percent in 2018.
○ Only 41.2 percent claimed in 2019 that “paying a commission is necessary to win procurement contracts,” a continuation of the downward trend from 48.4 percent in 2018 and 54.9 percent in 2017.
○ 54.1 percent of business operations affirmed the existence of corruption when having procedures settled, declining from 58.2 percent in 2018.
○ In 2019, 53.6 percent of firms claimed to have paid informal charges, the lowest share over the last six years.
○ Some areas need yet stronger efforts. The share of firms that claimed they had to pay informal charges to accelerate land procedures climbed back to 36 percent in 2019 after a slight drop from 32 percent in 2017 down to 30.8 percent in 2018. Regarding payment of informal charges to inspectors and examiners, after a sharp decline from 51.9 percent in 2017 to 39.3 percent in 2018, the number was identical in 2019 (39.3 percent). Unfortunately, 7.5 percent of firms still affirmed that they spent more than 10 percent of their income on paying informal charges, a marginal rise from 7.1 percent in 2018.
2525 PCI 2019THE VIET NAM PROVINCIAL COMPETITIVENESS INDEX
� Reforms of administrative procedures progress, but some areas still burdensome: Positive firm perceptions on the handling of administrative procedures are recorded, overall.
○ 81.3 percent of domestic firms approved of the way provincial officials handle work, a significant increase from 67.4 percent in 2015.
○ 73.6 percent of firms considered public officials as friendly in handling procedures, compared to only 59 percent in 2015.
○ Remarkably, 72.6 percent of respondents stated that “time spent on complying with administrative procedures was reduced” in 2019, continuing the positive trend from 67 percent in 2017, and 69.8 percent in 2018.
○ Only 29.5 percent of firms spent more than 10 percent of their time understanding and implementing regulations (down from 35.5 percent in 2015).
○ The following areas were rated considerably burdensome: land (35 percent); taxes and fees (25 percent); social insurance (23 percent); and construction and transportation (14 percent).
� Administrative obstacles on construction projects: Investment projects involving compliance with cross-sectoral procedures remain troublesome.
○ 59 percent of respondents claimed procedures on land and site clearance were the most troublesome.
○ Procedures related to construction and urban planning took second place (53.1 percent of firms) and decisions on investment policy came in third (43.3 percent of firms responded that these are the most troublesome procedures).
○ Some procedures were rated relatively less troublesome; setting up water supply/drainage and establishing power supply were deemed difficult by 25.2 percent and 28.9 percent of firms, respectively.
iii. The PCI Infrastructure Index ranks the quality of infrastructure and connectivity in each province. The infrastructure index is not included in the calculation of the PCI scores. However, it serves as a useful reference for businesses as well as policy-makers (see Figure 1.13, Chapter 1).
○ Why is infrastructure not included in the signature PCI? The PCI research team has determined it is unfair to include infrastructure in the overall PCI ranking for three reasons: i) initial endowments were dramatically different across provinces, making it very difficult for some rural provinces to catch up; ii) provinces are not solely responsible for infrastructure within their borders, as many investments are funded
26 PCI 2019 THE VIET NAM PROVINCIAL COMPETITIVENESS INDEX
through central government initiatives; and iii) the team strongly believes improvement of infrastructure is best achieved through regional cooperation and does not want to encourage duplicative and damaging competition in port or airport construction.
○ What does the infrastructure index measure? This index is built upon the survey results of firms’ perceptions about infrastructure quality across provinces and cities and published data from government sources. It includes four subindices, measuring: i) industrial zone quality; ii) roads; iii) public services (telecommunications, energy); and iv) information technology.
○ Which provinces have the best infrastructure? Binh Duong, Bac Ninh, Dong Nai, Thai Nguyen, and Bac Giang made up the Top 5 in the Infrastructure Index and also are, not surprisingly, major industrial hubs in the country.
○ Has infrastructure quality changed over time? Infrastructure in Vietnam is generally improving, a trend that continued since 2014. The median score of the Infrastructure Index 2019 reached a new all-time high of 68.45 points, exceeding the 66.06 points recorded in 2018.
○ The relationship between governance and infrastructure. This year’s findings show the correlation between the quality of governance and infrastructure in 2019. There remains a close correlation across the 63 provinces. Consistent with the findings of the previous PCI surveys, PCI 2019 finds that provinces performing well in governance indicators tend to have higher quality infrastructure. Provinces that outperform the median province in terms of infrastructure, but do not perform as well in governance appear to be burdened by a structural advantage trap where they have not pursued governance vigorously because they were confident that investment would come regardless of their efforts. Finally, the provinces that perform better than the median province in terms of their governance but face the obstacle of limited infrastructure have to “conquer hardships” through dedicated reforms to overcome their limited endowments.
iv. Challenges to Business Operations in 2019. This year, the PCI repeated a module asking businesses about the greatest obstacles to business success. A large number of businesses pointed to non-governance issues as their key concerns.
○ Key challenges. The top five obstacles are finding customers (63 percent), getting credit (35 percent), recruiting employees (34 percent), finding business partners (28 percent), and market downturns (27 percent). Eighteen percent of respondents reported concerns related to unpredictability in dealing with regulatory matters.
v. PCI Business Thermometer. Each year, respondents to the PCI survey answer a question about their investment plans for the next year. We then record and plot the share of
2727 PCI 2019THE VIET NAM PROVINCIAL COMPETITIVENESS INDEX
respondents planning to “increase the size of their operations.” The measure has become an elegant indicator of optimism and confidence felt by the business community regarding its economic prospects.
○ Optimism remains high. This year, the thermometer demonstrates that business confidence in 2019 remained at a fairly high level, with 51 percent of respondents planning to expand their business operations in the following two years. This marginally surpasses 49 percent in PCI 2018 and significantly exceeds the 2012-2013 low during Vietnam’s economic downturn.
࠸ Correlated level of confidence and size of operations. The PCI 2019 results show an increasing correlation between the level of business confidence and size of operations. While approximately 69 percent of firms with investment assets exceeding 200 billion Vietnam Dong (VND) plan to expand operations, only 45 percent of firms with capital less than 1 billion VND plan to do the same. Looking at firms by the size of their operations, roughly 65 percent of businesses employing at least 300 workers plan to increase their operations, while 45 percent of firms employing fewer than 10 workers intend to expand.
○ Foreign investors remain positive. Fifty-three percent of FIEs plan to expand in the next two years. However, this represents a decline from the high of 60 percent achieved in 2017 and from 55 percent last year. The sectors which reported the highest interest in expansion in 2017 (when Vietnam achieved the highest growth rate over a decade) also tended to have the highest actual expansion (measured by employment growth) in 2019.
࠸ Manufacturers of electronic equipment, motor vehicles, food processing, and basic metals also have a super-majority of 60 percent of firms indicating optimism about expansion. By contrast, furniture, mining, and garments, growth leaders over the past five years, are more negative. Less than 40 percent of FIEs in those sectors indicate intent to expand.
○ Please note that business prospects in the 2019 PCI report were projected in the second and third quarter of 2019, before the January 2020 coronavirus outbreak. Both large and small businesses have been significantly affected by the global pandemic. In the 2020 PCI report, we will explore how the outbreak has influenced business operations and expansion plans.
vi. Analysis of PCI- FDI Survey. Chapter 2 of the report, traditionally, presents the findings from the PCI-FDI survey regarding governance improvements and challenges that influence the performance of FIEs in Vietnam. This year’s highlights include:

28 PCI 2019 THE VIET NAM PROVINCIAL COMPETITIVENESS INDEX
○ Characteristics of foreign investors. The composition and size of FDI is changing incrementally. In particular, we are seeing greater entry and business expansion by firms producing higher technology goods, requiring higher skilled labor.
࠸ Most foreign investors are from Asia, with South Korea, Japan and Taiwan topping the list.
࠸ Most FIEs are manufacturers. The most popular manufacturing activities are fabricated metals (involving 9.2 percent of operations), rubber and plastic (7.2 percent), computers and electronics (6.7 percent), textiles (4.8 percent), and garments (3.16 percent).
࠸ Less than 1 percent of firms are involved in agriculture/aquaculture or natural resource exploitation such as mining. Twenty-eight percent of FIEs engage in some form of services. The biggest service sector activities are wholesale/retail (9.4 percent) and finance and insurance (5.25 percent).
࠸ In 2019, tremendous growth was observed in the share of firms operating in energy provision. In 2016, these firms represented only 1.3 percent of the national sample, but their share has quickly grown to over 4 percent in 2019.
○ Halt to shrinking investment and employment size. For the first time in the history of the project, we observe growth in both the employment and investment sizes of individual respondents. This is a critical finding, as it highlights that FDI is not just increasing due to new projects; it signals investors’ willingness to risk new capital on expanding existing endeavors after experiencing the Vietnamese investment environment.
࠸ The largest investment growth occurred among firms that manufacture garments, paper products, and fabricated metals
࠸ The greatest average employment growth is occurring in wood products, textiles, and energy provision, with companies in these sectors growing to meet expanding international demands and rising levels of domestic energy consumption.
࠸ However, a noticeable employment decline was observed among firms in several industries, especially in wholesale/retail and information and communication services, which saw 48 percent and 37 percent average employment declines since 2016. These trends may be due to increasing automation in many manufacturing and service outlets.
࠸ Businesses producing computers and electronics rose from 2.73 percent in 2016 to 6.7 percent today (nearly 9 percent if combined with electronic equipment). Over the same period, the share of firms engaged in garment production has declined from 6 percent in 2016 to only 3.2 percent today. These trends represent
2929 PCI 2019THE VIET NAM PROVINCIAL COMPETITIVENESS INDEX
a noticeable enhancement of the more technologically sophisticated production in Vietnam that may have been boosted by shifts in global value chains caused by US tariffs on China.
○ The 2019 PCI-FDI survey offers several causes for optimism. In addition to high business confidence, FIEs also report strong improvement in entry procedures, reduction in expropriation risk after the promulgation of the 2013 Land Law, and efforts to combat corruption.
� Reduced regulatory burden. Administrative changes that began with the 2000 Enterprise Law and 2005 Unified Investment Law continue today. The 2014 Investment Law in particular significantly reduced the bureaucratic costs of investing in Vietnam.
࠸ 92 percent of FIEs obtained all the necessary paperwork to fully operate their businesses within three months. Since 2015, waiting periods for initial licenses have dropped from 60 days on average to less than 40, average registration certificate wait times have dropped from 36 days to 20, renewals have declined from 35 days to 25, and tax code acquisition has decreased from 22 days to just under 20. In sum, regulatory improvements over the past four years have saved businesses 38 days in start-up time.
࠸ 56 percent of businesses in 2019 were registered in less than one month, the highest share seen since 2011. Indeed, 11 percent of FIEs claim that they had all the documentation for legal operations within a week of their applications.
࠸ The share of firms having to spend over five percent of managers’ time on bureaucratic procedures dropped from an average of 70 percent between 2012 and 2016 to 66.2 percent in 2017 and to 41.3 percent in 2018.
࠸ The share of firms enduring harassment – defined as having five or more inspections per year – decreased from 24 percent in 2016 to 9.3 percent in 2019.
࠸ However, Fire and Safety, which was selected by 49 percent of respondents, and Tax Authority, which was selected by 37 percent of respondents, were clearly the most problematic. Adding the audit activities of the tax authority to its inspection activities indicates that 56 percent of businesses are concerned about disruptions in their business caused by these agencies. Customs (20 percent), Labor (20 percent), and Environment regulators were the next most cited groups.

30 PCI 2019 THE VIET NAM PROVINCIAL COMPETITIVENESS INDEX
○ Increasing Share of Firms Entering as Domestic Companies. As predicted in the 2016 PCI report,5 the fraction of FIEs that registered as domestic operations increased to 13 percent in 2019 following the introduction of the 2014 Investment Law (versus 4 percent before 2015). The domestic entry possibility appears to be a highly efficient pathway. Entry procedures are significantly faster on every measured indicator. In particular, 93 percent of firms are fully legal within three months and 67 percent are fully legal within one month, investment license acquisition and renewal take 38 and 20 days, respectively, and tax codes were obtained within 19 days.
○ Concerns about Post-Entry Regulatory Enforcement and Tax Audits. Two areas of particular concern arise from this year’s analysis. First, Vietnam’s regulatory system needs to become more efficient and professional. In general, the regulatory burden (particularly safety and tax audits) is not overwhelming. The median FIEs experience two inspections and 1.5 audits per year. However, a small set of firms, many of them in the country’s most dynamic industries, bear an unfair share of the compliance costs.
࠸ 37 percent of FIEs in the PCI-FDI survey were audited in 2018-2019. Of those, 87 percent received some form of penalty, which indicates extremely strong enforcement. However, only 7 percent of penalized FIEs thought the judgement was unfair relative to the underlying violations that were discovered.
○ Lower expropriation risk After the promulgation of the 2013 Land Law, FIEs reporting expropriation risk as low or very low increased from an average of 47.1 percent in 2012 to 79.5 percent in 2019. Expropriation risk reduction is most pronounced among firms that received a Land Use Rights Certificate (LURC) from their industrial zone manager. Before the Land Law, only 37 percent of firms inside industrial zones (IZs) had LURCs, but 51 percent have them in 2019.
࠸ According to the 2013 Constitution’s (Article 53) Land Law (45/2013/QH13), the Vietnamese people are the ultimate owners of land which is managed by the State. Foreign investors can obtain land use rights certificates (LURCs) either by partnering with a Vietnamese company (SOE or private) that provides the LURC as part of its joint venture (JV) contribution, or by leasing directly from state-permitted lessors, such as a national or provincial government authority.
○ Two clear trends are evident in the data. There is a sharp jump in formal LURC possession after the promulgation of the 2013 Land Law (from 26.2 percent in 2012 to a high of 38.8 percent in 2016), which corresponds with a decline in short-term rentals (from 72.2 percent in 2012 to a low of 56 percent in 2016). Since 2017, however, these trends have reversed slightly, which is disconcerting
5 See page 57. Malesky, Edmund., Phan Tuan Ngoc, and Pham Ngoc Thach, 2018. The Vietnam Provincial Competitiveness Index: Measuring Economic Governance for Private Sector Development, 2017 Final Report, Vietnam Chamber of Commerce and Industry and United States Agency for International Development: Hanoi, Vietnam. <http://pcivietnam.org/danh-muc-du-lieu/du-lieu-pci/>

3131 PCI 2019THE VIET NAM PROVINCIAL COMPETITIVENESS INDEX
as LURCs represent the most secure of property documentation. At the same time, we have seen a slight rise among FIEs strategically using joint ventures to obtain land.
࠸ There has been a sharp increase in the share of firms obtaining their LURC by leasing it second-hand from the industrial zone landlord or management authority as opposed to acquiring a primary lease from the national or provincial government authority.
○ New Analysis of Bribery in Construction Using a specialized survey experiment that shields respondents from culpability, we find that 48 percent of FIEs who applied for construction permits in the past year paid bribes to acquire them at an additional average cost of 24 million VND (USD1,043) per permit. Critically, these numbers represent a lower bound because they do not include FIEs who did not apply for new construction licenses because they were worried about the additional informal charges. The clear danger is that grand corruption of this type may inhibit expansion activities on the part of existing investors.
࠸ 45.8 percent of firms had to pay informal charges to inspectors in 2016, this dropped to 44.9 percent in 2017, 39.9 percent in 2018, and reached a low of 32.5 percent in 2019.
࠸ The share of firms having to pay a bribe during customs procedures declined from 56.4 percent in 2016 to 42.5 percent in 2019.
࠸ More than one-fifth of FIEs paid bribes during land transactions in 2016. In 2019, the number rose more than three percentage points above the 2018 level, but remained at less than half the 2016 figure.
࠸ At the end of the last administration in 2015, FIEs payed bribes equal to about 1.69 percent of their annual sales revenue. This number dropped steadily during the anti-corruption campaign, reaching a low of 1.04 percent in 2018. In 2019, the bribe cost increased slightly to 1.11 percent, but remains very low compared with past levels. Moreover, the overlapping confidence intervals indicate the cost of bribery is not significantly different than it was in 2018.
࠸ Reduced informal charges has positively changed firms’ attitude toward regulations. The share of FIEs agreeing with the statement that regulations are a pretext for bribery dropped from its 2014 high of 59.9 percent to a much-improved 33.7 percent in 2019.
vii. Special Investigation. For the PCI research team, the most enjoyable feature of every report is Chapter 3. Every year, the team chooses a relevant policy concern and leverages the team’s full arsenal of data, analytics, and visualization to address it. These results
32 PCI 2019 THE VIET NAM PROVINCIAL COMPETITIVENESS INDEX
are reported in Chapter 3. In past years, we have studied the impact of global integration on international contracting in Vietnam (PCI 2018), whether the talent and skills of Vietnam’s business managers affect the performance of their companies (PCI 2017), the environmental consequences of business development (PCI 2016), unique challenges for Vietnam’s SMEs (2015), business perceptions and understanding of the Trans-Pacific Partnership (PCI 2014), and the impact of business participation on regulatory quality and compliance (PCI 2013). This year, we analyze the behavior and interest of foreign and domestic investors in automation and digital technologies, and the potential impact that these investments will have on employment size and composition.
○ The extent of current and planned automation in Vietnam is higher than expected. Within the past three years, 67 percent of both foreign and domestic of investors have automated some operations, while 75 percent plan to automate new tasks during the next three years over the next three years. Domestic firms claim to have already automated about 10 percent of their operational tasks over the past three years and plan to automate over 25 percent of their work in the near future. Automation among foreign firms is only slightly more advanced (10.6 percent and 28 percent of current and planned tasks respectively).
○ Reductions in labor training costs and efforts to globally integrate drive automation plans. We found two motivations behind firms’ automation decisions. First, firms seek automation to reduce the costs of recruiting and training new employees, especially when qualified technical workers in a business sector are hard to find. Second, both foreign and domestic firms see automation as a way to better connect with global supply chains. For domestic firms, the highest levels of current automation are found among firms whose primary customers are FIEs based in Vietnam. However, those selling to third-party buyers have the greatest plans for automating technologies. Foreign firms that are part of multi-national corporations (MNCs) or sell to third-party buyers have been the most ambitious automators. For foreign firms, we identify an important third correlate of investment in automation - labor unrest. Firms that have observed labor strikes among competitors in similarly situated provinces and industries are significantly more likely to adopt automation than those where strikes have been less prominent.
○ Automation is affecting firms’ employment decisions in surprising ways. The impact of increased automation on current employment and future hiring plans is diverse and dual-edged. Only 12.6 percent of domestic businesses have increased employment as a result of automation, compared to 35 percent who plan to maintain employment at current levels and 27 percent of domestic businesses who intend to reduce employment. Of this latter group, over half (15 percent) plan to do the same activities but with a smaller number of people. By sharp contrast, 17.8 percent of FIEs expressed their intention to increase employment. This is positive news. Although

3333 PCI 2019THE VIET NAM PROVINCIAL COMPETITIVENESS INDEX
33 percent do still plan to reduce employment, in contrast to domestic investors, a significant share (8.5 percent) intend to increase the sophistication of their smaller labor forces. Automation is quite diverse across sectors, revealing the dual-edged nature of automated technologies. In some cases, they will lead to redundancies and decreased employment. In other cases, they will lead to enhanced training and greater opportunities for the next generation’s workers.
○ Automation impact on the average skill level of labor force is diverse. We asked firms about how automation will affect the skill-sets of their employees. For both foreign and domestic firms, there are two dominant answers, but their rank-ordering is different depending on the business’ origin. For domestic firms, the most frequent answer was that automation would have no impact on the average skill level of employees (just under 24 percent). The second most common answer for domestic firms was that they would seek more high-skilled labor (19 percent), illustrating that some firms are interested in upgrading their workforces. For foreign firms, these answers are reversed. More than 23 percent of FIEs plan to hire workers with greater skills and just over 20 percent do not expect to change. This is illustrative of the dual-edged nature of automated technologies. In some cases, they will lead to redundancies and decreased employment. In other cases, they will lead to enhanced training and greater opportunities for the next generation’s workers.
○ Policy recommendations to address automation. The Vietnamese leadership should continue its efforts to improve education and labor relations. The Law on Education (No. 43/2019/QH14) and accompanying national curriculum reforms6
were aimed at enhancing the quality of general and vocational education with the specific goal of improving the skillsets for Vietnamese workers to succeed in an advanced economy. The 2021 Labor Code (No. 45/2019/QH14) broke new ground for working conditions and employee-labor relations. Both the Education Law and Labor Code were legislative achievements. However, implementing regulations and decrees at both national and local levels have yet to be written. By augmenting the skillsets of Vietnamese employees and reducing misunderstanding between workers and employers, successful application of both laws will go a long way toward reducing some of the pain of firm-level automation decisions.
6 Vietnam News. 2018. “New General Educational Curriculum Unveiled,” December 28. https://vietnamnews.vn/society/482917/new-general-educational-curriculum-unveiled.html

34 PCI 2019 THE VIET NAM PROVINCIAL COMPETITIVENESS INDEX
Chapter 1

35
Chapter 1SURVEY OF DOMESTIC FIRMS AND THE 2019 PROVINCIAL COMPETITIVENESS INDEX
INTRODUCTION
Since the first edition of the Provincial Competitiveness Index (PCI) 15 years ago as a collaborative product between the Vietnam Chamber of Commerce and Industry (VCCI) and the United States Agency for International Development (USAID), Vietnam’s business community has thrived. In 2005, a mere 105,0007 firms were operating in Vietnam. This number rose drastically to approximately 760,0008
in 2019. The number of jobs created and the size of capital investment of firms have similarly been on an impressive rise over time.
There are a number of reasons for such rapid and remarkable growth of domestic firms. Efforts by individual firms were critically boosted by regulatory reforms, significantly aided by the extensive research which
7 General Statistics Office, Statistical Yearbook of Vietnam 2013.8 Newly established businesses highest ever in 2019, VN Express, 30/12/2019, <https://
vnexpress.net/kinh-doanh/doanh-nghiep-lap-moi-nam-2019-cao-ky-luc-4034489.html>
35

36 PCI 2019 THE VIET NAM PROVINCIAL COMPETITIVENESS INDEX
the PCI is proud to have contributed.9 Representing perceptions of domestic firms across the country, the annual PCI survey conveys independent, evidence-based, and reliable information to local governments to make informed and timely decisions to better public services and the Vietnamese business environment. PCI findings have been used by the central government of Vietnam as a governance tool in the series of Resolutions 19 since 2014 intended to promote provincial business environment, and the series of Resolution 02 on improving business environment and national competitiveness10 since 2019.
More than that, the PCI provides information to people’s elected representatives to improve oversight of administrative agencies as well as the media to exert social monitoring functions. Importantly, the PCI has established itself as an increasingly effective and trusted channel through which the business community, especially MSMEs, conveys its concerns and expectations about an enabling business climate to local governments. The increasing national sample of PCI is an indicator of this expanded impact. In 2005, only 1,957 firms responded to the pilot PCI survey in 45 provinces. The following year, in which the PCI survey started covering all the provinces, had a turnout of 6,319 firms. Since then, the number of firm respondents has increased steadily. The 2019 PCI witnessed a record-breaking total of 12,429 respondents including 10,846 domestic firms and 1,583 foreign invested enterprises (FIEs). Over the last 15 years, the PCI survey reached out to 141,011 firms in total, of which 125,162 are domestic firms and 15,849 are FIEs. This means, out of over 760,000 firms operating in Vietnam by end of 2019, nearly one out of five has responded to the PCI survey.
The Provincial Competitiveness Index (PCI): The PCI measures economic governance as well as the administrative reform efforts of provincial governments and national-level cities in Vietnam to build an enabling business environment across ten areas influencing private sector development. Accordingly, a province that is considered as performing well on the PCI is one that has: 1) low entry costs for business start-ups; 2) easy access to land and security of business premises; 3) a transparent business environment that provides information equitably to firms; 4) limited time requirements for bureaucratic procedures and inspections; 5) minimal informal charges; 6) low crowding out of private activity from policy biases toward state, foreign, or connected firms; 7) a proactive and creative provincial leadership in solving problems for enterprises, and management; 8) high-quality business support services; 9) labor quality sufficient to meet firm needs; and 10) fair and effective legal procedures for dispute resolution and maintenance of law and order.
Methodology of the PCI: The construction of the 2019 PCI complies with the annual survey process and maintains the methodology calibrated most recently in 2017. The process consists of 3 steps: 1) collecting information from responses to mailed surveys returned by businesses
9 The PCI survey was recognized as a research work that makes significant contributions to the socioeconomic development of Vietnam in 2011-2015 by the Party Committee of the Centrally Run Business Sector.
10 Beginning with Resolution 19/NQ-CP dated 18/3/2014 on key tasks and solutions to improve business environment and national competitiveness, between 2015 and 2018, the Government has issued a number of resolutions to promote business environment reforms. These resolutions include Resolution 19/NQ-CP dated 12/3/2015; Resolution 19-2016/NQ-CP dated 28/4/2016; Resolution 19-2017/NQ-CP dated 6/2/2017; and Resolution 19-2018/NQ-CP dated 15/5/2018. Since 2019, key tasks and solutions to improve business environment and national competitiveness have been enacted on the very first day of the year, with Resolution 02/NQ-CP dated 01/01/2019 and Resolution 02/NQ-CP dated 01/01/2020.

3737 PCI 2019THE VIET NAM PROVINCIAL COMPETITIVENESS INDEX
and from state statistical data (businesses are selected from provincial lists of enterprises actually paying tax; a computer program ensures stratified random sampling); 2) calculating 10 subindices and standardizing each of them on a 10-point scale; and 3) calculating the aggregate PCI score for the weighted means of the 10 subindices on a maximum scale of 100. The methodology of PCI 2019, with its system of 128 indicators and 10 areas of evaluation, is to be maintained through next year’s survey.11 Every four years, the PCI research team reviews and makes adjustments to the PCI methodology, and the next calibration will be in PCI 2021, to reflect changes in the business and regulatory environment and private sector development. The next adjustment of the PCI methodology will continue to base on consultations with academia and businesses and we look forward to receiving continued support and participation.
The first chapter of the PCI 2019 report includes five sections. Section 1.1 presents the Business Thermometer – a gauge of firm confidence in business potential extracted from the PCI 2019 data with comparative analyses from previous years. The next section looks into the results of PCI 2019 and summarizes some of the key provincial reform efforts. Section 1.3 identifies prominent trends in local governance in Vietnam as perceived by domestic firms over the course of the years. The fourth section is a re-cap of the largest obstacles faced by firms in 2019, intended to inform state agencies’ decision making on business support. The final section correlates infrastructure quality with local governance from domestic firms’ perspective.
1.1 BUSINESS THERMOMETER
The PCI 2019 assesses the level of business confidence, asking firms about their planned activities in the next two years, and presents it in a Business Thermometer. Since 2006, the research team has asked respondents to pick the choice that best reflects their business plans for the next two years, whether they: 1) will considerably increase the size of their operations; 2) increase the size of their operations; 3) will continue the business at their present size; 4) consider reducing the size of the operations; 5) intend to considerably reduce the size of their operations; or 6) plan to close the business. As the PCI survey is based on random sampling, this question’s findings reflect the level of optimism and confidence of domestic firms in Vietnam over the short-term business outlook. Time series analysis has demonstrated that the thermometer has served as a leading indicator of actual business investment in Vietnam.
Displayed in Figure 1.1, the PCI 2019 Business Thermometer indicates 51 percent of respondents are planning to expand their business operations in the following two years, revealing a continued level of optimism. This slightly surpasses 49 percent in PCI 2018 and significantly exceeds the 2012-2013 low during Vietnam’s economic downturn.
11 For more details on the PCI methodology see the PCI 2017 report at www.pcivietnam.vn

38 PCI 2019 THE VIET NAM PROVINCIAL COMPETITIVENESS INDEX
Figure 1.1 PCI Business Thermometers over time
20192018201720162015201420132012201120102009200820072006
Shar
e of
Firm
s Pl
anin
g to
Exp
and
(%)
0
10
20
30
40
50
60
70
80
90
100
75 72 71
60 62
47
34 32
46 49 4852 49 51
Source: PCI Survey, QA10 “Which statement best characterizes your firm’s investment plans over the next 2 years?” The share of firms selecting 1 “Plan to increase the size of operations” or 2 “Plan to considerably increase the size of operations”.
As in previous years, the PCI 2019 results show an increasing correlation between the level of business confidence and size of operations. While approximately 69 percent of firms with investment assets exceeding 200 billion Vietnamese Dong plan to expand operations, only 45 percent of firms with capital less than 1 billion Vietnamese Dong plan to do the same. Looking at firms by the size of their operations, roughly 65 percent of businesses employing at least 300 workers plan to increase their operations, while 45 percent of firms employing fewer than 10 workers intend to expand.
It should be noted that business prospects in the 2019 PCI report were projected in the second and third quarter of 2019, before the January 2020 coronavirus outbreak. Both large and small businesses have been significantly affected by the global pandemic. However, because we know from above that capital size and access are significantly correlated with expansion plans, we suspect that small and micro businesses are most likely to be injured by the halt in business activity. In the 2020 PCI report, we will explore how the outbreak has influenced business operations and expansion plans.
1.2 PROVINCIAL COMPETITIVENESS INDEX 2019
The PCI 2019 is scored by calculations on a 100-point scale, which results from a weighted sum of ten subindices representing firm assessments of local economic governance in areas impacting private sector development in all 63 provinces of Vietnam.12
12 For details on the most updated methodology, refer to the PCI 2017 report, http://pcivietnam.vn/

3939 PCI 2019THE VIET NAM PROVINCIAL COMPETITIVENESS INDEX
Figure 1.2 displays the PCI 2019 ranking arranged in descending order and Figure 1.3 presents economic governance of 63 provinces and cities in the form of a PCI national map.
Figure 1.2 Weighted Provincial Competitiveness Index 2019
59.9560.50
62.2162.6262.8063.2063.3863.5463.6063.6963.7063.7163.7863.7963.8463.8463.8563.9164.1064.1164.1464.1464.3364.4764.5864.8164.8964.9864.9965.0765.0965.1365.3365.3465.3765.3865.4665.5465.5665.6465.8266.2366.4466.5066.5666.6466.7566.9667.0567.1667.3867.7168.3868.7368.8068.8269.3469.4270.1570.7971.3072.10
73.40
0 5 10 15 20 25 30 35 40 45 50 55 60 65 70 75 80 85 90 95 100
Lai ChauDak Nong
Binh PhuocHa GiangBac KanTra VinhSon La
Kon TumHung YenCao BangSoc Trang
Quang BinhBac Lieu
Lang SonQuang TriHoa Binh
Hai DuongTien Giang
Ca MauDien BienPhu Yen
Hau GiangQuang Ngai
Bac GiangNinh Binh
Dak LakNinh Thuan
Yen BaiKien Giang
Ha NamNam Dinh
Tuyen QuangBinh Thuan
Gia LaiKhanh Hoa
Thai BinhHa Tinh
Phu ThoLao Cai
Thanh HoaDong Nai
Lam DongAn Giang
TT-HueBinh DinhNghe An
Vinh PhucBRVT
Tay NinhHCMC
Binh DuongThai Nguyen
Can ThoHai Phong
Ha NoiLong AnBen Tre
Quang NamDa NangBac Ninh
Vinh LongDong Thap
Quang Ninh
Excellent
High
Mid−High
Mid−Low
Low

40 PCI 2019 THE VIET NAM PROVINCIAL COMPETITIVENESS INDEX
Figure 1.3 PCI 2019 Map
LAO CAILAI CHAU
DIEN BIEN
SON LA
YEN BAI
TUYEN QUANG
LANG SONTHAI NGUYEN
BAC GIANG
HAI DUONG
HÛNGYEN
BACNINH
HAI PHONGTHAIBINH
NAM DINH
HOA BINH
NINH BINH
THANH HOA
NGHE AN
HA TINH
QUANG BINH
Hoang Sa
Truong Sa
QUANG TRI
QUANG NGAI
KON TUM
GIA LAI
DAK LAK
DAK NONG
BINH DINH
PHUYEN
KHANH HOA
NINH THUANLAM DONG
BINH THUAN
BINH PHUOC
TAY NINH
TIEN GIANG
BINHDUONG
DONGNAI
BRVT
TRA VINH
SOC TRANG
BAC LIEU
CA MAU
CAN THO
HAUGIANG
CON DAO
PHU QUOCAN GIANG
KIEN GIANG
BAC KAN
PHUTHO
VINHPHUÁC
TP.HCM
TT-HUE
HA NOI
HA NAM
HA GIANG CAO BANG
QUANG NINH
DANANG
LONG AN
BEN TREVINHLONG
DONG THAP
QUANG NAM
Excellent
High
Mid−High
Mid−Low
Low

4141 PCI 2019THE VIET NAM PROVINCIAL COMPETITIVENESS INDEX
As shown in the PCI 2019 results in Figure 1.2, Quang Ninh maintains the top position with 73.40 points, securing its lead for the third year in a row. Making improvements in 8 out of 10 governance areas measured by the PCI, the province increased its aggregate score by 3.04 points over the previous year, marking its highest score ever. In 2019, Quang Ninh continued to strengthen IT applications in administrative procedure settlement. Grade 3 and grade 4 administrative procedures13 accounted for 84.6 percent of all required interactions for firms (71 percent were grade 3 procedures and 13.6 percent were grade 4). Payment of fees at public administration centers were made easier through optional methods: internet banking, card payment at POS, QR code payment or cash payment. The province launched “Smart Quang Ninh” through a city management center that operates a database synchronized across agencies and levels. It also initiated a paperless meeting room model, digitalization of management data, and inter-agency and inter-level document sending and receipt. Nineteen provincial agencies have put in use a second official stamp according to five spot principles “on-spot receipt, appraisal, approval, stamp, results return.” This authorization is valid at the public administration center at the provincial level as well as in the judicial sector and land use right registration at public administration centers at district and city levels. In addition, Quang Ninh prioritized a business-enabling environment for which leaders were held accountable at every level and across agencies. The leadership combined this approach with regular monitoring with publicly available evaluation results of the administration14, and ongoing implementation of the Departmental and District-level Competitiveness Index.
The PCI 2019 recorded positive firm perceptions of these efforts in Quang Ninh. Seventy-six percent of firms affirmed a faster-than-required time in administrative procedure settlements; 87 percent said public officials handled work effectively, and 82 percent judged public officials’ attitude as friendly when dealing with businesses. Remarkably, 89 percent of local firms in the province rated the provincial leadership as being “creative in applying law to create an enabling environment for the private sector” (compared with 84 percent in 2018) and 82 percent considered the administration to be “proactive and creative in dealing with new issues” (the rate was 72 percent in the previous year). In 2019, 82 percent of firms reported timely government settlements of problematic issues and 93 percent said they were satisfied with the way local authorities dealt with issues.
13 Clause 4 Article 3 of Government Decree 43/2011/ND-CP dated 13/06/2011 prescribing the provision of information and online public services via website or electric portal of state agencies: Online public services are public services and other services provided by state agencies for organizations and individuals via the internet-based environment. Grade 1 public services mean services ensuring provision of full information on administrative procedures and related regulations. Grade 2 online public services are grade 1 online public services and allow users to download document forms to complete required dossiers. Completed dossiers are to be sent directly or by post to public service providers. Grade 3 online public services are grade 2 online public services and allow users to fill in and send online document forms to service providers. Transactions during the process of handling such dossiers and service provision are conducted online. Payment of fees if any and receipt of results are conducted in person at service provider’s premises. Grade 4 online public services are grade 3 online public services and allow users to pay fees (if any) online. Receipt of results can be done online, or in person or by post.
14 Preliminary review of improvement of business and investment environment and improvement of provincial competitiveness in 2019, 21/8/2019, <https://www.quangninh.gov.vn/Trang/ChiTietTinTuc.aspx?nid=85887>; Provinces, agencies to change mindset, action and uphold common goals, 12/11/2019, <http://www.baoquangninh.com.vn/kinh-te/201911/chu-tich-ubnd-tinh-nguyen-van-thang-cac-dia-phuong-so-nganh-phai-thay-doi-tu-duy-hanh-dong-nghi-ve-cai-chung-2460702/?fbclid=IwAR1fPWQhfiGFbouoH-mTxt0kNRy0-6RjBWrIjyPntXnxa1WOEWQPivEfdeA >

42 PCI 2019 THE VIET NAM PROVINCIAL COMPETITIVENESS INDEX
The two runners-up of PCI 2019 are Dong Thap (72.10 points) and Vinh Long (71.30 points). Dong Thap maintains its second place in the PCI ranking with a score increased by 1.91 points over last year. Reflecting its efforts to build a trademark of a business-friendly government, the best known of which is the “Café Doanh nhan” (Coffee with Entrepreneurs) model, Dong Thap is rated the national top performer in the Policy Bias subindex for the second year in a row. Local domestic firms in particular acknowledged lower bias by the provincial government. Vinh Long returned to the Top 3 by taking strong steps in the provincial administrative reform agenda (up 1.01 points) and facilitating market entry (up 0.99 point) categories.
In the Top 10, PCI 2019 witnesses the comeback of Bac Ninh (70.79 points, fourth place), and Hai Phong (68.73 points, tenth place), while Da Nang (70.15 points), Quang Nam (69.42 points), Ben Tre (69.34 points), Long An (68.82 points) and Ha Noi (68.80 points) make up the remaining Top 10 performers. Bac Ninh has gradually built business trust partly thanks to the initiative “Bac si Doanh nghiep” (Doctor for Enterprises) intended to address problems in doing business. When businesses in Bac Ninh face obstacles to their operations, they can convey their problems to the provincial Socioeconomic Development Institute through various channels, including in-person meetings, telephone calls, and emails. This initiative actually serves as a task force on supporting firms, where firms are heard in a friendly and open way in order to build trust. This initiative has helped address many problems facing firms in Bac Ninh.15 In 2019, in an effort to promote change at local level, Bac Ninh organized training courses to build capacity for state officials working at one-stop shops in the provincial departments and districts to improve public service quality through analysis of PCI findings and Bac Ninh’s DCI (a set of tools that has been put in place since 2017 to measure and rank the provincial departments). These efforts have resulted in changes that are verified by the 2019 PCI result that 68 percent of local domestic firms in Bac Ninh rated the attitude of the provincial government towards the private sector as positive, the national highest share in this indicator and a dramatic increase from the 45 percent responding this way in 2018. Hai Phong City won high praise from firms for the highest rate of business approval in the area of Labor Policy with 8.24 points, maintaining its positive trend since 2017.
On the other end of the PCI ranking are Lai Chau, Dak Nong, Binh Phuoc, Ha Giang and Bac Kan. The PCI 2019 continues to witness rapid improvements in the bottom-ranked provinces’ scores compared with 2018. If these provinces steadfastly increase their scores as seen in the last two years, major changes in next year’s ranking are forthcoming.
The results of the ten governance areas across the provinces are displayed in a star chart in Figure 1.4. Each point on the graph represents one of the ten subindices. This chart clearly visualizes each province’s strengths and weaknesses for improvement.
15 “Public servants” in the @ era, Bac Ninh Newspaper, 13/9/2018. Retrieved at <http://baobacninh.com.vn/news/-/details/20182/-cong-boccua-d-3>

4343 PCI 2019THE VIET NAM PROVINCIAL COMPETITIVENESS INDEX
Figure 1.4 Star Diagram of the PCI 2019 Subindices
Entry Costs
Land Access & Tenure
Transparency
Time Costs
Informal Charges
Policy Bias
Proactivity
Business Support Services
Labor Policy
Law & Order
Worst Lai Chau Dak Nong Binh Phuoc Ha Giang Bac Kan Tra Vinh Son La Kon Tum
Hung Yen Cao Bang Soc Trang Quang Binh Bac Lieu Lang Son Quang Tri Hoa Binh Hai Duong
Tien Giang Ca Mau Dien Bien Phu Yen Hau Giang Quang Ngai Bac Giang Ninh Binh Dak Lak
Ninh Thuan Yen Bai Kien Giang Ha Nam Nam Dinh Tuyen Quang Binh Thuan Gia Lai Khanh Hoa
Thai Binh Ha Tinh Phu Tho Lao Cai Thanh Hoa Dong Nai Lam Dong An Giang TT-Hue
Binh Dinh Nghe An Vinh Phuc BRVT Tay Ninh HCMC Binh Duong Thai Nguyen Can Tho
Hai Phong Ha Noi Long An Ben Tre Quang Nam Da Nang Bac Ninh Vinh Long Dong Thap
Quang Ninh Perfect
The table below lists top and bottom performers of the ten subindices in PCI 2019. Vinh Phuc leads in the Entry Cost subindex. Vinh Long was rated best for facilitating Land Access and efforts to cut down Informal Charges. An Giang secured the top score in Transparency and Ben Tre took first place in Time Costs. Dong Thap sealed its name in two areas (Bias and Proactivity). Ho Chi Minh City continues its tradition of topping Business Support Services. Hai Phong and Bac Ninh performed best in Labor Policy and Law and Order, respectively. The provinces scoring lowest of the PCI rankings in these subindices are Ba ria-Vung tau (BRVT), Bac Kan, Cao Bang, Dien Bien, Ha Nam, Hung Yen, Phu Yen, Quang Tri, and Tra Vinh.

44 PCI 2019 THE VIET NAM PROVINCIAL COMPETITIVENESS INDEX
Table 1.1 Top and Bottom Performers in the PCI 2019 Subindices
Sub indexHighest Lowest
Province Score Province Score
Entry Costs Vinh Phuc 8.65 BRVT 5.86
Land Access & Tenure Vinh Long 7.89 Cao Bang 5.18
Transparency An Giang 7.44 Hung Yen 5.98
Time Costs Ben Tre 8.80 Bac Kan 5.15
Informal Charges Vinh Long 8.29 Dien Bien 4.70
Policy Bias Dong Thap 8.01 Ha Nam 4.55
Proactivity Dong Thap 8.37 Cao Bang 5.26
Business Support Services HCMC 7.39 Quang Tri 4.85
Labor Policy Hai Phong 8.24 Tra Vinh 5.45
Law & Order Bac Ninh 7.91 Phu Yen 5.27
1.3 KEY FEATURES IN PROVINCIAL ECONOMIC GOVERNANCE OVER TIME
To illustrate changes in economic governance over time, the PCI 2019 report uses box plots (Figure 1.5) for the PCI and the Core Index. The PCI is the annual aggregate score, which is recalibrated and updated every four years to reflect changes in the legal and regulatory environment on the business climate in Vietnam. The Core Index is aggregated from a limited set of 45 indicators that have been employed since 2006, enabling analysis and fair comparison of trends over time.16 In Figure 1.5, green boxes indicate the aggregate PCI and orange boxes present core PCI scores. The horizontal lines in the middle of each box present the median scores (equal to the score of the provinces ranked thirty-second) of a specific year. The lower and upper edges of each box provide the scores at the 25th percentile (the 16th ranked province) and the 75th percentile (the 48th ranked province), respectively. The ends of the range bar provide the lowest and highest values that are not outliers by standard statistical definitions. Dots outside the range bars are the outliers – provinces that scored extraordinarily low or high in a given year.
Economic Governance Improving Trend Maintained
As demonstrated in Figure 1.5, economic governance in Vietnam continues to show improvement over the previous years. This is the third consecutive year in which the median PCI score surpassed 60 points (65.13 points for the overall PCI score and 63.25 points for Core Index),
16 For details on the PCI methodology, see the PCI 2017 report, pages 54-65, www.pcivietnam.vn.

4545 PCI 2019THE VIET NAM PROVINCIAL COMPETITIVENESS INDEX
reinforcing the trend of improving economic governance since 2016. This partially reflects the Vietnamese government’s unwavering governance reform efforts, enshrined by Resolution 02 that focused on improving the business environment and national competitiveness, and their predecessor Resolution 19 in 2014, and the engagement of local governments.
The bottom-ranked provinces have nevertheless all made significant improvements in economic governance, despite their comparatively low positions at year’s end. In the first year of the PCI, the worst-performing province scored around 36 points, while its counterpart is close to 60 points in 2019. Similarly, in the Core Index, the lowest ranked province in the Core Index only scored 41.87 points back in 2006 while its counterpart in 2019 received 56.68 points. This fortifies a PCI 2014 conclusion that there is a convergence of PCI scores over time; in other words, there is a narrowing gap between the best and worst performers. The gap in PCI 2019 is 13.44 points, much narrowed from 41.5 points of the first PCI edition. The same trend is observed in the Core Index, with the difference in highest and lowest Core Index values of PCI 2019 being 14.61 points, compared with 20.61 points in 2006.
Figure 1.5 Box plots of the PCI and Core Index over Time
3540
4550
5560
6570
7580
Scor
e (1
-100
)
2006 2007 2008 2009 2010 2011 2012 2013 2014 2015 2016 2017 2018 2019
PCI Core Index
Changes in economic governance over time are illustrated in Figure 1.6. The Core Index is presented by trajectories moving closer and forward, reflecting improvements in local economic governance. Especially since 2016, the improving trend has become more stable than in the preceding years.

46 PCI 2019 THE VIET NAM PROVINCIAL COMPETITIVENESS INDEX
Figure 1.6 Trends of Change in the Core PCI Index over Time
Quang Ninh
Dong Thap
Vinh Long
3035
4045
5055
6065
7075
8085
9095
Core
PCI
Inde
x
2006 2007 2008 2009 2010 2011 2012 2013 2014 2015 2016 2017 2018 2019
Gray lines depict trajectories of all 63 provinces.The solid orange line represents the median score in each year.
Figure 1.7 illustrates the improvement in economic governance across the provinces from inception of the PCI to date. As the Core Index employs a consistent set of indicators, it can be used to track how the provinces make progress over time. The horizontal bars represent the level of change in the average annual Core Index scores of each province over the last 15 years of the PCI survey. There is a broad trend of positive improvement, evidenced by the fact that all provinces are in positive numbers. Unsurprisingly, as Figure 1.7 reveals, Bac Lieu maintained the highest rate of improvement of core PCI scores. As the province was among those at the bottom of the 2006 PCI ranking, it had the greatest room for improvement. It exemplifies how a province that began as one of the worst performers at the launch of the PCI in 2006 progressed into the Mid-Low rank in recent years. Long An and Quang Ninh are the first- and second runners-up in average annual change in core PCI scores, which is typical of provinces that were initially ranked in the Mid-High group and made it into the Top 10 in recent years. Interestingly, some provinces that are important investment destinations and top PCI performers, such as Da Nang and Hung Yen, have evinced relatively low rates of change over time, a phenomenon first pointed out in the PCI 2013 report, though this should be seen as indicative of these provinces’ continued attractiveness to businesses rather than as a warning sign.

4747 PCI 2019THE VIET NAM PROVINCIAL COMPETITIVENESS INDEX
Figure 1.7 Average Annual Change in Core PCI Scores
0 .2 .4 .6 .8 1 1.2 1.4 1.6 1.8
Lang SonBinh DinhDa Nang
Hung YenPhu Yen
Hoa BinhBinh Thuan
Quang TriDien Bien
Khanh HoaPhu Tho
Son LaHau Giang
Dong NaiNinh BinhCao Bang
Binh DuongCan ThoNghe AnAn Giang
Quang BinhHai Duong
Gia LaiBac Kan
Kien GiangKon Tum
Vinh PhucBRVT
Soc TrangHai Phong
HCMCHa Nam
Ha NoiBac GiangHa Giang
Lao CaiCa Mau
Binh PhuocLai Chau
Thanh HoaBac Ninh
Lam DongTra Vinh
Ninh ThuanTT-Hue
Tuyen QuangNam Dinh
Yen BaiQuang NamThai Nguyen
Ben TreDak Lak
Quang NgaiDak NongVinh Long
Dong ThapTien Giang
Thai BinhHa Tinh
Tay NinhQuang Ninh
Long AnBac Lieu

48 PCI 2019 THE VIET NAM PROVINCIAL COMPETITIVENESS INDEX
Figure 1.8 describes changes in the Core Index since 2006. Quite a number of areas have improved over time, including Entry Costs, Transparency, Informal Charges, Policy Bias, and Proactivity. However, some areas, such as Time Costs and Business Support Services, have changed at a less stable pace.
Figure 1.8 Changes in Scores of the PCI Subindices 2006-2019
1
2
3
4
5
6
7
8
9
10
Scor
e
2007 2011 2015 2019
Entry Costs
1
2
3
4
5
6
7
8
9
10
2007 2011 2015 2019
Land Access
1
2
3
4
5
6
7
8
9
10
2007 2011 2015 2019
Transparency
1
2
3
4
5
6
7
8
9
10
2007 2011 2015 2019
Time Costs
1
2
3
4
5
6
7
8
9
10
2007 2011 2015 2019
Informal Charges
1
2
3
4
5
6
7
8
9
10
Scor
e
2007 2011 2015 2019
Policy Bias
1
2
3
4
5
6
7
8
9
10
2007 2011 2015 2019
Proactivity
1
2
3
4
5
6
7
8
9
10
2007 2011 2015 2019
Biz Services
1
2
3
4
5
6
7
8
9
10
2007 2011 2015 2019
Labor
1
2
3
4
5
6
7
8
9
10
2007 2011 2015 2019
Legal & Order
Yellow lines represent the median provincial score, while the dashed grey lines depict the maximum and minimum scores, respectively.
Next, we analyze comparative changes from economic governance reforms as found in PCI 2019 relative to previous years. In these comparisons, we use data that was available back in the earlier years of the PCI for some indicators, and, for most of the indicators, data from 2015, the year in which the set of PCI indicators was last recalibrated, and which marked the most recent administration transition in Vietnam.

4949 PCI 2019THE VIET NAM PROVINCIAL COMPETITIVENESS INDEX
Highlights of economic governance reforms
Provincial authorities are more proactive and creative
Firms in Vietnam have reported more positive perceptions of provincial leadership proactivity. In 2019, 54.1 percent of respondents rated provincial authorities’ attitude towards the private sector as positive, which is the highest rate since 2006 (48.3 percent) and a big leap from the bottom rate of 35.1 percent in 2015. As many as 80 percent of firms agreed with the statement “my provincial People’s Committee is very flexible, within the scope of laws, to create a favorable business environment,” the highest level over the 15 years of the PCI survey. The 2019 survey also witnessed 65.8 percent of firms recognizing provincial People’s Committees’ proactivity and creativity in dealing with newly arising problems, the highest such approval rating since 2006.
There are considerable improvements in some indicators that assess handling of business concerns and problems. Specifically, in 2019, the share of firms acknowledging their problems were addressed through business dialogues and meetings with provincial authorities reached 74.1 percent (67 percent and 68.5 percent in 2017 and 2018 respectively). The share of firms having their concerns and complaints responded to remains high at 94.9 percent as in 2018 and rises slightly over 2017 (94.1 percent). Notably, 82.5 percent of respondents reported being satisfied with the way provincial agencies solved their concerns, significantly higher than 77.4 percent and 76.7 percent in 2018 and 2017 respectively.
Table 1.2 A Sample of Province-Level Indicators on Proactivity over Time
Indicator Source Measure 2015 2016 2017 2018 2019
1. Firms’ assessment of the attitude of provincial government toward private sector (% Positive or Fairly Positive)
PCI Survey Question: I1
Min 24.75 29.41 30.93 30.95 35.93
Median 35.14 44.33 45.33 46.22 54.08
Max 60.44 67.71 60.76 64 68.00
Correlation w/Previous Year 0.67* 0.54* 0.54* 0.51* 0.55*
2. The PPC is flexible within the legal framework to create favorable business environment for nonstate firms (% Strongly Agree or Agree)
PCI Survey Question: I2.2
Min 51.39 48.35 53.16 56.84 66.97
Median 73.56 70.54 73.97 76.32 80.00
Max 88.43 89.22 89.71 94.38 93.65
Correlation w/Previous Year 0.68* 0.72* 0.68* 0,60* 0.63*
3. The PPC is very proactive and innovative in solving new problems (% Strongly Agree or Agree).
PCI Survey Question: I2.3
Min 40.96 32.56 38.89 45.16 51.72
Median 58.95 56.67 57.78 60.87 65.85
Max 82.50 80.81 81.82 78.95 85.25
Correlation w/Previous Year 0.62* 0.73* 0.68* 0.49* 0.49*

50 PCI 2019 THE VIET NAM PROVINCIAL COMPETITIVENESS INDEX
Indicator Source Measure 2015 2016 2017 2018 2019
4. There are good initiatives at the provincial level but they are not well implemented by departments (% Strongly Agree or Agree).
PCI Survey Question: I2.1
Min 55.56 61.45 61.76 67.82 60.53
Median 79.07 78.57 76.81 80 75.68
Max 90.24 87.50 86.96 88.76 87.63
Correlation w/Previous Year 0.45* 0.30* 0.14 0.39* 0.24
5. Provincial leaders have good policies which are not well implemented at district level (% Strongly Agree or Agree).
PCI Survey Question: I2.4
Min 47.50 47.06 40.32 45.88 42.97
Median 61.95 59.46 59.42 61.19 56.36
Max 72.88 77.00 71.75 74.9 70.53
Correlation w/Previous Year -0.01 0.36* 0.40* 0.47* 0.23
6. Province’s reaction to lack of clarity in central policies/documents: % “delay and seek instructions” and “do nothing”.
PCI Survey Question: I1.3-I1.4
Min 18.75 19.71 16.95 17.46 13.13
Median 35.29 33.80 31.15 32 26.26
Max 48.28 50.00 42.19 42.86 43.48
Correlation w/Previous Year 0.07 0.27* 0.27* 0.49* 0.07
7. Provincial authorities handle timely firm’s difficulties raised in PPD dialogues - New variable in 2017
PCI Survey Question: I2.7
Min 49.35 54.72 60.29
Median 67.01 68.48 74.12
Max 80.00 86.3 87.06
Correlation w/Previous Year N.A 0.26* 0.43*
8. Received local authorities’ responses and/or feedback for firm’s questions/problems (% YES) - New variable in 2017
PCI Survey Question: F2-6.3
Min 84.62 78.26 81.48
Median 94.12 94.87 94.87
Max 100 100 100
Correlation w/Previous Year N.A -0.13 -0.01
9. Satisfied with local authorities’ responses or their ways of handling the issue (% YES) - New variable in 2017
PCI Survey Question: F2-6.4
Min 51.52 44.83 64.71
Median 76.67 77.42 82.50
Max 93.33 95.24 97.14
Correlation w/Previous Year N.A 0.42* 0.12
Less biased business environment
In light of factual concerns from many firms and academia over policy bias that might conduce to a skewed playing field for the private sector, the PCI research team restored the Policy Bias subindex in 2013 and has incorporated it into each subsequent survey. This subindex measures three dimensions: 1) favoritism towards state-owned enterprises (SOEs); 2) favoritism towards foreign-invested enterprises (FIEs); and 3) favoritism towards connected firms.
The PCI 2019 findings show more positive firm perceptions in this area of governance (Figure 1.9). The percentage of private firms agreeing with the statement “state-owned enterprises more easily win state contracts” dropped to 21 percent from 27 percent in 2015. 2019 also

5151 PCI 2019THE VIET NAM PROVINCIAL COMPETITIVENESS INDEX
witnessed only 19.1 percent of firms stating “administrative procedures are faster and more simply processed” for SOEs (compared with 23 percent in 2015). It is noteworthy that there is a sign of decline in favoritism towards large and connected firms in PCI 2019 with 63.4 percent of respondents concurring that “government procurement contracts, and other business resources mostly fall into the hands of enterprises that have strong connections with the provincial authorities.” The corresponding number was 76.9 percent in 2015. Most recently, 51.1 percent of firms affirmed their perception that favoritism towards big companies posed obstacles to their business operations, a decrease from 56.5 percent in 2015. Nevertheless, favoritism towards big and connected firms remains high, requiring yet more efforts by provincial authorities to create a fair playing field for the private sector.
Figure 1.9 A Sample of Indicators in the Policy Bias Subindex over Time
0
20
40
60
80
100
Shar
e of
Firm
s (%
)
2007 2011 2015 2019
Favoritism towards State Corporations
0
20
40
60
80
100
2007 2011 2015 2019
Favoritism towards FDI
0
20
40
60
80
100
Shar
e of
Firm
s (%
)
2007 2011 2015 2019
Favoritism towards Connected Firms
Yellow lines represent the median provincial score, while the dashed grey lines depict the maximum and minimum scores, respectively.

52 PCI 2019 THE VIET NAM PROVINCIAL COMPETITIVENESS INDEX
Transparency shows signs of improvement
There are signs of improvement in the area of information access, as observed in the PCI 2019 findings and depicted in Table 1.3. On a scale of 1-5 (ranging from Impossible (1) to Very Easy (5)), access to planning documents climbed from 2.38 points in 2018 to 2.50 points in 2019. Just over 60 percent (60.4 percent) of domestic firms stated “relations are needed to have access to provincial planning documents,” a sharp drop from 69.4 percent in 2018. The share of firms affirming negotiations with tax officials were essential in doing business also declined drastically from 53.2 percent in 2018 to 47.1 percent in 2019. This trend comes alongside observed enhancements in provincial website quality, with provincial authorities’ websites both being scored higher and having an increase in the number of firms using the websites. These indicators have shown steady improvements since 2015, indicating provincial efforts are beginning to pay off.
However, the PCI 2019 results denote that transparency in public services has room for improvement. Many indicators, such as “relations” being needed to access provincial planning documents, negotiations on tax rates, and predictability of provincial implementation of centrally issued policies, still show worrisome signs. There are even disturbing reversals in several important dimensions of transparency. Only 65 percent of firms stated they received information requested from provincial authorities, a considerable fall from 71.4 percent in 2017 and 68.8 percent in 2018. Similarly, the share of firms reporting access to information on procurement contracts in their provinces via open public channels was only 42.9 percent, a significant decline from 55 percent in 2018.
Table 1.3 A Sample of Province-Level Transparency Indicators Over Time
Indicator Source Measure 2015 2016 2017 2018 2019
1. Access to planning documents (1=Impossible to access; 5=Easy to access)
PCI Survey Question: F1.1-F1.13†
Min 2.14 2.13 2.23 2.12 2.24
Median 2.38 2.39 2.44 2.38 2.50
Max 2.65 2.71 2.67 2.6 2.81
Correlation w/Previous Year 0.05 0.34* 0.45* 0.49* 0.47*
2. Access to legal documents (1=Impossible to access; 5= Easy to access)
PCI Survey Question: F1.1-F1.13†
Min 2.79 2.83 2.83 2.57 2.80
Median 3.03 3.10 3.06 3 3.08
Max 3.29 3.30 3.29 3.21 3.37
Correlation w/Previous Year 0.44* 0.38* 0.53* 0.34* 0.39*
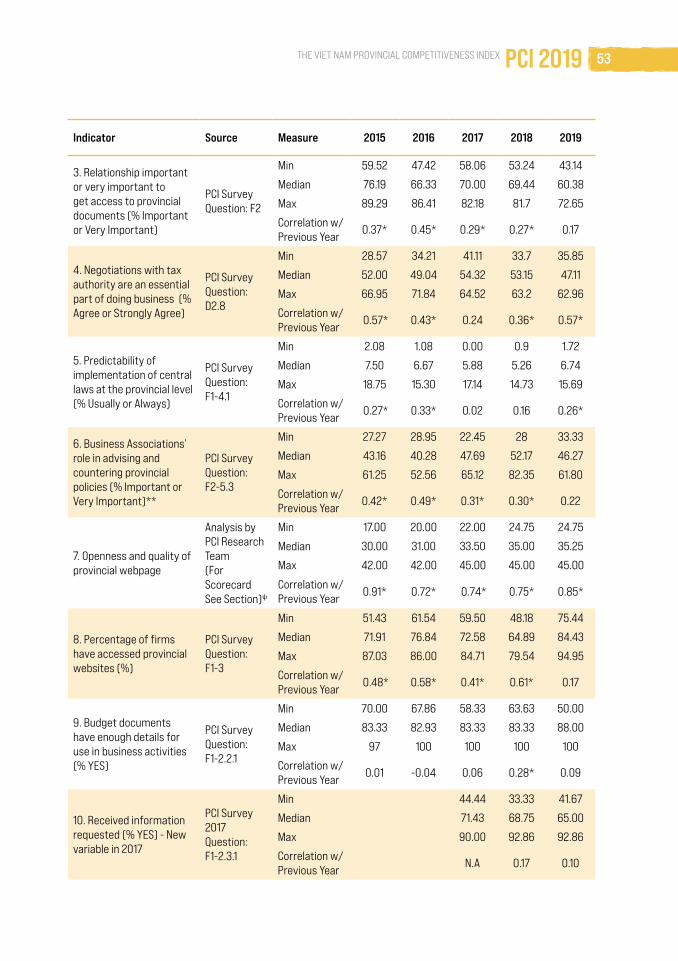
5353 PCI 2019THE VIET NAM PROVINCIAL COMPETITIVENESS INDEX
Indicator Source Measure 2015 2016 2017 2018 2019
3. Relationship important or very important to get access to provincial documents (% Important or Very Important)
PCI Survey Question: F2
Min 59.52 47.42 58.06 53.24 43.14
Median 76.19 66.33 70.00 69.44 60.38
Max 89.29 86.41 82.18 81.7 72.65
Correlation w/Previous Year 0.37* 0.45* 0.29* 0.27* 0.17
4. Negotiations with tax authority are an essential part of doing business (% Agree or Strongly Agree)
PCI Survey Question: D2.8
Min 28.57 34.21 41.11 33.7 35.85
Median 52.00 49.04 54.32 53.15 47.11
Max 66.95 71.84 64.52 63.2 62.96
Correlation w/Previous Year 0.57* 0.43* 0.24 0.36* 0.57*
5. Predictability of implementation of central laws at the provincial level (% Usually or Always)
PCI Survey Question: F1-4.1
Min 2.08 1.08 0.00 0.9 1.72
Median 7.50 6.67 5.88 5.26 6.74
Max 18.75 15.30 17.14 14.73 15.69
Correlation w/Previous Year 0.27* 0.33* 0.02 0.16 0.26*
6. Business Associations’ role in advising and countering provincial policies (% Important or Very Important)**
PCI Survey Question: F2-5.3
Min 27.27 28.95 22.45 28 33.33
Median 43.16 40.28 47.69 52.17 46.27
Max 61.25 52.56 65.12 82.35 61.80
Correlation w/Previous Year 0.42* 0.49* 0.31* 0.30* 0.22
7. Openness and quality of provincial webpage
Analysis by PCI Research Team (For Scorecard See Section)ψ
Min 17.00 20.00 22.00 24.75 24.75
Median 30.00 31.00 33.50 35.00 35.25
Max 42.00 42.00 45.00 45.00 45.00
Correlation w/Previous Year 0.91* 0.72* 0.74* 0.75* 0.85*
8. Percentage of firms have accessed provincial websites (%)
PCI Survey Question: F1-3
Min 51.43 61.54 59.50 48.18 75.44
Median 71.91 76.84 72.58 64.89 84.43
Max 87.03 86.00 84.71 79.54 94.95
Correlation w/Previous Year 0.48* 0.58* 0.41* 0.61* 0.17
9. Budget documents have enough details for use in business activities (% YES)
PCI Survey Question: F1-2.2.1
Min 70.00 67.86 58.33 63.63 50.00
Median 83.33 82.93 83.33 83.33 88.00
Max 97 100 100 100 100
Correlation w/Previous Year 0.01 -0.04 0.06 0.28* 0.09
10. Received information requested (% YES) - New variable in 2017
PCI Survey 2017 Question: F1-2.3.1
Min 44.44 33.33 41.67
Median 71.43 68.75 65.00
Max 90.00 92.86 92.86
Correlation w/Previous Year N.A 0.17 0.10

54 PCI 2019 THE VIET NAM PROVINCIAL COMPETITIVENESS INDEX
Indicator Source Measure 2015 2016 2017 2018 2019
11. Median days to receive information requested (days) - New variable in 2017
PCI Survey 2017 Question: F1-2.3.2
Min 1.00 1 1
Median 4.00 3 3
Max 10.00 16.5 10
Correlation w/Previous Year N.A 0.02 0.18
12. Transparency in bidding (% YES) - New variable in 2017
PCI Survey 2017 Question: D4-13
Min 32.61 20.00 26.67
Median 50.00 55.00 42.86
Max 65.91 76.47 64.71
Correlation w/Previous Year N.A 0.11 0.14
Reinforced law and order
Most indicators of the Law and Order subindex share a positive trend over time, as seen in Table 1.4. A record 87.8 percent of firms expressed confidence in 2019 that the provincial courts would protect their contracts and property rights in case of disputes, compared to 81.2 percent in 2015. Similarly, 34.5 percent of respondents affirmed that “the legal system provided mechanism for firms to appeal against officials’ corrupt behaviors,” a sharp increase over the 19.1 percent who agreed in 2006.
Recent years have also seen improved quality in court proceedings. In 2019, 90.7 percent of respondents felt provincial courts judged economic cases by the law, compared to 87.9 percent in 2015. The share of firms concurring with the statement “provincial courts resolve economic cases quickly” increased to 72.4 percent over 63.4 percent in 2015. The number of firms agreeing court judgements were fair continued to be high at 86.7 percent (compared to 82 percent in 2015). Nearly 56 percent of firms underwent disputes and expressed willingness to bring dispute to court in 2019, marking a resurgence for the second consecutive year after continuous drops over the period 2015-2017. These results may come from important court reforms, including publicizing judicial precedents and court judgements since July 2017,17 leading to reduced discretionary court judgements, increased transparency, and lessened risks for firms in court proceedings.18
There are improvements in some of the new indicators focusing on security and order that were added in the 2017 adjustment of the PCI methodology. The share of firms rating local security and order as good or very good has steadily risen from 56.5 percent in 2017 to 57.7 percent in 2018 and 60.5 percent in 2019. The share of firms experiencing break-ins or theft slid from 13.6
17 Resolution 03/2017/NQ-HDTP dated 16/3/2017 by the Judges’ Council of the People’s Supreme Court on the publicizing judgements and decisions on the electronic portal of courts, effective from 1/7/2017.
18 VCCI and Australia Aid, Report on implementation of Government Decree 02 in 2019 and Decree 35 in 2016: From firms’ perspective, Hanoi, 12/2020.

5555 PCI 2019THE VIET NAM PROVINCIAL COMPETITIVENESS INDEX
percent in 2017 to 12 percent in 2018 and 11.4 in 2019. It is noteworthy that the percentage of firms having to pay “protection” money to gangsters dropped from 2.9 percent in 2017 to 1.7 percent in 2018 and 1.6 percent in 2019. This reflects how the private sector has benefitted from the strong efforts of public security authorities to counter crime in recent years.19
Table 1.4 A Sample of Province-Level Indicators in Law and Order Subindex over Time
Indicator Source Measure 2015 2016 2017 2018 2019
1. Legal system provided mechanism for firms to appeal against officials’ corrupt behavior (% Always or Usually)
PCI Survey Question: F2-7
Min 18.29 19.63 19.54 17.71 24.24
Median 31.39 31.68 30.43 32.14 34.51
Max 47.67 43.75 45.24 51.65 56.63
Correlation w/Previous Year 0.55* 0.41* 0.34* 0.45* 0.41*
2. Firm confident that legal system will uphold property rights and contracts (% Strongly Agree or Agree)
PCI Survey Question: H1-1
Min 70.36 65.38 75.76 76.15 80.91
Median 81.20 81.25 85.19 84.78 87.85
Max 88.89 90.67 92.31 93.33 96.24
Correlation w/Previous Year 0.31* 0.36* 0.22 0.21 0.51*
3. Cases filed by non-state entities at Provincial Economic Court per 100 firms.
People’s Supreme Court
Min 0.00 0.00 0.00 0.14 0.22
Median 0.63 0.68 0.46 1.41 1.82
Max 12.25 10.13 7.15 11.11 10.07
Correlation w/Previous Year 0.78* 0.74* 0.61* 0.53* 0.71*
4. Non-state claimants as a percentage of claimants at Provincial Economic Court.
People’s Supreme Court
Min 0.00 0.00 0.00 33.33 25.23
Median 85.14 81.82 82.35 83.85 86.18
Max 100.00 100.00 100.00 100.00 100.00
Correlation w/Previous Year 0.46* 0.41* 0.57* 0.25* 0.41*
5. Ratio of economic cases solved (%) (2014)
People’s Supreme Court
Min 16.67 42.94 50.45 22.22 36.36
Median 76.78 75.00 80.00 58.06 63.22
Max 100.00 100.00 100.00 100.00 100.00
Correlation w/Previous Year 0.80* 0.73* 0.57* 0.56* 0.44*
6. Provincial court judge economic cases by the law (% Agree or Strongly Agree)
PCI Survey Question: H1-2.1
Min 77.82 69.32 81.11 80.73 80.85
Median 87.90 83.33 88.00 89.11 90.70
Max 93.51 92.50 98.53 96.34 98.88
Correlation w/Previous Year 0.47* 0.22 0.32* 0.22 0.41*
19 Phan Tuyen, 2019, Gather force to fight “black credit” and “underground society,” Ho Chi Minh City Law News, 9/1/2019 <https://plo.vn/thoi-su/nam-2019-tong-luc-dau-tranh-tin-dung-den-va-xa-hoi-den-812079.html>

56 PCI 2019 THE VIET NAM PROVINCIAL COMPETITIVENESS INDEX
Indicator Source Measure 2015 2016 2017 2018 2019
7. Provincial court resolve economic cases quickly (% Agree or Strongly Agree)
PCI Survey Question: H1-2.2
Min 48.00 46.04 49.49 55.71 59.72
Median 63.41 59.38 65.83 67.62 72.38
Max 74.71 71.28 80.30 79.63 82.96
Correlation w/Previous Year 0.37* 0.31* 0.51* 0.31* 0.31*
8. Court judgements are enforced quickly (% Agree or Strongly Agree)
PCI Survey Question: H1-2.3
Min 50.00 47.25 50.56 55.88 62.38
Median 65.26 62.82 67.86 69.66 76.27
Max 76.32 73.53 82.43 83.51 88.75
Correlation w/Previous Year 0.36* 0.57* 0.53* 0.34* 0.31*
9. Legal aid agencies support businesses in the use of laws when disputes arise (% Agree)
PCI Survey Question: H1-2.4
Min 55.95 44.83 58.43 59.41 67.07
Median 72.15 66.67 72.88 72.82 77.55
Max 86.30 84.44 87.50 87.95 89.74
Correlation w/Previous Year 0.31* 0.26* 0.39* 0.45* 0.33*
10. Formal and informal costs are acceptable (% Agree or Strongly Agree)
PCI Survey Question: H1-2.5
Min 63.41 53.09 59.74 68.67 71.84
Median 74.73 72.93 79.17 79.81 82.98
Max 83.56 85.37 90.28 94.20 91.58
Correlation w/Previous Year 0.40* 0.35* 0.43* 0.36* 0.30*
11. Judgement by the court is fair (% Agree or Strongly Agree)
PCI Survey Question: H1-2.6
Min 68.75 65.67 70.13 76.14 76.92
Median 81.98 78.41 83.33 83.65 86.67
Max 90.67 89.86 92.54 93.67 95.16
Correlation w/Previous Year 0.43* 0.35* 0.53* 0.20 0.33*
12. Willingness to use court in case a dispute arises (% Yes)
PCI Survey Question: H1.3
Min 23.42 26.81 20.44 34.78 44.38
Median 37.50 35.79 36.08 45.16 55.88
Max 50.00 55.67 48.15 60.00 74.68
Correlation w/Previous Year 0.22 0.39* 0.34* 0.33* 0.36*
13. Security situation in the province (% Good or Very good) - New variable in 2017
PCI Survey Question: H2-6
Min 33.98 41.05 37.50
Median 56.48 57.69 60.49
Max 77.38 77.11 84.72
Correlation w/Previous Year N.A 0.72* 0.70*
14. Was firm a victim of theft or break in last year (% Yes) – New variable in 2017
PCI Survey Question: H2-6.1
Min 4.71 5.68 5.22
Median 13.59 12.00 11.40
Max 26.73 25.00 24.14
Correlation w/Previous Year N.A 0.62* 0.44*

5757 PCI 2019THE VIET NAM PROVINCIAL COMPETITIVENESS INDEX
Indicator Source Measure 2015 2016 2017 2018 2019
15. Local police handled firm’s case effectively (% Yes) - New variable in 2017
PCI Survey Question: H2-6.4
Min 43.75 26.66 33.33
Median 70.59 64.28 60.00
Max 89.47 90.91 100.00
Correlation w/Previous Year N.A 0.27* 0.11
16. Did firm have to pay money to gangsters groups (% Yes) - New variable in 2017
PCI Survey Question: H2-7
Min 0.00 0.00 0.00
Median 2.86 1.71 1.6
Max 6.98 8.79 5.50
Correlation w/Previous Year N.A 0.07 0.30*
17. The leaders will discipline the offending staffs (% Agree) - New variable in 2017
PCI Survey Question: F2-7.1
Min 22.58 23.25 27.78
Median 35.56 35.00 40.38
Max 50.68 57.30 61.45
Correlation w/Previous Year N.A 0.44* 0.42*
Areas Needing Further Reform
Informal charges decline at a slow rate
The PCI 2019 results show continued positive perceptions of the private sector in the fight against corruption and informal charges at the provincial level, as seen in Figure 1.10. Twenty-one percent of PCI respondents were concerned that “paying bribes is common to influence court decisions in legal proceedings,” compared to 31.6 percent in 2017 and 28.8 percent in 2018. Only 41.2 percent claimed in 2019 that “paying a commission is necessary to win procurement contracts,” a continuation of the downward trend from 48.4 percent in 2018 and 54.9 percent in 2017. Additionally, 54.1 percent of business operations affirmed the existence of corruption when having procedures settled, declining from 58.2 percent in 2018. In 2019, 53.6 percent of firms claimed to have paid informal charges, the lowest share over the last six years. This is a substantial improvement from the 70 percent who made such payments in 2006, demonstrating a major step forward in provincial governments’ efforts to combat corruption.
Nevertheless, many challenges remain in the ongoing fight against corruption. The PCI 2019 result in the area of informal charges is far from the target set in Government Resolution 139/2018 that “by 2020, cut in half the share of firms claiming in the PCI survey that businesses in the same sector have to pay informal charges,”20 and it is clear that stronger solutions are needed at all levels. The share of firms that claimed they had to pay informal charges to accelerate land procedures climbed back to 36 percent in 2019 after a slight drop from 32 percent in 2017 down to
20 Government, Decree 139/NQ-CP dated 9 November 2018 promulgating Business Cost-cutting Action Plan, <http://chinhphu.vn/portal/page/portal/chinhphu/hethongvanban?class_id=2&mode=detail&document_id=195260&category_id=0>

58 PCI 2019 THE VIET NAM PROVINCIAL COMPETITIVENESS INDEX
30.8 percent in 2018. Regarding payment of informal charges to inspectors and examiners, after a sharp decline from 51.9 percent in 2017 to 39.3 percent in 2018, the number was identical in 2019 (39.3 percent). Unfortunately, 7.5 percent of firms still affirmed that they spent more than 10 percent of their income on paying informal charges, a marginal rise from 7.1 percent in 2018.
Figure 1.10 A Sample of Indicators About Informal Charges over Time
0
20
40
60
80
100
Shar
e of
Firm
s (%
)
2007 2011 2015 2019
Common to Pay Informal Charges
0
20
40
60
80
100
2007 2011 2015 2019
>10% of Income for Informal Charges
0
20
40
60
80
100
Shar
e of
Firm
s (%
)
2007 2011 2015 2019
Service was Delivered as Expected
0
20
40
60
80
100
2007 2011 2015 2019
Regulations Used to Extract Rents
Yellow lines represent the median provincial score, while the dashed grey lines depict the minimum and maximum scores, respectively.
The PCI 2019 results indicate that although significant challenges remain in the combat against corruption, recent government efforts have been enhancing private sector confidence. Stronger engagement at all government levels is expected to be in line with the Party Secretary Nguyen Phu Trong’s 2020 statement that “fighting corruption is not only a requirement in the development and redress of the Party, it is also a condition for improving the investment and business environment and accelerating growth. The corruption fight should go alongside with regulatory development and refinement to serve as a double-rail for Vietnam’s economy to speed up.” It will be especially important for provinces to take steps in the directions that he emphasized; namely, to “tackle the situation of ‘hot at the top, cold at the bottom’ [indifference

5959 PCI 2019THE VIET NAM PROVINCIAL COMPETITIVENESS INDEX
to corruption at lower levels of government despite attention at the top], and fight ‘petty corruption’ at local and grassroots levels to reduce frustrations for citizens and firms.”21
Reforms of administrative procedures progress but some areas still burdensome
The PCI 2019 survey records positive firm perceptions on the handling of administrative procedures across the country. Specifically, 81.3 percent of domestic firms approved of the way provincial officials handle work, a significant increase from 67.4 percent in 2015. Fully 73.6 percent of firms considered public officials as friendly in handling procedures compared to only 59 percent in 2015. Remarkably, 72.6 percent of respondents stated that “time spent on complying with administrative procedures was shortened” in 2019, continuing the rising trend from 67 percent in 2017, and 69.8 percent in 2018. With only 29.5 percent of firms having to spend more than 10 percent of their time understanding and implementing regulations (down from 35.5 percent in 2015), these indicate that the compliance burden has somewhat lessened for firms.
Table 1.5 reports firms’ perception on whether an individual area needs stronger and substantive reform to become less burdensome. As the Government put it straightforwardly in Resolution 02 reviewing performance of tasks and solutions to improve business environment and national competitiveness “Some reform efforts are at surface level, and are not creating real changes. Businesses and citizens still face irritations and harassments, at some places and from time to time, caused by partial regulations imposed by some authorities and some public officials,”22 this assessment has been verified by the PCI survey over the years. In 2019, the following areas were rated considerably burdensome: land (35 percent); taxes and fees (25 percent); social insurance (23 percent); and construction and transportation (14 percent). Since 2015, some areas have become less burdensome, including taxes and fees, social insurance, market management and business registration. However, some have either not improved or even worsened, including land, construction, fire safety, environmental protection, and labor.
21 The Party Secretary General, State President Nguyen Phu Trong: Join hands for a prosperous Vietnam, Vietnam News Agency, 03/01/2020 <http://baochinhphu.vn/Thoi-su/Tong-bi-thu-Chu-tich-nuoc-Nguyen-Phu-Trong-Chung-suc-dong-long-vi-mot-Viet-Nam-cuong-thinh/384105.vgp>
22 Resolution 02/NQ-CP dated 1/1/2019 on continued implementation of key tasks and solutions to improve business environment and enhance national competitiveness in 2019 and orientations toward 2021

60 PCI 2019 THE VIET NAM PROVINCIAL COMPETITIVENESS INDEX
Table 1.5 Troublesome Administrative Procedures
Area 2015 2016 2017 2018 2019
Social Insurance 25 24 25 25 23
Environment Protection 10 12 12 11 12
Land 26 27 26 30 35
Biz/Investment Registration 10 13 10 9 8
Import - Export 7 10 7 8 8
Fire Safety 9 15 13 12 13
Taxes, Fees 30 29 28 28 25
Construction 12 16 13 14 14
Labor 7 8 8 8 10
Market Management 16 17 16 14
Treasury payment 15 14 13 13 12
Transportation 12 13 16 15 14
Food safety 6 6 7
Others 2 2 2 4 3
Question D2. Annual PCI survey: From your experience in the province, please indicate the troublesome administrative procedures (Multiple choices). Percentage of firms answering the procedure is burden.
Obstacles in implementing projects involving multiple areas of administrative procedures
Administrative procedures have improved in several areas, demonstrated through recent PCI survey results (Table 1.5). However, a number of investment projects involve compliance with procedural areas falling under multiple authorities across and beyond provincial jurisdiction and boundaries. Investors in these projects claimed they faced many problems, ranging from ambiguity, inconsistencies, administrative incompetence, overlapping processes or procedural requirements that prolonged the timeline and increased costs, and unpredictability. The laws on investment, land, construction, and the environment were perceived by firms as redundant, contradictory, and lacking a clearly defined authorization process. Provincial authorities face confusion in applying procedures and laws; many face legal risks from this maze of regulations.
These project implementation obstacles involving multiple areas of administrative procedures are not new. Since 2012, research studies and reviews conducted by VCCI found that a typical project was governed, procedurally, by five laws, ten decrees, and 9 circulars of different technical fields from commencement to completion,23 in addition to a large volume of implementation guiding documents at the provincial level. Understanding and complying with this plethora of regulations in a consistent manner is difficult and costly. This does not yet
23 Investment procedures like a “maze,” Ho Chi Minh City Law News, 21/8/2013. <https://plo.vn/kinh-te/quan-ly/thu-tuc-dau-tu-nhu-ma-tran-380355.html >

6161 PCI 2019THE VIET NAM PROVINCIAL COMPETITIVENESS INDEX
include risks stemming from unpredictable changes to such legal documents, and the possibility of conflicting interpretation of the same regulations by different authorities and public officials at various levels.
In response to such business concerns, on 19 December 2013, Decision 339/QD-TTg on approving the master plan to restructure the economy associated with a shift of growth model towards improved quality, efficiency and competitiveness in 2013-2020 was promulgated. In this Decision, the Prime Minister delegated the Ministry of Planning and Investment to take lead and collaborate with the Ministry of Construction and Ministry of Natural Resources and Environment to develop a joint circular24 that set out an inter-ministerial, cross-sectoral process for handling construction and investment administrative procedures. The draft circular put forth strong solutions including prescribing a master process for handling procedures required for land-used investment projects, prescribing a specific coordination process between state agencies in handling administrative procedures, and naming a focal contact agency to settle procedures. However, a final circular has never been realized. The approach of having one law amend multiple laws on investment, land, construction, and environment has also been rejected by the National Assembly after much debate.25
Administrative obstacles on construction projects
Firm responses and feedback collected through a VCCI-initiated survey and conferences and other sources show that the obstacles caused by dealing with cross-sectoral administrative procedures are substantial. In PCI 2019, we collaborated with the Ministry of Construction to obtain further insight into this problem, asking firms that engaged in a construction project in the last two years if they had difficulty completing related administrative procedures (Question D15.7).
Figure 1.11 depicts the share of firms facing difficulties completing basic procedures for construction-related projects. Among twenty percent of 8,773 domestic firms engaged in a construction project in the last two years, the PCI findings show that 59 percent of respondents claimed procedures on land and site clearance were the most troublesome. Procedures related to construction and urban planning took second place (53.1 percent of firms) and decisions on investment policy came in third (43.3 percent of firms responded these make the most troublesome procedures). Some procedures were rated relatively less troublesome; setting up water supply/drainage and establishing power supply were deemed difficult by 25.2 percent and 28.9 percent of firms, respectively. It should be noted that these numbers only serve to define surface problems and there needs to be much greater in-depth survey work and research conducted in the future.
24 Ministry of Planning and Investment, Proposal of inter-ministerial joint circular on administrative procedures applicable for investment projects. Retrieved from <http://vibonline.com.vn/du_thao/du-thao-thong-tu-lien-tich-huong-dan-quy-trinh-giai-quyet-thu-tuc-hanh-chinh-ve-dau-tu-xay-dung-dat-dai-va-moi-truong-de-thuc-hien-du-an-dau-tu >
25 Law to tackle obstacles in investment and business doing: Not suitable to submit to National Assembly, Financial News, 18/10/2016. Retrieved from <http://thoibaotaichinhvietnam.vn/pages/thoi-su/2016-10-18/luat-ve-go-vuong-trong-dau-tu-kinh-doanh-chua-du-dieu-kien-trinh-quoc-hoi-36867.aspx>

62 PCI 2019 THE VIET NAM PROVINCIAL COMPETITIVENESS INDEX
Figure 1.11 Share of Firms Facing Difficulties Completing Construction-related Administrative Procedures
25.2
25.6
28.9
33.8
34.3
34.6
36.4
37.6
38.5
41.1
41.8
43.3
53.1
59.0
0 5 10 15 20 25 30 35 40 45 50 55 60 65
Share of Firms(%)
Setting up Water Supply/Drainage
Other
Setting up Power Supply
Certificate of Envir. Protection
Fire Safety Inspections
Envir. Protection Plan
Envir. Impact Assessment Report
Appraisal of Fire Safety
Certificate of Ownership
Constr. Inspections
Basic Design, Constr. Design
Decision on Investment Policy
Constr. & Urban Planning
Land & Site Clearance
Question D15.7, PCI 2019 Survey: Which of the following administrative procedures your firm had to undertake and did your firm encounter any difficulty when completing the procedure?

6363 PCI 2019THE VIET NAM PROVINCIAL COMPETITIVENESS INDEX
1.4 WHAT CHALLENGES ARE BUSINESS OPERATIONS FACING?
Each year, the PCI survey dedicates a module to delve into operational difficulties faced by firms. Collection of such information is intended to inform policy makers and enable them to develop appropriate solutions.
Figure 1.12 portrays the operational difficulties faced by firms in 2019. The top five obstacles are finding customers (63 percent), getting credit (35 percent), recruiting employees (34 percent), finding business partners (28 percent), and market downturns (27 percent). Eighteen percent of respondents reported concerns related to unpredictability in dealing with regulatory matters. All of these problems were made more difficult and salient by the 2020 coronavirus.
Figure 1.12 Major Challenges Faced by Firms
2.0
5.1
5.2
13.5
14.7
17.4
17.8
26.6
27.6
33.8
34.8
63.4
0 10 20 30 40 50 60 70
Share of Firms (%)
Others
Intellectual property infringeme
Poor infrastructure
Finding suitable premises
Dealing with legal matters
Finding suppliers
Abrupt changes of regulations
Market downturn
Finding business partners
Recruiting employees
Getting credit
Finding customers
Question E1. PCI 2019 survey: Do you face any of the following difficulties when running your business?

64 PCI 2019 THE VIET NAM PROVINCIAL COMPETITIVENESS INDEX
1.5 INFRASTRUCTURE INDEX 2019
In PCI 2019, we assembled the Infrastructure Index based on data collected through the PCI-DDI survey and published statistics. The Infrastructure Index is separated from the PCI assessment as infrastructure is beyond provincial authorities’ purview.
For this report, we retain the methodology developed in 2008 that is comprised of four subindices measuring the quality of four fundamental business-related infrastructure areas. These include: 1) industrial zones/clusters; 2) roads and transportation; 3) basic utilities; and 4) accessibility and application of IT.
Figure 1.13 demonstrates the 2019 Infrastructure Index results. Binh Duong topped this year’s ranking and has been the champion for many consecutive years. Since the re-establishment of Binh Duong in 1997, the province has focused on developing an integrated transportation system and an industrial zone infrastructure associated with urbanization to create socioeconomic dynamics. With 29 industrial zones, of which many are high quality, Binh Duong has attracted many big companies and multinational corporations.26 Binh Duong, Bac Ninh, Dong Nai, Thai Nguyen, and Bac Giang made up the Top 5 in the Infrastructure Index and also are major industrial hubs in the country. Soc Trang, Binh Thuan, Cao Bang, Quang Binh, and Bac Lieu were among the provinces rated as having limited infrastructure.
26 Binh Duong: A highlight in infrastructure development associated with smart urban development, 6/10/2018, <https://baodautu.vn/binh-duong-diem-sang-xay-dung-co-so-ha-tang-gan-voi-phat-trien-do-thi-thong-minh-d88990.html>

6565 PCI 2019THE VIET NAM PROVINCIAL COMPETITIVENESS INDEX
Figure 1.13 The Infrastructure Index 2019
0 10 20 30 40 50 60 70 80 90 100
Soc TrangBinh Thuan
Cao BangQuang Binh
Bac LieuGia Lai
Dak NongBac KanPhu YenNghe An
Dien BienNinh ThuanKien Giang
Tuyen QuangSon La
Ca MauNam Dinh
Lai ChauTra VinhYen Bai
Lang SonBinh DinhHa GiangKon Tum
Hai PhongHung Yen
Binh PhuocThanh Hoa
Quang NgaiHa Noi
Khanh HoaQuang Tri
Tien GiangLam Dong
Ben TreHa Tinh
Hoa BinhLao Cai
Tay NinhQuang Nam
Hau GiangAn Giang
Hai DuongCan ThoDak Lak
Vinh LongLong An
HCMCTT-Hue
Dong ThapThai BinhNinh Binh
Ha NamQuang Ninh
Phu ThoDa Nang
Vinh PhucBRVT
Bac GiangThai Nguyen
Dong NaiBac Ninh
Binh Duong
Industrial Zones
Roads
Energy/Telecom
Internet
The quality of Vietnamese infrastructure continues to improve. The median score of the Infrastructure Index 2019 reached a new all-time high of 68.45 points, exceeding the 66.06 points recorded in 2018.

66 PCI 2019 THE VIET NAM PROVINCIAL COMPETITIVENESS INDEX
Table 1.6 A Sample of Province-Level Indicators of the Infrastructure Index over Time
Indicator Source Measure 2015 2016 2017 2018 2019
Quality of Industrial Zone/Cluster (% Good and Very Good)
PCI Survey Question: E2-5
Min 15.87 10.42 13.46 10.53 22.54
Median 39.51 40.91 46.38 46.67 50.00
Max 73.03 73.48 73.91 77.22 76.40
Correlation w/Previous Year 0.85* 0.85* 0.77* 0.86* 0.74*
Quality of road (% Good and Very Good)
PCI Survey Question: E2-1
Min 20.19 23.86 23.00 24.24 29.06
Median 38.60 42.06 41.30 41.12 44.14
Max 77.27 79.81 80.43 77.13 80.00
Correlation w/Previous Year 0.79* 0.76* 0.71* 0.74* 0.72*
Number of days with blocked roads
PCI Survey Question: E3
Min 2.76 2.68 1.96 1.76 1.20
Median 6.13 5.81 4.11 3.77 3.42
Max 97.70 192.25 6.06 11.42 7.38
Correlation w/Previous Year -0.06 0.71* 0.22 0.58* 0.73*
Hours of lost power in the last month (Median number)
PCI Survey Question: E4-4
Min 0.04 1.00 3.00 3.00 3.00
Median 8.00 8.00 8.00 7.55 7.84
Max 15.91 16.00 11.87 10.75 9.60
Correlation w/Previous Year 0.60* 0.56* 0.57* 0.57*
Percentage of pre-informed power cuts
PCI Survey Question: E4-3
Min 5.00 10.00 42.87 48.18 45.52
Median 47.28 50.00 57.08 65.06 57.84
Max 70.00 80.00 80.00 90.00 80.00
Correlation w/Previous Year -0.14 0.31* 0.52* 0.89* 0.88*
Telecom quality PCI Survey Question: E2-2
Min 59.07 65.26 67.74 68.22 69.83
Median 75.00 76.84 78.17 81.08 82.57
Max 84.54 88.46 90.12 91.43 91.30
Correlation w/Previous Year 0.49* 0.40* 0.43* 0.44* 0.56*
Telecom hours lost (median)
PCI Survey Question:E5
Min 0.00 0.00 0.00 0.00 0.00
Median 0.12 0.01 1.00 0.00 0.00
Max 8.00 5.00 5.40 3.98 2.30
Correlation w/Previous Year 0.45* 0.34* 0.06 0.36*
Good quality of Internet supply (%)
PCI Survey Question: E2-6
Min 42.61 43.00 42.86 53.64 59.14
Median 53.27 57.02 61.76 64.42 70.13
Max 68.32 70.71 80.23 80.77 82.61
Correlation w/Previous Year 0.55* 0.41* 0.56* 0.26* 0.29*

6767 PCI 2019THE VIET NAM PROVINCIAL COMPETITIVENESS INDEX
Figure 1.14 demonstrates the correlation between the quality of governance and infrastructure in 2019. There remains a close correlation across the 63 provinces. Consistent with the findings of the previous PCI surveys, PCI 2019 finds that provinces performing well in governance indicators tend to have higher quality infrastructure. Specifically, provinces appearing in the upper right quadrant are better in both governance and infrastructure than the median province. In the lower left quadrant are provinces that have poorer governance and infrastructure than the median province, which means they must strive the most to address both infrastructure problems and governance challenges. Provinces in the upper left quadrant outperform the median province in terms of infrastructure but do not perform as well in governance. These provinces should be aware of the structural advantage trap. Lastly, the provinces situated in the lower right quadrant have to “conquer hardship” as they perform better than the median province in terms of their governance but face the obstacle of limited infrastructure.
Figure 1.14 Correlation between Quality of Governance and Infrastructure
Ha Noi
Hai Phong
Da Nang
HCMC
Can Tho
Thanh Hoa
Nghe An
Ha Tinh
Quang Binh
Quang Tri
TT-Hue
Quang Nam
Quang Ngai
Binh Dinh
Phu Yen
Khanh Hoa
Dong Thap
An Giang
Tien Giang
Vinh Long
Ben Tre
Kien Giang
Tra Vinh
Soc Trang
Bac Lieu
Ca Mau
Binh Phuoc
Tay Ninh
Ninh Thuan
Long An
Quang Ninh
Hau Giang
BRVT
Bac Ninh
Binh Duong
Binh Thuan
Dong Nai
Ha Nam
Hai Duong
Hung Yen
Nam Dinh
Ninh BinhThai Binh
Vinh Phuc
Bac Kan
Bac Giang
Cao Bang
Dak Lak
Dak NongDien Bien
Gia Lai
Hoa Binh
Kon Tum
Lai Chau
Lam Dong
Lang Son
Lao Cai
Phu Tho
Son La
Thai Nguyen
Tuyen Quang
Yen BaiHa Giang
60
65
70
75
80
85
2019
Infr
astr
uctu
re In
dex
55 60 65 70 75
2019 Weighted Provincial Competitiveness Index
r=.52*
68 PCI 2019 THE VIET NAM PROVINCIAL COMPETITIVENESS INDEX
CONCLUSION
The 2019 PCI survey results show a fairly bright outlook for the business environment in Vietnam. Economic governance across provinces and cities continues its positive momentum. The average PCI score reached a record high. The top performing province has raised the bar, and the gap between the rankings is narrowing. Infrastructure has considerably improved. Informal charges continue to shrink, there is less bias toward certain types of firms, security and order are more reliable, and there are positive changes to administrative procedures. However, much can be done to further improve transparency, labor quality, and business support services. Strong, substantive reforms are needed to cut down post-registration administrative procedures and improve business conditions.
In fact, private firms face significant obstacles. The private sector in Vietnam is struggling with customer, capital, and human resource constraints. Problems in implementing projects related to land, investment, and construction are rampant and regular. To promote stronger private sector development, timely and effective policies are needed to address the identified problems and foster a transparent, business-enabling environment in Vietnam.


Chapter 2

71
Chapter 2PCI FOREIGN DIRECT INVESTMENT SURVEY
Both pledged and disbursed foreign direct investment (FDI) in Vietnam achieved ten-year highs in 2019. The amount of FDI that was licensed to enter the country, including nearly 3,900 new projects, grew 7.2 percent to $38 billion USD. Of this amount, new and existing investors were granted $20.4 billion USD, which also represents a 7 percent increase. The disbursal rate - ratio of disbursed over pledged funds - of 54 percent is among the highest in Vietnam’s reform era. This indicates increased confidence in the Vietnamese business environment, as investors seek to expand existing operations beyond their initial allocations.27 Increased optimism and willingness to expand is also evident in the firm-level data collected in the 2019 PCI-FDI survey. For the first time in the history of the project, we observe growth in both the employment and investment sizes of individual respondents. This is a critical finding, as it highlights that FDI is not just increasing due to new projects; it signals investors’ willingness to risk new capital on expanding existing endeavors after experiencing the Vietnamese investment environment.
27 General Statistical Office. 2019. “Socio-Economic Situation in 2019.” Hanoi, Vietnam. <https://www.gso.gov.vn/default_en.aspx?tabid=622&ItemID=19463>

72 PCI 2019 THE VIET NAM PROVINCIAL COMPETITIVENESS INDEX
In this year’s PCI-FDI report, we attempt to understand the motivations for investors’ optimism, but also flag some potential warning signs on the horizon. While Vietnam has worked to enhance the quality of infrastructure, improve labor quality, and limit entry costs caused by fees and waiting periods for licenses and registrations, firms continue to struggle with uncertain property rights and burdens caused by arbitrary enforcement of post-entry regulations.
This year’s PCI-FDI survey included 1,583 foreign enterprises from the 21 provinces and cities with the highest concentration of foreign invested enterprises (FIEs). As with the survey of domestic firms, the PCI-FDI respondents were selected from the General Tax Department (GTD) list. Although the PCI-FDI survey is not the only survey of foreign investment in Vietnam, it is the largest and most comprehensive.
As in the domestic survey, the PCI-FDI survey uses a stratified random sampling approach with strata determined by firm age, sector, and legal form.28 Samples sizes are selected to reflect the underlying population of foreign investors in each province, and range from 9 FIEs in Binh Thuan to 291 in Hanoi.29 Investors from 52 different countries are represented in the survey with the largest shares coming from South Korea, Japan, Taiwan, and Singapore.30 To ensure accuracy and precision of answers, surveys must be completed by the Chief Executive Officer (CEO), general director, general manager, or another top manager at the company. Historically, response rates range from 25 percent to 30 percent. This year, the PCI-FDI survey had an uncorrected response rate of 14 percent.31 After adjusting for incorrect addresses and phone numbers, the survey yielded a corrected response rate of 26 percent,32 which is extremely high for research published in high quality refereed management journals.33
To celebrate the 15th anniversary of the PCI project and the 10th anniversary of the PCI-FDI survey, we begin this year’s analysis by analyzing a question that asked FIE respondents to reflect upon the improvements made in key areas of the legal, regulatory, and policy environment in Vietnam as a whole. The question asks firms to evaluate the quality of reforms in these areas, ranging from 1 (Very Bad) to 5 (Very Good). Figure 2.1 reports the answers to this analysis. Each bar represents the share of firms that reported policy changes were either good or very good. The red dashed line represents 50 percent of firms. We use the line as a rough proxy of successful reform achievements, as it indicates that a majority of firms were pleased with the policy
28 For a full description of the PCI’s sampling methodology see Section 1.5 of the 2017 PCI Report (p52-63). Malesky, Edmund, Phan Tuan Ngoc, and Pham Ngoc Thach, 2018. The Vietnam Provincial Competitiveness Index: Measuring Economic Governance for Private Sector Development, 2017 Final Report, Vietnam Chamber of Commerce and Industry and United States Agency for International Development: Hanoi, Vietnam. <http://pcivietnam.org/danh-muc-du-lieu/du-lieu-pci/>
29 See Figure 2.34 in the Appendix for the sample populations by province.30 See Figure 2.33 in the Appendix for the sample populations by country of origin.31 1,583 sampled firms/11,544 firms in total population.32 1,583 sampled firms/6,215 pre-screened firms with correct contact information.33 Anseel, F., Lievens, F., Schollaert, E., & Choragwicka, B. (2010). Response rates in organizational science, 1995–2008: A meta-
analytic review and guidelines for survey researchers. Journal of Business and Psychology, 25(3), 335-349; Mellahi, K., & Harris, L. C. (2016). Response rates in business and management research: An overview of current practice and suggestions for future direction. British Journal of Management, 27(2), 426-437.

73PCI 2019THE VIET NAM PROVINCIAL COMPETITIVENESS INDEX
change. Three areas stand out as successes, including business establishment, electricity access, and social insurance.
Fifty-five percent of firms were positive about business establishment, which reflects the vast improvement in business registration and licensing. This area has been a focus of Vietnamese reforms for many years but received a huge lift from the 2014 Investment Law (67/2014/QH13) and its subsequent implementing documents. We explore Vietnam’s success on easing business entry in Section 2.3 below. Critically, we observe that in 2014, before the promulgation of the law, 80 percent of respondents waited under three months to obtain all of the necessary documentation to legally begin business. By contrast, in 2019, 92 percent of FIEs were fully legal within three months, the highest share observed in the history of the survey. Since 2015, initial licensing waiting periods have dropped from 60 days on average to less than 40. Registration certificate waits have dropped from an average of 36 days to 20 days, license renewals have declined from 35 days to 25 days, and tax code acquisition has declined from 22 days to just under 20 days. In sum, regulatory improvements have saved businesses 38 days in business start-up time, a shocking 27 percent decline in the costs of entry for FIEs in the country. It is quite clear why FIEs are so pleased with changes made in business establishment procedures. Importantly, the lowest entry costs are experienced by a new legal form of FIE created by the 2014 Investment Law, which allowed FIEs with 50 percent local ownership to enter as domestic, private operations.
Fully 51 percent of firms selected access to electricity as good or very good. This area has also been a focal point for Vietnamese authorities. Currently, nearly 100 percent of households have access to energy,34 and electricity has become more reliable over time.35 However, Vietnamese authorities are currently debating how to provide reliable energy that matches the growing demands of a booming middle-income economy. Finally, 50.3 percent of businesses are positive about changes in the country’s social insurance policy, which reflects changes made by the Vietnamese government to streamline social insurance payments and documentation. The introduction of electronic transactions for collecting and granting social insurance books and health insurance cards considerably reduced the waiting periods and transactions for businesses.36 Many of these changes were introduced as part of Resolution No. 9 series and their successor Resolution No. 02/NQ-CP on improving the competitiveness of businesses in
34 Anseel, F., Lievens, F., Schollaert, E., & Choragwicka, B. (2010). Response rates in organizational science, 1995–2008: A meta-analytic review and guidelines for survey researchers. Journal of Business and Psychology, 25(3), 335-349; Mellahi, K., & Harris, L. C. (2016). Response rates in business and management research: An overview of current practice and suggestions for future direction. British Journal of Management, 27(2), 426-437. World Bank, World Development Indicators Dataset, (Washington, DC: World Bank, 2019)
<http://databank.worldbank.org/data/reports.aspx?source=world-development-indicators.>35 Minh Ha-Duong, Hoai-Son Nguyen. 2017. “Is electricity affordable and reliable for all in Vietnam?” Presented at The tenth
Vietnam Economist Annual Meeting - VEAM 2017, Banking University Ho Chi Minh City; Development and Policies Research Center (DEPOCEN); CNRS; Foreign Trade University (FTU), August, Ho Chi Minh City, Vietnam. <https://hal-enpc.archives-ouvertes.fr/hal-01389981v3/document>
36 The ministry of finance estimates that the number of social insurance interactions declined from 12 to 1 annually for the average of enterprise. Dao Viet Anh, “Maximise convenience for enterprises to participate in social insurance,” Ministry of Finance Website <https://tinyurl.com/t96hr5y> January 8, 2019.

74 PCI 2019 THE VIET NAM PROVINCIAL COMPETITIVENESS INDEX
January 2019.37 While infrastructure and labor provide both interesting success stories and new challenges for FIEs, we focused on them in last year’s report, and therefore set them aside in this year’s analysis.38
Foreign investors were significantly less satisfied about the quality of Vietnamese legal institutions. Only 23 percent are satisfied with changes to Vietnam’s bankruptcy procedures. Similarly, about one third of FIEs observed improvements in their ability to use courts or arbitration centers to settle contract disputes (36.7 percent) and obtain protections for minority investors (33.2 percent). These outcomes require a fair and impartial court system, which many foreign investors continue to distrust. Chapter three of the 2018 PCI report analyzed these problems, focusing on the Vietnamese court system, foreign arbitration centers, and international modes of dispute resolution available to FIEs in Vietnam and through the Comprehensive and Progressive Agreement for the Trans-Pacific Partnership (CPTPP).39
Another area of concern is customs procedures with only 38.9 percent of firms indicating that they were satisfied with improvements. This critical issue has been explored in tremendous depth by VCCI using both PCI data and a separate survey.40
In the rest of this chapter of the 2019 PCI report, we focus special attention on three other reform areas in Figure 2.1 that receive only moderate approval from foreign investors: 1) taxes and audits (Section 2.4); 2) property rights for land holdings (Section 2.5); and 3) bribery in the issuance of construction permits (Section 2.6).
Tax policy represents a key area of concern with only 43 percent of businesses satisfied with the current status of reform. Foreign chambers of commerce in Vietnam have recently complained about the increased burdens of tax procedures, audits, and penalties, as the GTD strengthens tax enforcement to shore up fiscal revenue by instructing local offices to create annual tax audit plans.41 In Section 2.4, we evaluate FIEs perceptions of these audits, their assessment of the burden on enterprises, and their perception of whether the audits were fairly implemented. We find that for FIEs as a whole, the audit policy does not appear to be a major concern. Thirty-seven percent of FIEs received at least one audit last year. The median firm faced 1.5 tax
37 Nguyen Thuy Hang and Pham Tri Dung. 2019. “New Labor Code of Vietnam,” Baker and McKenzie, December 2019 <https://f.datasrvr.com/fr1/719/65391/Client_Alert_-_Amended_Labor_Code_2019_.pdf>
38 Section 1.5 of this report, however, does provide an index of Vietnamese infrastructure improvements over time. For labor quality see Section 2.5 of the 2018 PCI Report (p70-82) for infrastructure for see Section 1.5 (p49-55) and perceptions of infrastructure by FIEs see Section 2.6 (p82-85). Malesky, Edmund, Phan Tuan Ngoc, and Pham Ngoc Thach, 2019. The Vietnam Provincial Competitiveness Index: Measuring Economic Governance for Private Sector Development, 2018 Final Report, Vietnam Chamber of Commerce and Industry and United States Agency for International Development: Hanoi, Vietnam. <http://pcivietnam.org/danh-muc-du-lieu/du-lieu-pci/
39 See Chapter 3 of the 2018 PCI Report, “Special Investigation of Global Integration and International Contracting in Vietnam” (p90-105).
40 Vietnam Chamber of Commerce and Industry. 2019. Customs Enterprise Satisfaction Survey Report, Hanoi, Vietnam, January 11.41 CustomsNews. 2019. “Tax inspections attract lower satisfaction index: VCCI,” November 21. <https://customsnews.vn/tax-
inspections-attract-lower-satisfaction-index-vcci-12656.html> ; Dezan Shira and Associates. 2018. “Vietnam: Sectors in Focus for 2018 Tax Audits.” Vietnam Briefing, Ho Chi Minh City, Vietnam <https://www.vietnam-briefing.com/news/vietnam-sectors-focus-2018-tax-audits.html/>

75PCI 2019THE VIET NAM PROVINCIAL COMPETITIVENESS INDEX
audits and spent about 32 hours complying with local tax authority requests. Of these firms, 87 percent eventually received a penalty; however, only 7 percent believe the procedures and penalty were unfair. Nevertheless, the data also show that some firms faced extraordinary attention from tax authorities. A small share of FIEs experienced three audits in the past year, consuming over 72 hours of response time. The tax burden was felt most strongly in several groups of industrial sectors. Firms manufacturing wood products, computers and electronics, or fabricated metals, as well as companies in food processing appear to be in sectors that have higher than average enforcement. However, another group of sectors stand out for average or below average levels of audit activity but high shares of firms citing unfair enforcement. These are firms manufacturing leather or electronic equipment and those offering health, labor, or educational services.
Only 38 percent of investors cite property rights protections as good or very good, despite the changes made to the 2013 Land Law (45/2013/QH13). In Section 2.5, we evaluate whether this assessment is correct by looking at FIEs responses to changes in the law over time in regard to land use rights certificate (LURC) acquisition and assessments of expropriation risk. We document a tremendous reduction in perceptions of expropriation risk after the promulgation of the 2013 Land Law. FIEs reporting expropriation risk as low or very low increased from an average of 47.1 percent in 2012 to 79.5 percent in 2019. Expropriation risk reduction is most pronounced among firms that received a Land Use Rights Certificate (LURC) from their industrial zone manager. Before the Land Law, only 37 percent of firms inside industrial zones (IZs) had LURCs; this rose to 51 percent in 2019. Eighty-five percent of these firms believed expropriation risk was low or very low. Firms located outside industrial zones also saw reduced risk, but it was not nearly as pronounced.
In the final section of the chapter, we study FIEs experience with corruption. We demonstrate that, on almost every indicator in every survey, informal charges during licensing to land acquisitions, regulatory inspections, and courts, corruption has declined far below its 2016 peak. This is a credit to the ongoing anti-corruption campaign.42 Indeed, the average cost of bribe payments for FIEs has declined from 1.6 percent of sales in 2016 to 1.1 percent in 2019, indicating a 31 percent decline in the overall cost of bribery for investors. This is equivalent to a US$1.1 billion reduction in the bribe tax for FIEs operating in Vietnam, providing them with money that can be more productively used to innovate, hire, and even pay formal taxes. This is a phenomenal improvement.
However, there is one area of concern, captured by Figure 2.1, where only 34 percent of businesses are positive about changes in policies for obtaining construction permits. Informal fees appear to be a key contributor to this concern. Using a specialized survey experiment that shields respondents from culpability, allowing them to answer the question as honestly as possible, we
42 Malesky, Edmund and Phan Thuan Ngoc. 2019. “Rust Removal: Why Vietnam’s Historical Anticorruption Efforts Failed to Deliver Results, and What That Implies for the Current Campaign Edmund Malesky and Ngoc Phan,” in Chen, Cheng, and Meredith L. Weiss, eds. The Political Logics of Anticorruption Efforts in Asia. SUNY Press, 2019.

76 PCI 2019 THE VIET NAM PROVINCIAL COMPETITIVENESS INDEX
find that 48 percent of FIEs who applied for construction permits in the past year paid bribes in order to acquire them. The additional cost was 24 million VND ($1,043) per construction permit. Critically, these numbers represent a lower bound, because they do not include FIEs who did not apply for new construction licenses due to the threat of informal charges.
Before we dive into the governance analysis, we first spend some time in Section 2.1 focusing on the changing picture of FIEs in Vietnam. Due to the country’s economic growth, burgeoning middle class, and technical sophistication, combined with changes in the global economy (most notably, US tariffs on Chinese goods), the composition and size of FDI is changing incrementally. In particular, we are seeing greater entry and business expansion by firms producing higher technology goods, requiring higher skilled labor. Understanding the changing legal, policy, and regulatory demands of FIEs requires first understanding the new dynamics caused by different types of investors.
Figure 2.1 Evaluation of Governance by Policy Arena
Business Establishment
Investor ProtectionCustoms
TaxContract Enforcement
Access to Loans/Credit Social InsuranceBankruptcy Procedures
Impr
ovem
ents
Goo
d or
Ver
y Go
od (%
)
0
10
20
30
40
50
60
Construction Permit Access to Electricity Property Registration
55.1
34.0
51.4
37.640.3
33.2
43.1
50.3
38.936.7
22.9
Source: PCI-FDI Question J5, “From your firm’s observation and experience, how do you rate the changes in the following areas in your province compared to the previous years?” Values are collected using a five-point Likert scale ranging from 1) Very Bad to 5) Very Good. We present the share of firms answering Good or Very Good.

77PCI 2019THE VIET NAM PROVINCIAL COMPETITIVENESS INDEX
2.1 CHANGING SECTOR AND SIZE OF FOREIGN INVESTMENT COMPOSITION
Looking at broad sectors in 2019, about 61 percent of the 1,583 PCI-FDI Respondents engage in manufacturing. Less than 1 percent of firms are involved in agriculture/aquaculture (11 firms) or natural resource exploitation such as mining (4 firms). Twenty-eight percent of FIEs engage in some form of services. Within these broad sectors, however, there is a great deal of diversity. No single industry dominates foreign investment activity. Digging a little deeper by studying the two-digit sector codes in Figure 2.2, we can see the most popular manufacturing activities are fabricated metals (involving 9.2 percent of operations), rubber and plastic (7.2 percent), computers and electronics (6.7 percent), textiles (4.8 percent), and garments (3.16 percent). The biggest service sector activities are wholesale/retail (9.4 percent) and finance and insurance (5.25 percent).
At first glance, sectoral shares have remained broadly stable over time, as we show by tracking changes in industrial patterns represented by respondent FIEs back to 2016. Nevertheless, there are three changes worthy of note. First, businesses producing computers and electronics rose from 2.73 percent in 2016 to 6.7 percent today. If we combine this sector with electronic equipment, the share of firms has nearly doubled over the last four years to nearly 9 percent of operations. Over the same period, the share of firms engaged in garment production has declined from 6 percent in 2016 to only 3.2 percent today. These trends represent a noticeable enhancement of the more technologically sophisticated production in Vietnam that may have been boosted by shifts in global value chains caused by US tariffs on China.43
Another interesting trend, related to Vietnam’s rise into middle income status and growing energy needs, is the tremendous growth of firms operating in energy provision. In 2016, these firms represented only 1.3 percent of the national sample, but their share has quickly grown to over 4 percent in 2019. Foreign investors have expanded into a number of energy-related industries, including coal, water, and a host of renewable energy sources, such as wind, electricity, and even biomass waste.44 These investments have been encouraged by Vietnamese authorities through generous tax incentives in order to help meet their estimates for Vietnam’s changing energy needs. The National Electricity Development Plan estimates that the country will increase its usage from 47,000 MW today to 130,000 MW in 2030.45
43 Malesky, Edmund and Layna Mosley. 2019. “Labor Upgrading, Trade Agreements and Export Market Opportunities: E v i d e n c e from Vietnam.” Presented at the 2019 Annual Meeting of the International Political Economy Society, San Diego, CA, November 14th. <http://laynamosley.web.unc.edu/files/2019/07/20190812_MM_TariffsUpgrading_Final3_ejm.pdf>
44 http://ven.vn/vietnam-attracts-foreign-investors-in-renewable-energy-40679.html45 Deutsche Gesellschaft für Internationale Zusammenarbeit (GIZ). 2016. Vietnam Power Development Plan for the period 2011
– 2020: Highlights of the PDP 7 Revised, Hanoi, Vietnam. <http://gizenergy.org.vn/media/app/media/legal%20documents/GIZ_PDP%207%20rev_Mar%202016_Highlights_IS.pdf>

78 PCI 2019 THE VIET NAM PROVINCIAL COMPETITIVENESS INDEX
A related trend can be observed in Figure 2.3, where we plot the average employment size of PCI-FDI respondents.46 In the 2017 and 2018 PCI Reports, we observed that while the number of investors was increasing, the average size of employment and investment capital of the operations was decreasing.47 This was true for both PCI data and results from the General Statistical Office (GSO) Enterprise Survey. In 2019, for the first time since 2012, this trend has appeared to halt. In the past year, the mean respondent size is 191 employees, representing an increase of 13 employees per firm above 2018. Although the overlapping 95 percent confidence intervals indicate that this increase is not statistically significant and the average employment size is still below that of 2017, the halt of the decline provides some optimism.
Figure 2.2 Change in Sectoral Composition of FDI over Time
2.40
4.99
1.26
1.26
5.85
11.51
3.59
1.33
8.52
2.86
4.32
3.33
2.13
2.73
12.18
2.13
7.25
4.13
2.06
0.67
3.39
5.99
2.66
2.73
0.13
0.60
0 5 10 15
Edu/Healths/Labour services
Others Services
Professional Services
Real Estate
Financial/Insurance
Wholesale/Retail
Construction
Electricity/Gas/AC
M: Other
M:Furniture
M:Motor Vehicles
M:Machinery
M:Electronic Equip.
M:Computers/Electronics
M:Fabricated Metals
M:Basic Metals
M:Rubber/Plastics
M:Chemicals
M:Paper Products
M:Wood Products
M:Leather
M:Garments
M:Textiles
M:Food Processing
Mining
Agriculture/Aquaculture
2016
5.35
5.69
1.08
0.51
5.12
1.59
9.78
3.41
2.90
9.44
0.91
3.24
3.13
2.56
5.80
7.00
3.98
6.66
3.19
1.88
1.54
2.67
4.21
4.95
2.96
0.11
0.34
0 5 10 15
Edu/Healths/Labour services
Others Services
Professional Services
Real Estate
Financial/Insurance
Information/Communication
Wholesale/Retail
Construction
Electricity/Gas/AC
M: Other
M:Furniture
M:Motor Vehicles
M:Machinery
M:Electronic Equip.
M:Computers/Electronics
M:Fabricated Metals
M:Basic Metals
M:Rubber/Plastics
M:Chemicals
M:Paper Products
M:Wood Products
M:Leather
M:Garments
M:Textiles
M:Food Processing
Mining
Agriculture/Aquaculture
2017
4.26
6.43
0.76
0.57
5.35
1.85
10.18
4.71
3.31
8.34
0.83
3.06
3.12
2.48
6.94
7.83
2.42
6.94
4.07
2.04
1.27
2.10
3.76
4.20
2.80
0.19
0.19
0 5 10 15
Edu/Healths/Labour services
Others Services
Professional Services
Real Estate
Financial/Insurance
Information/Communication
Wholesale/Retail
Construction
Electricity/Gas/AC
M: Other
M:Furniture
M:Motor Vehicles
M:Machinery
M:Electronic Equip.
M:Computers/Electronics
M:Fabricated Metals
M:Basic Metals
M:Rubber/Plastics
M:Chemicals
M:Paper Products
M:Wood Products
M:Leather
M:Garments
M:Textiles
M:Food Processing
Mining
Agriculture/Aquaculture
2018
4.81
6.52
1.52
0.95
5.25
2.15
9.37
3.54
4.24
5.95
1.14
2.97
2.53
2.03
6.65
9.18
2.72
7.15
4.11
1.84
1.46
2.53
3.16
4.81
2.34
0.06
1.01
0 5 10 15
Edu/Healths/Labour services
Others Services
Professional Services
Real Estate
Financial/Insurance
Information/Communication
Wholesale/Retail
Construction
Electricity/Gas/AC
M: Other
M:Furniture
M:Motor Vehicles
M:Machinery
M:Electronic Equip.
M:Computers/Electronics
M:Fabricated Metals
M:Basic Metals
M:Rubber/Plastics
M:Chemicals
M:Paper Products
M:Wood Products
M:Leather
M:Garments
M:Textiles
M:Food Processing
Mining
Agriculture/Aquaculture
2019
Share of Respondents (%)
Source: Author’s calculation based on General Department of Taxation classification in PCI Sample Frame. “M” de-notes manufacturing sector.
46 See Figure 2.35 in the Appendices for a full breakdown of firms using the PCI’s eight-point scale.47 See section 3.1, “The Shrinking Private Firm” in Malesky, Edmund, Phan Tuan Ngoc, and Pham Ngoc Thach, 2018. The Vietnam
Provincial Competitiveness Index (p98-102)

79PCI 2019THE VIET NAM PROVINCIAL COMPETITIVENESS INDEX
Figure 2.3 Downward Trend in Average Employment Size Halts
150
175
200
225
250
275
300
Mea
n Em
ploy
men
t of F
DI R
espo
nden
ts (W
orke
rs)
2012 2013 2014 2015 2016 2017 2018 2019
Source: PCI-FDI Question A10, “What was the employment size of your firm (this year)?” Range bars represent 95 Percent Confidence Intervals.
Figures 2.4 and 2.5 disaggregate firm average size by sector to study where the firm growth may be coming from. Currently, labor intensive manufacturing sectors, such as furniture, leather, garments, and textiles provide the greatest average employment with over 400 workers per company. More technologically sophisticated manufacturing in wood products, computers, electronic equipment, and motor vehicles occupy the next largest tier with firms employing between 270 and 400 individuals. On the other end of the scale, we observe service sector operations in sales, construction, and finance and insurance that appear to have really small operations measured by employment size.
Observing growth rates in Figure 2.5 demonstrates that the greatest average employment growth is occurring in wood products, textiles, and energy provision, with companies in these sectors growing to meet expanding international demands and rising levels of domestic energy consumption. There is also a noticeable employment decline among firms in several industries, especially in wholesale/retail and information and communication services, which saw 48 percent and 37 percent average employment declines since 2016. These trends may be due to increasing automation in many manufacturing and service outlets.48
48 Organization for Economic Cooperation and Development (OECD). 2019. Multi-dimensional Review of Viet Nam Suggestions for an integrated, transparent and sustainable economy “Viet Nam 4.0.” Paris, France, p124.
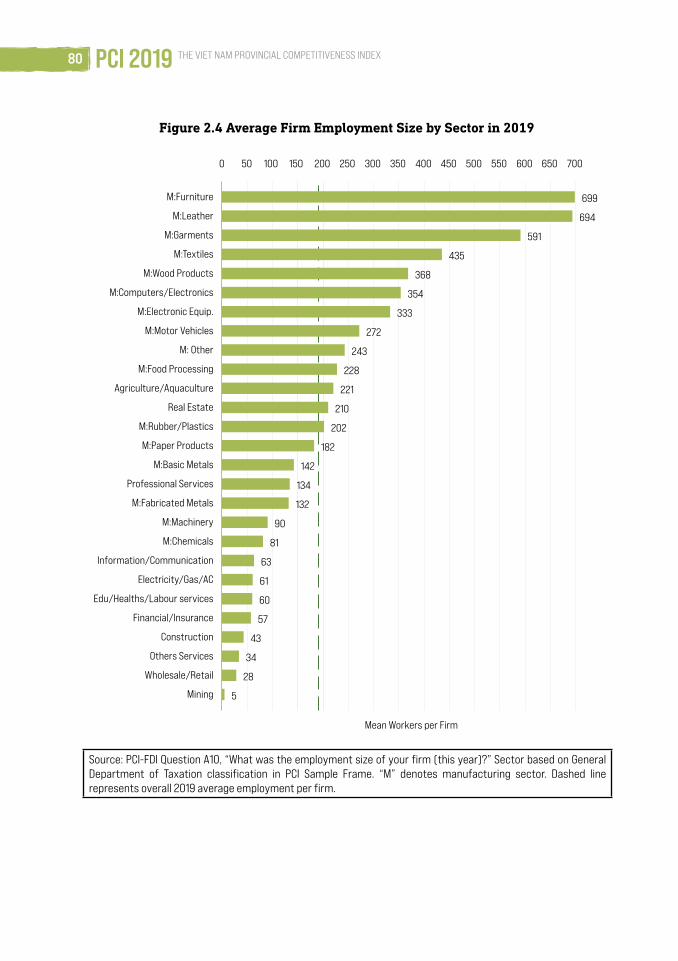
80 PCI 2019 THE VIET NAM PROVINCIAL COMPETITIVENESS INDEX
Figure 2.4 Average Firm Employment Size by Sector in 2019
5
28
34
43
57
60
61
63
81
90
132
134
142
182
202
210
221
228
243
272
333
354
368
435
591
694
699
0 50 100 150 200 250 300 350 400 450 500 550 600 650 700
Mining
Wholesale/Retail
Others Services
Construction
Financial/Insurance
Edu/Healths/Labour services
Electricity/Gas/AC
Information/Communication
M:Chemicals
M:Machinery
M:Fabricated Metals
Professional Services
M:Basic Metals
M:Paper Products
M:Rubber/Plastics
Real Estate
Agriculture/Aquaculture
M:Food Processing
M: Other
M:Motor Vehicles
M:Electronic Equip.
M:Computers/Electronics
M:Wood Products
M:Textiles
M:Garments
M:Leather
M:Furniture
Mean Workers per Firm
Source: PCI-FDI Question A10, “What was the employment size of your firm (this year)?” Sector based on General Department of Taxation classification in PCI Sample Frame. “M” denotes manufacturing sector. Dashed line represents overall 2019 average employment per firm.

81PCI 2019THE VIET NAM PROVINCIAL COMPETITIVENESS INDEX
Figure 2.5 Employment Growth by Sector since 2016
-52
-48
-37
-30
-26
-23
-20
-13
-13
-12
-10
-9
-5
-2
1
3
4
5
6
10
11
12
20
-60 -40 -20 0 20
Professional Services
Wholesale/Retail
Information/Communication
Others Services
M:Chemicals
M:Machinery
M:Computers/Electronics
M:Basic Metals
Construction
M:Food Processing
M:Fabricated Metals
M: Other
M:Garments
Edu/Healths/Labour services
M:Rubber/Plastics
M:Motor Vehicles
M:Leather
M:Furniture
M:Electronic Equip.
M:Paper Products
Electricity/Gas/AC
M:Textiles
M:Wood Products
Average Employment Growth (2016-2019)
Source: PCI-FDI Question A10, “What was the employment size of your firm (this year)?” used to calculate labor growth between 2016 and 2019. Sector based on General Department of Taxation classification in PCI Sample Frame. “M” denotes manufacturing sector. Dashed line represents overall 2019 average employment growth per firm.
Figure 2.6 demonstrates that the halting of the downward trend in business size also occurred this year in FIE investment size. Average firm capital, in inflation adjusted billions of VND, increased from 62.5 billion VND ($2.7 million USD) in 2016 to 72.6 billion VND ($2.3 million USD) in 2019. Again, this only demonstrates a plateau, as the size has not rebounded to figures recorded in previous years. According to Figure 2.7, the largest investors in our dataset by capital size are

82 PCI 2019 THE VIET NAM PROVINCIAL COMPETITIVENESS INDEX
involved in real estate with investments that are nearly three times the national average at 233 billion VND ($10.1 million USD). However, this figure should be treated with caution, as there are very few real estate firms among PCI-FDI respondents, which means that one or two firms can generate large aggregate swings. The next tier involves manufacturers of electronic services and providers of professional services, such as accounting, consulting, and legal advice. Average investment sizes for these businesses are 171 billion VND ($7.4 million USD) and 160 billion ($7 million USD). Manufacturers of furniture, other wood products, processed food, basic metals, textiles, computers, motor vehicles and fabricated metals all are above the mean investment size averaging between 93 and 120 billion VND ($4 to $5.2 million USD).
Figure 2.6 Average Investment Size Increases after 10-Year Low
50
55
60
65
70
75
80
85
90
95
100
Mea
n In
vest
men
t of F
DI R
espo
nden
ts (B
illion
s of V
ND)
2012 2013 2014 2015 2016 2017 2018 2019
Source: PCI-FDI Question A5, “What was your firm’s actual (implemented) investment size (this year)?” Range bars represent 95% Confidence Intervals.

83PCI 2019THE VIET NAM PROVINCIAL COMPETITIVENESS INDEX
Figure 2.7 Average Investment Size per Sector
7
17
18
23
29
39
58
62
74
75
79
79
80
83
85
93
95
97
107
109
112
119
119
160
171
233
0 25 50 75 100 125 150 175 200 225 250
Financial/Insurance
Wholesale/Retail
Others Services
Information/Communication
Construction
Edu/Healths/Labour services
M:Machinery
M:Leather
Electricity/Gas/AC
M:Garments
M:Paper Products
Agriculture/Aquaculture
M:Chemicals
M:Rubber/Plastics
M: Other
M:Fabricated Metals
M:Motor Vehicles
M:Basic Metals
M:Computers/Electronics
M:Textiles
M:Food Processing
M:Wood Products
M:Furniture
Professional Services
M:Electronic Equip.
Real Estate
Mean Investment per Firm (Billions of VND)
Source: PCI-FDI Question A5, “What was your firm’s actual (implemented) investment size (this year)?” Sector based on General Department of Taxation classification in PCI Sample Frame. “M” denotes manufacturing sector. Dashed line represents overall 2019 average investment per firm.

84 PCI 2019 THE VIET NAM PROVINCIAL COMPETITIVENESS INDEX
Figure 2.8 shows that the largest investment growth occurred among firms that manufacture garments, paper products, and fabricated metals.
Figure 2.8 Investment Growth by Sector over Time
-104
-57
-36
-31
-27
-25
-20
-20
-18
-17
-17
-14
-9
-8
-5
-5
-5
-3
-3
4
5
9
15
-150 -100 -50 0 50
Information/Communication
M:Wood Products
Wholesale/Retail
M:Machinery
Construction
Professional Services
M:Electronic Equip.
M:Leather
Electricity/Gas/AC
M:Motor Vehicles
M:Food Processing
Others Services
Edu/Healths/Labour services
M:Basic Metals
M:Chemicals
M:Rubber/Plastics
M:Textiles
M:Computers/Electronics
M:Furniture
M:Fabricated Metals
M: Other
M:Paper Products
M:Garments
Average Investment Growth (2016-2019)
Source: PCI-FDI Question A5, “What was your firm’s actual (implemented) investment size (this year)?” used to calculate investment growth between 2016 and 2019. Sector based on General Department of Taxation classification in PCI Sample Frame. “M” denotes manufacturing sector. Dashed line represents overall 2019 average investment growth per firm.

85PCI 2019THE VIET NAM PROVINCIAL COMPETITIVENESS INDEX
2.2 PROSPECTS FOR EXPANSION OF EXISTING OPERATIONS
As with domestic firms, FDI business prospects in the 2019 PCI report were projected in the second and third quarter of 2019, before the January 2020 coronavirus outbreak. Both large and small businesses have been significantly affected by the global pandemic. In the 2020 PCI report, we will explore how the outbreak has influenced business operations and expansion plans.
In this section, we shift our focus away from historical growth to prospective expansion. Each year, the PCI research team queries businesses about their plans for the next two years. The question specifically asks whether they: 1) will considerably increase the size of their operations; 2) will increase the size of their operations; 3) will continue the business at its present size; 4) are considering reducing the size of the operations; 5) intend to considerably reduce the size of their operations; or 6) plan to close the business. FIEs remain quite positive in 2019 with 53 percent of firms intending to expand. However, this represents a decline from the high of 60 percent achieved in 2017 and from 55 percent last year.
Figure 2.9 PCI-FDI Business Thermometer
Firm
s Pla
nnin
g to
Exp
and
over
Nex
t Tw
o Ye
ars (
%)
68
47
3328
5148
51
6056
53
0
10
20
30
40
50
60
70
80
90
100
2010 2011 2012 2013 2014 2015 2016 2017 2018 2019
68
47
3328
5148
51
6056
53
Source: PCI-FDI Question A12, “Which statement best characterizes your firm’s investment plans over the next 2 years?” Share of firms answering they intend to 1 “Plan to considerably increase the size of operations” or 2 “Plan to increase the size of operations.” Range bars represent 95% Confidence Intervals.

86 PCI 2019 THE VIET NAM PROVINCIAL COMPETITIVENESS INDEX
As we have shown for many years, how businesses respond to this question is a strong gauge of the level of optimism and confidence in the business community and a leading predictor of economic performance. The PCI business thermometer falls in the years before GDP contraction and expands in the years preceding economic growth.49 In 2017, for instance, we observed the highest PCI thermometer scores since the economic crisis of 2011 for both foreign and domestic investors. The country then achieved a growth rate of 7.08 percent in 2018, the highest rate in over a decade, surpassing the prediction of the General Statistical Office (GSO). Figure 2.10 demonstrates this phenomenon for FIE growth directly by showing that the sectors which reported the highest interest in expansion in 2017 also tended to have the highest actual expansion (measured by employment growth) in 2019.
Figure 2.10 Thermometer is a Lead Indicator for Actual Expansion
M:Food Processing
M:Textiles
M:Garments
M:Leather
M:Wood Products
M:Paper Products
M:Chemicals
M:Rubber/Plastics
M:Basic MetalsM:Fabricated Metals
M:Computers/Electronics
M:Electronic Equip.
M:Machinery
M:Motor VehiclesM:Furniture
M: Other
Electricity/Gas/AC
Construction
Wholesale/Retail
Information/Communication
Professional Services
Others Services
Edu/Healths/Labour services
-60
-40
-20
0
20
Aver
age
Labo
r Gro
wth
(201
6-20
19, %
)
30 40 50 60 70 80
Firms Planning to Expand in 2017 (%)
Prediction Observed
Source: X-Axis is PCI-FDI Question A12, “Which statement best characterizes your firm’s investment plans over the next 2 years?” Share of firms in 2016 answering they intend to 1 “Plan to considerably increase the size of operations” or 2 “Plan to increase the size of operations.” Y-Axis used PCI-FDI Question A10, “What was the employment size of your firm (this year)?” to calculate labor growth between 2016 and 2019.
49 Malesky, Edmund, Phan Tuan Ngoc, and Pham Ngoc Thach, 2018. The Vietnam Provincial Competitiveness Index. See Figure 1.2 on Page 20.

87PCI 2019THE VIET NAM PROVINCIAL COMPETITIVENESS INDEX
Knowing that the PCI Thermometer anticipates growth, what sectors are likely to see the greatest expansion over the next two years? Figure 2.11 reports the average expansion by sector from the 2019 PCI data. We find that firms involved in real estate are the most optimistic with 73 percent of FIEs in the sector indicating a willingness to expand. Again, caution is required because of the small number of real estate investors overall. However, there are a substantial number of light manufacturers, and they are also anticipating growth. Manufacturers of electronic equipment, motor vehicles, food processing, and basic metals also have a super-majority of 60 percent of firms indicating optimism about expansion. By contrast, furniture, mining, and garments, growth leaders over the past five years, are more negative. Less than 40 percent of FIEs in those sectors indicate intent to expand.
Figure 2.11 PCI-FDI Thermometer by Sector in 2019
36.0038.89
41.1842.50
44.6247.8348.21
50.0050.00
51.3251.7252.4153.3353.4953.7353.9554.1754.37
55.4156.6357.45
59.2959.4659.57
65.6373.33
0 10 20 30 40 50 60 70 80
Firms Planning to Expand (%)
M:GarmentsM:Furniture
Information/CommunicationM:MachineryM:Chemicals
M:Wood ProductsConstruction
Agriculture/AquacultureM:LeatherM:Textiles
M:Paper ProductsM:Fabricated Metals
M:Computers/ElectronicsM:Basic Metals
Electricity/Gas/ACEdu/Healths/Labour services
Professional ServicesOthers Services
Wholesale/RetailFinancial/Insurance
M: OtherM:Rubber/PlasticsM:Food Processing
M:Motor VehiclesM:Electronic Equip.
Real Estate
Source: PCI-FDI Question A12, “Which statement best characterizes your firm’s investment plans over the next 2 years?” Share of firms answering they intend to 1 “Plan to considerably increase the size of operations” or 2 “Plan to increase the size of operations.” Average expansion plans by two-digit sector. Red dashed line indicates half of firms in sector.

88 PCI 2019 THE VIET NAM PROVINCIAL COMPETITIVENESS INDEX
Figure 2.12 aggregates the thermometer data to the provincial level. Surprisingly, the highest share of firms with expansion plans are in Ha Nam (81 percent), Binh Phuoc (80 percent), and Hai Duong (70.2 percent) provinces. These provinces have the smallest absolute numbers of FIEs and some of the youngest firms in the sample. Indeed, FIEs may have selected these provinces specifically with the intention of expanding outside the traditional centers for FDI in Vietnam. It is worth noting that all three of the major expansion sites border historical recipients of FDI Hanoi and Binh Duong. To double check this, we ran regression analysis of expansion plans on firm age, finding that older firms are much less likely to expand than new ones. Each year that a firm has been in operation reduces its willingness to expand by about 1.5 percentage points.
Figure 2.12 PCI-FDI Thermometer by Province
36.67
42.59
42.86
44.44
45.12
45.76
47.83
49.09
51.15
51.39
54.30
56.52
57.14
57.14
57.69
57.69
60.87
61.22
70.21
80.00
80.65
0 10 20 30 40 50 60 70 80 90
Firms Planning to Expand (%)
Khanh Hoa
Bac Giang
BRVT
Binh Thuan
Binh Duong
Long An
Lam Dong
Da Nang
HCMC
Hai Phong
Ha Noi
Vinh Phuc
Tay Ninh
Bac Ninh
Quang Nam
Dong Nai
Thai Nguyen
Hung Yen
Hai Duong
Binh Phuoc
Ha Nam
Source: PCI-FDI Question A12, “Which statement best characterizes your firm’s investment plans over the next 2 years?” Share of firms answering they intend to 1 “Plan to considerably increase the size of operations” or 2 “Plan to increase the size of operations.” Average expansion plans by province. Red dashed line indicates half of firms in sector.

89PCI 2019THE VIET NAM PROVINCIAL COMPETITIVENESS INDEX
2.3 STRONG IMPROVEMENT IN ALL ENTRY PROCEDURES
Turning to Figure 2.13, we noted that a majority of investors were positive about government efforts to reduce entry costs, measured by the cost of receiving all of the licenses, registration certificates, and other permissions and signatures necessary to commence operations. Figure 2.13 presents a confidence interval plot, where the symbol depicts the average share of firms for each time period and the range bars represent the possible range of values possible in a different random sample. When confidence intervals do not overlap we can infer significant differences, indicating that these estimates did not occur by chance and that our conclusions are not an artifact of our sample.
Critically, we observe that, in 2014, just over 80 percent of respondents waited less than three months to obtain all of the necessary documentation to legally begin business. By 2019, we find 92 percent of FIEs were licensed within three months, the highest share observed in the history of the survey. Moreover, 56 percent of businesses in 2019 were registered in less than one month, the highest share seen since 2011. Indeed, 11 percent of FIEs claim that they had all the documentation for legal operations within a week of their applications.
Figure 2.13 Wait to Begin Operations
30
35
40
45
50
55
60
65
70
75
80
85
90
95
Shar
e of
Firm
s (%
)
2010 2011 2012 2013 2014 2015 2016 2017 2018 2019
Waited under One Month Waited under Three Months
Source: PCI-FDI Question B3, “Considering all your documentation, how long did it take you to get all required registration certificate, licenses, and stamps to be a fully legal business in your province?” Symbol denotes mean score per year, while range bar depicts 95% confidence intervals.

90 PCI 2019 THE VIET NAM PROVINCIAL COMPETITIVENESS INDEX
Figure 2.14 provides a more fine-grained analysis of the actual changes by looking at the average days necessary to receive a particular legal document over time. We focus on four common documents, including investment licenses, business registration, tax codes, and license renewal for existing investors. The graph shows a clear drop in wait times for all four activities since the promulgation of the 2014 Investment Law, which went into effect on July 1, 2015. Since 2015, initial licensing waiting periods have dropped from 60 days on average to fewer than 40, registration certificate waits have dropped from 36 average days to 20, renewals have declined from 35 days to 25, and tax code acquisition has declined from 22 days to just under 20. In sum, regulatory improvements have saved businesses 38 days in start-up time - a shocking 27 percent decline in the costs of entry for FIEs in the country. It is quite clear why FIEs are so pleased with changes made in business establishment procedures.
Figure 2.14 Wait Times by Document
0
5
10
15
20
25
30
35
40
45
50
55
60
65
70
Num
ber o
f Day
s
2010 2011 2012 2013 2014 2015 2016 2017 2018 2019
Initial Investment License License Renewal
Registration Certificate Tax Code
Source: PCI-FDI Question B1, “From the day you submitted the application to the day you received it, how long did it take for you to receive your (Feel free to calculate months as 30 days and years as 365 days)”
Different entry modes are available for new investors in Vietnam. The dominant share of investors (84 percent) enter as 100 percent foreign-owned operations. About 6 percent enter as joint ventures (JVs) with either domestic, private firms (5 percent) or state-owned

91PCI 2019THE VIET NAM PROVINCIAL COMPETITIVENESS INDEX
enterprises (SOEs) (1 percent). Joint venture decisions are usually made when FIEs are looking for partners with unique assets that the FIE cannot obtain on its own, including land, natural resource exploitation licenses, and even relationships with important decision-makers. Over the years, the PCI research team has closely tracked the legal forms FIEs choose when they enter the country. In the 2016 PCI report, we predicted that the fraction of FIEs that registered as domestic operations would increase following the introduction of the 2014 Investment Law.50 The Vietnamese legal system considers firms with over 51 percent local ownership to be domestic investors and thus does not require an Investment Registration Certificate (IRC). As can be seen in Figure 2.15, domestic operations accounted for only 4 percent of applicants for business licenses before 2015 but increased to 13 percent of those applying after the National Assembly promulgated the Law.
Figure 2.15 Increasing Share of Firms Entering as Domestic Companies
91%
4%
1%
4%
Registered before 2015
79%
8%0%
13%
Registered after 2015
100% Foreign JV w/VN Private Firm
JV w/VN SOE Registered as Domestic
Source: PCI-FDI Question A8,” Which of the following categories best describe your company’s current legal form?”
Has the policy of domestic registration been effective? We attempt to answer this question in Figure 2.16. We present the same entry cost indicators as above but disaggregate the analysis by business form. The first thing to notice is that there is clearly a divergence between 100 percent foreign-owned firms (including those using both the foreign and domestic entry provisions) and joint ventures. On every indicator, JVs take significantly longer to get started. This is most apparent in the case of JVs with SOEs. Only 75 percent of businesses are fully legal within three
50 See page 57. Malesky, Edmund, Phan Tuan Ngoc, and Pham Ngoc Thach, 2018. The Vietnam Provincial Competitiveness Index: Measuring Economic Governance for Private Sector Development, 2017 Final Report, Vietnam Chamber of Commerce and Industry and United States Agency for International Development: Hanoi, Vietnam. <http://pcivietnam.org/danh-muc-du-lieu/du-lieu-pci/>

92 PCI 2019 THE VIET NAM PROVINCIAL COMPETITIVENESS INDEX
months, compared to all other forms, which are above 90 percent. Similarly, investment licenses took 74 days compared to 37 days for 100 percent foreign-owned operations. Even license renewal and tax code acquisition, at 47 and 33 days, respectively, take nearly twice as long as 100 percent foreign-owned businesses.
As anticipated, the domestic entry possibility appears to be a highly efficient avenue. Entry procedures are significantly faster on every measured indicator. In particular, 93 percent of firms are fully legal within three months and 67 percent are fully legal within one month, investment license acquisition and renewal take 38 and 20 days, respectively, and tax codes were obtained within 19 days.
Figure 2.16 Entry Times by Registration Form
91
55
37
2520 18
90
56
45
32
2115
75
42
74
47
30 33
93
67
38
2016
19
0
10
20
30
40
50
60
70
80
90
100
Registration< 3 Months (%) Registration< 1 Month (%)
Investment License (Days) License Renewal (Days)
Business Registration (Days) Tax Code (Days)
Registered as DomesticJV w/VN SOEJV w/VN Private Firm100% Foreign
Source: PCI-FDI Question A8,” Which of the following categories best describe your company’s current legal form?” PCI-FDI Question B1, “From the day you submitted the application to the day you received it, how long did it take for you to receive your (Feel free to calculate months as 30 days and years as 365 days)”

93PCI 2019THE VIET NAM PROVINCIAL COMPETITIVENESS INDEX
2.4 CONCERNS ABOUT POST-ENTRY REGULATORY ENFORCEMENT AND TAX AUDITS
Vietnamese policy-makers continued to implement measures to reduce the regulatory burden on FIEs. In February 2017, the government issued Resolution 19-2017/NQ-CP on “Improving the Business Environment and National Competitiveness toward 2020.” The Resolution outlines specific goals regarding governance, competitiveness, innovation and e-government. In May 2017, the Prime Minister issued Directive 20/CT-TTg on rectifying inspection activities to prevent redundant, overlapping and unnecessary inspections that interfere with the operation of enterprises. In 2018, the government issued Resolution 19-2018 on improving business environment and national competitiveness, with more concrete targets. At the end of 2018, the Prime Minister’s office also introduced Resolution 139/NQ-CP on reducing costs of doing business for firms. This action plan aims at, among other things, reducing informal fees and harassment in inspection activities.51 However, weak implementation and informal regulation will continue to pose difficulties for some FIEs.52 As the Vietnamese government described the problem in Resolution 02, “Some reform efforts are at surface level, and are not creating real changes. Businesses and citizens still face irritations and harassments, at some places and from time to time, caused by partial regulations imposed by some authorities and some public officials.”53
We observed the initial benefits of these policies in 2017 and 2018; to some extent, they continue today. The share of firms having to spend over five percent of managers’ time on bureaucratic procedures dropped from an average of 70 percent between 2012 and 2016 to 66.2 percent in 2017 and to 41.3 percent in 2018. This is very substantial progress. This finding is consistent with reductions in harassment activities. The share of firms enduring harassment – defined as having five or more visits per year – decreased from 24 percent in 2016 to 9.3 percent in 2019.
51 Nguyen, P. X. (2017, May 17). On rectifying inspections and examinations of businesses. Thu Vien Phap Luat. Retrieved from https://thuvienphapluat.vn/van-ban/Doanh-nghiep/Chi-thi-20-CT-TTg-2017-chan-chinh-thanh-tra-kiem-tra-doanh-nghiep-349402.aspx; Nguyen, P. X. (2018a, November 9). Promulgating Action Plan to Cut Costs for Businesses. Vietnamese Government Electronic Portal. Retrieved from http://vanban.chinhphu.vn/portal/page/portal/chinhphu/hethongvanban?class_id=509&mode=detail&document_id=195260; Nguyen, P. X. (2018b). On continued implementation of key tasks and solutions to improve business environment and national competitiveness in 2017 and orientations toward 2020. Thu Vien Phap Luat. Retrieved from https://thuvienphapluat.vn/van-ban/Doanh-nghiep/Nghi-quyet-19-2017-NQ-CP-tiep-tuc-thuc-hien-nhiem-vu-giai-phap-chu-yeu-cai-thien-moi-truong-kinh-doanh-338606.aspx
52 OECD 2019. Multidimensional review, p80.53 Government Decree 02/ND-CP dated 1 January 2019 on continued implementation of key task and solutions to
improve business environment and enhance national competitiveness in 2019 and orientations towards 2021, p3.

94 PCI 2019 THE VIET NAM PROVINCIAL COMPETITIVENESS INDEX
Table 2.1 Post-Entry Regulatory Costs over Time
Year Over 5% of Time Spent on Bureaucratic Procedures (Share of Firms, %)
Inspections (Median) Harassment (5+ Inspections, %)
2010 56.6 2.00 19.9
2011 68.1 2.00 11.8
2012 79.4 2.00 12.9
2013 77.8 2.00 14.5
2014 70.2 2.00 17.5
2015 69.8 2.00 12.9
2016 71.9 2.00 23.8
2017 66.2 2.00 15.8
2018 42.6 2.00 9.8
2019 41.3 2.00 9.3
Source: PCI-FDI Question D1.1. “What percentage of senior management’s time per year is spent interacting with government officers in order to understand and comply with administrative procedures?” PCI-FDI Question D2.3. “How many total times was your business inspected/examined in LAST YEAR?”
While on aggregate, the trends appear to be positive, FIEs still complain about considerable challenges. As we were preparing the research instruments for 2019, we were contacted by foreign chambers of commerce asking us to look into what they believed were increasing regulatory inspections and tax audits by local authorities. This is apparent in Figure 2.17, where we asked firm to evaluate which agencies in their province placed the greatest burden on them through frequency of suspended work activity during inspections as well as subsequent fines and penalties. Fire and Safety, which was selected by 49 percent of respondents, and Tax Authority, which was selected by 37 percent of respondents, were clearly the most problematic. Adding the audit activities of the tax authority to its inspection activities indicates that 56 percent of businesses are concerned about disruptions in their business caused by these agencies. Customs (20 percent), Labor (20 percent), and Environment regulators were the next most cited groups.

95PCI 2019THE VIET NAM PROVINCIAL COMPETITIVENESS INDEX
Figure 2.17 Inspection Burden by Agency
11
3.9
2.3
13
19
37
17
4.6
20
20
7
0.95
49
0 10 20 30 40 50 60
Firms Selecting Agency (%)
Other
Planning and Investment
Construction
Food Safety and Sanitation
Audit
Tax Authority
Environment
Market Regulator
Labor Regulators
Customs
Economic Police
Transportation
Fire and Safety
Source: PCI-FDI Question D2.4,” Please list the agencies that inspected and examined your firm in last year?”
Figure 2.18 probes deeper into the inspection frustration for FIEs by charting the burden, measured by number of visits experienced by FIEs. The horizontal lines in the middle of each box present median scores (equal to the number of inspections divided by the number of hours spent on compliance of the 792nd ranked FIE in the sample) of a specific year. As the graph shows, the median FIE in Vietnam experienced about 2 regulatory inspections and 1.5 tax audits in the past year. The lower and upper edges of each box provide the scores at the 25th percentile (1 inspection and 1 audit) and the 75th percentile (3 inspections and 2 audits), respectively. The ends of the range bar provide the lowest (0 inspections and audits) and highest values (6 inspections and 3 audits) that are not outliers by standard statistical definitions. Dots outside the range bars are the outliers – provinces that scored extraordinarily low or high in a given year. These dots represent the individual firms that we consider to have experienced harassment in the past year. In some cases, this is because of legitimate regulatory compliance problems that need to be resolved. In other cases, the underlying motivation remains ambiguous.

96 PCI 2019 THE VIET NAM PROVINCIAL COMPETITIVENESS INDEX
The bottom line is that while inspections and audits are not a general problem for FIEs, the burden experienced by these activities is unequally distributed with some firms experiencing far more stringent regulatory enforcement than others.
Figure 2.18 Distribution of Inspections and Tax Audits (by Visits)
0
5
10
15
20
25
30
35
40
Num
ber o
f Visi
ts p
er Fi
rm
Full Distribution
Regulatory Inspections Tax Audits
1
2
3
4
5
6
7
8
9
10
Num
ber o
f Visi
ts p
er Fi
rm
Zoom In
Source: PCI-FDI D2 Q3 “How many total times was your business inspected/examined in LAST YEAR?“ PCI-FDI Section D2B Q6.1: “Thinking back over the past three years, have you had any tax payments audited and/or inspected? Audits/inspections can include payment of any tax or government fee, including corporate income taxes, value added taxes, and local servicing or licensing fees.” “If Yes, how many times were you audited/inspected in the past three years?”
Figure 2.19 extends the analysis to study manpower waste, measured by the average salaried hours per firm that were spent either meeting the requirements of the inspector or auditor. This analysis is necessary because measuring by a single inspection or audit can be misleading. Some regulatory visits last less than an hour, while others persist over days with regulators spending significant time inside the operation. Looking at manpower hours spent dealing with compliance yields the same pattern of relatively low overall regulatory enforcement but reveals some firms receive disproportionate attention from authorities. According to our data, the median regulatory inspection lasted 18 hours and the median audit lasted 32. The variance in the
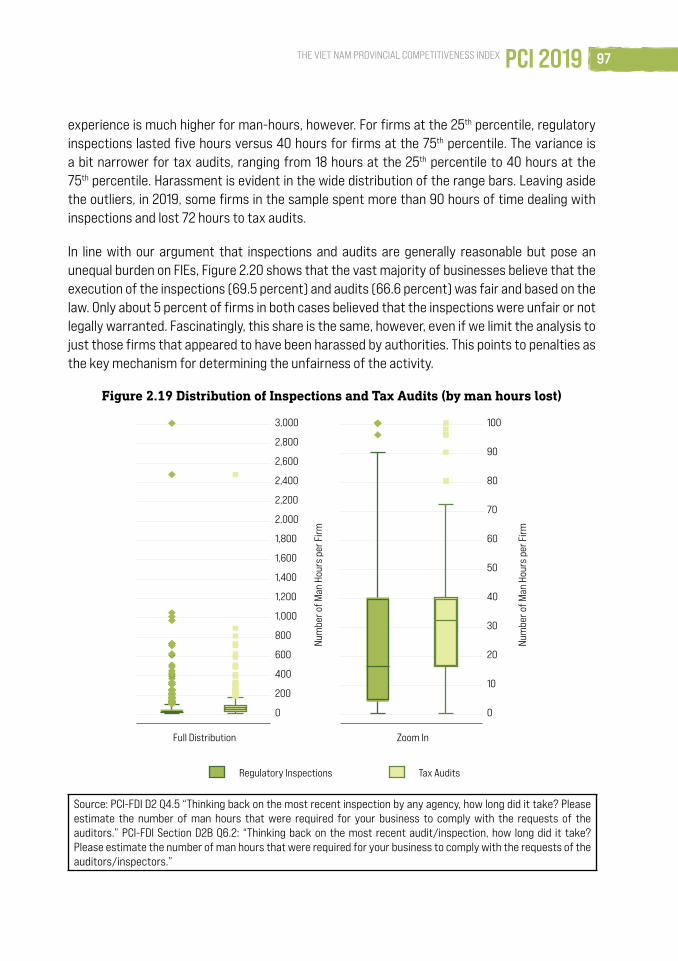
97PCI 2019THE VIET NAM PROVINCIAL COMPETITIVENESS INDEX
experience is much higher for man-hours, however. For firms at the 25th percentile, regulatory inspections lasted five hours versus 40 hours for firms at the 75th percentile. The variance is a bit narrower for tax audits, ranging from 18 hours at the 25th percentile to 40 hours at the 75th percentile. Harassment is evident in the wide distribution of the range bars. Leaving aside the outliers, in 2019, some firms in the sample spent more than 90 hours of time dealing with inspections and lost 72 hours to tax audits.
In line with our argument that inspections and audits are generally reasonable but pose an unequal burden on FIEs, Figure 2.20 shows that the vast majority of businesses believe that the execution of the inspections (69.5 percent) and audits (66.6 percent) was fair and based on the law. Only about 5 percent of firms in both cases believed that the inspections were unfair or not legally warranted. Fascinatingly, this share is the same, however, even if we limit the analysis to just those firms that appeared to have been harassed by authorities. This points to penalties as the key mechanism for determining the unfairness of the activity.
Figure 2.19 Distribution of Inspections and Tax Audits (by man hours lost)
0
200
400
600
800
1,000
1,200
1,400
1,600
1,800
2,000
2,200
2,400
2,600
2,800
3,000
Num
ber o
f Man
Hou
rs p
er Fi
rm
Full Distribution
0
10
20
30
40
50
60
70
80
90
100
Num
ber o
f Man
Hou
rs p
er Fi
rm
Zoom In
Regulatory Inspections Tax Audits
Source: PCI-FDI D2 Q4.5 “Thinking back on the most recent inspection by any agency, how long did it take? Please estimate the number of man hours that were required for your business to comply with the requests of the auditors.” PCI-FDI Section D2B Q6.2: “Thinking back on the most recent audit/inspection, how long did it take? Please estimate the number of man hours that were required for your business to comply with the requests of the auditors/inspectors.”

98 PCI 2019 THE VIET NAM PROVINCIAL COMPETITIVENESS INDEX
Figure 2.20 Regulatory Inspections and Audits Were Fair
Regulatory Inspections Tax Audits
Strongly agree Agree Neither agree nor disagree
Disagree Strongly disagree
54.0%
15.5%0.8%
3.6%
26.1%
58.1%
27.8%
4.7% 8.5%
0.8%
Source: PCI-FDI D2A.Q4.5.1 “To what extent do you agree with the following statement? “The inspection was con-ducted in a fair manner and based on the law.” PCI-FDI Section D2B Q6.4: “To what extent do you agree with the following statement? “The audits/inspections were fair and based on the law?”
Figures 2.21 through 2.24 focus more directly on the tax audit experience, which has received very little attention in previous work on foreign investment in Vietnam. Certainly, the government of Vietnam has important reasons for auditing firms. The country faces annual challenges in accumulating enough budget revenue to provide adequate public services for its citizens.54 And, as we have documented in past reports, transfer pricing and profit shifting remain constant threats to adequate revenue collection.55 The ability to fairly, efficiently, and comprehensively collect taxes (especially income and profit taxes) is a hallmark of a modern, developed state. At the same time, overly aggressive enforcement is burdensome for companies and can hamper management and technical innovation. It is also worth noting that the tax authority is not a provincial office and provincial authorities are constrained in their ability to influence tax collection.
We study audits by aggregating three different questions by the provincial location of the investment and the two-digit sector. These yes-or-no questions are: 1) Was your firm audited by the provincial tax authority in the past year?; 2) Did you receive a penalty afterward as a result of this audit?; and 3) If you received a penalty, was it fair? Dashed red lines in each graph indicate the national average score, allowing readers to determine where tax enforcement exceeds national standards. In sum, 37 percent of FIEs in the PCI-FDI survey were audited in 2018-2019. Of those, 87 percent received some form of penalty, which indicates extremely
54 OECD. 2019. Multidimensional Review of Vietnam, p70.55 Malesky, Edmund, 2015. “Transfer Pricing and Global Poverty.” International Studies Review, 17(4), pp.669-677.

99PCI 2019THE VIET NAM PROVINCIAL COMPETITIVENESS INDEX
strong enforcement. However, only 7 percent of penalized FIEs thought the judgement was unfair relative to the underlying violations that were discovered.
As the three following figures show, however, there are geographic and sectoral disparities in tax audits. The wood products sector also demonstrates a high degree of tax enforcement in Figure 2.21 with half of the 23 FIEs receiving audits. Ultimately, 80 percent of audited wood producing firms were penalized, and 12 percent believed the tax was unfair. On all three indicators, the tax enforcement experiences for FIEs in this sector exceed or are very close to the national average.
Figure 2.21 Audit Experience by Sector
0 20 40 60 80Share Audited (%)
Mining
Professional Services
Others Services
Real Estate
Wholesale/Retail
M:Machinery
Electricity/Gas/AC
Edu/Healths/Labour services
Financial/Insurance
Construction
M:Chemicals
M:Motor Vehicles
Agriculture/Aquaculture
Information/Communication
M:Rubber/Plastics
M:Textiles
M:Electronic Equip.
M:Fabricated Metals
M:Leather
M:Computers/Electronics
M:Garments
M:Food Processing
M: Other
M:Paper Products
M:Basic Metals
M:Furniture
M:Wood Products
Audits
0 20 40 60 80 100Share Penalized (%)
Real Estate
Financial/Insurance
M:Furniture
M:Electronic Equip.
M:Leather
Electricity/Gas/AC
M:Motor Vehicles
M:Chemicals
Wholesale/Retail
M:Wood Products
M:Machinery
M:Basic Metals
Edu/Healths/Labour services
M:Textiles
M:Garments
M: Other
Information/Communication
M:Fabricated Metals
M:Rubber/Plastics
M:Computers/Electronics
Others Services
Agriculture/Aquaculture
M:Food Processing
M:Paper Products
Construction
Professional Services
Penalty
0 10 20Share Unfair (%)
M:Paper Products
M:Basic Metals
M:Electronic Equip.
M:Machinery
M:Motor Vehicles
M:Furniture
Construction
Wholesale/Retail
Information/Communication
Real Estate
Professional Services
Others Services
M:Rubber/Plastics
M: Other
M:Textiles
M:Garments
Financial/Insurance
M:Food Processing
M:Chemicals
Electricity/Gas/AC
M:Wood Products
M:Computers/Electronics
M:Fabricated Metals
M:Leather
Agriculture/Aquaculture
Edu/Healths/Labour services
Unfair
Source: FDI Section D2B Q6 “Thinking back over the past three years, have you had any tax payments audited and/or inspected? Audits/inspections can include payment of any tax or government fee, including corporate income taxes, value added taxes, and local servicing or licensing fees.” D2B Q6.3 “Did you receive a fine or penalty as a result of the audit/inspection?” D2B Q6.4. “To what extent do you agree with the following statement? “The audits/inspections were fair and based on the law?”

100 PCI 2019 THE VIET NAM PROVINCIAL COMPETITIVENESS INDEX
Figure 2.22 summarizes all three indicators into a weighted scatter plot by two-digit sector, plotting the share of firms in each sector audited on the x-axis, the share of firms penalized on the y-axis, and weighting the circles by the share of firms believing the penalty was unfair. Again, we plot national averages with red dashed lines, allowing readers to observe which sectors experienced unusual enforcement (or lack thereof). Two groups of sectors stand out in this regard. Food processing, paper products, computers and electronics, fabricated metals, and rubber and plastics appear as sectors that have higher than average enforcement on all three indicators. However, another group of sectors is notable for average or below average levels of audit activity but high shares of firms citing unfair enforcement. These are firms manufacturing leather or electronic equipment, and those offering health, labor, or educational services.
Figure 2.22 Audit Experience by Sector Combined
Agriculture/AquacultureM:Food Processing
M:Textiles
M:Garments
M:Leather
M:Wood Products
M:Paper Products
M:Chemicals
M:Rubber/Plastics
M:Basic Metals
M:Fabricated MetalsM:Computers/Electronics
M:Electronic Equip.
M:Machinery
M:Motor Vehicles
M:Furniture
M: Other
Electricity/Gas/AC
Construction
Wholesale/Retail
Information/Communication
Financial/Insurance
Real Estate
Professional Services
Others Services
Edu/Healths/Labour services
3540
4550
5560
6570
7580
8590
9510
0Pe
naliz
ed (%
)
0 5 10 15 20 25 30 35 40 45 50 55
Audited (%)Bubble size= Share Unfair (%); mean=6.2%
Source: FDI Section D2B Q6 “Thinking back over the past three years, have you had any tax payments audited and/or inspected? Audits/inspections can include payment of any tax or government fee, including corporate income taxes, value added taxes, and local servicing or licensing fees.”D2B Q6.3 “Did you receive a fine or penalty as a result of the audit/inspection?” D2B Q6.4. “To what extent do you agree with the following statement? “The audits/inspections were fair and based on the law?”
Figures 2.23 and 2.24 apply the same disaggregated analysis to tax enforcement at the provincial level. To be clear, the tax burden is not created by provincial or local authority, as tax is a technical field that remains more centralized than other administrative activities. Certainly, tax enforcement at the provincial level is highly correlated with both the sectoral composition of the investment cluster and the concentration of investment activity.

101PCI 2019THE VIET NAM PROVINCIAL COMPETITIVENESS INDEX
In the lower right corner of Figure 2.24 are the provinces that endure a large number of audits but find the process to be relatively fair, as less than 7 percent of FIEs in those areas complain about biased treatment. These include Ba Ria - Vung Tau (BRVT), Dong Nai, Vinh Phuc, Hai Duong, and Bac Ninh. The upper right section presents three provinces (Binh Duong, Lam Dong, Quang Nam) that have an above average share of audits and firms finding the process unfair. As with the sectoral discussion above, however, the most concerning province is Bac Giang. FIEs in that province report a below-average number of audits, but express significantly higher frustration with their treatment. The large bubble on Bac Giang also indicates that a relatively higher share of firms felt the process was unfair
Figure 2.23 Audit Experience by Province
0 20 40
Share Audited (%)
Da Nang
Ha Noi
Binh Phuoc
Hung Yen
Bac Giang
HCMC
Ha Nam
Thai Nguyen
Hai Phong
Quang Nam
Long An
Lam Dong
Hai Duong
Bac Ninh
Binh Duong
Tay Ninh
Binh Thuan
Dong Nai
Khanh Hoa
Vinh Phuc
BRVT
Audits
0 20 40 60 80 100
Share Penalized (%)
Da Nang
Long An
Binh Thuan
Vinh Phuc
Hung Yen
Ha Noi
HCMC
Dong Nai
Bac Giang
Ha Nam
Lam Dong
Quang Nam
BRVT
Binh Duong
Hai Phong
Tay Ninh
Hai Duong
Bac Ninh
Khanh Hoa
Binh Phuoc
Thai Nguyen
Penalty
0 10 20
Share Unfair (%)
Khanh Hoa
Binh Phuoc
Tay Ninh
Binh Thuan
Hung Yen
Thai Nguyen
Hai Phong
Dong Nai
Hai Duong
BRVT
Vinh Phuc
Bac Ninh
Ha Noi
HCMC
Quang Nam
Binh Duong
Lam Dong
Da Nang
Long An
Ha Nam
Bac Giang
Unfair
Source: FDI Section D2B Q6 “Thinking back over the past three years, have you had any tax payments audited and/or inspected? Audits/inspections can include payment of any tax or government fee, including corporate income taxes, value added taxes, and local servicing or licensing fees.”D2B Q6.3 “Did you receive a fine or penalty as a result of the audit/inspection?” D2B Q6.4. “To what extent do you agree with the following statement? “The audits/inspections were fair and based on the law?”
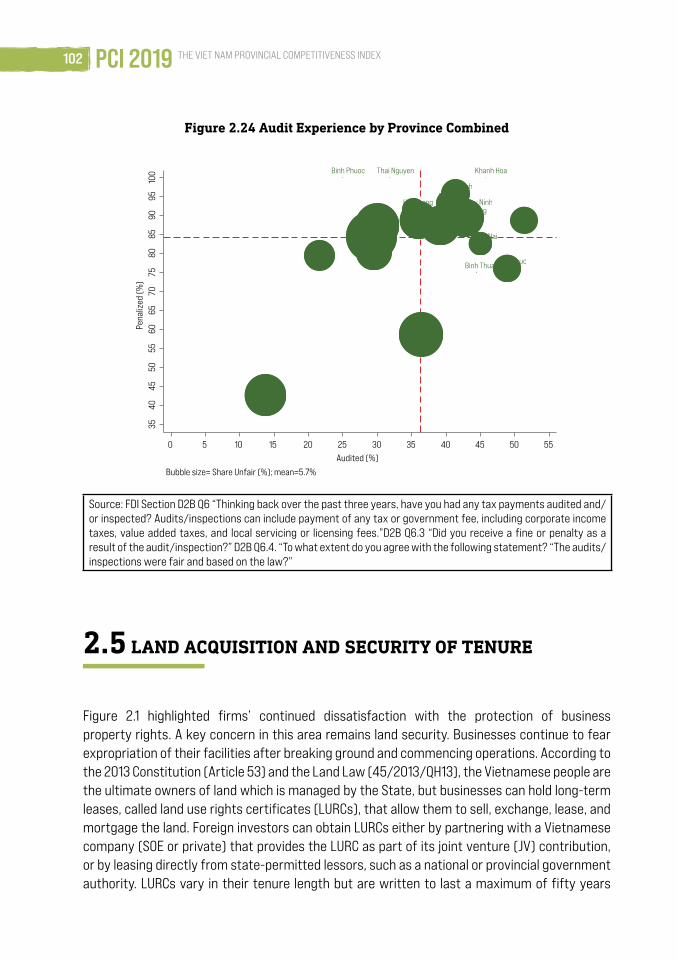
102 PCI 2019 THE VIET NAM PROVINCIAL COMPETITIVENESS INDEX
Figure 2.24 Audit Experience by Province Combined
Ha Noi
Hai Phong
Da Nang
HCMC
Quang Nam
Khanh HoaBinh Phuoc
Tay Ninh
Long An
BRVT
Bac Ninh
Binh Duong
Binh Thuan
Dong Nai
Ha Nam
Hai Duong
Hung Yen Vinh Phuc
Bac GiangLam Dong
Thai Nguyen
3540
4550
5560
6570
7580
8590
9510
0Pe
naliz
ed (%
)
0 5 10 15 20 25 30 35 40 45 50 55Audited (%)
Bubble size= Share Unfair (%); mean=5.7%
Source: FDI Section D2B Q6 “Thinking back over the past three years, have you had any tax payments audited and/or inspected? Audits/inspections can include payment of any tax or government fee, including corporate income taxes, value added taxes, and local servicing or licensing fees.”D2B Q6.3 “Did you receive a fine or penalty as a result of the audit/inspection?” D2B Q6.4. “To what extent do you agree with the following statement? “The audits/inspections were fair and based on the law?”
2.5 LAND ACQUISITION AND SECURITY OF TENURE
Figure 2.1 highlighted firms’ continued dissatisfaction with the protection of business property rights. A key concern in this area remains land security. Businesses continue to fear expropriation of their facilities after breaking ground and commencing operations. According to the 2013 Constitution (Article 53) and the Land Law (45/2013/QH13), the Vietnamese people are the ultimate owners of land which is managed by the State, but businesses can hold long-term leases, called land use rights certificates (LURCs), that allow them to sell, exchange, lease, and mortgage the land. Foreign investors can obtain LURCs either by partnering with a Vietnamese company (SOE or private) that provides the LURC as part of its joint venture (JV) contribution, or by leasing directly from state-permitted lessors, such as a national or provincial government authority. LURCs vary in their tenure length but are written to last a maximum of fifty years

103PCI 2019THE VIET NAM PROVINCIAL COMPETITIVENESS INDEX
(seventy years is possible under special circumstances), and can be renewed after expiration. A third group of FIEs obtain their business premises through short term rental or leases that are renewed on an annual or biannual basis.
Figure 2.25 presents the documentation of land tenure for FIEs according to these three broad categories below. Navy represents autonomous LURC holders; JV partners are shown in light blue; and short-term leases and rental arrangements are depicted in gray. Two clear trends are evident in the data. There is a sharp jump in formal LURC possession after the promulgation of the 2013 Land Law (from 26.2 percent in 2012 to a high of 38.8 percent in 2016), which corresponds with a decline in short-term rentals (from 72.2 percent in 2012 to a low of 56 percent in 2016). Since 2017, however, these trends have reversed slightly, which is disconcerting as LURCs represent the most secure documentation. At the same time, we have seen a slight rise among FIEs strategically using joint ventures to obtain land.
Figure 2.25 Type of Land Tenure
28.8
65.0
6.1
26.2
72.2
1.6
27.3
69.8
3.0
37.3
58.7
4.1
35.2
60.8
4.0
38.8
55.9
5.4
37.3
57.0
5.7
35.1
59.1
5.8
31.4
62.6
6.1
020406080100
020406080100
020406080100
2011 2012 2013
2014 2015 2016
2017 2018 2019
Have LURC Rent/Lease JV Partner Owns
Source: FDI Section QC.3 “Do you have a land use rights certificate (LURC) for this plot of land?”• Yes (Please answer questions C3.1 and C3.2) • No, we rent or lease land (Please skip to question C4)• No, LURC held by joint venture partner (Please skip to question C4)

104 PCI 2019 THE VIET NAM PROVINCIAL COMPETITIVENESS INDEX
Following implementation of the Land Law in 2013, we have seen a rise in another form of LURC acquisition, which entails leasing or sub-leasing the certificate itself from the landlord of an industrial zone. Figure 2.26 shows that, historically, the share of FIEs in industrial zones has remained fairly constant with roughly half of FIEs being inside and half outside the IZ.
Figure 2.26 Use of Industrial Zones over Time
52.8
47.2
48.6
51.4
51.7
48.3
50.2
49.8
50.7
49.3
47.1
52.9
47.7
52.3
48.9
51.1
49.0
51.0
020406080100
020406080100
020406080100
2011 2012 2013
2014 2015 2016
2017 2018 2019
Outside IZ In IZ
Source: FDI Section QC.2 “Is there any part of your firm’s business premise that is located within an industrial zone/concentration area?”
However, there has been a sharp increase in the share of firms obtaining their LURC by leasing it second-hand from the industrial zone (IZ) landlord or management authority as opposed to acquiring a primary lease from the national or provincial government authority. This can best be seen in Figure 2.27 which illustrates that before the 2013 Land Law only 36.5 percent of PCI-FDI respondents located in an industrial zone had a LURC, compared to 50.5 percent afterward. A corresponding decline in short-term leases is also visible among those in industrial zones, but not those outside.

105PCI 2019THE VIET NAM PROVINCIAL COMPETITIVENESS INDEX
Figure 2.27 Increasing LURC Acquisition in Industrial Zones
19.1
75.5
5.3
36.5
61.3
2.2
0
20
40
60
80
100
Outside IZ In IZ
Have LURC Rent/Lease JV Partner Owns
2010-2013
19.9
72.9
7.3
50.5
46.2
3.3
0
20
40
60
80
100
Outside IZ In IZ
2014-2019
Source: FDI Section QC.2 “Is there any part of your firm’s business premise that is located within an industrial zone/concentration area?” QC.3 “Do you have a land use rights certificate (LURC) for this plot of land?”
The changes we observe in forms of LURC possession appear to correspond with views about the security of property rights. Figure 2.28 probes a historical question, where respondents have been asked to consider the risk of expropriation of their operations. Firms answer on a five-point Likert scale ranging from 1 (Very Low) to 5 (Very High). Before the promulgation of the 2013 Land Law, the likelihood of expropriation was considered to be moderately high. In 2012, for instance, only 47.1 percent of firms answered that expropriation risk was low or very low. Immediately after the promulgation of the Land Law, however, we see a tremendous change in this perspective. In 2014, a combined 80.3 percent of FIEs answered that expropriation risk was low or very low. This trend has persisted to 2019, where 79.5 percent of firms rank expropriation risk as low or very low, with over half considering it to be very low.
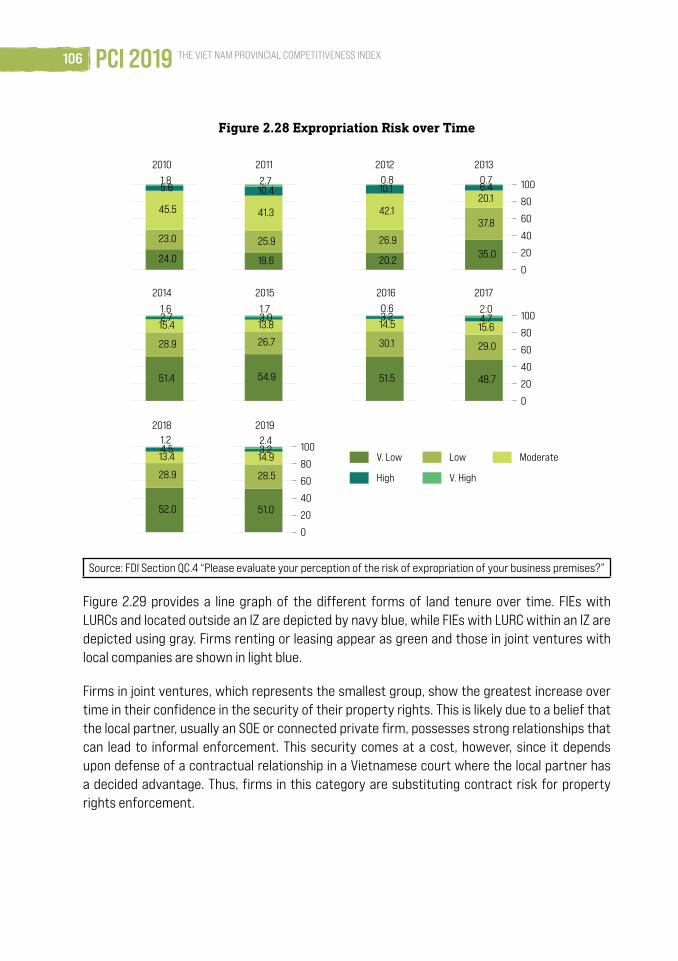
106 PCI 2019 THE VIET NAM PROVINCIAL COMPETITIVENESS INDEX
Figure 2.28 Expropriation Risk over Time
24.0
23.0
45.5
5.61.8
19.6
25.9
41.3
10.42.7
20.2
26.9
42.1
10.10.8
35.0
37.8
20.16.40.7
51.4
28.9
15.42.71.6
54.9
26.7
13.83.01.7
51.5
30.1
14.53.20.6
48.7
29.0
15.64.72.0
52.0
28.9
13.44.51.2
51.0
28.5
14.93.22.4
0
20
40
60
80
100
0
20
40
60
80
100
0
20
40
60
80
100
2010 2011 2012 2013
2014 2015 2016 2017
2018 2019
V. Low Low Moderate
High V. High
Source: FDI Section QC.4 “Please evaluate your perception of the risk of expropriation of your business premises?”
Figure 2.29 provides a line graph of the different forms of land tenure over time. FIEs with LURCs and located outside an IZ are depicted by navy blue, while FIEs with LURC within an IZ are depicted using gray. Firms renting or leasing appear as green and those in joint ventures with local companies are shown in light blue.
Firms in joint ventures, which represents the smallest group, show the greatest increase over time in their confidence in the security of their property rights. This is likely due to a belief that the local partner, usually an SOE or connected private firm, possesses strong relationships that can lead to informal enforcement. This security comes at a cost, however, since it depends upon defense of a contractual relationship in a Vietnamese court where the local partner has a decided advantage. Thus, firms in this category are substituting contract risk for property rights enforcement.

107PCI 2019THE VIET NAM PROVINCIAL COMPETITIVENESS INDEX
Firms obtaining their LURCs within the industrial zone show the next largest rise. By 2019, 85 percent of firms with these certificates rank expropriation risk as low, statistically indistinguishable from those in JVs. By contrast, firms with LURCs outside the industrial zone have not been as confident, averaging around 75 percent claiming low risk, for most of the post-2013 period. It seems that firms in the industrial zones have greater confidence in industrial zone managers to uphold the property right. They do see a sharp jump upwards in 2019, which is a positive sign, but we cannot be sure about the sustainability of this trend. Firms renting and leasing property have hovered at about 80 percent confidence in the surety of their tenancy, but this appears to be trending slightly downward in recent years.
Figure 2.29 Expropriation Risk over Time by Tenure Type
0
10
20
30
40
50
60
70
80
90
100
Shar
e An
swer
ing
Low
Exp
ropr
iatio
n Ri
sk (%
)
2011 2012 2013 2014 2015 2016 2017 2018 2019
LURC outside IZ
LURC inside IZ
Rent/Lease
JV Partner Owns
Source: FDI Section QC.4 “Please evaluate your perception of the risk of expropriation of your business premises?” QC.3 “Do you have a land use rights certificate (LURC) for this plot of land?” QC.2 “Is there any part of your firm’s business premise that is located within an industrial zone/concentration area?”

108 PCI 2019 THE VIET NAM PROVINCIAL COMPETITIVENESS INDEX
2.6 CORRUPTION
Since taking charge in 2016, the new central administration has been aggressively tackling corruption and informal charges in government-business interactions, with policy measures such as Resolution 35/NQ-CP on supporting the development of enterprises toward 2020.56 As a further step, Resolution 139/NQ-CP, issued in November 2018, specifies five specific goals to reduce the cost of doing business. One of these targets is to halve, by 2020, the share of all firms reporting in the PCI that they have to pay informal fees.
The 2017 and 2018 PCI reports drew attention to significant declines in corrupt behavior among FIEs. Progress continued and even accelerated this year, as can be seen in Table 2.2. While 45.8 percent of firms had to pay informal charges to inspectors in 2016, this dropped to 44.9 percent in 2017, 39.9 percent in 2018, and reached a low of 32.5 percent in 2019. The share of firms having to pay a bribe during customs procedures declined from 56.4 percent in 2016 to 42.5 percent in 2019. More than one-fifth of FIEs paid bribes during land transactions in 2016. In 2019, the number rose more than three percentage points above the 2018 level, but remained at less than half the 2016 figure.
One important effect of the reduction in corruption is firms’ attitude toward regulations. Recent achievements in reducing informal charges have affected FIE’s perception of regulations as an excuse for rent seeking. According to Table 2.2, the share of FIEs agreeing with the statement that regulations are a pretext for bribery dropped from its 2014 high of 59.9 percent to a much-improved 33.7 percent in 2019.
56 Nguyen, P. X. (2016, May 16). On support and development of businesses until 2020. Thu Vien Phap Luat. Retrieved from https://thuvienphapluat.vn/van-ban/Doanh-nghiep/Nghi-quyet-35-NQ-CP-ho-tro-phat-trien-doanh-nghiep-2020-2016-311331.aspx

109PCI 2019THE VIET NAM PROVINCIAL COMPETITIVENESS INDEX
Table 2.2 Bribe Payments over Time
Type of Informal Charge
Year
Regulations are an excuse for
bribery (percent agree)
Paid informal charges to inspectors
(percent agree)
Bribe during customs
procedures (percent agree)
Bribe during land procedures (percent agree)
Bribes were a deterrent to using
courts (percent agree)
Service delivered after bribe
payment (percent agree)
Question D3 Q7 D2 Q4.2 M Q5.1 C Q5.2 I Q3 D3 Q9
2010 32.0 64.9 9.3 48.0
2011 23.9 52.9 5.2 46.1
2012 24.2 56.2 13.1 54.7
2013 44.0 58.6 14.5 59.0
2014 59.9 66.2 21.9 58.2
2015 58.8 66.5 23.9 59.1
2016 49.7 45.8 56.4 22.6 18.7 45.3
2017 44.6 44.9 53.0 17.5 18.9 50.3
2018 36.5 39.9 44.4 6.8 14.3 49.0
2019 33.7 32.5 42.5 10.0 14.9 44.5
Cost of Informal Charges (Amount as Percentage of Annual Income, D3 Q8)
Year 0 percent <1 percent 1-2 percent 2-5 percent 5-10 percent >10 percent
2010 21.8 40.4 16.7 11.4 7.0 2.6
2011 30.2 33.7 20.0 7.7 6.7 1.6
2012 30.0 41.0 17.4 8.3 2.6 0.8
2013 19.7 48.5 18.3 8.7 3.1 1.7
2014 18.7 42.7 20.4 11.8 4.5 1.9
2015 16.4 44.5 18.2 12.8 6.4 1.8
2016 25.9 43.9 15.2 8.8 4.1 2.1
2017 31.3 41.1 14.4 6.8 3.8 2.6
2018 37.5 39.8 14.6 4.8 1.8 1.5
2019 36.6 40.0 13.1 6.0 2.8 1.4
FIEs’ responses on the costs of informal charges did not follow the same declining trend as other indicators. As Figure 2.30 shows, at the end of the last administration in 2015, FIEs paid bribes equal to about 1.69 percent of their annual sales revenue. This number dropped steadily during the anti-corruption campaign, reaching a low of 1.04 percent in 2018. In 2019, the bribe cost increased slightly to 1.11 percent, but remains very low compared with past levels. Moreover, the overlapping confidence intervals indicate the cost of bribery is not significantly different than it was in 2018.
The impact of the anti-corruption campaign on the bottom lines for businesses is significant. We can even use a straightforward back-of-the-envelope calculation to estimate the cost savings

110 PCI 2019 THE VIET NAM PROVINCIAL COMPETITIVENESS INDEX
of the anti-corruption campaign for businesses.57 Trade economists estimate that export earnings of FIEs in Vietnam was about USD181.35 billion.58 Using this number as a proxy revenue, we can calculate that the unofficial cost of doing business is 1.1 billion USD lower today than in 2015.59 This is a net savings for foreign exporters that can be productively applied to workers’ salaries, innovation, and even formal domestic taxes.
The bottom line is that Vietnam’s anti-corruption campaign has been successful at reducing the scale of bribery experienced by foreign investors, lowering the financial risk they face by engaging in business in the country.
Figure 2.30 Costs of Bribery over Time
0
.25
.5
.75
1
1.25
1.5
1.75
2
2.25
2.5
2.75
3
Aver
age
Size
of B
ribe
Paym
ents
/Rev
enue
(%)
2010 2011 2012 2013 2014 2015 2016 2017 2018 2019
Source: FDI Section QD3.8 “On average, what percentage of income do firms in your line of business typically pay per year for informal charges to public official?”
One concern with Table 2.2, however, is that we may only be capturing reductions in petty corruption due to the anti-corruption campaign. Grand corruption is less visible, harder to detect, and generally charged to elite firms engaging in procurement, trying to enter restricted
57 Nguyen, T.V., Ho, B.D., Le, C.Q. and Nguyen, H.V., 2016. Strategic and transactional costs of corruption: perspectives from Vietnamese firms. Crime, Law and Social Change, 65(4-5), pp.351-374.
58 General Statistical Office. 2019. “Socio-Economic Situation in 2019.” Hanoi, Vietnam. <https://www.gso.gov.vn/default_en.aspx?tabid=622&ItemID=19463>
59 .0169*181.35=3.1 billion; .011*181.35=2 billion.
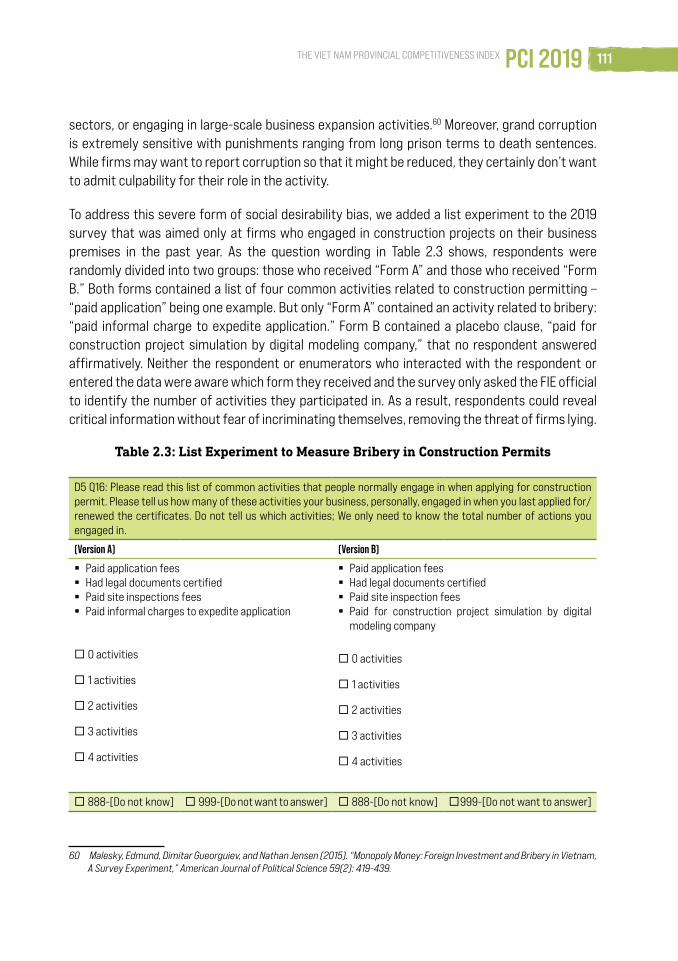
111PCI 2019THE VIET NAM PROVINCIAL COMPETITIVENESS INDEX
sectors, or engaging in large-scale business expansion activities.60 Moreover, grand corruption is extremely sensitive with punishments ranging from long prison terms to death sentences. While firms may want to report corruption so that it might be reduced, they certainly don’t want to admit culpability for their role in the activity.
To address this severe form of social desirability bias, we added a list experiment to the 2019 survey that was aimed only at firms who engaged in construction projects on their business premises in the past year. As the question wording in Table 2.3 shows, respondents were randomly divided into two groups: those who received “Form A” and those who received “Form B.” Both forms contained a list of four common activities related to construction permitting – “paid application” being one example. But only “Form A” contained an activity related to bribery: “paid informal charge to expedite application.” Form B contained a placebo clause, “paid for construction project simulation by digital modeling company,” that no respondent answered affirmatively. Neither the respondent or enumerators who interacted with the respondent or entered the data were aware which form they received and the survey only asked the FIE official to identify the number of activities they participated in. As a result, respondents could reveal critical information without fear of incriminating themselves, removing the threat of firms lying.
Table 2.3: List Experiment to Measure Bribery in Construction Permits
D5 Q16: Please read this list of common activities that people normally engage in when applying for construction permit. Please tell us how many of these activities your business, personally, engaged in when you last applied for/renewed the certificates. Do not tell us which activities; We only need to know the total number of actions you engaged in.
(Version A) (Version B)
� Paid application fees � Had legal documents certified � Paid site inspections fees � Paid informal charges to expedite application
� 0 activities
� 1 activities
� 2 activities
� 3 activities
� 4 activities
� Paid application fees � Had legal documents certified � Paid site inspection fees � Paid for construction project simulation by digital
modeling company
� 0 activities
� 1 activities
� 2 activities
� 3 activities
� 4 activities
� 888-[Do not know] � 999- [Do not want to answer] � 888-[Do not know] �999- [Do not want to answer]
60 Malesky, Edmund, Dimitar Gueorguiev, and Nathan Jensen (2015). “Monopoly Money: Foreign Investment and Bribery in Vietnam, A Survey Experiment,” American Journal of Political Science 59(2): 419-439.

112 PCI 2019 THE VIET NAM PROVINCIAL COMPETITIVENESS INDEX
D5: Q16.1 Now, tell us the total cost of these activities for your business. Remember, we only need to know the total cost of all fees, not the cost of any individual fee.
(Version A) (Version B)
� Paid application fees � Had legal documents certified � Paid site inspections fees � Paid informal charges to expedite application
Million VND
� Paid application fees � Had legal documents certified � Paid site inspection fees � Paid for construction project simulation by digital
modeling company
Million VND
� 888-[Do not know] � 999-[Do not want to answer] � 888-[Do not know] � 999-[Do not want to answer]
The difference in means between the forms provides the share of firms that participated in the sensitive activity – in this case, paying informal charges. For instance, as shown in Figure 2.31, firms receiving Form A reported 2.43 payment activities on average, compared to 1.95 for those answering Form B. The difference between these means is .48 (2.43-1.95), indicating 48 percent of firms that received a construction license in 2019 paid a bribe to expedite its reception. This represents a significant share of informal charges associated with the activity. Importantly, this is likely an under-estimation of the true scope of bribery, because firms that did not want to pay likely refrained from applying for a new permit while others may have chosen to engage in illegal construction and avoid the permitting process entirely.
We pushed the analysis a bit further by asking firms to disclose the prices they paid for each of the listed activities. To constrain disparate costs associated with widely varying firm and construction project sizes, we transformed the number using the natural log. The distribution of the total cost of administrative procedures to obtain a construction permit is shown in Figure 2.32. The kernel density plot behind the histogram illustrates that the cost is significantly higher for those answering Form A than Form B. To put a finer point on this, just under 60 percent of those answering Form B are in the smallest of the five bins (-2 to 0), representing payments between 130,000 to 1 million VND ($5.60 to $43 USD). Just over 45 percent of Form A respondents are in this lowest bin. By contrast, 26 percent of FIEs receiving Form A are in the fourth bin (3.5 to 5), representing a total payment between 33 million and 148 million VND (1,419 to 6,365 USD). Only 15 percent of FIEs receiving Form B are in that group.
The two dashed lines in each graph depict the average total payment for FIEs receiving Form A (red=.68) and Form B (purple=-.005). The difference between them illustrates that, on average, firms receiving Form A report 24 million VND (1,043 USD) in higher construction-related payments than those receiving Form B. Like above, the difference in means provides the size of the bribe payment.

113PCI 2019THE VIET NAM PROVINCIAL COMPETITIVENESS INDEX
In sum, our analysis illustrates that substantial construction-related bribery payments occurred in 2019. Roughly 48 percent of firms who engaged in this form of grand corruption paid bribes averaging a little over $1,000 per firm.
Figure 2.31 Calculation of Share of Foreign Firms Bribing for Construction Permits
2.425
1.951
48% Bribe
1
1.2
1.4
1.6
1.8
2
2.2
2.4
2.6
2.8
3
Num
ber o
f Act
iviti
es d
urin
g Co
nstr
uctio
n
95% CI Treatment Mean
95% CI Control Mean
95% CI for Bribe Frequency
Bribe frequency of 48 percent is calculated by the difference in means between the two forms on how many activities the business engaged in when completing construction permitting procedures. Source: FDI Section D5 Q16 “Please read this list of common activities that people normally engage in when applying for construction permit. Please tell us how many of these activities your business, personally, engaged in when you last applied for/renewed the certificates. Do not tell us which activities; We only need to know the total number of actions you engaged in.”

114 PCI 2019 THE VIET NAM PROVINCIAL COMPETITIVENESS INDEX
Figure 2.32 Calculation of Cost of Bribes for Construction Permits
05
101520253035404550556065
-5 -4 -3 -2 -1 0 1 2 3 4 5 6 7 8 -5 -4 -3 -2 -1 0 1 2 3 4 5 6 7 8
Form A Form B
Percent Kernel Density
Perc
ent
Size of Construction Service Payments(Millions of VND, ln)
Average bribe size is 24 Million VND, which calculated by the difference in means between the two forms on how much the business paid when completing construction permitting procedures. Source: FDI Section D5 Q16.1 “Now, tell us the total cost of these activities for your business. Remember, we only need to know the total cost of all fees, not the cost of any individual fee.” The dashed red line represents the average payment of those receiving the bribe treatment, the dashed purple line represents the control group.

115PCI 2019THE VIET NAM PROVINCIAL COMPETITIVENESS INDEX
2.7 CONCLUSIONS
This year’s PCI-FDI survey analyzes the perceptions and experiences of 1,583 FIEs from 52 countries, which invested in the 21 wealthiest provinces and cities in the country. While FIEs continue to report dissatisfaction with a number of key features of the Vietnamese investment environment, particularly insufficient contracting institutions caused by the lack of an independent legal system, the survey finds an enormous amount to be positive about. Many economic reforms launched over the past decade are clearly bearing fruit.
Administrative changes that began with the 2000 Enterprise Law and 2005 Unified Investment Law continue today. The 2014 Investment Law in particular significantly reduced the bureaucratic costs of investing in Vietnam. In 2019, 92 percent of FIEs obtained all the necessary paperwork to fully operate their businesses within three months. Since 2015, waiting periods for initial licenses have dropped from 60 days on average to less than 40, average registration certificate wait times have dropped from 36 days to 20, renewals have declined from 35 days to 25, and tax code acquisition has decreased from 22 days to just under 20. In sum, regulatory improvements over the past four years have saved businesses 38 days in start-up time.
We also document a tremendous reduction in perceptions of expropriation risk after the promulgation of the 2013 Land Law. FIEs reporting expropriation risk as low or very low increased from an average of 47.1 percent in 2012 to 79.5 percent in 2019. Expropriation risk reduction is most pronounced among firms that received a Land Use Rights Certificate (LURC) from their industrial zone manager. Before the Land Law only 37 percent of firms inside IZs had LURCs, but 51 percent have them in 2019.
We demonstrate that on almost every indicator of informal charges during licensing, land acquisitions, regulatory inspections, and court procedures, corruption has declined far below its 2016 peak, which is a credit to the government’s ongoing anti-corruption campaign. Indeed, the average bribe payment for FIEs has declined from 1.6 percent of sales in 2016 to 1.1 percent in 2019, a 31 percent decline in the overall cost of bribery for investors. This is money that can be more productively used to innovate, hire, and expand.
Efforts made by the Vietnamese leadership are clearly transforming the ways foreign investors interact with the state, reducing the costs of doing business and alleviating their fears about regulatory risk. However, it is important to note that these reforms were crafted for a different generation of FIEs. The country’s own economic growth, burgeoning middle class, and increased technical sophistication, combined with changes in the global economy (most notably US tariffs on Chinese goods), are incrementally changing the composition and size of FDI. In particular, we

116 PCI 2019 THE VIET NAM PROVINCIAL COMPETITIVENESS INDEX
are seeing greater entry and business expansion by firms producing higher technology goods. These firms will need different sets of policies from the state in order to thrive.
Two areas of particular concern arise from this year’s analysis. First, Vietnam’s regulatory system needs to become more efficient and professional. In general, the regulatory burden (particularly safety and tax audits) is not overwhelming. The median FIEs experience two inspections and 1.5 audits per year. However, a small set of firms, many of them the country’s most dynamic foreign investors, bear an unfair share of the compliance costs.
Second, despite the demonstrable successes of the anti-corruption campaign, bribery does remain relatively frequent in particular areas, such as construction permitting. Using a specialized survey experiment that shields respondents from culpability, we find that 48 percent of FIEs who applied for construction permits in the past year paid bribes to acquire them at an additional average cost of 24 million VND ($1,043) per permit. Critically, these numbers represent a lower bound because they do not include FIEs who did not apply for new construction licenses because they were worried about the additional informal charges. The clear danger is that grand corruption of this type may inhibit expansion activities on the part of existing investors.
In sum, Vietnamese authorities have shown a willingness to work hard and innovate to improve the nation’s attractiveness as a destination for foreign investment. These efforts have led to more productive operations willing to take larger risks within the country and a changing composition of investors as more and more high tech firms enter the country. The next generation of Vietnamese leaders will need to maintain their innovation and reform-minded approach to tackle the new challenges brought by the evolving investment landscape.

117PCI 2019THE VIET NAM PROVINCIAL COMPETITIVENESS INDEX
2.8 APPENDIX
Figure 2.33 PCI-FDI Respondents by Country of Origin
10
20
20
20
21
24
26
41
59
72
86
264
344
371
0 250 500
Netherlands
Australia
Germany
Malaysia
Thailand
France
United Kingdom
United States
Hong Kong
Singapore
China
Taiwan
South Korea
Japan
2016
15
16
17
18
23
26
30
55
90
91
215
439
505
0 250 500
United Kingdom
Germany
France
Australia
Malaysia
Thailand
United States
Hong Kong
Singapore
China
Taiwan
Japan
South Korea
2017
11
13
13
17
25
34
43
66
96
183
408
459
0 250 500
United Kingdom
Australia
France
Thailand
Malaysia
United States
Hong Kong
Singapore
China
Taiwan
Japan
South Korea
2018
10
10
11
14
19
22
28
50
59
82
172
409
471
0 250 500
Germany
United Kingdom
Australia
France
Thailand
Malaysia
United States
Hong Kong
Singapore
China
Taiwan
Japan
South Korea
2019
Number of Firms from Each Country
Source: FDI Introduction: “Country where the headquarters of the mother company or biggest FOREIGN investor is located?” If missing, we supplement with “Manager’s country of origin”

118 PCI 2019 THE VIET NAM PROVINCIAL COMPETITIVENESS INDEX
Figure 2.34 Number of Firms Surveyed in Each Province over Time
24
34
36
38
40
52
63
65
93
101
146
250
265
305
0 250 500
Tay Ninh
Bac Giang
Da Nang
BRVT
Vinh Phuc
Hung Yen
Hai Duong
Bac Ninh
Hai Phong
Long An
Dong Nai
Ha Noi
HCMC
Binh Duong
2016
6
8
19
28
32
32
34
37
41
42
48
51
57
71
76
78
96
183
239
288
299
0 250 500
Binh Phuoc
Binh Thuan
Thai Nguyen
Khanh Hoa
Tay Ninh
Phu Tho
Quang Nam
Ha Nam
Bac Giang
BRVT
Da Nang
Vinh Phuc
Hai Duong
Hai Phong
Hung Yen
Long An
Bac Ninh
Dong Nai
Binh Duong
Ha Noi
HCMC
2017
6
8
21
22
27
32
33
33
42
44
47
51
63
65
75
127
142
211
262
266
0 250 500
Binh Phuoc
Binh Thuan
Tay Ninh
Thai Nguyen
Khanh Hoa
Quang Nam
BRVT
Ha Nam
Vinh Phuc
Da Nang
Long An
Bac Giang
Hai Duong
Hung Yen
Hai Phong
Bac Ninh
Dong Nai
Binh Duong
HCMC
Ha Noi
2018
9
10
23
23
26
28
30
31
42
46
47
49
54
55
59
72
126
130
215
217
291
0 250 500
Binh Thuan
Binh Phuoc
Lam Dong
Thai Nguyen
Quang Nam
Tay Ninh
Khanh Hoa
Ha Nam
BRVT
Vinh Phuc
Hai Duong
Hung Yen
Bac Giang
Da Nang
Long An
Hai Phong
Bac Ninh
Dong Nai
Binh Duong
HCMC
Ha Noi
2019
Number of Firms from Each Province
Source: Tax registration address of firm.

119PCI 2019THE VIET NAM PROVINCIAL COMPETITIVENESS INDEX
Table 2.4 Size of Foreign Firms over Time by Employment and Investment
Employment Size (A10): Percent of firms with employment of:
Year Less than 5 5 to 9 10 to 49 50 to 199 200 to 299 300 to 499 500 to 999 1000 and over
2012 2.5 7.5 27.3 29.1 9.9 8.6 8.1 7.0
2013 3.6 5.5 28.1 30.5 9.5 8.0 8.3 6.4
2014 5.3 8.5 29.0 29.5 6.6 7.6 6.9 6.6
2015 5.7 9.3 31.0 27.7 6.4 7.0 6.8 6.1
2016 5.9 9.7 29.1 29.8 6.9 7.3 4.9 6.2
2017 7.4 10.9 31.0 26.2 7.3 5.0 5.8 6.4
2018 9.4 11.0 32.0 26.4 6.3 5.5 5.4 4.0
2019 9.1 10.6 32.7 26.4 5.6 5.4 5.2 4.9
Employment Size (A5): Percent of firms reporting equity of:
Under 0.5 BVND
0.5 to under 1 BVND
1 to under 5 BVND
5 to under 10 BVND
10 to under 50 BVND
50 to under 200 BVND
200 to under 500 BVND
500 BVND and over
Year ($25,000) ($50,000) ($250,000) ($500,000) ($2.5 million) ($10 million) ($25 million) ($50 million)
2012 2.3 4.2 14.8 17.0 29.6 19.5 6.7 5.9
2013 2.5 4.1 15.3 19.3 31.4 16.4 6.1 4.9
2014 5.7 5.5 14.0 15.7 30.6 16.8 6.2 5.5
2015 6.1 6.1 17.4 16.9 25.8 15.8 6.3 5.7
2016 7.0 3.5 16.3 13.3 31.6 17.0 5.6 5.7
2017 7.9 5.7 16.7 15.1 27.3 16.8 4.7 5.9
2018 10.8 6.6 20.3 13.0 25.7 15.9 4.0 3.9
2019 9.8 6.2 19.3 11.7 26.7 16.3 5.0 5.1

120 PCI 2019 THE VIET NAM PROVINCIAL COMPETITIVENESS INDEX
Table 2.5 Performance of FIEs over Time
Source A10 A5 A11 A11 A13 A15
Year Firms Increasing Investment (%)
Firm Adding Employees (%)
Firms Reporting Profits (%)
Firms Reporting Losses (%)
Median Sales (Millions of 2010 USD)
Median Expenditures (Millions of 2010 USD)
2012 5.2 31.0 60.4 27.5 1.54 0.97
2013 5.1 30.0 63.6 24.1 1.45 0.94
2014 16.1 62.4 57.9 34.2 1.14 0.71
2015 11.4 62.4 55.1 37.6 0.69 1.42
2016 11.0 63.3 59.0 33.4 0.73 0.49
2017 13.2 62.4 54.3 37.9 2.43 2.02
2018 11.8 58.2 53.1 36.7 2.57 2.20
2019 10.4 61.6 56.2 34.3 0.93 1.51
Table 2.6 Customers of FIEs over Time
Sales to Vietnamese State Exports Sales to Foreigners in Vietnam Sales to Private Vietnamese
Year SOEs (%) Agency (%)
Home (%)
Third Country
(%)
Individual (%) Both (%) Enterprise
(%)Individual
(%)Both (%)
Enterprise (%)
2010 10.2 4.0 51.0 9.5 29.1 29.1
2011 8.1 7.4 44.5 4.2 17.1 41.9
2012 13.1 5.4 32.8 28.5 24.9 41.3
2013 16.9 6.3 34.9 40.0 35.8 48.5
2014 12.9 5.2 37.5 29.3 46.1 39.2
2015 13.6 4.1 39.9 33.0 51.6 40.2
2016 11.9 4.8 39.0 34.2 13.3 53.1 18.3 41.1
2017 10.7 4.3 33.7 26.6 11.6 56.0 18.3 41.0
2018 5.3 2.5 31.0 20.7 7.2 53.5 14.1 33.9
2019 8.4 3.5 34.2 22.6 10.4 57.1 16.9 40.7
Source: PCI-FDI A14 “Who are your customers? Please check all that apply” We calculate percentage with at least one customer.

121PCI 2019THE VIET NAM PROVINCIAL COMPETITIVENESS INDEX
Table 2.7 Suppliers of FIEs over Time
Year State Owned Enterprise (%) Private Firm (%) Household
Business (%) In-House (%) Home Country Businesses (%) Third Party (%)
2010 13.5 53.6 12.8 7.4 28.3 34.0
2011 7.6 30.4 7.4 8.6 15.9 18.6
2012 5.6 43.1 4.8 6.6 39.7 24.5
2013 9.5 47.9 10.1 12.8 45.6 34.0
2014 11.5 62.6 15.9 8.3 55.5 34.8
2015 11.9 68.9 19.3 8.5 58.0 38.3
2016 12.1 68.5 18.4 9.9 58.7 39.0
2017 10.0 62.5 16.1 6.9 49.2 26.6
2018 6.8 60.2 15.0 5.7 47.1 22.8
2019 10.1 66.0 17.1 7.3 44.3 24.8
Source: PCI-FDI A16 “Who are your suppliers of intermediate goods and services? Please check all that apply.“ We calculate percentage with at least one vendor.

Chapter 3

123
Are robots coming to take Vietnamese jobs? Are iPads invading Vietnamese workplaces? In this year’s special investigation, the PCI research team analyzes the behavior and interest of foreign and domestic investors in automation and digital technologies, and the potential impact that these investments will have on employment size and composition.
Throughout the economic reform era, a key policy challenge for Vietnamese leaders has been to continually provide new employment opportunities for the country’s workforce. In addition to the fundamental conundrum of creating jobs for Vietnam’s extremely large labor force of 55.4 million people,61 which is augmented every year by over half a million net new entrants,62 economic transition has influenced where people are seeking jobs. Increasing agricultural productivity has freed citizens from the countryside to leave the farm
61 Out of a population of 96.2 million62 CEIC. 2020, “Vietnam Labour Force Participation Rate.” CEIC Data. https://www.ceicdata.
com/en/indicator/vietnam/labour-force-participation-rate
Chapter 3ROBOTS ON THE FACTORY FLOOR: THE IMPACT OF AUTOMATION ON FIRMS IN VIETNAM

124 PCI 2019 THE VIET NAM PROVINCIAL COMPETITIVENESS INDEX
and seek urban employment in the growing manufacturing and service sectors.63 State-owned enterprise reform has similarly generated redundancies, releasing even more workers into the private economic sphere.64 The growth of the formal, domestic and foreign invested sectors has played a key role creating new jobs and absorbing these workers, mitigating the potential negative effects of Vietnam’s market transition.65
Recent commentary, both about Vietnam and other emerging economies, has begun to question whether private and foreign companies will continue to fill this salutary role.66 Rising labor costs and tightening labor markets, combined with pressure from international competitors and demands from international buyers, have led many companies to contemplate enhancing productivity by investing in labor-saving automation.67 The decline of manufacturing employment in emerging economies is a global phenomenon that Harvard Economist Dani Rodrik has termed premature deindustrialization.68 Thus far, Vietnam has bucked the global trend with continued manufacturing sector growth, yet analysts are starting to worry.69 Using occupation-based projections, some scholars suggest that up to 70 percent of Vietnamese jobs are at risk from automation,70 higher than any of its East and Southeast Asian neighbors. Unskilled workers with only primary and secondary school education are thought to face the greatest risk.71
Not all forecasts are so gloomy. Concerns about technological change triggering mass unemployment have existed since the Industrial Revolution. Technological change often has led to the creation of new jobs, which make use of automation and other advancements.72 More recent evidence also suggests that automation can serve as a complement which
63 Belser, Patrick. 1999. “Vietnam: on the Road to Labor-Intensive growth? Background paper for the Vietnam Development Report 2000,” Vietnam: Attacking Poverty, Joint Report of the Government of Vietnam –Donor- NGO Poverty Working Group, Hanoi, Vietnam. McCaig, B. and Pavcnik, N., 2013. Moving out of agriculture: structural change in Vietnam (No. w19616). National Bureau of Economic Research. <https://www.nber.org/papers/w19616.pdf>; Nguyen Thi Minh. 2009. “Dynamic Demographics and Economic Growth in Vietnam. Journal of the Asia Pacific Economy, 14(4): 389-398.
64 Belser, Patrick. and Rama, Martin, 2001. State Ownership and Labor Redundancy: Estimates Based on Enterprise-level Data from Vietnam (Vol. 2599). World Bank, Washington DC; Nguyen, Binh T., Loi Chi Cu, and Chien Thang Nguyen. 2009. “A Stocktaking of Viet Nam’s labor market Policies.” Labor Markets in Asia. Palgrave Macmillan, London, 2006. 559-629; Coxhead, Ian, and Diep Phan. 2013. “Princelings and paupers? State employment and the distribution of human capital investments among households in Viet Nam.” Asian Development Review 30.2: 26-48.
65 Jaax, Alexander, 2020.” Private sector development and provincial patterns of poverty: Evidence from Vietnam.” World Development, 127 <https://doi.org/10.1016/j.worlddev.2019.104747>; McCaig, Brian. and Pavcnik, Nina, 2018. “Export Markets and Labor Allocation in a Low-Income Country. American Economic Review, 108(7): 1899-1941. Vo, Anne. 2009. The Transformation of Human Resource Management and Industrial Relations in Vietnam. Elsevier:, Amsterdam
66 Das, Koushan. 2018. “Labor Market Trends in Vietnam,” VietnamBriefing, June 29. <https://www.vietnam-briefing.com/news/labor-market-trends-vietnam.html/>
67 Organization for Economic Cooperation and Development (OECD). 2019. Multi-dimensional Review of Viet Nam Suggestions for an integrated, transparent and sustainable economy “Viet Nam 4.0.” Paris, France, p124.68 Rodrik, D., 2016. “Premature Deindustrialization.” Journal of Economic Growth, 21(1): 1-33.69 Kunst, David, 2019. “Premature Deindustrialization through The Lens of Occupations: Which Jobs, Why, and Where?” Tinbergen
Institute Discussion Paper, August 2, 2019-033 <https://ssrn.com/abstract=3383582 or http://dx.doi.org/10.2139/ssrn.3383582
70 Frey, Carl Benedikt, and Michael A. Osborne. 2017. “The Future of Employment: How Susceptible Are Jobs to Computerization?” Technological Forecasting and Social Change 114: 254-280.>
71 Comparative estimates Malaysia (53 percent), Japan (49 percent) and Thailand (43 percent). See OECD, 2020. “Multi-Dimension Review,” p.25
72 Economist, 2016. “Special Report: Automation and Anxiety: Will Smarter Machines Cause Mass Unemployment?, June 23. <https://www.economist.com/special-report/2016/06/23/automation-and-anxiety>

125PCI 2019THE VIET NAM PROVINCIAL COMPETITIVENESS INDEX
enhances and diversifies firms’ activities.73 For instance, Eggelston et al. (2020) found that in Japanese hospitals, automation has served as an important complement to nurses and has actually reduced employee turnover.74 In that setting, robots assisted with the most physically demanding jobs, relieving the psychological and physical stress on human employees. Also in this vein, a recent World Bank report highlighted the new, lucrative jobs emerging in Vietnam due to the advent of higher-technology management processes and production techniques, especially in food processing and higher value-added manufacture projects.75
Among economists, debate about the consequences of automation remains heated. At the 2020 American Economic Association meeting, two groups of renowned scholars presented papers with fundamentally different conclusions. Besson et al (2020), studying Dutch firms, found evidence for the pessimistic view that automation is a job killer; they conclude that firm-level automation increases the probability of workers separating from their employers and decreases days worked.76 Acemoglu et al (2020) were more sanguine. They found that the adoption of robots in French manufacturing firms increased both traditional and higher skilled jobs as these companies became more productive. These findings are consistent with other work from developed countries. Acemoglu et al. (2020) also found, however, that the employment creation came at the expense of firms which chose not to automate. Early adopters of automation grew and prospered, while late and non-adopters tended to be driven out of the market, leading to employment losses for the least productive workers and firms. 77
Importantly, both of these new papers, along with most of the research on automation, concentrate on developed economies. To date, we have very little empirical understanding of how automation is affecting emerging economies like Vietnam. What work exists is based on high-level, sectoral projections of how robots and digital technologies have been utilized in developed economies.78 Firm-level evidence from emerging economies is sparse. Yet, for governments and international organizations, understanding the nature and extent of automation in developing countries is fundamental to creating policies that will address the continuing challenge of job creation and skills development.
73 Schlogl, Lukas, and Andy Sumner. 2018. “The rise of the robot reserve army: automation and the future of economic development, work, and wages in developing countries.” Center for Global Development Working Paper 487.
74 Eggleston, Karen, Yong Suk Lee and Toshiaki Iizuk. “The Impact of Robots on Nursing Home Care in Japan. Exploring the Implications of Robotic Technologies Adoption in Aging Societies,” Stanford Shorenstein Center Working Papers.
<https://aparc.fsi.stanford.edu/research/impact-robots-nursing-home-care-japan>75 Cunningham, Wendy, and Obert Pimhidzai. 2018. Vietnam’s Future Jobs: Leveraging Mega-Trends for Greater Prosperity. World
Bank: Hanoi, Vietnam. 76 Bessen, J.E., Goos, M., Salomons, A. and Van den Berge, W., 2019. “Automatic Reaction - What Happens to Workers at Firms
that Automate?” Boston Univ. School of Law, Law and Economics Research Paper. <https://scholarship.law.bu.edu/cgi/viewcontent.cgi?article=1585&context=faculty_scholarship>
77 Acemoglu, Daron, Claire Lelarge, and Pascual Restrepo. 2020. “Competing with Robots: Micro Evidence from France” Presented at the Annual Meeting of the American Economics Association., January 3.
https://www.aeaweb.org/conference/2020/preliminary/1265?q=eNqrVipOLS7OzM8LqSxIVbKqhnGVrAxrawGlCArI78 Carbonero, Francesco, Ekkehard Ernst, and Enzo Weber. 2018. “Robots worldwide: The Impact of Automation on Employment
and Trade.” ILO Research Department Working Paper 36: 23-37.

126 PCI 2019 THE VIET NAM PROVINCIAL COMPETITIVENESS INDEX
In this year’s PCI Special Investigation, we attempt to shed light on this debate within Vietnam by asking firms about their current use and plans for automation in their manufacturing and service sector operations. Because the PCI respondents are diverse, we defined automation broadly as three sets of activities: 1) using industrial robots in product assembly, distribution, and/or delivery; 2) digitalization of production or services, such as the use of iPads or tablets for taking customer orders or for back-office activities to reduce error from human input; 3) adoption of artificial intelligence, such as autonomous delivery vehicles or improved marketing using machine learning technology. We asked three questions:
1. What is the extent of current automation in Vietnam? 2. What factors are driving the adoption of these new technologies? 3. What is the potential impact on the scale and composition of employment in foreign and
domestic firms?
In Section 3.1, we study current and planned use of automated technology for 8,773 domestic and 1,583 foreign respondents. We find that two-thirds of both types of investors have automated some operations within the past three years, while three-quarters plan to employ or expand some automation over the next three years. Domestic firms claim to have already automated about 10 percent of their operational tasks over the past three years and plan to automate over a quarter of tasks in the near future. Automation among foreign firms is only slightly more advanced; they answer 10.6 percent and 28 percent of current and planned tasks respectively.
In Section 3.2, we analyze the motivation behind firms’ automation decisions using both respondent’s self-reported reasoning and econometric analysis to identify the correlates of higher-levels of automation. We identify two main drivers. First, firms seek automation to reduce the costs of recruiting and training new employees, especially when qualified technical workers in a business sector are hard to find. Second, both foreign and domestic firms see automation as a way to better connect with global supply chains. For domestic firms, the highest levels of current automation are found among firms whose primary customers are FIEs based in Vietnam. However, those selling to third-party buyers have the greatest plans for automating technologies. Foreign firms that are part of multi-national corporations (MNCs) or sell to third-party buyers have been the most ambitious automators. For foreign firms, we identify an important third correlate of investment in automation - labor unrest. Firms that have observed labor strikes among competitors in similarly situated provinces and industries are significantly more likely to adopt automation than those where strikes have been less prominent.
Section 3.3 tackles the impact of automation on current employment and future hiring plans. Here, we see big differences between domestic and foreign firms. Only 12.6 percent of domestic businesses have increased employment as a result of automation, compared to 35 percent who plan to maintain employment at current levels and 27 percent of domestic businesses who intend to reduce employment. Of this latter group, over half (15 percent) plan to do the same activities but with a smaller number of people. By sharp contrast, 17.8 percent of FIEs expressed

127PCI 2019THE VIET NAM PROVINCIAL COMPETITIVENESS INDEX
their intention to increase employment. This is positive news. Although 33 percent do still plan to reduce employment, in contrast to domestic investors, a significant share (8.5 percent) intend to increase the sophistication of their smaller labor forces.
We conclude the chapter by recommending that the Vietnamese leadership continue its efforts to improve education and labor relations. The Law on Education (No. 43/2019/QH14) and accompanying national curriculum reforms79 were aimed at enhancing the quality of general and vocational education with the specific goal of improving the skillsets for Vietnamese workers to succeed in an advanced economy. The 2021 Labor Code (No. 45/2019/QH14) broke new ground for working conditions and employee-labor relations. Both the Education Law and Labor Code were legislative achievements. However, implementing regulations and decrees at both national and local levels have yet to be written. By augmenting the skillsets of Vietnamese employees and reducing misunderstanding between workers and employers, successful application of both laws will go a long way toward reducing some of the pain of firm-level automation decisions.
3.1 SCALE OF AUTOMATION AMBITIONS
Figure 3.1 presents four different bars for both domestic (n=8,773) and foreign respondents (n=1,583) to the PCI surveys. Before asking firms to answer questions about automation, we first defined the set of activities that fall under the rubric of automation. The introduction to the “Automation” section of the survey began as follows:
“In this section, we would like to ask you a few questions about your use of automation in your business operations. Automation is a broad term that generally involves three distinct process changes within business that involve machines being used for tasks that previously involved human workers. These include: 1) using industrial robots in product assembly, distribution, and delivery; 2) digitalization of production or services, such as the use of iPads or tablets for taking customer orders or for back-office activities to reduce error from human input; 3) artificial intelligence, such as self-driving delivery trucks or improved marketing using machine learning technology.”
According to this expansive definition of automation, super-majorities of both types of investors are currently employing some form of automation in their daily business. About 67 percent of both foreign and domestic of investors have automated some operations within the past three
79 Vietnam News. 2018. “New General Educational Curriculum Unveiled,” December 28. https://vietnamnews.vn/society/482917/new-general-educational-curriculum-unveiled.html

128 PCI 2019 THE VIET NAM PROVINCIAL COMPETITIVENESS INDEX
years, while 75 percent plan to automate new tasks during the next three years. When we dig a bit deeper, however, and ask firms to be specific about what proportion of their operations are currently automated and will likely be automated in the future, the answers are more modest. Domestic firms claim to have automated about 10 percent of their tasks in the past three years and plan to automate over 25 percent of their work in the near future. Foreign firms are slightly further ahead with 10.6 percent currently automated and plans for 28 percent of tasks to be automated.
In both cases, the shares are slightly higher than we anticipated. Vietnamese labor costs remain relatively low compared to China and slack remains in the Vietnamese labor market with existing underemployment in the agricultural and informal sectors.80 Opportunities remain to bolster production through cheap labor growth, so why would companies see advantages to investing in automated technologies?
Figure 3.1 Frequency and Depth of Automation among Vietnamese Firms
Any Automation Share of Automated Tasks
Any Automation Plans Share of Planned Automated Tasks
10.2
67.7
74.9
25.1
0
5
10
15
20
25
30
35
40
45
50
55
60
65
70
75
80
Shar
e of F
irms (
%)
Domestic Investors
66.3
10.6
72.3
27.7
0
5
10
15
20
25
30
35
40
45
50
55
60
65
70
75
80
Shar
e of F
irms (
%)
Foreign Investors
Source: PCI QJ.1 and PCI-FDI QL.1: “In the past three years, what percentage of tasks previously done by human workers has your business automated?” PCI QJ.2 and PCI-FDI QL.2: “In the next three years, what additional percentage of tasks currently done by human workers do you plan to automate?” (n=1583 foreign and 8773 domestic)
80 Duffing, Erin. 2019. “Manufacturing labor costs per hour for China, Vietnam, Mexico from 2016 to 2020,” STATISTA. https://www.statista.com/statistics/744071/manufacturing-labor-costs-per-hour-china-vietnam-mexico/

129PCI 2019THE VIET NAM PROVINCIAL COMPETITIVENESS INDEX
Figure 3.2 helps answer the puzzle by demonstrating that there are clear differences according to sector. For FIEs, the manufacturing sector has taken the lead in automated production. The only service ranking among the top ten automated two-digit sectors is real estate. Foreign manufacturers in electronic equipment, furniture construction, computer and electronics production, and food processing have been the most aggressive over the past three years, automating nearly 15 percent of their production tasks. By contrast, foreign manufacturers of garments, leather products, and construction firms have chosen to automate less than 5 percent of their tasks. The latter three industries still perceive cost advantages from hiring low-cost, unskilled Vietnamese labor.
Turning to domestic firms, we see that the average share of automated tasks is slightly higher for the heavily automated industries. One sector, chemical production, has automated 20 percent of its tasks, and electronic equipment has automated 15 percent. Manufacturing firms have been the most aggressive adopters of automation among domestic firms as well.
Importantly, several sectors stand out as leading automators for both foreign and domestic firms, including the chemical industry, electronic equipment, computers and electronics, and basic metals. This has two implications. On the positive side, it indicates that domestic companies may be keeping pace with foreign investors, which is a good sign that domestic, private companies will be able to more effectively plug in to global supply chains because they employ similar technologies to existing manufactures. This also indicates that Vietnamese firms are preparing to enhance productivity and compete effectively with foreign firms both in the country and abroad. On the negative side, however, there are potential dangers for workers who have been made redundant by automation in the foreign sector. Whereas private domestic businesses may have been able to absorb the excess employees in unskilled production in prior years,81 increasing automation among domestic firms will make this labor transition less likely in the future.
81 Jaax, Alexander, 2020. “Private sector development and provincial patterns of poverty: Evidence from Vietnam.”; McCaig, Brian. and Pavcnik, Nina, 2018. “Export Markets and Labor Allocation in a Low-Income Country.”

130 PCI 2019 THE VIET NAM PROVINCIAL COMPETITIVENESS INDEX
Figure 3.2 Share of Tasks Automated by Two-Digit Sector
0 5 10 15 20
Professional Services
M:Leather
M:Garments
Information/Communication
Construction
Wholesale/Retail
Edu/Healths/Labour services
M:Motor Vehicles
Electricity/Gas/AC
Agriculture/Aquaculture
M:Wood Products
Others Services
M:Machinery
M:Textiles
Mining
M:Fabricated Metals
Real Estate
M:Food Processing
M:Furniture
M:Computers/Electronics
M:Rubber/Plastics
Financial/Insurance
M: Other
M:Paper Products
M:Basic Metals
M:Electronic Equip.
M:Chemicals
Domestic Investors
0 5 10 15 20
Financial/Insurance
M:Leather
M:Garments
Construction
Edu/Healths/Labour services
Information/Communication
M:Motor Vehicles
Professional Services
Wholesale/Retail
Electricity/Gas/AC
Others Services
M:Machinery
M:Paper Products
M:Wood Products
Agriculture/Aquaculture
M:Chemicals
M:Basic Metals
M:Rubber/Plastics
Real Estate
M:Textiles
M:Fabricated Metals
M: Other
M:Food Processing
M:Computers/Electronics
M:Furniture
M:Electronic Equip.
Foreign Investors
Share of Firms' Tasks Recently Automated (%)
Source: PCI QJ.1 and PCI-FDI QL.1: “In the past three years, what percentage of tasks previously done by human workers has your business automated?” By two-digit sector codes from ISIC Rev. 4. (n=1583 foreign and 8773 domestic)
Figure 3.3 studies the technological ambitions of firms according to their two-digit sector. In many ways, the story looks very similar, with similar sectors on both the top and bottom of the automated tasks ranking. Nevertheless, there are subtle and critical differences that should alert Vietnamese policy-makers, as they indicate which sectors will pose potential employment changes.
We can see this most clearly by studying the two top-ranked foreign automators from Figure 3.2. According to that graph, both computer and electronics manufacturers and food processing firms have automated 15 percent of their current tasks. However, Figure 3.3 shows that

131PCI 2019THE VIET NAM PROVINCIAL COMPETITIVENESS INDEX
manufacturers of computers want to increase automation, expanding ten percentage points to 22 percent of tasks by 2023. By contrast, firms in food processing plan to remain at 15 percent of automated tasks. The difference tells us that we should expect higher productivity growth in computer production, but also a higher likelihood of redundant employment.
Among domestic manufacturers, we observe a similar pattern. Manufacturers of electronic equipment currently have 15 percent of their tasks automated, but plan to expand to 30 percent. Chemical manufacturers, by contrast, plan to increase automation only from 20 percent to 26 percent of tasks.
To demonstrate this relationship more clearly, Figure 3.4 provides a scatter plot of two-digit sectors. We place the current automation performance on the horizontal axis and the planned automation on the vertical axis. The red dash lines depict a two-percentage point margin of error around a 45o line. Firms in sectors above the upper bound 45o are those planning to significantly enhance productivity above their current standards. Those within the bands are sectors not planning to significantly automate more tasks. Comparing the two scatter plots, we see that domestic firms are planning greater automation in the future than foreign firms. While only half of the foreign sectors are above the upper bound, nearly every domestic sector is. Of course, these figures should be taken with caution because it is not easy to disentangle true plans from over-confident ambitions on a self-administered survey.
Among domestic firms, seven sectors stand out with planned automation that is at least seven percentage points higher than current automation levels: electronic equipment (12.3 percentage points), machinery (10.2 percentage points), motor vehicles (9.5 percentage points), chemicals (7.7 percentage points), fabricated metals (7.6 percentage points), furniture (7 percentage points), and computers and electronics (6.9 percentage points).
For foreign firms, only three sectors have gaps that are greater than 7 percentage points between planned and current automation. Electronic equipment is again the most ambitious area with 7.5 percent. Surprisingly, agriculture is next at 7 percent. Four other industries are also worth noting for planned productivity investments: electricity and gas provision (6.4 percentage points), computers and electronics (6.1 percentage points), paper products (6.1 percentage points), and furniture (5.8 percentage points).

132 PCI 2019 THE VIET NAM PROVINCIAL COMPETITIVENESS INDEX
Figure 3.3 Planned Automated Tasks by Sector
0 5 10 15 20 25
M:Leather
Professional Services
Information/Communication
M:Garments
Construction
Wholesale/Retail
Edu/Healths/Labour services
Electricity/Gas/AC
Others Services
Agriculture/Aquaculture
M:Wood Products
M:Textiles
M:Rubber/Plastics
M:Motor Vehicles
Real Estate
M:Fabricated Metals
M:Food Processing
M:Machinery
M: Other
M:Furniture
M:Computers/Electronics
M:Paper Products
M:Basic Metals
Financial/Insurance
M:Chemicals
M:Electronic Equip.
Domestic Investors
0 5 10 15 20 25
Financial/Insurance
Professional Services
M:Garments
M:Leather
Construction
Edu/Healths/Labour services
Wholesale/Retail
Information/Communication
M:Motor Vehicles
M:Wood Products
M:Basic Metals
Others Services
M:Textiles
M:Machinery
Electricity/Gas/AC
M:Paper Products
M:Food Processing
M:Chemicals
M:Fabricated Metals
M: Other
M:Rubber/Plastics
Agriculture/Aquaculture
Real Estate
M:Furniture
M:Computers/Electronics
M:Electronic Equip.
Foreign Investors
Share of Firms' Tasks Planned To Be Automated (%)
Source: PCI QJ.2 and PCI-FDI QL.2: “In the next three years, what additional percentage of tasks currently done by human workers do you plan to automate?” By two-digit sector codes from ISIC Rev. 4. (n=1583 foreign and 8773 domestic)

133PCI 2019THE VIET NAM PROVINCIAL COMPETITIVENESS INDEX
Figure 3.4 Comparison of Current vs. Planned Automation
Agriculture/Aquaculture
M:Food Processing
M:Textiles
M:Garments
M:Leather
M:Wood Products
M:Chemicals
M:Rubber/Plastics
M:Basic Metals
M:Fabricated Metals
M:Computers/Electronics
M:Electronic Equip.
M:Machinery
M:Motor Vehicles
Electricity/Gas/AC
ConstructionWholesale/Retail
Information/Communication
Financial/Insurance
Real Estate
Professional Services
.
M:Paper ProductsM:Furniture
Others ServicesEdu/Healths/Labour services
6
8
10
12
14
16
18
20
22
24
26
28
30
32
Plan
ned
Task
s (%
)
6 8 10 12 14 16 18 20 22 24 26 28 30 32
Automated Tasks (%)
Domestic Investors
M:Food Processing
M:Textiles
M:GarmentsM:Leather
M:Wood Products
M:Paper ProductsM:Chemicals
M:Rubber/Plastics
M:Fabricated Metals
M:Electronic Equip.
M:Machinery
M:Motor Vehicles
M:Furniture
M: Other
Electricity/Gas/AC
Construction
Information/Communication
Financial/Insurance
Real Estate
Professional Services
Others Services
Edu/Healths/Labour services
.
Agriculture/Aquaculture
M:Basic Metals
M:Computers/Electronics
Wholesale/Retail
4
6
8
10
12
14
16
18
20
22
24
Plan
ned
Task
s (%
)
4 6 8 10 12 14 16 18 20 22 24
Automated Tasks (%)
Foreign Investors
Scatter plot of JA1 (Automated tasks in past three years) and JA2 (Planned automated tasks in next three years). The red dash lines depict a 45o line with a two-percentage point margin of error. Industries above the line are those that plan to automate significantly above their current amount. Source: PCI QJ.1 and PCI-FDI QL.1: “In the past three years, what percentage of tasks previously done by human workers has your business automated?” PCI QJ.2 and PCI-FDI QL.2: “In the next three years, what additional percentage of tasks currently done by human workers do you plan to automate?” By two-digit sector codes from ISIC Rev. 4. (n=1583 foreign and 8773 domestic)

134 PCI 2019 THE VIET NAM PROVINCIAL COMPETITIVENESS INDEX
3.2 MOTIVATION FOR AUTOMATION
In this section, we explore why firms in Vietnam have chosen to automate their operations in two different ways. First, we employ their answers to a direct survey question about the motivation behind their decisions. Second, we use regression analysis to identify the correlation between observed firm characteristics, such as size, industry, and cost structure of businesses with the scale of automation.
Figure 3.5 graphs the answers to the self-reported motivation question, “What were the main factors that motivated your firm’s automation efforts?” Firms were invited to check all that apply, and in the foreign survey, firms were asked to rank the salience of the motivation on a ten-point scale. The options that were presented are commonly discussed in academic work as well as the Vietnamese popular press.
Noticeably, the motivations for both foreign and domestic firms are very much the same. The dominant answer for automation decisions was cost reduction. Slightly over half of foreign firms cited “cost saving” compared to 45 percent of domestic firms.
The second and third choices for both groups were “market access” (31 percent of FIEs and 26 percent of domestic firms) and “supply chain entry” (30 percent of FIEs and 23 percent of domestic). These options are very similar in that both relate to making changes in business operations in order to conform to the demands of overseas purchasers. Firms answering “market access” were thinking about producing goods according to the quality and technical standards of foreign buyers. Firms answering “supply chains” were contemplating meeting the technical requirements for provision of inputs and intermediate goods into more complex products. Automation helps guarantee these standards are met and reduces reliance on more expensive high-skilled labor.
A surprising fourth choice for both foreign and domestic firms was “green compliance.” Environmental concerns have become a critically important issue in Vietnam, and local consumers and residents near factories are becoming increasingly aware of the costs of dirty production to their health and livelihoods.82 It appears that businesses have internalized these demands and are trying to respond to them by employing machinery that reduces their environmental footprint.
Other motivations, such as the fear of competitors gaining productivity gains through automation or responding to worker strikes, ranked slightly behind, but were not considered as
82 Nguyen, Quynh. 2020. “Không phải chỉ khi giàu thì người Việt mới biết sợ ô nhiễm,” January 7. Zing.Vn <https://news.zing.vn/khong-phai-chi-khi-giau-thi-nguoi-viet-moi-biet-so-o-nhiem-post1029218.html>

135PCI 2019THE VIET NAM PROVINCIAL COMPETITIVENESS INDEX
important as the other four factors. Importantly for our regression analysis below, over a fifth of foreign firms (23 percent) cited strikes, compared to 15 percent of domestic firms. Labor unrest and movements have been rising in Vietnam and it is possible that foreign firms, especially the Japanese and Korean firms that have been targeted in the past, may see automation as a preventive measure.83
Table 3.1: Survey of Automation Incentives
Source: PCI QJ.3 and PCI-FDI QL.3: “What were the main factors that motivated your firm’s automation efforts? Please check all that apply and rank their importance on a 1-10 point scale (with 1 as the most important and 10 as the least important)”
Factors Check all that applyRank their importance on a 1-10 point
scale (with 1 as the most important and 10 as the least important)
We want to access more sophisticated segments of product markets. □We want to lower our production costs over time. □We could not find the appropriately skilled workers. □Automation reduces our exposure to labor demands/strikes. □Our competitors are automating. □Buyers in our supply chain demanded it. □Suppliers in our supply chain demanded it. □We want to better plug in to global supply chains. □Automating improves our environmental compliance. □Others □
83 Tran, Angie Ngoc., 2007. “Alternatives to the “Race to the Bottom” in Vietnam: Minimum Wage Strikes and their Aftermath.” Labor Studies Journal, 32(4), pp.430-451; Kerkvliet, Benedict J. Tria. 2019. Speaking Out in Vietnam: Public Political Criticism in a Communist Party–Ruled Nation. Cornell University Press

136 PCI 2019 THE VIET NAM PROVINCIAL COMPETITIVENESS INDEX
Figure 3.5 Perceived Drivers of Automation According to Firms
Shar
e of
Firm
s (%
)
Domestic Investors
26
45
12
15 1613
8
23 23
1
0
5
10
15
20
25
30
35
40
45
50
55
Shar
e of
Firm
s (%
)
31
52
2023 22
18
13
3028
5
0
5
10
15
20
25
30
35
40
45
50
55
Foreign Investors
Market Access Lower Costs Can't Find Workers
Reduces Strikes Competitors Automating Buyers Demanded
Suppliers Demanded Enter Supply Chain Green Compliance
Other
Source: PCI QJ.3 and PCI-FDI QL.3: “What were the main factors that motivated your firm’s automation efforts?” Analysis limited to firms that have planned to automate at least one task (n=1145 foreign and 6568 domestic).
To test the reliability of the survey results above, we looked through the PCI and PCI-FDI datasets to identify firm attributes that matched the motivations cited in Figure 3.5 above. Rather than asking firms, we decided to statistically test the correlation between firm characteristics and automation levels and ambition. The benefit of this approach is that it is not as prone to social desirability bias. If asked explicitly, firms may have cited particular motivations because they thought that is what the research team wanted to hear. Our regression approach does not suffer from biases caused by this motivation. We are simply testing the association between standard firm attributes and their answers to the automation questions.
In Figure 3.6, we employ a traditional linear regression of the share of automated tasks and planned tasks on features of the firms that match the survey options in Figure 3.5. The regression clusters standard errors at the provincial level, the primary sampling unit in the PCI and PCI-FDI survey, to reduce the possibility that correlated errors among similar firms might lead to

137PCI 2019THE VIET NAM PROVINCIAL COMPETITIVENESS INDEX
false positives in our evaluation of the effects of certain variables. Finally, we employ two-digit sector fixed effects, so that we are only comparing differences within industrial sectors, which reduces the possibility that industrial differences are solely responsible for the results. This can be thought of as setting aside or controlling for the influence of sectors to isolate the effects of firm-level features that vary within sectors.
We then compare the relationship between automation and several firm characteristics. Descriptive statistics on these correlates can be seen in Table 3.2 in the Appendix. First, we measure the original employment size of the firm when it began operations. It is important to realize that we use initial employment and not employment in 2019. On average, initial size was recorded about eight years ago, which helps us avoid reverse causality, whereby automation decisions affected subsequent employment levels. Second, we include the firm’s age, calculated as the number of years since the business first began operations in Vietnam. Third, we capture the legal form by studying whether the firm is a joint-stock company for domestic firms or multi-national corporation (MNC) for foreign firms. The MNC variable also helps us understand whether the firm is fundamentally integrated into global supply chains and therefore likely to be asked to upgrade by its global headquarters. Relatedly, we look at the firms’ main customers. Do they sell primarily to companies or consumers in Vietnam and are therefore part of domestic supply chains? Or do they mainly sell to overseas buyers and tap into global supply chains driven by lead firms from other countries? Fourth, the importance of climate change on decisions is operationalized by firms’ answers to question G2, which asked “How would you evaluate the impact of climate change on the activities of your firm?” Firms were invited to answer on a scale of one to ten, where ten represented, “Climate change has no negative impact. It only creates opportunities for my business,” and one was, “Climate change only creates negative impacts. It offers no positive benefits for my business.” To approximate the cost of labor, we used the direct question E2.8, which asks, “What percentage of business costs did your firm spend on labor training?”84 Finally, for foreign firms, we measured the threat of potential strikes by using question F6, “In the past three years, has your firm experienced a labor strike or work stoppage?”85 We calculated the share of firms within the same industry and province as the respondent to measure whether strikes were likely in their industry and therefore might motivate labor-saving choices. For domestic firms, we used Question E3.8.1, “On average, what percentages of workers trained by your company remain with the firm for longer than a year?” as a proxy for the cost of recruiting new, trained labor for their industry.
84 In robustness tests in Tables 3.4 through 3.7, we replace the measure of training cost with a range of other variables that measure the quality of labor and cost of labor for firms. These include: “Recruitment Costs/Total Costs (percent)”; “Difficulty of Recruiting Technical Workers (1=V. Easy; 5=V. Difficult)”; “Quality of General Education (1=V. Bad; 4=V. Good)”; and “Worker Skills Meet Firm’s Needs (1=Sufficient; 4=Not Sufficient)”. The substantive implications are similar: low quality labor increases incentives to automate.
85 The domestic survey does not ask about strikes, because they are too rare a phenomenon for small, local firms.
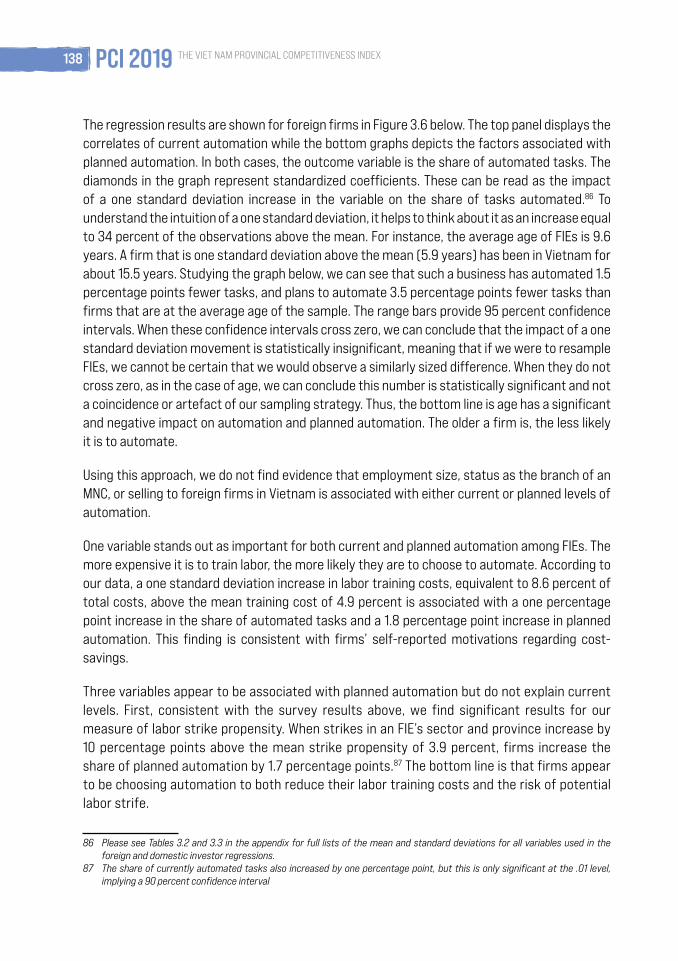
138 PCI 2019 THE VIET NAM PROVINCIAL COMPETITIVENESS INDEX
The regression results are shown for foreign firms in Figure 3.6 below. The top panel displays the correlates of current automation while the bottom graphs depicts the factors associated with planned automation. In both cases, the outcome variable is the share of automated tasks. The diamonds in the graph represent standardized coefficients. These can be read as the impact of a one standard deviation increase in the variable on the share of tasks automated.86 To understand the intuition of a one standard deviation, it helps to think about it as an increase equal to 34 percent of the observations above the mean. For instance, the average age of FIEs is 9.6 years. A firm that is one standard deviation above the mean (5.9 years) has been in Vietnam for about 15.5 years. Studying the graph below, we can see that such a business has automated 1.5 percentage points fewer tasks, and plans to automate 3.5 percentage points fewer tasks than firms that are at the average age of the sample. The range bars provide 95 percent confidence intervals. When these confidence intervals cross zero, we can conclude that the impact of a one standard deviation movement is statistically insignificant, meaning that if we were to resample FIEs, we cannot be certain that we would observe a similarly sized difference. When they do not cross zero, as in the case of age, we can conclude this number is statistically significant and not a coincidence or artefact of our sampling strategy. Thus, the bottom line is age has a significant and negative impact on automation and planned automation. The older a firm is, the less likely it is to automate.
Using this approach, we do not find evidence that employment size, status as the branch of an MNC, or selling to foreign firms in Vietnam is associated with either current or planned levels of automation.
One variable stands out as important for both current and planned automation among FIEs. The more expensive it is to train labor, the more likely they are to choose to automate. According to our data, a one standard deviation increase in labor training costs, equivalent to 8.6 percent of total costs, above the mean training cost of 4.9 percent is associated with a one percentage point increase in the share of automated tasks and a 1.8 percentage point increase in planned automation. This finding is consistent with firms’ self-reported motivations regarding cost-savings.
Three variables appear to be associated with planned automation but do not explain current levels. First, consistent with the survey results above, we find significant results for our measure of labor strike propensity. When strikes in an FIE’s sector and province increase by 10 percentage points above the mean strike propensity of 3.9 percent, firms increase the share of planned automation by 1.7 percentage points.87 The bottom line is that firms appear to be choosing automation to both reduce their labor training costs and the risk of potential labor strife.
86 Please see Tables 3.2 and 3.3 in the appendix for full lists of the mean and standard deviations for all variables used in the foreign and domestic investor regressions.
87 The share of currently automated tasks also increased by one percentage point, but this is only significant at the .01 level, implying a 90 percent confidence interval

139PCI 2019THE VIET NAM PROVINCIAL COMPETITIVENESS INDEX
The second variable influencing planned automation is climate change. The more positive the environment is for a firms’ business, the more likely they are to be ambitious about potential automation. The effect of a one standard deviation in the effects of climate change score is associated with a 1.5 percentage point increase in planned automation. In addition, firms that want to make themselves attractive to foreign buyers also see automation as beneficial. The greater the propensity that an FIE will do business with an overseas buyer, the greater the level of tasks they plan to automate.
In sum, we observe two sets of correlates of automation strategies. The costs of labor training and the risk of labor strikes have already inspired some FIEs to automate tasks and will lead to greater automation in the future. At the same time, FIEs’ views about climate change and the prospects of global integration for their business are also incentivizing them to invest in automation.
Figure 3.6: Determinants of Automation of Foreign Firms (Regression Analysis)
Employees
Firm Age in Years
MNC=1
Main Customer is FIE=1
Export Indirectly=1
Climate Change Impact (1=Bad;10=Good)
Training Costs/Total (%)
Avg. Strikes in Provice-Sector
-6 -5.5 -5 -4.5 -4 -3.5 -3 -2.5 -2 -1.5 -1 -.5 0 .5 1 1.5 2 2.5 3 3.5 4 4.5 5
Effect of 1SD Change on Share of Automated Tasks (%)
Employees
Firm Age in Years
MNC=1
Main Customer is FIE=1
Export Indirectly=1
Climate Change Impact (1=Bad;10=Good)
Training Costs/Total (%)
Avg. Strikes in Provice-Sector
-6 -5.5 -5 -4.5 -4 -3.5 -3 -2.5 -2 -1.5 -1 -.5 0 .5 1 1.5 2 2.5 3 3.5 4 4.5 5
Effect of 1SD Change on Share of Planned Automated Tasks (%)
Source: OLS Regression of Question J2 from PCI survey on listed determinants, including two-digit sector fixed effects. Standardized coefficients are depicted with diamonds, representing the effect of a one standard deviation change in the independent variable. Range bars display 95 percent Confidence Intervals. For descriptive statistics on key variables see Table 3.3. For full regression results see Model 7 of Table 3.6 for Panel 1 and Model 7 of Table 3.7 for Panel 2.

140 PCI 2019 THE VIET NAM PROVINCIAL COMPETITIVENESS INDEX
In Figure 3.7, we apply the same regression analysis approach to unpack the motivations behind domestic investors’ automation decisions. As opposed to the direct survey question analysis in Figure 3.5, using regression to disentangle motivations behind automation demonstrates that there are important differences between domestic and foreign firms. Again, the top panel looks at the share of tasks that are currently automated and the bottom panel studies the share of tasks that the firm plans to automate.
As with foreign firms, the cost of finding qualified workers is influencing automation decisions. According to our data, a one standard deviation increase in labor training costs, which is equal to 9.6 percent of total costs above the mean training costs of 4.9 percent, is associated with a 1.6 percentage point increase in the share of automated tasks and a 2.3 percentage point increase in planned automation. Similarly, the firm’s assessment of the quality of local labor on a four-point scale has an impact on automation choices. A one standard deviation movement is correlated with a .72 percentage point increase in current automation and a 1.6 percentage point increase in planned automation.
However, domestic firms appear to have a different decision-making process as well. Focusing on the top panel of current automation, the first difference from foreign firms is that firm size matters dramatically for locals. One standard deviation of 83.4 employees above the mean employment of 20 employees is associated with a 1.3 percentage point increase in the number of tasks automated. Second, the older a domestic firm is, the higher the likelihood of automation. One standard deviation of 6.5 years above the mean age of 8.7 years is associated with a 0.65 percentage point increase in the number of tasks automated. Third, integration with supply chains within Vietnam also matters for automation decisions, while indirect exporting is less important and not significantly different from zero. A one standard deviation rise in the probability of selling to an FIE (37 percent) is associated with a 0.8 percentage point increase in the share of tasks automated.
Indirect exporting does appear to be a motivation for planning automation in order to meet the needs of overseas buyers. A one standard deviation increase (28 percent) in the probability of selling to an overseas buyer is associated with an uptick of 1.3 percentage points in planned automation. Business size and having a main customer as an FIE are significant in planned automation as well.
Thus, for domestic firms, labor quality and training costs do appear to be strong motivations to invest in automation. Similarly, the possibility of connecting with global supply chains also ranks highly. Both of these are consistent with Figure 3.5.

141PCI 2019THE VIET NAM PROVINCIAL COMPETITIVENESS INDEX
Figure 3.7 Determinants of Automation for Domestic Firms (Regression Analysis)
Employees
Firm Age in Years
Joint Stock=1
Main Customer is FIE=1
Export Indirectly=1
Climate Change Impact (1=Bad;10=Good)
Training Costs/Total (%)
Labor Force Does Not Meet Needs (1-4)
-1.5 -1 -.5 0 .5 1 1.5 2 2.5 3 3.5Effect of 1SD Change on Share of Automated Tasks (%)
Employees
Firm Age in Years
Joint Stock=1
Main Customer is FIE=1
Export Indirectly=1
Climate Change Impact (1=Bad;10=Good)
Training Costs/Total (%)
Labor Force Does Not Meet Needs (1-4)
-1.5 -1 -.5 0 .5 1 1.5 2 2.5 3 3.5
Effect of 1SD Change on Share of Planned Automated Tasks (%)
Source: OLS Regression of Question J2 from PCI survey on listed determinants, including two-digit sector fixed effects. Standardized coefficients are depicted with diamonds, representing the effect of a one standard deviation change in the independent variable. Range bars display 95 percent Confidence Intervals. For descriptive statistics on key variables see Table 3.3. For full regression results see Model 7 of Table 3.6 for Panel 1 and Model 7 of Table 3.7 for Panel 2.

142 PCI 2019 THE VIET NAM PROVINCIAL COMPETITIVENESS INDEX
3.3 THE IMPACT OF AUTOMATION ON EMPLOYMENT
Given that a main driver of automation is the difficulty of finding quality workers, are companies that are choosing to automate also intending to shed labor? Figure 3.8 presents the results when we posed this question directly to businesses, asking how their composition of labor and tasks was likely to change. Domestic and foreign investors responded quite differently to this query.
Only 12.6 percent of domestic businesses have increased employment as a result of automation. Thirty-five percent of domestic investors answered that they maintained the same numbers of workers. Nineteen percent retain employment levels doing the same tasks, but 16 percent used automation to diversify tasks at existing employment levels. Twenty-seven percent of businesses intend to reduce employment. Of those, over half (15 percent) plan to do the same activities but with a smaller number of people. Much smaller shares of firms plan to use less labor on either more or less sophisticated tasks.
By contrast, the largest single value checked by foreign enterprises was their intention to increase employment (17.8 percent) while automating. Twenty-eight percent plan to maintain employment with roughly equal numbers diversifying and keeping tasks the same. Thirty-three percent plan to reduce employment, with over half (17.5 percent) intending to use the remaining workers on less sophisticated tasks. In contrast to domestic investors, a significant share (8.5 percent) plan to increase the sophistication of their smaller labor forces.

143PCI 2019THE VIET NAM PROVINCIAL COMPETITIVENESS INDEX
Figure 3.8 Impact of Automation on Employment DecisionsSh
are
of Fi
rms (
%)
Domestic Investors
Shar
e of
Firm
s (%
)
Foreign Investors
Same Number of Workers, Same Tasks Same Number of Workers, Different Tasks
More Workers w/Automation Fewer Workers, Same Tasks
Fewer Workers, Less Sophisticated Tasks Fewer Workers, More Sophisticated Tasks
18.5
16.4
12.6
15.3
6.7
5.3
0
2
4
6
8
10
12
14
16
18
20
22
24
14.613.6
17.8 17.5
6.8
8.5
0
2
4
6
8
10
12
14
16
18
20
22
24
Source: PCI QJ.4 and PCI-FDI QL.4: “Which statement best describes the way in which automated and digital means of production has affected your employment decisions?” Analysis limited to firms that have automated at least one task (n=1050 foreign and 5937 domestic).
Figure 3.9 studies which sectors are most likely to increase employment. For FIEs, real estate and manufacture of furniture rank at the top of the list with over 30 percent planning to add workers. However, less than 10 percent of firms in three service sectors (wholesale/retail, construction, and information/communications) expect automation to create new jobs. Zero information/communication firms expect employment growth. Among domestic firms, over 25 percent of manufacturers of electronic equipment and leather expect automation to generate new employment, leading the pack. Utilities like electricity and gas, manufacturers of motor vehicles, and businesses in information and communications services also are not optimistic about automation leading to new hires.

144 PCI 2019 THE VIET NAM PROVINCIAL COMPETITIVENESS INDEX
Figure 3.9: Companies Hiring More Workers (by Sector)
0 5 10 15 20 25 30 35 40
Information/Communication
M:Motor Vehicles
Electricity/Gas/AC
Others Services
Wholesale/Retail
M:Furniture
Real Estate
Construction
Edu/Healths/Labour services
M:Basic Metals
M:Food Processing
Professional Services
M:Paper Products
Agriculture/Aquaculture
M:Rubber/Plastics
M:Wood Products
Financial/Insurance
M:Textiles
M:Machinery
M:Chemicals
M:Fabricated Metals
M:Computers/Electronics
M:Garments
M: Other
M:Leather
M:Electronic Equip.
Domestic Investors
0 5 10 15 20 25 30 35 40
Information/Communication
Construction
Wholesale/Retail
M:Leather
M:Chemicals
Professional Services
Edu/Healths/Labour services
M:Food Processing
M:Garments
Others Services
M:Computers/Electronics
Electricity/Gas/AC
M:Textiles
M: Other
M:Basic Metals
M:Electronic Equip.
M:Rubber/Plastics
M:Machinery
Financial/Insurance
M:Motor Vehicles
M:Wood Products
M:Paper Products
Agriculture/Aquaculture
M:Fabricated Metals
M:Furniture
Real Estate
Foreign Investors
Total Share of More Workers (%)
Source: PCI QJ.4 and PCI-FDI QL.4: “Which statement best describes the way in which automated and digital means of production has affected your employment decisions?” We have both expanded employment and automated production. By two-digit sector from ISIC Rev. 4, analysis limited to firms that have automated at least one task (n=1050 foreign and 5937 domestic).
Figure 3.10 illustrates the other side of the coin by depicting industries where job losses are expected. The graph presents three bars disaggregating where these employment reductions are aimed at improving the sophistication of business activities or simply cutting costs. Fascinatingly, foreign real estate firms, accounting for 60 percent of the sample, are planning to cut jobs due to automation, illustrating diversity in firm strategies between domestic companies and FIEs even within the same industry. Even more interestingly, these foreign-owned real estate firms are evenly split between those planning to concentrate remaining workers on more sophisticated tasks, and those planning to employ them in less sophisticated

145PCI 2019THE VIET NAM PROVINCIAL COMPETITIVENESS INDEX
activities. Manufacturers of paper products (50 percent), electronic equipment (43 percent), and fabricated metals (39 percent) rank as the next sectors most likely to shed workers due to automation over the next three years among FIEs. In all of these cases, only a small share will employ workers in more sophisticated tasks. For domestic firms, manufacturers of furniture (57 percent), food processing (52 percent), and textiles (48 percent) are the most likely to reduce employment. Again, in these sectors, only a small minority of firms plan to use automation to engage in more sophisticated activities. In almost all of these cases, the majority of companies will use automation to have fewer workers doing the same tasks, leading to cost savings.
Figure 3.10 Companies Planning to Reduce Employment by Sector
0 10 20 30 40 50 60
Wholesale/RetailInformation/Communication
M:MachineryElectricity/Gas/AC
Real EstateFinancial/Insurance
Edu/Healths/Labour servicesM:Computers/Electronics
ConstructionOthers Services
M:Motor VehiclesM:Leather
Professional ServicesM:Garments
M:Fabricated MetalsM: Other
M:Basic MetalsM:Electronic Equip.
M:Paper ProductsM:Rubber/Plastics
Agriculture/AquacultureM:Chemicals
M:Wood ProductsM:Textiles
M:Food ProcessingM:Furniture
Domestic Investors
0 10 20 30 40 50 60
M:MachineryEdu/Healths/Labour services
Financial/InsuranceM:Wood Products
M:LeatherAgriculture/Aquaculture
Others ServicesM:Food Processing
M:ChemicalsM:Furniture
M:GarmentsConstruction
M:Motor VehiclesM:Basic Metals
Wholesale/RetailM:Rubber/Plastics
Professional ServicesM:Textiles
Electricity/Gas/ACInformation/Communication
M:Fabricated MetalsM:Computers/Electronics
M:Electronic Equip.M: Other
M:Paper ProductsReal Estate
Foreign Investors
Total Share of Fewer Workers (%)
Fewer Workers, Same Tasks Fewer Workers, Less Sophisticated Tasks
Fewer Workers, More Sophisticated Tasks
Source: PCI QJ.4 and PCI-FDI QL.4: “Which statement best describes the way in which automated and digital means of production has affected your employment decisions?” By two-digit sector from ISIC Rev. 4, analysis limited to firms that have automated at least one task (n=1050 foreign and 5937 domestic).
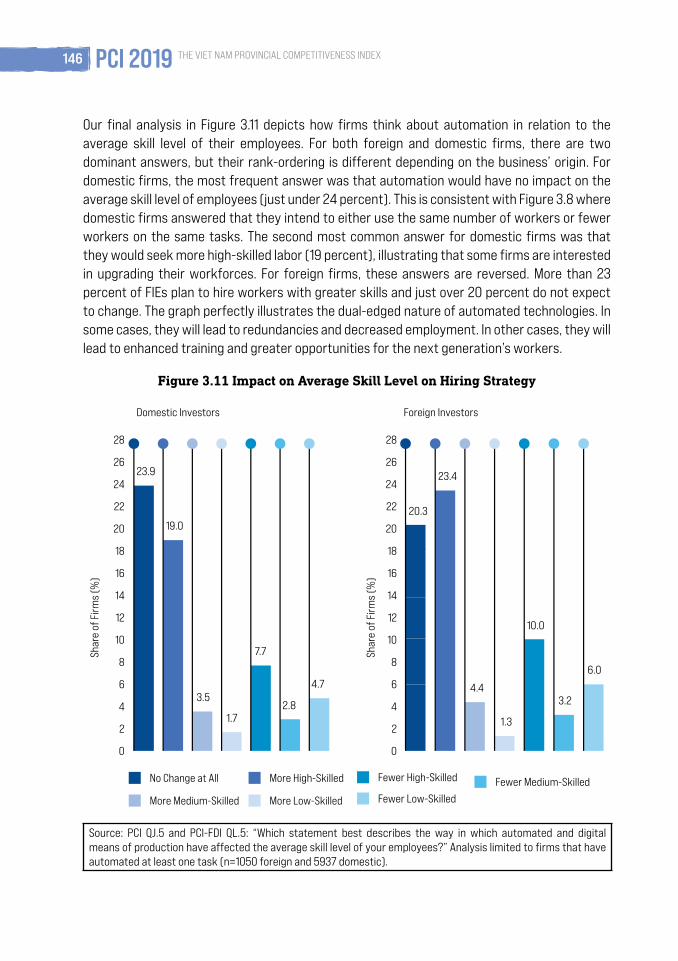
146 PCI 2019 THE VIET NAM PROVINCIAL COMPETITIVENESS INDEX
Our final analysis in Figure 3.11 depicts how firms think about automation in relation to the average skill level of their employees. For both foreign and domestic firms, there are two dominant answers, but their rank-ordering is different depending on the business’ origin. For domestic firms, the most frequent answer was that automation would have no impact on the average skill level of employees (just under 24 percent). This is consistent with Figure 3.8 where domestic firms answered that they intend to either use the same number of workers or fewer workers on the same tasks. The second most common answer for domestic firms was that they would seek more high-skilled labor (19 percent), illustrating that some firms are interested in upgrading their workforces. For foreign firms, these answers are reversed. More than 23 percent of FIEs plan to hire workers with greater skills and just over 20 percent do not expect to change. The graph perfectly illustrates the dual-edged nature of automated technologies. In some cases, they will lead to redundancies and decreased employment. In other cases, they will lead to enhanced training and greater opportunities for the next generation’s workers.
Figure 3.11 Impact on Average Skill Level on Hiring Strategy
Shar
e of
Firm
s (%
)
Domestic Investors
Shar
e of
Firm
s (%
)
Foreign Investors
No Change at All More High-Skilled
More Medium-Skilled More Low-Skilled
Fewer High-Skilled Fewer Medium-SkilledFewer Low-Skilled
23.9
19.0
3.5
1.7
7.7
2.8
4.7
0
2
4
6
8
10
12
14
16
18
20
22
24
26
28
20.3
23.4
4.4
1.3
10.0
3.2
6.0
0
2
4
6
8
10
12
14
16
18
20
22
24
26
28
Source: PCI QJ.5 and PCI-FDI QL.5: “Which statement best describes the way in which automated and digital means of production have affected the average skill level of your employees?” Analysis limited to firms that have automated at least one task (n=1050 foreign and 5937 domestic).

147PCI 2019THE VIET NAM PROVINCIAL COMPETITIVENESS INDEX
3.4 POLICY RECOMMENDATIONS
Our analysis has shown that automation is already widespread among both domestic and foreign investors in Vietnam, and that both groups plan to continue investing in labor-saving technologies. We have further shown that the key drivers of these changes are three-fold: 1) the opportunities of global integration through supply chains; 2) the costs of recruiting and training suitably qualified workers; and 3) the threat of labor unrest disrupting business operations, especially for foreign firms. Finally, we demonstrated that while automation will increase employment in some sectors, especially for better trained and more sophisticated workers, it will be extremely disruptive for unskilled and low skilled workers. Given that automation is an unstoppable force that is likely to be undeterred by regulatory changes, what can Vietnamese policy-makers do to mitigate the harmful effects of new business technologies while simultaneously aiming to take advantage of the opportunities that automation provides?
Our recommendation is simple - Vietnamese authorities should double-down on their current legislative achievements in education and labor relations. Make sure these laws are implemented quickly and aggressively, and that, in so doing, bureaucrats adhere to the spirit envisioned by the laws’ architects. The Law on Education (No. 43/2019/QH14) and accompanying national curriculum reforms were aimed at enhancing the quality of general and vocational education with the specific goal of improving the skillsets for Vietnamese workers to succeed in an advanced economy. The 2021 Labor Code (No. 45/2019/QH14) broke new ground for working conditions and employee-labor relations.88 Both the Education Law and Labor Code were legislative achievements, but the corresponding implementing regulations and decrees at both national and local levels have yet to be written. By augmenting the skillsets of Vietnamese employees and reducing misunderstanding between workers and employers, successful execution of both laws will help mitigate any hurt stemming from firm-level automation decisions.
According to the PCI data, only 29 percent of foreign employers and 27 percent of domestic employers assess the workforce near where they do business in Vietnam as fully sufficient to meet their needs.89 The cost of retraining employees in-house is the largest contributor to their automating decisions, as firms have justifiable concerns about investing in training when those workers can so easily move on to competitors. To date, robots have proved more loyal. Better matching general and vocation educational training to business needs will reduce some of the current demands for automation and will prepare Vietnamese workers for better and higher paying jobs both now and after automation occurs. Because it will be extremely difficult
88 Evans, Alice. 2019. “The Politics of Pro-Worker Reforms,” Socio-Economic Review. <https://www.cgdev.org/sites/default/files/The%20Politics%20of%20Pro-Worker%20Reforms.pdf>
89 Question E9 on the PCI Domestic Survey and F2.1 on the PCI-FDI Survey, “Are workers’ skills in the province sufficient to meet firm needs?”

148 PCI 2019 THE VIET NAM PROVINCIAL COMPETITIVENESS INDEX
for Vietnamese leaders to anticipate what new jobs will be created due to automation, it is important to focus education on providing sets of fungible skills that allows workers to adapt quickly, learn new skills easily, and take advantage of technological change.90
Because fear of labor unrest appears to play a role in cautionary FIEs selecting automation,91 reforms that improve working conditions and allow for collective bargaining between workers and employers will reduce the immediate demand for automation by some foreign employers. At the same time, allowing for more constructive conduits between workers and businesses will provide opportunities for collective decision making about how best to prepare local workforces for automation. Inspired by domestic developments and recent international trade agreements, the amendments to the Labor Code took an enormous step by both broadly improving labor conditions and by allowing employee organizations within companies to operate with greater autonomy as opposed to being closely supervised by the state-run Vietnam General Confederation of Labor (VGCL). Successful implementation of the revised Labor Code will go a long way toward reducing some of the pain of firm-level automation decisions.
90 Nguyen Hang Thuy and Tri Trung Pham. 2019. “New Labor Code of Vietnam,” Baker and McKenzie Insights, December. https://www.vietnam-briefing.com/news/vietnam-approves-labor-code-2021.html/
91 Tran, Angie Ngoc. and Nørlund, I., 2015. “Globalization, Industrialization, and Labor Markets in Vietnam.” Journal of the Asia Pacific Economy, 20(1), pp.143-163.

149PCI 2019THE VIET NAM PROVINCIAL COMPETITIVENESS INDEX
3.5 STATISTICAL APPENDICES
Table 3.2 Descriptive Statistics of Regression Variables (Foreign Firms)
N Mean SD Min Max
Share of Automated Tasks (percent) 1583 10.57 20.17 0.00 100.00
Share of Planned Automated Tasks (percent) 1583 13.96 24.06 0.00 100.00
Employees at Establishment 1548 81.61 221.76 2.50 1500.00
Firm Age in Years 1505 9.60 5.87 1.00 30.00
Subsidiary of MNC=1 1583 0.27 0.44 0.00 1.00
Main Customer is FIE=1 1583 0.57 0.50 0.00 1.00
Main Customer is Overseas Buyer=1 1583 0.07 0.26 0.00 1.00
Climate Change Impact (1=Bad;10=Good) 1583 4.22 1.92 1.00 10.00
Training Costs/Total (percent) 1081 4.90 8.63 0.00 80.00
Avg. Strikes in Province-Sector 1575 0.04 0.10 0.00 1.00
Recruitment Costs/Total Costs (percent) 1190 2.93 8.06 0.00 100.00
Difficulty of Recruiting Technical Workers (5=V. Difficult) 1401 2.98 0.74 1.00 5.00
Quality of General Education (4=V. Good) 1294 4.41 0.77 1.00 6.00
Worker Skills Meet Firm’s Needs (4=Not Sufficient) 1411 1.76 0.53 1.00 4.00
Table 3.3 Descriptive Statistics of Regression Variables (Domestic Firms)
N Mean SD Min Max
Share of Automated Tasks (percent) 8773 10.21 20.24 0.00 100.00
Share of Planned Automated Tasks (percent) 8773 15.55 26.12 0.00 100.00
Employees at Establishment 8581 21.16 83.46 2.50 1500.00
Firm Age in Years 8772 8.77 6.49 1.00 60.00
Joint Stock Company=1 8773 0.19 0.39 0.00 1.00
Main Customer is FIE=1 8773 0.17 0.38 0.00 1.00
Main Customer is Overseas Buyer=1 8773 0.09 0.28 0.00 1.00
Climate Change Impact (1=Bad;10=Good) 8773 4.31 1.87 1.00 10.00
Training Costs/Total (percent) 6146 6.30 9.64 0.00 50.00
Worker Skills Meet Firm’s Needs (4=Not Sufficient) 7345 1.83 0.60 1.00 4.00
Recruitment Costs/Total Costs (percent) 6058 4.89 9.36 -25.00 50.00
Difficulty of Recruiting Technical Workers (5=V. Difficult) 6563 2.93 0.82 1.00 5.00
Quality of General Education (4=V. Good) 7665 2.45 0.79 1.00 6.00

150 PCI 2019 THE VIET NAM PROVINCIAL COMPETITIVENESS INDEX
Table 3.4 Correlates of Automated Tasks (OLS with Foreign Investor Sample)
Dependent Variable =Share of Automated Tasks (percent)
(1) (2) (3) (4) (5) (6) (7) (8)
Employees at Establishment 0.001 0.001 0.001 0.000 0.000 -0.001 0.000 0.000
(#) (0.002) (0.004) (0.002) (0.003) (0.002) (0.002) (0.002) (0.004)
Firm Age -0.168** -0.260* -0.234** -0.215** -0.261** -0.192* -0.172** -0.266*
(Years) (0.077) (0.130) (0.108) (0.081) (0.095) (0.098) (0.079) (0.133)
Multinational Corporation=1 2.017* 2.074 1.901 1.558 1.445 2.117* 1.940 2.048
(1.151) (1.727) (1.538) (1.015) (1.206) (1.125) (1.140) (1.709)
Main Customer is FIE=1 1.586* 1.798 1.970 0.908 1.392 1.243 1.514 1.734
(0.890) (1.799) (1.279) (0.931) (0.906) (0.865) (0.885) (1.791)
Main Customer is Overseas Buyer=1 3.428** 3.257 2.327 3.375** 3.571* 4.265** 3.189* 2.939
(1.589) (2.306) (2.194) (1.606) (1.921) (1.662) (1.588) (2.331)
Climate Change Impact 0.023 0.197 -0.041 0.046 -0.133 -0.029 0.008 0.174
(1=Bad;10=Good) (0.245) (0.295) (0.246) (0.276) (0.280) (0.256) (0.240) (0.290)
Training Costs/Total 0.131** 0.135**
(percent) (0.062) (0.062)
Recruitment Costs/Total Costs 0.058
(percent) (0.082)
Difficulty of Recruiting Technical Workers 0.218
(1=V. Easy; 5=V. Difficult) (0.552)
Quality of General Education -0.761
(1=V. Bad; 4=V. Good) (0.588)
Worker Skills Meet Firm’s Needs -1.167
(1=Sufficient; 4=Not Sufficient) (1.076)
Avg. Strikes in Province-Sector 7.865 9.848*
(4.606) (5.431)
Constant 10.384*** 11.540*** 12.124*** 11.177*** 16.076*** 13.478*** 10.318*** 11.432***
(1.518) (2.371) (1.888) (2.398) (2.431) (2.481) (1.495) (2.399)
Observations 1,480 1,038 1,138 1,322 1,222 1,338 1,472 1,034
Clusters 21 21 21 21 21 21 21 21
R-squared 0.042 0.064 0.053 0.045 0.049 0.048 0.043 0.067
RMSE 19.92 20.89 20.57 20.27 20.03 20.01 19.95 20.89
Ordinary Least Squares with robust standard errors, clustered at province level, in parentheses (*** p<0.01, ** p<0.05, * p<0.1).

151PCI 2019THE VIET NAM PROVINCIAL COMPETITIVENESS INDEX
Table 3.5 Correlates of Planned Automation with (OLS with Foreign Investor Sample)
Dependent Variable =Share of Planned Tasks (percent)
(1) (2) (3) (4) (5) (6) (7) (8)
Employees at Establishment 0.001 -0.000 0.000 0.001 0.001 -0.000 0.000 -0.002
(#) (0.003) (0.005) (0.003) (0.003) (0.003) (0.003) (0.003) (0.004)
Firm Age -0.364*** -0.536*** -0.482*** -0.452*** -0.461*** -0.387*** -0.370*** -0.549***
(Years) (0.089) (0.168) (0.125) (0.106) (0.120) (0.102) (0.094) (0.174)
Multinational Corporation=1 3.231** 3.763 3.014* 2.927* 2.254 3.136** 3.149** 3.788
(1.341) (2.381) (1.698) (1.428) (1.367) (1.381) (1.317) (2.354)
Main Customer is FIE=1 2.163 2.562 2.802 1.698 1.987 1.731 2.110 2.530
(1.265) (2.076) (1.798) (1.290) (1.390) (1.338) (1.259) (2.058)
Main Customer is Overseas Buyer=1 5.815*** 5.013** 5.126** 5.808*** 6.532*** 6.556*** 5.465*** 4.532**
(1.586) (2.094) (2.017) (1.578) (2.238) (1.520) (1.547) (2.105)
Climate Change Impact 0.449* 0.584* 0.317 0.438 0.389 0.438 0.419* 0.534
(1=Bad;10=Good) (0.252) (0.329) (0.296) (0.317) (0.281) (0.265) (0.240) (0.318)
Training Costs/Total 0.208** 0.211**
(percent) (0.092) (0.092)
Recruitment Costs/Total Costs 0.049
(percent) (0.100)
Difficulty of Recruiting Technical Workers 1.395*
(1=V. Easy; 5=V. Difficult) (0.804)
Quality of General Education -1.009
(1=V. Bad; 4=V. Good) (0.848)
Worker Skills Meet Firm’s Needs 0.264
(1=Sufficient; 4=Not Sufficient) (1.511)
Avg. Strikes in Province-Sector 13.601** 17.860***
(5.676) (6.057)
Constant 13.179*** 15.708*** 15.968*** 11.089*** 20.039*** 13.795*** 12.977*** 15.453***
(1.437) (2.604) (2.169) (2.998) (4.581) (2.393) (1.431) (2.634)
Observations 1,480 1,038 1,138 1,322 1,222 1,338 1,472 1,034
Clusters 21 21 21 21 21 21 21 21
R-squared 0.055 0.076 0.067 0.062 0.063 0.061 0.058 0.081
RMSE 23.72 25.24 24.37 24.16 23.97 23.90 23.74 25.21
Ordinary Least Squares with robust standard errors, clustered at province level, in parentheses (*** p<0.01, ** p<0.05, * p<0.1)
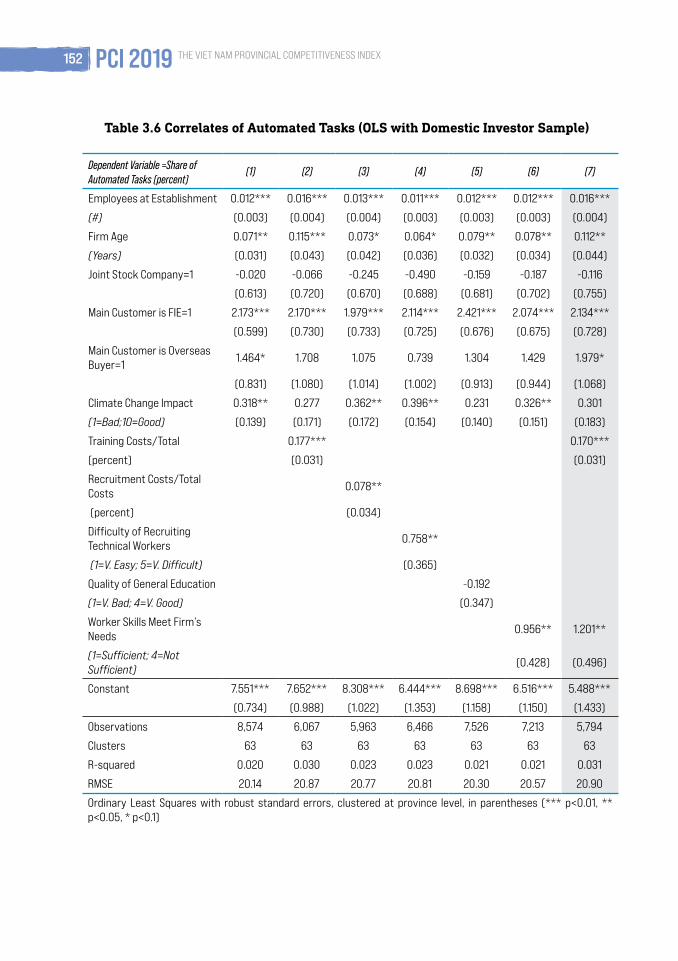
152 PCI 2019 THE VIET NAM PROVINCIAL COMPETITIVENESS INDEX
Table 3.6 Correlates of Automated Tasks (OLS with Domestic Investor Sample)
Dependent Variable =Share of Automated Tasks (percent)
(1) (2) (3) (4) (5) (6) (7)
Employees at Establishment 0.012*** 0.016*** 0.013*** 0.011*** 0.012*** 0.012*** 0.016***
(#) (0.003) (0.004) (0.004) (0.003) (0.003) (0.003) (0.004)
Firm Age 0.071** 0.115*** 0.073* 0.064* 0.079** 0.078** 0.112**
(Years) (0.031) (0.043) (0.042) (0.036) (0.032) (0.034) (0.044)
Joint Stock Company=1 -0.020 -0.066 -0.245 -0.490 -0.159 -0.187 -0.116
(0.613) (0.720) (0.670) (0.688) (0.681) (0.702) (0.755)
Main Customer is FIE=1 2.173*** 2.170*** 1.979*** 2.114*** 2.421*** 2.074*** 2.134***
(0.599) (0.730) (0.733) (0.725) (0.676) (0.675) (0.728)
Main Customer is Overseas Buyer=1 1.464* 1.708 1.075 0.739 1.304 1.429 1.979*
(0.831) (1.080) (1.014) (1.002) (0.913) (0.944) (1.068)
Climate Change Impact 0.318** 0.277 0.362** 0.396** 0.231 0.326** 0.301
(1=Bad;10=Good) (0.139) (0.171) (0.172) (0.154) (0.140) (0.151) (0.183)
Training Costs/Total 0.177*** 0.170***
(percent) (0.031) (0.031)
Recruitment Costs/Total Costs 0.078**
(percent) (0.034)
Difficulty of Recruiting Technical Workers 0.758**
(1=V. Easy; 5=V. Difficult) (0.365)
Quality of General Education -0.192
(1=V. Bad; 4=V. Good) (0.347)
Worker Skills Meet Firm’s Needs 0.956** 1.201**
(1=Sufficient; 4=Not Sufficient) (0.428) (0.496)
Constant 7.551*** 7.652*** 8.308*** 6.444*** 8.698*** 6.516*** 5.488***
(0.734) (0.988) (1.022) (1.353) (1.158) (1.150) (1.433)
Observations 8,574 6,067 5,963 6,466 7,526 7,213 5,794
Clusters 63 63 63 63 63 63 63
R-squared 0.020 0.030 0.023 0.023 0.021 0.021 0.031
RMSE 20.14 20.87 20.77 20.81 20.30 20.57 20.90
Ordinary Least Squares with robust standard errors, clustered at province level, in parentheses (*** p<0.01, ** p<0.05, * p<0.1)

153PCI 2019THE VIET NAM PROVINCIAL COMPETITIVENESS INDEX
Table 3.7 Correlates of Planned Automation (OLS with Domestic Investor Sample)
Dependent Variable =Share of Planned Tasks (percent)
(1) (2) (3) (4) (5) (6) (7)
Employees at Establishment 0.013*** 0.018*** 0.015*** 0.011*** 0.013*** 0.012*** 0.018***
(#) (0.004) (0.005) (0.004) (0.004) (0.004) (0.004) (0.005)
Firm Age -0.066 -0.039 -0.084* -0.071 -0.076* -0.047 -0.028
(Years) (0.040) (0.049) (0.049) (0.048) (0.041) (0.046) (0.051)
Joint Stock Company=1 1.039 1.411 1.042 0.541 0.870 0.761 1.148
(0.746) (0.869) (0.888) (0.827) (0.829) (0.883) (0.929)
Main Customer is FIE=1 3.244*** 3.070*** 2.937*** 2.485*** 3.323*** 2.840*** 2.951***
(0.740) (0.903) (0.981) (0.918) (0.827) (0.857) (0.926)
Main Customer is Overseas Buyer=1 3.943*** 4.698*** 4.072*** 3.045** 3.465*** 3.881*** 4.901***
(1.073) (1.225) (1.154) (1.234) (1.118) (1.177) (1.228)
Climate Change Impact 0.309* 0.201 0.297 0.347* 0.162 0.306 0.253
(1=Bad;10=Good) (0.172) (0.218) (0.213) (0.195) (0.183) (0.195) (0.232)
Training Costs/Total 0.257*** 0.240***
(percent) (0.045) (0.044)
Recruitment Costs/Total Costs 0.104**
(percent) (0.041)
Difficulty of Recruiting Technical Workers 0.947**
(1=V. Easy; 5=V. Difficult) (0.437)
Quality of General Education -0.069
(1=V. Bad; 4=V. Good) (0.397)
Worker Skills Meet Firm’s Needs 2.292*** 2.636***
(1=Sufficient; 4=Not Sufficient) (0.511) (0.583)
Constant 13.578*** 14.442*** 15.461*** 13.177*** 15.261*** 10.676*** 9.648***
(0.930) (1.228) (1.302) (1.577) (1.494) (1.372) (1.675)
Observations 8,574 6,067 5,963 6,466 7,526 7,213 5,794
Clusters 63 63 63 63 63 63 63
R-squared 0.022 0.032 0.026 0.022 0.022 0.023 0.035
RMSE 25.97 26.76 26.82 26.94 26.31 26.49 26.79
Ordinary Least Squares with robust standard errors, clustered at province level, in parentheses (*** p<0.01, ** p<0.05, * p<0.1)

154 PCI 2019 THE VIET NAM PROVINCIAL COMPETITIVENESS INDEX
REFERENCES
Acemoglu, Daron, Claire Lelarge, and Pascual Restrepo. (2020). Competing with Robots: Micro Evidence from France. Presented at the Annual Meeting of the American Economics Association. January 3. Retrieved from https://www.aeaweb.org/conference/2020/preliminary/1265?q=eNqrVipOLS7OzM8LqSxIVbKqhnGVrAxrawGlCArI
Anseel, F., Lievens, F., Schollaert, E., & Choragwicka, B. (2010). Response rates in organizational science, 1995–2008: A meta-analytic review and guidelines for survey researchers. Journal of Business and Psychology, 25(3), 335-349.
Belser, Patrick. (1999). Vietnam: on the Road to Labor-Intensive growth? Background paper for the Vietnam Development Report 2000, Vietnam: Attacking Poverty, Joint Report of the Government of Vietnam –Donor- NGO Poverty Working Group. Hanoi, Vietnam.
Belser, Patrick. and Rama, Martin. (2001). State Ownership and Labor Redundancy: Estimates Based on Enterprise-level Data from Vietnam (Vol. 2599). World Bank, Washington DC.
Bessen, J.E., Goos, M., Salomons, A. and Van den Berge, W. (2019). Automatic Reaction-What Happens to Workers at Firms that Automate?. Boston Univ. School of Law, Law and Economics Research Paper. <https://scholarship.law.bu.edu/cgi/viewcontent.cgi?article=1585&context=faculty_scholarship>
Carbonero, Francesco, Ekkehard Ernst, and Enzo Weber. (2018). Robots worldwide: The Impact of Automation on Employment and Trade. ILO Research Department Working Paper 36: 23-37.
CEIC. (2020), Vietnam Labour Force Participation Rate. CEIC Data. https://www.ceicdata.com/en/indicator/vietnam/labour-force-participation-rate
Coxhead, Ian., and Diep Phan. 2013. Princelings and paupers? State employment and the distribution of human capital investments among households in Viet Nam. Asian Development Review 30.2: 26-48.
Cunningham, Wendy, and Obert Pimhidzai. (2018). Vietnam’s Future Jobs: Leveraging Mega-Trends for Greater Prosperity. World Bank: Hanoi, Vietnam.
CustomsNews. (2019, November 21). Tax inspections attract lower satisfaction index: VCCI. Customs News. Retrieved from https://customsnews.vn/tax-inspections-attract-lower-satisfaction-index-vcci-12656.html/

155PCI 2019THE VIET NAM PROVINCIAL COMPETITIVENESS INDEX
Dao, Viet Anh. (2019, January 8). Maximize convenience for enterprises to participate in social insurance, Ministry of Finance Website. Retrieved from https://tinyurl.com/t96hr5y
Das, Koushan. (2018). Labor Market Trends in Vietnam. VietnamBriefing, June 29. Retrieved from https://www.vietnam-briefing.com/news/labor-market-trends-vietnam.html/
Deutsche Gesellschaft für Internationale Zusammenarbeit (GIZ). (2016). Vietnam Power Development Plan for the period 2011 – 2020: Highlights of the PDP 7 Revised. GIZ. Hanoi, Vietnam. Retrieved from http://gizenergy.org.vn/media/app/media/legal%20documents/GIZ_PDP%207%20rev_Mar%202016_Highlights_IS.pdf
Dezan Shira and Associates. (2018). Vietnam: Sectors in Focus for 2018 Tax Audits. Vietnam Briefing, Ho Chi Minh City, Vietnam. Retrieved from https://www.vietnam-briefing.com/news/vietnam-sectors-focus-2018-tax-audits.html/
Duffing, Erin. (2019). Manufacturing labor costs per hour for China, Vietnam, Mexico from 2016 to 2020. STATISTA. Retrieved from https://www.statista.com/statistics/744071/manufacturing-labor-costs-per-hour-china-vietnam-mexico/
Economist. (2016, June 23). Special Report: Automation and Anxiety: Will Smarter Machines Cause Mass Unemployment?. The Economist. Retrieved from https://www.economist.com/special-report/2016/06/23/automation-and-anxiety
Eggleston, Karen., Yong Suk Lee, and Toshiaki Iizuk. The Impact of Robots on Nursing Home Care in Japan. Exploring the Implications of Robotic Technologies Adoption in Aging Societies. Stanford Shorenstein Center Working Papers. Retrieved from https://aparc.fsi.stanford.edu/research/impact-robots-nursing-home-care-japan
Evans, Alice. (2019). The Politics of Pro-Worker Reforms. Socio-Economic Review. Retrieved from https://www.cgdev.org/sites/default/files/The%20Politics%20of%20Pro-Worker%20Reforms.pdf
Frey, Carl Benedikt, and Michael A., Osborne. (2017). The Future of Employment: How Susceptible Are Jobs to Computerization? Technological Forecasting and Social Change 114: 254-280.
General Statistics Office, Statistical Yearbook of Vietnam 2013.
General Statistical Office. (2019). Socio-Economic Situation in 2019. Hanoi, Vietnam. Retrieved from https://www.gso.gov.vn/default_en.aspx?tabid=622&ItemID=19463

156 PCI 2019 THE VIET NAM PROVINCIAL COMPETITIVENESS INDEX
Ho Chi Minh City Law Newspaper. (May 21, 2013). Investment procedures like a “maze,” (2013). Phap luat TP Ho Chi Minh. Retrieved from https://plo.vn/kinh-te/quan-ly/thu-tuc-dau-tu-nhu-ma-tran-380355.html
Investment Online (Đầu tư Online) (2018, October 6). Binh Duong: A highlight in infrastructure development associated with smart urban development. Đầu tư Online. Retrieved from <https://baodautu.vn/binh-duong-diem-sang-xay-dung-co-so-ha-tang-gan-voi-phat-trien-do-thi-thong-minh-d88990.html>
Jaax, Alexander. (2020). Private sector development and provincial patterns of poverty: Evidence from Vietnam. World Development, 127. Retrieved from https://doi.org/10.1016/j.worlddev.2019.104747
Kerkvliet, Benedict J. Tria. (2019). Speaking Out in Vietnam: Public Political Criticism in a Communist Party–Ruled Nation. Cornell University Press
Kunst, David. (2019). Premature Deindustrialization through The Lens of Occupations: Which Jobs, Why, and Where? Tinbergen Institute Discussion Paper, August 2, 2019-033. Retrieved from https://ssrn.com/abstract=3383582 or http://dx.doi.org/10.2139/ssrn.3383582
Malesky, Edmund., (2015). Transfer Pricing and Global Poverty. International Studies Review, 17(4), pp.669-677.
Malesky, Edmund., Dimitar Gueorguiev, and Nathan Jensen (2015). Monopoly Money: Foreign Investment and Bribery in Vietnam, A Survey Experiment. American Journal of Political Science 59(2): 419-439.
Malesky, Edmund., Phan Tuan Ngoc, and Pham Ngoc Thach. (2018). The Vietnam Provincial Competitiveness Index: Measuring Economic Governance for Private Sector Development, 2017 Final Report, Vietnam Chamber of Commerce and Industry and United States Agency for International Development: Hanoi, Vietnam. <http://pcivietnam.org/danh-muc-du-lieu/du-lieu-pci/>
Malesky, Edmund., and Layna, Mosley. (2019). Labor Upgrading, Trade Agreements and Export Market Opportunities: Evidence from Vietnam. Presented at the 2019 Annual Meeting of the International Political Economy Society, San Diego, CA, November 14th. Retrieved from http://laynamosley.web.unc.edu/files/2019/07/20190812_MM_TariffsUpgrading_Final3_ejm.pdf
Malesky, Edmund., and Phan Thuan Ngoc. (2019). “Rust Removal: Why Vietnam’s Historical Anticorruption Efforts Failed to Deliver Results, and What That Implies for the Current Campaign”, in Chen, Cheng, and Meredith L. Weiss, eds. The Political Logics of Anticorruption Efforts in Asia. SUNY Press, 2019.

157PCI 2019THE VIET NAM PROVINCIAL COMPETITIVENESS INDEX
Malesky, Edmund., Phan Tuan Ngoc, and Pham Ngoc Thach. (2019). Special Investigation of Global Integration and International Contracting in Vietnam. The Vietnam Provincial Competitiveness Index: Measuring Economic Governance for Private Sector Development, 2018 Final Report, Vietnam Chamber of Commerce and Industry and United States Agency for International Development: Hanoi, Vietnam, pp90-105
McCaig, B. and Pavcnik, N. (2013). Moving out of agriculture: structural change in Vietnam (No. w19616). National Bureau of Economic Research. Retrieved from https://www.nber.org/papers/w19616.pdf
McCaig, Brian., and Pavcnik, Nina. (2018). Export Markets and Labor Allocation in a Low-Income Country. American Economic Review, 108(7): 1899-1941.
Mellahi, K., and Harris, L. C. (2016). Response rates in business and management research: An overview of current practice and suggestions for future direction. British Journal of Management, 27(2), 426-437.
Minh Ha-Duong, Hoai-Son Nguyen. (2017). Is electricity affordable and reliable for all in Vietnam? Presented at The tenth Vietnam Economist Annual Meeting - VEAM 2017, Banking University Ho Chi Minh City; Development and Policies Research Center (DEPOCEN); CNRS; Foreign Trade University (FTU), August, Ho Chi Minh City, Vietnam. <https://hal-enpc.archives-ouvertes.fr/hal-01389981v3/document>”
Nguyen, Binh T., Loi Chi Cu, and Chien Thang Nguyen. (2009). A Stocktaking of Viet Nam’s labor market Policies. Labor Markets in Asia. Palgrave Macmillan, London, 2006. 559-629.
Nguyen Hang Thuy and Tri Trung Pham. (2019). New Labor Code of Vietnam. Baker and McKenzie Insights. December 10. https://www.vietnam-briefing.com/news/vietnam-approves-labor-code-2021.html/
Nguyen, P. X. (2016, May 16). Vê Hỗ trơ va Phat triên Doanh nghiêp đên năm 2020. Thu Vien Phap Luat. Retrieved from https://thuvienphapluat.vn/van-ban/Doanh-nghiep/Nghi-quyet-35-NQ-CP-ho-tro-phat-trien-doanh-nghiep-2020-2016-311331.aspx
Nguyen, P. X. (2017, May 17). Vê Viêc Chân Chinh Hoat Đông Thanh Tra Kiêm Tra Đôi Vơi Doanh Nghiêp. Thu Vien Phap Luat. Retrieved from https://thuvienphapluat.vn/van-ban/Doanh-nghiep/Chi-thi-20-CT-TTg-2017-chan-chinh-thanh-tra-kiem-tra-doanh-nghiep-349402.aspx
Nguyen, P. X. (2018a, November 9). Ban Hanh Chương Trình Hanh Đông Cắt Giảm Chi Phí Cho Doanh Nghiêp. Vietnamese Government Electronic Portal. Retrieved from http://vanban.chinhphu.vn/portal/page/portal/chinhphu/hethongvanban?class_id=509&mode=detail&document_id=195260

158 PCI 2019 THE VIET NAM PROVINCIAL COMPETITIVENESS INDEX
Nguyen, P. X. (2018b). Vê Tiêp Tục Thực Hiên Những Nhiêm Vụ, Giải Phap Chủ Yêu Cải Thiên Môi Trường Kinh Doanh, Nâng Cao Năng Lực Canh Tranh Quôc Gia Năm 2017, Định Hương Đên Năm 2020. Thu Vien Phap Luat. Retrieved from https://thuvienphapluat.vn/van-ban/Doanh-nghiep/Nghi-quyet-19-2017-NQ-CP-tiep-tuc-thuc-hien-nhiem-vu-giai-phap-chu-yeu-cai-thien-moi-truong-kinh-doanh-338606.aspx
Nguyen, Quynh. (2020, January 7). Không phải chi khi giau thì người Viêt mơi biêt sơ ô nhiễm. Zing.Vn <https://news.zing.vn/khong-phai-chi-khi-giau-thi-nguoi-viet-moi-biet-so-o-nhiem-post1029218.html>
Nguyen, Thi Minh. (2009). Dynamic Demographics and Economic Growth in Vietnam. Journal of the Asia Pacific Economy, 14(4): 389-398.
Nguyen, Thuy Hang and Pham, Tri Dung. (2019). New Labor Code of Vietnam. Baker and McKenzie, December. Retrieved from https://f.datasrvr.com/fr1/719/65391/Client_Alert_-_Amended_Labor_Code_2019_.pdf
Nguyen, T.V., Ho, B.D., Le, C.Q. and Nguyen, H.V., 2016. Strategic and transactional costs of corruption: perspectives from Vietnamese firms. Crime, Law and Social Change, 65(4-5), pp.351-374.
Organization for Economic Cooperation and Development (OECD). (2019). Multidimensional review. OECD. p70, 80.
Organization for Economic Cooperation and Development (OECD). (2019). Multi-dimensional Review of Viet Nam. Suggestions for an integrated, transparent and sustainable economy “Viet Nam 4.0.” OECD. Paris, France, p124.
Organization for Economic Cooperation and Development (OECD).(2020). Multi-Dimension Review. OECD. p.25
Phan, Tuyen. (2019) Gather force to fight “black credit” and “underground society,” Hochiminh City Law News, 9/1/2019. Retrieved from https://plo.vn/thoi-su/nam-2019-tong-luc-dau-tranh-tin-dung-den-va-xa-hoi-den-812079.html
Preliminary review of improvement of business and investment environment and improvement of provincial competitiveness in 2019. (2019, August 28). Quang Ninh Province Portal. Retrieved from https://www.quangninh.gov.vn/Trang/ChiTietTinTuc.aspx?nid=85887

159PCI 2019THE VIET NAM PROVINCIAL COMPETITIVENESS INDEX
Provinces, agencies to change mindset, action and uphold common goals. (2019, November 12). Quang Ninh Province Portal. Retrieved from http://www.baoquangninh.com.vn/kinh-te/201911/chu-tich-ubnd-tinh-nguyen-van-thang-cac-dia-phuong-so-nganh-phai-thay-doi-tu-duy-hanh-dong-nghi-ve-cai-chung-2460702/?fbclid=IwAR1fPWQhfiGFbouoH-mTxt0kNRy0-6RjBWrIjyPntXnxa1WOEWQPivEfdeA
“Public servants” in the @ era. (2018, September 13). Bac Ninh Newspaper. Retrieved from http://baobacninh.com.vn/chi-tiet-dang-voi-nhan-dan/-/details/20182/-cong-boc-cua-d-3
Rodrik, D., (2016). Premature Deindustrialization. Journal of Economic Growth, 21(1): 1-33.
Schlogl, Lukas, and Andy Sumner. (2018). The rise of the robot reserve army: automation and the future of economic development, work, and wages in developing countries. Center for Global Development Working Paper. 487.
Thời bao Tai chính Viêt Nam (Vietnam Financial News) (2016, October, 18). Law to tackle obstacles in investment and business doing: Not suitable to submit to National Assembly. Vietnam Financial News. Retrieved from http://thoibaotaichinhvietnam.vn/pages/thoi-su/2016-10-18/luat-ve-go-vuong-trong-dau-tu-kinh-doanh-chua-du-dieu-kien-trinh-quoc-hoi-36867.aspx
Tran, Angie Ngoc., (2007). Alternatives to the “Race to the Bottom” in Vietnam: Minimum Wage Strikes and their Aftermath. Labor Studies Journal, 32(4), pp.430-451
Tran, Angie Ngoc., and Nørlund, I. (2015). Globalization, Industrialization, and Labor Markets in Vietnam. Journal of the Asia Pacific Economy, 20(1), pp.143-163.
VCCI and Australia Aid. (2019). Report on implementation of Government Decree 02 in 2019 and Decree 35 in 2016: From firms’ perspective. Hanoi, December.
VIBOnline. (2013 December 10). Proposal of inter-ministerial joint circular on administrative procedures applicable for investment projects by Ministry of Planning and Investment. VIBOnline. Retrieved from <http://vibonline.com.vn/du_thao/du-thao-thong-tu-lien-tich-huong-dan-quy-trinh-giai-quyet-thu-tuc-hanh-chinh-ve-dau-tu-xay-dung-dat-dai-va-moi-truong-de-thuc-hien-du-an-dau-tu >
Vietnam Chamber of Commerce and Industry. (2019). Customs Enterprise Satisfaction Survey Report, Hanoi, Vietnam, January 11.
Vietnam Economic News (VEN). (2019). Vietnam attracts foreign investors in renewable energy. September, 26. VEN. Retrieved from http://ven.vn/vietnam-attracts-foreign-investors-in-renewable-energy-40679.html

160 PCI 2019 THE VIET NAM PROVINCIAL COMPETITIVENESS INDEX
Vietnam News. (2018, December 28). New General Educational Curriculum Unveiled. Vietnam News. Retrieved from https://vietnamnews.vn/society/482917/new-general-educational-curriculum-unveiled.html
VN Express. (2019, December 30). Newly established businesses highest ever in 2019, VN Express. Retrieved from https://vnexpress.net/kinh-doanh/doanh-nghiep-lap-moi-nam-2019-cao-ky-luc-4034489.html
Vo, Anne. (2009). The Transformation of Human Resource Management and Industrial Relations in Vietnam. Elsevier:, Amsterdam
World Bank. (2019). World Development Indicators Dataset. World Bank. Washington, DC. Retrieved from http://databank.worldbank.org/data/reports.aspx?source=world-development-indicators.
Publíhing licence No: 1132-2020/CXBIPH/10-23/TN and 569/QĐ-NXBTN Issued on April 6, 2020 ISBN: 978-604-9946-66-0


We invite you to become a sponsor and partner of the Provincial Competitiveness Index (PCI), the largest and most comprehensive business survey in Vietnam. The PCI has tremendously influenced provincial business environments across Vietnam by providing trusted, evidence-based findings regarding the experiences of private and foreign businesses with local institutions, administrative procedures, and infrastructure in the localities where they operate.
For more information on PCI, please visit our website at www.pcivietnam.vn
THANK YOU TO OUR PARTNERS AND SPONSORS
