artificial vegetation: a novel paper-based sound …
TRANSCRIPT

ARTIFICIAL VEGETATION:
A NOVEL PAPER-BASED SOUND ABSORBER
by
Amirhossein Salimian
B.Sc., Industrial Engineering, Tehran Azad University, 2010
A THESIS SUBMITTED IN PARTIAL FULFILMENT OF
THE REQUIREMENTS FOR THE DEGREE OF
MASTER OF APPLIED SCIENCE
in
THE FACULTY OF GRADUATE AND POSTDOCTORAL STUDIES
(Mechanical Engineering)
THE UNIVERSITY OF BRITISH COLUMBIA
(Vancouver)
January 2018
© Amirhossein Salimian, 2018
ii
Abstract
Demand for acoustic barriers in urban buildings grown in recent times fed by levels of
increasing urban noise. Extraneous urban noise in buildings was commonly controlled
using noise barriers like absorptive panels. The efficiency and sustainability of such noise
absorbers is suspect. Our research in acoustics led to the development of a novel paper-
based sound absorbers as a viable alternative for those currently available in the market.
We named this product Artificial Vegetation (AV). We tested AV and found it an efficient
and sustainable alternative that can be mass produced with relatively comparable low
overheads.
In this research paper we explored literature in acoustic barriers, both paper- and foam-
based. We also identified gaps in the literature. The paper elaborates measurement of
sound absorption coefficient using impedance-tube method, as a basic procedure for
producing AV. We developed an analytical model that optimizes and improves sound
absorptivity of AV. Data gathered from experiments were used to validate our model and
test as a computational platform in more AV designs.

iii
Lay summary
The outcome of our research project was a product for urban sound insulation in rooms
and buildings. This product, Artificial Vegetation (AV), utilized a porous paper-based
material and modified Origami method. We conducted a series of experiments to obtain
optimal acoustical characteristics. These experiments consisted of altering the physical
characteristics of the material such as thickness and porosity and studying the impact on
its acoustical characteristics. We developed a model to predict the behaviour of AV. This
model was validated and optimized from the experiments’ data that led to the final
prototype. AV can be used as a sustainable and effective acoustic barrier to urban noise
pollution in buildings.

iv
Preface
This thesis is an original, unpublished, and independent work of the author. All the
experiments, analysis and writing are performed under the direct supervision of Dr. James
Olson and Dr. Murray Hodgson in Mechanical Engineering department in UBC. The
MATLAB code of the prediction model, is a modification of Mr. Banda Logawa’s original
work.
v
Table of contents
Abstract ........................................................................................................................................................ ii
Lay Summary ............................................................................................................................................. iii
Preface ........................................................................................................................................................ iv
Table of contents ........................................................................................................................................ v
List of tables ............................................................................................................................................... vi
List of figures ............................................................................................................................................. vii
Acknowledgments ..................................................................................................................................... ix
Dedication .................................................................................................................................................... x
1. Introduction .......................................................................................................................................... 1
2 Background ......................................................................................................................................... 7
2.1 Sound absorption ..................................................................................................................... 10
2.1.1 Definition ............................................................................................................................ 10
2.2 Transmission loss ..................................................................................................................... 12
2.3 Prediction models for a Helmholtz resonator ....................................................................... 12
2.3.1 Transfer matrix method ................................................................................................... 13
2.4 Origami....................................................................................................................................... 18
2.4.1 Formation ........................................................................................................................... 18
2.5 Foam-paper ............................................................................................................................... 21
3 Experimental Procedure and Results ............................................................................................ 24
3.1 Impedance tube test ................................................................................................................ 24
3.2 Results ....................................................................................................................................... 29
4 Modeling and Optimization ............................................................................................................. 40
4.1 Modeling .................................................................................................................................... 40
4.2 Results ....................................................................................................................................... 41
4.3 Fitting the model to experimental data .................................................................................. 43
4.4 Sensitivity analysis ................................................................................................................... 45
5 Summary, Conclusions, and Final Remarks ................................................................................ 51
References ................................................................................................................................................ 53

vi
List of tables
Table 4-1 Parameters for the best fit to the experimental results ...............................................45
Table 4-2-Test matrix for sensitivity analysis. ............................................................................45

vii
List of figures
Figure 1-1 Total paper consumption by printing grade in North America between years 2000-
2009 ........................................................................................................................................... 1
Figure 1-2 -NBSK foam-paper at 50% air content. (Photographed by Anna Jamroz, UBC Pulp
and Paper Centre) (Ahmadi, 2016) ............................................................................................ 3
Figure 1-3 Folded tessellation (Sina, 2015). ............................................................................... 4
Figure 1-4 module-based green walls; natural vegetation. Adapted from (Azkorra et al., 2015) . 5
Figure 1-5 two self-folding Origami designs ............................................................................... 6
Figure 2-1 Sound behavior facing a surface. .............................................................................11
Figure 2-2 Transfer Matrix Model (TMM) representation for a multi-layer medium. ...................14
Figure 2-3 “Pyramid” designed with AutoCAD software. ............................................................19
Figure 2-4 Graphtec FC2250-180 .............................................................................................20
Figure 2-5 Graphtec 2250-180 dual heads ................................................................................20
Figure 2-6 Polymer attachment to the paper (adapted form (Sina, 2015)) .................................21
Figure 2-7 Drying foam-papers; exposed to air and a heater. ....................................................23
Figure 3-1 Impedance tube setup .............................................................................................25
Figure 3-2 two ¼ inches B&K 4178 phase matched microphones .............................................26
Figure 3-3 impedance tube with two microphones ....................................................................26
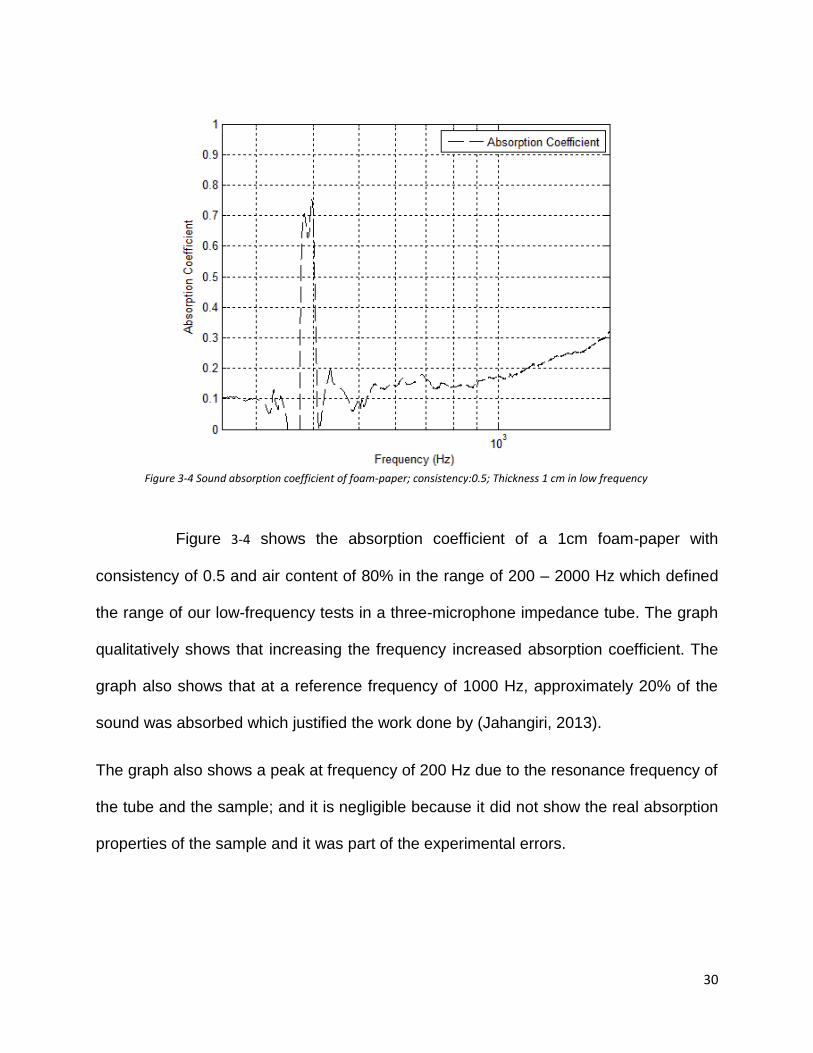
Figure 3-4 Sound absorption coefficient of foam-paper; consistency:0.5; Thickness 1 cm in low
frequency ..................................................................................................................................30
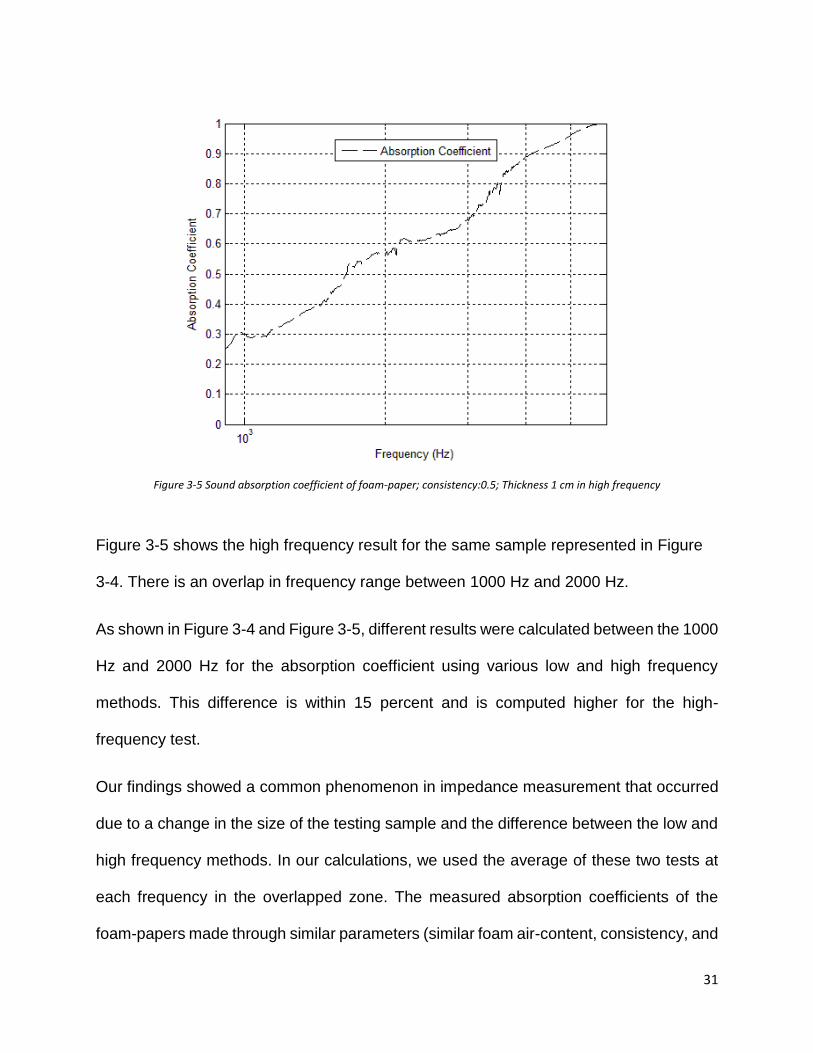
Figure 3-5 Sound absorption coefficient of foam-paper; consistency:0.5; Thickness 1 cm in high
frequency ..................................................................................................................................31
Figure 3-6 Artificial Vegetation ..................................................................................................33
Figure 3-7 Sound absorption coefficient of 1 cm thick foam-paper; consistency:0.5. (no grass) 34
Figure 3-8 Sound absorption coefficient of 1 cm thick foam-paper and 1 cm grass;
consistency:0.5. ........................................................................................................................34
Figure 3-9 Sound absorption coefficient of 1 cm thick foam-paper; consistency: 1. ...................35
Figure 3-10 Sound absorption coefficient of 1 cm thick foam-paper and 1 cm grass;
consistency:1. ...........................................................................................................................35
Figure 3-11 Sound absorption coefficient of 1 cm thick foam-paper and 3 cm grass;
consistency:1. ...........................................................................................................................36
Figure 3-12 Sound absorption coefficient of 1 cm thick foam-paper and 6 cm grass;
consistency:1. ...........................................................................................................................36
Figure 3-13 Q-dP graphs of a 1.5 cm thick foam-paper and a 1.5 cm thick artificial grass
product. .....................................................................................................................................37
Figure 3-14 Comparison between the sound absorption result of an AV product and a
commercial fibreglass absorber (results of the commercial absorber are provided by Kinetics
Noise Inc.) .................................................................................................................................38
Figure 4-1 n cm and two n/2 cm material ..................................................................................42
Figure 4-2 Model test: difference between n cm material and two n/2 cm the same material ....42
Figure 4-3 changing the thickness of the layer 1 from 1cm to 5 cm Vs doing the same for the
second layer .............................................................................................................................43
Figure 4-4 Model Vs Experiment result 1cm foam and 6cm grass ............................................44
viii
Figure 4-5 Tortuosity change of the foam from 2 to 4 ................................................................44
Figure 4-6 Porosity change of the foam from .9 to.8 ..................................................................44
Figure 4-7 Changing of shape factor from 3.4 to 8 ....................................................................44
Figure 4-8 Test A1: Changing the foam-paper porosity from 0.4 to 0.9 for the thicknesses of 1,2
and 6 cm. ..................................................................................................................................46
Figure 4-9 Test A2: Sensitivity analysis of air flow resistivity from 10000 to 1000 and 20000
(porosity = 0.9) ..........................................................................................................................47
Figure 4-10 Test A3: Sensitivity analysis of air-flow resistivity from 10000 to 1000 and 20000
(thickness=1cm; porosity = 0.6) ................................................................................................48
Figure 4-11 Test B: Sensitivity analysis of air-flow resistivity from 10000 to 1000 and 20000 (
porosity = 0.6 and thickness = 3 cm) .........................................................................................48
Figure 4-12 Test C: Sensitivity analysis of air-flow resistivity from 10000 to 1000 and 20000 (
porosity =0.6 and thickness = 9 cm) ..........................................................................................49
Figure 4-13 Test D: Sensitivity analysis of the tortuosity of layer 2, from 0.5 to 5 ......................50
Figure 4-14 Test E: Sensitivity analysis of the shape factor of layer 2, from 1 to 10 ..................50

ix
Acknowledgments
Firstly, I would like to express my sincerest gratitude to my supervisor, Dr. James Olson,
for the continuous support of my study and research since the start of my master’s degree
program.
I would like to offer my special thanks to Dr. Murray Hodgson who although no longer with
us, continues to inspire me by his dedication to his research and work. I was privileged
Dr. Hodgson as my supervisory committee member until August 2017
I would especially like to thank Pouyan Jahangiri for his invaluable help in the past years
and for the critical reviews of the thesis.
I would also like to thank Dr. Ali Elahimehr and my colleagues Hatef Rahmani,
Mohammad Shanbghazani, Chitra Arcot and Banda Logawa for their suggestions and
discussions.
My everlasting gratitude goes to my parents and my beloved brother, Sina, for the
endless support on this progressive road.

x
Dedication
To my dear parents, who have always been there for me.

1. Introduction
The Pulp and Paper sector has influenced the core of Canadian economy for more than
two centuries. Over time, pulp and paper manufacturing enterprises have undergone
revolutionary improvements, and diversified from paper grades to smart cellulose-based
membranes. The turn of the century saw the demand for the consumption of printing and
writing paper grade products dramatically diminish in North America. A large portion of
their market declined, substituted by electronic media.
Figure 1-1 Total paper consumption by printing grade in North America between years 2000-2009
The State of the Paper Industry in 2011 reported that the market for the printing grades -
66% of the total North American market – diminished by 25 percent (see Figure 1-1). The
strategic forest network in Canada realised that the industry was struggling for survival,
and that a major part of the Canadian traditional pulp and paper industry was dwindling.
It was unlikely to regain profitability in competition with the electronic media market. The
2
industry policies changed, and the industry started focusing on the production of wood
based eco-friendly biodegradable materials for a wide range of applications to diversify
its depleted markets (Green Fibre Network conference, 2015).
The recyclability and bio-compatibility as well as the low net cost of biodegradable
materials have drawn interest and investment of scientists and businesses attentions. An
abundant and cost-efficient use of these resources is cellulose which has been vastly
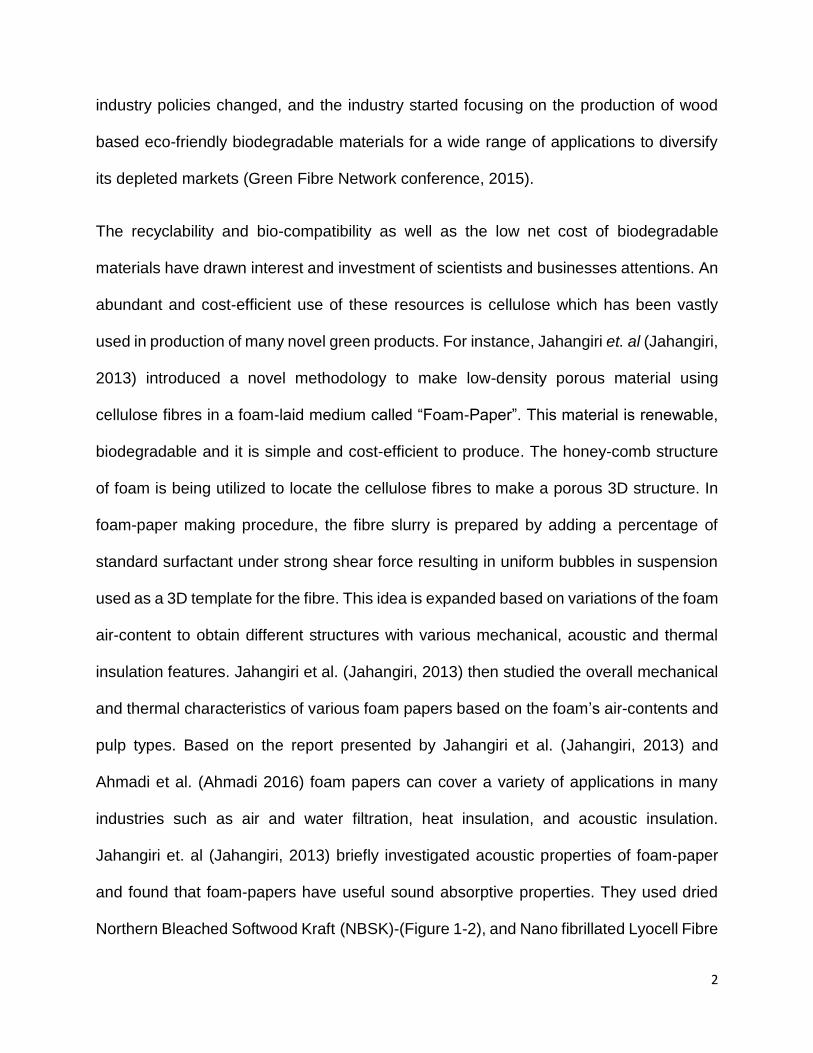
used in production of many novel green products. For instance, Jahangiri et. al (Jahangiri,
2013) introduced a novel methodology to make low-density porous material using
cellulose fibres in a foam-laid medium called “Foam-Paper”. This material is renewable,
biodegradable and it is simple and cost-efficient to produce. The honey-comb structure
of foam is being utilized to locate the cellulose fibres to make a porous 3D structure. In
foam-paper making procedure, the fibre slurry is prepared by adding a percentage of
standard surfactant under strong shear force resulting in uniform bubbles in suspension
used as a 3D template for the fibre. This idea is expanded based on variations of the foam
air-content to obtain different structures with various mechanical, acoustic and thermal
insulation features. Jahangiri et al. (Jahangiri, 2013) then studied the overall mechanical
and thermal characteristics of various foam papers based on the foam’s air-contents and
pulp types. Based on the report presented by Jahangiri et al. (Jahangiri, 2013) and
Ahmadi et al. (Ahmadi 2016) foam papers can cover a variety of applications in many
industries such as air and water filtration, heat insulation, and acoustic insulation.
Jahangiri et. al (Jahangiri, 2013) briefly investigated acoustic properties of foam-paper
and found that foam-papers have useful sound absorptive properties. They used dried
Northern Bleached Softwood Kraft (NBSK)-(Figure 1-2), and Nano fibrillated Lyocell Fibre

3
(NLF) to make foam-papers for acoustic tests, and studied the effect of air-content,
porosity, sample thickness, and pulp consistency (the proportion of mass of pulp to the
whole suspension mass).
Figure 1-2 -NBSK foam-paper at 50% air content. (Photographed by Anna Jamroz, UBC Pulp and Paper Centre) (Ahmadi, 2016)
Samples were made in two different air contents: 50 percent and 70 percent, and the
acoustic features were studied in low-frequency range (between 250 Hz and 1750 Hz).
The researchers used the three-microphone impedance-tube method (explained in
Chapter 3). The experiments showed that higher consistency results in higher sound
absorption properties. The same trend was captured for changing the thickness at the
certain frequencies. They also showed that increasing the air content had a negative
effect on the absorption since less energy could be damped in relatively high air content
4
products. They concluded that the similarity index for the absorption coefficient was more
pronounced in relatively lower frequencies of commercial acoustic products.
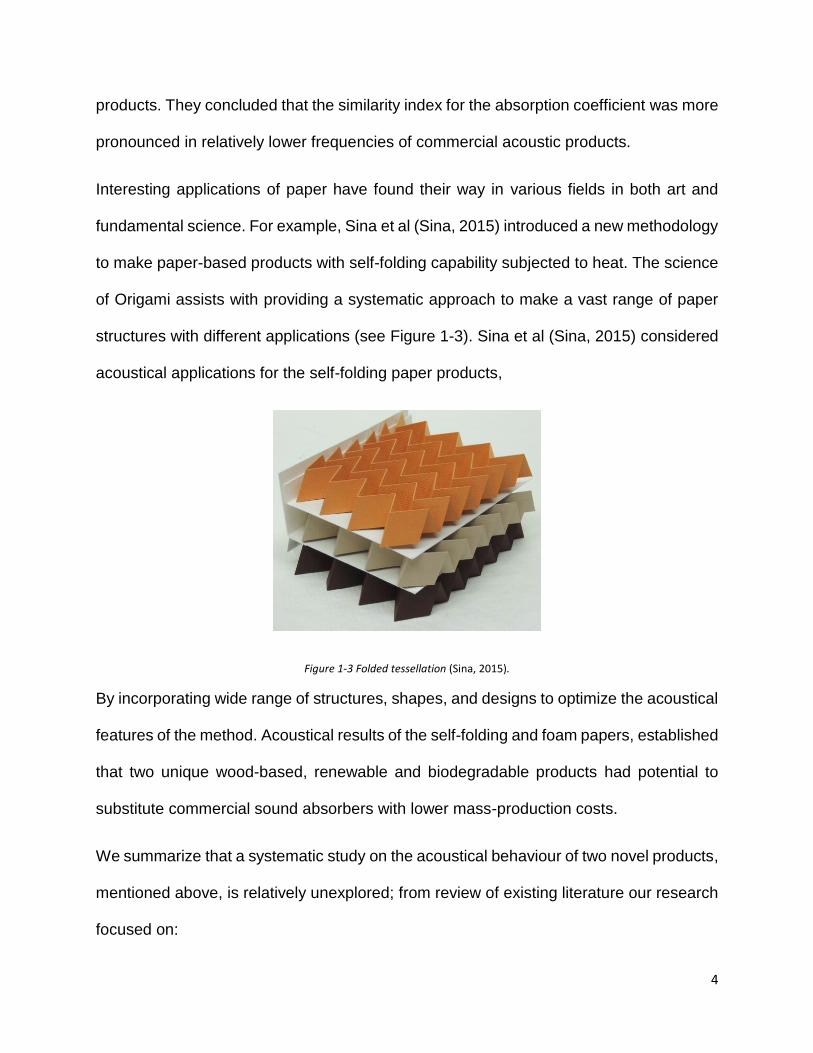
Interesting applications of paper have found their way in various fields in both art and
fundamental science. For example, Sina et al (Sina, 2015) introduced a new methodology
to make paper-based products with self-folding capability subjected to heat. The science
of Origami assists with providing a systematic approach to make a vast range of paper
structures with different applications (see Figure 1-3). Sina et al (Sina, 2015) considered
acoustical applications for the self-folding paper products,
Figure 1-3 Folded tessellation (Sina, 2015).
By incorporating wide range of structures, shapes, and designs to optimize the acoustical
features of the method. Acoustical results of the self-folding and foam papers, established
that two unique wood-based, renewable and biodegradable products had potential to
substitute commercial sound absorbers with lower mass-production costs.
We summarize that a systematic study on the acoustical behaviour of two novel products,
mentioned above, is relatively unexplored; from review of existing literature our research
focused on:

5
• Measurement of sound absorption coefficient of self-folding papers.
• increasing sound absorption properties of the foam-papers.
• Mathematical modeling of combined foam-paper and self-folding paper material
to create a new sound absorptive material.
We form a porous and complex shapes with sound absorption capability (Taherzadeh et
al., 2012) by utilizing Origami. The desired absorption can be the result of thermal and
viscous losses (Horoshenkov, 2013). Sound scattering, another method of noise
attenuation can be obtained using scattered surfaces. However, experiments in sound
scattering are beyond the scope of our research project. Most recently, the structures of
the vegetated surfaces were employed to gain the desired absorption. Problems with
maintenance, shipping and installation have made this technique unattractive for
commercial use.
Figure 1-4 module-based green walls; natural vegetation. Adapted from (Azkorra et al., 2015)
“Artificial Vegetation” was developed as a unique and effective technology developed to
acquire desired absorption based on the idea of vegetated surfaces. This methodology
6
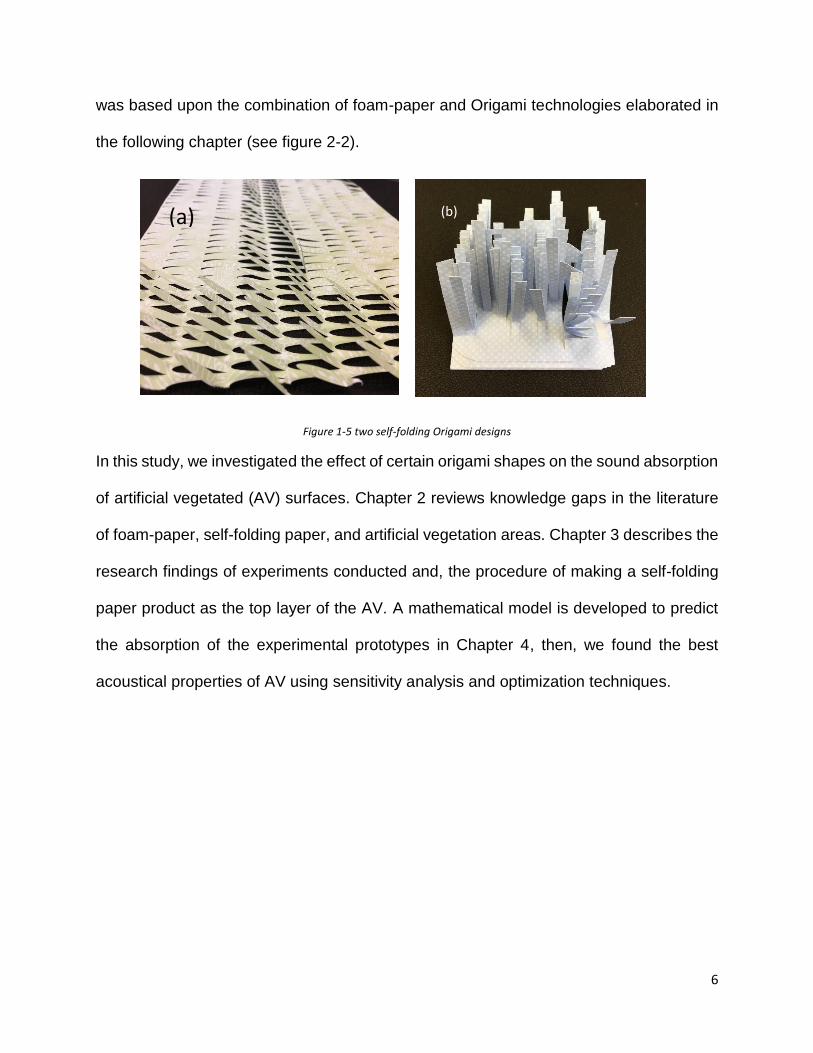
was based upon the combination of foam-paper and Origami technologies elaborated in
the following chapter (see figure 2-2).
Figure 1-5 two self-folding Origami designs
In this study, we investigated the effect of certain origami shapes on the sound absorption
of artificial vegetated (AV) surfaces. Chapter 2 reviews knowledge gaps in the literature
of foam-paper, self-folding paper, and artificial vegetation areas. Chapter 3 describes the
research findings of experiments conducted and, the procedure of making a self-folding
paper product as the top layer of the AV. A mathematical model is developed to predict
the absorption of the experimental prototypes in Chapter 4, then, we found the best
acoustical properties of AV using sensitivity analysis and optimization techniques.
(a) (b)
7
2 Background
We explicated the research studies conducted in building noise-control so far, as well as
introductory and background information concerning Origami and foam-papers. Attention
is focused on how these two methodologies can improve the acoustical properties of the
Artificial Vegetation.
Noise pollution and troubleshooting in houses and commercial buildings have always
been a major issue for this industry. Noise pollution is transmitted in buildings either
through airborne or mechanically-transmitted sounds, regardless of their sources.
Airborne sound is referred to the sound waves travelling in air and reflecting in the spaces
between buildings, whereas, mechanically transmitted sound is mostly referred to the
sound waves travelling between objects inside a building which is technically in
conjunction with the impact-insulation class transmission. In many cases the sources of
the noise pollution are detectable, therefore immediate strategies could be established to
reduce the noise level and adjust it to an acceptable level.
Noise mitigation or noise control is a protocol or set of strategies to diminish the impact
of the noise and reduce the noise pollution in the building industry. Scientists and
engineers developed multiple techniques and carried out research studies to address the
noise difficulties, many of which are encouraged by the building codes; The most popular
technologies in this category are sound insulation, sound absorption, and vibration
damping.
8
We refer to sound insulation as a series of methodologies to prevent noise transmission
by the introduction of a mass barrier or an obstacle. In this method, the density of the
obstacle plays vital role in insulation procedure. To overcome this problem, sound
absorption utilizes the porosity of a material rather than its density. In this method, a highly
porous structure converts the noise energy into heat within the material through multiple
energy loss inside the meandering structure. Vibration damping method is mostly
common for large vibrant surfaces. In this method, the vibration energy is extracted from
a thin sheet and is dissipated as heat. In building industry, sound absorption became
more popular due to light weight and inexpensive price of the sound absorbers, and their
high efficiency in noise control.
In the field of noise absorption, researches developed a green technology called
“vegetation” to combine highly porous plant region with less porous soil regions.
Vegetation is a useful sound barrier particularly at mid and high frequencies (Aylor, 1972).
Vegetation and growing plants can absorb up to 50% of the propagating sound
(Horoshenkov, 2013). Many scientific studies were carried out concerning the sound
attenuation using vegetation. For example, Taherzadeh et al (Taherzadeh et al., 2012)
conducted a comprehensive experimental study on the influence of a planted area on
noise reduction and control. In their study, they concluded that noise reduction is mostly
related to the air-flow resistivity and filling fraction of the amount of plant occupation. Upon
studying plants, it is observed that the low frequency sound attenuation occurs mostly
due to the ground surface, stems and their foliage. The scientific study done by
Taherzadeh et al (Taherzadeh et al., 2012), however, showed that viscous and thermal
losses and sound scattering was the main reason for the sound attenuation in high

9
frequencies ( > 2000 Hz ). Burns (Burns, 1979) argued that Aylor (Aylor, 1972) statement
concerning the reason of sound attenuation in high frequencies could not be rejected nor
accepted. Burns (Burns, 1979) mentioned that “trunks scattering” was the main reason
for this argument. Bullen & Fricke (Bullen & Fricke, 1982) showed that if ground cover
was stiff, noise reduction in high frequencies was much more pronounced. They,
however, mentioned that if the stiffness factor was relatively low, noise attenuation could
even be negative.
Vegetation width is an important element in noise attenuation; It is observed that with
relatively larger width, a greater amount of noise absorption was achieved (Cook & Van
Haverbeke, 1971). Cook and Van Haverbeke also mentioned that width, height, length,
and density of tree belts were more important in noise reduction than the size of the
leaves. The four above-mentioned characteristics are entangled with the sound diffusivity
and the leave size influencing the resonant absorption. Fricke (Fricke, 1984) studied the
main factors affecting the sound transmission in vegetation in pine forests and came to
the conclusion that vegetation attenuate the sound in high frequencies and excess
attenuation rate (decibel per meter) which depends on the space between trees and their
size.
The noticeable point in the literature of vegetated absorbers is that every type of plant,
tree, or vegetated surface has specified inherited sound absorption characteristics. In this
research, to overcome this limit, we developed an innovative technology at Pulp and
Paper Centre at UBC called “Artificial Vegetation (AV)” which is a sophisticated imitation
from the nature. In this method, attempt was to produce a novel sound absorber based
on the structures similar to the vegetated absorbers. Using the knowledge of Origami and
10
the novel foam-paper products, we diversified all the morphological features associated
with the leaves/plants artificially. This technology provides the capability to produce
various shapes in assorted sizes which are inspired by the natural patterns to ultimately
come up with a sound absorber.
Due to the complex structure of the AV products, insight into their characteristics is
difficult, if not impossible. Therefore, building up a brief background knowledge on the
dominant mechanisms of the absorbers is highly necessary. This will be discussed in
Sections 2.1 to 2.6.
2.1 Sound absorption
Noise - defined as unwanted sound - can make serious trouble for most of the daily
human activities. Some high frequency noises and vibrations can even lead to failure of
the massive structures. Therefore, reducing the noise level in the buildings is one of the
very topics that government pay a serious attention. One way to reduce the noise level is
using efficient sound absorber materials. In this section, attempt is to shed light on this
topic:
2.1.1 Definition
In general, when sound collides with a surface, three scenarios may occur; it is either
transmitted, reflected, or absorbed. The share of each depends on the acoustical
properties of the surface material (see Figure 2-1).

11
Figure 2-1 Sound behavior facing a surface.
Sound absorption of a material is usually determined by sound absorption coefficient (𝛼),
which is the fraction of the incident sound energy which is absorbed by a medium. A
material with absorption coefficient of 1 is fully absorptive which means that all incident
sound wave energies are absorbed in the material, whereas, a material with absorption
coefficient of 0 does not absorb the incident sound wave i.e. the sound is either reflected
or transmitted through the material. The sound absorption of a medium depends on the
acoustic impedance of the medium and is a function of the wave frequency and the
incident angle. Sound absorption also depends on the structural and morphological
characteristics (parameters like porosity, composition, density, and thickness) of the
medium.
12
2.2 Transmission loss
Another important acoustical concept is transmission loss (TL) which is defined as
intensity decrease of a sound wave when it propagates from a source or when it transmits
through a material or a structure. Mathematically, it is defined as follows and is measured
in “dB” scale:
𝑇𝐿 = 10 𝑙𝑜𝑔 |
𝑇𝑖
𝑇𝑡|
Eq. (2-1)
where 𝑇𝑖 and 𝑇𝑡 represent the incident wave power and transmitted wave power
respectively. Transmission coefficient is also defined as the fraction of the sound energy
which is transmitted through a wall.
2.3 Prediction models for a Helmholtz resonator
Helmholtz resonator (HR) is a type of resonant absorber that attenuates the noise due to
viscous loss of the system especially in vicinity of its natural frequency. HR was first
introduced in 1862 in a book by Helmholtz, as a device with ability of taking specific
frequency out of a larger range. When a gas resonates in a cavity, Helmholtz resonance
occurs. This phenomenon is widely used to study acoustical sound absorption. To obtain
a higher absorption usually arrays of HRs which consist of certain number of cavities are
utilized. For further studies and the mechanism of HRs we refer to (Logawa, 2017).
The purpose of the prediction models is finally to understand and calculate the absorption
coefficient from impedance. To do so, we need to know the governing equations of a HR
to understand how a pressure difference and velocity is related in a simple resonator.

13
Upon applying a control volume on a resonator, the force balance on the control volume
can be derived and a second order differential equation is derived to describe the
relationship between the input pressure (𝑃) and the volume of the gas in the neck of HR
(𝑣) as follows. The details of the derivation of Eq.(2-2) is described by (Logawa, 2017).
𝑃 =
𝜌𝑐2
𝑉𝑣(𝑡) +
𝜌𝑙
𝑆
𝑑2𝑣(𝑡)
𝑑𝑡2
Eq. (2-2)
Where 𝜌 is mass density, 𝑙 is length of the neck, 𝑐 is speed of sound in air, 𝑉 is volume
inside the cavity and S is surface area.
Here, 𝜌𝑐2
𝑉 refers to the compliance of the resonator and
𝜌𝑙
𝑆 is generally referred to acoustic
inertance (Logawa, 2017). Eq. (2-2) is a classical model and is usually accurate to predict
the impedance of a simple resonator. The application of this equation will be considerably
limited if our medium consists of arrays of various configurations of many HRs. To analyse
a complex system with a complex configuration of resonators and to overcome this
problem, we applied Transfer Matrix method.
2.3.1 Transfer matrix method
Transfer Matrix Method (TMM) is used when a system can be divided into multiple
subsystems. TMM is used to connect the layers using matrices which define the
acoustical properties of each layer near the boundary (see
Figure 2-2).
14
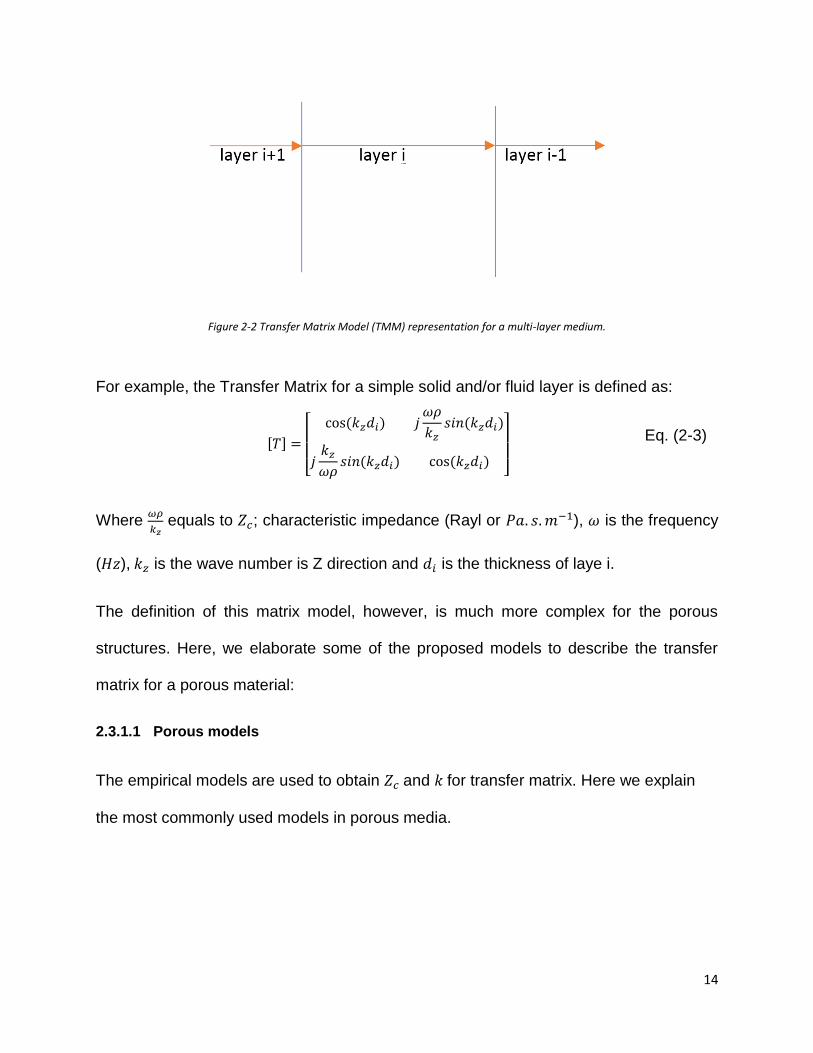
Figure 2-2 Transfer Matrix Model (TMM) representation for a multi-layer medium.
For example, the Transfer Matrix for a simple solid and/or fluid layer is defined as:
[𝑇] =
[ cos (𝑘𝑧𝑑𝑖) 𝑗
𝜔𝜌
𝑘𝑧𝑠𝑖𝑛(𝑘𝑧𝑑𝑖)
𝑗𝑘𝑧
𝜔𝜌𝑠𝑖𝑛(𝑘𝑧𝑑𝑖) cos (𝑘𝑧𝑑𝑖) ]
Eq. (2-3)
Where 𝜔𝜌
𝑘𝑧 equals to 𝑍𝑐; characteristic impedance (Rayl or 𝑃𝑎. 𝑠.𝑚−1), 𝜔 is the frequency
(𝐻𝑧), 𝑘𝑧 is the wave number is Z direction and 𝑑𝑖 is the thickness of laye i.
The definition of this matrix model, however, is much more complex for the porous
structures. Here, we elaborate some of the proposed models to describe the transfer
matrix for a porous material:
2.3.1.1 Porous models
The empirical models are used to obtain 𝑍𝑐 and 𝑘 for transfer matrix. Here we explain
the most commonly used models in porous media.

15
2.3.1.1.1 Delany – Bazley model
Delany and Bazley (Delany & Bazley, 1969) fulfilled a large set of experiments in a
specific frequency range (250-4000 Hz) for 200 measurements. This model is valid under
two different conditions; first, porosity should be greater than 95%, second, the model is
valid for frequencies lower than 1% of the flow resistivity. The frequency range for their
experiments was from 2000 to 80000 N.s/m3. Considering 𝜔 as angular velocity, 𝜌0 as air
density (1.213 kg/m3), 𝑐0 as speed of sound in air medium (342.2 m/s), 𝑓 frequency, k as
propagation constant, 𝜌0 as ambient air density and 𝜎 flow resistivity then:
𝑍𝑐 = 𝜌0𝑐0 (1 + 0.495 (
𝑓
𝜎)
−0.754
− 𝑗0.0754 (𝑓
𝜎)
−0.732
) Eq. (2-4)
𝑘 =
𝜔
𝑐0(1 + 0.848 (
𝑓
𝜎)−0.7
− 𝑗0.164 (𝑓
𝜎)
−0.595
) Eq. (2-5)
2.3.1.1.2 Miki model
Improvement to the model proposed by Delany and Bazley (Delany & Bazley, 1969) were
made by Miki (Miki, 1990) to increase the model accuracy in range of low frequencies
(frequencies lower than 0.01𝜎). In this model, 𝑍𝑐 and 𝑘 are defined as follows:
𝑍𝑐 = 𝜌0𝑐0 (1 + 0.070 (
𝑓
𝜎)−0.632
− 𝑗0.107 (𝑓
𝜎)−0.632
) Eq. (2-6)
𝑘 =
𝜔
𝑐0(1 + 0.109 (
𝑓
𝜎)−0.618
− 𝑗0.164 (𝑓
𝜎)
−0.618
) Eq. (2-7)

16
2.3.1.1.3 Allard - Champoux model
Allard and Champoux (1975) proposed a model in which other morphological parameters
such as viscous and thermal characteristic lengths (𝛬 and 𝛬′ respectively), porosity (𝜑),
and tortuosity (𝛼∞) were included. The viscous and thermal characteristic lengths are
average dimensions of the cells related to viscous and thermal losses, respectively.
Thermal characteristic length is twice the ratio of volume to surface area in connected
pores and viscous characteristic length is similar to this ratio weighted by the local velocity
of fluid in the volume and on the surface. Moreover, porosity of a material is defined as
the ratio of the volume of the connected pores to the total volume of the material and
tortuosity is defined as the measure of propagation path complexity or streamline
curvature. The characteristic impedance (𝑍𝑐) and propagation constant (𝑘) can be derived
from the effective density and bulk modulus of the medium as follows:
𝑍𝑐 = √𝜌𝑒𝐾𝑒 Eq. (2-8)
𝑘 = 𝜔√𝜌𝑒
𝐾𝑒
Eq. (2-9)
The effective density and bulk modulus of the medium was also defined as:
𝜌𝑒 = 𝛼∞𝜌0 (1 +𝜎𝜑
𝑗𝜔𝛼∞𝜌0
√1 +4𝑗𝛼∞
2 𝜂𝜌0𝜔
𝜎2𝛬2𝑥2)
Eq. (2-10)
𝐾𝑒 =
𝛾𝑃0
𝛾 − (𝛾 − 1) (1 +8𝜂
𝑗𝛬′2𝑁𝑃𝑟𝜔𝜌0√1 +
𝑗𝛬′2𝑁𝑃𝑟𝜔𝜌0
16𝜂 )
−1 Eq. (2-11)
17
where 𝜂 is viscosity of air, 𝑁𝑃𝑟 as Prandtl number (= 0.72), 𝛾 is specific heat ratio of air (=
1.4), and 𝑃0 is the air pressure.
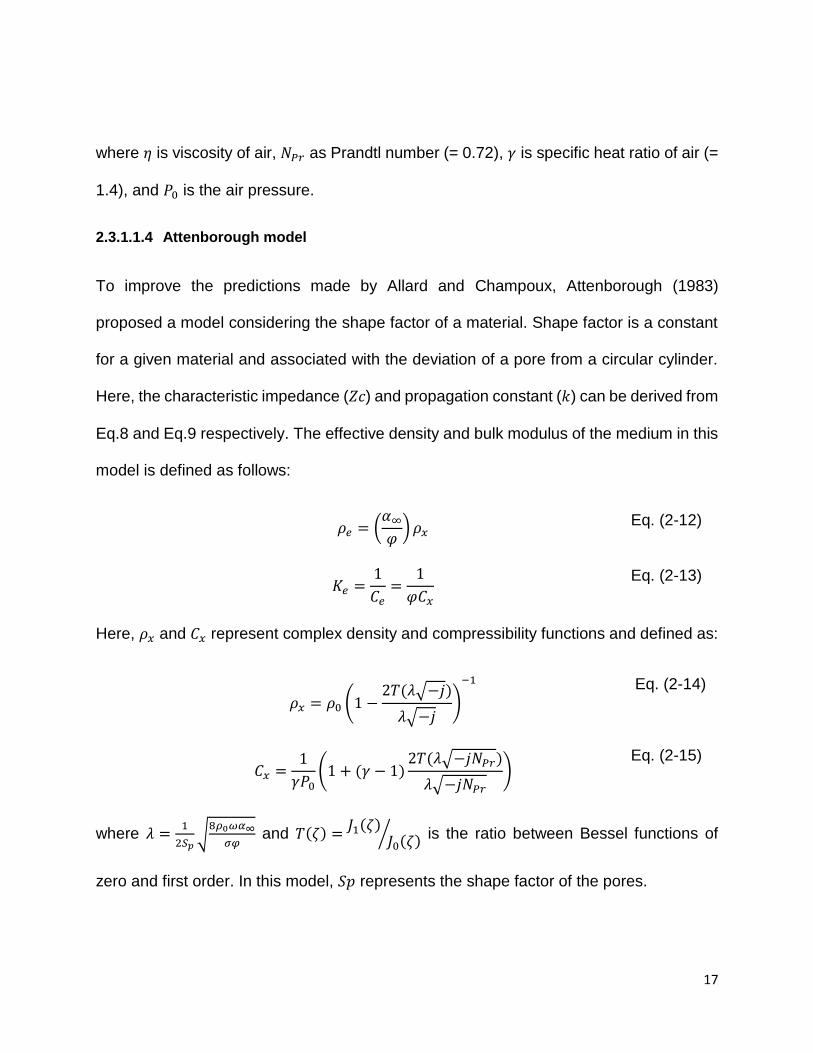
2.3.1.1.4 Attenborough model
To improve the predictions made by Allard and Champoux, Attenborough (1983)
proposed a model considering the shape factor of a material. Shape factor is a constant
for a given material and associated with the deviation of a pore from a circular cylinder.
Here, the characteristic impedance (𝑍𝑐) and propagation constant (𝑘) can be derived from
Eq.8 and Eq.9 respectively. The effective density and bulk modulus of the medium in this
model is defined as follows:
Here, 𝜌𝑥 and 𝐶𝑥 represent complex density and compressibility functions and defined as:
where 𝜆 =1
2𝑆𝑝√
8𝜌0𝜔𝛼∞
𝜎𝜑 and 𝑇(𝜁) =
𝐽1(𝜁)𝐽0(𝜁)
⁄ is the ratio between Bessel functions of
zero and first order. In this model, 𝑆𝑝 represents the shape factor of the pores.
𝜌𝑒 = (𝛼∞
𝜑)𝜌𝑥
Eq. (2-12)
𝐾𝑒 =
1
𝐶𝑒=
1
𝜑𝐶𝑥
Eq. (2-13)
𝜌𝑥 = 𝜌0 (1 −2𝑇(𝜆√−𝑗)
𝜆√−𝑗)
−1
Eq. (2-14)
𝐶𝑥 =
1
𝛾𝑃0(1 + (𝛾 − 1)
2𝑇(𝜆√−𝑗𝑁𝑃𝑟)
𝜆√−𝑗𝑁𝑃𝑟
) Eq. (2-15)
18
2.4 Origami
The word Origami comes from Japanese roots of “Ori” meaning to fold and “kami”
meaning paper i.e. the art of folding paper and making shapes without cutting. When
cutting is added to this technique, however, it is named Kirigami. Nowadays, this method
is applied in many industries from making simple toys to complex shapes in architecture
and solar panels (Guest, 1994; Jahedi, 2010; Miura, 1992). Paper is a perfect material
for Origami and Kirigami since it is sustainable, light, and inexpensive (Nojima & Saito,
2006). Folding the paper in order to get a desirable shape is, however, a very time taking
process which is not ideal for industry. To make this process more effective, (Nisser,
2016) used sensors to fold and make Origami shapes. (Dickey, 2012) innovated self
folding polymers by exposing them to the light. The method proposed by (Sina, 2015) is,
however, specifically innovated for Origami application in paper industry. (Sina, 2015)
developed a novel method to make papers self-fold by exposing them to heat. This
method can be used in many industries such as packaging, furniture, acoustics. Light
weight, flexibility, and ability to make repetitive patterns are amongst the major reasons
to use this method in acoustics.
2.4.1 Formation
After making foam-paper samples, we mount origami shapes on top of them to obtain
samples for acoustic tests. To reach this goal, we need to design Origami pattern. We
used AutoCAD as the most popular and user-friendly software to draw the patterns. Both
cutting and creasing lines should be considered carefully in drawings. Moreover, the
location of the crease lines - which later will be the pivots – is also very important. We
19
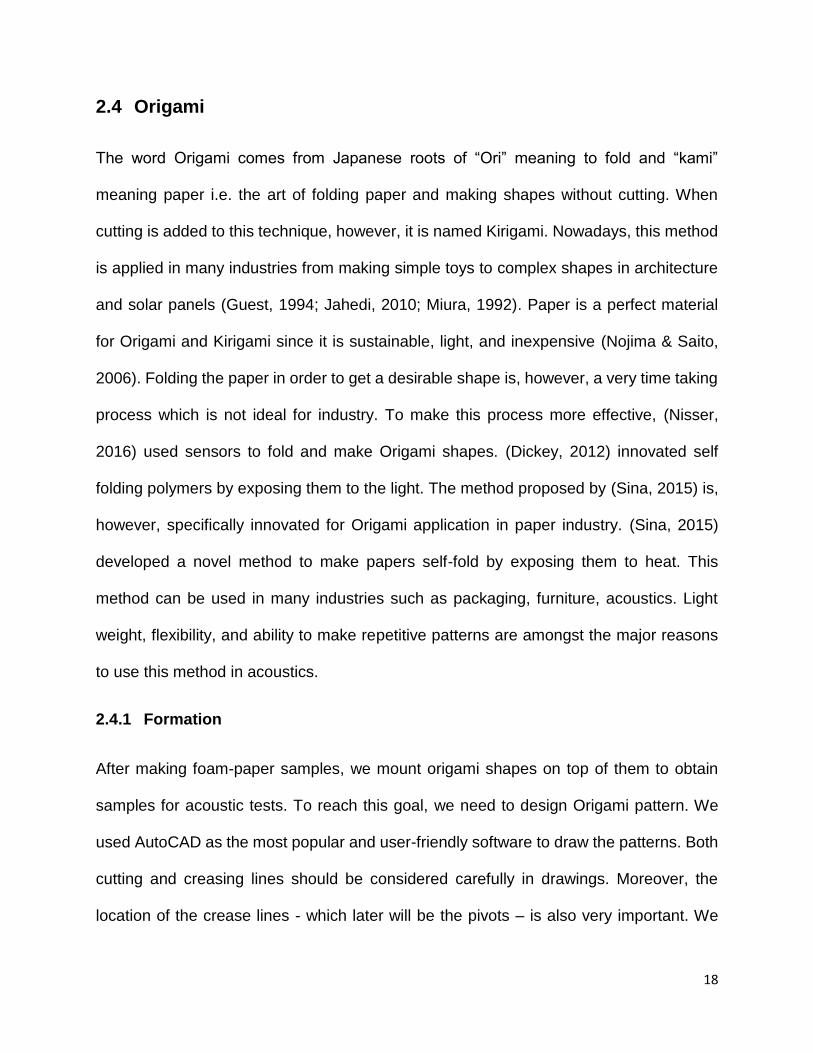
tested many trial and error patterns to gain the desired ones. The outcome of this part is
two-dimensional printed papers which are ready to be cut by the cutting machine and
eventually, making a three-dimensional self-folding product.
Figure 2-3 “Pyramid” designed with AutoCAD software.
2.4.1.1 Cutting
For cutting the Origami shapes, we use a Graphtec cutting machine (see Figure 2-4). The
table size is 68.5”x 36” with two 500 grams and 1000 grams down force heads (see
Figure 2-5). The final designs of AutoCAD are transferred to CorelDraw software, the
cutting machine – which is able to run with various speeds and forces - reads the files
from the software (Sina, 2015). Upon setting these parameters, the machine cuts and
creases the pattern on the paper which is already mounted on the Graphtec plate.

20
Figure 2-4 Graphtec FC2250-180
Figure 2-5 Graphtec 2250-180 dual heads
2.4.1.2 Polymer attachment
Polymer attachment is a process to convert the 2D paper patterns to 3D ones. This
process provides the capability of self-folding to the 2D papers. The process is initially
introduced by (Sina, 2015) by attaching pre-strained polymers in certain points of the
patterns designed in the drawings. To do so, (Sina, 2015) modified one of the cutting tips
with a soldering-iron tip. The process starts with fixing the pre-strained polymer sheet on
21
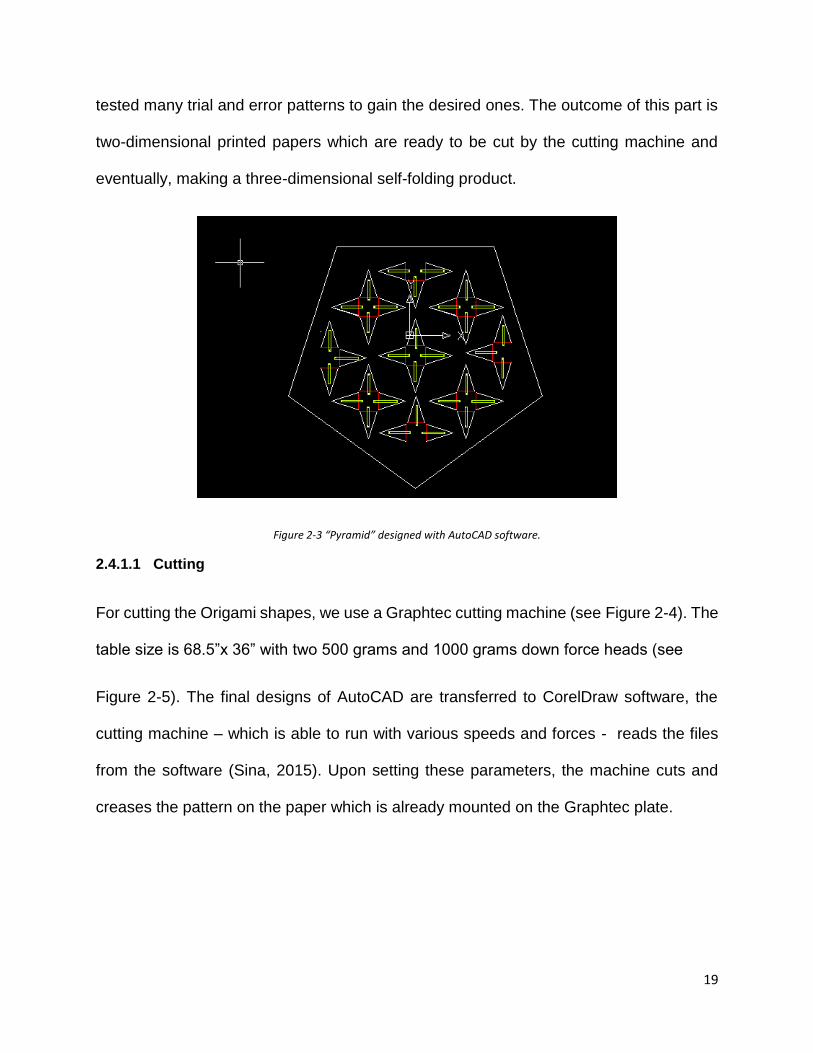
the creased-lines of the paper of the same size, soldering iron presses down the polymer
to the paper and heats the polymer on the defined points. The polymer is then melted
down and is welded to the paper on the defined points.
At this point, our polymer-attached paper is ready to be used as a self-folding prototype.
To make the 3D structure, we put the polymer-attached paper into an oven of 100oC. The
polymer, now reaches the glass transition temperature where starts to shrink.
Consequently, stretches the paper and folds it from the crease lines. These folded parts
turn the 2D shape into 3D.
Figure 2-6 Polymer attachment to the paper (adapted form (Sina, 2015))
2.5 Foam-paper
(Radvan & Gatward, 1972) used foam in production of paper process and also introduced
a foam making process named after his name, Radfoam process which is confirmed with
several researchers (Smith & Punton, 1975; Tringham, 1974) as a high efficiency process
in terms of making the paper more porous and more unified. On the other hand,(M. Deng,
2009), has developed a foam making process resulting in high porosity foam. (Cervin et
Heat

22
al., 2013) has done a research on the drying of the foam and how it affects the porosity
of the foam and claimed that the porosity in freeze-drying is lower than NFC stabilized
foam. (H. Sehaqui, Zhou, & Berglund, 2010) showed that cell structure of foam are the
key to improve mechanical specifications of the foam. (Jahangiri, 2013) has developed a
cellulose based porous foam called foam-paper. This product is made by adding
surfactant to the pulp suspension, mixing air into suspension, and drying in lab
environment (air-drying process). He studied the effect of air-content on porosity leading
to final product porosity of 99%. He also studied the air flow resistivity of the foam-paper.
(Korehei, 2016) investigated the effect of drying methods of foam-paper structure and
showed that freeze-drying makes the foam-papers even more porous.
In this study, we used the method proposed by (Jahangiri, 2013) to produce foam-paper.
A pulp suspension which consists of water and pulp which later turns into suspension of
foam and fibre. First, The Caframo Brinkmann RZR1 type mixer applies the shear force
to the pulp, meanwhile a certain amount of surfactant is added, both to get higher air
content. The velocity of the mixer can be changed to get higher air content that is the
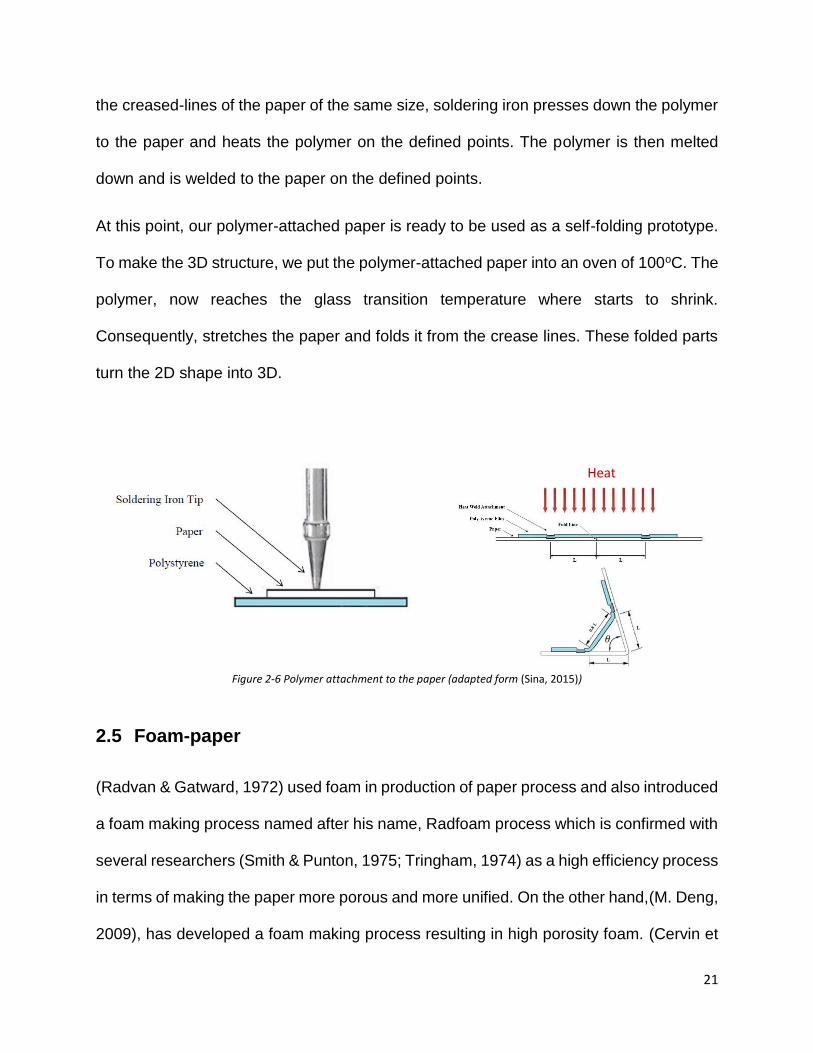
same for amount of the surfactant. In second phase, we air dry the sample; to do so, the
foam fibre suspension will be dewatered by vacuuming in a Buchner funnel then dried in
the room temperature in Constant Temperature and Humidity room for 24 hours.
23
Figure 2-7 Drying foam-papers; exposed to air and a heater.
In summary, the research works reviewed in the literature provide insight into the
systematic development of the modules required to produce the artificial vegetation. In
this thesis, we used and combined all the previous methodologies developed by Jahangiri
et al. (Jahangiri, 2013) and Sina et al. (Sina, 2015) to produce a novel and efficient sound
absorber based on the idea of Artificial Vegetation. We also developed an automated
modeling platform to understand the effect of various parameters on the acoustical
behaviour of the new product.

3 Experimental Procedure and Results
Production of various samples with different specifications were seen to investigate
acoustical behaviour of the AV products. In this chapter, the production procedure and
the required experimental apparatuses are described. The results will be discussed at the
end of this chapter.
3.1 Impedance tube test
Our research used the Impedance tube test as it is the most commonly-used method in
the field to evaluate acoustical performance. We used two ¼ inches B&K 4178 phase
matched microphones, each connected to a B&K 2269 preamp. A signal analyzer
(Soundbook SINUS GmbH) received the polarization voltage provided by preamps. Two
tubes measured the samples’ absorption: i) A 101.5 cm long circular steel with a 10-cm
diameter for the low frequency zones and ii) a 30 cm long, 2.9 cm diameter in the range
of high frequencies. The high and low frequency experiments overlap in the
measurements in the frequencies between 1000 Hz and 2000 Hz resulting in
approximately 15% discrepancy between the results in this range. This happens since we
use different samples of different sizes for these two experiments which can be resolved
by taking an arithmetic average of the data in this frequency zone. We measure the low
frequency zone between 200 Hz and 2000 Hz and the high frequency zone between 1000
Hz and 6000 Hz respectively. Depending on the application of the sound absorber the

25
range of interest for the frequencies can differ, however, the frequencies below 1000 Hz
is paid less attention in resolving building’s noise pollution. (Wolkesson & Wolkesson,
2013) carried out a comprehensive study on the design and the major calculations of an
impedance tube and explained the influence of spacing and number of microphones in
the measurements.
Figure 3-1 Impedance tube setup

26
Figure 3-2 two ¼ inches B&K 4178 phase matched microphones
Microphones inside the tube measured sound pressure and Soundbook calculated
transfer function using outcoming data resulting in the calculation of absorption coefficient
using equation 3-2. We first calculated the reflection coefficient R, derived through the
dimensions and geometry of the tube and the transfer function (H).
Figure 3-3 impedance tube with two microphones
27
𝑅 = |𝑅|𝑒𝑗𝜙𝑅 = 𝑅𝑟 + 𝑗𝑅𝑖 =
𝐻 − 𝑒−𝑗𝑘𝑠
𝑒𝑗𝑘𝑠 − 𝐻𝑒𝑗2𝑘(𝑙−𝑠)
Eq. (3-1)
𝛼 = 1 − |𝑅|2 Eq. (3-2)
Our experiments worked on the assumption that the impedance tube to be a fully sealed.
Allowing the total fraction of the incident sound that is not reflected to be absorbed. If the
wave-length of the highest frequency was longer than the tube diameter, sound
propagation in the impedance tube was defined as plane wave propagation in a duct.
The ISO 10537:1998 defined the higher frequency limit for an impedance tube as:
𝑓𝑢 < 0.58
𝐶0
𝑑
Eq. (3-3)
𝑓𝑢 < 0.45𝐶0
𝑠
Eq. (3-4)
Another limitation based on ISO 10537 mentioned that upper frequency was dependant
on the distance between two microphones. In equation 3-3 and equation 3-4, 𝐶0, 𝑑, and 𝑠
represent speed of sound, internal diameter of the tube, and spacing between two
microphones. k0 is the wave number in the air, 𝜑𝐼 and 𝜑𝑅 are phase shift of incident and
reflected wave, �̂�𝐼 and �̂�𝑅 are the magnitude of incident and reflected wave. A lower band
for low-frequency, that is for the wavelength which have the same pressure in the
microphones:
𝑓𝑙 > 0.05
𝐶0
𝑠
Eq. (3-5)
So, the sound pressure for incident and reflected waves were defined as follows:
28
𝑝𝐼 = �̂�𝐼 𝑒(𝑗𝑘0𝑥+𝜑𝐼)𝑒𝑗𝜔𝑡 Eq. (3-6)
𝑝𝑅 = �̂�𝑅 𝑒(𝑗𝑘0𝑥+𝜑𝑅)𝑒𝑗𝜔𝑡 Eq. (3-7)
Where 𝜑𝐼 is the incident wave and 𝜑𝑅 is the reflected waves phase shift and �̂�𝐼 and �̂�𝑅 are
magnitudes of incident and reflected waves, respectively 𝑥 is distance from surface of the
sample and 𝑘0 is the wave number. The sound pressure for microphones 1 and 2 were
calculated using:
𝑝1 = 𝑝𝐼(𝑥1) + 𝑝𝑅(𝑥1) = �̂�𝐼 𝑒−𝑗𝑘𝑥1 + �̂�𝑅 𝑒
𝑗𝑘0𝑥1 Eq. (3-8)
𝑝2 = 𝑝𝐼(𝑥2) + 𝑝𝑅(𝑥2) = �̂�𝐼 𝑒−𝑗𝑘𝑥2 + �̂�𝑅 𝑒
𝑗𝑘0𝑥2 Eq. (3-9)
Here, 𝑥1 and 𝑥2 are defined as explained in Figure 3-3. Moreover, the transfer function
was also defined as:
𝐻𝑖𝑗 =𝑝𝑗
𝑝𝑖
Eq. (3-10)
Considering Equation 3-8, the transfer function between microphone 1 and 2 was
computed as:
𝐻12 =
𝑝2
𝑝1=
𝑒−𝑗(𝑘0𝑥2+𝜑) + 𝑅 𝑒𝑗(𝑘0𝑥2+𝜑)
𝑒−𝑗(𝑘0𝑥1+𝜑) + 𝑅 𝑒𝑗(𝑘0𝑥1+𝜑)
Eq. (3-11)
where, 𝑅 is the reflection coefficient which is the ratio of reflected and incident pressures.
This equation was re-formatted as:
𝑅 =
𝐻12 − 𝐻𝐼
𝐻𝑅 − 𝐻12𝑒𝑗𝑘02𝑥1
Eq. (3-12)
Where, 𝐻𝐼 and 𝐻𝑅 are the transfer functions for incident and reflected waves between the
microphone positions which were defined as:

29
𝐻𝐼 =
𝑝𝐼(𝑥2)
𝑝𝐼(𝑥1)= 𝑒𝑗𝑘0𝑠
Eq. (3-13)
𝐻𝑅 =
𝑝𝑅(𝑥2)
𝑝𝑅(𝑥1)= 𝑒−𝑗𝑘0𝑠
Eq. (3-14)
The fraction of the incident wave that propagated inside the material to the total energy
propagated out was defined as the absorption coefficient. The amount of the incident
wave not reflected had to be absorbed. The value of the absorption coefficient was
defined in equation 3-2. Finally, equation 3-15 shows the impedance surface of the
material consisting of a real part as energy loss and an imaginary part as phase were
calculated as:
𝑍𝑠 = 𝑍0
1 + 𝑅
1 − 𝑅
Eq. (3-15)
where, acoustical characteristic impedance of air is: 𝑍0 = 𝜌0𝑐0.
3.2 Results
The production procedure of the foam-paper samples was described in Section 2.2. The
test matrix for the acoustic tests in both low and high frequency zones in the impedance
tube was also elucidated earlier in Chapter 2.
30
Figure 3-4 Sound absorption coefficient of foam-paper; consistency:0.5; Thickness 1 cm in low frequency
Figure 3-4 shows the absorption coefficient of a 1cm foam-paper with
consistency of 0.5 and air content of 80% in the range of 200 – 2000 Hz which defined
the range of our low-frequency tests in a three-microphone impedance tube. The graph
qualitatively shows that increasing the frequency increased absorption coefficient. The
graph also shows that at a reference frequency of 1000 Hz, approximately 20% of the
sound was absorbed which justified the work done by (Jahangiri, 2013).
The graph also shows a peak at frequency of 200 Hz due to the resonance frequency of
the tube and the sample; and it is negligible because it did not show the real absorption
properties of the sample and it was part of the experimental errors.
31
Figure 3-5 Sound absorption coefficient of foam-paper; consistency:0.5; Thickness 1 cm in high frequency
Figure 3-5 shows the high frequency result for the same sample represented in Figure
3-4. There is an overlap in frequency range between 1000 Hz and 2000 Hz.
As shown in Figure 3-4 and Figure 3-5, different results were calculated between the 1000
Hz and 2000 Hz for the absorption coefficient using various low and high frequency
methods. This difference is within 15 percent and is computed higher for the high-
frequency test.
Our findings showed a common phenomenon in impedance measurement that occurred
due to a change in the size of the testing sample and the difference between the low and
high frequency methods. In our calculations, we used the average of these two tests at
each frequency in the overlapped zone. The measured absorption coefficients of the
foam-papers made through similar parameters (similar foam air-content, consistency, and
32
drying methodology) showed an uncertainty within 10 percent. This uncertainty was
elaborated through the differences in the meandering and tortuous structures of the
similar foam-papers. Overall, the results showed that the range of the measured
absorption coefficients were relatively lower compared to the one measured in the high-
frequency tests. The maximum achievable absorption coefficient in the low frequency
tests occurred near 2000 Hz which was approximately 0.3. Moreover, we observed an
overshoot in the results close to the frequency of 200 Hz (≈ 250 Hz) that showed the
resonance frequency of the tube. Absorption in the range of high frequencies showed an
ascending trend as frequency elevates.
The effect of production parameters had a significant effect on the results of the
absorption coefficient. Foam-papers with different air-contents, thicknesses, and
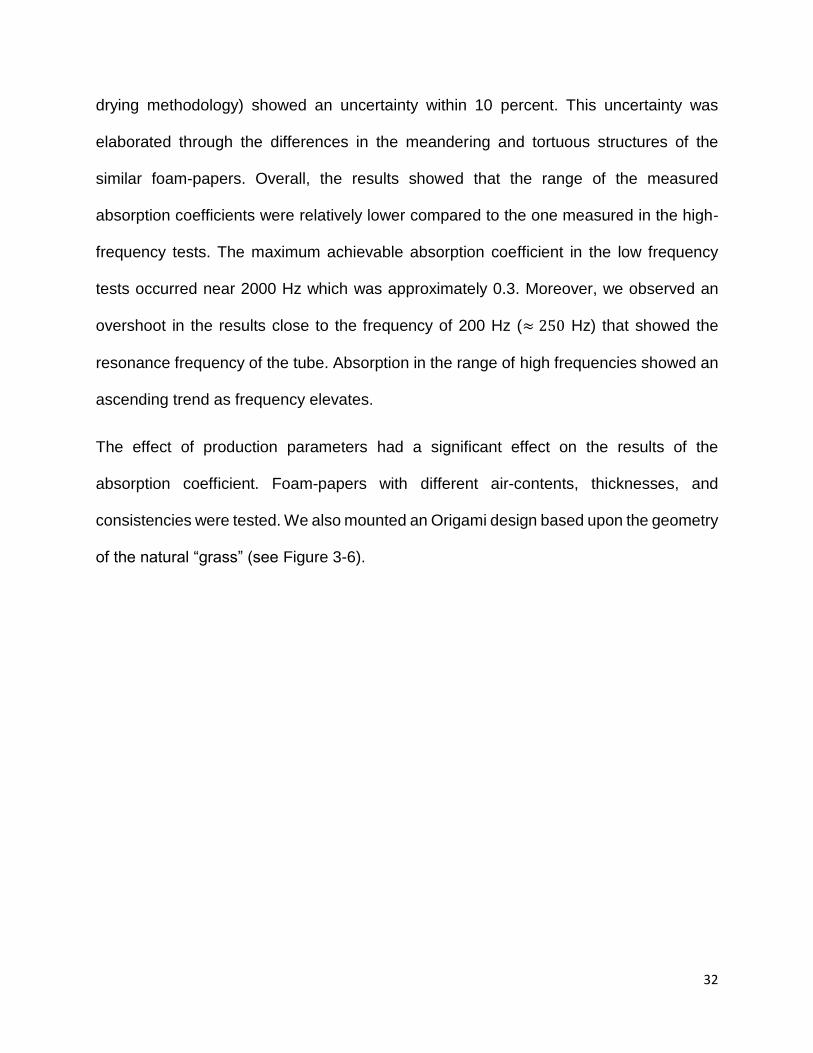
consistencies were tested. We also mounted an Origami design based upon the geometry
of the natural “grass” (see Figure 3-6).
33
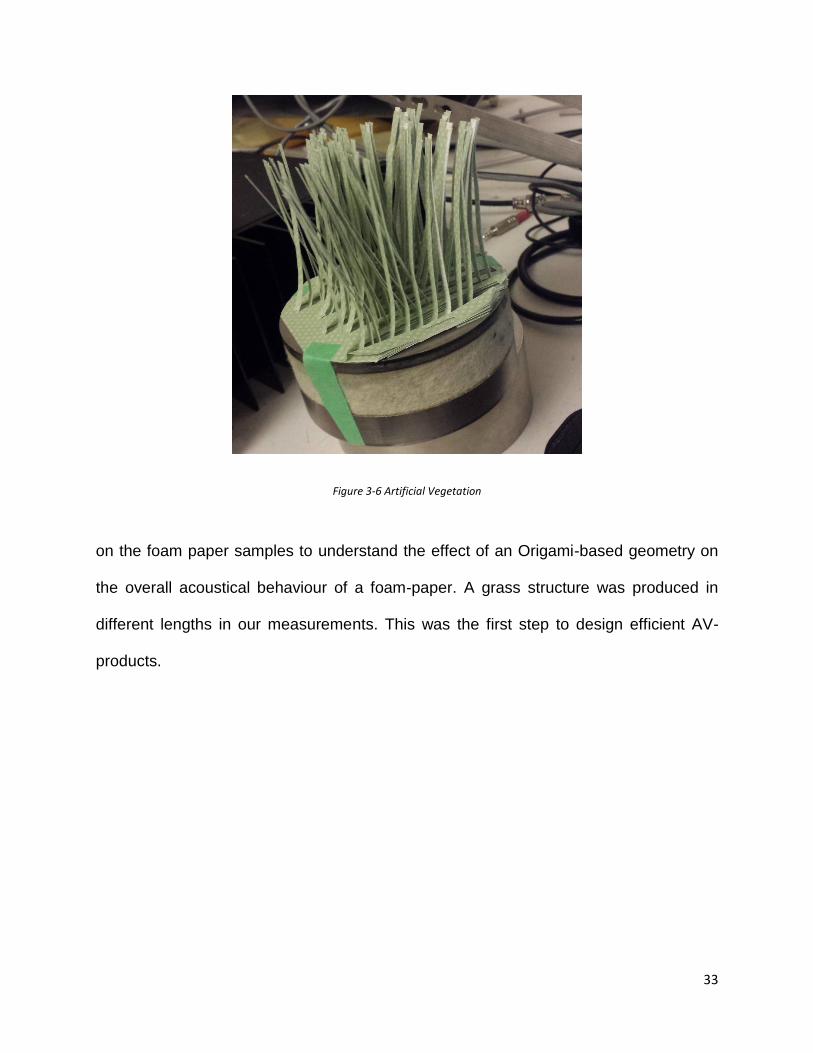
Figure 3-6 Artificial Vegetation
on the foam paper samples to understand the effect of an Origami-based geometry on
the overall acoustical behaviour of a foam-paper. A grass structure was produced in
different lengths in our measurements. This was the first step to design efficient AV-
products.

34
Figure 3-7 Sound absorption coefficient of 1 cm thick foam-paper; consistency:0.5. (no grass)
Figure 3-8 Sound absorption coefficient of 1 cm thick foam-paper and 1 cm grass; consistency:0.5.
Figure 3-7 and Figure 3-8 show the low and high frequency measurement results for both
a foam-paper and a grass-mounted foam-paper respectively. In these measurements, the
foam-paper specifications were identical with the only variable being the mounted
geometry of artificial grass. The results showed that addition of a layer as tick as 1 cm of
grass on top of the foam-paper slightly (within 5%) improved the acoustical behaviour of
the final product compared to the original sample of the foam-paper. The successful
improvement of the grass structure on the foam-paper built the foundation for our

35
fundamental hypothesis regarding the constructive effect of AV-structures on acoustical
behaviour of the foam-papers. Two variables we tested: i) The consistency of the pulp
solution to make the foam-papers; ii) The length (thickness) of the grass structure.
Figure 3-9 Sound absorption coefficient of 1 cm thick foam-paper; consistency: 1.
Figure 3-10 Sound absorption coefficient of 1 cm thick foam-paper and 1 cm grass; consistency:1.
Figure 3-9 and Figure 3-10 show the influence of the higher consistency foam-papers (the
foam consistency is within 1%) on the acoustical behaviour of the final product. The
results clearly showed that the absorption coefficient was improved approximately 10
percent compared to the samples with lower consistency (the foam consistency was

36
within 0.5%). The higher consistency led to more material involving in the structure of the
foam-paper causing a more efficient performance in our frequency ranges. High
frequency measurements in Figure 3-9 depict a sinusoidal behaviour. This happens due
to the presence of the large holes in the structure of the foam-paper as the direct result
of the heterogeneity in the foam structure.
Figure 3-11 Sound absorption coefficient of 1 cm thick foam-paper and 3 cm grass; consistency:1.
Figure 3-12 Sound absorption coefficient of 1 cm thick foam-paper and 6 cm grass; consistency:1.
Figure 3-11 and Figure 3-12 show the variation of absorption coefficients of our AV
products for a wide range of low and high frequencies for the Origami-grass thickness of
3cm and 6cm respectively. The results show a significant improvement of the absorption
37
coefficient over the range of frequencies by increasing the thickness of the Origami-grass
at the same foam-paper properties. The tortuous structure of the AV-product was the
main reason for improvement intensified by increasing the thickness of the Origami-grass
structure. We also observed that the absorption coefficient of our thickest sample (6cm
Origami-grass) showed a large bump close the frequency of 1000 Hz (resonance
frequency) depicting that our product behaviour was getting similar to a Helmholtz-
resonator.
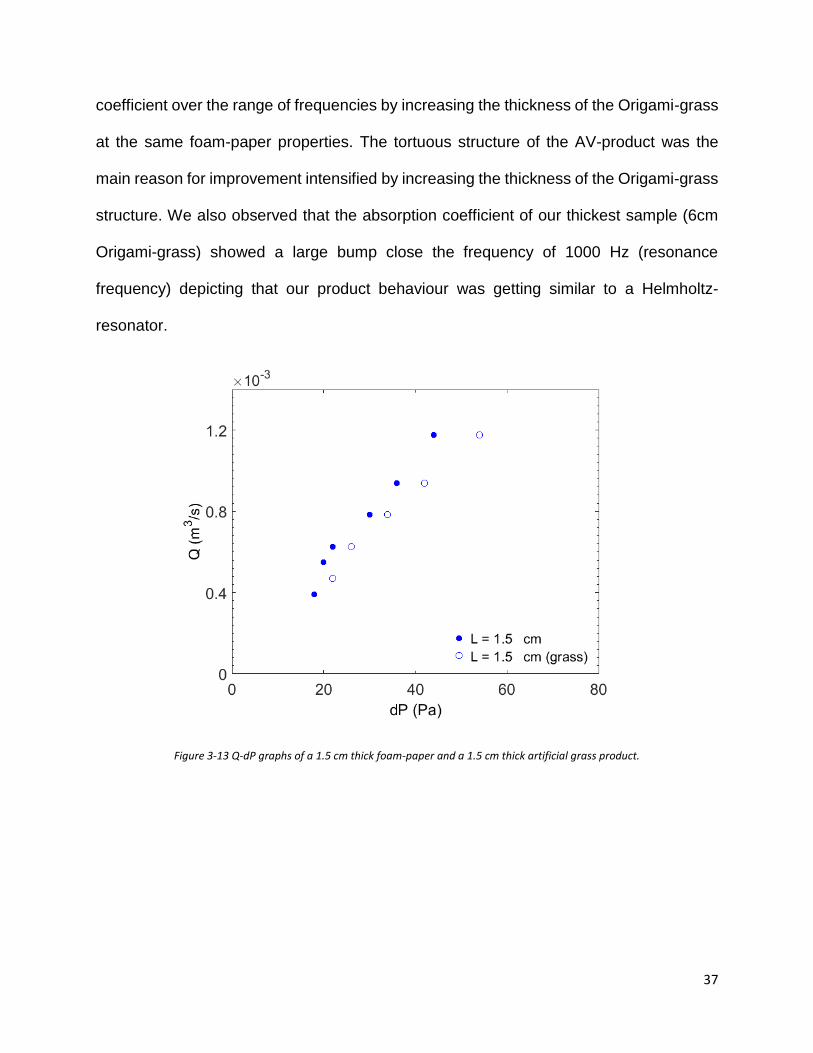
Figure 3-13 Q-dP graphs of a 1.5 cm thick foam-paper and a 1.5 cm thick artificial grass product.

38
Figure 3-14 Comparison between the sound absorption result of an AV product and a commercial fibreglass absorber (results of the commercial absorber are provided by Kinetics Noise Inc.)
Figure 3-13 shows the flow rate versus the pressure drop for both a 1.5cm thick foam-
paper and a 1.5 cm thick artificial grass product. The slope of the Q-dP curves is an
inverse function of the air-flow resistivity of the materials. The results show both products’
resistivity to flow was within the same range, both materials were considered as very low
resistive products to the air-flow. This proves that although the artificial grass structure
improved the absorption coefficients dramatically, it did not change the flow resistivity by
a great factor. Therefore, the AV products could be considered as efficient materials for
sound absorption. This was further confirmed by the results provided in Figure 3-14. The
graph shows the sound absorption results of an AV product and a commercial fibreglass
absorber. The results show that the AV product was compatible to the commercial
39
fibreglass product (an average 35% improvement was achieved within this range of
frequencies).
In summary, we developed a systematic methodology to test the acoustical behaviour of
our Artificially Vegetated products for various range of the sound frequencies. We showed
that Origami-grass mounted on a foam-paper significantly improved the acoustical
behaviour of the foam-papers in the range of our testing frequencies. Our experiments
led this to infer that AV products provide a wide avenue to produce novel and efficient
building insulators in the near future.

4 Modeling and Optimization
Parametric optimization of acoustical behaviour of porous Origami-based products is
relatively unexplored. In this chapter, we attempt to advance a model that was originally
developed by Logawa (Logawa, 2017), to follow acoustical behaviour of our AV products
to suggest the optimized combination of parameters for efficient production. Based upon
the experimental observations (see Chapter 3), we assume our AV products are
Helmholtz resonators due to their tortuous structure. We applied the idea of transfer
matrix method to solve the governing equations for a multilayer porous media. To simplify
the problem, we approximated the characteristic of porous media with their equivalent
fluid calculated through the model proposed by (Attenborough, 1983). Here, after the
validation process, we analyzed the sensitivity of our model to the input parameters and
suggested the physically-reasonable parametric combinations to follow our experimental
results. After we examined all aspects of our model and the influence of all parameters,
we used our findings to optimize the production procedure to develop more efficient AV
absorbers in the future.
4.1 Modeling
Our research aimed to understand the acoustical behaviour of a multilayer complex
structure in a broad range of sound frequencies. Due to the diverse number of degrees
of freedom, the exact numerical simulation of such a complicated problem was difficult.
in designing controlled and accurate experimental procedures to study the sound
41
absorption in this multi-dimensional tortuous structure; However, other mathematical
methodologies describe. The AV-mounted foam-paper product that we studied was a
complex form of a Helmholtz resonator due to multiple cavities in the Origami-grass
structure backed with foam-paper. Therefore, we applied the Helmholtz resonator theory
to model this system. As we had two layers in our system (foam-paper and Origami-grass)
we employed transfer matrix method to transfer the sound energy specification
propagating from one layer to another. We studied sound propagation in the system by
dividing Helmholtz resonator arrays into multilayer arrays and used transfer matrix
method in the boundaries of each layer. We used the formulations provided in Chapter 2
for our numerical computations.
4.2 Results
Our developed model was validated through some systematic numerical tests before
applying in the practical simulations. The accuracy of the model was tested for some
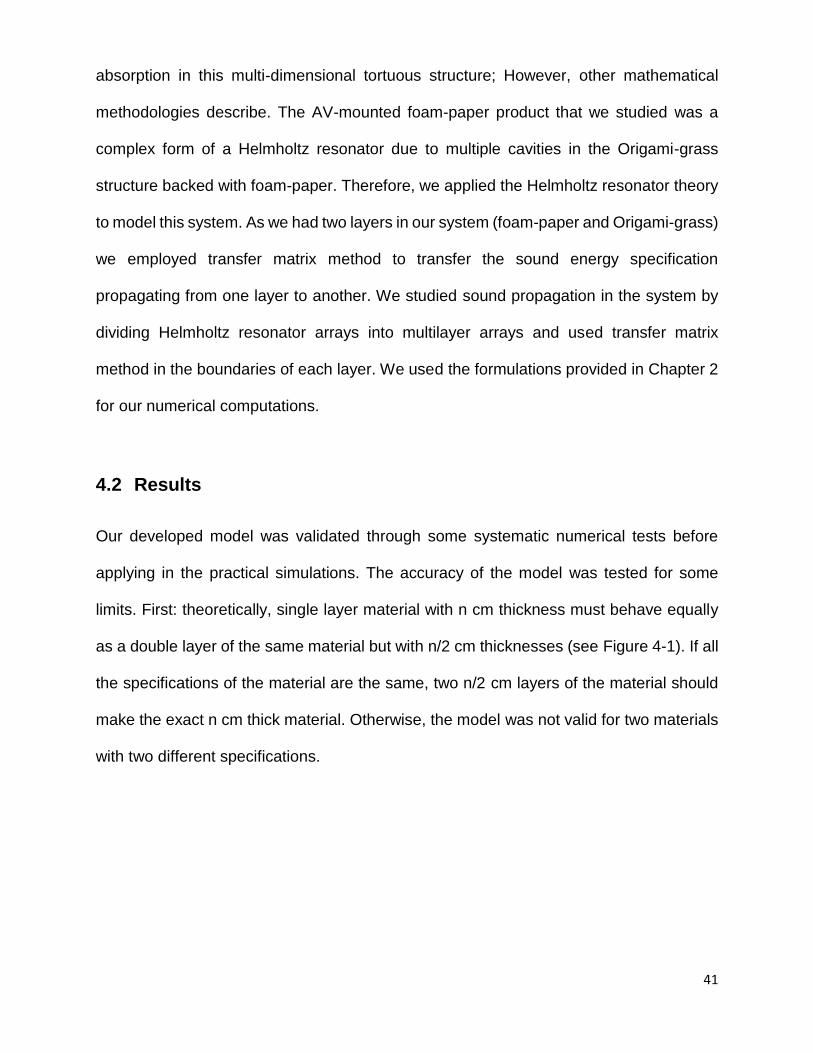
limits. First: theoretically, single layer material with n cm thickness must behave equally
as a double layer of the same material but with n/2 cm thicknesses (see Figure 4-1). If all
the specifications of the material are the same, two n/2 cm layers of the material should
make the exact n cm thick material. Otherwise, the model was not valid for two materials
with two different specifications.
42
Figure 4-1 n cm and two n/2 cm material
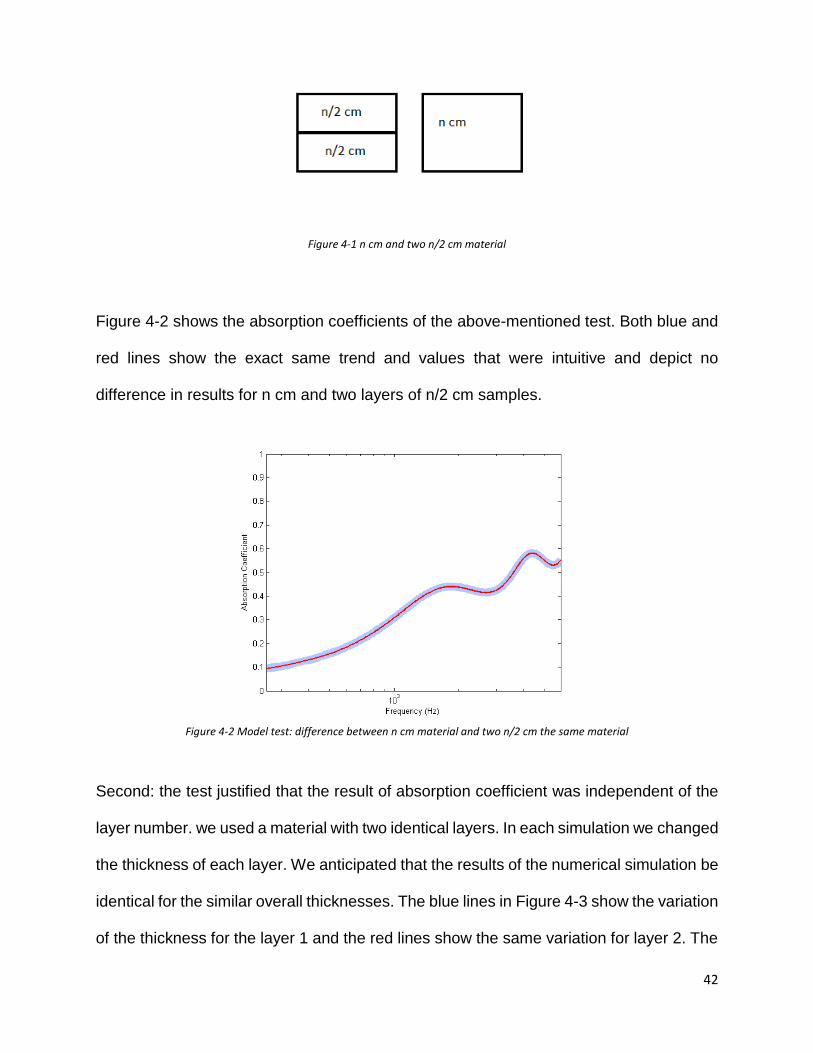
Figure 4-2 shows the absorption coefficients of the above-mentioned test. Both blue and
red lines show the exact same trend and values that were intuitive and depict no
difference in results for n cm and two layers of n/2 cm samples.
Figure 4-2 Model test: difference between n cm material and two n/2 cm the same material
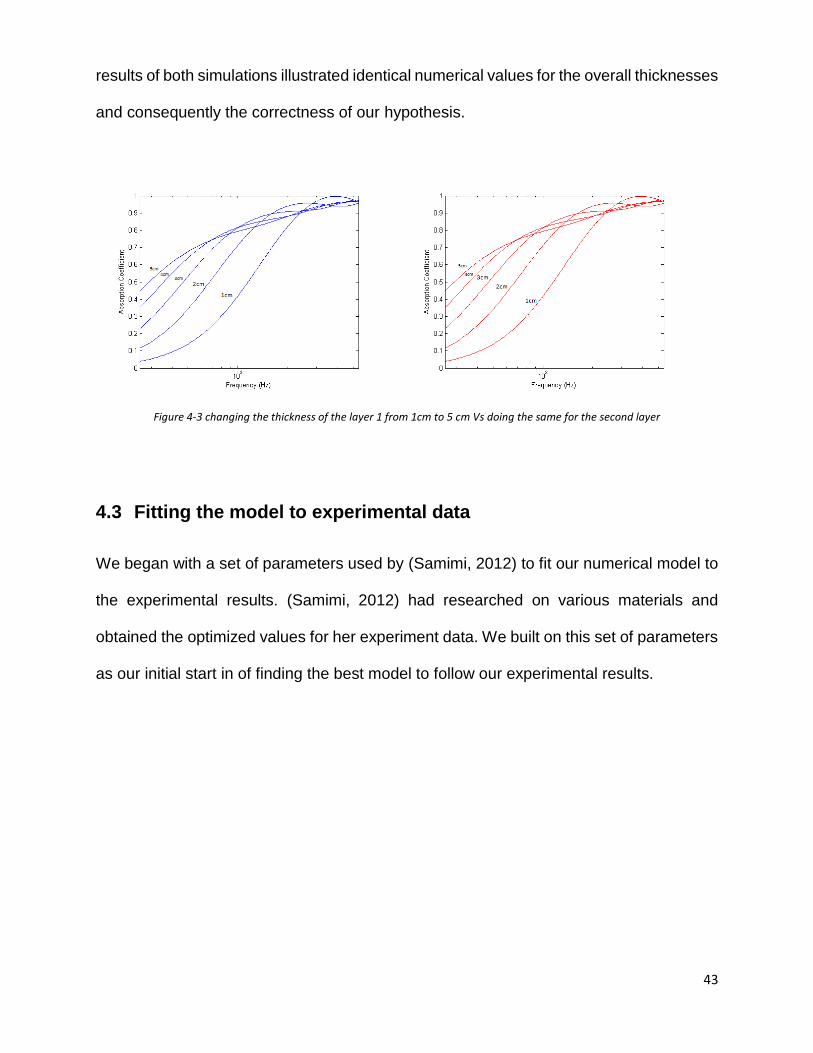
Second: the test justified that the result of absorption coefficient was independent of the
layer number. we used a material with two identical layers. In each simulation we changed
the thickness of each layer. We anticipated that the results of the numerical simulation be
identical for the similar overall thicknesses. The blue lines in Figure 4-3 show the variation
of the thickness for the layer 1 and the red lines show the same variation for layer 2. The
43
results of both simulations illustrated identical numerical values for the overall thicknesses
and consequently the correctness of our hypothesis.
Figure 4-3 changing the thickness of the layer 1 from 1cm to 5 cm Vs doing the same for the second layer
4.3 Fitting the model to experimental data
We began with a set of parameters used by (Samimi, 2012) to fit our numerical model to
the experimental results. (Samimi, 2012) had researched on various materials and
obtained the optimized values for her experiment data. We built on this set of parameters
as our initial start in of finding the best model to follow our experimental results.
44
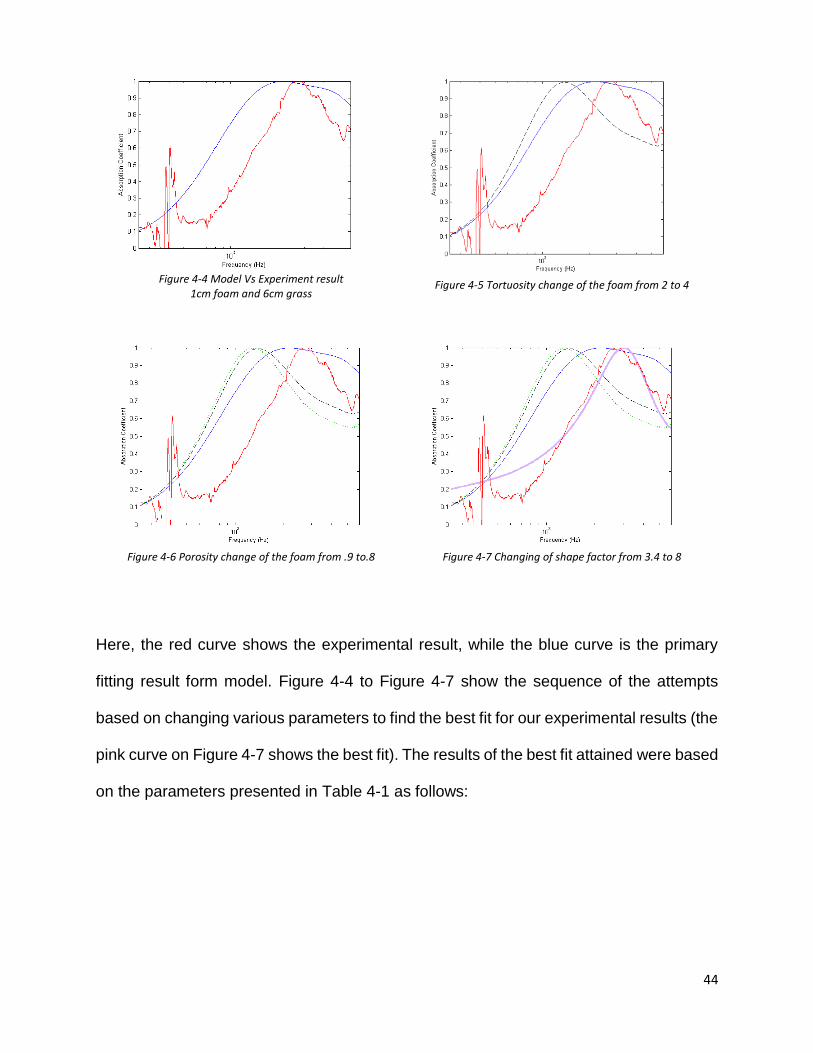
Figure 4-4 Model Vs Experiment result
1cm foam and 6cm grass
Figure 4-5 Tortuosity change of the foam from 2 to 4
Figure 4-6 Porosity change of the foam from .9 to.8
Figure 4-7 Changing of shape factor from 3.4 to 8
Here, the red curve shows the experimental result, while the blue curve is the primary
fitting result form model. Figure 4-4 to Figure 4-7 show the sequence of the attempts
based on changing various parameters to find the best fit for our experimental results (the
pink curve on Figure 4-7 shows the best fit). The results of the best fit attained were based
on the parameters presented in Table 4-1 as follows:
45
Thickness Tortuosity Porosity Shape Factor Flow Restivity
Foam-paper 2.0 2.0 0.88 0.1 5000
Origami-grass 2.5 1.0 0.99 3.4 1000
Table 4-1 Parameters for the best fit to the experimental results
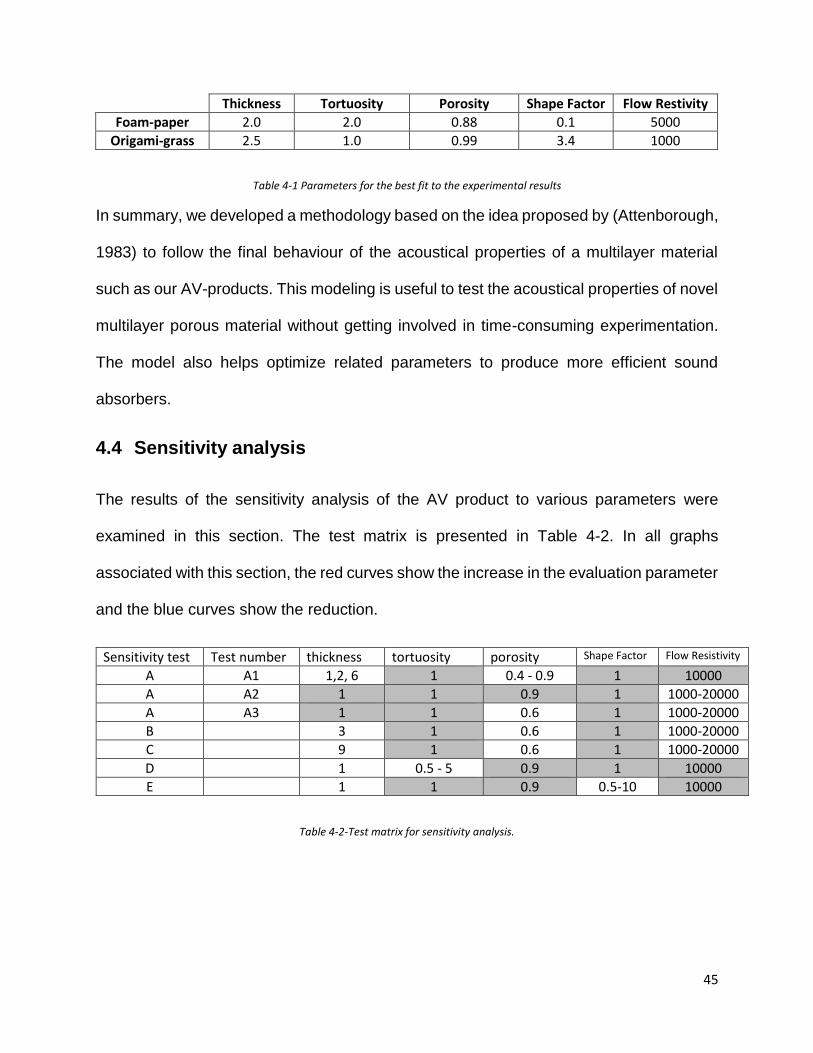
In summary, we developed a methodology based on the idea proposed by (Attenborough,
1983) to follow the final behaviour of the acoustical properties of a multilayer material
such as our AV-products. This modeling is useful to test the acoustical properties of novel
multilayer porous material without getting involved in time-consuming experimentation.
The model also helps optimize related parameters to produce more efficient sound
absorbers.
4.4 Sensitivity analysis
The results of the sensitivity analysis of the AV product to various parameters were
examined in this section. The test matrix is presented in Table 4-2. In all graphs
associated with this section, the red curves show the increase in the evaluation parameter
and the blue curves show the reduction.
Sensitivity test Test number thickness tortuosity porosity Shape Factor Flow Resistivity
A A1 1,2, 6 1 0.4 - 0.9 1 10000
A A2 1 1 0.9 1 1000-20000
A A3 1 1 0.6 1 1000-20000
B 3 1 0.6 1 1000-20000
C 9 1 0.6 1 1000-20000
D 1 0.5 - 5 0.9 1 10000
E 1 1 0.9 0.5-10 10000
Table 4-2-Test matrix for sensitivity analysis.

46
Figure 4-8 Test A1: Changing the foam-paper porosity from 0.4 to 0.9 for the thicknesses of 1,2 and 6 cm.
Figure 4-8 shows the sensitivity of the absorption coefficient to the porosity in the range
of 0.4 - 0.9 for three various thicknesses of 1, 2, and 6 cm (represented by blue, red, and
black family of curves respectively). The results show that increasing the thickness of
foam-paper of the AV products led to a significant increase of the absorption coefficients
in low frequency zones. The graph also indicates that the variation of the absorption
coefficient diminishes in the range of high porosities (> 0.8) compared to the relatively
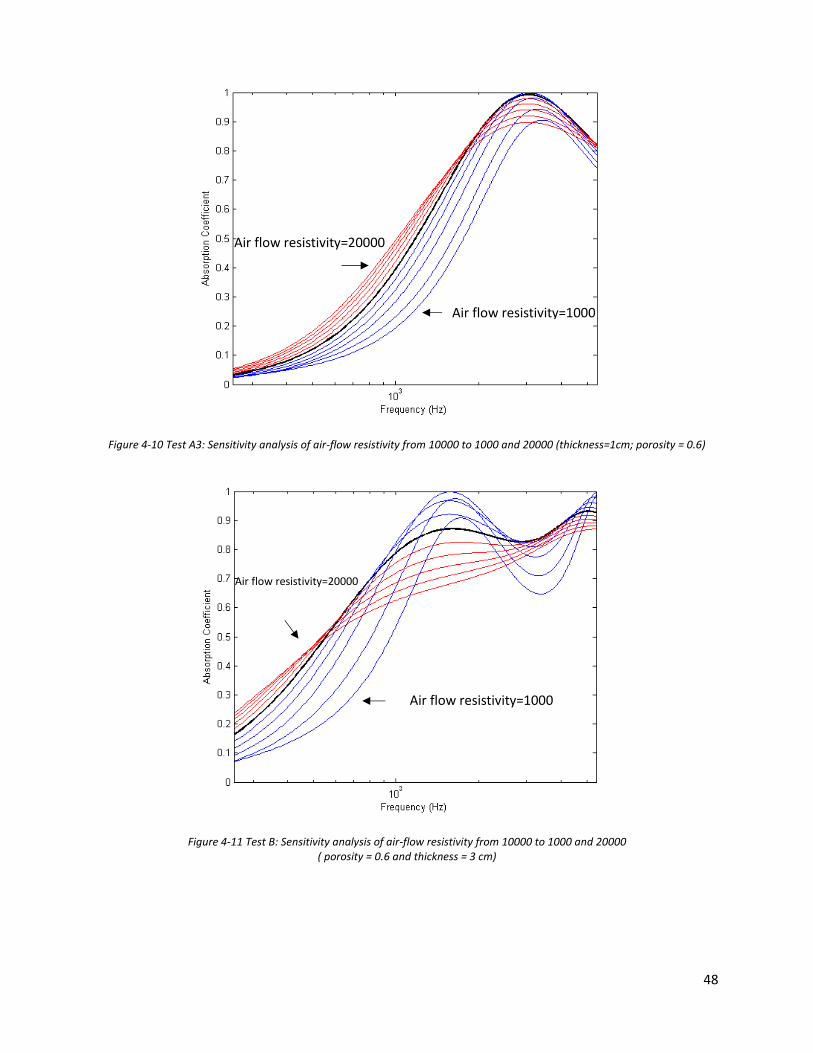
lower porosities. Figure 4-9 shows the sensitivity of the absorption coefficient to the air-
flow resistivity. The results showed that increasing the value of the air-flow resistivity
generally increases the average value of the absorption coefficient in various frequencies.
In practice, the air flow resistivity increased by thickening the foam-paper and increased
the foliage of the vegetated region. Figures 4-10, 4-11 and 4-12 show the results of
1cm
2cm
3cm
Porosity=0.4
Porosity=0.9
Porosity=0.4
Porosity=0.9
Porosity=0.4
Porosity=0.9

47
porosity of 0.6, thickness of 3cm and 9cm respectively o investigate the similar effect of
the air-flow resistivity at different porosities and thicknesses.
Figure 4-9 Test A2: Sensitivity analysis of air flow resistivity from 10000 to 1000 and 20000 (porosity = 0.9)
Air flow resistivity=1000
Air flow resistivity=20000
48
Figure 4-10 Test A3: Sensitivity analysis of air-flow resistivity from 10000 to 1000 and 20000 (thickness=1cm; porosity = 0.6)
Figure 4-11 Test B: Sensitivity analysis of air-flow resistivity from 10000 to 1000 and 20000 ( porosity = 0.6 and thickness = 3 cm)
Air flow resistivity=1000
Air flow resistivity=20000
Air flow resistivity=1000
Air flow resistivity=20000
49
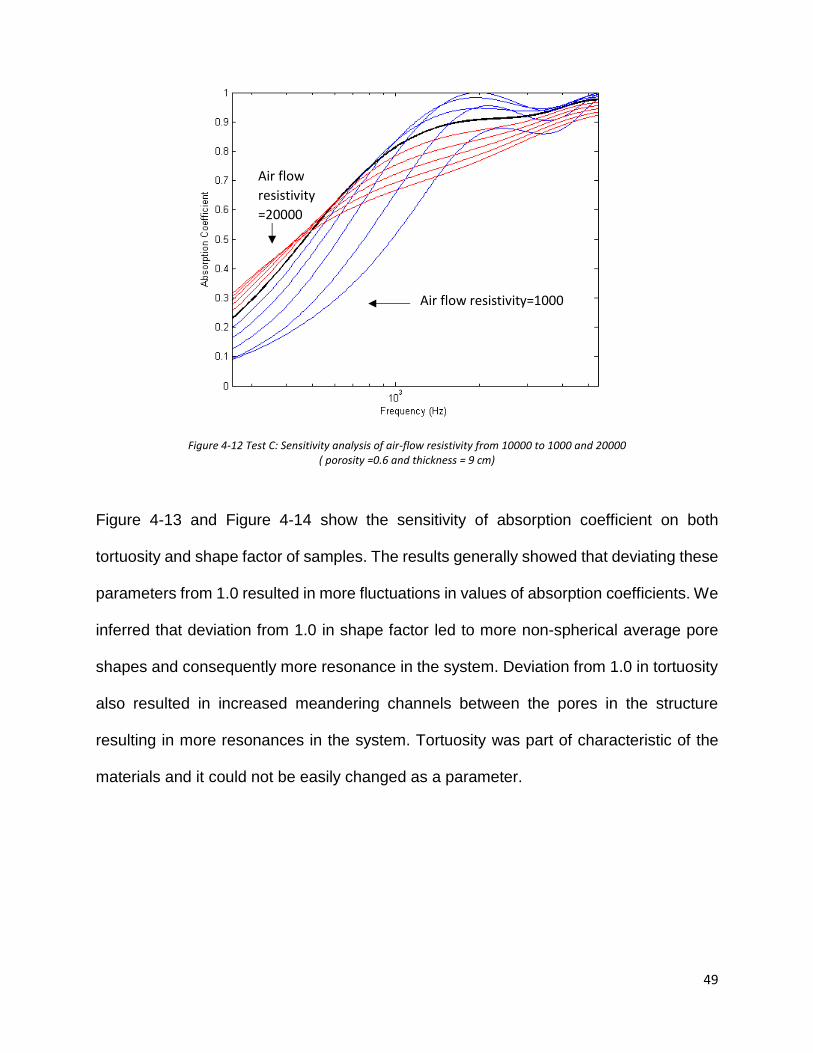
Figure 4-12 Test C: Sensitivity analysis of air-flow resistivity from 10000 to 1000 and 20000 ( porosity =0.6 and thickness = 9 cm)
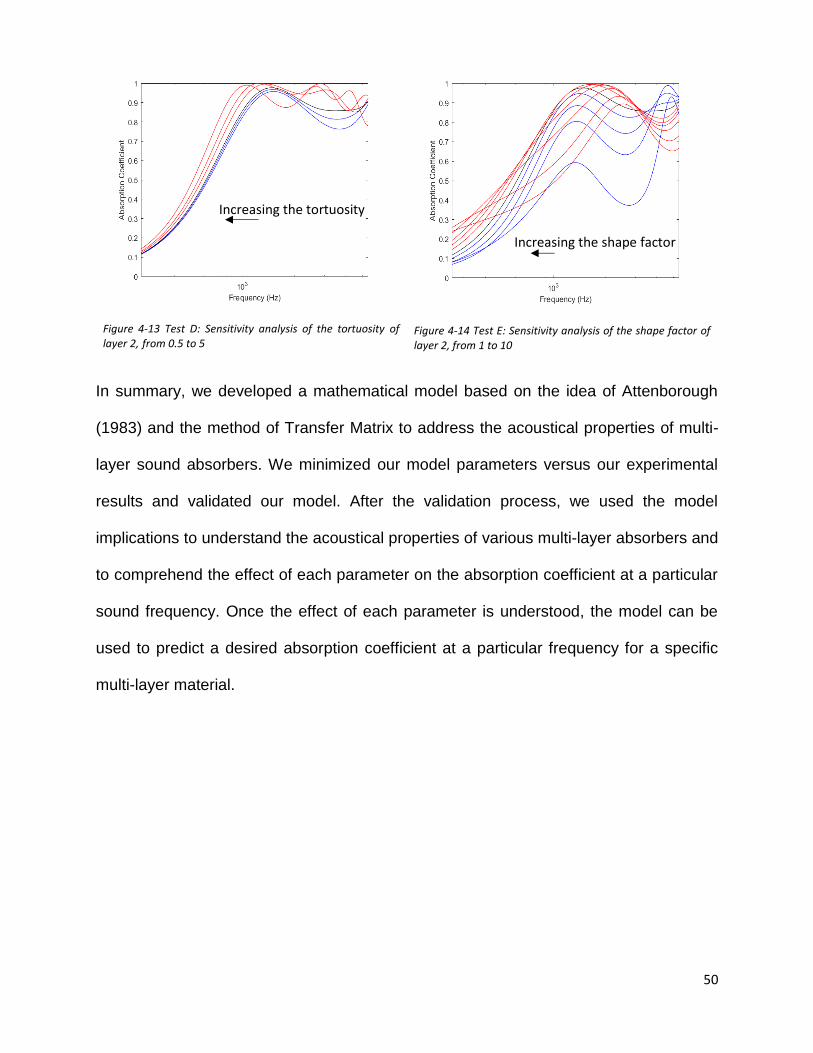
Figure 4-13 and Figure 4-14 show the sensitivity of absorption coefficient on both
tortuosity and shape factor of samples. The results generally showed that deviating these
parameters from 1.0 resulted in more fluctuations in values of absorption coefficients. We
inferred that deviation from 1.0 in shape factor led to more non-spherical average pore
shapes and consequently more resonance in the system. Deviation from 1.0 in tortuosity
also resulted in increased meandering channels between the pores in the structure
resulting in more resonances in the system. Tortuosity was part of characteristic of the
materials and it could not be easily changed as a parameter.
Air flow resistivity=1000
Air flow
resistivity
=20000
50
Figure 4-13 Test D: Sensitivity analysis of the tortuosity of layer 2, from 0.5 to 5
Figure 4-14 Test E: Sensitivity analysis of the shape factor of layer 2, from 1 to 10
In summary, we developed a mathematical model based on the idea of Attenborough
(1983) and the method of Transfer Matrix to address the acoustical properties of multi-
layer sound absorbers. We minimized our model parameters versus our experimental
results and validated our model. After the validation process, we used the model
implications to understand the acoustical properties of various multi-layer absorbers and
to comprehend the effect of each parameter on the absorption coefficient at a particular
sound frequency. Once the effect of each parameter is understood, the model can be
used to predict a desired absorption coefficient at a particular frequency for a specific
multi-layer material.
Increasing the tortuosity
Increasing the shape factor
51
5 Summary, Conclusions, and Final Remarks
In this chapter, the main scientific and engineering contributions of this thesis are
highlighted followed by some practical recommendations based on both experimental and
modeling results for the future. We attempted to develop a novel green and biodegradable
sound absorber product as an alternative to porous absorbers. We developed this product
by combining the foam-paper material and a novel technology borrowed from the Origami
techniques. This process – which we named Artificial Vegetation (AV) – was inspired by
the structure of planted grass in a soil-based platform. We mimicked this structure and
produced a novel material with excellent acoustical properties applicable to building
construction industry.
We reviewed the major methodologies recommended by the foam and Origami
techniques. We repeated the work done by (Jahangiri, 2013) and (Sina, 2015) to develop
the base products used to produce Artificial Vegetative sound absorbers. Through this
procedure, we also validated the results of our tests with the ones already introduced in
the literature. In the foam-forming paper-making technology, we reproduced the
experimental setup proposed by (Jahangiri, 2013) and developed a series of foam-papers
with various foam air-contents as a platform for our novel AV products. We also repeated
the Origami method used by (Sina, 2015) to reproduce the self-folding paper technology
as a platform to produce the additional porous structure on top of the foam-paper.
We proceeded by combining the foam-paper structure with the novel artificial grass
geometries developed through the Origami method to produce the Artificial Vegetative
52
sound absorbers. To confirm the positive effect of the grass geometry on the acoustical
behavior of the foam-papers, we designed systematic acoustical experiments to examine
the sound absorption efficiency of the novel AV products. The experimental results
showed that increasing the thickness of the artificial grass layer increased sound
absorption of the AV products significantly while the products flow-resistivity remained
relatively unaltered. Overall, the experiments showed an eye-catching improvement in
the acoustical behavior of the novel AV products.
To understand the influence of the different parameters on the acoustical behavior of the
AV products and to come up with new efficient designs, we advanced a mathematical
model to simulate the absorption coefficients of multi-layer porous structures. We studied
the effects of various parameters such as layer-thickness, porosity, shape-factor, flow-
resistivity, and tortuosity. Our experimentation assisted in understanding how the
absorption coefficient behaved in different frequencies.
In conclusion, we proved that the AV product has excellent acoustical properties that can
be used as a sound absorber in buildings. Our research findings are the necessary first
step to a larger research and development programs to produce novel renewable,
biodegradable cellulose based sound absorbers. In future, various foam-paper materials
as well as different designs for the artificial grass could help optimize the sound
absorptivity of the AV products further.

53
References
[1] Ahmadi, H. (2016). Cellulose-Mycelia Foam: Novel Bio-Composite Material. Master’s
Thesis, (University of British Columbia).
[2] Attenborough, K. (1983). Acoustical characteristics of rigid fibrous absorbents and
granular materials Po, 73(March 1983), 785–799.
[3] Aylor, D. (1972). Sound Transmission through Vegetation in Relation to Leaf Area
Density, Leaf Width, and Breadth of Canopy. The Journal of the Acoustical Society of
America, 51(1B), 411.
[4] Azkorra, Z., Prez, G., Coma, J., Cabeza, L. F., Bures, S., lvaro, J. E., Urrestarazu, M.
(2015). Evaluation of green walls as a passive acoustic insulation system for buildings.
Applied Acoustics, 89, 46–56.
[5] Bullen, R., and Fricke, F. (1982). Sound propagation through vegetation. Journal of
Sound and Vibration, 80(1), 11–23.
[6] Burns, S. H. (1979). The absorption of sound by pine trees. Journal of Acoustic Society of
America, 65(3), 658–661.
[7] Cervin, N. ., Andersson, L., J. B. S, N., Olin, P., Bergstrm, L., and Wgberg, L. (2013).
Lightweight and strong cellulose materials made from aqueous foams stabilized by nano
brillated cellulose. Biomacromolecules, 14(2), 503–511.
[8] Cook, D. I., and Van Haverbeke, D. F. (1971). Trees and shrubs for noise abatement.,
Res. Bull., 77 p.
[9] Delany, and Bazley. (1969). Acoustical properties o f fibrous absorbent materials, (3).
[10] Dickey, M. D. (2012). Soft Matter Self-folding of polymer sheets using local light

54
absorption 8(6).
[11] Fricke, F. (1984). Sound attenuation in forests. Journal of Sound and Vibration, 92(1),
149–158.
[12] Guest, S. . (1994). Folding Triangulated Cylinders. Journal of Applied Mechanic, 61,
773.
[13] H. Sehaqui, M. S., Zhou, Q., and Berglund, L. a. (2010). Mechanical performance
tailoring of tough ultra-high porosity foams prepared from cellulose suspensions. Soft
Matter, 6, 1824.
[14] Horoshenkov, K. V. (2013). Acoustic properties of low growing plants. The Journal of
the Acoustical Society of America, 133(5), 2554–2565.
[15] Jahangiri, P. (2013). Novel cellulose based foam-formed products : applications and
numerical studies, PhD thesis(November), University of British Columbia.
[16] Jahedi, M. (2010). Folding in Architecture: A Spatial, Structural and Material
Investigation, University of British Colombia, Vancouver.
[17] Korehei, R. (2016). Effects of drying strategies and micro brillated cellulose ber content
on the properties of foam-formed paper. Journal of Wood Chemistry and Technology,
36(4), 235–249.
[18] Logawa, B. (2017). Improving The Sound-Absorption of Cross-Laminated Timber Panels
Using Resonant Absorbers Layers. Masters' Thesis, (June), University of British
Columbia.
[19] M. Deng. (2009). Preparation of nanoporous cellulose foams from cellulose-ionic liquid
solutions. Materials Letters, 63(21), 1851–1854.
[20] Miki, Y. (1990). Aeoustical properties of porous materials Modifications of Delany-
Bazley models. Journal of Acoustic Society of Japan, 11(1), 19–24.
55
[21] Miura, K. (1992). Concepts of Deployable Space Structures. Internation Journal of Space
Structures, 8(1&2), 3–16.
[22] Nisser, M. E. W. (2016). Feedback-Controlled Self-Folding of Autonomous Robot
Collectives, 1254–1261.
[23] Nojima, T, and Saito, K. (2006). Development of Newly Designed Ultra-Light Core
Structures,. JSME Int. J., Ser.A, Vol.49, No.1, 38–42.
[24] Radvan, B., & Gatward, A. (1972). Formation of wet-laid webs by a foaming process.
Tappi, 55(5), 748.
[25] Samimi, M. (2012). Sound Absorbing Porous Materials : Modelling of Normal
Absorption Coefficient. Noise Control Lab Course Report.
[26] Sina, A. (2015). Origami Engineering: Advanced Converting for Novel Paper Products.
Masters’ Thesis.
[27] Smith, M., and Punton, V. (1975). The role of the forming process in determining the
structure and properties of paper. Pulp Pap Can, 76, 114–117.
[28] Taherzadeh, S., Attenborough, K., and Bashir, I. (2012). Sound attenuation by crops and
hedges. Soci´
[29] et´ e Fran¸ caise d’Acoustique
[30] Tringham, R. (1974). New developments in radfoam process. Paper Technology and
Industry 15(5), 288–294.
[31] Wolkesson, M., (2013). Evaluation of impedance tube methods - A two microphone in-
situ method for road surfaces and the three microphone transfer function method for
porous materials Masters' Thesis, Chalmers University.