artificial recharge at kwemakame spring water intakes ... · information on the behaviour of the...
TRANSCRIPT

Artificial recharge at Kwemakame spring water intakes, Usambara Mountains, Tanzania Short mission report Project Title: Project number:
Tanzania - Chamavita Spring water supply research project Aquanet 11016
Country: Tanzania Period: October 25 – November 8 2014 Participants: Harry Rolf Author(s): Harry Rolf ([email protected]) Date of Report: November 14 (Draft) Copy to: Aquanet, Aqua for All, Chamavita, PBWO, SamSamWater, Kees
Kempenaar (SPOTT)

Mission Report Spring water Chamavita 2014-I
Page 1 of 21
Introduction This is short report of my (last) mission to the ‘Chamavita Spring Water’ research project. The project is finishing this year, 2014. This mission was mainly to disseminate the results to Water Stakeholders in the wider area. Apart from that, a last inspection of the project facilities was carried out. The highlights of the mission are given below. The rest of this report gives my findings from day to day. Some technical issues are elaborated in annexes added to this report.
Highlights Successful dissemination meetings were held in Moshi and Kwemakame Village. Very unfortunately the meeting in Tanga had to be skipped at the very last moment due to miscommunication and untimely preparation. The subject of rainwater Harvesting and Groundwater Recharge was clarified and discussed. The attendees now understand that: it is beneficial to use excessive rainwater. During major rain showers this water is just running
off, out of the area and unused for the water system it makes sense and it is feasible to harvest that water and to store it for later use in the dry
season storing water underground is a good, clean and low-cost option. In the meetings the project was presented, followed by livingly discussions. Many questions were asked and clarified. While visiting the structures at the Dindira source, the attendees showed to be impressed by all the good work that have been done to improve the source. It was a pity that not many people from other villages and Water Associations were invited due to budget issues (and miscommunication). Dissemination products are now available: project poster ‘Mvua Bombani’ (‘Tap Water from Rain’) PPT presentation summary Report The information will be made available on SamSamWater.com website and other sources. The village of Kwemakame/ Kwai is extremely happy with the results of the research project, since they can now meet the water demand throughout the dry season. This has not been the case since many years.
Possible follow up Pangani Basin Water Office suggested to carrying out a survey (both desk and field) on the options to replicate the concept for other similar water schemes in the wider Lushoto district. This needs to be followed up. Such a survey may fit as well to the Dutch ‘3R’ initiative. Lushoto Urban Water Supply is interested as well, even to apply the concept to the city water supply.
The project pilots Pilot 1 (artificial recharge of rainfall, runoff water) The infrastructural is in a good state and is functioning properly. Over the years the silts inside the reservoir need to be removed, but up to now the silts are not blocking infiltration. So far 2560 m3 of additional water has been infiltrated in two rain seasons.

Mission Report Spring water Chamavita 2014-I
Page 2 of 21
Pilot 2 (slow sand filter, treating the water that is seeping permanently from the underground to the reservoir) The SSF construction was re-enforced (at additional costs). The filter can produce safe drinking water at 4000 – 5000 litre every day, if properly operated. The functioning is hindered by a leak on one side of the filter wall. This needs repairing asap. The research benefits from the diverloggers that have been installed since 2012. No diver (at least not in Dindira) has been stolen, due to the caretaking off local staff (Mr. Kiyango). Even now (the hand-data collection being stopped since the beginning of this year) the loggers give excellent information on the behaviour of the system. The divers were re-started and thus they are still reading data every 30 minutes in the year to come. My advice: in any next project, install diverloggers from the very beginning.
O&M The project has now been handed over to the Kwemakame/Kwai Village. Organized operation and maintenance is the crucial next step for sustainability. As in many rural water schemes, this is a major challenge. The village needs to improve on operation and maintenance. The awareness on the scheme’s operation is low. The O&M issue is discussed with Chamavita and the village and needs to be put in action urgently. This will be brought to the attention of SPOT Tanzania as well. The Dindira main storage tank for instance is still overflowing at times. From the diverlogger readings it was calculated that at least 11% (but probably more, say 20%) of the yearly yield is going to waste due to the overflows!! So, topping up to the project benefits, the village can have 20% additional water supply, just by improving the operation. This is the first priority to be addressed as soon as possible.
Water Quality Water quality certainly is an issue. Main source of pollution is from farming on the shambas close to the intakes. Raised nitrate levels were indicated both in the field and from water sample analysis. Water was not (yet) tested on the occurrence of inorganic chemical fertilizers. Water quality protection areas need to be demarcated to protect the water sources from pollution.
Finances confidential.

Mission Report Spring water Chamavita 2014-I
Page 3 of 21
Day by day activities & findings
Saturday 25/10/2014 Amsterdam – KIA Staying at Blue Acacia Hotel Moshi.
Sunday Oct 26 Preparing PPT presentation for dissemination meetings Preparing summary project report Late afternoon meeting Mr. Mwanjela na Simon Shoo on their arrival in Moshi Planning the mission Discussion on available budget for dissemination. Beforehand I wrote to Mwanjela that there is
no budget for paying invitees for there travelling and accommodation. The bottom line is the available project budget. According to my calculations there should be roughly Tsh 10,000,000.-. be available for this mission and dissemination. This, however is very uncertain since the status of the spending is yet not known.
Monday Oct 27 Dissemination meeting at Pangani Basin Office Moshi PPT Presentation Introduction of the project poster Mvua Bombani 15 participants, mostly from PBWO We were introduced to the principle hydrogeologist, Mr. Kanyawanah, +255 754 596122 , [email protected]. PBWO is interested in the further upscaling of this interesting new concept, e.g. by preparing an assessment study on ‘opportunities for artificial recharge to boost spring water yields’, e.g. in the area surrounding Lushoto. Actually, the subject of Water harvesting (Retention), Recharge and Re-use should be very relevant for the Dutch 3R initiative as well. This needs to be followed up. Further discussion issues: Explain why the Dindira scheme depleted in the years after construction 1989 (by ‘using up
groundwater storage and then stabilizing to just yielding added recharge’). This is something to explain in more detail in the project report. Some basic groundwater modelling might explain this in a quantitative way.
Idea to replicate and upscale the concept, starting with an assessment of the potentials (‘quick mapping’). This is a good suggestion. It is feasible by using digital maps, delineating catchment areas, existing water schemes, landuse (natural, protected areas vs. farming land, etc.). This would be a relevant subject for the 3R initiative!
Can this (artificial recharge of storm water) also be applied in flat areas? Yes it can, to boost shallow wells or boreholes.
Water quality: isn’t there a risk of recharging contaminated water that might pollute the aquifer? (meaning the indicated pollution by nitrates, and maybe even chemical fertilizers?). (Good question this certainly is an issue.)
Shouldn’t there be guidelines, or even a law for doing this? (…I hope not….)
Tuesday Oct 28 Travelling Moshi – Lushoto Staying in Tumaini hostel
Mission Report Spring water Chamavita 2014-I
Page 4 of 21
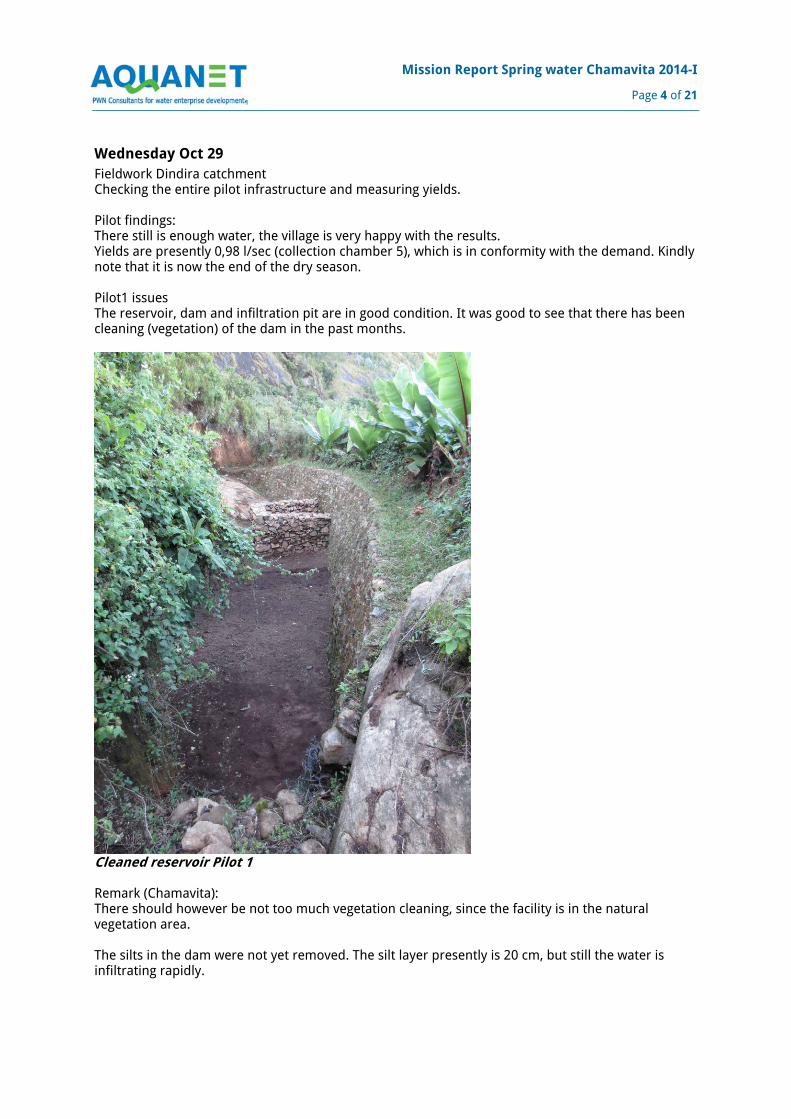
Wednesday Oct 29 Fieldwork Dindira catchment Checking the entire pilot infrastructure and measuring yields. Pilot findings: There still is enough water, the village is very happy with the results. Yields are presently 0,98 l/sec (collection chamber 5), which is in conformity with the demand. Kindly note that it is now the end of the dry season. Pilot1 issues The reservoir, dam and infiltration pit are in good condition. It was good to see that there has been cleaning (vegetation) of the dam in the past months.
Cleaned reservoir Pilot 1 Remark (Chamavita): There should however be not too much vegetation cleaning, since the facility is in the natural vegetation area. The silts in the dam were not yet removed. The silt layer presently is 20 cm, but still the water is infiltrating rapidly.

Mission Report Spring water Chamavita 2014-I
Page 5 of 21
Intake nr. 2 is partly blocked. It is interesting to see how nicely this is registered by the diverloggers (see later, this report) Pilot nr. 2 (Slow sand filter treatment of groundwater seepage water from the Pilot 2 reservoir) The SSF (Slow Sand Filter) is still looking good. The walls had some additional plastering and the inlet pipes have been changed to a larger diameter size (1,5”). This was advised in the previous mission.
Perforated 1,5” polythene inlet pipe on top of the sandfilter We did a full assessment of the SSF capacity. The pipe size is now more than enough to supply water from the reservoir to the sandfilter. The capacity of the sand filter itself is tested at 8700 litre/day. The seepage to the reservoir is 4000 to 5000 litre/day. Thus the sandfilter can easily take the seepage water in full and treat it to safe drinking water. There is one challenge remaining: there is water leaking through the North side of the filter wall (due to animal digging?). This needs to be repaired asap since the leakage increases rapidly. The hole must be blocked with clay/stones and the wall needs to be backfilled by well-compacted clay soil to have enough pressure on the outside of the wall. Divers All divers were recovered, not one was missing (excellent!) This day we met Mr. Kyango Sefu. Kiyango completed his Vocational Training at Mbeya this summer, where he has got his certificate. This training was financed by donations at my PWN retirement. Kyango is presently doing jobs for Chamavita. He wrote a ‘thank you’ letter telling the story of his training. This letter will be used as feedback to the people who donated money for the training.
Thursday Oct 30 Full day working on project summary report. The report is now available in final draft version.

Mission Report Spring water Chamavita 2014-I
Page 6 of 21
Friday Oct 31 Finalizing summary report, printing and copying. Meeting Chamavita: Monday’s dissemination meeting at Kwemakame and finances (spendings 2014) The 2014 spending (up to May) were checked and discussed. confidential.
Saturday 1/11 Diver(logger) data recovery and processing. 7 divers were re-installed (30 min. frequency) at Dindira (by Kiyango Sefu). One diver could not be re-started for unknown reason. The Diver readings give excellent new information. Some examples are highlighted below. Pilot 1 dam fillings There have been 28 (partial) fillings in the pilot1 reservoir in the last rain season (since November 26, 2013). The infiltration volumes are calculated from the high frequency diver data. The total infiltration for the 2013-2014 rain season was 1200 m3. Total infiltration in the previous rain season was 1350 m3. So, a total of 2530 m3 has been recharged to the groundwater aquifer.
water depth pilot nr.1 reservoir
0
10
20
30
40
50
60
70
01/04/2014 00:00 03/04/2014 00:00 05/04/2014 00:00 07/04/2014 00:00 09/04/2014 00:00 11/04/2014 00:00 13/04/2014 00:00 15/04/2014 00:00
pilot1 reservoir correctedbarotank"Fillings of the pilot1 dam in April 2014After the filling the water infiltrates very fast , within one or two days and the reservoir is ready to receive new rainwater in the days after.(The variations around 5 cm level are caused by barometric variations)
Graph of the water level inside the pilot 1 reservoir, showing some of the fillings in April. The total infiltrated volume is however much less than expected. This is mainly caused by the runoff volumes, so high in the catchment. We observed that there is much more runoff down in the catchment. This is an important lesson learned. When the concept is replicated in other villages, one of the first things to consider is the runoff: how much and where? There is however a dilemma: the largest runoff volume is down in the catchment. But these lower areas are mostly farm land, while the upper catchment is protected (non-farming) area. The lower runoff is flowing over these plots and may take up fertilizers from the soil, causing water quality problems (Nitrates or even derivatives from inorganic, synthetic fertilizers). Thus, while the infiltration is preferred in the top of the catchment (feeding through the whole groundwater system), most of the runoff water is available down in the catchment and there I may be contaminated. This really is an issue for any next project.

Mission Report Spring water Chamavita 2014-I
Page 7 of 21
Intake nr. 2 Divers were installed both in the intake chamber and in a groundwater piezometers (nr. 2A) some 7 m metres upstream of the intake. Very interesting data, showing the behaviour of groundwater level when the intake was closed and opened (in June). By the end of September the outlet pipe is slowly blocking; this process is showed as well in the diver readings.
Water levels intake nr.2
0
50
100
150
200
250
300
16/03/2014 00:00 05/05/2014 00:00 24/06/2014 00:00 13/08/2014 00:00 02/10/2014 00:00
wat
er
lev
el i
n c
m a
bo
ve c
ha
mb
er
flo
or
chamber intake 2 corrected baro tank
groundwater level piezometer 2Aintake closed
outlet pipe getting blocked
Graph, showing the behaviour of the water level inside the intake chamber and the groundwater level in front of the intake. The groundwater level is the driving force for the outflow to the intake. It is nice to see how groundwater level is high (building up storage) when the intake is closed (the first part of the graph, up to June 9). Then, at June 9 the intake was opened, and the level in the chamber drops immediately to the level of the outlet pipe down in the chamber. Groundwater level shows a nice and slow decay over the dry season. Starting September 20, the outlet pipe of the intake is slowly getting blocked: since the water cannot flow out easily, the level in the intake chamber rises. Dindira storage tank The diver readings from the Dindira main tank show that the tank still overflows at night. Even at the end of the dry season! This is a serious loss of water. Some more technical details and calculations from these storage tank data are given in appendix 1.
water depth Dindira Main storage tank
0
50
100
150
200
250
14-Mar-14 03-Apr-14 23-Apr-14 13-May-14 02-Jun-14 22-Jun-14 12-Jul-14 01-Aug-14 21-Aug-14 10-Sep-14 30-Sep-14 20-Oct-14
tank full (overflow)
Graph showing the water level inside the Dindira main storage tank. The tank overflows at +215cm. A lot of water is going to waste due to the many overflows. The amount of overflow water is calculated from the diver data (see more, appendix1). It turns out that at least 11% over the total yield is going to waste due to these overflows. It is likely that some of other tanks, down in the village are overflowing as well (as was already seen in the 2012 diver data, see mission report S.A.de Haas). Therefore the overflow will be even more than the 11%, it may even be 20%. This is a very serious issue. This tends to the conclusion that the many efforts and benefits of this project are going to waste by insufficient operation. The awareness on the functioning of the system actually is very low. The village urgently need to improve on this. The scheme operator needs serious training in the

Mission Report Spring water Chamavita 2014-I
Page 8 of 21
operation of the tanks. Not just by knowing ‘how to open a gate valve’, but by training him to full understanding of the scheme’s functioning. Some basic exercises on how the storage tank could be operated are given in appendix 2.
Sunday Nov 2 Big rain showers in Lushoto and Dindira as well. Pilot1 has received its first runoff water since …how much up to now? (20 cm on the staff gauge in de dam) The divers were re-started today at 0 am. During the day the divers were tested on their performance in Lushoto, at Tumaini. The diver test is described in appendix 4. The divers perform well on water level changes, but the correction on temperature is bad for 3 of the divers.
Monday Nov 3 Dissemination meeting Kemakame and in the field at Dindira There were some problems to organise the presentation at the Village Office (beamer, cable missing, no power, generators ,…..) . It took us up to 3 pm to even start the meeting. Still, after the meeting an excursion could be carried out to the Dindira source infrastructure. Participants were from: Village leaders Village Water Board District Water Officers, Urban Lushoto Water People from other villages in the wider area were unfortunately not invited because Mr. Rolf had announced in advance that we could not allow people coming from other villages to be paid for their transport and accommodation. (At that point in time there was no insight in the budget left for dissemination and the communication was very poor).
Mwanjela did a great job giving the presentation and explaining the invitees the Dindira scheme in the field. It was a pity to see that Mr. Kussaga (Village Scheme operator) did not attend. He could have learned a lot from the many discussions and explanations.

Mission Report Spring water Chamavita 2014-I
Page 9 of 21
There were many questions/ discussions in local language, which was too fast for me to understand. One of the issues is water quality. It is known that some intakes show raised nitrate levels, due to the upper farm lands. There may even be inorganic chemical fertilizers used as well (the water was not tested on these components). Nitrate levels are still within WHO standard. The use of fertilizers is the main threat for water quality and the village should seriously consider the demarcation of protection zones.
The attendees were impressed by the many excellent works that have been done to improve the Dindira source.
The MVUA BOMBANI project poster was presented and given out to the attendees.
Finally, by handing over the summary project report to the village leaders, the project is now finished and given to the ownership and the further care of the Kwai/Kwemakame village.
Tuesday Nov 4 Further processing of Diver data Data processing of the fillings in the pilot 1 reservoir Analysis of diver data Dindira tank. Mission reporting
Wednesday Nov 5 Discussion with Mwanjela on the serious issue of tank overflows and the need for proper operation and Maintenance. We discussed on how to proceed, e.g. the Operation and Maintenance, and how to put these into practise. A list of practical and concrete maintenance action is prepared (see appendix 3)

Mission Report Spring water Chamavita 2014-I
Page 10 of 21
TARUWAS Trust has offered to carry out the O&M for the Kwemakame scheme, but there is still no agreement with the village. On the other hand, the village clearly has not enough knowledge to do it themselves (which e.g. is shown by he overflowing tanks).
Thursday Nov 6 Travelling to Tanga using Chamavita car Stay at Mkonge Hotel (Tsh 90.000,- local price).
Friday Nov 7 Dissemination meeting at Pangani Basin Office. Very unfortunately, the Tanga meeting had to be skipped at the very last moment. Government officials were not properly informed about this meeting. In my opinion this is a serious flaw. Without blaming anyone, but there has been a lack in the timely (!) and correct communication on the organisation of the Tanga meeting (as well as checking and re-checking if it is clear to everybody involved).
Saturday Nov 8 Mission reporting, ending the mission

Mission Report Spring water Chamavita 2014-I
Page 11 of 21
Appendix 1
Calculations on the Dindira storage tank diver readings (March – October 2014)
When the tank outlet is closed at night, the full yield of the intakes is flowing to the tank and the yield can be calculated from the rise of the water level (each 30 minutes). The tank net volume is 87 m3, tank inside surface is 41,62 m2 and the height between empty tank and overflow is 2,1 m. In the graph below the (filling) yields are calculated during the nights.
INDICATION OF TOTAL YIELD?
0.5
0.7
0.9
1.1
1.3
1.5
1.7
1.9
2.1
2.3
2.5
14-Mar-14 13-Apr-14 13-May-14 12-Jun-14 12-Jul-14 11-Aug-14 10-Sep-14 10-Oct-14
YIELD?
YIELD? ONLY at NIGHT
YIELD? ONLY at NIGHT WEEKLY AVERAGE
YIELD? ONLY at NIGHT MONTHLY AVERAGE
The yellow line is the weekly moving average and the blue line is the monthly average. Though it is not clear what caused the remarkable high fillings in June en beginning of July, it shows that the overall filling rate and thus the yield has been in the order of 0,9 l/sec throughout the year, even up to October 2014 (end of dry season). Looking at the monthly average graph it may even be so that the yield in the middle of the year (June, July, August) have been higher, in the order of 1,1.
Note that the water demand of Kwai/ Kwemakame estimated as 1,1 l/sec. And the other smaller Kidandi source is producing 0,15 l/sec (dry season). So this is another proof that the scheme can supply the full demand.

Mission Report Spring water Chamavita 2014-I
Page 12 of 21
Note that the filling rates (without the exceptional Jun/July data) are generally within 0,7 and 1,3 l/sec. This information can be used to set-up operation rules for the tank (see appendix 2)
The next graph shows all the calculated filling rates. (during the whole day)
filling rates (l/sec) Dindira tank
-5
-4
-3
-2
-1
0
1
2
3
14/03/2014 00:00 03/05/2014 00:00 22/06/2014 00:00 11/08/2014 00:00 30/09/2014 00:00
0
50
100
150
200
250
flow neto l/sec
water level
We see the 3 clusters:
1) the top filling rates while filling the tank when it is closed (as shown in the previous graph)
2) The cluster around 0 , these are the times when the tank is either a. empty and open (and the outflow is more than the inflow) b. or overflowing
3) the negative and low filling rates; these occur when the tank is open (delivering down to the village and meanwhile getting water from the intakes. So these are the net outflows.
The net outflows ad3) show a large variance. This must be due to the outflow pipe: the flow to that pipe is large just after opening and it stabilises after some time. The graph shows as well that the operation of the tank has been quite chaotic up to September. Since September (although there are still overflows) the operation has been more regular. From that period we can see that the net outflow (during the day) is in the order of 1,3 l/sec. Taking the inflow to be 0,9 l/sec, we estimate the outflow rate as 2,2 l/sec. So, this is obviously the flow through the pipe when the tank is opened (assuming the gate valve is fully opened). A next assessment is on the overflows. The cluster ad 2) in the previous graph is split, taking only the filling rates around 0 l/sec (accounting for a standard deviation) while the tank is full (>210 cm water depth). During those events, the tank is full and overflowing (net filling rate around 0). Then the yield in the hours before the overflow period was calculated from the filling rates. And the overflow was calculated assuming that the same yield was flowing in while the tank is full. Next graph gives the results

Mission Report Spring water Chamavita 2014-I
Page 13 of 21
cumulative loss of water due to overflows Dindira Main Tank
0
500
1000
1500
2000
2500
3000
3500
13-Mar-14 02-Apr-14 22-Apr-14 12-May-14 01-Jun-14 21-Jun-14 11-Jul-14 31-Jul-14 20-Aug-14 09-Sep-14 29-Sep-14 19-Oct-14
los
s i
n m
3
0
50
100
150
200
250
300
wa
ter
de
pth
(c
m)
Cumulative loss (m3)
water leveltotal yearly supply 28.400 m3 (0.9 l/sec)the total loss due to overflow is estmated at 3034m3This is 11% of the yearly supply
The total (cumulative) overflow volume is estimated at some 3000 m3. This is 11% of the total yield of the Dindira source.
From previous missions (2012, 2013) we know that other tanks (e.g. the Kimunyu and Mtambwe), down in the village show overflows at times as well. So, the estimated 11% overflow is a conservative. The actual percentage may be in the order of 20%.
Of course, this is a serious issue. It shows that there is no understanding on how to operate the water scheme.
This conclusion is a crucial one, since the numbers show that a large part of the efforts and benefits of this research project are going to waste by the lack of understanding (by the village but by Chamavita as well) on the operation of the Kwemakame Water scheme.

Mission Report Spring water Chamavita 2014-I
Page 14 of 21
Appendix 2
Basic operation of the storage tank From the diver readings of the main Dindira storage tank (see appendix 1) we know the dynamic behaviour water level. The next graph gives a detail example on how the tank is operated
Water level Dindira main tank
0
50
100
150
200
250
02-Sep 03-Sep 04-Sep 05-Sep 06-Sep 07-Sep 08-Sep 09-Sep 10-Sep
14
15
16
17
18
19
20
Dindira Main Tank
temp
Friday SundaySaturday Monday
On September 2 the tank was empty. It was closed in the afternoon and opened the next morning. Iit was left open till the next day September 4. In the evening of that day the tank was closed. On Friday September 5 the fundi obviously did not go to the tank to open it and the tank starts to overflow on Friday evening. On Saturday the tank was opened and closed in the afternoon. Then on Sunday, he obviously did not go to open the tank, and the overflow starts again on Sunday morning etc. etc. Weekend operation obviously is a problem? How should the tank be operated? Some exercising were done in a spreadsheet The yield to the tank is in between 0,7 and 1,3 l/sec (2,52 – 4.68 m3/hr). That means that the filling rate (yield/surface) is in between 6 and 11 cm per hour. We assume that the outflow through the pipe down to the village is 2,2 l/sec (if fully opened)

Mission Report Spring water Chamavita 2014-I
Page 15 of 21
0.7 Balnce TOTAL IN 241.92 m3m3/hr m3/hr TOTAL OU 241.92 m3
2.52 7.92 1 start unbalance 0.00%hours inflow (m3) outflow (m3) raise tank water level
0 2.52 0.00 0.06 1.001 2.52 0.00 0.06 1.062 2.52 0.00 0.06 1.123 2.52 0.00 0.06 1.184 2.52 0.00 0.06 1.245 2.52 0.00 0.06 1.306 2.52 0.00 0.06 1.367 2.52 7.92 -0.13 1.238 2.52 7.92 -0.13 1.109 2.52 7.92 -0.13 0.97
10 2.52 7.92 -0.13 0.8411 2.52 7.92 -0.13 0.7112 2.52 7.92 -0.13 0.5813 2.52 7.92 -0.13 0.4614 2.52 5.04 -0.06 0.3915 2.52 0.00 0.06 0.4616 2.52 0.00 0.06 0.52 tank is too big17 2.52 0.00 0.06 0.5818 2.52 0.00 0.06 0.6419 2.52 0.00 0.06 0.7020 2.52 0.00 0.06 0.7621 2.52 0.00 0.06 0.8222 2.52 0.00 0.06 0.8823 2.52 0.00 0.06 0.9424 2.52 0.00 0.06 1.00
1 2.52 0.00 0.06 1.06
0.00
0.50
1.00
1.50
2.00
2.50
0 6 12 18 24 6 12 18 24 6 12 18 24 6 12 18
hours
tank water leveloverflow
In the upper graph we assumed a yield of 0,7 l/sec. The tank can be operated in between 0,4 and 1,36 m water depth. The tank is closed at 1:30 pm and opened in the morning at 7 am. So the opening hours are from 7 am to 1:30 pm (7,5 hours), in those hours, each day 60,5 m3 is supplied to the village. In case the Dindira yield is high, 1,3 l/sec, the tank can be operated as shown below
1.3 Balnce TOTAL IN 449.28 m3 daily supplym3/hr m3/hr TOTAL OU 443.52 m3 110.88 m3
4.68 7.92 1 start unbalance 1.28%hours inflow (m3) outflow (m3) raise tank water level
0 4.68 0.00 0.11 1.001 4.68 0.00 0.11 1.112 4.68 0.00 0.11 1.223 4.68 0.00 0.11 1.344 4.68 0.00 0.11 1.455 4.68 0.00 0.11 1.566 4.68 0.00 0.11 1.677 4.68 7.92 -0.08 1.608 4.68 7.92 -0.08 1.529 4.68 7.92 -0.08 1.44
10 4.68 7.92 -0.08 1.3611 4.68 7.92 -0.08 1.2912 4.68 7.92 -0.08 1.2113 4.68 7.92 -0.08 1.1314 4.68 7.92 -0.08 1.0515 4.68 7.92 -0.08 0.9716 4.68 7.92 -0.08 0.90 tank is too big17 4.68 7.92 -0.08 0.8218 4.68 7.92 -0.08 0.7419 4.68 7.92 -0.08 0.6620 4.68 7.92 -0.08 0.5821 4.68 0.00 0.11 0.7022 4.68 0.00 0.11 0.8123 4.68 0.00 0.11 0.9224 4.68 0.00 0.11 1.03
1 4.68 0.00 0.11 1.15
0.00
0.50
1.00
1.50
2.00
2.50
0 6 12 18 24 6 12 18 24 6 12 18 24 6 12 18
hours
tank water leveloverflow
Now, the tank can operated in between 60 and 170 cm. The tank can be opened 14 hours (from 7 am to 8 pm. From this, the following rules can be set: The tank needs to be opened every day, to prevent overflows. The opening of the tank must be at least 7 hours every day In periods of high yield (rain season) the tanks can (and needs) to be opened longer, even to a
maximum of 14 hours. If the opening time is too long (e.g. tanks down in the village start overflowing) the yield needs to
be reduced, meaning that intakes (preferably the most yielding intakes 1 and nr.2) need to be (fully or partly) closed.
The operator should realise that the tank will certainly overflow when the tank is closed and he doesn’t get there within one day to open the tank.

Mission Report Spring water Chamavita 2014-I
Page 16 of 21
Actually it is quite simple: the operator needs to operate acc to a regular scheme: to close the tank in the afternoon and note the water level (Lclose) and the time of closure to open the tank at a fixed time and check the water level in the tank and assure that there was
no overflow to come back in the afternoon and wait till the level in the tank has dropped to the same level
(Lclose) of the previous day and then close the tank if the time of opening is too long, he should (partly) close intake nr.1 or nr.2, thus reducing the
yield. Such operation would require the following technical facilities: a bucket under the overflow pipe outlet, to check whether there was any overflow during the
night a facility on the outside wall of the tank (e.g. a transparent hose pipe) where the tank water level
can be observed Intake nr.1 and 2 both need a gate valve (in collection chamber nr 2) to be able to partly close
the intakes.

Mission Report Spring water Chamavita 2014-I
Page 17 of 21
Appendix 3
Some concrete Points of Attention for Operation & Maintenance The village can improve on the operation and maintenance of the Dindira scheme Proper operation of the Main Tank at Dindira, (and other village tanks as well), so that the tank is
never overflowing during the night. Overflow water is money! To do this both intake nr 1 and intake nr 2 (as well as intake nr.1) should be equipped with a gate valve and the tank should have a facility to know the filling level on the outside of the tank. Some basic rules are given in Appendix 2.
Maintenance pilot 1 Diversion channel: remove sands up to the top of the concrete walls inside the channel Clearing vegetation in the reservoir and diversion channel Inspection of the Dam (holes by animals) every week Take out the silts from the reservoir (once every three year) Scraping off the silts from the infiltration pit. Maintenance Pilot 2 Inspection of the dam (on holes etc. any digging by animals) Optimal Operation of the sand filter, so that the filter is not overflowing and the level of the
reservoir is lowered to the top of the inlet pipe, hanging in the reservoir. The lid of the sandfilter opening must be locked. The sand filter must always have some water on top (slow sand filtration is a bacteriological
process) Over time there will be some silts on top of the sandfilter, causing less water going through, in
that case the silt layer (only a very thin layer of say 3 cm) need to be scraped off from the top, without disturbing the underlying sands. Please disinfect hands an arms afterwards.
General maintenance issues Intake chambers need to be inspected every 2 weeks: check if the water depth is higher than
normal. This indicates that (unless the intake is closed on purpose)) the outlet pipe to the collection chamber is blocked. The surrounding of the intake chamber (the lid and the surrounding area) need regular cleaning.
Intakes need to be washed out, cleaned and disinfected every year. Tanks need to be inspected on leakages Tanks need to be washed out, cleaned and disinfected every two year. Each storage tank should have a facility at the end of the overflow pipe (kama Ndoo) that can
show each morning if there has been overflow during the night. This overflow indicator must be checked regularly.
For proper operation each tank should have a facility to observe the water level on the outside. The area around the intakes and reservoir/dams/ sandfilter must be protected by e.g. thorny
bushes, so that people cannot go there for any issues like washing, taking water, playing children and no farming activity.

Mission Report Spring water Chamavita 2014-I
Page 18 of 21
Appendix 4
Description of Diver performance test (November2) The divers were restarted at 0 am in the morning From 0 to 8 am they were outside in the shade of the balcony, they should read the same barometric pressure. At 8 am: They are connected together and were put in a bucket that was filled with warm water. Water depth in the bucket = length of the diver (9,5 CM).
The divers were removed from the bucket at 7 pm and read out the next morning at 6 am.

Mission Report Spring water Chamavita 2014-I
Page 19 of 21
Results Barometric pressure readings
divertest performance 2014 Lushoto PRESSURE
840
860
880
900
920
940
960
21:36 00:00 02:24 04:48 07:12 09:36 12:00 14:24 16:48 19:12 21:36 00:00 02:24 04:48 07:12 09:36
time
diver2
diver3
diver4
diver9
diver12
diver15
diver16
Diver 16 is a special (small) barometric diver (higher accuracy). Absolute pressure is in range of 964 – 907 Assuming the baro diver (diver 16) is correct The following divers have a difference in reading the absolute barometric pressure: Diver3 +24 Diver4 -18 Diver2 +12 Divers 9, 12 and 15 are close to the reference diver 16. The absolute reading of the temperature
divertest 2014 Lushoto TEMPERATURE
151617181920212223242526272829303132333435
19:12 00:00 04:48 09:36 14:24 19:12 00:00 04:48 09:36
time
temp D2
temp D3
temp d4
temp d9
temp d12
temp d15
temp d16
The temperature readings are accurate for all the divers. The differences are within 1 grC. The first part shows the readings during the night, laying in the open air. The temperature dip (4:48) is from an early rain shower. In the second part, the divers

Mission Report Spring water Chamavita 2014-I
Page 20 of 21
were in the small bucket, filled with (34 grC) warm water, slowly cooling down during the day. At 19:30 the divers were taken out and laid back in open air during the next night (temp = 18 grC). Reading the water height in the bucket The readings are shifted so that they are all the same as Diver 16 at the start (00:00), thus correcting for the differences in absolute barometric pressure.
divertest pressure shifted
865
870
875
880
885
890
895
900
905
910
915
920
925
19:12 00:00 04:48 09:36 14:24 19:12 00:00 04:48 09:36
cm
diver3
diver4
diver9
diver12
diver15
diver16
diver2
end drop
Clearly the temperature correction is not working properly. The lift of the middle part should be in the order of 9,5 cm (the water level in the bucket). Diver4 and Diver3 give wrong readings on the warm water period. Diver nr2 is not good as well After the water cooled down, the results are better. The end drops (taking the divers out of the water) are: Diver nr. End drop
2 8.8 cm 3 10.7 cm 4 9.3 cm 9 9.5 cm
12 9.9 cm 15 10.1 cm
16 9.7 cm In conclusion, the divers are all able to read changes in water level within 1 cm accuracy, as long as there is not too much difference in the water temperature Therefore: Diver 4 is used under permanent water (constant temperature) in intake piezometer 2A Diver 3 used in the pilot 2 reservoir (under permanent water as well) Diver 2 is put in the Main Dindira reservoir tank (= less important for the project)