artificial disc replacement – re-review 19, 2016 artificial disc replacement – re-review: final...
TRANSCRIPT

Artificial disc replacement – Re-review Final evidence report
December 19, 2016
Health Technology Assessment Program (HTA)
Washington State Health Care Authority PO Box 42712
Olympia, WA 98504-2712 (360) 725-5126
www.hca.wa.gov/about-hca/health-technology-assessment [email protected]

Artificial Disc Replacement – Re-review
Provided by:
Spectrum Research, Inc.
Prepared by:
Robin Hashimoto, PhD Andrea C. Skelly, PhD, MPH
Erika Brodt, BS Mark Junge, BS
December 19, 2016
With assistance from: Krystle Pagarigan, BS
Cassie Winter, BS This technology assessment report is based on research conducted by a contracted technology assessment center, with updates as contracted by the Washington State Health Care Authority. This report is an independent assessment of the technology question(s) described based on accepted methodological principles. The findings and conclusions contained herein are those of the investigators and authors who are responsible for the content. These findings and conclusions may not necessarily represent the views of the HCA/Agency and thus, no statement in this report shall be construed as an official position or policy of the HCA/Agency.

The information in this assessment is intended to assist health care decision makers, clinicians, patients and policy makers in making sound evidence-based decisions that may improve the quality and cost-effectiveness of health care services. Information in this report is not a substitute for sound clinical judgment. Those making decisions regarding the provision of health care services should consider this report in a manner similar to any other medical reference, integrating the information with all other pertinent information to make decisions within the context of individual patient circumstances and resource availability.

WA – Health Technology Assessment December 19, 2016
Artificial disc replacement – Re-review: Final evidence report i
TABLE OF CONTENTS
ABBREVIATIONS ............................................................................................................................. VIII
EXECUTIVE SUMMARY .......................................................................................................................1
1. APPRAISAL ................................................................................................................................... 51
1.1 BACKGROUND AND RATIONALE ............................................................................................................. 51 1.2 KEY QUESTIONS ................................................................................................................................. 52 1.3 OUTCOMES ASSESSED ......................................................................................................................... 54 1.4 WASHINGTON STATE UTILIZATION AND COST DATA ................................................................................. 58
2. BACKGROUND .............................................................................................................................. 61
2.1 EPIDEMIOLOGY AND BURDEN OF DISEASE ............................................................................................... 61 2.2 TECHNOLOGY: ARTIFICIAL DISC REPLACEMENT (ADR) .............................................................................. 62
2.2.1 Lumbar ADR (L-ADR) ....................................................................................................................... 63 2.2.1.1 FDA-Approved Devices .................................................................................................................... 63 2.2.1.2 Indications ....................................................................................................................................... 64 2.2.1.3 Contraindications ............................................................................................................................ 64 2.2.1.4 Ongoing Clinical Trials ..................................................................................................................... 64 2.2.2 Cervical ADR (C-ADR) ...................................................................................................................... 65 2.2.2.1 FDA-Approved Devices .................................................................................................................... 65 2.2.2.2 Indications ....................................................................................................................................... 65 2.2.2.3 Contraindications ............................................................................................................................ 65 2.2.2.4 Ongoing Clinical Trials ..................................................................................................................... 66
2.3 COMPARATOR TREATMENTS ................................................................................................................ 66 2.3.1 Non-operative treatment ................................................................................................................ 66 2.3.2 Spinal Fusion ................................................................................................................................... 66
2.4 CLINICAL GUIDELINES .......................................................................................................................... 68 2.5 PREVIOUS SYSTEMATIC REVIEWS/TECHNOLOGY ASSESSMENTS .................................................................. 73 2.6 MEDICARE AND REPRESENTATIVE PRIVATE INSURER COVERAGE POLICIES .................................................... 99
3. THE EVIDENCE ............................................................................................................................ 107
3.1 METHODS OF THE SYSTEMATIC LITERATURE REVIEW .............................................................................. 107 3.1.1 Objectives ...................................................................................................................................... 107 3.1.2 Key Questions (from previous report) ........................................................................................... 107 3.1.3 Inclusion/exclusion criteria ............................................................................................................ 107 3.1.4 Data sources and search strategy ................................................................................................. 110 3.1.5 Data extraction ............................................................................................................................. 112 3.1.6 Quality assessment: Overall Strength of evidence (SoE), Risk of Bias, and QHES evaluation ...... 112 3.1.7 Analysis ......................................................................................................................................... 113
4. RESULTS .................................................................................................................................... 116
4.1 KEY QUESTION 1: EFFICACY AND EFFECTIVENESS .................................................................................... 116 4.1.1 Number of studies retained ........................................................................................................... 116 4.1.2 Lumbar Spine................................................................................................................................. 118 4.1.2.1 L-ADR vs. Fusion: 1-level................................................................................................................ 118 4.1.2.2 L-ADR vs. Fusion: 2-level................................................................................................................ 127
WA – Health Technology Assessment December 19, 2016
Artificial disc replacement – Re-review: Final evidence report ii
4.1.2.3 L-ADR vs. Fusion: 1- or 2-level ....................................................................................................... 133 4.1.2.4 L-ADR vs. Multidisciplinary Rehabilitation .................................................................................... 141 4.1.3 Cervical Spine ................................................................................................................................ 147 4.1.3.1 C-ADR vs. Fusion: 1-level ............................................................................................................... 147 4.1.3.2 C-ADR vs. Fusion: 2-level ............................................................................................................... 162 4.1.3.3 C-ADR vs. Fusion: Mixed levels (1-, 2-, or 3-level).......................................................................... 171 4.1.3.4 C-ADR vs. ACDF with a zero-profile device: 2 non-contiguous levels ............................................ 178
4.2 KEY QUESTION 2: HARMS AND COMPLICATIONS .................................................................................... 180 4.2.1 Number of studies retained ........................................................................................................... 180 4.2.2 Lumbar Spine................................................................................................................................. 180 4.2.2.1 L-ADR vs. Fusion: 1-level................................................................................................................ 180 4.2.2.2 L-ADR vs. Fusion: 2-level................................................................................................................ 185 4.2.2.3 L-ADR vs. Fusion: 1- or 2-level (or levels not specified) ................................................................. 186 4.2.2.4 L-ADR vs. Multidisciplinary Rehabilitation .................................................................................... 190 4.2.3 Cervical Spine ................................................................................................................................ 192 4.2.3.1 C-ADR vs. Fusion: 1-level ............................................................................................................... 192 4.2.3.2 C-ADR vs. Fusion: 2-level ............................................................................................................... 194 4.2.3.3 C-ADR vs. Fusion: Mixed levels (1-, 2-, or 3-level).......................................................................... 196 4.2.3.4 C-ADR vs. ACDF with a zero-profile device: 2 non-contiguous levels ............................................ 198
4.3 KEY QUESTION 3: DIFFERENTIAL EFFICACY AND HARMS IN SUBPOPULATIONS ............................................. 199 4.3.1 Number of studies retained ........................................................................................................... 199 4.3.2 C-ADR vs. Fusion ............................................................................................................................ 199
4.4 KEY QUESTION 4: COST EFFECTIVENESS ................................................................................................ 200 4.4.1 Number of studies retained ........................................................................................................... 200 4.4.2 Lumbar Spine................................................................................................................................. 200 4.4.2.1 L-ADR vs. Fusion: 1- or 2-level or levels not specified .................................................................... 200 4.4.2.2 L-ADR vs. Fusion and Multidisciplinary Rehabilitation: 1 or 2-level .............................................. 202 4.4.3 Cervical Spine ................................................................................................................................ 207 4.4.3.1 C-ADR vs. Fusion: 1-level ............................................................................................................... 207 4.4.3.2 C-ADR vs. Fusion: 2-level ............................................................................................................... 214
5 STRENGTH OF EVIDENCE (SOE) SUMMARY TABLES ...................................................................... 218
5.1 STRENGTH OF EVIDENCE SUMMARY: L-ADR VS. FUSION (1-LEVEL) EFFICACY RESULTS ................................ 218 5.2 STRENGTH OF EVIDENCE SUMMARY: L-ADR VS. FUSION (2-LEVEL) EFFICACY RESULTS ................................ 221 5.3 STRENGTH OF EVIDENCE SUMMARY: L-ADR VS. FUSION (1 OR 2-LEVEL) EFFICACY RESULTS ......................... 223 5.4 STRENGTH OF EVIDENCE SUMMARY: L-ADR VS. MULTIDISCIPLINARY REHABILITATION EFFICACY RESULTS ...... 225 5.5 STRENGTH OF EVIDENCE SUMMARY: L-ADR VS. FUSION (1-LEVEL) SAFETY RESULTS ................................... 226 5.6 STRENGTH OF EVIDENCE SUMMARY: L-ADR VS. FUSION (2-LEVEL) SAFETY RESULTS ................................... 229 5.7 STRENGTH OF EVIDENCE SUMMARY: L-ADR VS. FUSION (1 OR 2-LEVEL) SAFETY RESULTS ............................ 231 5.8 STRENGTH OF EVIDENCE SUMMARY: L-ADR VS. MULTIDISCIPLINARY REHABILITATION SAFETY RESULTS ......... 233 5.9 STRENGTH OF EVIDENCE SUMMARY: DIFFERENTIAL EFFICACY AND SAFETY RESULTS – L-ADR ....................... 235 5.10 STRENGTH OF EVIDENCE SUMMARY: COST-EFFECTIVENESS RESULTS – L-ADR ............................................ 236 5.11 STRENGTH OF EVIDENCE SUMMARY: C-ADR VS. ACDF (1-LEVEL) EFFICACY RESULTS .................................. 238 5.12 STRENGTH OF EVIDENCE SUMMARY: C-ADR VS. ACDF (2-LEVEL) EFFICACY RESULTS .................................. 244 5.13 STRENGTH OF EVIDENCE SUMMARY: C-ADR VS. ACDF (MIXED LEVELS (1-, 2-, OR 3-LEVEL)) EFFICACY
RESULTS .......................................................................................................................................... 248

WA – Health Technology Assessment December 19, 2016
Artificial disc replacement – Re-review: Final evidence report iii
5.14 STRENGTH OF EVIDENCE SUMMARY: C-ADR VS. ACDF WITH A ZERO-PROFILE DEVICE (2 NON-CONTIGUOUS LEVELS) EFFICACY RESULTS ................................................................................................................. 250
5.15 STRENGTH OF EVIDENCE SUMMARY: C-ADR VS. ACDF (1-LEVEL) SAFETY RESULTS..................................... 251 5.16 STRENGTH OF EVIDENCE SUMMARY: C-ADR VS. ACDF (2-LEVEL) SAFETY RESULTS..................................... 254 5.17 STRENGTH OF EVIDENCE SUMMARY: C-ADR VS. ACDF (MIXED LEVEL (1-, 2-, OR 3-LEVEL) SAFETY RESULTS .. 256 5.18 STRENGTH OF EVIDENCE SUMMARY: C-ADR VS. ACDF WITH A ZERO-PROFILE DEVICE (2 NON-CONTIGUOUS
LEVELS) SAFETY RESULTS .................................................................................................................... 258 5.19 STRENGTH OF EVIDENCE SUMMARY: DIFFERENTIAL EFFICACY AND SAFETY RESULTS – C-ADR ....................... 258 5.20 STRENGTH OF EVIDENCE SUMMARY: COST-EFFECTIVENESS RESULTS – C-ADR ........................................... 259
FIGURES ......................................................................................................................................... 260
REFERENCES .................................................................................................................................. 307

WA – Health Technology Assessment December 19, 2016
Artificial disc replacement – Re-review: Final evidence report iv
TABLES
Table 1. Outcome Measures ....................................................................................................................... 54 Table 2. Summary of Clinical Guidelines ..................................................................................................... 70 Table 3. Previous Health Technology Assessments .................................................................................... 74 Table 4. Selected Previous Systematic Reviews .......................................................................................... 83 Table 5. Overview of payer technology assessments and policies ........................................................... 100 Table 6. Summary of inclusion and exclusion criteria .............................................................................. 109 Table 7. Comparative studies retained to answer key questions for L-ADR............................................. 116 Table 8. Comparative studies retained to answer key questions for C-ADR ............................................ 117 Table 9. RCT Study Characteristics: 1-Level L-ADR vs. Fusion ................................................................... 120 Table 10. RCT Patient Demographics: 1-Level L-ADR vs. Fusion ............................................................... 120 Table 11. L-ADR vs. Fusion (1 level): SF-36 Success ................................................................................. 124 Table 12. L-ADR vs. Fusion (1 level): SF-36 PCS scores ............................................................................ 125 Table 13. L-ADR vs. Fusion (1 level): Patient Satisfaction ........................................................................ 126 Table 14. L-ADR vs. Fusion (1 level): Work Status and Recreational Activity ......................................... 127 Table 15. RCT Study Characteristics: 2-Level L-ADR vs. Fusion ................................................................. 128 Table 16. RCT Patient Demographics: 2-Level L-ADR vs. Fusion ............................................................... 128 Table 17. L-ADR vs. Fusion (2-levels): Overall Success .............................................................................. 129 Table 18. L-ADR vs. Fusion (2-levels): ODI scores ..................................................................................... 130 Table 19. L-ADR vs. Fusion (2-levels): Neurological Success ..................................................................... 131 Table 20. L-ADR vs. Fusion (2-levels): VAS pain scores ............................................................................ 131 Table 21. L-ADR vs. Fusion (2-levels): SF-36 PCS scores ........................................................................... 132 Table 22. L-ADR vs. Fusion (2-levels): Patient satisfaction ...................................................................... 132 Table 23. L-ADR vs. Fusion (2-levels): Work status, recreational activities and narcotic use ................... 133 Table 24. RCT Study Characteristics: 1- or 2-Level L-ADR vs Fusion ......................................................... 134 Table 25. RCT Patient Demographics: 1-or 2 Level L-ADR vs. Fusion ....................................................... 135 Table 26. L-ADR vs. Fusion (1- or 2-levels): Overall Success ..................................................................... 136 Table 27. L-ADR vs. Fusion (1- or 2-levels): ODI Success ........................................................................... 137 Table 28. L-ADR vs. Fusion (1- or 2- levels): Pain scores .......................................................................... 138 Table 29. L-ADR vs. Fusion (1- or 2- levels): EQ-5D scores ....................................................................... 138 Table 30. L-ADR vs. Fusion (1- or 2- levels): Patient satisfaction ............................................................. 139 Table 31. L-ADR vs. Fusion (1- or 2- levels): Work status ......................................................................... 139 Table 32. Non-randomized Study Characteristics ..................................................................................... 140 Table 33. RCT Study Characteristics: L-ADR (1- or 2-levels) vs Multidisciplinary Rehabilitation .............. 142 Table 34. RCT Patient Demographics: L-ADR (1- or 2-levels) vs Multidisciplinary Rehabilitation ............ 143 Table 35. L-ADR vs. Multidisciplinary rehabilitation: ODI Success ............................................................ 143 Table 36. L-ADR vs. Multidisciplinary rehabilitation: VAS pain scores ..................................................... 145 Table 37. L-ADR vs. Multidisciplinary rehabilitation: Quality of Life measures ....................................... 145 Table 38. L-ADR vs. Multidisciplinary rehabilitation: Patient satisfaction, work status, and medication use ............................................................................................................................................................. 146 Table 39. RCT Study Characteristics .......................................................................................................... 149 Table 40. RCT Patient Demographics ........................................................................................................ 150 Table 41. C-ADR vs. ACDF (1-level): Arm pain success .............................................................................. 156 Table 42. Non-randomized Study Characteristics ..................................................................................... 161 Table 43. RCT Study Characteristics .......................................................................................................... 164 Table 44. RCT Patient Demographics ........................................................................................................ 164 Table 45. C-ADR vs. ACDF (2-level): Overall Success ................................................................................. 165

WA – Health Technology Assessment December 19, 2016
Artificial disc replacement – Re-review: Final evidence report v
Table 46. C-ADR vs. ACDF (2-level): NDI success ...................................................................................... 166 Table 47. C-ADR vs. ACDF (2-level): NDI scores ........................................................................................ 166 Table 48. C-ADR vs. ACDF (2-level): Neurological success ........................................................................ 167 Table 49. C-ADR vs. ACDF (2-level): Arm pain VAS scores ........................................................................ 168 Table 50. C-ADR vs. ACDF (2-level): SF-36 PCS scores .............................................................................. 169 Table 51. Non-randomized Study Characteristics ..................................................................................... 170 Table 52. RCT Study Characteristics .......................................................................................................... 172 Table 53. RCT Patient Demographics ........................................................................................................ 172 Table 54. C-ADR vs. ACDF (Mixed levels): NDI scores ............................................................................... 173 Table 55. C-ADR vs. ACDF (Mixed levels): Arm and neck pain VAS scores ............................................... 174 Table 56. C-ADR vs. ACDF (Mixed levels): Quality of Life Scores .............................................................. 174 Table 57. Non-randomized Study Characteristics ..................................................................................... 176 Table 58. RCT Study Characteristics .......................................................................................................... 179 Table 59. RCT Patient Demographics ........................................................................................................ 179 Table 60. C-ADR vs. ACDF + zero-profile device (2 non-contiguous levels): NDI and JOA scores ............. 180 Table 61. L-ADR vs. Fusion (1 level) RCTs: Major adverse events and any adverse events ...................... 181 Table 62. L-ADR vs. Fusion (1 level) RCTs: Death ...................................................................................... 182 Table 63. L-ADR vs. Fusion (1 level) RCTs: Any device-related adverse event.......................................... 183 Table 64. L-ADR vs. Fusion (2 levels) RCTs: Subsequent surgery at the index level, major adverse events and device-related adverse events ........................................................................................................... 186 Table 65. L-ADR vs. Fusion (1- or 2-levels) RCTs: Subsequent surgery at the index and adjacent level ... 187 Table 66. L-ADR vs. Fusion (1- or 2-levels) RCTs: Any, major and minor complications ........................... 188 Table 67. L-ADR vs. Multidisciplinary Rehabilitation (1 to 2 levels) RCTs: Subsequent surgery at the index level, major and any adverse event .......................................................................................................... 191 Table 68. C-ADR vs. ACDF (2-level): Summary of Adverse Events from RCTs ........................................... 195 Table 69. C-ADR vs. ACDF (Mixed levels (1-, 2-, or 3-level): Adverse Events ............................................ 197 Table 70. Summary of Economic Evaluation Study Characteristics and Results: L-ADR vs. Fusion or Multidisciplinary Rehabilitation ................................................................................................................ 204 Table 71. Summary of Economic Evaluation Study Characteristics and Results: C-ADR vs. ACDF (1-level) .................................................................................................................................................................. 210 Table 72. Summary of Economic Evaluation Study Characteristics and Results: C-ADR vs. ACDF (2-level) .................................................................................................................................................................. 216

WA – Health Technology Assessment December 19, 2016
Artificial disc replacement – Re-review: Final evidence report vi
FIGURES
Figure 1. Analytic framework ...................................................................................................................... 53 Figure 2. Flow chart of literature search results ....................................................................................... 111 Figure 3. L-ADR vs. Fusion (1 level): Overall Clinical Success*, ITT Analysis ............................................. 260 Figure 4. L-ADR vs. Fusion (1 level): Overall Clinical Success*, Completer Analysis ................................. 261 Figure 5. L-ADR vs. fusion (1-level): Overall Success, Sensitivity Analysis* .............................................. 262 Figure 6. L-ADR vs. Fusion (1 level): ODI success (≥ 15 point improvement), ITT Analysis ....................... 263 Figure 7. L-ADR vs. Fusion (1 level): ODI success (≥ 15 point improvement), Completer Analysis .......... 264 Figure 8. L-ADR vs. Fusion (1 level): Neurological Success, ITT Analysis ................................................... 264 Figure 9. L-ADR vs. Fusion (1 level): Neurological Success, Completer Analysis ...................................... 265 Figure 10. L-ADR vs. Fusion (1 level): VAS Pain (0-100 [worst]), Completer Analysis .............................. 265 Figure 11. L-ADR vs. Fusion (1 level): Patient Satisfaction at 24 and 60 months* ................................... 266 Figure 12. L-ADR vs. Fusion (1 level): Work Status (working full- or part-time), Completer Analysis ...... 266 Figure 13. L-ADR vs. Fusion (1 level): Narcotic Use, ITT Analysis .............................................................. 267 Figure 14. L-ADR vs. fusion (2-level): Overall Success, Sensitivity Analysis at 24 months* ...................... 267 Figure 15. L-ADR vs. Multidisciplinary Rehabilitation: Overall Success, Sensitivity Analysis at 24 months* .................................................................................................................................................................. 268 Figure 16. C-ADR vs. ACDF (1-level): Overall Success, ITT Analysis ........................................................... 269 Figure 17. C-ADR vs. ACDF (1-level): Overall Success, Completer Analysis .............................................. 271 Figure 18. C-ADR vs. ACDF (1-level): Overall Success, Sensitivity Analysis ............................................... 273 Figure 19. C-ADR vs. ACDF (1-level): NDI Success (≥15-point improvement), ITT Analysis ...................... 274 Figure 20. C-ADR vs. ACDF (1-level): NDI Success (≥15-point improvement), Completer Analysis .......... 275 Figure 21. C-ADR vs. ACDF (1-level): NDI Scores, Completer Analysis ...................................................... 276 Figure 22. C-ADR vs. ACDF (1-level): Neurological Success, ITT Analysis .................................................. 278 Figure 23. C-ADR vs. ACDF (1-level): Neurological Success, Completer Analysis ..................................... 280 Figure 24. C-ADR vs. ACDF (1-level): Arm Pain VAS/NRS Scores, Completer Analysis .............................. 282 Figure 25. C-ADR vs. ACDF (1-level): Neck Pain Success (≥20-point improvement), ITT Analysis ............ 284 Figure 26. C-ADR vs. ACDF (1-level): Neck Pain Success (≥20-point improvement), Completer Analysis 284 Figure 27. C-ADR vs. ACDF (1-level): Neck Pain VAS/NRS Scores, Completer Analysis ............................ 285 Figure 28. C-ADR vs. ACDF (1-level): SF-36 PCS Success (≥15% improvement), Completer Analysis ....... 287 Figure 29. C-ADR vs. ACDF (1-level): SF-36 MCS Success (≥15% improvement), Completer Analysis ...... 288 Figure 30. C-ADR vs. ACDF (1-level): SF-36 PCS Scores, Completer Analysis ............................................ 289 Figure 31. C-ADR vs. ACDF (1-level): Patient Satisfaction, Completer Analysis ........................................ 291 Figure 32. C-ADR vs. ACDF (1-level): Patient Satisfaction VAS Scores (0-100, higher scores are better), Completer Analysis ................................................................................................................................... 292 Figure 33. C-ADR vs. ACDF (1-level): Odom’s Criteria “Excellent” or “Good”, Completer Analysis .......... 293 Figure 34. C-ADR vs. ACDF (1-level): Return to Work, Completer Analysis .............................................. 294 Figure 35. C-ADR vs. ACDF (1-level): Time to Return to Work, Completer Analysis ................................. 295 Figure 36. C-ADR vs. ACDF (2-level): Overall Success, Sensitivity Analysis ............................................... 295 Figure 37. Lumbar ADR vs. Fusion at 1 Level: Any Subsequent Surgery at the Index Level* ................. 296 Figure 38. Lumbar ADR vs. Fusion at 1 level: Device Related Adverse Events (excluding secondary surgery at index level)* ............................................................................................................................. 296 Figure 39. Lumbar ADR vs. Fusion at 1 Level: All Adverse Events/Complications Regardless of Relationship to Treatment ........................................................................................................................ 297 Figure 40. C-ADR vs. ACDF (1-level): Secondary Surgery at the Index Level............................................. 298 Figure 41. C-ADR vs. ACDF (1-level): Serious/Major Adverse Events (as classified by the trial†) ............ 300 Figure 42. C-ADR vs. ACDF (1-level): Device-Related Adverse Events (as classified by the trial†) ........... 302

WA – Health Technology Assessment December 19, 2016
Artificial disc replacement – Re-review: Final evidence report vii
Figure 43. C-ADR vs. ACDF (1-level): Secondary Surgery at the Adjacent Level ....................................... 304 Figure 44. C-ADR vs. ACDF (1-level): Any Adverse Event (as reported by the trial†) ............................... 306
WA – Health Technology Assessment December 19, 2016
Artificial disc replacement – Re-review: Final evidence report viii
Abbreviations
ACDF Anterior cervical discectomy and fusion ADR Artificial disc replacement C-ADR Cervical artificial disc replacement CI Confidence interval CUA Cost utility analysis DDD Degenerative disc disease FDA United States Food and Drug Administration EQ5D EuroQol 5 dimensions ICER Incremental cost effectiveness ratio IDE Investigational device exemption L-ADR Lumbar artificial disc replacement LBP Low back pain MCS Mental Component Score of the SF-36 MD Mean difference NA Not applicable NDI Neck Disability Index NR Not reported ODI Oswestry Disability Index PCS Physical Component Score of the SF-36 QALY Quality-adjusted life year RCT Randomized controlled trial RD Risk difference RR Risk ratio SF-36 Short-Form 36 questionnaire VAS Visual Analogue Scale

WA – Health Technology Assessment December 19, 2016
Artificial disc replacement – Re-review: Final evidence report ES - 1
Executive Summary
Introduction Low back pain and chronic neck pain are common. The prevalence of low back pain ranges from 60% to 70% in industrialized countries.41 Axial back pain, which does not radiate to the legs, buttocks or feet, is most common. An estimated 25%-58% of low back pain cases resolve spontaneously with conservative care,32 however, persistent low back pain that is refractory to conservative treatment may occur in as many as one quarter of persons six months following an initial episode.39 Back pain attributed to degenerative disc disease (DDD) is a major health problem throughout the world. Over 90% of spinal procedures are performed because of disc degeneration and a reported 15% to 20% of patients do not recover from back pain after lumbar surgery.3,18 Low back pain is the leading cause of pain and disability in adults in the United States.11 Approximately 2.4 million Americans are disabled by low back pain at any given time, and half of those are chronically disabled.61 An analysis of 27 studies published between 1997 and 2007, conducted both in the United States and internationally, estimated that the economic burden of lower back pain treatment costs were $100-200 billion each year reporting that low back pain was the second most common cause of a visit to the doctor.19 Low back pain due to DDD peaks at 40 years of age and affects both men and women equally.61 Neck pain is also prevalent, with approximately 15%-20% of adults reporting at least one episode during a given year15; DDD is a frequent cause. DDD progression is a common cause of chronic neck pain. In one study of surgical patients with DDD, 61% presented with radiculopathy, 16% with myelopathy, and the other 23% had a combination of the two.71 Spondylosis is an umbrella term used to describe pain associated with degenerative conditions of the spine and includes degenerative disc disease (DDD). This degenerative process may cause radiculopathy (peripheral nerve root impingement) or less commonly, myelopathy (compression of the spinal cord). Lumbosacral radiculopathy, more common than its cervical counterpart, affects 3% to 5% of the population.85 Myelopathy is estimated to affect 605 per million individuals in North America.11 The major risk factor for spondylosis is aging; an estimated 60% of individuals older than 40 years of age have radiographic evidence of cervical DDD secondary to spondylosis.8,52 The presence of degenerative changes on radiographic or MRI images alone does not correlated well with the presence or severity of pain, however. A 2010 survey of 200 asymptomatic individuals between 60 and 65 years of age found that 95% of men and 70% of women showed degenerative changes in the cervical region. Notably, cervical spine surgery has increased significantly since 2002, with an estimated 307,188 cervical spine procedures performed between 2002 and 2011.49 The increase of cervical spine surgery is not well understood but may be a result of the higher frequency of neck pain in office and computer workers, healthcare workers, and transit operators. Because aging is the primary risk factor, as the U.S. population ages, the incidence of DDD is expected to increase. The number of patient visits due to back pain increased from 3350 between 1999 and 2000 to 4078 between 2009 and 2010 in one study.48 Intervertebral discs are soft, spongy pads of tissue that separate and provide stability to the individual vertebrae of the spine, and function by absorbing shock and facilitating motion of the spine. They are composed of water, collagen, and proteoglycans. Intervertebral discs consist of an annulus fibrosus, located in the outer region of the disc that surrounds the nucleus pulposus. The annulus fibrosus consists primarily of collagen and functions to resist tensile loads; the nucleus pulposus has a higher water and proteoglycan content that makes it jelly-like in substance, and functions to prevent compression of the spine.53,74 With age, discs lose moisture content and elasticity, leading to a loss of

WA – Health Technology Assessment December 19, 2016
Artificial disc replacement – Re-review: Final evidence report ES - 2
disc height. These changes put increased stress on the articular cartilage of the vertebrae and their endplates, and osteophytic spurs may form at the endplates.9,27,53,74,96 In addition, annular degeneration may lead to disc herniation or protrusion.74 Disc degeneration and its sequelae may cause low back pain or neck pain, and possible leg or arm pain if radiculopathy is present; less commonly, disturbances in gait and balance may occur if there the spinal cord is compressed (myelopathy).
In persons with persistent low back or neck pain, surgery may be considered when nonoperative treatments fail to relieve symptoms attributed to spinal DDD or to prevent progression of nerve damage in the case of radiculopathy or myelopathy. A surgical alternative to fusion is artificial disc replacement (ADR) also referred to as spinal or disc arthroplasty. Lumbar ADR (L-ADR) is currently indicated in patients with single-level DDD who have failed at least six months of nonoperative care, while cervical ADR (C-ADR) is indicated in patients with radiculopathy or myelopathy secondary to one- or two-level DDD that has not responded to six weeks of nonsurgical treatment. This update to the 2008 Health Technology Assessment titled: Artificial Disc Replacement synthesizes evidence on both lumbar disc arthroplasty and cervical disc arthroplasty. For all sections, information relating to the lumbar spine is presented first.
Policy Context This technology was originally reviewed September 2008 and was selected for re-review based on new literature identified which may invalidate aspects of the previous report. Objectives The primary aim of this assessment is to update the 2008 report based on systematic review and synthesis of subsequently published evidence on the efficacy, safety, and cost-effectiveness of artificial disc replacement (ADR) in the cervical and lumbar spine. Key Questions Key question 1 What is the evidence of efficacy and effectiveness of ADR compared with comparative therapies (including non-operative therapy; spinal fusion; other surgery)?
Key Question 2
What is the evidence related to the ADR safety profile? (including device failure, reoperation)
Key Question 3 What is the evidence of differential efficacy or safety issues amongst special populations (including but not limited to the elderly and workers compensation populations)?
Key Question 4 What are the cost implications and cost effectiveness for ADR?
Inclusion and exclusion criteria are summarized as follows:
• Population: • Lumbar: Patients undergoing primary L-ADR for DDD without neurological compromise and
who have not had prior spine surgery at the instrumented level.

WA – Health Technology Assessment December 19, 2016
Artificial disc replacement – Re-review: Final evidence report ES - 3
• Cervical: Patients undergoing primary C-ADR for DDD resulting in radiculopathy or myelopathy and who have not had prior surgery at the instrumented level.
• Intervention: L-ADR or C-ADR with commercially available device (defined as FDA-approved devices or unapproved devices in Phase III trials with ≥ 1 year of follow-up data in a peer-reviewed journal).
• Comparators: Non-operative treatment, spinal fusion, other spine surgery. Comparator interventions that employ a device not FDA-approved for use in the US will be excluded.
• Outcomes: Studies must report on at least one of the following: • Physical function/disability (overall clinical success, ODI [L-ADR] or NDI [C-ADR]) • Pain/pain reduction • Device failure (reoperation at the index level – to include revision, reoperation, or removal) • Complications (e.g., migration, subsidence, neurologic injury as well as infection, vascular
damage, heterotopic ossification, others) The following secondary outcomes are reported if presented with studies meeting the above criteria: • Quality of life (SF-36) • Incidence of adjacent segment disease (e.g., reoperation at the adjacent level)
• Study design: This report will focus on evidence that evaluates efficacy and effectiveness and has the least potential for bias. For Key Questions 1 and 2, only randomized controlled trials (RCTs) and comparative studies with concurrent controls will be considered (N≥50 for lumbar ADR; N≥100 for cervical ADR). RCTs included in the 2008 HTA will be carried forward into the current report, otherwise, conclusions will be discussed in context of conclusions of that report. For Key Question 3, RCTs which stratify on patient or other characteristics and formally evaluate statistical interaction (effect modification) will be sought. For Key Question 4 only full, formal economic studies (i.e., cost-effectiveness, cost-utility, cost-minimization, and cost-benefit studies) will be considered.
Methods The scope of this report and final key questions were refined based on input from clinical experts from a variety of disciplines (including spine surgery, physical therapy) and public comments received on draft key questions. Clinical expert input was sought to confirm critical outcomes on which to focus. A formal, structured systematic search of the peer-reviewed literature was performed across a number of databases including PubMed to identify relevant peer reviewed literature as well as other sources (National Guideline Clearinghouse, Center for Reviews and Dissemination Database) to identify pertinent clinical guidelines and previously performed assessments. Studies were selected for inclusion based on pre-specified criteria detailed in the full report. All records were screened by two independent reviewers. Selection criteria included a focus on studies with the least potential for bias that were written in English and published in the peer-reviewed literature. Pertinent studies were critically appraised independently by two reviewers based on Spectrum’s Risk of Bias (formerly Class of Evidence) system which evaluates the methodological quality and potential for bias based on study design as well as factors which may bias studies. Reviewers discussed and resolved

WA – Health Technology Assessment December 19, 2016
Artificial disc replacement – Re-review: Final evidence report ES - 4
differences by consensus; consultation with a third reviewer was done if needed. An overall Strength of Evidence (SoE) combines the appraisal of study limitations with consideration of the consistency of effects, directness and precision of the findings across studies to describe an overall confidence regarding the stability of estimates for critical outcomes as further research is available. Included economic studies were also formally appraised based on criteria for quality of economic studies and pertinent epidemiological precepts. Results: Summary of evidence with least potential bias on primary outcomes The following summaries of evidence have been based on the highest quality of studies available and for Key Question 1, are focused much as possible on the percentage of patients who achieved a study-defined threshold of “success” (i.e., responders). Additional information on lower quality studies is available in the report. A summary of the primary outcomes for each key question are provided in the tables below and are sorted by comparator. Details of other outcomes are available in the report. Lumbar Artificial Disc Replacement (L-ADR) For L-ADR, a total of 5 RCTs (in 11 publications), 5 non-randomized comparative studies, and 3 economic evaluations were included. The comparisons evaluated and their respective studies are listed in the table below; comparisons of interest not listed in the table below had no comparative evidence available that met the inclusion criteria. Comparison of L-ADR studies included in the previous report with those included in this update
Key Question Original 2008 Report Update L-ADR vs. Fusion (1-level) KQ1: Efficacy & Effectiveness 2 RCTs
5 comparative observational studies* 7 case series*
2 index† RCTs10,99 (4 additional publications)29,86,87,101
KQ2: Safety 2 RCTs 22 case series
2 index† RCTs10,99 (5 additional publications)29,86,87,101,102 2 comparative observational studies25,45
KQ3: Differential Effects 0 studies 0 studies KQ4: Cost-effectiveness 0 studies 0 studies L-ADR vs. Fusion (2-level) KQ1: Efficacy & Effectiveness 0 studies 1 RCT22
KQ2: Safety 0 studies 1 RCT22
KQ3: Differential Effects 0 studies 0 studies KQ4: Cost-effectiveness 0 studies 0 studies L-ADR vs. Fusion (1- or 2-level, or levels not specified) KQ1: Efficacy & Effectiveness 0 studies 1 index RCT7 (2 additional publications)5,82
1 comparative observational study6 KQ2: Safety 0 studies 1 index RCT7 (1 additional publication)82
3 comparative observational studies6,44,47 KQ3: Differential Effects 0 studies 0 studies KQ4: Cost-effectiveness 0 studies 2 studies26,60 L-ADR vs. Multidisciplinary Rehabilitation KQ1: Efficacy & Effectiveness 0 studies 1 RCT31

WA – Health Technology Assessment December 19, 2016
Artificial disc replacement – Re-review: Final evidence report ES - 5
Key Question Original 2008 Report Update KQ2: Safety 0 studies 1 RCT31 KQ3: Differential Effects 0 studies 0 studies KQ4: Cost-effectiveness 0 studies 1 study40
* Used only to provide evidence on non-clinical effectiveness outcomes (preservation of motion, radiographic adjacent segment disease); one cohort compared VAS pain in mono- vs. multilevel ADR, not a comparison of interest for this update.
† Both RCTs included in the 2008 report have been included in this update. Cervical Artificial Disc Replacement (C-ADR) For C-ADR, a total of 19 RCTs (in 49 publications), nine non-randomized comparative studies, and 6 economic evaluations were included. The comparisons evaluated and their respective studies are listed in the table below; comparisons of interest not listed in the table below had no comparative evidence available that met the inclusion criteria. Comparison of C-ADR studies included in the previous report with those included in this update
Key Question Original 2008 Report Update C-ADR vs. ACDF (1-level) KQ1: Efficacy & Effectiveness 5 RCTs
13 case series* 13 index† RCTs30,33,42,54-57,62,65,76,95,97,98 (18 additional publications12,13,23,34,35,38,58,64,73,77,78,88-
93,100) 3 comparative observational studies36,43,83
KQ2: Safety 5 RCTs 22 case series
13 index† RCTs30,33,42,54-57,62,65,76,95,97,98 (23 additional publications4,12,13,23,24,34,35,37,38,50,58,64,73,77-79,88-93,100) 2 comparative observational studies36,70
KQ3: Differential Effects 0 studies 2 post hoc analyses each summarizing 2 RCTs72,84 KQ4: Cost-effectiveness 0 studies 4 studies46,51,67,69 C-ADR vs. ACDF (2-level) KQ1: Efficacy & Effectiveness 0 studies 2 Index RCTs17,20 (3 additional publications21,68,94)
2 comparative observational studies36,43 KQ2: Safety 0 studies 2 Index RCTs17,20 (4 additional publications21,37,68,94)
1 comparative observational study36 KQ3: Differential Effects 0 studies 0 studies KQ4: Cost-effectiveness 0 studies 2 studies1,2 C-ADR vs. ACDF (Mixed levels) KQ1: Efficacy & Effectiveness 0 studies 2 RCTs16,80
3 comparative observational studies14,28,63 KQ2: Safety 0 studies 2 index RCTs16,80 (1 additional publication81)
4 comparative observational studies14,28,59,63 KQ3: Differential Effects 0 studies 1 RCT75 KQ4: Cost-effectiveness 0 studies 0 studies C-ADR vs. ACDF with a zero-profile device (2 non-contiguous levels) KQ1: Efficacy & Effectiveness 0 studies 1 RCT66 KQ2: Safety 0 studies 1 RCT66 KQ3: Differential Effects 0 studies 0 studies KQ4: Cost-effectiveness 0 studies 0 studies C-ADR vs. Nonoperative care Any 0 studies 0 studies
* Used only to provide evidence on non-clinical effectiveness outcomes (preservation of motion, radiographic adjacent segment disease) † All five RCTs included in the 2008 report have been included in this update.
WA – Health Technology Assessment December 19, 2016
Artificial disc replacement – Re-review: Final evidence report ES - 6
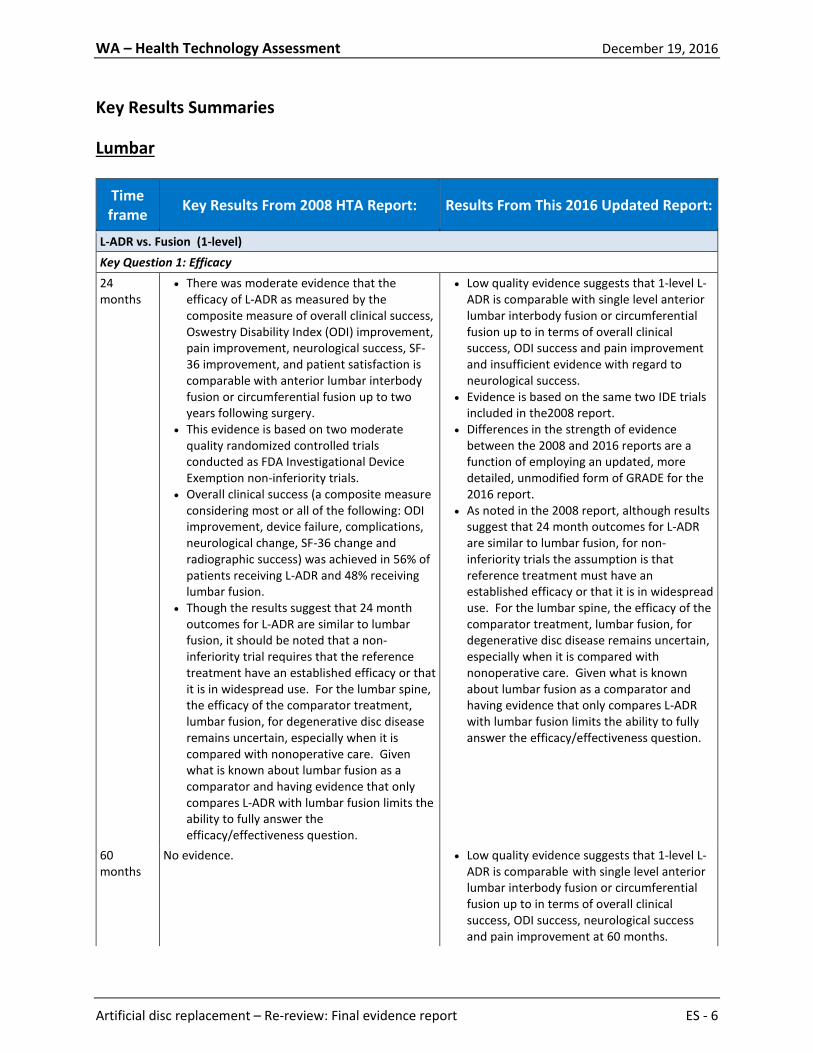
Key Results Summaries Lumbar
Time frame Key Results From 2008 HTA Report: Results From This 2016 Updated Report:
L-ADR vs. Fusion (1-level) Key Question 1: Efficacy 24 months
• There was moderate evidence that the efficacy of L-ADR as measured by the composite measure of overall clinical success, Oswestry Disability Index (ODI) improvement, pain improvement, neurological success, SF-36 improvement, and patient satisfaction is comparable with anterior lumbar interbody fusion or circumferential fusion up to two years following surgery.
• This evidence is based on two moderate quality randomized controlled trials conducted as FDA Investigational Device Exemption non-inferiority trials.
• Overall clinical success (a composite measure considering most or all of the following: ODI improvement, device failure, complications, neurological change, SF-36 change and radiographic success) was achieved in 56% of patients receiving L-ADR and 48% receiving lumbar fusion.
• Though the results suggest that 24 month outcomes for L-ADR are similar to lumbar fusion, it should be noted that a non-inferiority trial requires that the reference treatment have an established efficacy or that it is in widespread use. For the lumbar spine, the efficacy of the comparator treatment, lumbar fusion, for degenerative disc disease remains uncertain, especially when it is compared with nonoperative care. Given what is known about lumbar fusion as a comparator and having evidence that only compares L-ADR with lumbar fusion limits the ability to fully answer the efficacy/effectiveness question.
• Low quality evidence suggests that 1-level L-ADR is comparable with single level anterior lumbar interbody fusion or circumferential fusion up to in terms of overall clinical success, ODI success and pain improvement and insufficient evidence with regard to neurological success.
• Evidence is based on the same two IDE trials included in the2008 report.
• Differences in the strength of evidence between the 2008 and 2016 reports are a function of employing an updated, more detailed, unmodified form of GRADE for the 2016 report.
• As noted in the 2008 report, although results suggest that 24 month outcomes for L-ADR are similar to lumbar fusion, for non-inferiority trials the assumption is that reference treatment must have an established efficacy or that it is in widespread use. For the lumbar spine, the efficacy of the comparator treatment, lumbar fusion, for degenerative disc disease remains uncertain, especially when it is compared with nonoperative care. Given what is known about lumbar fusion as a comparator and having evidence that only compares L-ADR with lumbar fusion limits the ability to fully answer the efficacy/effectiveness question.
60 months
No evidence. • Low quality evidence suggests that 1-level L-ADR is comparable with single level anterior lumbar interbody fusion or circumferential fusion up to in terms of overall clinical success, ODI success, neurological success and pain improvement at 60 months.

WA – Health Technology Assessment December 19, 2016
Artificial disc replacement – Re-review: Final evidence report ES - 7
Time frame Key Results From 2008 HTA Report: Results From This 2016 Updated Report:
• Evidence is based subsequent publications reporting on 60 month follow-up from the same two FDA IDE trials that were included in the 2008 report.
Key Question 2: Safety 24 months
• There is moderate evidence that L-ADR results in a similar proportion of device-related complications (7 to 18%) compared with lumbar fusion (4 to 20%)
• There is moderate evidence that L-ADR results in a similar proportion of major complications (0 to 1%) compared with lumbar fusion (0 to 1%)
• The primary evidence was from the two FDA IDE trials.
• There is low quality evidence that single-level L-ADR results in a similar proportion of secondary surgery at the index level, device-related adverse events (excluding secondary surgery at the index level) and experience of any adverse event, based on data from the two FDA IDE trials. (Low quality evidence)
• There is low quality evidence that L-ADR results in a similar proportion of major complications (0 to 1%) compared with lumbar fusion (0 to 1%); Sample sizes may have precluded detection of such events and their frequency may be underestimated.
• Evidence is from the two FDA non-inferiority IDE trials
60 months
No evidence. • Single-level L-ADR resulted similar proportion of secondary surgery at the index level, between 24 and 60 months and through 60 months based on data from one FDA IDE trial (low quality evidence).
• Similarly through 60 months, similar proportions of L-ADR and fusion patients experienced “any” adverse event. (low quality evidence) from the one FDA IDE trial.
• With regard to major adverse events as defined by the study, one IDE trial reported no events at 60 months; the other reported that serious life threatening events (definition not provided) were more common in the L-ADR group (0.58 per patient) compared with fusion (0.38 per patient).
Key Question 3: Differential Efficacy and Safety Any No or insufficient evidence. No evidence. Key Question 4: Cost-effectiveness Not applicable
There were inadequate data from partial economic studies reflecting short time horizons for L-ADR to truly assess the potential cost effectiveness of L-ADR. One report and one previously done HTA suggest that the type of fusion may influence complication rates and therefore costs.
No evidence specific to single-level L-ADR vs. fusion.

WA – Health Technology Assessment December 19, 2016
Artificial disc replacement – Re-review: Final evidence report ES - 8
Time frame Key Results From 2008 HTA Report: Results From This 2016 Updated Report:
L-ADR vs. fusion (2-level) Key Question 1: Efficacy 24 months
No evidence. • Low quality evidence suggests that 2-level L-ADR is comparable with fusion up to 24 months in terms of overall clinical success, ODI scores neurological success and improvement in VAS pain scores.
• Evidence is from one FDA, non-inferiority IDE trial.
• No information beyond 24 months was reported
Key Question 2: Safety 24 months
No evidence. • Low quality evidence suggests that 2-level L-ADR was associated with fewer additional surgeries at the index level compared with fusion (2.4% vs. 8.3%) at 24 months.
• Major surgery-related complications were less common with L- ADR (0.7%) than with fusion (4.9%) (low quality evidence).
• Device-related events were similar between groups (2.4% for L-ADR vs. 1.4% for fusion) (low quality evidence).
• Evidence is from one FDA non-inferiority IDE trial.
• No information beyond 24 months was reported
Key Question 3: Differential Efficacy and Safety Any No or insufficient evidence. No or insufficient evidence.
Key Question 4: Cost-effectiveness Not applicable
No evidence. No evidence specific to 2-level intervention.
L-ADR vs. Fusion (Mixed levels: 1- or 2-, or number of levels not specified) Key Question 1: Efficacy 24 months
No evidence. • Low quality evidence suggests that L-ADR is comparable to fusion with regard to clinical success, (defined as being totally pain free or much better), ODI success or improvement in pain scores at 24 months.
• Evidence is from one trial. 60 months
No evidence. • Low quality evidence suggests that L-ADR is comparable to fusion with regard to clinical success, (defined as being totally pain free or

WA – Health Technology Assessment December 19, 2016
Artificial disc replacement – Re-review: Final evidence report ES - 9
Time frame Key Results From 2008 HTA Report: Results From This 2016 Updated Report:
much better), ODI success or improvement in VAS pain scores at 60 months in the same trial.
Key Question 2: Safety 24 months
No evidence. • Low quality evidence suggests: L-ADR was associated with significantly fewer secondary surgeries compared with fusion up to 24 months; the majority were device related.
• Fewer major complications occurred following L-ADR compared with fusion (low quality evidence)
• Similar proportions of L-ADR and fusion recipients experienced “any” complication; all events occurred within 24 months
• Evidence is from one trial 60 months
• Similarly, ow quality evidence suggests: L-ADR was associated with significantly fewer secondary surgeries compared with fusion up to 60 months as well; the majority were device related.
• Fewer major complications occurred following L-ADR compared with fusion and all events occurred within 24 months with no additional events reported through 60 months.
• No additional adverse events occurred after 24 months through 60 months.
Key Question 3: Differential Efficacy and Safety Any No or insufficient evidence. No or insufficient evidence.
Key Question 4: Cost-effectiveness Not applicable
No evidence. • Results across the two moderate quality studies are mixed with regard to the cost-effectiveness of L-ADR versus fusion. One study reported that L-ADR was somewhat less costly (particularly when reoperation costs were excluded) differences in effectiveness based on EQ-5D, ODI, VAS for pain or SF-36 were not significant, thus an ICER is not meaningful. In contrast, the other study L-ADR dominated fusion when overall clinical success and narcotic discontinuation were the outcomes; it was less costly but also less effective than fusion when ODI success was the outcome.

WA – Health Technology Assessment December 19, 2016
Artificial disc replacement – Re-review: Final evidence report ES - 10
Time frame Key Results From 2008 HTA Report: Results From This 2016 Updated Report:
L-ADR (1 or 2 level) vs. Multidisciplinary Rehabilitation Key Question 1: Efficacy 24 months
No evidence. • Low quality evidence suggests that L-ADR is better than multidisciplinary rehabilitation with regard to clinical success, (defined ODI improvement of ≥15-points) and improvement in VAS pain scores at 24 months.
• Evidence is from one trial that didn’t report data beyond 24 months.
Key Question 2: Safety 24-months
No evidence. • Low quality evidence suggests that in L-ADR recipients additional surgery at the index level (6.5%) and complications resulting in some form of impairment (7.8%) are not uncommon; 33% of L-ADR recipients experienced at least one complication. Complications were not reported for the rehabilitation group.
Key Question 3: Differential Efficacy and Safety Any No evidence. No evidence. Key Question 4: Cost-effectiveness Not applicable
No evidence. One moderate to high quality cost-effectiveness analysis suggests that L-ADR may to be a cost effective alternative to rehabilitation given a willingness to pay greater than $49,132 based on utilities derived from the EQ-5D. The same was not true with SF-6D was used.

WA – Health Technology Assessment December 19, 2016
Artificial disc replacement – Re-review: Final evidence report ES - 11
Cervical
Time frame Key Results From 2008 HTA Report: Results From This 2016 Updated Report:
C-ADR vs. ACDF (1-level) Key Question 1: Efficacy 24 months Moderate quality evidence suggested that 1-
level C-ADR is superior to ACDF in terms of overall success and neurological success, and is comparable to ACDF in terms of NDI and pain scores
Moderate quality evidence suggests that 1-level C-ADR is superior to ACDF in terms of overall success, NDI success, and neurological success. However, there was low quality evidence that the groups were comparable in terms of arm and neck pain success.
48-60 months No evidence. Moderate quality evidence suggests that 1-level C-ADR is superior to ACDF in terms of overall success and neurological success. However, there was low quality evidence that the groups were comparable in terms of NDI, arm, and neck pain success.
84 months No evidence. Low quality evidence suggests that 1-level C-ADR is superior to ACDF in terms of overall success, while low quality evidence suggests that the groups were comparable in terms of neurological success, NDI success, and arm pain scores. In addition, low quality evidence suggests that 1-level C-ADR conferred a slight benefit over ACDF in terms of neck pain scores. (Arm and neck pain success were not reported.)
Key Question 2: Safety 24 months Moderate quality evidence suggested that 1-
level C-ADR is safer than ACDF in terms of device failure or device-related adverse events through 24 months.
Single-level C-ADR is superior to ACDF in terms of the incidence of secondary surgery at the index level (moderate quality evidence), serious/major adverse events (low quality evidence), and device-related adverse events (moderate quality evidence).
48-60 months No evidence. Single-level C-ADR is superior to ACDF in terms of the incidence of secondary surgery at the index level (low quality evidence), while the groups were comparable in terms of serious/major adverse events (low quality evidence) and device-related adverse events (moderate quality evidence).
84 months No evidence. Low quality evidence suggests that 1-level C-ADR is superior to ACDF in terms of the incidence of secondary surgery at the index level, while the

WA – Health Technology Assessment December 19, 2016
Artificial disc replacement – Re-review: Final evidence report ES - 12
Time frame Key Results From 2008 HTA Report: Results From This 2016 Updated Report:
groups were comparable in terms of serious/major adverse events and device-related adverse events.
Key Question 3: Differential Efficacy and Safety Any No or insufficient evidence. No or insufficient evidence.
Key Question 4: Cost-effectiveness Not applicable No evidence. Overall, results from four cost utility analyses
(CUAs) found that both C-ADR and ACDF were cost effective options based on a WTP threshold of $50,000. However, C-ADR was more effective and less costly than ACDF for 1-level disc procedures. The CUAs were of moderate to high quality, and all had some limitations, with a Quality of Health Economic Study (QHES) score of 75/100 (range: 62 to 91). All four studies were conducted in the US.
C-ADR vs. ACDF (2-level) Key Question 1: Efficacy 24 months No evidence. Moderate quality evidence suggests that 2-level
C-ADR is superior to ACDF in terms of overall success and NDI success; while low quality evidence suggests that C-ADR is as good as or better than ACDF in terms of arm and neck pain scores. However, the groups are comparable in terms of neurological success (low quality evidence). (Arm and neck pain success were not reported.)
48-60 months No evidence. Moderate quality evidence suggests that 2-level C-ADR is superior to ACDF in terms of overall success and NDI success; while low quality evidence suggests the groups are comparable in terms of neurological success, arm pain scores, and neck pain scores. (Arm and neck pain success were not reported.)
84 months No evidence. No evidence.
Key Question 2: Safety 24 months No evidence. Low quality evidence suggests that 2-level C-ADR
is superior to ACDF in terms of the incidence of secondary surgery at the index level, serious/major adverse events, and device-related adverse events.

WA – Health Technology Assessment December 19, 2016
Artificial disc replacement – Re-review: Final evidence report ES - 13
Time frame Key Results From 2008 HTA Report: Results From This 2016 Updated Report:
48-60 months No evidence. Low quality evidence suggests that 2-level C-ADR is superior to ACDF in terms of the incidence of secondary surgery at the index level. (Serious/major adverse events, and device-related adverse events were not reported.)
84 months No evidence. No evidence.
Key Question 3: Differential Efficacy and Safety Any No or insufficient evidence. No or insufficient evidence.
Key Question 4: Cost-effectiveness Not applicable No evidence. Two high-quality CUAs (QHES scores of both were
100/100) based on a single RCT suggest that, based on a willingness to pay threshold of $50,000/QALY, C-ADR was highly cost-effective at 24 and 60 months when compared to ACDF for 2-level degenerative disc disease with radiculopathy or myelopathy that had not responded to six weeks of conservative care. Both studies were conducted in the US.
C-ADR vs. ACDF (Mixed levels (1-, 2-, or 3-level) Key Question 1: Efficacy 24 months No evidence. Low quality evidence suggests no differences
between groups in NDI, arm pain, or neck pain scores. No other primary efficacy outcomes were reported.
24-36 months No evidence. Low quality evidence suggests that C-ADR is as good as or better than ACDF in terms of NDI scores. No other primary efficacy outcomes were reported.
48-84 months No evidence. No evidence.
Key Question 2: Safety 24-36 months No evidence. Low quality evidence suggests no difference
between groups terms of the incidence of secondary surgery at the index level, and serious/major adverse events. In terms of device-related adverse events, low quality evidence suggests individual events occurred similarly between groups, with the exception of dysphagia, which was less common with C-ADR.
48-84 months No evidence. No evidence.

WA – Health Technology Assessment December 19, 2016
Artificial disc replacement – Re-review: Final evidence report ES - 14
Time frame Key Results From 2008 HTA Report: Results From This 2016 Updated Report:
Key Question 3: Differential Efficacy and Safety Any No or insufficient evidence. No or insufficient evidence.
Key Question 4: Cost-effectiveness Not applicable No evidence. No evidence.
C-ADR vs. ACDF with a zero-profile device (2 non-contiguous levels) Key Question 1: Efficacy 24-46 months No evidence. Low quality evidence suggests no differences
between groups in NDI scores. No other primary efficacy outcomes were reported.
48-84 months No evidence. No evidence. Key Question 2: Safety 24-46 months No evidence. Low quality evidence suggests no differences
between groups in terms of serious/major or device-related adverse events. (Secondary surgery at the index level was not reported.)
48-84 months No evidence. No evidence.
Key Question 3: Differential Efficacy and Safety Any No evidence. No evidence.
Key Question 4: Cost-effectiveness Not applicable No evidence. No evidence.

WA – Health Technology Assessment December 19, 2016
Artificial disc replacement – Re-review: Final evidence report ES - 15
Strength of Evidence Summary Tables Lumbar Strength of Evidence Summary: L-ADR vs. Fusion (1-level) Efficacy Results
Outcome Follow-up RCTs N* Reasons for
Downgrading Conclusion* Quality
L-ADR vs. fusion (1-level) Overall success†
24 mos. 2 RCTs (Charité, ProDisc-L IDE trials)
N=484
Risk of Bias1 (-1) Imprecision3 (-1)
Pooled RD 7.9% (95% CI -1.7%, 17.4%), Conclusion: L-ADR is comparable with single level anterior lumbar interbody fusion or circumferential fusion up to 24 months following surgery in terms of the proportion of patients achieving overall clinical success
⨁⨁◯◯
LOW
60 mos. 2 RCTs (Charité, ProDisc-L IDE trials)
N=319 Risk of Bias1 (-1) Imprecision3 (-1)
Pooled RD 7.1%, (95% CI -4.9%, 18.9%) Conclusion: L-ADR is comparable with single level anterior lumbar interbody fusion or circumferential fusion up to 60 months following surgery in terms of the proportion of patients achieving overall clinical success
⨁⨁◯◯
LOW
ODI success (≥15-point improvement)
24 mos. 2 RCTs (Charité, ProDisc-L IDE trials)
N=485
Risk of Bias1 (-1) Imprecision3 (-1)
Pooled RD 8.9% (95% CI -0.5%, 18.3%), Conclusion: L-ADR is comparable with single level anterior lumbar interbody fusion or circumferential fusion up to 24 months following surgery in terms of the proportion of patients achieving ODI success
⨁⨁◯◯
LOW
60 mos. 2 RCTs (Charité, ProDisc-L IDE trials)
N=310
Risk of Bias1 (-1) Imprecision3 (-1)
Pooled RD 7.8%, (95% CI -3.6%, 19.2%) Conclusion: L-ADR is comparable with single level anterior lumbar interbody fusion or circumferential fusion up to 60 months following surgery in terms of the proportion of patients achieving ODI success
⨁⨁◯◯
LOW
Neurological success‡
24 mos. 2 RCTs N=483
Risk of Bias1 (-1) Inconsistency2 (-1) Imprecision3 (-1)
Pooled RD 2.2%, (95% CI -12.6%, 17.1%)
⨁◯◯◯
INSUFFICIENT

WA – Health Technology Assessment December 19, 2016
Artificial disc replacement – Re-review: Final evidence report ES - 16
Outcome Follow-up RCTs N* Reasons for
Downgrading Conclusion* Quality
(Charité, ProDisc-L IDE trials)
Conclusion: L-ADR is comparable with single level anterior lumbar interbody fusion or circumferential fusion up to 24 months following surgery in terms of the proportion of patients achieving neurological success
60 mos. 2 RCTs (Charité, ProDisc-L IDE trials)
N=306
Risk of Bias1 (-1) Imprecision3 (-1)
Pooled RD 0.2%, (95% CI -7.9%, 8.3%) Conclusion: L-ADR is comparable with single level anterior lumbar interbody fusion or circumferential fusion up to 60 months following surgery in terms of the proportion of patients achieving neurological success
⨁⨁◯◯
LOW
VAS Pain scores (0-100)
24 mos. 2 RCTs (Charité, ProDisc-L IDE trials)
N=488
Risk of Bias1 (-1) Imprecision4 (-1)
WMD 6.84, 95% CI 0.63, 12.32) Conclusion: L-ADR may be comparable to fusion with regard to pain relief at 24 months. Neither trial individually reported a significant difference between treatments. Based on pooled estimates, VAS pain at 24 months may be somewhat less following L-ADR compared with fusion (pooled mean difference however the difference is likely not clinically meaningful).
⨁⨁◯◯
LOW
60 mos. 2 RCTs (Charité, ProDisc-L IDE trials)
N=309
Risk of Bias1 (-1) Imprecision4 (-1)
WMD MD 1.16, 95% CI -6.43, 8.74 Conclusion: L-ADR may be as good as fusion with regard to pain relief at 24 months.
⨁⨁◯◯
LOW
* Unless otherwise specified, conclusion and patient numbers were based on completer analysis, for which the effect estimate was more conservative than that of the ITT analysis.
† Overall clinical success: The FDA criterion of at least a 15-point improvement from baseline ODI scores was used for both RCTs to minimize heterogeneity in the meta-analysis. The definition of overall clinical success was similar in the two studies, but not identical. In the Prodisc-L trial (Zigeler 2007), success was defined more conservatively than the Charité (Blumenthal 2005) trial in that it required improvement in the SF-36 and radiological success as additional criteria. The addition of these parameters would make success more difficult to achieve resulting in a lower proportion of patients attaining overall clinical success, but not likely biasing the results between study groups. Therefore, these two studies were pooled;
‡ Neurological success was defined as no neurological change (i.e. defined as lack of neurological deterioration compared with preoperative status, at any point of time in the Charité trial and as neurological status improved or maintained (motor, sensory, reflex, straight leg raise) in the ProDisc-L trial.
Reasons for downgrading:

WA – Health Technology Assessment December 19, 2016
Artificial disc replacement – Re-review: Final evidence report ES - 17
1. Serious risk of bias: the majority of studies violated one or more of the criteria for good quality RCT (or cohort study) related to the outcome reported (see Appendix for details) 2. Inconsistency: differing estimates of effects across trials 3. Imprecise effect estimate for a dichotomous outcome: small sample size and/or confidence interval includes both negligible effect and appreciable benefit or harm with ADR 4. Imprecise effect estimate for a continuous outcome: wide (or unknown) confidence interval and/or small sample size
Strength of Evidence Summary: L-ADR vs. Fusion (2-level) Efficacy Results
Outcome Follow-up RCTs N* Reasons for
Downgrading Conclusion* Quality
L-ADR vs. fusion (2-level) Overall success†
24 mos. 1 RCTs (Delamarter)
N=215
Risk of Bias1 (-1) Imprecision3 (-1)
RD 11.0% (95% CI -3.3%, 25.4%) Conclusion: At 24 months, 2-level L-ADR is as good as fusion with regard to the proportion of patients achieving clinical success; no statistical difference was observed between treatments observed.
⨁⨁◯◯
LOW
ODI Scores (0-100)
Risk of Bias1 (-1) Imprecision4 (-1)
MD -8.4 (95% CI -15.4, -1.4) Conclusion: Two-level ADR may be as good as or slightly better than fusion with respect to function measured via ODI. Patients receiving 2-level L-ADR had significant improvement (lower) in ODI scores; It is not clear if this difference is clinically meaningful. Change from baseline for ADR was 52.4% ± 38.1% and for fusion was 40.9% ± 36.0%.
⨁⨁◯◯
LOW
Neurological success‡
Risk of Bias1 (-1) Imprecision3 (-1)
RD 8.5% (95% CI -2.5%, 19.6%) Conclusion: Two-level ADR may be as good as fusion by 24 months in terms of neurological success; no statistical difference was observed between treatments observed
⨁⨁◯◯
LOW
VAS Pain scores (0-100)
Risk of Bias1 (-1) Imprecision4 (-1)
MD -6.5 (-15.7, 2.7) Conclusion: Two-level ADR may be as good as fusion with regard to pain relief; no statistical difference was observed between treatments observed
⨁⨁◯◯
LOW
* Unless otherwise specified, conclusion and patient numbers were based on completer analysis, for which the effect estimate was more conservative than that of the ITT analysis.
† Overall clinical success: The FDA criterion of at least a 15-point improvement from baseline ODI scores was used, other components of the composite: 1) Improvement in SF-36 PCS compared with baseline; 2) Neurological status improved or maintained from baseline; 3) No secondary surgical procedures to remove or modify the total disc replacement implant or arthrodesis implant/site; 4) no subsidence >3 mm; 5) no migration >3 mm; 6) no radiolucency/loosening; 7) no loss of disc height >3 mm); and 8) for ADR, range of motion improved for maintained from baseline and for Fusion, no motion (<10⁰ angulation, total for two levels combined) on flexion and extension radiographs.
‡ Neurological success was defined as neurological status improved or maintained (motor, sensory, reflex, straight leg raise).

WA – Health Technology Assessment December 19, 2016
Artificial disc replacement – Re-review: Final evidence report ES - 18
Reasons for downgrading:
1. Serious risk of bias: the majority of studies violated one or more of the criteria for good quality RCT (or cohort study) related to the outcome reported (see Appendix for details) 2. Inconsistency: differing estimates of effects across trials 3. Imprecise effect estimate for a dichotomous outcome: small sample size and/or confidence interval includes both negligible effect and appreciable benefit or harm with ADR 4. Imprecise effect estimate for a continuous outcome: wide (or unknown) confidence interval and/or small sample size
Strength of Evidence Summary: L-ADR vs. Fusion (1 or 2-level) Efficacy Results
Outcome Follow-up RCTs N* Reasons for
Downgrading Conclusion* Quality
L-ADR vs. fusion (1- or 2-level) Overall success†
24 mos. 1 RCT (Berg/Skold)
N= 152
Risk of Bias1 (-1) Imprecision3 (-1)
RD 5.8% (95% CI -8.8%, 20.5%) Conclusion: L-ADR is comparable to fusion with regard to the proportion of patients who reported being totally pain free or much better.
⨁⨁◯◯
LOW
60 mos. N=151
Risk of Bias1 (-1) Imprecision3 (-1)
RD 4.9% (95% CI -9.7%, 19.5%) Conclusion: L-ADR is comparable to fusion with regard to the proportion of patients who reported being totally pain free or much better.
⨁⨁◯◯
LOW
ODI success (≥ 25% improvement)
24 mos. N= 152
Risk of Bias1 (-1) Imprecision3 (-1)
RD 8.2% (95% CI -7.4%, 23.8%) Conclusion: L-ADR is comparable to fusion with regard to the proportion of patients who achieved ODI success
⨁⨁◯◯
LOW
60 mos. N=151
Risk of Bias1 (-1) Imprecision4 (-1)
RD 12.7% (95% CI -1.7%, 27.1%) Conclusion: L-ADR is comparable to fusion with regard to the proportion of patients achieved ODI success.
⨁⨁◯◯
LOW
Back Pain VAS scores (0-100)
24 mos. N= 152
Risk of Bias1 (-1) Imprecision4 (-1)
MD -3.8 (95% CI -12.6, 5.0) Conclusion: L-ADR is comparable to fusion with regard to back pain relief at 24 months.
⨁⨁◯◯
LOW
60 mos. N=151
Risk of Bias1 (-1) Imprecision4 (-1)
MD -7.8 (-16.9, 1.3) Conclusion: L-ADR is comparable to fusion with regard to back pain relief at 60 months
⨁⨁◯◯
LOW
Leg Pain VAS scores (0-100)
24 mos. N= 152
Risk of Bias1 (-1) Imprecision4 (-1)
MD -4.3 (-12.1, 3.5) Conclusion: L-ADR is comparable to fusion with regard to leg pain relief at 24 months.
⨁⨁◯◯
LOW
60 mos. N=151
Risk of Bias1 (-1) Imprecision4 (-1)
MD -6.3 (-14.0, 1.4) ⨁⨁◯◯
LOW

WA – Health Technology Assessment December 19, 2016
Artificial disc replacement – Re-review: Final evidence report ES - 19
Outcome Follow-up RCTs N* Reasons for
Downgrading Conclusion* Quality
Conclusion: L-ADR is comparable to fusion with regard to leg pain relief at 60 months
SF-36 pain subscale (0-100 [best])
60 mos. N= 151
Risk of Bias1 (-1) Imprecision4 (-1)
MD 10.8 (1.2, 20.4) Conclusion: L-ADR is comparable to or slightly better than fusion with regard at 60 months; It is not clear that the difference in SF-36 pain scores is clinically meaningful.
⨁⨁◯◯
LOW
* Unless otherwise specified, conclusion and patient numbers were based on completer analysis, for which the effect estimate was more conservative than that of the ITT analysis. For this trial, authors report no loss to follow-up at 24 months; however it is not clear if there were randomized patients who did not receive the allotted treatment.
† Overall clinical success was defined differently in the Berg 2009 (totally pain free) and Skold 2013 (totally pain free OR much better) publications; The latter definition is used here as it is more conservative; Using the definition of “totally pain free” RDs at 24 months ( RD 22.2% , 95%CI 8.8, 35.7)and 60 months RD 22.0% (95% CI 8.5, 35.5)suggest L-ADR is better than fusion however substantial imprecision is noted and strength of evidence is low. Full detail is provided in the report.
Reasons for downgrading:
1. Serious risk of bias: the majority of studies violated one or more of the criteria for good quality RCT (or cohort study) related to the outcome reported (see Appendix for details) 2. Inconsistency: differing estimates of effects across trials 3. Imprecise effect estimate for a dichotomous outcome: small sample size and/or confidence interval includes both negligible effect and appreciable benefit or harm with ADR 4. Imprecise effect estimate for a continuous outcome: wide (or unknown) confidence interval and/or small sample size
Strength of Evidence Summary: L-ADR vs. Multidisciplinary Rehabilitation Efficacy Results
Outcome Follow-up RCTs N* Reasons for
Downgrading Conclusion* Quality
L-ADR vs. Multidisciplinary Rehabilitation Overall success/ODI success† (≥15-point improvement in ODI)
24 mos. 1 RCT (Hellum)
N=139
Risk of Bias1 (-1) Imprecision3 (-1)
RD 22.9% (95% CI 6.9%, 38.9%) Conclusion: L-ADR appears to be superior to multidisciplinary rehabilitation; the proportions of L-ADR participants achieving clinical success based on ODI improvement of at least 15 points is significantly higher (57.3%) than the proportion in the rehabilitation group (34.4%).
⨁⨁◯◯
LOW
VAS Pain scores (0-100)
Risk of Bias1 (-1) Imprecision4 (-1)
MD -14.3 (95% CI -23.0, -5.6) Conclusion: Results for VAS pain scores for suggest that L-ADR may be associated with less pain at 24 months compared with multidisciplinary rehabilitation however, baseline low back pain scores were significantly worse in the
⨁⨁◯◯
LOW

WA – Health Technology Assessment December 19, 2016
Artificial disc replacement – Re-review: Final evidence report ES - 20
Outcome Follow-up RCTs N* Reasons for
Downgrading Conclusion* Quality
rehabilitation group than in the surgery group
* Unless otherwise specified, conclusion and patient numbers were based on completer analysis, for which the effect estimate was more conservative than that of the ITT analysis.
† Overall clinical success: The FDA criterion of at least a 15-point improvement from baseline ODI scores was used to define clinical success
Reasons for downgrading: 1. Serious risk of bias: the majority of studies violated one or more of the criteria for good quality RCT (or cohort study) related to the outcome reported (see Appendix for details) 2. Inconsistency: differing estimates of effects across trials 3. Imprecise effect estimate for a dichotomous outcome: small sample size and/or confidence interval includes both negligible effect and appreciable benefit or harm with ADR 4. Imprecise effect estimate for a continuous outcome: wide (or unknown) confidence interval and/or small sample size
Strength of Evidence Summary: L-ADR vs. Fusion (1-level) Safety Results
Outcome Follow-up RCTs N* Reasons for
Downgrading Conclusion* Quality
L-ADR vs. fusion (1-level) Secondary Surgery at Index Level+
24 mos. 2 RCTs (Charité, ProDisc-L IDE trials)
N=540
Risk of Bias1 (-1) Imprecision3 (-1)
L-ADR 4.9%, Fusion 1.4% Pooled RD 2.3% (95% CI -2.1%, 6.6%) Conclusion: L-ADR is comparable with single level anterior lumbar interbody fusion or circumferential fusion up to 24 months following surgery in terms of the proportion of patients who had subsequent surgery at the index level.
⨁⨁◯◯
LOW
24–60 mos.
1 RCTs (ProDisc-L IDE trial)
N=236 Risk of Bias1 (-1) Imprecision3 (-1)
L-ADR 6.6%, Fusion 3.7% RD 2.9% (95% CI -3.4%, 9.3%) Conclusion: L-ADR is comparable with single level anterior lumbar interbody fusion or circumferential fusion between 24 and 60 months following surgery in terms of the proportion of patients
⨁⨁◯◯
LOW
60 mos.
1 RCTs (ProDisc-L IDE trial)
N=236
Risk of Bias1 (-1) Imprecision3 (-1)
L-ADR 12.0%, Fusion 8.1% RD 3.9% (95% CI -4.6%, 12.4% Conclusion: L-ADR is comparable with single level anterior lumbar interbody fusion or circumferential fusion up to 24 months following surgery in terms of the proportion of patients achieving ODI success
⨁⨁◯◯
LOW

WA – Health Technology Assessment December 19, 2016
Artificial disc replacement – Re-review: Final evidence report ES - 21
Outcome Follow-up RCTs N* Reasons for
Downgrading Conclusion* Quality
Major Adverse Events‡
24 mos. 2 RCTs (Charité, ProDisc-L IDE trials)
N=540
Risk of Bias1 (-1) Imprecision3 (-2)
Frequency ≤ 1% of patients for both treatments across both trials. Conclusion: Firm conclusions regarding the comparability of L-ADR and fusion regarding the frequency of major adverse events are not possible: sample sizes may be inadequate to detect rare events. It is possible that reported frequency of such events is underestimated.
⨁◯◯◯
INSUFFICIENT
Major‡, serious or life-threatening adverse event§
60 mos.
2 RCTs (Charité, ProDisc-L IDE trials)
N=133 (Charité) N=236 (ProDisc-
L)
Risk of Bias1 (-1) Inconsistency (-1) Imprecision3 (-1)
Charité: No major adverse events were reported for L-ADR or fusion, however the small sample size and substantial loss to follow-up preclude drawing firm conclusion ** Prodisc- L: Serious or life-threatening event risks for L-ADR were 0.58 per patient, fusion 0.38 per patient, p = 0.036; They appear to be more common with L-ADR than with fusion. Conclusion: Firm conclusions regarding the comparability L-ADR and fusion across these studies at 60 months is not possible. Differing definitions of what may constitute such events may impact the discrepancy across studies in addition to factors related to the population available for the Charite trial at 60 months.
⨁◯◯◯
INSUFFICIENT
Device-related adverse events (excluding secondary surgery at index level)
24 mos. 2 RCTs (Charité, ProDisc-L IDE trials)
N=540
Risk of Bias1 (-1) Imprecision3 (-1)
L-ADR 11.5%, fusion 9.2% Pooled RD -2.7% (95% CI -7.4 %, 1.9%) Conclusion: L-ADR is comparable with single level anterior lumbar interbody fusion or circumferential fusion up to 60 months following surgery in terms of the proportion of patients
⨁⨁◯◯
LOW

WA – Health Technology Assessment December 19, 2016
Artificial disc replacement – Re-review: Final evidence report ES - 22
Outcome Follow-up RCTs N* Reasons for
Downgrading Conclusion* Quality
Any Adverse Event
24 mos. 2 RCTs (Charité, ProDisc-L IDE trials)
N=540
Risk of Bias1 (-1) Imprecision4 (-1)
L-ADR 79.5%, fusion 84.5% Pooled RD 6.2% (95% CI -0.7%, 13.0%) Conclusion: L-ADR may be comparable to fusion with regard to experiencing any adverse event by 24 months.
⨁⨁◯◯
LOW
60 mos. 1 RCT (ProDisc-L IDE trials)
N=236
Risk of Bias1 (-1) Imprecision4 (-1)
L-ADR 5.1 per patient, fusion 5.4 per patient, p = 0.507 Conclusion: L-ADR may be comparable with fusion with regard frequency of any adverse event by 60 months.
⨁⨁◯◯
LOW
*Percentages were calculated based on the number of patients who received treatment (i.e., excludes those who dropped out after randomization but prior to undergoing surgery) unless otherwise noted.
†Secondary surgery at index level included revision, reoperation, device/hardware removal, supplemental fixation, hemilaminectomy and discectomy with decompression ‡Major adverse event defined as major vessel injury, neurological damage, nerve root injury, and death. §Zigler 2012 does not provide detail regarding what constitutes a serious or life threatening event; unclear if these events were defined the same way as “major adverse events” for the ProDisc-L trial at 24 months. **For the Charite IDE trial, of the 14 initial sites, 6 declined participation in the 60-month continuation study, which eliminated 64 randomized patients and only those with both 24 month and 60 month data were included. Reasons for downgrading:
1. Serious risk of bias: the majority of studies violated one or more of the criteria for good quality RCT (or cohort study) related to the outcome reported (see Appendix for details) 2. Inconsistency: differing estimates of effects across trials 3. Imprecise effect estimate for a dichotomous outcome: small sample size and/or confidence interval includes both negligible effect and appreciable benefit or harm with ADR. If sample size is likely too small to detect rare outcomes, evidence may be downgraded twice. 4. Imprecise effect estimate for a continuous outcome: wide (or unknown) confidence interval and/or small sample size

WA – Health Technology Assessment December 19, 2016
Artificial disc replacement – Re-review: Final evidence report ES - 23
Strength of Evidence Summary: L-ADR vs. Fusion (2-level) Safety Results
Outcome Follow-up RCTs N* Reasons for
Downgrading Conclusion* Quality
L-ADR vs. Fusion (2-level) Secondary surgical procedure at index level(s)†
24 mos. 1 RCTs (Delamarter)
N=237
Risk of Bias1 (-1) Imprecision3 (-1)
L-ADR 2.4%, fusion 8.3% RD -5.9% (95% CI -12.7%, 0.09%) Conclusion: At 24 months, additional surgery at the index level was less common following 2-level L-ADR vs. fusion.
⨁⨁◯◯
LOW
Major surgery-related complications‡
Risk of Bias1 (-1) Imprecision4 (-1)
L-ADR 0.7%, fusion 4.9% RD -6.7% (95% CI -14.0%, 0.6%) Conclusion: Major surgery-related complications were less common with L- ADR compared with fusion, however there was no statistical difference between groups, perhaps partly due to sample size.
⨁⨁◯◯
LOW
Device related complications (Subsidence or migration)§
24 mos. 1 RCTs (Delamarter)
N=237
Risk of Bias1 (-1) Imprecision3 (-2)
L-ADR 2.4%, Fusion 1.4% RD 1.0% (-2.5%, 4.6%) Conclusion: There was no statistical difference between groups; however, this may in part be a function of sample size. The frequency of device-related events may be underestimated.
⨁◯◯◯
INSUFFICIENT
* Percentages were calculated based on the number of patients who received treatment (i.e., excludes those who dropped out after randomization but prior to undergoing surgery) unless otherwise noted.
† Includes revision (1 ADR, 1 fusion), decompression (3 ADR, 1 fusion), and device/implant removal (0 ADR, 6 fusion). One fusion patients underwent implant removal, decompression and revision of the bone fusion sites due to pseudarthrosis at L5-S1; this patient is only counted once in the overall estimate. ‡ Included dural tear (1 ADR, 3 fusion; all successful repaired), blood loss >1500 mL (2 ADR, 2 fusion; 1 iliac artery tear in ADR group while all others had excessive oozing from the surgical site), and deep vein thrombosis (2 ADR, 2 fusion; all successfully treated). § Based on radiographic evaluation, implant subsidence of >3 mm for L-ADR patients (not clinically relevant) or migration and implant migration or subsidence of > 3mm was reported for fusion. There was one anterior migration of L-ADR which resulted in need for revision. Reasons for downgrading:
1. Serious risk of bias: the majority of studies violated one or more of the criteria for good quality RCT (or cohort study) related to the outcome reported (see Appendix for details) 2. Inconsistency: differing estimates of effects across trials 3. Imprecise effect estimate for a dichotomous outcome: small sample size and/or confidence interval includes both negligible effect and appreciable benefit or harm with ADR. If sample size is likely too small to detect rare outcomes, evidence may be downgraded twice. 4. Imprecise effect estimate for a continuous outcome: wide (or unknown) confidence interval and/or small sample size.

WA – Health Technology Assessment December 19, 2016
Artificial disc replacement – Re-review: Final evidence report ES - 24
Strength of Evidence Summary: L-ADR vs. Fusion (1- or 2-level) Safety Results
Outcome Follow-up RCTs N* Reasons for
Downgrading Conclusion* Quality
L-ADR vs. fusion (1- or 2-level) Any Secondary Surgical Procedure at Index Level†
24 mos. 1 RCT (Berg/Skold)
N= 152
Risk of Bias1 (-1) Imprecision3 (-1)
L-ADR 10.0%, fusion 30.6% RD -20.6% (-33.1%, -8.1%) Conclusion: L-ADR was associated with significantly fewer secondary surgeries compared with fusion up to 24 months; the majority were device related
⨁⨁◯◯
LOW
60 mos. N=151
Risk of Bias1 (-1) Imprecision3 (-1)
L-ADR 17.5%, fusion 36.6% RD -19.1% (-33.1%, -5.2%) Conclusion: L-ADR was associated with significantly fewer secondary surgeries compared with fusion through 60 months; the majority was device related.
⨁⨁◯◯
LOW
Device-related reoperation†
24 mos. N= 152
Risk of Bias1 (-1) Imprecision3 (-1)
L-ADR 5.0%, fusion 27.8% RD -22.8% (95% CI -34.2%, -11.4%) Conclusion: L-ADR was associated fewer device-related surgeries compared with fusion up to 24 months; these are the only device-related adverse events that authors report.
⨁⨁◯◯
LOW
60 mos. N=151
Risk of Bias1 (-1) Imprecision3 (-1)
L-ADR 11.3%, fusion 28.2% RD -16.9% (95% CI -29.5%, -4.4%) Conclusion: L-ADR was associated fewer device-related surgeries compared with fusion through 60 months; these are the only device-related adverse events that authors report.
⨁⨁◯◯
LOW
Total major complications§
60 mos. N= 152
Risk of Bias1 (-1) Imprecision3 (-1)
L-ADR 2.5%, fusion 8.3% RD -5.8% (95% CI -13.1%, 1.4%) Conclusion: Fewer major complications occurred following L-ADR compared with fusion; however statistical significance was not reached, possibly in part due to sample size. All events occurred within 24 months with no additional events reported through 60 months.
⨁⨁◯◯
LOW
Any (total) complication
60 mos. N= 152
Risk of Bias1 (-1) Imprecision4 (-1)
L-ADR 17.5%, fusion 20.8% RD -3.3% (95% CI -15.9%, 9.2%) Conclusion: L-ADR was comparable to fusion with regard
⨁⨁◯◯
LOW

WA – Health Technology Assessment December 19, 2016
Artificial disc replacement – Re-review: Final evidence report ES - 25
Outcome Follow-up RCTs N* Reasons for
Downgrading Conclusion* Quality
to frequency of any complications through 24 months. All events occurred within 24 months with no additional events reported through 60 months.
* Percentages were calculated based on the number of patients who received treatment (i.e., excludes those who dropped out after randomization but prior to undergoing surgery) unless otherwise noted. † Based on authors’ description: Subsequent device-related procedures included subsequent fusion (in the ADR group), pedicle screw extraction due to pain or irritation. Non-device related secondary procedures includes decompression, decompression + pedicle screw extraction, re-fusion, hematoma removal, hernia repair and repair of dural tear. § Major complications include deep infection (4 fusion), pseudarthrosis (2 fusion), nerve entrapment (1 ADR), and subsidence/reoperation (1 ADR). Reasons for downgrading:
1. Serious risk of bias: the majority of studies violated one or more of the criteria for good quality RCT (or cohort study) related to the outcome reported (see Appendix for details) 2. Inconsistency: differing estimates of effects across trials 3. Imprecise effect estimate for a dichotomous outcome: small sample size and/or confidence interval includes both negligible effect and appreciable benefit or harm with ADR. If sample size is likely too small to detect rare outcomes, evidence may be downgraded twice. 4. Imprecise effect estimate for a continuous outcome: wide (or unknown) confidence interval and/or small sample size
Strength of Evidence Summary: L-ADR vs. Multidisciplinary Rehabilitation Safety Results
Outcome Follow-up RCTs N* Reasons for
Downgrading Conclusion* Quality
L-ADR vs. Multidisciplinary Rehabilitation Secondary Surgery at Index Level†
24 mos. 1 RCT (Hellum)
N=77
Risk of Bias1 (-1) Imprecision3 (-1)
L-ADR: 6.5% (5/77) Conclusion: Secondary surgery risk is only applicable to the L-ADR group; conclusions regarding comparative safety are not possible
⨁⨁◯◯
LOW
Major complication resulting in impairment‡
Risk of Bias1 (-1) Imprecision4 (-1)
L-ADR: 7.8% (6/77) Conclusion: Conclusions regarding comparative safety are not possible. As defined in this study, major complications resulting in impairment are only applicable to those receiving L-ADR.
⨁⨁◯◯
LOW
Any complication§ Risk of Bias1 (-1) Imprecision4 (-1)
L- ADR: 33.8% (26/77)
⨁⨁◯◯
LOW

WA – Health Technology Assessment December 19, 2016
Artificial disc replacement – Re-review: Final evidence report ES - 26
Outcome Follow-up RCTs N* Reasons for
Downgrading Conclusion* Quality
Conclusion: Over 1/3 of L-ADR recipient s experienced some type of complication. Conclusions regarding comparative safety with respect to any complications as defined are not possible; authors do not provide information on any events in the rehabilitation group.
* ITT analyses are based on the baseline, as-treated population: Six patients (3 in each group) were excluded shortly after randomization and not accounted for in the studies analyses. Safety events were only reported for L-ADR, thus although the total study populations was 139, only 77 received ADR. † Surgeries included fusion at level with disc prosthesis and level above (n=1); insertion of new polyethylene inlay (n=1); and partial resection of spinous process because of possible painful contact between adjacent levels (n=2) ‡ Includes: polyethylene inlay dislodgement requiring revision surgery, during which injury to the left common iliac artery led to compartment syndrome resulting in a lower leg amputation (n=1); arterial thrombosis of dorsalis pedis artery resulting in a slightly colder foot (n=1); retrograde ejaculation (n=1); sensory loss in the thigh (n=2); and new radicular pain (n=2); there were a total of 7 events in 6 patients. § Includes “major complications resulting in impairment” as well as perioperative and other surgery-related adverse events such as dural tear, blood loss >1500 mL, hematoma, infection, etc. Authors report the most frequent treatment-related events as blood loss >1500 mL; temporary sensory loss and temporary radicular pain occurring in 5.2% of LADR patients (4/77). It is not clear if patients could experience more than one complication. Reasons for downgrading:
1. Serious risk of bias: the majority of studies violated one or more of the criteria for good quality RCT (or cohort study) related to the outcome reported (see Appendix for details) 2. Inconsistency: differing estimates of effects across trials 3. Imprecise effect estimate for a dichotomous outcome: small sample size and/or confidence interval includes both negligible effect and appreciable benefit or harm with ADR. If sample size is likely too small to detect rare outcomes, evidence may be downgraded twice. 4. Imprecise effect estimate for a continuous outcome: wide (or unknown) confidence interval and/or small sample size
Strength of Evidence Summary: Differential Efficacy and Safety Results for L-ADR
Outcome Follow-up RCTs N* Reasons for
Downgrading Conclusion Quality
L-ADR vs. Fusion or Multidisciplinary Rehabilitation Any Any No studies were identified
which stratified on patient characteristics or evaluated effect modification.
⨁◯◯◯ INSUFFICIENT

WA – Health Technology Assessment December 19, 2016
Artificial disc replacement – Re-review: Final evidence report ES - 27
Strength of Evidence Summary: Cost-Effectiveness for L-ADR Assessment of the overall strength of evidence for formal economic analyses does not appear to be documented in the literature. As such, a summary of the primary results from these studies is provided below. L-ADR vs. Fusion Conclusions and Limitations No full economic studies specific to the evaluation of single level or 2-level L-ADR versus fusion were identified. Two moderate to high quality (QHES scores of 81/100 and 86/100) cost utility (CUA) analyses in patients receiving 1 or 2 level L-ADR for treatment of chronic low back pain secondary to degenerative disc disease were identified. Results across the two studies were mixed with regard to the cost-effectiveness of L-ADR versus fusion. A Swedish study examining both societal and healthcare perspectives,26 reported that although L-ADR was somewhat less costly (particularly when reoperation costs were excluded) differences between L-ADR and fusion in EQ-5D, ODI, VAS for pain or SF-36 were not significant suggesting L-ADR is as effective as fusion, thus an ICER is not meaningful.. Based on a net benefit approach, authors state that L-ADR could not be demonstrated to be cost-effective. The same findings for EQ-5D were reported in an Australian study, which used a healthcare perspective.60 Results from evaluation of other effectiveness outcomes suggest that L-ADR may be less costly. The ICER was dependent on which clinical outcome was chosen. Although L-ADR dominated fusion when overall clinical success and narcotic discontinuation were the outcomes, it was less costly but also less effective than fusion when ODI success was the outcome. One limitation of these studies is their applicability to practice in the United States; the medical systems, pricing and costs of care in the U.S. differ from those in Sweden and Australia. Both studies used data from RCTs that were considered to be at moderately high risk of bias. Neither study provided detail on sensitivity analyses, particularly related to the impact of factors that may be driving the results or major adverse events, even though both did account for re-operation. A general consensus in both studies and a common limitation noted, was the necessity for a longer follow-up period to better evaluate the impact of the treatments on factors that may impact need for future surgical intervention and productivity. L-ADR vs. Multidisciplinary Rehabilitation Conclusions and Limitations One high quality CUA (QHES 87/100) was based on an RCT comparing patients receiving 1 or 2 level L-ADR with multidisciplinary rehabilitation for treatment of chronic low back pain secondary to degenerative disc disease was identified.40 A societal perspective was employed. The cost effectiveness of L-ADR appears to be dependent on the utility measure used. Compared with multidisciplinary rehabilitation, L-ADR appears to be a cost effective alternative given a willingness to pay greater than $49,132 based on utilities derived from the EQ-5D. The probability of L-ADR being cost effective was 90% when this measure was used. By contrast, when SF-6D utilities were used, L-ADR no longer appeared to be cost effective and authors estimate that the chance of L-ADR being cost effective form a societal perspective was 40%, i.e. not cost effective. The primary limitation was failure to describe or incorporate information on potential adverse events for L-ADR in particular. In addition, the health care system in Norway and costs likely differ substantially

WA – Health Technology Assessment December 19, 2016
Artificial disc replacement – Re-review: Final evidence report ES - 28
from those in the U.S, possibly limiting the applicability of the findings to the U.S. system. The 24 month follow- up was considered to be short. Cervical Strength of Evidence Summary: C-ADR vs. ACDF (1-level) Efficacy Results
Outcome Follow-up RCTs N* Reasons for
Downgrading Conclusion* Quality
C-ADR vs. ACDF (1-level)
Overall success†
24 mos. 5 RCTs (Prestige ST, ProDisc-C, Bryan, SECURE-C, & PCM IDE trials)
N= 1681
Risk of bias1 (-1) Pooled RD 9.5% (95% CI 5.3%, 13.7%) Conclusion: C-ADR was superior to ACDF in terms of the percentage of patients who achieved overall success at 24 months.
⨁⨁⨁◯
MODERATE
48-60 mos.
3 RCTs (Mobi-C, Prestige ST, & Bryan IDE trials)
N= 933
Risk of bias1 (-1) Pooled RD 9.6% (95% CI 3.9%, 15.3%) Conclusion: C-ADR was superior to ACDF in terms of the percentage of patients who achieved overall success at 48 to 60 months.
⨁⨁⨁◯
MODERATE
84 mos. 1 RCT (Prestige ST IDE trial)
N= 933
Risk of bias1 (-1) Imprecision3 (-1)
RD 11.8% (95% CI 2.0%, 20.1%) Conclusion: C-ADR was superior to ACDF in terms of the percentage of patients who achieved overall success at 84 months.
⨁⨁◯◯
LOW
NDI success (≥15-point improvement)
24 mos. 5 RCTs (Prestige ST, ProDisc-C, Bryan, SECURE-C, & PCM IDE trials)
N= 1640
Risk of bias1 (-1) Pooled RD 4.3% (95% CI 0.6%, 8.1%) Conclusion: Slightly more C-ADR than ACDF patients achieved NDI success (≥15-point improvement from baseline) at 24 months.
⨁⨁⨁◯
MODERATE
48-60 mos.
3 RCTs (Mobi-C, Prestige ST, & Bryan IDE trials)
N= 933
Risk of bias1 (-1) Imprecision3 (-1)
Pooled RD 5.8% (95% CI -1.8%, 13.3%) Conclusion: C-ADR and ACDF appear to be comparable; no significant difference between groups.
⨁⨁◯◯
LOW
84 mos. 1 RCT (Prestige ST IDE trial)
N= 395
Risk of bias1 (-1) Imprecision3 (-1)
RD 3.2% (95% CI -4.5%, 10.8%) Conclusion: C-ADR and ACDF appear to be comparable; no significant difference between groups.
⨁⨁◯◯
LOW
NDI scores 24 mos. 9 RCTs N= Risk of bias1 (-1) WMD 1.11 (95% CI -0.06, 2.27) ⨁⨁⨁◯

WA – Health Technology Assessment December 19, 2016
Artificial disc replacement – Re-review: Final evidence report ES - 29
Outcome Follow-up RCTs N* Reasons for
Downgrading Conclusion* Quality
(0-100) (Prestige ST, ProDisc-C, Mobi-C, Bryan, PCM, & SECURE-C IDE trials; Karabag 2014; Zhang 2012; Zhang 2014)
2183 Conclusion: C-ADR may be comparable to ACDF in terms of mean NDI scores at 24 months; the difference between groups was not significant.
MODERATE
48-60 mos.
6 RCTs (ProDisc-C, Mobi-C, Bryan, Prestige ST, & PCM IDE trials; Zhang 2014)
N= 1443
Risk of bias1 (-1) WMD 4.21 (95% CI 1.67, 6.75) Conclusion: C-ADR patients had slightly higher NDI scores than did ACDF patients at 48 to 60 months, although the difference between groups is probably not clinically meaningful. Additionally, this effect appears to stem largely from three moderately high risk of bias trials, as the two moderately low risk of bias trials together suggest equivalence.
⨁⨁⨁◯
MODERATE
84 mos. 2 RCTs (ProDisc-C & Prestige ST IDE trials)
N= 544
Risk of bias1 (-1) Imprecision4 (-1)
WMD 4.41 (95% CI 0.68, 8.14) Conclusion: C-ADR conferred a slight benefit over ACDF in mean NDI scores, although the difference between groups is probably not clinically meaningful. Additionally, this effect appears to stem largely from the moderately high risk of bias trial, as the moderately low risk of bias trial found no difference between groups.
⨁⨁◯◯
LOW
Neurological success (maintenance/ improvement of motor function, sensory function, and deep tendon reflexes)
24 mos. 6 RCTs (Mobi-C, ProDisc-C, Prestige ST, Bryan, PCM, & SECURE-C IDE trials)
N= 1882
Risk of bias1 (-1) Pooled RD 3.2% (95% CI 0.8%, 5.7%) Conclusion: C-ADR may be slightly better than ACDF in terms of neurological success at 24 months.
⨁⨁⨁◯
MODERATE
48-60 mos.
4 RCTs (ProDisc-C, Bryan, Prestige ST, & PCM IDE trials)
N= 1147
Risk of bias1 (-1) Pooled RD 4.0% (95% CI 0.5%, 7.5%) Conclusion: C-ADR may be slightly better than ACDF in terms of neurological success at 48 to 60 months.
⨁⨁⨁◯
MODERATE
84 mos. 2 RCTs N= 531
Risk of bias1 (-1) Imprecision3 (-1)
Pooled RD 4.5% (95% CI -4.9%, 13.8%)
⨁⨁◯◯
LOW

WA – Health Technology Assessment December 19, 2016
Artificial disc replacement – Re-review: Final evidence report ES - 30
Outcome Follow-up RCTs N* Reasons for
Downgrading Conclusion* Quality
(ProDisc-C & Prestige ST IDE trials)
Conclusion: C-ADR and ACDF appear to be comparable; no significant difference between groups.
Arm pain success (≥20-point VAS improvement)
24 mos. 2 RCTs (SECURE-C & PCM IDE trials)
N= 578
Risk of bias1 (-1) Imprecision3 (-1)
Conclusion: Two trials each found no difference between groups in the percentage of patients who achieved arm pain success at 24 months:‡ • SECURE-C trial: RD 4.7% (95%
CI -7.9%, 17.4%) (left arm); RD -2.5% (95% CI -15.1%, 10.1%) (right arm)
• PCM trial: RD 3.8% (95% CI -5.2%, 12.8%) (worst arm)
⨁⨁◯◯
LOW
60 mos. 1 RCT (PCM IDE trial)
N= 288
Risk of bias1 (-1) Imprecision3 (-1)
RD 9.5% (95% CI -0.4%, 19.5%) Conclusion: C-ADR and ACDF appear to be comparable, no significant difference between groups.
⨁⨁◯◯
LOW
84 mos. No trials No data reported. ⨁◯◯◯
INSUFFICIENT Arm pain VAS scores (0-100)
24 mos. 7 RCTs (Prestige ST, ProDisc-C, Mobi-C, Bryan, PCM, & SECURE-C IDE trials; Zhang 2012)
N= 2015
Risk of bias1 (-1) WMD 1.60 (95% CI 0.51, 2.70) Conclusion: Arm pain VAS scores were slightly better with C-ADR versus ACDF; however, the difference between groups is probably not clinically meaningful. Two additional trials (Rozankovic 2016 (N=101), Nabhan 2007 (N=39)), reached similar conclusions but were not included in the pooled analysis.§
⨁⨁⨁◯
MODERATE
48-60 mos.
5 RCTs (ProDisc-C, Mobi-C, Bryan, Prestige ST, & PCM IDE trials)
N= 1332
Risk of bias1 (-1) WMD 3.82 (95% CI 1.15, 6.48) Conclusion: Arm pain VAS scores may be slightly better with C-ADR versus ACDF; however, the difference between groups is probably not clinically meaningful.
⨁⨁⨁◯
MODERATE
84 mos. 2 RCTs (ProDisc-C & Prestige ST IDE trials)
N= 543
Risk of bias1 (-1) Imprecision4 (-1)
WMD 2.21 (95% CI -2.08, 6.50) Conclusion: C-ADR and ACDF appear to be comparable; no significant difference between groups.
⨁⨁◯◯
LOW
Neck pain success
24 mos. 2 RCTs (SECURE-C & PCM IDE trials)
N= 578
Risk of bias1 (-1) Imprecision3 (-1)
Pooled RD 3.6% (95% CI -6.1%, 13.4%)
⨁⨁◯◯
LOW

WA – Health Technology Assessment December 19, 2016
Artificial disc replacement – Re-review: Final evidence report ES - 31
Outcome Follow-up RCTs N* Reasons for
Downgrading Conclusion* Quality
(≥20-point VAS improvement)
Conclusion: C-ADR and ACDF appear to be comparable; no significant difference between groups.
60 mos. 1 RCT (PCM IDE trial)
N= 288
Risk of bias1 (-1) Imprecision3 (-1)
-4.0% (95% CI -14.1%, 6.3% Conclusion: C-ADR and ACDF appear to be comparable; no significant difference between groups.
⨁⨁◯◯
LOW
84 mos. No trials No data reported. ⨁◯◯◯
INSUFFICIENT Neck pain VAS scores (0-100)
24 mos. 3 RCTs (Prestige ST, ProDisc-C, Mobi-C IDE trials)
N= 905
Risk of bias1 (-1) WMD 1.29 (95% CI -1.28, 3.86) Conclusion: C-ADR is as good as ACDF. For the three trials at moderately low risk of bias only, no difference was seen between groups. Six additional trials (Bryan, PCM, & SECURE-C IDE trials; Nabhan 2007; Rozankovic 2016; Zhang 2012) (N=1250) reported this outcome; however, the resulting pooled estimate, which favored C-ADR, had high statistical heterogeneity (I2=80%) (WMD 5.11 (95% CI 2.55, 7.66)).
⨁⨁⨁◯
MODERATE
48-60 mos.
5 RCTs (ProDisc-C, Mobi-C, Bryan, Prestige ST, & PCM IDE trials)
N= 1331
Risk of bias1 (-1) WMD 6.63 (95% CI 3.29, 9.97) Conclusion: C-ADR is as good as or slightly better than ACDF; C-ADR may confer a slight benefit over ACDF in mean NDI scores, although the difference between groups is most likely not clinically meaningful.
⨁⨁⨁◯
MODERATE
84 mos. 2 RCTs (ProDisc-C & Prestige ST IDE trials)
N= 543
Risk of bias1 (-1) Imprecision4 (-1)
WMD 5.59 (95% CI 1.31, 9.86) Conclusion: C-ADR is as good as or slightly better than ACDF; C-ADR may confer a slight a slight benefit over ACDF in terms of mean neck pain VAS scores, although the difference between groups is probably not clinically meaningful. Additionally, this effect appears to stem largely from the moderately high risk of bias trial, as the moderately low risk of
⨁⨁◯◯
LOW

WA – Health Technology Assessment December 19, 2016
Artificial disc replacement – Re-review: Final evidence report ES - 32
Outcome Follow-up RCTs N* Reasons for
Downgrading Conclusion* Quality
bias trial found no difference between groups.
* Unless otherwise specified, conclusion and patient numbers were based on completer analysis, for which the effect estimate was more conservative than that of the ITT analysis.
† Overall clinical success included the following components: • NDI score improvement ≥ 15 points (from baseline) • Maintenance or improvement in neurological status • No additional surgery from device failure (removal, revision, supplemental fixation) • No device-related adverse events and/or major complications • In addition, one trial required patients to achieve radiological success for motion (PCM trial); another stipulated no
changes to the treatment plan made intraoperatively (SECURE-C trial) ‡ Results could not be pooled due to differences in data reporting between the trials. § Two trials were excluded from the pooled analysis because their mean differences were both considerably different from
those reported by other trials and their inclusion led to high statistical heterogeneity Reasons for downgrading: 1. Serious risk of bias: the majority of studies violated one or more of the criteria for good quality RCT (or cohort study)
related to the outcome reported (see Appendix for details) 2. Inconsistency: differing estimates of effects across trials 3. Imprecise effect estimate for a dichotomous outcome: small sample size and/or confidence interval includes both
negligible effect and appreciable benefit or harm with ADR 4. Imprecise effect estimate for a continuous outcome: wide (or unknown) confidence interval and/or small sample size
Strength of Evidence Summary: C-ADR vs. ACDF (2-level) Efficacy Results
Outcome Follow-up RCTs N* Reasons for
Downgrading Conclusion* Quality
C-ADR vs. ACDF (2-level)
Overall success†
24 mos. 1 RCT (Mobi-C (2-level) ST IDE trial))
N= 320
Risk of bias1 (-1) RD 23.2% (95% CI 11.6%, 34.8%) Conclusion: C-ADR was superior to ACDF in terms of the percentage of patients who achieved overall success at 24 months.
⨁⨁⨁◯
MODERATE
60 mos. 1 RCT (Mobi-C (2-level) ST IDE trial))
N= 297
Risk of bias1 (-1) RD 29.6% (95% CI 18.1%, 41.2%) Conclusion: C-ADR was superior to ACDF in terms of the percentage of patients who achieved overall success at 60 months.
⨁⨁⨁◯
MODERATE
84 mos. No trials No data reported. ⨁◯◯◯
INSUFFICIENT NDI success‡ 24 mos. 1 RCT
(Mobi-C (2-level) ST IDE trial))
N= 320
Risk of bias1 (-1) RD 16.7% (95% CI 5.7%, 27.7%) Conclusion: C-ADR was superior to ACDF in terms of the percentage of patients who achieved NDI success at 24 months.
⨁⨁⨁◯
MODERATE
48 mos. 1 RCT N= Risk of bias1 (-1) RD 26.6% (95% CI 14.6%, 38.6%) ⨁⨁⨁◯

WA – Health Technology Assessment December 19, 2016
Artificial disc replacement – Re-review: Final evidence report ES - 33
Outcome Follow-up RCTs N* Reasons for
Downgrading Conclusion* Quality
(Mobi-C (2-level) ST IDE trial))
285 Conclusion: C-ADR was superior to ACDF in terms of the percentage of patients who achieved NDI success at 24 months.
MODERATE
84 mos. No trials No data reported. ⨁◯◯◯
INSUFFICIENT NDI scores 24 mos. 2 RCTs
(Mobi-C (2-level) ST IDE trial), Cheng 2009)
N= 353
Risk of bias1 (-1) Imprecision4 (-1)
Conclusion: C-ADR may be slightly better than ACDF in terms of NDI scores; both trials reported significantly better scores following C-ADR: one moderately low risk of bias trial (Mobi-C, N=291) (MD -7.5 (95% CI -12.0, -3.0)) and another moderately high risk of bias trial (Cheng 2009, N=62) (11 vs. 19, MD -8 (95% CI NR), p=0.02). Differences may not be clinically meaningful.
⨁⨁◯◯
LOW
60 mos. 1 RCT (Mobi-C (2-level) ST IDE trial))
N= 258
Risk of bias1 (-1) Imprecision4 (-1)
MD -9.6 (95% CI -14.6, -4.6) Conclusion: NDI scores may be slightly better with C-ADR versus ACDF; however, differences may not be clinically meaningful.
⨁⨁◯◯
LOW
84 mos. No trials No data reported. ⨁◯◯◯
INSUFFICIENT Neurological success (maintenance/ improvement of motor function, sensory function, and deep tendon reflexes)
24 mos. 1 RCT (Mobi-C (2-level) ST IDE trial))
N= 320
Risk of bias1 (-1) Imprecision3 (-1)
RD 1.6% (95% CI -4.2%, 7.5%) Conclusion: C-ADR and ACDF appear to be comparable; no significant difference between groups.
⨁⨁◯◯
LOW
60 mos. 1 RCT (Mobi-C (2-level) ST IDE trial))
N= 297
Risk of bias1 (-1) Imprecision3 (-1)
RD -2.4% (95% CI -8.7%, 4.0%) Conclusion: C-ADR and ACDF appear to be comparable; no significant difference between groups.
⨁⨁◯◯
LOW
84 mos. No trials No data reported. ⨁◯◯◯
INSUFFICIENT
Arm or neck pain success
Any No trials No data reported. ⨁◯◯◯
INSUFFICIENT
Arm pain VAS scores (0-100)
24 mos. 2 RCTs (Mobi-C (2-level) ST IDE trial), Cheng 2009)
N= 353
Risk of bias1 (-1) Imprecision4 (-1)
Conclusion: C-ADR is as good as or better than ACDF in terms of arm pain scores: while one moderately low risk of bias trial (Mobi-C, N=291) found no
⨁⨁◯◯
LOW

WA – Health Technology Assessment December 19, 2016
Artificial disc replacement – Re-review: Final evidence report ES - 34
Outcome Follow-up RCTs N* Reasons for
Downgrading Conclusion* Quality
difference between groups (MD -4.3 (95% CI -9.5, 0.9)), another moderately high risk of bias trial (Cheng 2009, N=62) found better scores with C-ADR than with ACDF (14 vs. 27, MD -13 (95% CI NR), p=0.01). Differences may not be clinically meaningful.
48 mos. 1 RCT (Mobi-C (2-level) ST IDE trial))
N= 255
Risk of bias1 (-1) Imprecision4 (-1)
MD in ∆ scores: -3.0 (95% CI -11.6, 5.6) Conclusion: C-ADR and ACDF appear to be comparable; no significant difference between groups.
⨁⨁◯◯
LOW
84 mos. No trials No data reported. ⨁◯◯◯
INSUFFICIENT
Neck pain VAS scores (0-100)
24 mos. 2 RCTs (Mobi-C (2-level) ST IDE trial), Cheng 2009)
N= 353
Risk of bias1 (-1) Imprecision4 (-1)
Conclusion: C-ADR is as good as or slightly better than ACDF in terms of neck pain scores: while one moderately low risk of bias trial (Mobi-C, N=291) found no difference between groups (MD -3.9 (95% CI -10.1, 2.3)), another moderately high risk of bias trial (Cheng 2009, N=62) reported better scores with C-ADR than with ACDF (15 vs. 26, MD -11 (95% CI NR), p=0.01). Differences may not be clinically meaningful
⨁⨁◯◯
LOW
48 mos. 1 RCT (Mobi-C (2-level) ST IDE trial))
N= 255
Risk of bias1 (-1) Imprecision4 (-1)
MD in ∆ scores: -5.0 (95% CI -13.3, 3.3) Conclusion: C-ADR and ACDF appear to be comparable; no significant difference between groups.
⨁⨁◯◯
LOW
84 mos. No trials No data reported. ⨁◯◯◯
INSUFFICIENT * Unless otherwise specified, conclusion and patient numbers were based on completer analysis, for which the effect estimate
was more conservative than that of the ITT analysis. † Overall clinical success required all of the following:
• NDI improvement of at least 15 points (out of 50) from baseline • Maintenance or improvement in all components of neurological status • No subsequent surgical intervention at the index level or levels; • No potentially (possibly or probably) device-related adverse event; • No Mobi-C intraoperative changes in treatment.

WA – Health Technology Assessment December 19, 2016
Artificial disc replacement – Re-review: Final evidence report ES - 35
‡ NDI success was defined as postoperative ≥30-point improvement on the NDI if the baseline score was ≥60, or ≥50% improvement if the baseline score was <60. Reasons for downgrading: 1. Serious risk of bias: the majority of studies violated one or more of the criteria for good quality RCT (or cohort study)
related to the outcome reported (see Appendix for details) 2. Inconsistency: differing estimates of effects across trials 3. Imprecise effect estimate for a dichotomous outcome: small sample size and/or confidence interval includes both
negligible effect and appreciable benefit or harm with ADR 4. Imprecise effect estimate for a continuous outcome: wide (or unknown) confidence interval and/or small sample size. Strength of Evidence Summary: C-ADR vs. ACDF (Mixed levels (1-, 2-, or 3-level)) Efficacy Results
Outcome Follow-up RCTs N* Reasons for
Downgrading Conclusion* Quality
C-ADR vs. ACDF (Mixed levels (1-, 2-, or 3-level))
Overall, NDI, or neurological success
Any No trials No data reported. ⨁◯◯◯
INSUFFICIENT
NDI scores 24 mos. 1 RCT (Skeppholm 2015)
N= 143
Risk of bias1 (-1) Imprecision4 (-1)
MD -1.0 (95% CI -7.4, 5.4) Conclusion: C-ADR and ACDF appear to be comparable .No significant difference between groups in one trial of radiculopathy patients.
⨁⨁◯◯
LOW
24-36 mos.
1 RCT (Cheng 2011)
N= 81
Risk of bias1 (-1) Imprecision4 (-1)
Conclusion: C-ADR is as good as or slightly better. One trial of myelopathy patients reported better scores with C-ADR than with ACDF at 24 months (13 vs. 16, MD -3 (95% CI NR), p=0.01) and 36 months (12 vs. 17, MD -5 (95% CI NR), p<0.01), although this difference is not likely to be clinically meaningful.
⨁⨁◯◯
LOW
48-60 or 84 mos.
No trials No data reported. ⨁◯◯◯
INSUFFICIENT
Arm or neck pain success
Any No trials No data reported. ⨁◯◯◯
INSUFFICIENT
Arm pain VAS scores (0-100)
24 mos. 1 RCT (Skeppholm 2015)
N= 143
Risk of bias1 (-1) Imprecision4 (-1)
MD 0.4 (95% CI -7.7, 8.5) Conclusion: C-ADR and ACDF appear to be comparable. No significant difference between groups.
⨁⨁◯◯
LOW
48-60, 84 mos.
No trials No data reported. ⨁◯◯◯
INSUFFICIENT Arm pain VAS scores
24 mos. 1 RCT (Skeppholm 2015)
N= 143
Risk of bias1 (-1) Imprecision4 (-1)
MD -1.2 (95% CI -9.9, 7.5) ⨁⨁◯◯
LOW

WA – Health Technology Assessment December 19, 2016
Artificial disc replacement – Re-review: Final evidence report ES - 36
Outcome Follow-up RCTs N* Reasons for
Downgrading Conclusion* Quality
(0-100)
Conclusion: C-ADR and ACDF appear to be comparable. No significant difference between groups.
48-60, 84 mos.
No trials No data reported. ⨁◯◯◯
INSUFFICIENT * Unless otherwise specified, conclusion and patient numbers were based on completer analysis, for which the effect estimate
was more conservative than that of the ITT analysis. Reasons for downgrading: 1. Serious risk of bias: the majority of studies violated one or more of the criteria for good quality RCT (or cohort study)
related to the outcome reported (see Appendix for details) 2. Inconsistency: differing estimates of effects across trials 3. Imprecise effect estimate for a dichotomous outcome: small sample size and/or confidence interval includes both
negligible effect and appreciable benefit or harm with ADR 4. Imprecise effect estimate for a continuous outcome: wide (or unknown) confidence interval and/or small sample size Strength of Evidence Summary: C-ADR vs. ACDF with a zero-profile device (2 non-contiguous levels) Efficacy Results
Outcome Follow-up RCTs N* Reasons for
Downgrading Conclusion* Quality
C-ADR vs. ACDF with a zero-profile device (2 non-contiguous levels)
Overall, NDI, or neurological success
Any No trials No data reported. ⨁◯◯◯
INSUFFICIENT
NDI scores Mean 32.4 (24-46) mos.
1 RCT (Qizhi 2016)
N= 30
Risk of bias1 (-1) Imprecision4 (-1)
MD 0.3 (95% CI -0.4, 1.0) Conclusion: C-ADR and ACDF appear to be comparable. No significant difference between groups possibly due in part to small sample size.
⨁⨁◯◯
LOW
Arm or neck pain success or scores
Any No trials No data reported. ⨁◯◯◯
INSUFFICIENT
* Unless otherwise specified, conclusion and patient numbers were based on completer analysis, for which the effect estimate was more conservative than that of the ITT analysis.
Reasons for downgrading: 1. Serious risk of bias: the majority of studies violated one or more of the criteria for good quality RCT (or cohort study)
related to the outcome reported (see Appendix for details) 2. Inconsistency: differing estimates of effects across trials 3. Imprecise effect estimate for a dichotomous outcome: small sample size and/or confidence interval includes both
negligible effect and appreciable benefit or harm with ADR 4. Imprecise effect estimate for a continuous outcome: wide (or unknown) confidence interval and/or small sample size

WA – Health Technology Assessment December 19, 2016
Artificial disc replacement – Re-review: Final evidence report ES - 37
Strength of Evidence Summary: C-ADR vs. ACDF (1-level) Safety Results
Outcome Follow-up RCTs N* Reasons for
Downgrading Conclusion* Quality
C-ADR vs. ACDF (1-level)
Secondary surgery at the index level
24 mos. 8 RCTs (Prestige ST, Mobi-C, ProDisc-C, Bryan, PCM, & SECURE-C IDE trials; Karabag 2014; Rozankovic 2016)
N= 2299
Risk of bias1 (-1)
C-ADR 2.9%, ACDF 6.2% Pooled RD 3.1% (95% CI 1.1%, 5.1%) Conclusion: Fewer patients in the C-ADR group underwent secondary surgery at the index level through 24 months compared with those in the ACDF group.
⨁⨁⨁◯
MODERATE
48-60 mos.
4 RCTs (Mobi-C, ProDisc-C, Bryan, & PCM IDE trials)
N= 1335
Risk of bias1 (-1) Imprecision3 (-1)
C-ADR 4.6%, ACDF 9.3% Pooled RD 4.8% (95% CI 0.8%, 8.8%) Conclusion: Fewer patients in the C-ADR group underwent secondary surgery at the index level through 48 or 60 months compared with those in the ACDF group.
⨁⨁◯◯
LOW
84 mos. 2 RCTs (ProDisc-C & Prestige ST IDE trials)
N= 750
Risk of bias1 (-1) Imprecision3 (-1)
C-ADR 4.5%, ACDF 12.1% RD 7.5% (95% CI 3.6%, 11.4%) Conclusion: C-ADR was superior to ACDF in terms of the percentage of patients who underwent secondary surgery at the index level through 84 months.
⨁⨁◯◯
LOW
Serious/ major adverse events* (as classified by the trial)
24 mos. 5 RCTs (Prestige ST, ProDisc-C, Bryan, SECURE-C, & PCM IDE trials)
N= 2388
Risk of bias1 (-1) Imprecision3 (-1)
C-ADR 24.3%, ACDF 31.0% Pooled RD 6.8% (95% CI 2.0%, 11.6%) Conclusion: Slightly fewer C-ADR than ACDF patients had serious adverse events (as classified by the trial) through at 24 months.
⨁⨁◯◯
LOW
24-48 mos.
1 RCT (Bryan ST IDE trial)
N= 463
Risk of bias1 (-1) Imprecision3 (-1)
C-ADR 17.4%, ACDF 17.1% RD -0.3% (95% CI -7.2%, 6.7%) Conclusion: No significant difference between groups.
⨁⨁◯◯
LOW
0-48 mos.
1 RCT (Mobi-C IDE trial)
N= 260
Risk of bias1 (-1) Imprecision3 (-1)
C-ADR 10.1%, ACDF 9.9% RD -0.2% (95% CI -8.0%, 7.7%) Conclusion: No significant difference between groups.
⨁⨁◯◯
LOW
24-84 mos.
1 RCT (PCM ST IDE trial)
N= 404
Risk of bias1 (-1) Imprecision3 (-1)
C-ADR 21.0%, ACDF 17.4% RD -3.7% (95% CI -11.3%, 4.0%)
⨁⨁◯◯
LOW

WA – Health Technology Assessment December 19, 2016
Artificial disc replacement – Re-review: Final evidence report ES - 38
Outcome Follow-up RCTs N* Reasons for
Downgrading Conclusion* Quality
Conclusion: No significant difference between groups.
Device-related adverse events† (as classified by the trial)
24 mos. 6 RCTs (Prestige ST, ProDisc-C, Mobi-C, Bryan, PCM, & SECURE-C IDE trials)
N= 2167
Risk of bias1 (-1)
C-ADR 4.9%, ACDF 10.8% Pooled RD 5.0% (95% CI 2.7%, 7.4%) Conclusion: Device-related adverse events (as classified by the trial) were less common with C-ADR than ACDF through at 24 months.
⨁⨁⨁◯
MODERATE
60 mos. 2 RCTs (Mobi-C & ProDisc-C IDE trials)
N= 469
Risk of bias1 (-1)
C-ADR 3.9%, ACDF 3.2% Pooled RD 0.4% (95% CI -3.4%, 4.3%) Conclusion: No significant difference between groups.
⨁⨁⨁◯
MODERATE
84 mos. 1 RCT (ProDisc-C IDE trial)
N= 209
Risk of bias1 (-1) Imprecision3 (-1)
C-ADR 27.2%, ACDF 28.3% RD 1.1% (95% CI -11.0%, 13.3%) Conclusion: No significant difference between groups.
⨁⨁◯◯
LOW
* Defined as: • Bryan IDE trial: Most serious adverse events were related to medical conditions and not to the procedure, implant, or
cervical spine disease. Classified as WHO grade 3 or 4 (taken from Anderson 2008) (grade 3 events required medical treatment or may have had a long-term health effect; grade 4 events required an operation, were life threatening, permanent disability, or caused death).
• PCM IDE trial: any event that results in death, serious injury, permanent impairment; or that prolongs hospitalization or requires surgical intervention to prevent death or serious injury; classified by the Clinical Events Committee.
• Mobi-C IDE trial: any event that results in death, serious injury, permanent impairment; or that prolongs hospitalization or requires surgical intervention to prevent death or serious injury; or that was a congenital anomaly or birth defect; classified by the Clinical Events Committee.
• ProDisc-C IDE trial: “Severe or life-threatening adverse event”: defined as any event requiring hospitalization or surgery (see SSED Table 18).
• Secure-C IDE trial: “Severe or life-threatening adverse event”: a severe event was defined as any event that significantly limits the patient’s ability to perform routine activities despite symptomatic therapy; a life-threatening event was defined as any event that required removal of the implant or put the patient at immediate risk of death (including death) (see SSED Table 19).
† Defined as: • Prestige ST IDE trial: events included anatomical/technical difficulty, implant displacement/loosening, infection, neck
and/or arm pain, neurological, non-union, pending non-union, and subsidence. • Bryan IDE trial: events included malpositioned implant, neck and/or arm pain, non-union, other, pending non-union,
spinal event, and trauma. • Mobi-C IDE trial: events included spinal ligament ossification, neck pain, muscle spasms, radiculopathy, subsidence,
medical device complication, misplaced screw coded as device complication. • ProDisc-C IDE trial (0-24 months): events included dysphagia, superficial wound infection, musculoskeletal, neck pain,
and index-level surgery. • ProDisc-C IDE trial (0-84 months): adjacent-level degenerative disc disease or degenerative joint changes,
cardiovascular, dysphagia, headache, musculoskeletal, musculoskeletal neck spasms, neurologic, numbness, ossification, other, back and lower extremity pain, incision site pain, neck pain, neck and other pain, neck and shoulder pain, neck and upper extremity pain, neck and upper extremity pain with numbness, surgery for device related events (index or other level), wound issues.

WA – Health Technology Assessment December 19, 2016
Artificial disc replacement – Re-review: Final evidence report ES - 39
• Secure-C IDE trial: device-related adverse events were classified by the Clinical Events Committee and included those events that were linked to the device (revision, removal, reoperation, or supplemental fixation at the index level; fracture or mechanical failure of the device, pseudarthrosis, radiolucency around the device, migration, subsidence, loosening, etc. Neck and arm pain were excluded from this category of adverse events.
• Riina 2008: not defined Reasons for downgrading: 1. Serious risk of bias: the majority of studies violated one or more of the criteria for good quality RCT (or cohort study)
related to the outcome reported (see Appendix for details) 2. Inconsistency: differing estimates of effects across trials 3. Imprecise effect estimate for a dichotomous outcome: small sample size and/or confidence interval includes both
negligible effect and appreciable benefit or harm with ADR. If sample size is likely too small to detect rare outcomes, evidence may be downgraded twice.
Strength of Evidence Summary: C-ADR vs. ACDF (2-level) Safety Results
Outcome Follow-up RCTs N* Reasons for
Downgrading Conclusion* Quality
C-ADR vs. ACDF (2-level)
Secondary surgery at the index level
24 mos. 1 RCT (Mobi-C (2-level) IDE trial)
N= 330
Risk of bias1 (-1) Imprecision3 (-1)
C-ADR 3.1%, ACDF 11.4% RD -8.3% (95% CI -14.8%, -1.8%) Conclusion: Secondary surgery at the index level was performed in fewer C-ADR than ACDF patients through 24 months.
⨁⨁◯◯
LOW
60 mos. 1 RCT (Mobi-C (2-level) IDE trial)
N= 339
Risk of bias1 (-1) Imprecision3 (-1)
C-ADR 4.7%, ACDF 12.4% RD -7.7% (95% CI -14.5%, -0.8%) Conclusion: Fewer patients in the C-ADR group underwent secondary surgery at the index level through 60 months compared with those in the ACDF group.
⨁⨁◯◯
LOW
84 mos. No trials No data reported. ⨁◯◯◯
INSUFFICIENT Serious/ major adverse events* (as classified by the trial)
24 mos. 1 RCT (Mobi-C (2-level) IDE trial)
N= 330
Risk of bias1 (-1) Imprecision3 (-1)
C-ADR 24.4%, ACDF 32.4% RD -7.9% (95% CI -18.5%, 2.6%) Conclusion: Device-related adverse events (as classified by the trial) were less common with C-ADR than ACDF through at 24 months.
⨁⨁◯◯
LOW
48-60 mos.
No trials No data reported. ⨁◯◯◯
INSUFFICIENT
84 mos. No trials No data reported. ⨁◯◯◯
INSUFFICIENT Device-related adverse
24 mos. 1 RCT (Mobi-C (2-level) IDE trial)
N= 330
Risk of bias1 (-1) Imprecision3 (-1)
C-ADR 16.0%, ACDF 34.3% RD -18.3% (95% CI -28.6%, -8.0%)
⨁⨁◯◯
LOW

WA – Health Technology Assessment December 19, 2016
Artificial disc replacement – Re-review: Final evidence report ES - 40
Outcome Follow-up RCTs N* Reasons for
Downgrading Conclusion* Quality
events† (as classified by the trial)
Conclusion: Device-related adverse events (as classified by the trial) were less common with C-ADR than ACDF through at 24 months.
48-60 mos.
No trials No data reported. ⨁◯◯◯
INSUFFICIENT
84 mos. No trials No data reported. ⨁◯◯◯
INSUFFICIENT * Classified by the Clinical Events Committee as possibly or definitely related to the device, and included anatomy/technical
difficulty, dysphagia/dysphonia, gastrointestinal, heterotopic ossification, malpositioned implant, neck and/or arm pain, neurological, non-union, other, other pain, respiratory, spinal disorder, trauma.
† Serious adverse events met one or more of the following criteria: 1) resulted in death; 2) was life-threatening (immediate risk of death); 3) required inpatient hospitalization or prolonged hospitalization; 4) resulted in persistent or significant disability or incapacity; 5) necessitated medical or surgical intervention to preclude permanent impairment of a body function or permanent damage to a body structure; or 6) was a congenital anomaly or birth defect. Reported events included: anatomy/technical difficulty, cancer, cardiovascular, death, dysphagia/dysphonia, gastrointestinal, infection (systemic or local), malpositioned implant, migration of implant, neck and/or arm pain, neurological, non-union, other, other pain, respiratory, spinal disorder, trauma, upper extremity nerve entrapment, urogenital, non-infectious wound issue (hematoma, CSF leakage).
Reasons for downgrading: 1. Serious risk of bias: the majority of studies violated one or more of the criteria for good quality RCT (or cohort study)
related to the outcome reported (see Appendix for details) 2. Inconsistency: differing estimates of effects across trials 3. Imprecise effect estimate for a dichotomous outcome: small sample size and/or confidence interval includes both
negligible effect and appreciable benefit or harm with ADR. If sample size is likely too small to detect rare outcomes, evidence may be downgraded twice.
Strength of Evidence Summary: C-ADR vs. ACDF (Mixed level (1-, 2-, or 3-level) Safety Results
Outcome Follow-up RCTs N* Reasons for
Downgrading Conclusion* Quality
C-ADR vs. ACDF (Mixed level (1-, 2-, or 3-level)
Secondary surgery at the index level
24-36 mos.
2 RCTs (Skeppholm 2015, Cheng 2011)
N= 234
Risk of bias1 (-1) Imprecision3 (-1)
24 mos. (N=151): C-ADR 6.2%, ACDF 1.4% RD 4.7% (95% CI -1.2%,
10.7%) 36 mos. (N=83):
C-ADR 0%, ACDF 0% RD 0% (95% CI not calculable)
Conclusion: No significant difference between groups.
⨁⨁◯◯
LOW
48-60 mos.
No trials No data reported. ⨁◯◯◯
INSUFFICIENT 84 mos. No trials No data reported. ⨁◯◯◯
INSUFFICIENT

WA – Health Technology Assessment December 19, 2016
Artificial disc replacement – Re-review: Final evidence report ES - 41
Outcome Follow-up RCTs N* Reasons for
Downgrading Conclusion* Quality
Serious/ major adverse events
24-36 mos.
2 RCTs (Skeppholm 2015, Cheng 2011)
N= 234
Risk of bias1 (-1) Imprecision3 (-1)
Conclusion: No serious adverse events were reported by either trial.
⨁⨁◯◯
LOW
48-60 mos.
No trials No data reported. ⨁◯◯◯
INSUFFICIENT 84 mos. No trials No data reported. ⨁◯◯◯
INSUFFICIENT Device-related adverse events
24-36 mos.
2 RCTs (Skeppholm 2015, Cheng 2011)
N= 234
Risk of bias1 (-1) Imprecision3 (-1)
Conclusion: No overall summary of device-related adverse events was reported by either trial. With the exception of dysphagia, which was less common in the C-ADR group than in the ACDF group (Skeppholm: 11.8% vs. 19.9% through 24 months, p=0.31; Cheng 2011: 2.4% vs. 16.7% through 36 months, p<0.01), complications attributable to the device occurred similarly between groups, and occurred in relatively few patients (0-2.4% of the C-ADR group; 0% in the ACDF group) across both trials.
⨁⨁◯◯
LOW
48-60 mos.
No trials No data reported. ⨁◯◯◯
INSUFFICIENT
84 mos. No trials No data reported. ⨁◯◯◯
INSUFFICIENT Reasons for downgrading: 1. Serious risk of bias: the majority of studies violated one or more of the criteria for good quality RCT (or cohort study)
related to the outcome reported (see Appendix for details) 2. Inconsistency: differing estimates of effects across trials 3. Imprecise effect estimate for a dichotomous outcome: small sample size and/or confidence interval includes both
negligible effect and appreciable benefit or harm with ADR. If sample size is likely too small to detect rare outcomes, evidence may be downgraded twice.

WA – Health Technology Assessment December 19, 2016
Artificial disc replacement – Re-review: Final evidence report ES - 42
Strength of Evidence Summary: C-ADR vs. ACDF with a zero-profile device (2 non-contiguous levels) Safety Results
Outcome Follow-up RCTs N* Reasons for
Downgrading Conclusion* Quality
C-ADR vs. ACDF with a zero-profile device (2 non-contiguous levels)
Secondary surgery at the index level
Any No data reported. ⨁◯◯◯
INSUFFICIENT
Serious/ major adverse events
Mean 32.4 (24-46) mos.
1 RCT (Qizhi 2016)
N=30 Risk of bias1 (-1) Imprecision3 (-2)
Conclusion: No serious adverse events were reported.
⨁◯◯◯
INSUFFICIENT
Device-related adverse events
Mean 32.4 (24-46) mos.
1 RCT (Qizhi 2016)
N=30 Risk of bias1 (-1) Imprecision3 (-2)
Conclusion: All events that could be attributed to the device occurred similarly between groups, but no summary of device-related adverse events was reported.
⨁◯◯◯
INSUFFICIENT
Reasons for downgrading: 1. Serious risk of bias: the majority of studies violated one or more of the criteria for good quality RCT (or cohort study)
related to the outcome reported (see Appendix for details) 2. Inconsistency: differing estimates of effects across trials 3. Imprecise effect estimate for a dichotomous outcome: small sample size and/or confidence interval includes both
negligible effect and appreciable benefit or harm with ADR. If sample size is likely too small to detect rare outcomes, evidence may be downgraded twice.
Strength of Evidence Summary: Differential Efficacy and Safety Results for C-ADR
Outcome Follow-up RCTs N* Reasons for
Downgrading Conclusion Quality
C-ADR vs. ACDF
Any Any No studies were identified which stratified on patient characteristics or evaluated effect modification.
⨁◯◯◯
INSUFFICIENT

WA – Health Technology Assessment December 19, 2016
Artificial disc replacement – Re-review: Final evidence report ES - 43
Strength of Evidence Summary: Cost-Effectiveness for C-ADR Assessment of the overall strength of evidence for formal economic analyses does not appear to be documented in the literature. As such, a summary of the primary results from these studies is provided below. C-ADR vs. Fusion 1-level Conclusions and Limitations Overall, results from four CUAs found that both C-ADR and ACDF were cost effective options based on a WTP threshold of $50,000.46,51,67,69 However, C-ADR was more effective and less costly than ACDF for 1-level disc procedures. One study found ACD (without fusion) to be the dominant intervention, which outperformed both C-ADR and ACDF. A general consensus in many of the studies and a common limitation noted was the necessity for a longer follow-up period. The complicated nature of estimating some of the necessary effectiveness and cost variables resulted in what some authors admit to be overly simplistic assumptions, particularly in terms of arriving at utility values for health states and/or determining greater encompassing health state possibilities. QHES scores ranged from 62 to 91. C-ADR vs. Fusion 2-level Conclusions and Limitations Two studies assuming a U.S. societal perspective were identified.1,2 Both were conducted by the same author and used many of the same assumptions. Based on a WTP threshold of $50,000/QALY, C-ADR was cost-effective when compared to ACDF for 2-level degenerative disc disease with radiculopathy or myelopathy that had not responded to six weeks of conservative care. Given the parallels between the two studies, the 60-month cost-effectiveness of C-ADR was shown to be even more dramatic than in the previous 24-month study. The notably large difference between the societal (includes direct and indirect costs) and healthcare (includes direct costs only) perspective ICERs (-$165,103 and $8518, respectively) was credited to the differences in 60-month productivity loss for C-ADR versus ACDF ($57,447 vs. $91,824, respectively), which was the result of different return to work rates for C-ADR versus ACDF (80.6% vs. 65.4%, respectively, at 24 months). To reconcile the large difference between the studies of different follow-up time, the authors suggest the greater QALYs and reduced cost as well as more realistic return to work data are the key driving factors. While both studies received high QHES scores (100/00) there were inherent limitations relating to time horizon (noting the significant difference in the two studies given the different follow-up) as well as availability of complete cost information- operating times and length of hospitalization were not captured. A variety of sensitivity measures were undertaken to address concerns stemming from the inherent limitations.

WA – Health Technology Assessment December 19, 2016
Artificial disc replacement – Re-review: Final evidence report ES - 44
References 1. Ament JD, Yang Z, Nunley P, Stone MB, Kim KD. Cost-effectiveness of cervical total disc replacement vs fusion for the treatment of 2-level symptomatic degenerative disc disease. JAMA surgery 2014;149:1231-9. 2. Ament JD, Yang Z, Nunley P, Stone MB, Lee D, Kim KD. Cost Utility Analysis of the Cervical Artificial Disc vs Fusion for the Treatment of 2-Level Symptomatic Degenerative Disc Disease: 5-Year Follow-up. Neurosurgery 2016. 3. An HS, Anderson PA, Haughton VM, et al. Introduction: disc degeneration: summary. Spine 2004;29:2677-8. 4. Anderson PA, Sasso RC, Riew KD. Comparison of adverse events between the Bryan artificial cervical disc and anterior cervical arthrodesis. Spine 2008;33:1305-12. 5. Berg S, Fritzell P, Tropp H. Sex life and sexual function in men and women before and after total disc replacement compared with posterior lumbar fusion. The spine journal : official journal of the North American Spine Society 2009;9:987-94. 6. Berg S, Tropp H. Results from a randomized controlled study between total disc replacement and fusion compared with results from a spine register. SAS journal 2010;4:68-74. 7. Berg S, Tullberg T, Branth B, Olerud C, Tropp H. Total disc replacement compared to lumbar fusion: a randomised controlled trial with 2-year follow-up. European spine journal : official publication of the European Spine Society, the European Spinal Deformity Society, and the European Section of the Cervical Spine Research Society 2009;18:1512-9. 8. Blue Cross Blue Shield Association. Artificial Intervertebral Disc Arthroplasty for Treatment of Degenerative Disc Disease of the Cervical Spine. Technology Evaluation Center, Assessment Program. Volume 28, No. 13. April 2014. 9. Blue Cross Blue Shield Association. Artificial Lumbar Disc Arthroplasty. Technology Evaluation Center, Assessment Program. Volume 28, No. 7. January 2014. 10. Blumenthal S, McAfee PC, Guyer RD, et al. A prospective, randomized, multicenter Food and Drug Administration investigational device exemptions study of lumbar total disc replacement with the CHARITE artificial disc versus lumbar fusion: part I: evaluation of clinical outcomes. Spine 2005;30:1565-75; discussion E387-91. 11. Buchbinder R, Blyth FM, March LM, Brooks P, Woolf AD, Hoy DG. Placing the global burden of low back pain in context. Best practice & research Clinical rheumatology 2013;27:575-89. 12. Burkus JK, Haid RW, Traynelis VC, Mummaneni PV. Long-term clinical and radiographic outcomes of cervical disc replacement with the Prestige disc: results from a prospective randomized controlled clinical trial. Journal of neurosurgery Spine 2010;13:308-18. 13. Burkus JK, Traynelis VC, Haid RW, Jr., Mummaneni PV. Clinical and radiographic analysis of an artificial cervical disc: 7-year follow-up from the Prestige prospective randomized controlled clinical trial: Clinical article. Journal of neurosurgery Spine 2014;21:516-28. 14. Cappelletto B, Giorgiutti F, Veltri C, Trevigne MA, Facchin P, Del Fabro P. Disc prosthesis replacement and interbody fusion in the treatment of degenerative cervical disc disease: comparative analysis of 176 consecutive cases. European spine journal : official publication of the European Spine Society, the European Spinal Deformity Society, and the European Section of the Cervical Spine Research Society 2013;22 Suppl 6:S894-9. 15. Carroll LJ, Hogg-Johnson S, Cote P, et al. Course and prognostic factors for neck pain in workers: results of the Bone and Joint Decade 2000-2010 Task Force on Neck Pain and Its Associated Disorders. Spine 2008;33:S93-100.
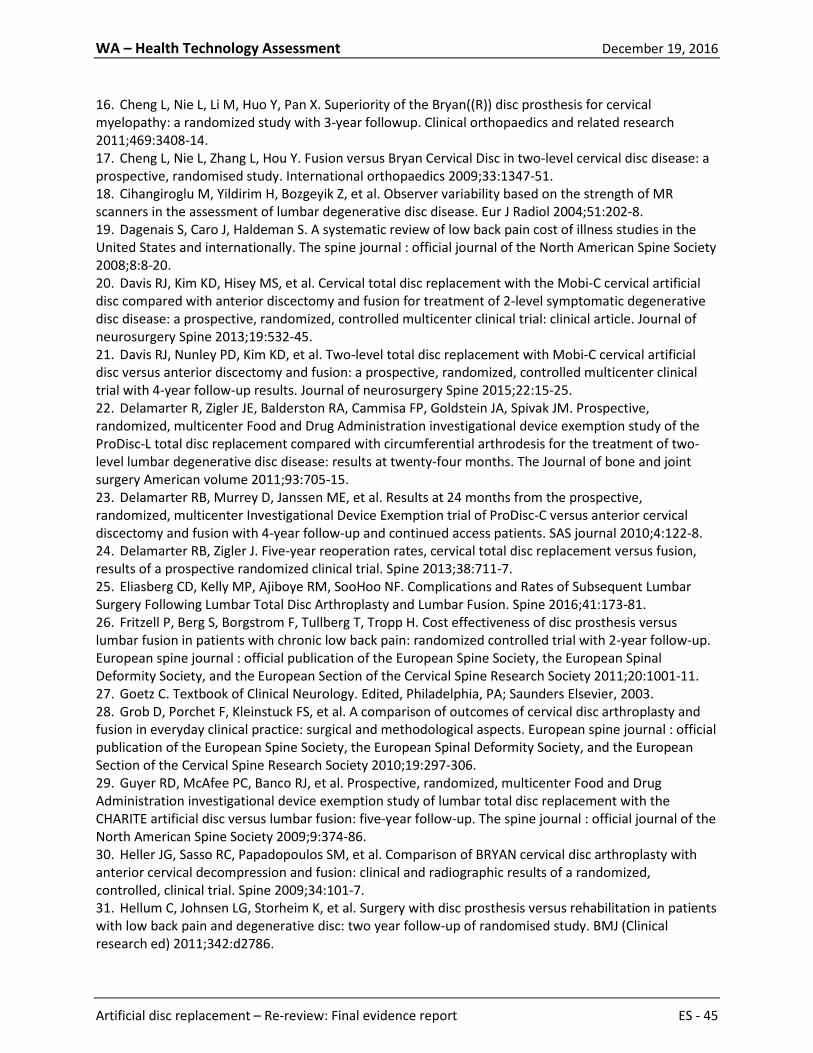
WA – Health Technology Assessment December 19, 2016
Artificial disc replacement – Re-review: Final evidence report ES - 45
16. Cheng L, Nie L, Li M, Huo Y, Pan X. Superiority of the Bryan((R)) disc prosthesis for cervical myelopathy: a randomized study with 3-year followup. Clinical orthopaedics and related research 2011;469:3408-14. 17. Cheng L, Nie L, Zhang L, Hou Y. Fusion versus Bryan Cervical Disc in two-level cervical disc disease: a prospective, randomised study. International orthopaedics 2009;33:1347-51. 18. Cihangiroglu M, Yildirim H, Bozgeyik Z, et al. Observer variability based on the strength of MR scanners in the assessment of lumbar degenerative disc disease. Eur J Radiol 2004;51:202-8. 19. Dagenais S, Caro J, Haldeman S. A systematic review of low back pain cost of illness studies in the United States and internationally. The spine journal : official journal of the North American Spine Society 2008;8:8-20. 20. Davis RJ, Kim KD, Hisey MS, et al. Cervical total disc replacement with the Mobi-C cervical artificial disc compared with anterior discectomy and fusion for treatment of 2-level symptomatic degenerative disc disease: a prospective, randomized, controlled multicenter clinical trial: clinical article. Journal of neurosurgery Spine 2013;19:532-45. 21. Davis RJ, Nunley PD, Kim KD, et al. Two-level total disc replacement with Mobi-C cervical artificial disc versus anterior discectomy and fusion: a prospective, randomized, controlled multicenter clinical trial with 4-year follow-up results. Journal of neurosurgery Spine 2015;22:15-25. 22. Delamarter R, Zigler JE, Balderston RA, Cammisa FP, Goldstein JA, Spivak JM. Prospective, randomized, multicenter Food and Drug Administration investigational device exemption study of the ProDisc-L total disc replacement compared with circumferential arthrodesis for the treatment of two-level lumbar degenerative disc disease: results at twenty-four months. The Journal of bone and joint surgery American volume 2011;93:705-15. 23. Delamarter RB, Murrey D, Janssen ME, et al. Results at 24 months from the prospective, randomized, multicenter Investigational Device Exemption trial of ProDisc-C versus anterior cervical discectomy and fusion with 4-year follow-up and continued access patients. SAS journal 2010;4:122-8. 24. Delamarter RB, Zigler J. Five-year reoperation rates, cervical total disc replacement versus fusion, results of a prospective randomized clinical trial. Spine 2013;38:711-7. 25. Eliasberg CD, Kelly MP, Ajiboye RM, SooHoo NF. Complications and Rates of Subsequent Lumbar Surgery Following Lumbar Total Disc Arthroplasty and Lumbar Fusion. Spine 2016;41:173-81. 26. Fritzell P, Berg S, Borgstrom F, Tullberg T, Tropp H. Cost effectiveness of disc prosthesis versus lumbar fusion in patients with chronic low back pain: randomized controlled trial with 2-year follow-up. European spine journal : official publication of the European Spine Society, the European Spinal Deformity Society, and the European Section of the Cervical Spine Research Society 2011;20:1001-11. 27. Goetz C. Textbook of Clinical Neurology. Edited, Philadelphia, PA; Saunders Elsevier, 2003. 28. Grob D, Porchet F, Kleinstuck FS, et al. A comparison of outcomes of cervical disc arthroplasty and fusion in everyday clinical practice: surgical and methodological aspects. European spine journal : official publication of the European Spine Society, the European Spinal Deformity Society, and the European Section of the Cervical Spine Research Society 2010;19:297-306. 29. Guyer RD, McAfee PC, Banco RJ, et al. Prospective, randomized, multicenter Food and Drug Administration investigational device exemption study of lumbar total disc replacement with the CHARITE artificial disc versus lumbar fusion: five-year follow-up. The spine journal : official journal of the North American Spine Society 2009;9:374-86. 30. Heller JG, Sasso RC, Papadopoulos SM, et al. Comparison of BRYAN cervical disc arthroplasty with anterior cervical decompression and fusion: clinical and radiographic results of a randomized, controlled, clinical trial. Spine 2009;34:101-7. 31. Hellum C, Johnsen LG, Storheim K, et al. Surgery with disc prosthesis versus rehabilitation in patients with low back pain and degenerative disc: two year follow-up of randomised study. BMJ (Clinical research ed) 2011;342:d2786.

WA – Health Technology Assessment December 19, 2016
Artificial disc replacement – Re-review: Final evidence report ES - 46
32. Hestbaek L, Leboeuf-Yde C, Manniche C. Low back pain: what is the long-term course? A review of studies of general patient populations. European spine journal : official publication of the European Spine Society, the European Spinal Deformity Society, and the European Section of the Cervical Spine Research Society 2003;12:149-65. 33. Hisey MS, Bae HW, Davis R, et al. Multi-center, prospective, randomized, controlled investigational device exemption clinical trial comparing Mobi-C Cervical Artificial Disc to anterior discectomy and fusion in the treatment of symptomatic degenerative disc disease in the cervical spine. International journal of spine surgery 2014;8. 34. Hisey MS, Bae HW, Davis RJ, et al. Prospective, Randomized Comparison of Cervical Total Disk Replacement Versus Anterior Cervical Fusion: Results at 48 Months Follow-up. Journal of spinal disorders & techniques 2015;28:E237-43. 35. Hisey MS, Zigler JE, Jackson R, et al. Prospective, Randomized Comparison of One-level Mobi-C Cervical Total Disc Replacement vs. Anterior Cervical Discectomy and Fusion: Results at 5-year Follow-up. International journal of spine surgery 2016;10:10. 36. Hou Y, Liu Y, Yuan W, et al. Cervical kinematics and radiological changes after Discover artificial disc replacement versus fusion. The spine journal : official journal of the North American Spine Society 2014;14:867-77. 37. Jackson RJ, Davis RJ, Hoffman GA, et al. Subsequent surgery rates after cervical total disc replacement using a Mobi-C Cervical Disc Prosthesis versus anterior cervical discectomy and fusion: a prospective randomized clinical trial with 5-year follow-up. Journal of neurosurgery Spine 2016;24:734-45. 38. Janssen ME, Zigler JE, Spivak JM, Delamarter RB, Darden BV, 2nd, Kopjar B. ProDisc-C Total Disc Replacement Versus Anterior Cervical Discectomy and Fusion for Single-Level Symptomatic Cervical Disc Disease: Seven-Year Follow-up of the Prospective Randomized U.S. Food and Drug Administration Investigational Device Exemption Study. The Journal of bone and joint surgery American volume 2015;97:1738-47. 39. Johannes CB, Le TK, Zhou X, Johnston JA, Dworkin RH. The prevalence of chronic pain in United States adults: results of an Internet-based survey. J Pain 2010;11:1230-9. 40. Johnsen LG, Hellum C, Storheim K, et al. Cost-effectiveness of total disc replacement versus multidisciplinary rehabilitation in patients with chronic low back pain: a Norwegian multicenter RCT. Spine 2014;39:23-32. 41. Kaplan W, Wirtz VJ, Mantel-Teeuwisse A, Stolk P, Duthey B, Laing R. Priority Medicines for Europe and the World 2013 Update. World Health Organization; July 9, 2013. 42. Karabag H, Cakmak E, Celik B, Iplikcioglu AC, Soran AF. Arthroplasty versus fusion for single-level cervical disc disease. JPMA The Journal of the Pakistan Medical Association 2014;64:1348-51. 43. Kim SW, Limson MA, Kim SB, et al. Comparison of radiographic changes after ACDF versus Bryan disc arthroplasty in single and bi-level cases. European spine journal : official publication of the European Spine Society, the European Spinal Deformity Society, and the European Section of the Cervical Spine Research Society 2009;18:218-31. 44. Kurtz SM, Lau E, Ianuzzi A, et al. National revision burden for lumbar total disc replacement in the United States: epidemiologic and economic perspectives. Spine 2010;35:690-6. 45. Lee WT, Liu G, Thambiah J, Wong HK. Clinical outcomes of single-level lumbar artificial disc replacement compared with transforaminal lumbar interbody fusion in an Asian population. Singapore medical journal 2015;56:208-11. 46. Lewis DJ, Attiah MA, Malhotra NR, Burnett MG, Stein SC. Anterior surgical management of single-level cervical disc disease: a cost-effectiveness analysis. Spine 2014;39:2084-92. 47. Lindley EM, McBeth ZL, Henry SE, et al. Retrograde ejaculation after anterior lumbar spine surgery. Spine 2012;37:1785-9.

WA – Health Technology Assessment December 19, 2016
Artificial disc replacement – Re-review: Final evidence report ES - 47
48. Mafi JN, McCarthy EP, Davis RB, Landon BE. Worsening trends in the management and treatment of back pain. JAMA Intern Med 2013;173:1573-81. 49. Marquez-Lara A, Nandyala SV, Fineberg SJ, Singh K. Current trends in demographics, practice, and in-hospital outcomes in cervical spine surgery: a national database analysis between 2002 and 2011. Spine 2014;39:476-81. 50. McAfee PC, Cappuccino A, Cunningham BW, et al. Lower incidence of dysphagia with cervical arthroplasty compared with ACDF in a prospective randomized clinical trial. Journal of spinal disorders & techniques 2010;23:1-8. 51. McAnany SJ, Overley S, Baird EO, et al. The 5-year cost-effectiveness of anterior cervical discectomy and fusion and cervical disc replacement: a Markov analysis. Spine 2014;39:1924-33. 52. Medical Advisory Secretariat. Artificial discs for lumbar and cervical degenerative disc disease–update: an evidence-based analysis. Ontario Health Technology Assessment Series 2006; 6(10). 53. Medical Services Advisory Committee. Artificial intervertebral disc replacement (Total disc arthroplasty). MSAC application 1090. Assessment Report. February/March 2006. 54. Mummaneni PV, Burkus JK, Haid RW, Traynelis VC, Zdeblick TA. Clinical and radiographic analysis of cervical disc arthroplasty compared with allograft fusion: a randomized controlled clinical trial. Journal of neurosurgery Spine 2007;6:198-209. 55. Murrey D, Janssen M, Delamarter R, et al. Results of the prospective, randomized, controlled multicenter Food and Drug Administration investigational device exemption study of the ProDisc-C total disc replacement versus anterior discectomy and fusion for the treatment of 1-level symptomatic cervical disc disease. The spine journal : official journal of the North American Spine Society 2009;9:275-86. 56. Nabhan A, Ahlhelm F, Shariat K, et al. The ProDisc-C prosthesis: clinical and radiological experience 1 year after surgery. Spine 2007;32:1935-41. 57. Nabhan A, Ishak B, Steudel WI, Ramadhan S, Steimer O. Assessment of adjacent-segment mobility after cervical disc replacement versus fusion: RCT with 1 year's results. European spine journal : official publication of the European Spine Society, the European Spinal Deformity Society, and the European Section of the Cervical Spine Research Society 2011;20:934-41. 58. Nabhan A, Steudel WI, Nabhan A, Pape D, Ishak B. Segmental kinematics and adjacent level degeneration following disc replacement versus fusion: RCT with three years of follow-up. Journal of long-term effects of medical implants 2007;17:229-36. 59. Nandyala SV, Marquez-Lara A, Fineberg SJ, Singh K. Comparison between cervical total disc replacement and anterior cervical discectomy and fusion of 1 to 2 levels from 2002 to 2009. Spine 2014;39:53-7. 60. Parkinson B, Goodall S, Thavaneswaran P. Cost-effectiveness of lumbar artificial intervertebral disc replacement: driven by the choice of comparator. ANZ journal of surgery 2013;83:669-75. 61. Patel RK, Slipman CW. Lumbar degenerative disc disease. eMedicine Physical Medicine and Rehabilitation Topic 67. Edited, Omaha, N.E. 2007. http://emedicine.medscape.com/article/309767-overview2007. 62. Peng-Fei S, Yu-Hua J. Cervical disc prosthesis replacement and interbody fusion: a comparative study. International orthopaedics 2008;32:103-6. 63. Peng CW, Yue WM, Basit A, et al. Intermediate Results of the Prestige LP Cervical Disc Replacement: Clinical and Radiological Analysis With Minimum Two-Year Follow-up. Spine 2011;36:E105-11. 64. Phillips FM, Geisler FH, Gilder KM, Reah C, Howell KM, McAfee PC. Long-term Outcomes of the US FDA IDE Prospective, Randomized Controlled Clinical Trial Comparing PCM Cervical Disc Arthroplasty With Anterior Cervical Discectomy and Fusion. Spine 2015;40:674-83.

WA – Health Technology Assessment December 19, 2016
Artificial disc replacement – Re-review: Final evidence report ES - 48
65. Phillips FM, Lee JY, Geisler FH, et al. A prospective, randomized, controlled clinical investigation comparing PCM cervical disc arthroplasty with anterior cervical discectomy and fusion. 2-year results from the US FDA IDE clinical trial. Spine 2013;38:E907-18. 66. Qizhi S, Lei S, Peijia L, et al. A Comparison of Zero-Profile Devices and Artificial Cervical Disks in Patients With 2 Noncontiguous Levels of Cervical Spondylosis. Clinical spine surgery 2016;29:E61-6. 67. Qureshi SA, McAnany S, Goz V, Koehler SM, Hecht AC. Cost-effectiveness analysis: comparing single-level cervical disc replacement and single-level anterior cervical discectomy and fusion: clinical article. Journal of neurosurgery Spine 2013;19:546-54. 68. Radcliff K, Coric D, Albert T. Five-year clinical results of cervical total disc replacement compared with anterior discectomy and fusion for treatment of 2-level symptomatic degenerative disc disease: a prospective, randomized, controlled, multicenter investigational device exemption clinical trial. Journal of neurosurgery Spine 2016:1-12. 69. Radcliff K, Lerner J, Yang C, Bernard T, Zigler JE. Seven-year cost-effectiveness of ProDisc-C total disc replacement: results from investigational device exemption and post-approval studies. Journal of neurosurgery Spine 2016;24:760-8. 70. Radcliff K, Zigler J, Zigler J. Costs of cervical disc replacement versus anterior cervical discectomy and fusion for treatment of single-level cervical disc disease: an analysis of the Blue Health Intelligence database for acute and long-term costs and complications. Spine 2015;40:521-9. 71. Rao RD, Gourab K, David KS. Operative treatment of cervical spondylotic myelopathy. The Journal of bone and joint surgery American volume 2006;88:1619-40. 72. Riew KD, Buchowski JM, Sasso R, Zdeblick T, Metcalf NH, Anderson PA. Cervical disc arthroplasty compared with arthrodesis for the treatment of myelopathy. The Journal of bone and joint surgery American volume 2008;90:2354-64. 73. Riina J, Anderson PA, Holly LT, Flint K, Davis KE, Riew KD. The effect of an anterior cervical operation for cervical radiculopathy or myelopathy on associated headaches. Journal of Bone and Joint Surgery - Series A 2009;91:1919-23. 74. Roh JS, Teng AL, Yoo JU, Davis J, Furey C, Bohlman HH. Degenerative disorders of the lumbar and cervical spine. The Orthopedic clinics of North America 2005;36:255-62. 75. Rohl K, Rohrich F. Artificial disc versus spinal fusion in the treatment of cervical spine degenerations in tetraplegics: a comparison of clinical results. Spinal cord 2009;47:705-8. 76. Rozankovic M, Marasanov SM, Vukic M. Cervical Disc Replacement With Discover Versus Fusion In A Single Level Cervical Disc Disease: A Prospective Single Center Randomized Trial With A Minimum Two-Year Follow - Up. Clinical spine surgery 2016. 77. Sasso RC, Anderson PA, Riew KD, Heller JG. Results of cervical arthroplasty compared with anterior discectomy and fusion: four-year clinical outcomes in a prospective, randomized controlled trial. The Journal of bone and joint surgery American volume 2011;93:1684-92. 78. Schrot RJ, Mathew JS, Li Y, Beckett L, Bae HW, Kim KD. Headache relief after anterior cervical discectomy: post hoc analysis of a randomized investigational device exemption trial: clinical article. Journal of neurosurgery Spine 2014;21:217-22. 79. Segebarth B, Datta JC, Darden B, et al. Incidence of dysphagia comparing cervical arthroplasty and ACDF. SAS journal 2010;4:3-8. 80. Skeppholm M, Lindgren L, Henriques T, Vavruch L, Lofgren H, Olerud C. The Discover artificial disc replacement versus fusion in cervical radiculopathy--a randomized controlled outcome trial with 2-year follow-up. The spine journal : official journal of the North American Spine Society 2015;15:1284-94. 81. Skeppholm M, Olerud C. Comparison of dysphagia between cervical artificial disc replacement and fusion: data from a randomized controlled study with two years of follow-up. Spine 2013;38:E1507-10. 82. Skold C, Tropp H, Berg S. Five-year follow-up of total disc replacement compared to fusion: a randomized controlled trial. European spine journal : official publication of the European Spine Society,

WA – Health Technology Assessment December 19, 2016
Artificial disc replacement – Re-review: Final evidence report ES - 49
the European Spinal Deformity Society, and the European Section of the Cervical Spine Research Society 2013;22:2288-95. 83. Staub LP, Ryser C, Roder C, et al. Total disc arthroplasty versus anterior cervical interbody fusion: use of the Spine Tango registry to supplement the evidence from randomized control trials. The spine journal : official journal of the North American Spine Society 2016;16:136-45. 84. Steinmetz MP, Patel R, Traynelis V, Resnick DK, Anderson PA. Cervical disc arthroplasty compared with fusion in a workers' compensation population. Neurosurgery 2008;63:741-7; discussion 7. 85. Tarulli AW, Raynor EM. Lumbosacral radiculopathy. Neurol Clin 2007;25:387-405. 86. US Food & Drug Administration (FDA). Summary of Safety and Effectiveness Data (SSED): CHARITE Artifical Disc. http://www.accessdata.fda.gov/cdrh_docs/pdf4/P040006B.pdf2004. 87. US Food & Drug Administration (FDA). Summary of Safety and Effectiveness Data (SSED): PRODISC-L Total Disc Replacement. http://www.accessdata.fda.gov/cdrh_docs/pdf5/P050010B.pdf2006. 88. US Food & Drug Administration (FDA). Summary of Safety and Effectiveness Data (SSED): PRESTIGE Cervical Disc System. http://www.accessdata.fda.gov/cdrh_docs/pdf6/P060018b.pdf2007. 89. US Food & Drug Administration (FDA). Summary of Safety and Effectiveness Data (SSED): ProDisc-C Total Disc Replacement. http://www.accessdata.fda.gov/cdrh_docs/pdf7/p070001b.pdf2007. 90. US Food & Drug Administration (FDA). Summary of Safety and Effectiveness Data (SSED): Bryan Cervical Disc. http://www.accessdata.fda.gov/cdrh_docs/pdf6/P060023b.pdf 2009. 91. US Food & Drug Administration (FDA). Summary of Safety and Effectiveness Data (SSED): PCM Cervical Disc. http://www.accessdata.fda.gov/cdrh_docs/pdf10/P100012b.pdf2012. 92. US Food & Drug Administration (FDA). Summary of Safety and Effectiveness Data (SSED): SECURE-C Cervical Artificial Disc. http://www.accessdata.fda.gov/cdrh_docs/pdf10/p100003b.pdf2012. 93. US Food & Drug Administration (FDA). Summary of Safety and Effectiveness Data (SSED): Mobi-C Cervical Disc Prosthesis (1-level indication). http://www.accessdata.fda.gov/cdrh_docs/pdf11/p110002b.pdf2013. 94. US Food & Drug Administration (FDA). Summary of Safety and Effectiveness Data (SSED): Mobi-C Cervical Disc Prosthesis (2-level indication). http://www.accessdata.fda.gov/cdrh_docs/pdf11/P110009B.pdf2013. 95. Vaccaro A, Beutler W, Peppelman W, et al. Clinical outcomes with selectively constrained SECURE-C cervical disc arthroplasty: two-year results from a prospective, randomized, controlled, multicenter investigational device exemption study. Spine 2013;38:2227-39. 96. Young WF. Cervical spondylotic myelopathy: a common cause of spinal cord dysfunction in older persons. Am Fam Physician 2000;62:1064-70, 73. 97. Zhang HX, Shao YD, Chen Y, et al. A prospective, randomised, controlled multicentre study comparing cervical disc replacement with anterior cervical decompression and fusion. International orthopaedics 2014;38:2533-41. 98. Zhang X, Zhang X, Chen C, et al. Randomized, controlled, multicenter, clinical trial comparing BRYAN cervical disc arthroplasty with anterior cervical decompression and fusion in China. Spine 2012;37:433-8. 99. Zigler J, Delamarter R, Spivak JM, et al. Results of the prospective, randomized, multicenter Food and Drug Administration investigational device exemption study of the ProDisc-L total disc replacement versus circumferential fusion for the treatment of 1-level degenerative disc disease. Spine 2007;32:1155-62; discussion 63. 100. Zigler JE, Delamarter R, Murrey D, Spivak J, Janssen M. ProDisc-C and anterior cervical discectomy and fusion as surgical treatment for single-level cervical symptomatic degenerative disc disease: five-year results of a Food and Drug Administration study. Spine 2013;38:203-9. 101. Zigler JE, Delamarter RB. Five-year results of the prospective, randomized, multicenter, Food and Drug Administration investigational device exemption study of the ProDisc-L total disc replacement
WA – Health Technology Assessment December 19, 2016
Artificial disc replacement – Re-review: Final evidence report ES - 50
versus circumferential arthrodesis for the treatment of single-level degenerative disc disease. Journal of neurosurgery Spine 2012;17:493-501. 102. Zigler JE, Glenn J, Delamarter RB. Five-year adjacent-level degenerative changes in patients with single-level disease treated using lumbar total disc replacement with ProDisc-L versus circumferential fusion. Journal of neurosurgery Spine 2012;17:504-11.

WA – Health Technology Assessment December 19, 2016
Artificial disc replacement – Re-review: Final evidence report Page - 51
1. Appraisal
1.1 Background and Rationale
Back and neck pain due to degenerative disc disease (DDD) are leading causes of pain and disability in adults in the United States, and as such, a large proportion of health care expenditures is used for the evaluation and treatment of this condition. Because aging is the primary risk factor for development of DDD, as the US population ages, the incidence of DDD is expected to increase. Initially, treatment of symptomatic DDD typically consists of nonsurgical approaches, such as physical therapy, epidural steroid injections, and medications. However, an estimated 10% to 20% of people with lumbar DDD and up to 30% with cervical DDD are unresponsive to nonsurgical treatment. In addition, cervical DDD may lead to radiculopathy and/or myelopathy; 25% of people with cervical radiculopathy and 50% to 70% of those with cervical myelopathy do not respond to nonsurgical treatment. Surgery may be considered when nonoperative treatments for six months in the lumbar spine or six weeks in the cervical spine fail to relieve symptoms attributed to spinal DDD or to prevent progression of nerve damage in the case of radiculopathy or myelopathy. Historically, lumbar or cervical fusion (also called arthrodesis) has been offered as a surgical option with the goal of removing the disc and fusing the vertebrae, thereby limiting the motion at the symptomatic segment. Spinal fusion is thought by some to promote the degeneration of the vertebrae above or below the fusion site (adjacent segment disease); however, many uncertainties remain regarding the extent to which this occurs. Guidelines recommend consideration of intensive multidisciplinary rehabilitation and appropriate patient selection as an integral part of decisionmaking particularly for lumbar fusion. For cervical DDD resulting in radiculopathy or myelopathy, the current surgical standard is anterior cervical discectomy and spinal fusion (ACDF), the goal of which is nerve decompression and restoration of spinal alignment and stability. A surgical alternative to fusion is artificial disc replacement (ADR) also referred to as spinal arthroplasty. Disc prostheses were developed to mimic the decompressive and supportive properties of intervertebral discs as well as to preserve motion at the index level, thereby improving pain and function as well as decreasing stresses on adjacent segment structures and theoretically the risk of adjacent segment disease. Lumbar ADR (L-ADR) is currently indicated in patients with single-level DDD who have failed at least six months of nonoperative care, while cervical ADR (C-ADR) is indicated in patients with radiculopathy or myelopathy secondary to one- or two-level DDD that has not responded to six weeks of nonsurgical treatment. A Health Technology Assessment titled: Artificial Disc Replacement, was published on September 19, 2008 by the Health Care Authority.; the resulting Findings and Coverage Decision were released on October 17, 2008 and adopted on March 20, 2009. Based on a signal update report (1/25/2016), new randomized controlled trials for lumbar and cervical ADR have been published subsequent to the 2008 report. In addition, longer-term follow-up of patients is now available for some of these trials, and at least one device has subsequently received FDA approval for two-level placement. Both lumbar and cervical arthroplasty were covered in the original report as well as this update. Data relevant to the lumbar spine are presented first in all sections. Policy Context

WA – Health Technology Assessment December 19, 2016
Artificial disc replacement – Re-review: Final evidence report Page - 52
This technology was originally reviewed September 2008 and was selected for re-review based on new literature identified which may invalidate aspects of the previous report.
Objectives The primary aim of this assessment is to update the 2008 report based on systematic review and synthesis of subsequently published evidence on the efficacy, safety, and cost-effectiveness of artificial disc replacement (ADR) in the cervical and lumbar spine.
1.2 Key Questions
Key question 1 What is the evidence of efficacy and effectiveness of ADR compared with comparative therapies (including non-operative therapy; spinal fusion; other surgery)?
Key Question 2 What is the evidence related to the ADR safety profile? (including device failure, reoperation)
Key Question 3 What is the evidence of differential efficacy or safety issues amongst special populations (including but not limited to the elderly and workers compensation populations)?
Key Question 4 What are the cost implications and cost effectiveness for ADR? Inclusion and exclusion criteria are summarized as follows:
• Population: • Lumbar: Patients undergoing primary L-ADR for DDD without neurological compromise and
who have not had prior spine surgery at the instrumented level. • Cervical: Patients undergoing primary C-ADR for DDD resulting in radiculopathy or
myelopathy and who have not had prior surgery at the instrumented level. • Intervention: L-ADR or C-ADR with commercially available device (defined as FDA-approved
devices or unapproved devices in Phase III trials with ≥ 1 year of follow-up data in a peer-reviewed journal).
• Comparators: Non-operative treatment, spinal fusion, other spine surgery. Comparator interventions that employ a device not FDA-approved for use in the US will be excluded.
• Outcomes: Studies must report on at least one of the following: • Physical function/disability (overall clinical success, ODI [L-ADR] or NDI [C-ADR]) • Pain/pain reduction • Device failure (reoperation at the index level – to include revision, reoperation, or removal) • Complications (e.g., migration, subsidence, neurologic injury as well as infection, vascular
damage, heterotopic ossification, others) The following secondary outcomes are reported if presented with studies meeting the above criteria: • Quality of life (SF-36) • Incidence of adjacent segment disease (e.g., reoperation at the adjacent level)

WA – Health Technology Assessment December 19, 2016
Artificial disc replacement – Re-review: Final evidence report Page - 53
• Study design: This report will focus on evidence that evaluates efficacy and effectiveness and has the least potential for bias. For Key Question 1, only randomized controlled trials (RCTs) and comparative studies with concurrent controls will be considered (N≥50 for lumbar ADR; N≥100 for cervical ADR). For Key Question 2, adverse events or harms reported in the RCTs and nonrandomized studies included for Key Question 1 will be included; in addition, summaries of case series with the evaluation of safety as a primary study objective may be considered (with N≥100 and ≥80% follow-up) and very briefly summarized to provide additional context. High quality systematic reviews will be appraised and incorporated if feasible. RCTs and comparative cohort studies with concurrent controls and low risk of bias published subsequent to such reviews and will be evaluated based on the PICO inclusion/exclusion criteria. As this report serves to update the 2008 assessment, only comparative studies published subsequent to that review will be included and described; results will be described based on the context of previous findings. For Key Question 3, RCTs which stratify on patient or other characteristics and formally evaluate statistical interaction (effect modification) will be sought. For Key Question 4 only full, formal economic studies (i.e., cost-effectiveness, cost-utility, cost-minimization, and cost-benefit studies) will be considered.
Figure 1. Analytic framework

WA – Health Technology Assessment December 19, 2016
Artificial disc replacement – Re-review: Final evidence report Page - 54
1.3 Outcomes Assessed
The studies included in this assessment used a variety of measures to evaluate treatment outcomes, which are outlined in Table 1. The primary outcome measures were those which measured function and pain; these were designated primary outcomes a priori based on clinical expert input. Information on the minimal clinically important difference (MCID) was obtained for the population being evaluated whenever statistical differences were found between groups. Table 1. Outcome Measures
Outcome measure Instrument type
Components Score range Interpretation
American Academy of Orthopedic Surgeons (AAOS) Neck Disability Score122
Neck NR 0–6 6 = greater neck disability
American Academy of Orthopedic Surgeons (AAOS) Neurogenic Symptom Score122
Neurogenic symptoms
NR 0–6 6 = greater neurogenic symptoms
Back performance scale159
Back • Sock Test (0–3) • Pick-up Test (0–3) • Roll-up Test (0–3) • Fingertip-to-Floor Test (0–3) • Lift Test (0–3)
0–15 15 = worst
Core Outcome Measures Index (COMI)45
Generic • Neck pain, graphic rating scale (0–10)
• Arm pain, graphic rating scale (0–10)
0–10 10 = greater arm/neck pain
EuroQol-5 Dimensions (EQ-5D)50
Quality of Life
• Mobility • Self-care • Main activity • Social relationships • Pain • Mood
–0.59 to 1 1 = perfect health
Fear Avoidance Belief Questionnaire (FABQ)179
Low back pain
• 7 work-related items (0–6) • 4 fear-related items (0–6)
0–42 (work) 0–24 (physical)
Lower scores = less symptom severity
Hopkins Symptom Checklist-25 (HSCL-25)44
Quality of Life
• Somatization (1–4) • Obsessive-compulsive (1–4) • Interpersonal sensitivity (1–4) • Depression (1–4) • Anxiety (1–4)
1–4 4 = extreme distress
Japanese Orthopedic Association (JOA)76
Function • Upper extremity (0–4) • Lower extremity (0–4)
0–17 17 = better function

WA – Health Technology Assessment December 19, 2016
Artificial disc replacement – Re-review: Final evidence report Page - 55
Outcome measure Instrument type
Components Score range Interpretation
• Sensory: upper extremity (0–2)
• Sensory: lower extremity (0–2)
• Sensory: trunk (0–2) • Bladder function (0–3)
Neck Disability Index (NDI)28,178
Neck • Pain intensity • Personal care • Lifting • Reading • Headaches • Concentration • Work • Driving • Sleeping • Recreation
0–50 or 0%–100%*
Higher scores = greater disability
Numerical Rating System (NRS)103
Generic • Pain 0–10 No pain: 0 Mild pain: 1–3 Moderate pain: 4–6 Severe pain: 7–10
Nurick Grade126
Function Grades: • 0 = Signs or symptoms of
root involvement but without evidence of spinal cord disease
• 1 = Signs of spinal cord disease but no difficulty in walking
• 2 = Slight difficulty in walking which did not prevent full-time employment
• 3 = Difficulty in walking which prevented full-time employment or the ability to do all housework, but which was not so severe as to require someone else’s help to walk
• 4 = Able to walk only with someone else’s help or with the aid of a frame
• 5 = Chair bound or bedridden
0–5 Lower grade = lower spinal cord disorder
Oswestry Disability Index (ODI) (version 2.0)52
Back • Pain intensity • Personal care • Lifting • Walking • Sitting
0–100* Higher scores = greater disability

WA – Health Technology Assessment December 19, 2016
Artificial disc replacement – Re-review: Final evidence report Page - 56
Outcome measure Instrument type
Components Score range Interpretation
• Standing • Sleeping • Sex life • Social life • Travelling
Odom’s Criteria117 Physician • Surgeon’s overall assessment of patient’s surgical outcome
Excellent, Fair, Good, Poor
NA
Prolo Scale129 Patient • Economic status (5 items) • Functional status (5 items)
2–10 Poor (incapacitated state) = 2–4 Fair = 5–6 Good = 7–8 Excellent = 9–10
Roland-Morris Disability Questionnaire (RDQ)144
Back • Pain intensity • Self-care • Social life • Walking • Sitting • Standing • Sleeping • Bending • Stairs • Appetite • General activity • Household chores
0–24 Higher scores = greater disability
Self-efficacy beliefs for pain† 65,94
Pain • Self-efficacy pain subscale (10–100, 5 items)
• Self-efficacy function subscale (10–100, 9 items)
• Self-efficacy other symptoms subscale (10–100, 6 items)
10–100 Lower score = greater uncertainty in ability to manage pain
Short Form-36 (SF-36)181,182
Patient 8 subscales (36 items): • Role-functioning • Role limitations due to
physical health problems • Bodily pain • General health • Vitality • Social functioning • Role limitations due to
emotional problems • Mental health In addition, the following scores may be reported for the SF-36:
0–100 (subscale score) 0–100 (component score) Total score not used
Lower score = greater disability

WA – Health Technology Assessment December 19, 2016
Artificial disc replacement – Re-review: Final evidence report Page - 57
Outcome measure Instrument type
Components Score range Interpretation
• Mental Component Score (MCS) (35 items)
• Physical Component Score (PCS) (35 items)
Visual Analogue Scale (VAS) for pain
Generic • Pain 0–10 cm or 0–100 mm
No pain: 0 Worst pain imaginable: 10
NA: not applicable; NR: not reported. * ODI and NDI: Each of the ten subscales is scored on a scale of 0–5 points; the total score is then doubled for a
final score ranging from 0% – 100% † Outcome measure was specific to the Hellum 2011 trial (L-ADR) and based on a subscale of the Arthritis Self
Efficacy Scale

WA – Health Technology Assessment December 19, 2016
Artificial disc replacement – Re-review: Final evidence report Page - 58
1.4 Washington State Utilization and Cost Data
Artificial Disc – Re-Review
Data Extract
CLAIMS Agencies contributing cost and utilization claims data for the artificial disc analysis included PEBB/UMP (Public Employees Benefit Board Uniform Medical Plan), the Department of Labor and Industries (LNI) Workers’ Compensation Plan and Medicaid Fee for Service and Managed Care.
ANALYSIS PERIOD The analysis period captured claims incurred between and including January 1, 2013 thru December 31, 2015.
POPULATION INCLUSION CRITERIA Age greater than 17 years old at time of service AND at least one of the following CPT/HCPCS codes:
Procedure Codes for Artificial Disc
22861 22862 22864 22865 22857 22858 22856 0095T 0098T 0163T 0164T 0375T
EXCLUSION CRITERIA The analysis excluded denied claims and claims from members having dual eligibility with Medicare and Medicaid. Critically, adhering to HIPAA requirements to protect personal health information, the study excluded agency data that did not effectively mask an individual’s identity. Also, excluded artificial disk replacement accompanied by a fusion claims.
Demographics
PEBB/UMP 2013 2014 2015
TOTAL PEBB/UMP POPULATION 239,855 246,950 230,802
Percent Females/Male 55% / 45% 55% / 45% 54% / 46%
Greater than 17 years old 202,223 (84%) 208,330 (84%) 193,874 (84%)
MEDICAID FEE-FOR-SERVICE & MANAGED CARE 2013 2014 2015
TOTAL MEDICAID POPULATION 1,367,708 1,774,651 1,827,891
Percent Females/Male 67% / 33% 59% / 41% 58% / 42%
Greater than 17 years old 529,666 (39%) 905,451 (51%) 913,946 (51%)

WA – Health Technology Assessment December 19, 2016
Artificial disc replacement – Re-review: Final evidence report Page - 59
AGENCY COST AND UTILIZATION – Artificial Discs
2013 2014 2015
Average age at time of service
PEBB/UMP 46 49 48
LNI 43 44 44
Medicaid MCO 34 41 40
Medicaid FFS 39 39 36
Distribution by gender
Male Female Male Female Male Female
PEBB/UMP 60% 40% 22% 78% 54% 46%
LNI 79% 21% 60% 40% 73% 27%
Medicaid MCO 45% 55% 33% 67% 46% 54%
Medicaid FFS 50% 50% 0% 100% 50% 50%
Unique members and procedures
Unique
member Procedure Unique
member Procedure Unique
member Procedure
PEBB/UMP 7 7 8 8 11 11
LNI* 49 50 45 46 41 41 Medicaid MCO** 8 8 25 25 36 37
Medicaid FFS 1 1 2 2 2 2 LNI: Second Level Procedures Cervical- 8 individuals underwent a first AND a second level procedure (procedures occurred on the same day). . Five individuals had procedures on separate dates. **Second level procedures- Cervical: 11 individuals underwent a first AND a second level procedure (procedures occurred on the same day). All second level procedures occurred in 2015.

WA – Health Technology Assessment December 19, 2016
Artificial disc replacement – Re-review: Final evidence report Page - 60
Count of Cervical and Lumbar Procedures
2013 2014 2015
Cervical Lumbar Cervical Lumbar Cervical Lumbar
PEBB/UMP 7 0 8 0 11 0
LNI 41 9 36 10 36 5
Medicaid MCO 6 2 24 1 33 4
Medicaid FFS 1 0 2 0 2 0
Total Dollars Paid and Average Paid Per Procedure
Measure
Total Paid Dollars
2013 - 2015
2013 2014 2015
Paid dollars
Paid/ Procedure
Paid dollars
Paid/ Procedure
Paid dollars
Paid/ Procedure
PEBB/UMP $561,688 $176,125 $25,161 $150,815 $18,852 $234,748 $21,341
LNI $1,783,520 $796,686 $15,934 $551,033 $11,979 $435,801 $11,778
Medicaid MCOb $628,064 $44,747 $5,593 $158,217 $6,329 $428,100 $11,570
Medicaid FFS $22,676 $2,286a $2,286 $14,802 $7,401 $6,398 $3,199
Medicaid MCO claims use a calculated field: “Reported Paid Amount” for Paid Dollars.
a) Medicaid Fee for Service: In order to compare like procedures, excluded one claim for a lumbar artificial disc replacement with fusion for $17,619.
b) Medicaid MCO: In order to compare like procedures, excluded 6 Cervical Disc replacements with Fusions; 1 lumbar disc replacement with fusions; 1 2nd level replacement with fusion; and 1 removal of Lumbar artificial disc with fusions.

WA – Health Technology Assessment December 19, 2016
Artificial disc replacement – Re-review: Final evidence report Page - 61
2. Background
2.1 Epidemiology and Burden of Disease
Low back pain and chronic neck pain are common conditions. Low back pain has an estimated lifetime prevalence ranging from 60% to 70% in industrialized countries.84 Axial back pain (non-radicular back pain) is most common and does not involve pain to the buttocks, legs, feet or other areas; it usually resolves with time. An estimated 25%-58% of low back pain cases resolve spontaneously with conservative care,67 however, persistent low back pain that is refractory to conservative treatment may occur in as many as one quarter of persons six months following an initial episode.81 Back pain attributed to degenerative disc disease (DDD) is a major health problem throughout the world. Over 90% of spinal procedures are performed because of disc degeneration and a reported 15% to 20% of patients do not recover from back pain after lumbar surgery.6,34 A 2013 study found that lower back pain is the leading cause of pain and disability in adults in the United States.21 Data indicate that at least 80% of Americans have at least one significant episode of low back pain in their lifetime, and 5% have chronic low back pain.9,188 The National Center for Health Statistics found that in 2014, 28.1% of adults had experienced low back pain in the previous 3 months and 14.6% had experienced neck pain.26 Approximately 2.4 million Americans are disabled by lower back pain at any given time, and half of those are chronically disabled.120 An analysis of 27 studies published between 1997 and 2007, conducted both in the United States and internationally, estimated that the economic burden of lower back pain treatment costs were $100-200 billion each year reporting that low back pain was the second most common cause of a visit to the doctor.37 Low back pain due to DDD peaks at 40 years of age and affects both men and women equally.120 Similarly, neck pain is also prevalent, with approximately 15%-20% of adults reporting at least one episode during a given year25 and DDD is a common cause. In a study of surgical patients with DDD, 61% presented with radiculopathy, 16% with myelopathy, and the other 23% had a combination of the two.137 Spondylosis is an umbrella term used to describe pain associated with degenerative conditions of the spine, including degenerative disc disease (DDD). This degenerative process may cause radiculopathy (peripheral nerve root impingement) or less commonly, myelopathy (compression of the spinal cord). Lumbosacral radiculopathy, more common than its cervical counterpart, affects 3% to 5% of the population.161 Myelopathy that is a result of degeneration in the spine is estimated to affect 605 per million individuals in North America.21 The major risk factor for cervical spondylosis is aging; although trauma may contribute, there is usually no history of significant trauma. An estimated 60% of individuals older than 40 years of age have radiographic evidence of cervical DDD secondary to spondylosis.15,105 By age 59, 70% of women and 85% of men have radiographic evidence of these changes, and by age 70, the number increases to 93% and 97%, respectively.58 A study 2010 survey of 200 asymptomatic individuals between 60 and 65 years of age found that 95% of men and 70% of women showed degenerative changes in the cervical region. The presence of degenerative changes on radiographic or MRI images alone does not correlated well with the presence or severity of pain, however. Progression of DDD is a common cause of chronic neck pain. Notably, cervical spine surgery has increased significantly since 2002, with an estimated 307,188 cervical spine procedures performed between 2002 and 2011.97 The increase of cervical spine surgery is not well understood but may be a result of the higher incidence of neck pain in office and computer workers, healthcare workers, and transit operators.

WA – Health Technology Assessment December 19, 2016
Artificial disc replacement – Re-review: Final evidence report Page - 62
Because aging is the primary risk factor, as the US population ages, the incidence of DDD is expected to increase. A study published in 2013 through Harvard Medical School found that the number of patient visits due to back pain increased from 3350 between 1999 and 2000 to 4078 between 2009 and 2010.96 Intervertebral discs are soft, spongy pads of tissue that separate and provide stability to the individual vertebrae of the spine, and function by absorbing shock and facilitating motion of the spine. They are composed of water, collagen, and proteoglycans. Intervertebral discs consist of an annulus fibrosus, located in the outer region of the disc that surrounds the nucleus pulposus. The annulus fibrosus consists primarily of collagen and functions to resist tensile loads; the nucleus pulposus has a higher water and proteoglycan content that makes it jelly-like in substance, and functions to prevent compression of the spine.106,142 Spondylosis is associated with the aging process, during which discs lose moisture content and elasticity, leading to a loss of disc height. These changes put increased stress on the articular cartilage of the vertebrae and their endplates, and osteophytic spurs may form at the endplates.16,58,106,142,186 In addition, annular degeneration may lead to disc herniation or protrusion.142 Narrowing of the spinal canal by osteophytic spurs, ossification of the posterior longitudinal ligament, or bulging of a large central disc can compress the spinal cord resulting in myelopathy, and/or impinge the spinal nerve roots, causing radiculopathy. As a result of this disc deterioration in the cervical spine, patients may experience neck, shoulder, and arm pain (symptoms of radiculopathy) and less commonly, degrees of neurological symptoms and impairment, including unsteady gait and clumsiness if myelopathy is present.58,186 In severe cases, stenosis of the cervical spine can result in myelopathy affecting the lower extremity and radiculopathy affecting the upper extremity.166 Cervical spondylotic myelopathy (CSM), which is a specific type of spondylosis, is the most prevalent spinal cord dysfunction in people 55 years or older.186 However, CSM is not a common indication for arthroplasty.
2.2 Technology: Artificial Disc Replacement (ADR)
Proposed benefits of ADR and surgical approach
Artificial discs are functional prostheses that were developed to mimic the decompressive and supportive properties of intervertebral discs in both the lumbar and the cervical spine. ADR, also referred to as disc or spinal arthroplasty, is designed to preserve motion at the target spinal level by restoring the natural distance between the vertebrae. In addition to reducing pain, this preservation of motion is hypothesized to decrease stress on and increase mobility of adjacent segments, which in turn is theorized to reduce the incidence of adjacent segment degeneration (ASD), thought to result from lack of spinal mobility related to spinal fusion.16,106 ADR can also restore pre-degenerative disc height and spinal alignment and does not require a bone graft. Other theoretical advantages include maintenance of mechanical characteristics, decreased perioperative morbidity compared with fusion, and early return to function.7 In both the lumbar and the cervical spine, insertion of the prosthesis involves an anterior approach, however, one major difference is that cervical ADR involves a standard anterior cervical discectomy whereby the disc and osteophytes are removed and the nerves are carefully decompressed before the artificial disc is inserted; by contrast, the approach in the lumbar spine does not require moving the nerves. ADR is usually performed by a vascular or general surgeon and a spine surgeon (with orthopaedic or neurologic surgery background) working in tandem to facilitate exposure. The procedure is technically more demanding, has a steeper learning curve, and requires greater precision than fusion surgery. Both lumbar and cervical ADR are examined in this report. In each section, information relevant to the lumbar spine is presented first.

WA – Health Technology Assessment December 19, 2016
Artificial disc replacement – Re-review: Final evidence report Page - 63
Potential Consequences and Adverse Events
Potential problems associated with ADR may include injury to other structures (vascular and neurologic (L-ADR and C-ADR), intestinal or urogenital (L-ADR), esophageal (C-ADR)), temporary paralysis or loss of voice (C-ADR); infection, loosening/dislodgment, polyethylene or metal wear, loss of motion over time, impact/pressure on adjacent discs and facet joints, subsidence, implant failure, heterotopic ossification, and device related endplate fracture.106,123 Device Design
Each artificial disc is comprised of two or three components including two endplates and an articulating mechanism with a metal-on-polymer surface (e.g., the SB Charité and the Prodisc). Metal-on-metal surfaces were used in the past but as of 2013, FDA trials have halted for metal-on-metal devices due to concerns about the production of metal ions. To secure the disc in place and provide stability within the host vertebral body, devices feature a number of designs, such as teeth-like components called spikes or fins that are driven into the vertebral bone, a porous coated surface on the endplates which promotes bony in-growth around these structures, or are secured into the recipient vertebral body with screws.99 Each intervertebral disc is sandwiched between two adjacent vertebrae, and is placed anterior to paired facet joints that link the adjacent vertebrae. The facet joints and disc make up a single motion segment which is referred to as the “tri-joint complex”.142This motion unit in its healthy state allows for six potential motion directions: compression, distraction, flexion, extension, lateral bending, and axial rotation.104 The ability of artificial disc prostheses to mimic these ranges of motion provides the basis for a biomechanical classification system for ADR devices; each disc can be classified into one of three types: unconstrained, semiconstrained, and constrained devices.48 For further details on biomechanical classification in both cervical and lumbar ADR, refer to the background section of the previous report and Appendix F of this report. Another important aspect of disc design that relates to restoration and preservation of natural motion and stability is the center of rotation (COR). In both the cervical and lumbar spine, the center of rotation is not a fixed point but rather a locus of points that tend to be posterior to the midline and caudal to the inferior endplate.7 Some artificial discs are designed with the center of rotation fixed, either in the center of the disc or in the posterior aspect of the disc space. Alternatively, other devices create a mobile center of rotation so that the locus of points that define the normal centers of rotation can be replicated.7 Artificial discs are intended for the full life span of the patient and should be designed to last at least 40 to 50 years, which are conservative approximations for the average time a 35-year old patient would need a functioning disc prosthesis.62,104
2.2.1 Lumbar ADR (L-ADR)
2.2.1.1 FDA-Approved Devices Around the world the market penetration and regulatory status of artificial discs has remained varied. In the United States, the InMotion (formerly known as SB Charité; DePuy Spine, Inc., Raynham, MA), the Prodisc-L (Synthes, Inc., West Chester, PA), and the activ-L (Aesculap Implant Systems, Center Vally, PA) are currently approved for clinical use. Three other devices have undergone FDA trials but are either still in trial or approval information has not been updated since the completion of the trial (see Appendix

WA – Health Technology Assessment December 19, 2016
Artificial disc replacement – Re-review: Final evidence report Page - 64
F for details). Information on devices used in other countries at the time of the previous HTA can be found in the background section of the previous report. The primary inclusion criteria for the FDA clinical trials for the InMotion,167 Prodisc-L,168 and activ-L176 were similar to the indications for approved L-ADR use. Only adults were included (age 18-60 years); the mean age of patients enrolled in the trials was 39 (Prodisc-L and activ-L) and 40 (Charité) years. Indications and contraindications for these devices are summarized below.
2.2.1.2 Indications Indications for FDA-approved use of the InMotion, ActivL and Prodisc-L artificial lumbar discs can be summarized as follows: Skeletally mature patients Single-level DDD from L3-S1 (Prodisc-L) or L4-S1 (InMotion, activ-L)
o DDD confirmed by patient history, radiographic studies; or physical examination (InMotion, activ-L)
If spondylolisthesis (vertebral displacement towards an adjacent vertebrae) is present at the involved level, it cannot be more than grade 1 (Prodisc-L, activL) or 3 mm (Charité)
Failure of at least six months of nonoperative treatment
2.2.1.3 Contraindications Contraindications for FDA-approved InMotion, activL and Prodisc-L artificial lumbar discs can be summarized as follows:
Active systemic infection or infection localized to site of implantation Osteopenia or osteoporosis Bony lumbar spinal stenosis (InMotion, Prodisc-L) Allergy or sensitivity to implant materials (cobalt, chromium, molybdenum, polyethylene,
titanium) Isolated radicular compression syndromes, especially due to disc herniation (ProDiscL, activL) Pars defect (spondylosis) (InMotion, Prodisc-L) Involved vertebral endplate that is dimensionally smaller than 34.5 mm in the medial-lateral
and/or 27mm in the anterior-posterior directions (Prodisc-L only) Clinically compromised vertebral bodies at the affected level due to current or past trauma
(Prodisc-L only) Lytic spondylolisthesis or degenerative spondylolisthesis of more than grade 1 (Prodisc-L only) Involved vertebral endplate that is dimensionally smaller than 31 mm in the medial-lateral
and/or 26mm in the anterior-posterior directions, moderate to advanced spondylosis, chronic radiculopathy, extruded disc material, myelopathy, or spinal stenosis (InMotion only)
2.2.1.4 Ongoing Clinical Trials Ongoing clinical trials were identified by searching clinicaltrials.gov for terms related to artificial disc replacement. A total of three clinical trials investigating the use of L-ADR were identified that are relevant to the conditions of interest; the status of one is active, one is recruiting, and one is of unknown status. Of these, one compares single-level ADR devices, one is non-comparative, and one compares L-ADR to interspinous stabilization but does not specify the number of levels being treated. Trial details are available in Appendix I.
WA – Health Technology Assessment December 19, 2016
Artificial disc replacement – Re-review: Final evidence report Page - 65
2.2.2 Cervical ADR (C-ADR)
2.2.2.1 FDA-Approved Devices In 2008, only two cervical disc replacements were FDA approved for use in the United States. Recent years have seen a large increase in cervical devices, with a total of eight FDA approved options. These devices are The Prestige ST and Prestige LP (Medtronic, Minneapolis, MN), the Prodisc-C (Synthes, West Chester, PA), Secure-C (Globus Medical, Audubon, PA), Mobi-C 1-level and Mobi-C 2-level (LDR Spine, Austin, TX), PCM (NuVasive, Sand Diego, CA), the Bryan (Medtronic, Minneapolis, MN), and Discover (DePuy Spine, Raynham, MA). Of note, one device (Discover) is currently being evaluated in an IDE trial (ID NCT00432159) scheduled to be complete in 2016 and was included in the report at the request of the Washington State Health Care Authority. For further information on devices used in other countries at the time of the prior HTA see the background section of that report, or for FDA unapproved devices see Appendix F for details. Inclusion criteria for FDA trials were relatively uniform and followed the indications for FDA-approved device use but varied slightly between devices. Only adults were included; mean ages of the trial populations were similar. The ProDisc-C170 and Secure-C173 enrolled patients between 18-60 years of age; mean patient age was 42.1 years and 41.6 years, respectively. For the Prestige LP and Prestige CT,169 patients were required to be at least 18 years of age (no upper limit specified) and the mean age was 44.5 years. In the Mobi-C trials, the studies accepted patients ranging from age 18-69 years; mean ages were 45.3 (Mobi-C 2-level)175 and 43.3 years(Mobi-C 1-level).174 The Bryan171 device had a minimum age requirement of 21 years with a mean patient age of 44.4 years. The PCM enrolled patients ranging from 18-65 years; mean age 45.3 years.172 The Discover device trial enrolled patients age 21-70 years (mean 44.2 years). Indications and contraindications for these devices are summarized in the sections that follow.
2.2.2.2 Indications Indications for FDA-approved Prestige LP and CT, ProDisc-C, Secure-C, Mobi-C 1 and 2-level, PCM, and Bryan artificial cervical discs can be summarized as follows: Skeletally mature patients Single-level symptomatic cervical disc disease (SCDD) from C3-C7 (all except Mobi-C 2-level) or
two consecutive level SCDD from C3-C7 (Mobi-C 2-level) Demonstrate progressive signs or symptoms despite nonoperative treatment (Mobi-C 1 and 2-
level) Failure of at least six weeks of nonoperative treatment (except ProDisc-C and Prestige LP) Implanted via an open anterior approach (ProDisc-C, Prestige CT, and Bryan) Implanted vis anterior approach (Prestige LP, Secure-C, Mobi-C 1 and 2-level, PCM, and Bryan)
2.2.2.3 Contraindications Contraindications for FDA-approved Prestige LP and CT, ProDisc-C, Secure-C, Mobi-C 1 and 2-level, PCM, and Bryan artificial cervical discs can be summarized as follows: Active systemic infection or infection localized to site of implantation Osteoporosis or osteopenia (all except Prestige CT) Cervical instability (except Prestige CT, Mobi-C 2-level, Bryan) Allergy to implant materials (all except ProDisc-C) Severe spondylosis (ProDisc-C, Prestige LP, Secure-C) Clinically compromised vertebral bodies at affected level (ProDisc-C, Mobi-C 1 and 2-level)

WA – Health Technology Assessment December 19, 2016
Artificial disc replacement – Re-review: Final evidence report Page - 66
Moderate to advanced spondylosis (Bryan) Spinal stenosis (PCM)
2.2.2.4 Ongoing Clinical Trials Ongoing clinical trials were identified by searching clinicaltrials.gov for terms related to artificial disc replacement. A total of seven clinical trials investigating the use of C-ADR were identified that are relevant to the conditions of interest; two are recruiting, four are ongoing/active, and one is of unknown status. Of these, five compare single-level C-ADR to ACDF, three compare two-level C-ADR to ACDF, and one trial compares C-ADR to ACDF but does not specify the number of levels being treated. Trial details are available in Appendix I.
2.3 Comparator Treatments
2.3.1 Non-operative treatment In general, treatment of symptomatic DDD initially consists of non-surgical approaches. However, it is estimated that 10% to 20% of people with lumbar DDD and up to 30% with cervical DDD will be unresponsive to nonsurgical treatment.40 If no improvement is seen between two and six months of nonoperative treatment or if symptoms significantly worsen, patients may become candidates for surgical treatment.27 Lumbar For lumbar DDD, typical non-surgical approaches include physical therapy, acupuncture, facet joint injections, epidural steroids, anti-inflammatory drugs, analgesic medication, ultrasound, and cognitive behavioral interventions. 16,17,100,14116,17,96,13716,17,96,13716,17,96,137 Percutaneous laser discectomy and intradiscal electrothermal therapy are two examples of minimally invasive methods used to relieve pain in this population. More recent nonsurgical methods being explored include cell based therapies, growth factors, and gene therapy that target the reversal of degeneration. 160 Cervical Nonoperative treatments for cervical DDD may include the use of a cervical collar, temporary bed rest, application of heat or ice, physical therapy (muscle-strengthening exercises, aerobic training), weight control, electrical therapy, and the administration of analgesics, including anti-inflammatory medications and epidural injections.15,106,137 For cervical DDD, the aim of initial noninvasive treatment is to relieve pain and prevent permanent injury to the spinal cord and nerves. However, nonoperative management typically does not reverse or permanently stop the progression of the disease.137 Many patients with symptomatic cervical DDD become eligible for surgery; 50% to 70% of patients with cervical myelopathy and 25% with cervical radiculopathy fail to achieved adequate pain relief with nonoperative treatment.105 Furthermore, surgical treatment is frequently a consideration for patients with cervical DDD due to the risk of neurological deterioration.137
2.3.2 Spinal Fusion Initially, treatment of symptomatic DDD typically consists of nonsurgical approaches which are described below. Surgery may be considered when nonoperative treatments for at least six months (lumbar spine) or six weeks (cervical spine) fail to relieve symptoms attributed to spinal DDD or to prevent progression of nerve damage in the case of radiculopathy or myelopathy.

WA – Health Technology Assessment December 19, 2016
Artificial disc replacement – Re-review: Final evidence report Page - 67
Lumbar Traditionally, patients pursuing surgical treatment of lower back pain underwent lumbar spinal fusion, but in recent years the efficacy of the procedure has become increasingly controversial. An evidence-based clinical practice guideline from the American Pain Society published in 2009 indicated that fusion surgery was only beneficial for patients experiencing severe pain unresponsive to nonsurgical therapies for at minimum one year.32 The disadvantages of the procedure as well as concerns about its long-term consequences and benefits have prompted research on alternative surgical methods. Complications of fusion include the potential for adjacent segment degeneration (development of disc degeneration, hypertrophic facets, dynamic instability, and/or spinal stenosis in adjacent levels), pseudoarthrosis, bone graft donor site pain and infection, instrumentation prominence or failure, neural injuries, and simple failure to relieve pain.16,53,165 Four RCTs comparing lumbar fusion to nonsurgical treatments found that nearly 15% (58/399) of patients receiving lumbar fusion experienced complications.19,20,51,55 The most frequent complications reported included reoperation (with rates ranging from 0%-46.1%), infection (0%-9%), device-related complications (0%-17.8%), neurologic complications (0.7%-25.8%), thrombosis (0%-4%), bleeding/vascular complications (0%-12.8%), and dural injury (0.5%-29%).19,20,51,55 One of the main concerns regarding fusion surgery is that it may promote degeneration of vertebrae adjacent to the fusion site. Because surgical fusion results in loss of movement in the spine, adjacent vertebrae experience increased mobility and stress due to motion transfer from the immobile fused vertebrae. Evidence from one study suggests that approximately 26% of patients receiving lumbar fusion may develop new lumbar adjacent segment disease (L-ASD) within the first 10 years following fusion.57 Annualized incidence rates of symptomatic ASD from case-series ranged from 0%33 to 3.9%.49 It is unclear whether there is a greater risk for radiographic L-ASD in fusion patients compared with nonfusion patients. L-ASD rates among fusion patients ranged from 14.2% to 44.3% compared with 7.4% to 26.0% among patients who didn’t receive fusion based on four comparative studies.63,83,89,150 From case-series, radiographic ASD rates ranged from 1%31 to 100%108 following lumbar fusion and again, varied based on definition. The poor quality of these studies, divergent definitions of ASD, and the lack of correlation between radiographic L-ASD and symptomatic clinical disease make definitive conclusions regarding the extent to which L-ASD occurs following fusion difficult. Cervical Surgery is generally indicated when nonoperative conservative treatments fail to prevent neurologic progression. Although a variety of surgical approaches and procedures are available, the optimal choice of treatment remains controversial. Surgical procedures designed to decompress the spinal cord and, in some cases, stabilize the spine have been shown to be successful, but there is a persistent percentage of patients who do not improve with surgical intervention.138 Additionally, the potential complications of surgery for cervical DDD may depend on the various methods of surgical management. For many years, the posterior approach to decompress the cervical spine was used. In general this procedure resulted in favorable results for soft, accessible disc fragments. However, in order to better access midline fragments and calcified spurs, the anterior approach was developed.46 Anterior approaches include anterior cervical discectomy alone (ACD) and anterior cervical discectomy with fusion (ACDF, using autograft, allograft, bone graft substitutes).128 ACD has usually been associated with postoperative neck pain, low fusion rates and higher rates of cervical deformity.3,98,110 As a result, ACDF has become a common surgical option for many surgeons for the treatment of radiculopathy or myelopathy as a result of central or paracentral disc herniations, or osteoarthritis of the facet or uncovertebral joint. The goal of ACDF is nerve decompression and restoration of spinal alignment and

WA – Health Technology Assessment December 19, 2016
Artificial disc replacement – Re-review: Final evidence report Page - 68
stability, done by performing a partial or complete discectomy and decompression followed by the use of a bone graft to stabilize the spine.105,106,137,142 A range of factors must be considered when deciding which surgical technique to use, and surgeons are often challenged with determining the most appropriate technique because there is limited information about whether there is a difference between surgical procedures in terms of clinical and radiographic outcomes or in postoperative complication rates. Among surgically managed patients, an anterior or posterior approach may be employed.137 Among those managed posteriorly, laminoplasty or laminectomy with fusion are common surgical techniques. With several standards of care available for this population, a better understanding of the corresponding positive and negative outcomes with respect to clinical and patient-centered outcomes is warranted. There is a general trend for patients to see continued improvement for a few years after spinal fusion, but this improvement is often followed by functional deterioration. When the anterior surgical approach is used, this deterioration is thought to be caused by ASD.137 The incidence of ASD following cervical fusion is difficult to estimate due to the lack of comparative studies and poor quality of the few existing studies. In addition, varying definitions of ASD make definitive diagnosis difficult. For symptomatic C-ASD, the most methodologically rigorous longitudinal study reported a 2.9% annual incidence rate of C-ASD,68and case-series report rates of ASD between 6%-17%.59,86,95,162,187 Radiographic evidence of ASD has been reported to occur in 41%-92% of patients following spinal fusion based on varying definitions.59,66,86,88,162,187 Importantly, there is a lack of correlation between radiographic ASD and clinical symptoms. Studies which were able to effectively evaluate the separate effects of degeneration due to aging and degeneration which may be exacerbated following fusion were not identified. The development of symptomatic ASD can increase the need for subsequent surgery if it causes pain or disability.105 Data from two studies suggest that while the majority of patients (74%–84%) appeared to remain free of symptomatic C-ASD at 10 years after surgical fusion, survival analysis suggests that 16%–26% of patients have new disease within the first 10 years.68,77 By 17 years, the rate of C-ASD increased to 33% in one study.77 Spinal fusion surgery is also associated with complications such as pseudoarthrosis, graft or implant failure, instrument failure, continued growth of osteocytes, and neural injuries, as well as reoperation.105,137 There is also the risk of prolonged pain, deep infection, adjacent nerve and artery damage, and increased risk of stress fracture at the bone donor site in the hip; immunological reactions to allografts may also occur.106
2.4 Clinical Guidelines
The National Guideline Clearinghouse (NGC), PubMed, and Google were searched for evidence-based guidelines related to the use of artificial disc replacement in patients with relevant conditions. Key word searches were performed: “Artificial disc”, “disc replacement”, “disc prosthesis”, and “disc arthroplasty”. Lumbar Artificial Disc Replacement (L-ADR) Guidelines Three guidelines provided recommendations for use of ADR in the lumbar spine and are summarized below. Details of each clinical guideline, including the class/grade of recommendation and level of evidence, can be found in Table 2.

WA – Health Technology Assessment December 19, 2016
Artificial disc replacement – Re-review: Final evidence report Page - 69
• American Pain Society, 200932: Interventional therapies, surgery, and interdisciplinary rehabilitation for low back pain: ADR is recommended for single-level degenerative disc diseases in patients with non-radicular low back pain, but is not recommended for patients with non-radicular low back pain, common degenerative spinal changes, and persistent and disabling symptoms.
• Colorado Division of Workers’ Compensation, 201436: Low back pain medical treatment guidelines: L-ADR is recommended for patients with low back pain.
• American College of Occupational and Environmental Medicine, 20112: Low back disorders: ADR is not recommended for chronic non-specific LBP; radicular pain syndromes, including sciatica; and spinal stenosis.
Cervical Artificial Disc Replacement (C-ADR) Guidelines Three guidelines provided recommendations for use of ADR in the lumbar spine and are summarized below. Details of each clinical guideline, including the class/grade of recommendation and level of evidence, can be found in Table 2.
• North American Spine Society, 2010155: Diagnosis and Treatment of Cervical Radiculopathy from Degenerative Disorders: For single-level degenerative cervical radiculopathy, C-ADR is recommended as a comparable intervention to ACDF for the treatment of cervical radiculopathy from degenerative disorders. However, more RCTs and long-term follow up are needed to validate these findings.
• Colorado Division of Workers’ Compensation, 201435: Cervical spine injury medical treatment guidelines: C-ADR is recommended for patients with single-level radiculopathy or myelopathy.
• American College of Occupational and Environmental Medicine, 20111: Cervical and thoracic spine disorders: ADR is recommended for subacute or chronic radiculopathy and myelopathy. It is not recommended for chronic cervicothoracic pain or chronic non-specific cervical pain.

WA – Health Technology Assessment December 19, 2016
Artificial disc replacement – Re-review: Final evidence report Page - 70
Table 2. Summary of Clinical Guidelines
Guideline Evidence Base Recommendation Rating/
Strength of Recommendation
Lumbar American Pain Society Interventional therapies, surgery, and interdisciplinary rehabilitation for low back pain: an evidence-based clinical practice guideline from the American Pain Society (2009)32
1 SR of 161 RCTs For patients with non-radicular low back pain, L-ADR for single-level degenerative disc diseases is recommended through 2 years.
B/Fair*
State of Colorado Department of Labor and Employment, Division of Workers’ Compensation Low back pain medical treatment guidelines (2014)36
L-ADR: NR In patients with low back pain: • There is some evidence that L-ADR
has a slight advantage over multidisciplinary intensive treatment for 60 hours over 5 weeks.
• There is strong evidence that L-ADR is not inferior to fusion at 24 months for relief of back pain, reduction of disability, and provision of patient satisfaction.
• There is good evidence that the Charites disc is not inferior to allograft fusion with the BAK cage for single-level disease and some evidence that the ProDisc is non-inferior to circumferential fusions with iliac crest autograft for single-level disease.
• There is some evidence that a two-level lumbar disc replacement is not inferior to circumferential fusion in patients with 2-level DDD 24 months after surgery.
• There is good evidence from a comparison of ProDisc-L versus circumferential fusion that arthroplasty is not inferior to fusion and for preservation of motion over fusions.
• There is some evidence from a five-year follow-up of ProDisc-L versus circumferential fusion that arthroplasty reduces the risk of adjacent disease.
NR
American College of Occupational and
NR For low back disorders, ACOEM does not recommend:

WA – Health Technology Assessment December 19, 2016
Artificial disc replacement – Re-review: Final evidence report Page - 71
Guideline Evidence Base Recommendation Rating/
Strength of Recommendation
Environmental Medicine (ACOEM)† Low back disorders (2011)2
• ADR for chronic non-specific LBP; • ADR for radicular pain syndromes,
including sciatica; or • ADR for spinal stenosis.
I‡ I‡ I‡
Cervical North American Spine Society (NASS) Diagnosis and Treatment of Cervical Radiculopathy from Degenerative Disorders (2010)155
2 RCTs
ACDF and C-ADR are suggested to be comparable treatments, resulting in similarly successful short term outcomes, for single level degenerative cervical radiculopathy. However, more long term follow-up and additional independent, masked, prospective RCTs are needed to further validate these results.
B§
State of Colorado Department of Labor and Employment, Division of Workers’ Compensation Cervical spine injury medical treatment guidelines (2014)35
C-ADR: 2 SRs For cervical spine injury patients with single-level radiculopathy or myelopathy: • There is strong evidence that C-
ADR produces 2 year success rates at least equal to those of ACDF with allograft interbody fusion and an anterior plate.
• There is some evidence that C-ADR requires fewer revision operations than ACDF after the first two years of treatment, and that C-ADR slightly decreases neck pain at 5 years compared to ACDF.
• There is good evidence that arthroplasty produces greater segmental range of motion after 1-2 years than fusion, but the clinical significance is unknown.
NR
American College of Occupational and Environmental Medicine (ACOEM)‡ Cervical and thoracic spine disorders (2011)1
NR For cervical and thoracic spine disorders, ACOEM does not recommend: • ADR for chronic cervicothoracic
pain; or
I‡
• ADR for chronic non-specific cervical pain.
I‡
For cervical and thoracic spine disorders, ACOEM does recommend: • ADR for subacute or chronic
radiculopathy; and
B‡
• ADR for myelopathy. B‡ ACDF: Anterior cervical discectomy and fusion; ADR: Artificial disc replacement; C-ADR: Cervical artificial disc replacement; DDD: Degenerative disc disease; LBP: Low back pain; L-ADR: Lumbar artificial disc replacement; NR: Not reported; SR: Systematic review; RCT: Randomized controlled trial

WA – Health Technology Assessment December 19, 2016
Artificial disc replacement – Re-review: Final evidence report Page - 72
* American Pain Society guidelines definitions for recommendation grades Strongly recommend (A): The panel recommends that clinicians consider offering the intervention to eligible patients. The panel found good evidence that the intervention improves health outcomes and concludes that benefits substantially outweigh harms. Moderately recommend (B): The panel recommends that clinicians consider offering the intervention to eligible patients. The panel found at least fair evidence that the intervention improves health outcomes and concludes that benefits moderately outweigh harms, or that benefits are small but there are no significant harms, costs, or burdens associated with the intervention. No recommendation for or against (C): The panel makes no recommendation for or against the intervention. The panel found at least fair evidence that the intervention can improve health outcomes, but concludes that benefits only slightly outweigh harms, or the balance of benefits and harms is too close to justify a general recommendation. Recommend against (D): The panel recommends against offering the intervention. The panel found at least fair evidence that the intervention is ineffective or that harms outweighs benefits. Insufficient (I): The panel found insufficient evidence to recommend for or against the intervention. Evidence that the intervention is effective is lacking, of poor quality, or conflicting, and the balance of benefits and harms cannot be determined. American Pain Society guidelines definitions for strength of evidence ratings Good: Evidence includes consistent results from well-designed, well-conducted studies in representative populations that directly assess effects on health outcomes (at least 2 consistent, higher-quality trials). Fair: Evidence is sufficient to determine effects on health outcomes, but the strength of the evidence is limited by the number, quality, size, or consistency of included studies; generalizability to routine practice; or indirect nature of the evidence on health outcomes (at least 1 higher-quality trial of sufficient sample size; 2 or more higher quality trials with some inconsistency; at least 2 consistent, lower-quality trials, or multiple consistent observational studies with no significant methodologic flaws). Poor: Evidence is insufficient to assess effects on health outcomes because of limited number or power of studies, large and unexplained inconsistency between higher-quality trials, important flaws in trial design or conduct, gaps in the chain of evidence, or lack of information on important health outcomes. † Guideline authors do not specify whether procedure being evaluated is C-ADR or L-ADR. ‡ ACOEM strength of recommendations (evidence rating) definitions Strongly recommended (Evidence rating: A): The intervention is strongly recommended for appropriate patients. The intervention improves important health and functional outcomes based on high quality evidence, and the Evidence-Based Practice Panel (EBPP) concludes that benefits substantially outweigh harms and costs. Moderately recommended (Evidence rating: B): The intervention is recommended for appropriate patients. The intervention improves important health and functional outcomes based on intermediate quality evidence that benefits substantially outweigh harms and costs. Recommended (Evidence rating: C): The intervention is recommended for appropriate patients. There is limited evidence that the intervention may improve important health and functional benefits. Insufficient- no recommendation (Evidence rating: I): This is consensus-based. The evidence is insufficient to recommend for or against routinely providing the intervention. The EBPP makes no recommendation. Evidence that the intervention is effective is lacking, of poor quality, or conflicting and the balance of benefits, harms, and costs cannot be determined. Insufficient- not recommended (Evidence rating: I): This is consensus-based. The evidence is insufficient for an evidence-based recommendation. The intervention is not recommended for appropriate patients because of high costs or high potential for harm to the patient. Not recommended (Evidence rating: C): Recommendation against routinely providing the intervention. The EBPP found at least intermediate evidence that harms and costs exceed benefits based on limited evidence. Moderately not recommended (Evidence rating: B): Recommendation against routinely providing the intervention to eligible patients. The EBPP found at least intermediate evidence that the intervention is ineffective, or that harms or costs outweigh benefits. Strongly not recommended (Evidence rating: A): Strong recommendation against providing the intervention to eligible patients. The EBPP found high quality evidence that the intervention is ineffective, or that harms or costs outweigh benefits. § NASS standardized grades of recommendation definitions A: Good evidence (Level I studies with consistent findings) for or against recommending intervention. B: Fair evidence (Level II or III studies with consistent findings) for or against recommending intervention. C: Poor quality evidence (Level IV or V studies) for or against recommending intervention. I: Insufficient or conflicting evidence not allowing a recommendation for or against intervention.

WA – Health Technology Assessment December 19, 2016
Artificial disc replacement – Re-review: Final evidence report Page - 73
2.5 Previous Systematic Reviews/Technology Assessments
Health technology assessments (HTAs) were identified by searching the following databases for (“artificial disc replacement” OR “artificial disk replacement” OR “ADR” OR “total disc replacement” OR “total disk replacement” OR “TDR” OR “disc arthroplasty” OR “disk arthroplasty”) AND “health technology assessment”: PubMed; International Network of Agencies for Health Technology Assessment (INAHTA); the University of York Centre for Reviews and Dissemination database; the National Institute for Health and Care Excellence (NICE) Guidance Database; Google Scholar; as well as individual health technology assessment sites such as ECRI, Institute for Clinical and Economic Review (ICER), Hayes, Agency for Healthcare Research and Quality (AHRQ), and the BlueCross BlueShield (BCBS) Technology Evaluation Center. One HTA was found that evaluated both L-ADR and C-ADR, and three HTAs were found that evaluated C-ADR only (Table 3). Previous systematic reviews (SRs) were found by searching PubMed using the search strategy described in Appendix B. A total of 12 SRs were selected using the criteria described below – six evaluated L-ADR and six C-ADR. These SRs are summarized in Table 4. Lumbar Artificial Disc Replacement (L-ADR) While no HTAs provided summary strength of evidence conclusions, one SR (Jacobs 2012)79 did – the conclusions from which are summarized below: L-ADR versus Fusion:
• Function: Compared to fusion, L-ADR led to greater ODI score improvement at 24 months follow-up, although this was not clinically significant (moderate strength of evidence).
• Pain: L-ADR was associated with greater improvements in back pain than ACDF at 24 months follow-up, although this was not clinically significant (low strength of evidence).
• Device failure: Definitions of failure were variable among studies; as such, it was difficult to evaluate device-related failures (very low strength of evidence).
• Complications: Perioperative complications were not adequately or consistently reported (very low strength of evidence).
L-ADR versus Rehabilitation:
• Function: L-ADR is possibly superior to rehabilitation for ODI improvement at 12 and 24 months (low strength of evidence).
• Pain: L-ADR is possibly superior to rehabilitation for improvement in back pain at 24 months follow-up (very low strength of evidence).
• Device failure: Jacobs 201279 concluded that there was no difference in reoperations at 24 months follow-up (low strength of evidence).
Cervical Artificial Disc Replacement (C-ADR) SRs on C-ADR were selected based on the following criteria: publication date in or later than 2015, formal risk of bias assessment, and quantitative analysis. Because of the large number of potentially relevant SRs, those that included the highest number of relevant trials or that included trials not included in other SRs (despite overlap in some RCTs between SRs), and/or those that focused on specific outcomes of interest (e.g., reoperation, dysphagia) were selected for inclusion. None of the included SRs or HTAs regarding C-ADR provided levels of recommendations for their evidence base. The SRs are summarized in Table 4

WA – Health Technology Assessment December 19, 2016
Artificial disc replacement – Re-review: Final evidence report Page - 74
Table 3. Previous Health Technology Assessments
Assessment (year) Search Dates Diagnosis Treatments Evaluated Evidence Base
Available Primary Conclusions Critical Appraisal
Lumbar KCE (2015)73 Belgian Health Care Knowledge Centre (KCE) Cervical and lumbar total disc replacements Note: Lumbar only
2006 to October 2014
Chronic lumbar indications, including DDD and lumbar disc hernia (either 1- or 2-level disease)
L-ADR vs. conservative treatment and/or discectomy and fusion
L-ADR: 1 SR, 4 full economic evaluations and 1 literature review
Efficacy L-ADR vs. Fusion:
- Pain and functional status for L-ADR were not clinically different between groups.
- Long-term (>5 years) clinical outcomes are not significant for mobility or back pain between groups.
- Function as measured by the ODI statistically favored L-ADR over fusion after 6 months and 2 years. Two studies found that this difference was not maintained at 5 years.
- Back pain as measured by the VAS scale statistically favored L-ADR over fusion at 6 months and 2 years.
- There was no statistical difference between L-ADR or fusion for leg pain as measured with the NRS scale at 1 or 2 years.
L-ADR vs. Rehabilitation: - For L-ADR versus
rehabilitation, there was no clinically significant difference between groups for back pain and functional status.
No

WA – Health Technology Assessment December 19, 2016
Artificial disc replacement – Re-review: Final evidence report Page - 75
Assessment (year) Search Dates Diagnosis Treatments Evaluated Evidence Base
Available Primary Conclusions Critical Appraisal
- There was a statistically significant difference for ODI favoring L-ADR at 1 and 2 years follow-up.
- There was a statistically significant difference in back pain as measured by the VAS favoring L-ADR at 1 and 2 years follow-up.
Safety L-ADR vs. Fusion: 1- and 2-Level Disease
- There is insufficient evidence to determine long-term safety outcomes for L-ADR versus fusion.
L-ADR vs. Rehabilitation: 1- and 2-Level Disease
- There is insufficient evidence to determine long-term safety outcomes for lumbar disc replacement versus rehabilitation.
Economic L-ADR vs. Conservative treatment: 1- and 2-Level Disease
- A Norwegian study found that ICER was favorable with EQ-5D QoL data but not for SF-6D data.
L-ADR vs. Fusion: 1- and 2-Level Disease
- The data was inconclusive, with one study favoring L-

WA – Health Technology Assessment December 19, 2016
Artificial disc replacement – Re-review: Final evidence report Page - 76
Assessment (year) Search Dates Diagnosis Treatments Evaluated Evidence Base
Available Primary Conclusions Critical Appraisal
ADR and the other study favoring fusion regarding incremental QUALYs.
- Overall, there is a lack of high-quality economic evaluations and a need for better long-term information on crucial input parameters (e.g., safety); as such, it is difficult to draw definite conclusions regarding the cost-effectiveness of L-ADR versus fusion or versus conservative treatment.
Cervical BCBS Association (2014)15 BlueCross BlueShield Association Technology Evaluation Center Artificial Intervertebral Disc Arthroplasty for Treatment of Degenerative Disc Disease of the Cervical Spine
Database inception through August 2013
Cervical DDD C-ADR vs. single-level ACDF
6 RCTs (N=2163)
Efficacy C-ADR vs. single-level ACDF
- NDI and overall success composite outcome results indicated that for all devices, C-ADR was non-inferior to ACDF at two years follow-up. Long-term follow-up at 4-5 years of 3 devices indicate similar clinical outcomes between groups, as well as lower reoperation rates in C-ADR than ACDF patients. Overall success rates were better with C-ADR versus ACDF. Results were consistent among all trials.
Safety
No

WA – Health Technology Assessment December 19, 2016
Artificial disc replacement – Re-review: Final evidence report Page - 77
Assessment (year) Search Dates Diagnosis Treatments Evaluated Evidence Base
Available Primary Conclusions Critical Appraisal
C-ADR with Prestige ST Cervical disc vs. Fusion: 1-level
- Secondary surgical procedures were more prevalent in the fusion group (p NR), as were secondary surgical procedures for adjacent-level disease (p=NS).
- There was no difference between groups for any adverse event.
C-ADR with ProDisc-C vs. Fusion: 1-level
- Secondary surgical procedures were more common in the fusion group compared to the C-ADR group (p < 0.05).
- There was no difference between groups for adverse events.
C-ADR with Bryan Cervical Disc vs. Fusion: 1-level
- There was no difference between groups for secondary surgical procedures or adverse events.
C-ADR with PCM Cervical Disc vs. Fusion: 1-level
- There was no difference between groups for secondary surgical procedures or adverse events.

WA – Health Technology Assessment December 19, 2016
Artificial disc replacement – Re-review: Final evidence report Page - 78
Assessment (year) Search Dates Diagnosis Treatments Evaluated Evidence Base
Available Primary Conclusions Critical Appraisal
C-ADR with Secure-C Disc vs. Fusion: 1-level
- There was no difference between groups for overall adverse events.
C-ADR with Mobi-C Disc vs. Fusion: - Patients receiving C-ADR
experienced had fewer device-related AEs (p < 0.05) and device failures compared to patients receiving fusion. There was no difference between groups for surgery-related AEs, severe AEs, AEs within 48 hours of surgery, or secondary procedures at the index level.
Economic NR
CTAF (2009)180 California Technology Assessment Forum Artificial Disc Replacement for Degenerative Disc Disease of the Cervical Spine
1966 to July 2009
Cervical DDD C-ADR vs. single-level ACDF
3 RCTs (N=1215) Efficacy - C-ADR was non-inferior to
ACDF for two-year clinical outcomes, which included NDI scores, neck and arm pain scores, neurologic success,* and overall success.* However, the impact after two years is unknown.
Safety - The rate of adverse events
in the C-ADR group was non-inferior to the adverse
No
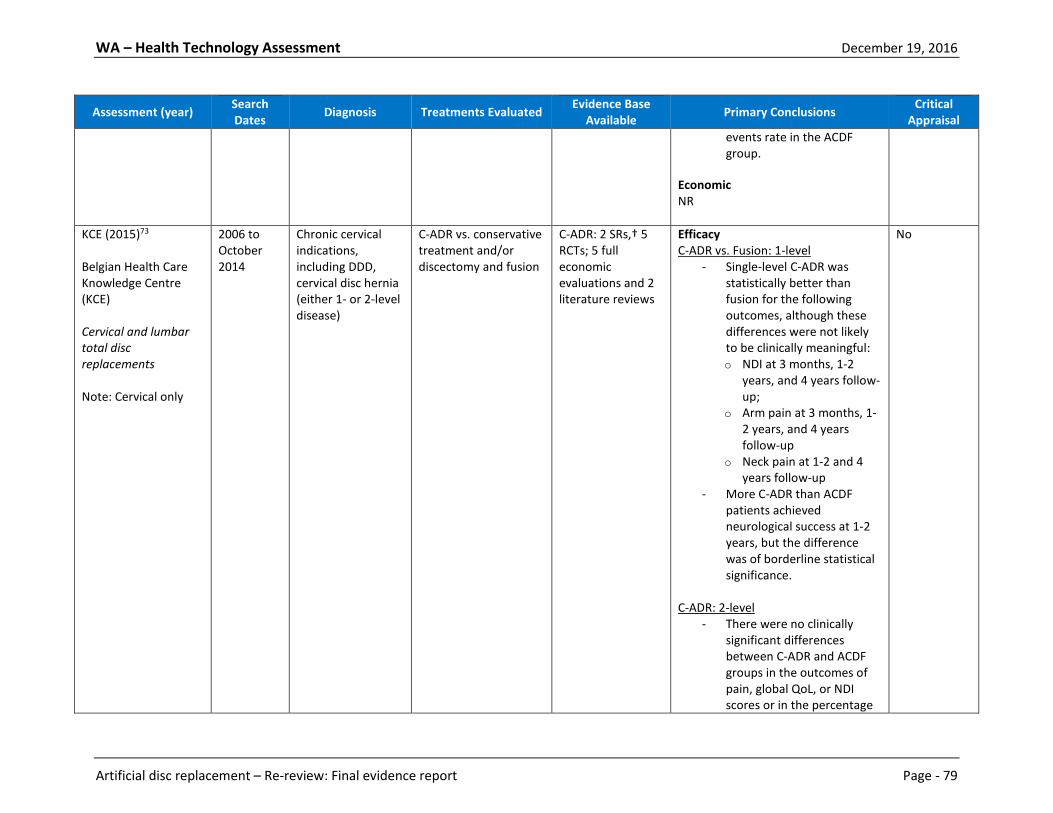
WA – Health Technology Assessment December 19, 2016
Artificial disc replacement – Re-review: Final evidence report Page - 79
Assessment (year) Search Dates Diagnosis Treatments Evaluated Evidence Base
Available Primary Conclusions Critical Appraisal
events rate in the ACDF group.
Economic NR
KCE (2015)73 Belgian Health Care Knowledge Centre (KCE) Cervical and lumbar total disc replacements Note: Cervical only
2006 to October 2014
Chronic cervical indications, including DDD, cervical disc hernia (either 1- or 2-level disease)
C-ADR vs. conservative treatment and/or discectomy and fusion
C-ADR: 2 SRs,† 5 RCTs; 5 full economic evaluations and 2 literature reviews
Efficacy C-ADR vs. Fusion: 1-level
- Single-level C-ADR was statistically better than fusion for the following outcomes, although these differences were not likely to be clinically meaningful: o NDI at 3 months, 1-2
years, and 4 years follow-up;
o Arm pain at 3 months, 1-2 years, and 4 years follow-up
o Neck pain at 1-2 and 4 years follow-up
- More C-ADR than ACDF patients achieved neurological success at 1-2 years, but the difference was of borderline statistical significance.
C-ADR: 2-level
- There were no clinically significant differences between C-ADR and ACDF groups in the outcomes of pain, global QoL, or NDI scores or in the percentage
No

WA – Health Technology Assessment December 19, 2016
Artificial disc replacement – Re-review: Final evidence report Page - 80
Assessment (year) Search Dates Diagnosis Treatments Evaluated Evidence Base
Available Primary Conclusions Critical Appraisal
of patients who achieved neurological success.
- The following outcomes were significantly better with 2-level C-ADR versus ACDF: o NDI at 2 and 4 years
follow-up; o Neck pain at 3 months
and 2 years follow-up; and
o Arm pain at 2 years follow-up.
Safety C-ADR vs. Fusion: 1-level
- Single-level C-ADR has less revision surgery at the index level at 1-2 years follow-up compared to fusion.
- There is a statistical difference in favor of C-ADR for the overall rate of index level surgery at 1-2 years follow-up.
- There appears to be no difference between groups for secondary surgery at adjacent levels after 1-2 years or for the incidence of dysphagia after 2 years.
C-ADR vs. Fusion: 2-level
- More studies on two-level disease are needed to reliably determine safety

WA – Health Technology Assessment December 19, 2016
Artificial disc replacement – Re-review: Final evidence report Page - 81
Assessment (year) Search Dates Diagnosis Treatments Evaluated Evidence Base
Available Primary Conclusions Critical Appraisal
issues; these evaluations are based on only two RCTs and should be interpreted cautiously.
- Two-level C-ADR appears to have significantly less subsequent surgical interventions after 2 and 4 years, and device-related adverse events after 2 years.
- Patient symptoms related to a degenerative adjacent level are not well-reported.
- There does not appear to be a difference between groups in rate of dysphagia after 2 years.
Economic C-ADR vs. Fusion: 1- and 2-level
- Given the lack of high-quality economic evaluations and long-term information, it is difficult to draw conclusions regarding the cost-effectiveness of either single- or double-level C-ADR compared to fusion.
MSAC (2010)107 Medical Services Advisory Committee Use of artificial disc replacement in patients with cervical
Database inception to June 2009
Cervical DDD C-ADR vs. ACDF 3 trials among 18 total publications: 14 RCTs, 1 retrospective pilot study, 1 SR, and 2 retrospective cohort studies; 1
Efficacy and Safety - Three RCTs indicated that
more patients in the C-ADR group achieved the composite outcome of “overall success” (which contained both efficacy and safety components)
No

WA – Health Technology Assessment December 19, 2016
Artificial disc replacement – Re-review: Final evidence report Page - 82
Assessment (year) Search Dates Diagnosis Treatments Evaluated Evidence Base
Available Primary Conclusions Critical Appraisal
degenerative disc disease
economic evaluation
compared to patients in the ACDF group at 24 months (pooled OR, 1.65 (95% CI, 1.25, 2.19); pooled RR, 1.14 (95% CI, 1.06, 1.22); pooled RD, 0.10 (95% CI, 0.04, 0.15)).
Safety
- Reoperations were required in 5.4% of C-ADR patients compared to 7.7% of ACDF patients (p = 0.045) in one RCT. Another RCT showed that the C-ADR group had a significant lower re-operation rate at the adjacent segment level compared to the ACDF group (3 versus 9 patients, p = 0.0492).
- A single study reported that one patient in the ACDF group required a re-operation and three a supplemental fixation. In the ProSisc-C group, no re-operations or supplemental fixations were required.
Economic
- C-ADR is cost-effective compared to ACDF; incremental cost per QALY gained was estimated at $13,702 (AUD).

WA – Health Technology Assessment December 19, 2016
Artificial disc replacement – Re-review: Final evidence report Page - 83
ACDF: Anterior cervical discectomy and fusion; AE: Adverse Event; ASD: Adjacent segment degeneration; AUD: Australian dollars; C-ADR: Cervical artificial disc replacement; L-ADR: Lumbar artificial disc replacement; NDI: Neck Disability Index; NR: Not reported; ODI: Oswestry Disability Index; OR: Odds ratio; QUALY: Quality adjusted life years; RCT: Randomized controlled trial; RD: Risk difference; RR: Risk ratio; VAS: Visual analog scale * Neurologic success was based on postoperative maintenance or improvement in condition compared with the preoperative status. Indicators included motor function, sensory function, and deep tendon reflexes. Overall success was based on successful outcomes with NDI score (≥15 point improvement from pre to post-operative score and maintenance or improvement in neurological status). In addition, a patient could not have suffered a serious implant associated or implantation procedure associated adverse event or have undergone a second surgery classified as a failure. † One of the SRs included in the cTDR analysis for clinical effectiveness was withdrawn due to non-compliance with The Cochrane Collaboration’s Commercial Sponsorship Policy. The authors of the KCE 2015 HTA decided to retain this SR because they detected no publication bias and thus, felt the impact of including this study would be minor. Table 4. Selected Previous Systematic Reviews
SR Search dates Purpose Condition Comparison Primary
Outcomes Evidence
Base
Risk of Bias
Assessed Primary Conclusions
Lumbar
Hiratzka (2015)69 Database inception through May 2015 Pubmed, Cochrane collaboration, National Guideline Clearinghouse, bibliographies of key articles and previous SRs
To compare the AEs and reoperations of lumbar spinal fusion with those from L-ADR.
Axial or mechanical low back pain of ≥3 months’ duration due to degenerative joint disease defined as any of the following: degenerative disk disease, facet joint disease, and spondylosis.
L-ADR vs. lumbar fusion
Complications Surgery-related adverse events; types of complications; reoperations; overall adverse events
5 RCTs among 7 publications (1506 patients)
No Complications Analysis of AEs and reoperations between lumbar spinal fusion and L-ADR demonstrated consistently higher risks of both for fusion as compared with L-ADR. The risk of AEs was twice as high in patients undergoing lumbar fusion compared to patients undergoing L-ADR at two-year (pooled RR, 2.0 (95% CI, 1.4, 2.9)) and five-year follow-up (pooled RR, 2.0 (95% CI, 1.1, 3.5)).* Analysis of reoperation also indicated a greater risk in the lumbar fusion group versus

WA – Health Technology Assessment December 19, 2016
Artificial disc replacement – Re-review: Final evidence report Page - 84
SR Search dates Purpose Condition Comparison Primary
Outcomes Evidence
Base
Risk of Bias
Assessed Primary Conclusions
the L-ADR group at two years (pooled RR 1.7 (95% CI, 1.1, 2.6)), although there was no difference between groups at five years follow-up (pooled RR, 1.1 (95% CI, 0.57, 2.1)).
Jacobs (2012)79 Database inception through December 22, 2011 PubMed Central, MEDLINE (from 1966), EMBASE (from 1980), BIOSIS (from 2004), FDA register, ClinicalTrials.gov, citation tracking through ISI Thompson, references of included studies
To evaluate the effectiveness of T-ADR versus fusion or other treatment options; to evaluate the safety of disc replacement with regards to loosening, subsidence, wear, adjacent segment degeneration, facet joint degeneration, and perioperative complications; and to determine if there is an acceptable and safe salvage procedure in case of failure.
Back and/or leg pain due to DDD unresponsive to conservative treatment for at least 3 months.
L-ADR vs. Fusion or rehabilitation
Function Overall improvement, Oswestry Disability Index, Roland Morris Disease Questionnaire Pain VAS pain score (back pain and/or leg pain) Device failure Complications
7 RCTs (1305 patients)
Yes
L-ADR vs. Fusion Function Five studies found significantly better ODI score improvement with L-ADR versus fusion (pooled MD, 4.3 (95% CI, 1.9, 6.7)) at 24 months; however, this improvement did not exceed the predefined clinically relevant difference of 10 points (GRADE: Moderate). Pain Two studies found that L-ADR statistically improved back pain compared to fusion (pooled MD, 5.2 (95% CI, 0.2, 10.3)) at 24 months follow-up; however, this improvement did not exceed the predefined clinically relevant difference of 15 mm on the VAS (GRADE: Low). Device failure

WA – Health Technology Assessment December 19, 2016
Artificial disc replacement – Re-review: Final evidence report Page - 85
SR Search dates Purpose Condition Comparison Primary
Outcomes Evidence
Base
Risk of Bias
Assessed Primary Conclusions
Definitions of “failure” varied among studies comparing L-ADR to fusion; as a result, it was difficult to determine which failures were device-related (GRADE: Very Low). Complications Perioperative complications (e.g., blood loss, epidural abscess, allergic reaction) were not adequately or consistently reported among studies comparing L-ADR to fusion (GRADE: Very Low). L-ADR vs. Rehabilitation Function One study found that L-ADR may be superior to rehabilitation for function as measured by the ODI at 12 months (MD, 10 (95% CI, 5.0, 15)) and 24 months (MD, 8.0 (95% CI, 3.6, 13.2)) follow-up (GRADE for 12 and 24 months: Low). Pain One study found that L-ADR may be superior to rehabilitation for improvement in back pain as measured by the VAS at (MD

WA – Health Technology Assessment December 19, 2016
Artificial disc replacement – Re-review: Final evidence report Page - 86
SR Search dates Purpose Condition Comparison Primary
Outcomes Evidence
Base
Risk of Bias
Assessed Primary Conclusions
12.3 (95% CI, 3.1, 21.3)) 24 months (GRADE: Very Low). Device failure One study showed that there was no difference in the incidence of reoperation in patients undergoing L-ADR or rehabilitation after an unreported period of follow-up (GRADE: Low).
Nie (2015)116 Database inception to September 2011 PubMed, Cochrane Central Register of Controlled Trials, EMBASE
To evaluate if there is a beneficial effect of L-ADR versus lumbar fusion.
DDD L-ADR vs. lumbar fusion
Function Oswestry Disability Index (ODI), overall success rate† Pain VAS Device failure Reoperation rate for secondary surgery Complications Proportion of patients presenting with a composite of major complications
6 RCTs among 11 publications (1074 patients)
Yes
Function‡ There was a significantly greater improvement in ODI scores with L-ADR compared to fusion (pooled MD –4.9 (95% CI, –7.8, –1.9)) at 2 years. In addition, the overall success rate was achieved by significantly more L-ADR than fusion patients (pooled OR, 1.7 (95% CI, 1.3, 2.3)) at 2 years. Pain‡ L-ADR patients showed a significantly greater improvement in VAS pain scores than fusion patients (pooled MD, –5.1 (95% CI, –9.0, –1.3)) at 2 years. Device failure‡

WA – Health Technology Assessment December 19, 2016
Artificial disc replacement – Re-review: Final evidence report Page - 87
SR Search dates Purpose Condition Comparison Primary
Outcomes Evidence
Base
Risk of Bias
Assessed Primary Conclusions
(e.g., major vessel injury, neurologic damage, nerve root injury, etc.) and minor complications (e.g., clinically significant blood loss, retrograde ejaculation, deep venous thrombosis, etc.)
The incidence of reoperation was not different between patients receiving L-ADR or fusion (pooled OR, 0.6 (95% CI, 0.4, 1.1)) through 2 years. Complications‡ The incidence of complications was significantly lower with L-ADR versus fusion (pooled OR, 0.5 (95% CI, 0.3, 0.8)) through 2 years.
Rao (2014)135 Database inception through March 2013 Medline, Embase, Clinical, Ovid, BIOSIS, Cochrane registry
To compare the effectiveness and safety of L-ADR with lumbar fusion for the treatment of lumbar degenerative disc disease (DDD).
DDD L-ADR vs. Lumbar fusion
Function Oswestry Disability Index, overall clinical success Pain VAS Device failure Reoperation rate Complications Complication rates
7 RCTs (1651 patients)
Yes Function ODI scores were significantly better with L-ADR versus fusion (pooled RR, –5.1 (95% CI, – 7.3, –2.8)), at two years, however this improvement was not clinically meaningful. Overall functional recovery as measured by ODI success or overall clinical success was better in the L-ADR group compared to the fusion group at two year follow-up. Meta-analysis was not performed for this outcome due to the differing assessment systems used by the included studies.

WA – Health Technology Assessment December 19, 2016
Artificial disc replacement – Re-review: Final evidence report Page - 88
SR Search dates Purpose Condition Comparison Primary
Outcomes Evidence
Base
Risk of Bias
Assessed Primary Conclusions
Pain Pain scores were significantly lower in L-ADR versus fusion patients (pooled MD, –5.31 (95% CI, –8.4, –2.3)) at two years, however this improvement was not clinically meaningful. Device failure There was no difference between in the reoperation rate (pooled OR, 0.8 (95% CI, 0.4, 1.8)) through two years follow-up. Complications There was no difference between groups in the incidence of complications (pooled OR, 0.72 (95% CI, 0.5, 1.1)) through two years.
Thavaneswaran (2014)163 January 2005 to April 2012 PubMed, Embase, Cochrane
To assess the safety and effectiveness of lumbar AIDR for patients suffering from significant axial back pain and/or radicular (nerve root) pain,
Significant axial back pain and/or radicular (nerve root) pain, secondary to disc degeneration or prolapse
RCTs: L-ADR vs. Lumbar fusion Non-randomized study: L-ADR vs. ALIF
Function Oswestry Disability Index, procedural success rate Pain Pain scores Complications
6 RCTs in 9 publications (1573 patients); 1 non-randomized comparative study (24 patients)
No Function Five studies showed a greater improvement in ODI following L-ADR versus fusion at 18 months; two studies also showed a similar effect at two year follow-up. Four studies found that overall clinical success was more likely following L-ADR

WA – Health Technology Assessment December 19, 2016
Artificial disc replacement – Re-review: Final evidence report Page - 89
SR Search dates Purpose Condition Comparison Primary
Outcomes Evidence
Base
Risk of Bias
Assessed Primary Conclusions
secondary to disc degeneration or prolapse, who have failed nonoperative treatment.
Complication rates
compared to fusion at up to two years follow-up. Pain Five studies indicated a significantly greater improvement in pain following L-ADR compared with fusion at up to 18 months follow-up; two studies also showed this at two year follow-up. Complications There were no obvious differences in complication incidence rates between the two treatment groups, and serious adverse events were rare in both groups.
Wei (2013)183 Database inception to January 2013 PubMed Central, MEDLINE, Embase, BIOSIS, ClinicalTrials.gov, FDA clinical trials register
To compare the efficacy and safety of L-ADR to that of the fusion for the treatment of lumbar degenerative disc disease (DDD).
DDD L-ADR vs. Lumbar fusion
Function Oswestry Disability Index (ODI), ODI Success§ Pain Visual Analog Scale (VAS) Device failure Reoperation rate§
6 RCTs (1603 patients)
Yes Function ODI scores were better following L-ADR than fusion (pooled SMD, – 5.1 (95% CI, – 7.4, –2.9)) at two years. Pain VAS pain scores were better in the L-ADR group compared to the fusion group (pooled MD, –3.2 (95% CI, –5.7, –0.6)) at two years.

WA – Health Technology Assessment December 19, 2016
Artificial disc replacement – Re-review: Final evidence report Page - 90
SR Search dates Purpose Condition Comparison Primary
Outcomes Evidence
Base
Risk of Bias
Assessed Primary Conclusions
Complications Complication rates§
Device failure There was no difference the incidence of reoperation between groups (pooled OR, 0.9 (95% CI, 0.6, 1.5)) through two years. Complications The incidence of complications was lower in the L-ADR group compared to the fusion group (pooled OR, 0.6 (95% CI, 0.4, 0.8)) through two years.
Cervical
Zhong (2016, Reoperation)193 Database inception to June 2015 PubMed, EMBASE, and Cochrane CENTRAL
To compare C-ADR with ACDF regarding (1) the overall frequency of reoperation at the index and adjacent levels; (2) the frequency of reoperation at the index level; and (3) the frequency of reoperation at the adjacent levels.
Cervical spondylosis with radiculopathy or myelopathy
C-ADR vs. ACDF
Device failure Reoperation at index level; second surgery at adjacent level after ADR or ACDF
12 RCTs (3234 patients)
Yes Reoperation The C-ADR group had a significantly lower likelihood of undergoing reoperation at the index level between 2 and 7 years after surgery compared with the ACDF group (pooled RR, 0.50 (95% CI, 0.37, 0.68)). Similar results were found with respect to surgery at the adjacent level (pooled RR 0.52 (95% CI, 0.37, 0.74)).

WA – Health Technology Assessment December 19, 2016
Artificial disc replacement – Re-review: Final evidence report Page - 91
SR Search dates Purpose Condition Comparison Primary
Outcomes Evidence
Base
Risk of Bias
Assessed Primary Conclusions
Zhong (2016, Dysphagia)192 Database inception to November 2015 PubMed, EMBASE, and Cochrane CENTRAL
To evaluate the incidence of dysphagia after C-ADR compared with ACDF.
Degenerative cervical disc disease or spondylosis
C-ADR vs. ACDF
Safety Incidence of postoperative dysphagia
10 RCTs (2711 patients)
Yes Safety The incidence of dysphagia was significantly lower after C-ADR than after ACDF (pooled RR 0.76 (95% CI, 0.61, 0.94)) at 1 to 7 years follow-up.
Yao (2016)185 1995 through December 2015 Pubmed, Medline, EBSCO, Springer, Ovid, CNKI and Cochrane Database of Systematic Reviews
To evaluate the efficacy and safety of C-ADR and ACDF for treating cervical degenerative diseases.
Single-segment cervical spondylotic radiculopathy or cervical spondylotic myelopathy from C3-C7
C-ADR vs. ACDF
Function Neck Disability Index (NDI), neurological success,** overall success**
Device failure Secondary surgical procedures at the index or adjacent level Complications Dysphagia and dysphonia
6 RCTs among 9 publications (2121 patients)
Yes Function NDI scores at 2 to 5 years follow-up were similar between groups (pooled RR, 1.14 (95% CI, 0.77, 1.70)). However, significantly more ADR patients achieved neurological success (pooled RR, 1.69 (95% CI, 1.18, 2.40)) and overall success (pooled RR, 1.78 (95% CI, 1.40, 2.25)) at 2 to 5 years follow-up. Device failure There is a significant difference between ADR and ACDF favoring ACDF for the outcome of secondary surgical procedures (pooled RR, 0.48 (95% CI, 0.27, 0.84)), and secondary surgical procedures at the index level at 2 to 5 years follow-up
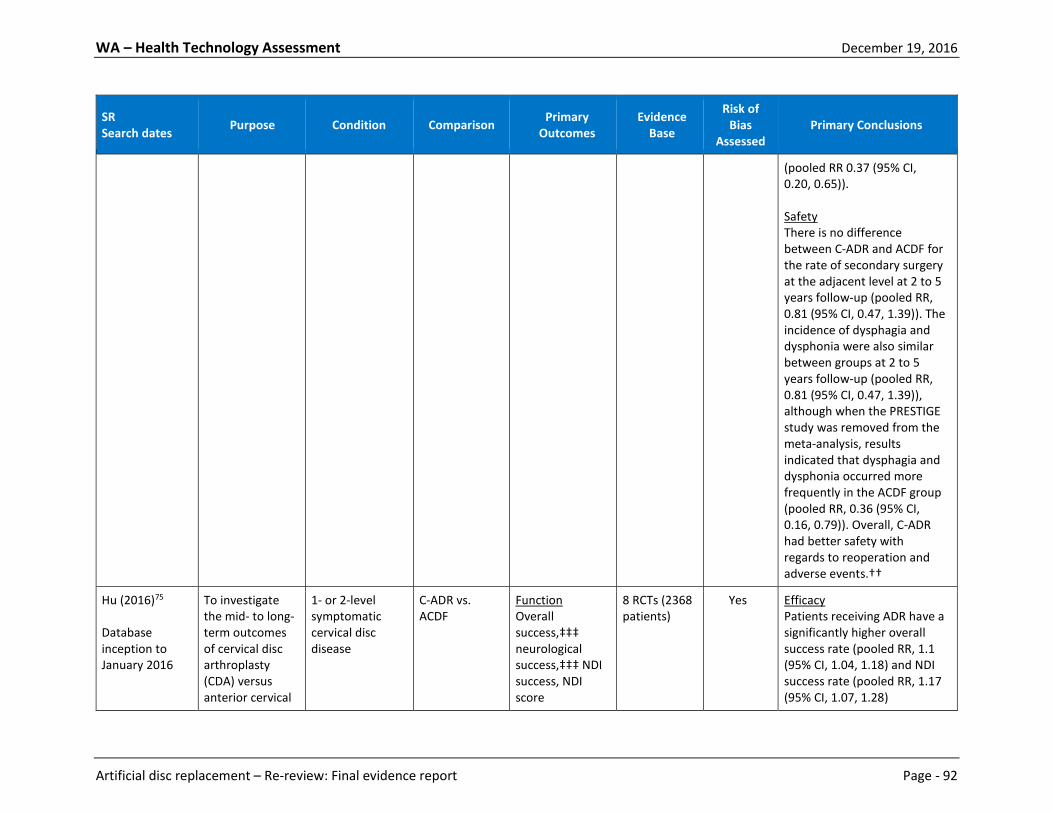
WA – Health Technology Assessment December 19, 2016
Artificial disc replacement – Re-review: Final evidence report Page - 92
SR Search dates Purpose Condition Comparison Primary
Outcomes Evidence
Base
Risk of Bias
Assessed Primary Conclusions
(pooled RR 0.37 (95% CI, 0.20, 0.65)). Safety There is no difference between C-ADR and ACDF for the rate of secondary surgery at the adjacent level at 2 to 5 years follow-up (pooled RR, 0.81 (95% CI, 0.47, 1.39)). The incidence of dysphagia and dysphonia were also similar between groups at 2 to 5 years follow-up (pooled RR, 0.81 (95% CI, 0.47, 1.39)), although when the PRESTIGE study was removed from the meta-analysis, results indicated that dysphagia and dysphonia occurred more frequently in the ACDF group (pooled RR, 0.36 (95% CI, 0.16, 0.79)). Overall, C-ADR had better safety with regards to reoperation and adverse events.††
Hu (2016)75 Database inception to January 2016
To investigate the mid- to long-term outcomes of cervical disc arthroplasty (CDA) versus anterior cervical
1- or 2-level symptomatic cervical disc disease
C-ADR vs. ACDF
Function Overall success,‡‡‡ neurological success,‡‡‡ NDI success, NDI score
8 RCTs (2368 patients)
Yes Efficacy Patients receiving ADR have a significantly higher overall success rate (pooled RR, 1.1 (95% CI, 1.04, 1.18) and NDI success rate (pooled RR, 1.17 (95% CI, 1.07, 1.28)

WA – Health Technology Assessment December 19, 2016
Artificial disc replacement – Re-review: Final evidence report Page - 93
SR Search dates Purpose Condition Comparison Primary
Outcomes Evidence
Base
Risk of Bias
Assessed Primary Conclusions
Medline, Embase, the Cochrane Central Register of Controlled Trials
discectomy and fusion (ACDF) for the treatment of 1-level or 2-level symptomatic cervical disc disease.
Pain VAS for Neck and arm pain Device failure Secondary procedures‡‡‡ Safety Serious adverse events‡‡‡
compared with patients receiving ACDF between 4 and 7 years follow-up. However, fewer C-ADR patients achieved neurological success than ACDF patients at 4 to 7 years follow-up (pooled RR, 1.04 (95% CI, 1.01, 1.08). NDI scores were better in patients receiving C-ADR compared to patients receiving ACDF at 4 to 7 years follow-up (pooled MD, –6.68 (95% CI, –9.17, –4.20)). Pain Neck pain scores were better in patients receiving C-ADR compared to patients receiving ACDF at 4 to 7 years follow-up (pooled MD, –7.61 (95% CI, –11.43, –3.79)). However, neck pain score improvement was better in patients receiving ACDF compared to patients receiving C-ADR at 4 to 7 years follow-up (pooled MD, 6.21 (95% CI, 1.76, 10.67). There was no difference between groups for arm pain scores (pooled MD, –3.72 (95% CI, –7.48, 0.04)) or arm

WA – Health Technology Assessment December 19, 2016
Artificial disc replacement – Re-review: Final evidence report Page - 94
SR Search dates Purpose Condition Comparison Primary
Outcomes Evidence
Base
Risk of Bias
Assessed Primary Conclusions
pain improvement scores (pooled MD, 3.59 (95% CI, –0.95, 8.12)) at 4 to 7 years follow-up. Device failure C-ADR was superior to ACDF regarding the rate of total secondary procedures involving the index or adjacent level at 4 to 7 years follow-up (pooled RR, 0.48 (95% CI, 0.39, 0.48)). Safety Most adverse events were medical problems unrelated to the index surgery or the cervical spine, but for implant/surgery-related serious adverse events for the assessment of safety, pooled results showed a lower rate following C-ADR (pooled RR, 0.62 (95% CI, 0.98, 1.06)), which suggests C-ADR is surgically safer than ACDF.
Zhang (2015)191 Database inception to December 2014
To compare the efficacy and safety of C-ADR and ACDF for the treatment of
Symptomatic cervical disc disease
C-ADR vs. ACDF
Function Neck Disability Index (NDI), NDI success, overall success,
19 RCTs (4516 patients)
Yes Function Patients treated with C-ADR had better NDI scores than those who received ACDF in the short- (pooled SMD, –
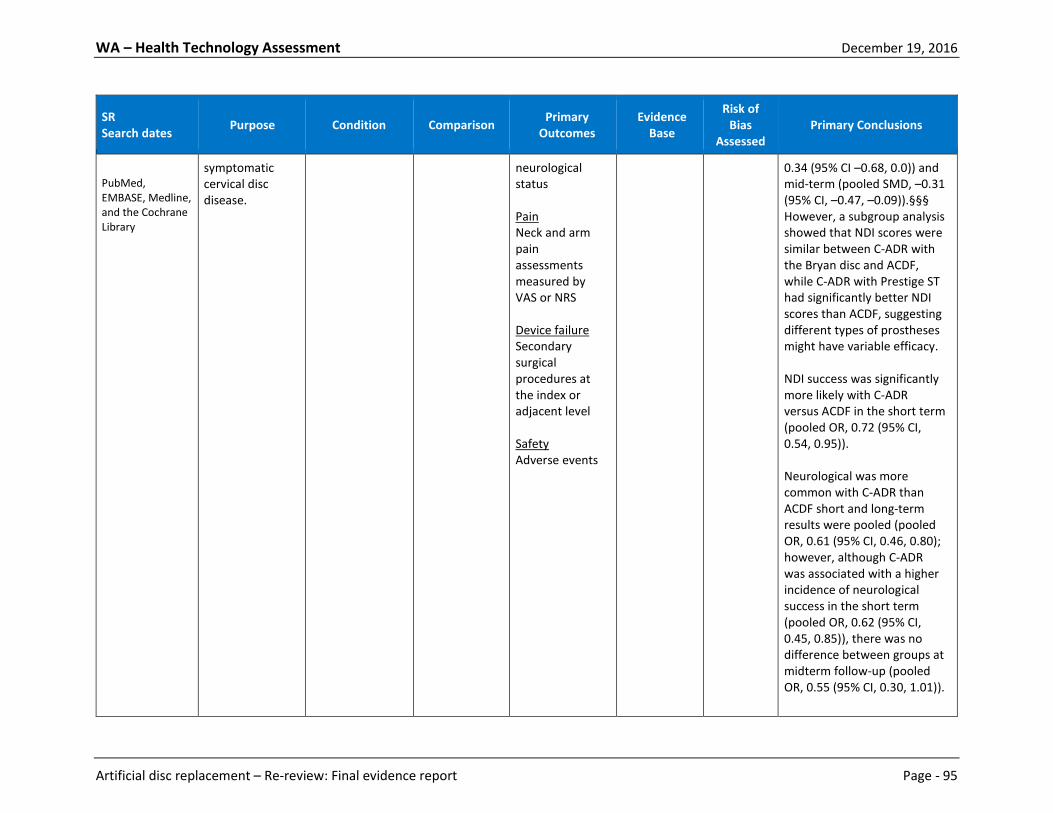
WA – Health Technology Assessment December 19, 2016
Artificial disc replacement – Re-review: Final evidence report Page - 95
SR Search dates Purpose Condition Comparison Primary
Outcomes Evidence
Base
Risk of Bias
Assessed Primary Conclusions
PubMed, EMBASE, Medline, and the Cochrane Library
symptomatic cervical disc disease.
neurological status Pain Neck and arm pain assessments measured by VAS or NRS Device failure Secondary surgical procedures at the index or adjacent level Safety Adverse events
0.34 (95% CI –0.68, 0.0)) and mid-term (pooled SMD, –0.31 (95% CI, –0.47, –0.09)).§§§ However, a subgroup analysis showed that NDI scores were similar between C-ADR with the Bryan disc and ACDF, while C-ADR with Prestige ST had significantly better NDI scores than ACDF, suggesting different types of prostheses might have variable efficacy. NDI success was significantly more likely with C-ADR versus ACDF in the short term (pooled OR, 0.72 (95% CI, 0.54, 0.95)). Neurological was more common with C-ADR than ACDF short and long-term results were pooled (pooled OR, 0.61 (95% CI, 0.46, 0.80); however, although C-ADR was associated with a higher incidence of neurological success in the short term (pooled OR, 0.62 (95% CI, 0.45, 0.85)), there was no difference between groups at midterm follow-up (pooled OR, 0.55 (95% CI, 0.30, 1.01)).

WA – Health Technology Assessment December 19, 2016
Artificial disc replacement – Re-review: Final evidence report Page - 96
SR Search dates Purpose Condition Comparison Primary
Outcomes Evidence
Base
Risk of Bias
Assessed Primary Conclusions
Pain C-ADR had lower NRS neck pain scores in the short-term, and lower NRS neck and arm pain scores in the midterm follow-up compared with ACDF. VAS neck and arm pain scores in the short-term also demonstrated that the C-ADR group had less pain than the ACDF group. Device failure There were fewer secondary surgical procedures at the index level (pooled OR, 0.32 (95% CI, 0.19, 0.53)) and at the adjacent segment (pooled OR, 0.28 (95% CI, 0.11, 0.72)) in the short-term with C-ADR versus ACDF. Similarly, there were fewer secondary surgical procedures at the index level with C-ADR at midterm follow-up (pooled OR, 0.45 (95% CI, 0.29, 0.68)), but there was no difference between groups for surgical procedures at the adjacent level at midterm follow-up (pooled OR, 0.76 (95% CI, 0.47, 1.22)).

WA – Health Technology Assessment December 19, 2016
Artificial disc replacement – Re-review: Final evidence report Page - 97
SR Search dates Purpose Condition Comparison Primary
Outcomes Evidence
Base
Risk of Bias
Assessed Primary Conclusions
Safety C-ADR was superior to ACDF in short-term follow-up (pooled OR, 0.58 (95% CI, 0.43, 0.80)); however, longer-term, multicenter studies are required for a better evaluation of long-term safety.
Rao (2015)136 Database inception through April 2014 Medline, Embase, Clinical, Ovid, BIOSIS and Cochrane Central
To compare the effectiveness and safety of C-ADR with ACDF for treatment of symptomatic cervical disc disease.
Symptomatic cervical disc disease
C-ADR vs. ACDF
Function Neurological success Pain VAS for neck and arm pain Device failure Secondary surgical procedures Complications Adverse events
18 RCTs (4061 patients)
Yes Function C-ADR was superior to ACDF for the outcome of neurological success (pooled OR, 1.57 (95% CI, 1.30, 1.90)) at 4 to 6 years follow-up. Pain There was no difference between C-ADR and ACDF for neck (pooled MD, –0.25 (95% CI, –0.53, 0.06)) and arm pain (pooled MD, 0.04 (95% CI, –0.23, 0.31)) at 4 to 6 years follow-up. Device failure C-ADR was superior to ACDF for fewer secondary surgical procedures (pooled OR, 0.47, (95% CI, 0.34, 0.65)) at 4 to 6 years follow-up. Safety

WA – Health Technology Assessment December 19, 2016
Artificial disc replacement – Re-review: Final evidence report Page - 98
SR Search dates Purpose Condition Comparison Primary
Outcomes Evidence
Base
Risk of Bias
Assessed Primary Conclusions
C-ADR has a lower rate of adverse events compared to ACDF (pooled OR, 0.58 (95% CI, 0.46, 0.73)) at 4 to 6 years follow-up.
ACDF: Anterior cervical discectomy and fusion; AE(s): Adverse event(s); C-ADR: Cervical artificial disc replacement; CI: Confidence interval; DDD: Degenerative disc disease; L-ADR: Lumbar artificial disc replacement; GRADE: Grading of Recommendations Assessment, Development, and Evaluation; MD: Mean difference; NDI: Neck disability index; NRS: Numeric rating scale; ODI: Oswestry disability index; OR: Odds Ratio; RCT(s): Randomized controlled trial(s); RR: Risk ratio; SMD: Standardized mean difference; VAS: Visual analog scale * Reported results from abstract, results, and discussion-- reporting from these sources of five year follow-up for surgery-related AEs was not consistent with results seen in Figure 2, which showed no difference between groups at five years follow-up. † Overall success was defined as achieving all of the following: 25% improvement in ODI score at 24 months compared with pre-operative score; no device failure; no major complications; no major neurological deterioration compared to pre-operative status. ‡ An alternative pooled analysis was also done excluding a study with stand-alone cage interbody fusion as the comparator indicated that results for this outcome were the same. § ODI Success was defined as a 15% improvement from baseline. Device failure was defined as a 15% improvement from baseline. Complications included device failures necessitating reoperation. ** Not defined in paper. †† Not formally assessed, adverse events not described. ‡‡‡ Overall Success: was considered achieved if a patient met all of the following items: NDI success, neurological success, absences of implant/surgery-related serious adverse events and secondary procedure. Neurological Success: Neurological success was determined as postoperative maintenance or improvement in each of the individual neurological evaluations (muscle strength, sensory deficit, and reflex functions) compared with the preoperative status. Secondary Procedures: Defined as any reoperation, revision, supplemental fixation, or implant removal. Serious Adverse Events: Defined as grade 3 or 4 adverse events based on the WHO criteria. §§§ Short-term follow-up is defined as 2-3 years follow-up; midterm follow-up is defined as 4-5 years follow-up.

WA – Health Technology Assessment December 19, 2016
Artificial disc replacement – Re-review: Final evidence report Page - 99
2.6 Medicare and Representative Private Insurer Coverage Policies
Individual payer websites, the Centers for Medicare and Medicaid Services (CMS) website, and Google were searched for coverage decisions on the use of L-ADR and C-ADR for conditions of interest to this report. Policy plans were identified from six payers, five of which are bellwether national payers. The CMS has a National Coverage Decision (NCD) for L-ADR but not C-ADR. Coverage policies are consistent and cover C-ADR but not necessarily L-ADR for conditions of interest. Coverage decisions are summarized briefly below; policy details are provided in Table 5. Lumbar Artificial Disc Replacement (L-ADR) • Centers for Medicare and Medicaid Services National Coverage Decisions: CMS has determined
that L-ADR is not covered for Medicare beneficiaries over 60 years of age. • United Healthcare and Medicare Advantage Plans: L-ADR is not covered for members over age 60;
coverage for those under age 60 is based on the discretion of local contractors. • Premera Blue Cross: L-ADR is not covered. • Aetna: Aetna considers L-ADR to be experimental and investigational for lumbosacral degenerative
disc disease and all other indications. • United Healthcare: L-ADR is not covered for treating single or multiple-level DDD in skeletally
mature patients. • Cigna: Cigna covers FDA-approved L-ADR for chronic, unremitting, discogenic LBP and disability
secondary to single-level DDD when all criteria are met. FDA-approved C-ADR for symptomatic cervical DDD at one or two levels is also covered in skeletally mature patients when all criteria are met.
Cervical Artificial Disc Replacement (C-ADR) • Centers for Medicare and Medicaid Services National Coverage Decisions: CMS does not have a
NCD for C-ADR. • Aetna: Aetna covers C-ADR for treatment of skeletally mature patients with symptomatic cervical
DDD or a herniated disc at one level from C3-C7 when specific criteria are met. • United Healthcare: C-ADR of FDA-approved prostheses for DDD with symptomatic intractable
radiculopathy and/or myelopathy is covered when specific criteria are met. C-ADR is also covered for treating symptoms of DDD at one level even if there is radiological evidence of DDD at multiples levels. C-ADR is covered for treating symptomatic contiguous two-level DDD in skeletally mature patients with used according to US FDA-labeled indications. Single-level C-ADR combined with cervical spinal fusion at another level is not covered.
• Cigna: C-ADR for any other indications is not covered. • Premera Blue Cross: C-ADR is covered when all criteria are met, but is considered investigational for
all other indications.

WA – Health Technology Assessment December 19, 2016
Artificial disc replacement – Re-review: Final evidence report Page - 100
Table 5. Overview of payer technology assessments and policies Payer,
Policy Name
Literature Search Dates
Disc(s) evaluated Evidence base available Policy Summary Rationale/ Comments
L-ADR Centers for Medicare and Medicaid Services (CMS) National Coverage Determination (NCD) for Lumbar Artificial Disc Replacement (150.10) Last review: 03/2013 Next review: NR
2002 to 2007
NR • 2 RCTs (86% f/u, 24 mos.); N = 596; monolevel arthroplasty only
• 1 nonrandomized CT (% f/u NR, 24 mos.); N = 24
• 19 case series (87% f/u for 5/19 reports, 1-204 months); N = 1082
For services performed on or after August 2007, CMS has found that L-ADR is not reasonable and necessary for the Medicare population over 60 years of age; therefore, L-ADR is non-covered for Medicare beneficiaries over 60 years of age. For Medicare beneficiaries age 60 and younger, there is no NCD for L-ADR.
NR
United Healthcare and Medicare Advantage Plans Artificial Disc Replacement, Cervical and Lumbar (Policy No. L-005) Last review date: 03/15/2016 Next review: NR
NR NR NR L-ADR is not covered for members over age 60. Coverage for L-ADR for members age 60 and younger will be based on the discretion of the local contractors.
For members age 60 and younger, relevant CPT codes: 22857, 22862, 0163T, 0165T Relevant cervical artificial disc CPT codes: 22856, 22858, 22861, 22864, 0095T, 0098T
Premera Blue Cross
Through October 2013
Charité® Lumbar Artificial Disc (SB Charité III)/INMOTION®
• RCTs, case series, health technology assessments (N NR)
• 2 SRs
L-ADR is considered investigational. Relevant codes: 22857, 22862, 22865, 22586, 0163T, 0164T, 0165T

WA – Health Technology Assessment December 19, 2016
Artificial disc replacement – Re-review: Final evidence report Page - 101
Payer, Policy Name
Literature Search Dates
Disc(s) evaluated Evidence base available Policy Summary Rationale/ Comments
Artificial Intervertebral Disc: Lumbar Spine (Policy No. 7.01.87) Last review: 08/11/2015 Next review: NR
lumbar artificial disc, ProDisc®-L Lumbar, FlexiCore® lumbar disc, Activ-L™ lumbar disc, Kineflex-L™ lumbar disc, Maverick™ lumbar disc
• 2 guidelines
•
Aetna* Intervertebral Disc Prostheses (Number: 0591) Last review: 11/20/2015 Next review: 07/08/2015
Exhaustive search up to July 2013
Charité® Lumbar Artificial Disc (SB Charité III), ProDisc®-L Lumbar, Nubac, DASCOR Arthroplasty System
• 116 studies, study type NR†
Aetna considers L-ADR (e.g., Charité Artificial Disc, ProDisc-L Total Disc Replacement) experimental and investigational for lumbosacral degenerative disc disease and for all other indications. Aetna considers prosthetic intervertebral discs experimental and investigational for persons who have degenerative disc disease or herniated disc at more than 1 level.‡ Aetna considers lumbar partial disc prosthetics (e.g., Nubac, DASCOR Disc Arthroplasty system) experimental and investigational because of insufficient evidence of their effectiveness.
CPT codes not covered for indications listed in the CPB: +0163T, +0165T, 0375T, 22857, 22862 Other CPT codes related to the CPB: +0164T, 22533, 22612, 22630, 22865 ICD-10 codes covered if selection criteria are met: G54.9, M50.30-M50.33, M53.1 ICD-10 codes not covered for indications listed in the CPB: M51.36-M51.37
United Healthcare
NR Charité® Lumbar Artificial Disc (SB Charité III), ProDisc®-
• 24 RCTs, prospective studies, retrospective
L-ADR is unproven and not medically necessary for treating single- or multi-level DDD in skeletally mature patients.
Applicable CPT codes:

WA – Health Technology Assessment December 19, 2016
Artificial disc replacement – Re-review: Final evidence report Page - 102
Payer, Policy Name
Literature Search Dates
Disc(s) evaluated Evidence base available Policy Summary Rationale/ Comments
Total Artificial Disc Replacement for the Spine (Policy No. 2016T0437Q) Last review: 06/01/2016 Next review: NR
L Lumbar, activL® Artificial Disc
studies, and case series
• 1 guideline • 1 SR • 3 HTAs
0163T, 0164T, 0165T, 22857, 22862, 22865
Cigna Intervertebral Disc Prostheses (Policy No. 0104) Last review: 06/15/2016 Next review: 12/15/2016
NR Charité® Lumbar Artificial Disc (SB Charité III), ProDisc®-L Lumbar, ProDisc II, Maverick, FlexiCore™ lumbar disc, AcroFlex® lumbar disc, Freedom Lumbar Disc, Kineflex Lumbar Artificial Disc, M6-L Artificial Lumbar Disc
Used case series, retrospective case reviews, observational studies, RCTs, HTAs, and guidelines (N NR)†
Cigna covers the surgical implantation of an FDA-approved L-ADR for chronic, unremitting, discogenic low back pain and disability secondary to single-level DDD as medically necessary in a skeletally mature individual when ALL criteria are met.§
Single-level L-ADR, covered as medically necessary: 22857 Multi-level L-ADR, not covered: 0163T
C-ADR •
Aetna* Intervertebral Disc Prostheses (Number: 0591) Last review: 11/20/2015 Next review: 07/08/2015
Exhaustive search up to July 2013
BRYAN® Cervical Disc, Mobi-C® Cervical Disc, Prestige Cervical Disc, PRODISC-C© Total Disc Replacement, Secure®-C Cervical Artificial Disc
• 116 studies, study type NR†
FDA-approved prosthetic intervertebral discs (e.g., Bryan Cervical Disc, MOBI-C, Prestige Cervical Disc, ProDisc-C Total Disc Replacement, Secure C Artificial Cervical disc) are medically necessary for treatment of skeletally mature persons with symptomatic cervical degenerative disc disease or herniated disc at one level from C3-C7 when specific criteria are met.** Aetna considers concurrent or planned sequential C-ADR with cervical spinal fusion experimental and investigational for the management of neck pain, spinal disorders, and all other indications.
CPT codes covered if selection criteria are met: 22856, 22861 CPT codes not covered for indications listed in the CPB: +0098T, 0375T, 22858

WA – Health Technology Assessment December 19, 2016
Artificial disc replacement – Re-review: Final evidence report Page - 103
Payer, Policy Name
Literature Search Dates
Disc(s) evaluated Evidence base available Policy Summary Rationale/ Comments
Other CPT codes related to the CPB: +0095T, 22548, 22551, +22552, 22554, 22558, 22590, 22595, 22600, 22864 ICD-10 codes covered if selection criteria are met: G54.2, G54.9, M50.00-M50.03, M50.10-M50,13, M50.20-M50.23, M50.30-M50.33, M53.1
United Healthcare Total Artificial Disc Replacement for the Spine (Policy No. 2016T0437Q) Last review: 06/01/2016 Next review: NR
NR Prestige™ ST Cervical Disc, ProDisc-C© Total Disc Replacement, BRYAN® Cervical Disc, Secure®-C Artificial Disc, Mobi-C® Cervical Disc Lumbar Charité® Lumbar Artificial Disc (SB Charité III), ProDisc®-L Lumbar, activL® Artificial Disc
Single-level • 21 RCTs, prospective
studies and case series 3 HTAs
• 2 guidelines 2-level • 1 RCT
C- ADR of FDA-approved prostheses for DDD with symptomatic intractable radiculopathy and/or myelopathy is proven and medically necessary in a skeletally mature individual when specific criteria are met.†† C- ADR is proven and medically necessary for treating symptoms of DDD at one level despite radiological evidence of DDD at multiple levels. C-ADR is proven and medically necessary for treating symptomatic contiguous two level DDD in skeletally mature patients when used according to FDA labeled indications. C-ADR at one level combined with cervical spinal fusion surgery at another level (adjacent or non-adjacent) performed in the same surgical setting is unproven and not medically necessary.
Applicable CPT codes: 0095T, 0098T, 0375T, 22856, 22858, 22861, 22864

WA – Health Technology Assessment December 19, 2016
Artificial disc replacement – Re-review: Final evidence report Page - 104
Payer, Policy Name
Literature Search Dates
Disc(s) evaluated Evidence base available Policy Summary Rationale/ Comments
Cigna Intervertebral Disc Prostheses (Policy No. 0104) Last review: 06/15/2016 Next review: 12/15/2016
NR Prestige™ ST Cervical Disc, Prestige LP Cervical Disc, PRODISC-C© Total Disc Replacement, BRYAN® Cervical Disc, Secure®-C Cervical Artificial Disc, PCM® Cervical Disc system, Mobi-C® Cervical Disc, CerviCore™ cervical disc, Flexicore™ Cervical Disc Replacement, Kineflex/C™ cervical disc, DISCOVER® cervical disc, NeoDisc™ cervical disc
Used case series, retrospective case reviews, observational studies, RCTs, HTAs, and guidelines (N NR)†
Cigna covers surgical implantation of FDA-approved C-ADR devices for symptomatic cervical DDD at one or two contiguous levels as medically necessary in a skeletally mature individual when ALL criteria are met.‡‡ Cigna does not cover C-ADR for ANY other indication.§§
Single- or two-level C-ADR, covered when medically necessary: 22856, 22858 Multi-level C-ADR, not covered: 0375T
Harvard Pilgrim Healthcare Artificial Cervical Disc Replacement Revised: 12/15 Last review: 12/2015 Next review: NR
NR PRODISC-C© Total Disc Replacement, BRYAN® Cervical Disc, Mobi-C® Cervical Disc
• 1 HTA • 6 study type NR • 5 payer policies • 1 guideline
Harvard Pilgrim Health Care considers C-ADR medically necessary when a member meets all the following criteria:
• The individual is skeletally mature; • Single-level disc degeneration has been
confirmed on complex imaging studies (CT, MRI, radiography);
• Cervical DDD with radiculopathy and/or myelopathy is present at one level from C3-C7;
• Non-operative treatment, including PT, NSAID medication, and activity modification for at least 6 weeks has been unsuccessful; and
• a FDA-approved artificial intervertebral disc device is used.
Relevant codes: 22856 (covered), 22858 (not covered)

WA – Health Technology Assessment December 19, 2016
Artificial disc replacement – Re-review: Final evidence report Page - 105
Payer, Policy Name
Literature Search Dates
Disc(s) evaluated Evidence base available Policy Summary Rationale/ Comments
Premera Blue Cross Artificial Intervertebral Disc: Cervical Spine (Policy No. 7.01.108) Last review: 08/11/2015 Next review: NR
Through November 2014
Kineflex/C™ cervical disc, DISCOVER® cervical disc, NeoDisc™ cervical disc, M6-C cervical disc Prestige cervical disc, ProDisc-C, Bryan, Kineflex-C, Mobi-C, PCM Cervical, Secure-C
• 10 RCTs • 3 guidelines
C-ADR may be considered medically necessary when all criteria are met.*** C-ADR is considered investigational for all other indications.†††
Relevant codes: 0375T, 0095T, 0098T, 22856, 22858, 22861, 22864
C-ADR: Cervical artificial disc replacement; CMS: Centers for Medicare and Medicaid Services; CPB: Clinical policy bulletin; CPT: Current procedural terminology; CT: Computed tomography; DDD: Degenerative disc disease; f/u: Follow-up; FDA: Food and Drug Administration; HTA: Health technology assessment; ICD: International Statistical Classification of Diseases and Related Health Problems; L-ADR: Lumbar artificial disc replacement; MRI: Magnetic resonance imaging; NCD: National coverage determination; No.: Number; NR: Not reported; NSAID: Nonsteroidal anti-inflammatory drug; PT: Physical therapy; RCT: Randomized controlled trial; SR: Systematic review * This payer policy covers both lumbar and cervical ADR; lumbar/cervical policy is listed in relevant section. † This evidence base is for both C-ADR and L-ADR. ‡ It is not stated that this is directly related to L-ADR. § Criteria include: Unremitting low back pain and significant functional impairment is refractory to at least six consecutive months of structured, physician supervised
conservative medical management, which includes ALL of the following components: exercise, including core stabilization exercises; nonsteroidal and/or steroidal medication (unless contraindicated); physical therapy, including passive and active treatment modalities; activity/lifestyle modification. Additionally, single-level disc degeneration has been confirmed on complex imaging studies (i.e., computerized tomography [CT] scan, magnetic resonance imaging [MRI]) AND the implant will be inserted at an FDA approved lumbar/sacral level specific to the implant being used.
** Criteria include: 1) All other reasonable sources of pain have been ruled out; and 2) Presence of neck or cervico-brachial pain with findings of weakness, myelopathy, or sensory deficit; and 3) Imaging studies (e.g. CT or MRI) indicate nerve root or spinal cord compression at the level corresponding with the clinical findings; and 4) Member has failed at least 6 weeks of conservative therapy (unless there is evidence of cervical cord compression, which requires urgent intervention); and 5) Member has physical and neurological abnormalities confirming the historical findings of nerve root or spinal cord compression (e.g. reflex charge, sensory loss, weakness) at or below the level of the lesion and may have gait or sphincter disturbance (evidence of cervical dermatomal distribution of the level of surgery and other criteria (other sources of pain have been ruled out, failure of conservative therapy) are thoroughly documented); and 6) Member’s activities of daily living are limited by persistent neck or cervico-brachial pain.
†† At least one of the following is met: herniated disc; osteophyte formation; AND both of the following: documented patient history of neck and/or arm pain and/or a functional/neurological deficit associated with the cervical level to be treated, failed at least six weeks of non-operative treatment before implantation (only applicable for elective surgery; emergent surgery, or does not require prior non-operative treatment).
‡‡ 1) Single-level or two contiguous level disc degeneration has been confirmed on complex imaging studies (i.e., CT, MRI, X-ray) demonstrating at least ONE of the following at each level: Herniated nucleus pulposus; spondylosis (i.e., presence of osteophytes); visible loss of disc height compared to adjacent levels.2) The planned implant will be

WA – Health Technology Assessment December 19, 2016
Artificial disc replacement – Re-review: Final evidence report Page - 106
used in the reconstruction of a cervical disc at C3-C7, following single-level or two-level discectomy. 3) The individual is a candidate for single-level or two-level anterior cervical decompression and interbody fusion. 4) EITHER of the following: unremitting cervical radiculopathy and/or myelopathy (i.e., neck and arm pain) resulting in disability and/or neurological deficit that are refractory to at least six weeks of standard conservative, nonoperative management (e.g., reduced activities, exercise, analgesics, physical therapy); demonstrated progressive signs/symptoms of nerve root and/or spinal cord compression despite nonoperative treatment before implantation that requires immediate/urgent surgical treatment.
§§ Non-covered indications include: the planned procedure includes the combined use of a prosthesis and spinal fusion (i.e., hybrid surgery); simultaneous multilevel implantation is planned at >2 diseased levels or two non-contiguous levels; the individual had prior fusion at an adjacent cervical level (Page 3 of 39 Coverage Policy Number: 0104); the individual had prior surgery at the treated level; osteopenia, osteomalacia, or osteoporosis (e.g., T-score of -3.5, or -2.5, with associated compression fracture); neck or arm pain of unknown etiology; absence of neck and/or arm pain; progressive neurological deficit or deterioration; infection, systemic or local; rheumatoid arthritis or other autoimmune disease; Paget’s disease, osteomalacia or any other metabolic bone disease; radiological evidence of ANY of the following: clinically significant cervical instability, such as kyphotic deformity or spondylolisthesis (e.g., > 3.5 mm subluxation or > 11 degrees angulation), significant cervical anatomical deformity or compromised vertebral bodies at the index level (e.g., ankylosing spondylitis, rheumatoid arthritis, or compromise due to current or past trauma), multilevel degenerative disc, or spinal metastases; implantation of non FDA–approved cervical disc prosthesis; FDA-approved cervical disc prosthesis used.
*** 1. The device is approved by FDA 2. The patient is skeletally mature 3. The patient has intractable cervical radicular pain or myelopathy a. Which has failed at least 6 weeks of conservative nonoperative treatment, including active pain management program or protocol, under the direction of a physician, with pharmacotherapy that addresses neuropathic pain and other pain sources AND physical therapy; OR b. If the patient has severe or rapidly progressive symptoms of nerve root or spinal cord compression requiring hospitalization or immediate surgical treatment. 4. Degeneration is documented by magnetic resonance imaging (MRI), computed tomography (CT), or myelography 5. Cervical degenerative disc disease is limited to a single level from C3-C7 6. The patient is free from contraindication to cervical artificial intervertebral disc implantation.
††† Disc implantation at more than 1 level; combined use of an artificial cervical disc and fusion; prior surgery at the treated level; previous fusion at another cervical level; multilevel disc disease; translational instability; anatomical deformity (e.g., ankylosing spondylitis); rheumatoid arthritis or other autoimmune disease; presence of facet arthritis; active infection; metabolic bone disease (e.g., osteoporosis, osteopenia, osteomalacia); or malignancy.

WA – Health Technology Assessment December 19, 2016
Artificial disc replacement – Re-review: Final evidence report Page - 107
3. The Evidence
3.1 Methods of the Systematic Literature Review
3.1.1 Objectives The primary aim of this assessment is to update the 2008 report based on systematic review and synthesis of subsequently published evidence on the efficacy, safety, and cost-effectiveness of ADR in the cervical and lumbar spine.
3.1.2 Key Questions (from previous report) 1. What is the evidence of efficacy and effectiveness of ADR compared with comparative therapies
(including non-operative therapy; spinal fusion; other surgery)?
2. What is the evidence related to the ADR safety profile? (including device failure, reoperation)
3. What is the evidence of differential efficacy or safety issues amongst special populations (including but not limited to the elderly and workers compensation populations)?
4. What are the cost implications and cost effectiveness for ADR
3.1.3 Inclusion/exclusion criteria
Inclusion and exclusion criteria are summarized in Table 6. Briefly, included studies met the following requirements with respect to participants, intervention, comparators, outcomes, and study design:
Inclusion and exclusion criteria are summarized as follows: • Population:
o Lumbar: Patients undergoing primary L-ADR for DDD without neurological compromise and who have not had prior spine surgery at the instrumented level.
o Cervical: Patients undergoing primary C-ADR for DDD resulting in radiculopathy or myelopathy and who have not had prior surgery at the instrumented level.
• Intervention: L-ADR or C-ADR with commercially available device (defined as FDA-approved devices or unapproved devices in Phase III trials with ≥ 1 year of follow-up data in a peer-reviewed journal).
• Comparators: Non-operative treatment, spinal fusion, other spine surgery. Comparator interventions that employ a device not FDA-approved for use in the US will be excluded.
• Outcomes: Studies must report on at least one of the following: o Physical function/disability (overall clinical success, ODI [L-ADR] or NDI [C-ADR]) o Pain/pain reduction o Device failure (reoperation at the index level – to include revision, reoperation, or removal) o Complications (e.g., migration, subsidence, neurologic injury as well as infection, vascular
damage, heterotopic ossification, others)

WA – Health Technology Assessment December 19, 2016
Artificial disc replacement – Re-review: Final evidence report Page - 108
The following secondary outcomes are reported if presented with studies meeting the above criteria: o Quality of life (SF-36) o Incidence of adjacent segment disease (e.g., reoperation at the adjacent level)
• Study design: This report will focus on evidence that evaluates efficacy and effectiveness and has the least potential for bias. For Key Question 1, only randomized controlled trials (RCTs) and comparative studies with concurrent controls will be considered (N≥50 for lumbar ADR; N≥100 for cervical ADR). For Key Question 2, adverse events or harms reported in the RCTs and nonrandomized studies included for Key Question 1 will be included; in addition, summaries of case series with the evaluation of safety as a primary study objective may be considered (with N≥100 and ≥80% follow-up) and very briefly summarized to provide additional context. High quality systematic reviews will be appraised and incorporated if feasible. RCTs and comparative cohort studies with concurrent controls and low risk of bias published subsequent to such reviews and will be evaluated based on the PICO inclusion/exclusion criteria. As this report serves to update the 2008 assessment, only comparative studies published subsequent to that review will be included and described; results will be described based on the context of previous findings. For Key Question 3, RCTs which stratify on patient or other characteristics and formally evaluate statistical interaction (effect modification) will be sought. For Key Question 4 only full, formal economic studies (i.e., cost-effectiveness, cost-utility, cost-minimization, and cost-benefit studies) will be considered
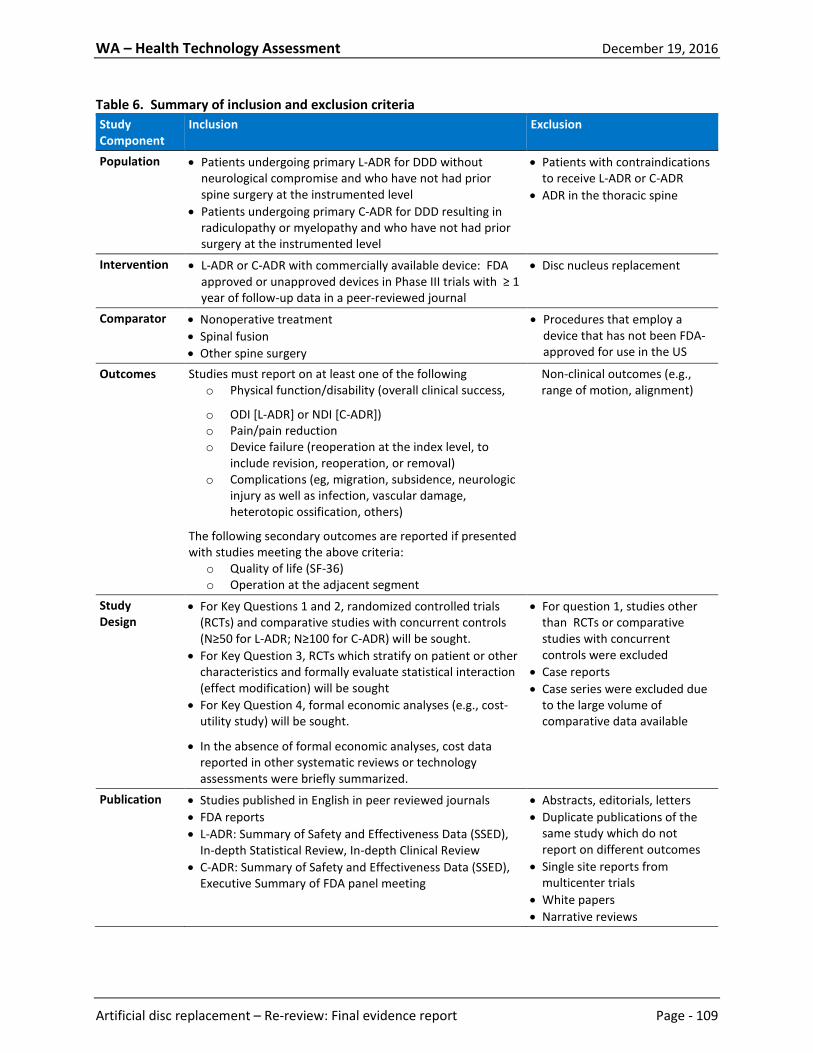
WA – Health Technology Assessment December 19, 2016
Artificial disc replacement – Re-review: Final evidence report Page - 109
Table 6. Summary of inclusion and exclusion criteria Study Component
Inclusion Exclusion
Population
• Patients undergoing primary L-ADR for DDD without neurological compromise and who have not had prior spine surgery at the instrumented level
• Patients undergoing primary C-ADR for DDD resulting in radiculopathy or myelopathy and who have not had prior surgery at the instrumented level
• Patients with contraindications to receive L-ADR or C-ADR
• ADR in the thoracic spine
Intervention
• L-ADR or C-ADR with commercially available device: FDA approved or unapproved devices in Phase III trials with ≥ 1 year of follow-up data in a peer-reviewed journal
• Disc nucleus replacement
Comparator • Nonoperative treatment • Spinal fusion • Other spine surgery
• Procedures that employ a device that has not been FDA-approved for use in the US
Outcomes Studies must report on at least one of the following o Physical function/disability (overall clinical success,
o ODI [L-ADR] or NDI [C-ADR]) o Pain/pain reduction o Device failure (reoperation at the index level, to
include revision, reoperation, or removal) o Complications (eg, migration, subsidence, neurologic
injury as well as infection, vascular damage, heterotopic ossification, others)
The following secondary outcomes are reported if presented with studies meeting the above criteria:
o Quality of life (SF-36) o Operation at the adjacent segment
Non-clinical outcomes (e.g., range of motion, alignment)
Study Design
• For Key Questions 1 and 2, randomized controlled trials (RCTs) and comparative studies with concurrent controls (N≥50 for L-ADR; N≥100 for C-ADR) will be sought.
• For Key Question 3, RCTs which stratify on patient or other characteristics and formally evaluate statistical interaction (effect modification) will be sought
• For Key Question 4, formal economic analyses (e.g., cost-utility study) will be sought.
• In the absence of formal economic analyses, cost data reported in other systematic reviews or technology assessments were briefly summarized.
• For question 1, studies other than RCTs or comparative studies with concurrent controls were excluded
• Case reports • Case series were excluded due
to the large volume of comparative data available
Publication • Studies published in English in peer reviewed journals • FDA reports • L-ADR: Summary of Safety and Effectiveness Data (SSED),
In-depth Statistical Review, In-depth Clinical Review • C-ADR: Summary of Safety and Effectiveness Data (SSED),
Executive Summary of FDA panel meeting
• Abstracts, editorials, letters • Duplicate publications of the
same study which do not report on different outcomes
• Single site reports from multicenter trials
• White papers • Narrative reviews

WA – Health Technology Assessment December 19, 2016
Artificial disc replacement – Re-review: Final evidence report Page - 110
Study Component
Inclusion Exclusion
• Articles identified as preliminary reports when results are published in later versions
3.1.4 Data sources and search strategy Electronic databases were searched from 1 January 2008 through 16 May 2016 to identify studies that have been published since the original report. Electronic databases searched included PubMed, EMBASE, and AHRQ for eligible studies, including health technology assessments (HTAs), systematic reviews, and primary studies. The search strategies used for PubMed are shown in Appendix B; hand-searching was also conducted. Figure 2 shows a flow chart of the results of all searches for included primary studies. Articles excluded at full-text review are listed with reason for exclusion in Appendix C. The clinical studies included in this report were identified using the algorithm shown in Appendix A. The search took place in four stages. The first stage of the study selection process consisted of a comprehensive literature search using electronic means and hand searching. All possible relevant articles were screened using titles and abstracts in stage two. This was done by one to two individuals independently. Those articles that met a set of a priori retrieval criteria based on the criteria above were included. Any disagreement between screeners that were unresolved resulted in the article being included for the next stage. Stage three involved retrieval of the full text articles remaining. The final stage of the study selection algorithm consisted of the selection of those studies using a set of a priori inclusion criteria, again, by two independent investigators. Those articles selected, along with the RCTs included in the 2008 HTA, form the evidence base for this report.

WA – Health Technology Assessment December 19, 2016
Artificial disc replacement – Re-review: Final evidence report Page - 111
Figure 2. Flow chart of literature search results
*Studies listed with reason for exclusion in Appendix C.
1. Total Citations (n=1890)
4. Excluded at full–text review (n=77) Lumbar (n=50)
Cervical (n=27)
3. Retrieved for full-text evaluation (n=161) Lumbar (n=70) Cervical (n=91)
5. Publications included (n=84) Lumbar (n=20)
5 RCTs (in 12 publications) 5 nonrandomized comparative studies 3 economic evaluations
Cervical (n=64) 19 RCTs (in 49 publications) 9 nonrandomized comparative studies 6 economic evaluations
2. Title/Abstract exclusion (n=1729)

WA – Health Technology Assessment December 19, 2016
Artificial disc replacement – Re-review: Final evidence report Page - 112
3.1.5 Data extraction Reviewers extracted the following data from the studies included to address Key Questions 1-3: study design, country, number of patients enrolled, intervention details, inclusion and exclusion criteria, patient characteristics, length of follow-up, follow-up rate, study funding, clinical efficacy outcomes (overall success, function, pain, neurological success, quality of life, patient satisfaction, return to work, medication use, and any other clinical outcomes), safety outcomes (secondary surgery at the index level, adverse events classified as major/serious, adverse events classified as device-related, secondary surgery at the adjacent level, summary incidence of any adverse event, and all individual adverse events reported), and differential efficacy or safety outcomes for any subgroup. An attempt was made to reconcile conflicting information among multiple reports presenting the same data. Detailed study and patient characteristics are available in Appendices G and H, all results are available in the results section of this document and/or Appendices I, J, K, L, M, and N. For economic studies, the following data were abstracted to address Key Question 4: population, intervention and comparator(s), country, funding source, study design, perspective, time horizon, analytic model, effectiveness outcome, effectiveness outcome components, source of effectiveness data, costing year, currency, cost sources, components of cost data, discounting, sensitivity analysis, results of base case and sensitivity analysis, and study conclusions. Detailed study characteristics and results are available in the results section of this document.
3.1.6 Quality assessment: Overall Strength of evidence (SoE), Risk of Bias, and QHES evaluation The method used by Spectrum Research, Inc. (SRI) for assessing the quality of evidence of individual studies as well as the overall quality of evidence incorporates aspects of the rating scheme developed by the Oxford Centre for Evidence-based Medicine,124 precepts outlined by the Grades of Recommendation Assessment, Development and Evaluation (GRADE) Working Group,10 and recommendations made by the Agency for Healthcare Research and Quality (AHRQ).184 Economic studies were evaluated according to The Quality of Health Economic Studies (QHES) instrument developed by Ofman et al.118 Details of the risk of bias and QHES methodology are available in Appendix D. Based on these quality criteria, each study chosen for inclusion for a Key Question was given a risk of bias (or QHES) rating; details of each study’s rating with reasons for not given credit when applicable are available in Appendix E. Standardized abstraction guidelines were used to determine the risk of bias (or QHES) rating for each study included in this assessment. Observational studies were considered to have been conducted retrospectively unless clearly stated otherwise. The strength of evidence for the overall body of evidence for all critical health outcomes was assessed by one researcher following the principles for adapting GRADE (Grades of Recommendation Assessment, Development and Evaluation) as outlined by the Agency for Healthcare Research and Quality (AHRQ).14 The strength of evidence was based on the highest quality evidence available for a given outcome. In determining the strength of body of evidence regarding a given outcome, the following domains were considered:
• Risk of bias: the extent to which the included studies have protection against bias • Consistency: the degree to which the included studies report results that are similar in terms of
range and variability. • Directness: describes whether the evidence is directly related to patient health outcomes.

WA – Health Technology Assessment December 19, 2016
Artificial disc replacement – Re-review: Final evidence report Page - 113
• Precision: describes the level of certainty surrounding the effect estimates. • Publication bias: is considered when there is concern of selective publishing.
Bodies of evidence consisting of RCTs were initially considered as High strength of evidence (SoE), while those that comprised nonrandomized studies began as Low strength of evidence. The strength of evidence could be downgraded based on the limitations described above. There could also be situations where the nonrandomized studies could be upgraded, including the presence of plausible unmeasured confounding and bias that would decrease an observed effect or increase an effect if none was observed, and large magnitude of effect (strength of association). Publication bias was unknown in all studies and thus this domain was eliminated from the strength of evidence tables. The final strength of evidence was assigned an overall grade of high, moderate, low, or insufficient, which are defined as follows:
• High - Very confident that effect size estimates lie close to the true effect for this outcome; there are few or no deficiencies in the body of evidence; we believe the findings are stable.
• Moderate – Moderately confident that effect size estimates lie close to the true effect for this outcome; some deficiencies in the body of evidence; we believe the findings are probably stable but some doubt remains.
• Low – Limited confidence that effect size estimates lie close to the true effect for this outcome; important or numerous deficiencies in the body of evidence; we believe that additional evidence is needed before concluding that findings are stable or that the estimate is close to the true effect.
• Insufficient – We have no evidence, are unable to estimate an effect or have no confidence in the effect estimate for this outcome; OR no available evidence or the body of evidence has unacceptable deficiencies precluding judgment.
Similar methods for determining the overall quality (strength) of evidence related to economic studies have not been reported, thus the overall strength of evidence for outcomes reported in Key Question 4 was not assessed.
3.1.7 Analysis Outcomes were stratified by duration of follow-up based on commonly reported time points: 24 months, 48-60 months, and 84 months. When more than one follow-up time was reported within the 48-60 month category, data from the longest duration available within that category was used. Data were also captured for time points other than those listed above if they were the latest time point duration available (i.e., 12 months, 36 months). Evidence for different spinal regions (lumbar, cervical spine), different number of treated levels (1-level, 2-level, or mixed levels (i.e., non-stratified data with 1-, 2-, or 3-level(s) treated)), and different comparators (i.e., fusion, rehabilitation) were all analyzed separately. For Key Question 1, an attempt was made to pool results when there were two or more RCTs of similar quality and which employed similar interventions and outcome timing/interpretation. However, because of differences in study quality, RCTs were not pooled with nonrandomized studies. An attempt was made to stratify pooled results based on study quality. For all dichotomous outcomes, risk differences
WA – Health Technology Assessment December 19, 2016
Artificial disc replacement – Re-review: Final evidence report Page - 114
(RD) or risk ratios and their respective 95% confidence intervals (CI) were calculated to compare the rate of occurrence or relative risk between treatments. For those dichotomous outcomes that could be pooled, risk differences and figures were produced using Review Manager v5.2.6 and the difference within each study was weighted and pooled using the Mantel-Haenszel method. For those dichotomous outcomes that could not be pooled, RDs were calculated using the Rothman Episheet (www.krothman.org/episheet.xls). For all continuous outcomes, mean differences (MD) and their respective 95% confidence intervals were calculated. For outcomes that could be pooled, mean differences were weighted according to the inverse of their variance; results and figures were produced using Review Manager v5.2.6. The more conservative random effects model was assumed to account for inter-study variability. In some instances, when a study did not report the standard deviation, it was imputed by taking the average from other studies within respective subgroups. If outcome measures with different scales were reported, the standard deviation (SD) was first scaled before being averaged, and standardized mean differences (SMD) were calculated by dividing the MD by the SD. In some studies, standard errors (SE) or 95% confidence intervals were reported in lieu of standard deviations; these values were converted to standard deviations: SD = SE*√n), and SE = (95% CI upper bound – 95% CI lower bound) ÷ 3.92. If the follow-up SD had to be calculated from the baseline (B) and change (C) SD, the following equation was used: follow-up SD = [-1.6B ± √ [(-1.6B)2 – 4(B2-C2)]] ÷ 2. If the standard deviation of the change score needed to be calculated the correlation between baseline and follow-up scores was assumed to be 0.8. For Key Question 1, the focus was placed on the percentage of patients who achieved a predefined threshold of success (e.g., responders) as defined by the study. In addition, the focus was placed on validated outcome measures, which are described in Table 1. The primary outcomes were those which measured overall success, function, pain, and neurological success; these were designated primary outcomes a priori based on clinical expert input. Based on recommendations from both AHRQ56 and Cochrane164 methods guides, continuous outcomes were not placed in context of MCID, as the relationship between outcome scores and the percentage of patients who achieved a defined measure of success (e.g., responders) requires further research. Data on the percentage of “responders,” or patients who achieved a defined measure of success (such as ≥50% pain reduction on VAS) was evaluated separately. In the SoE tables, such data was referred to as pain or function success. As was done in the 2008 HTA, two analytic perspectives on the meta-analysis for efficacy are presented: intent-to-treat (ITT) analysis and completer-only analysis. ITT analysis includes all randomized patients in the groups to which they were randomized without regard to the actual treatment received or to whether they withdrew from treatment. The completer-only analysis considers only those patients who had follow-up data available. Although ITT analysis is conservative for a superiority study, in a non-inferiority trial ITT tends to make the treatments appear more similar in effect than they are, when subjects receive the unintended treatment or are otherwise noncompliant. This could result in a truly inferior treatment appearing to be non-inferior. In contrast, a completer-only analysis excludes data from patients who violate protocol or fail to follow-up. Excluding these data can bias the results in either direction. Therefore, non-inferiority studies are often analyzed using both ITT and completer-only analyses, and an intervention is considered non-inferior only if both approaches support non-inferiority. Therefore, both types of analyses were done.154 Because the completer analysis yielded a more conservative effect estimate, SoE conclusions were based on this analysis.

WA – Health Technology Assessment December 19, 2016
Artificial disc replacement – Re-review: Final evidence report Page - 115
A non-inferiority clinical trial design is often used in FDA trials to show that a new treatment is no worse than a reference treatment. In order to accomplish this, a pre-stated margin of non-inferiority is defined for the treatment effect of a primary outcome. The new treatment will be recommended if it is similar to or better than the existing one, but not if it is worse by more than the pre-stated margin. It is acceptable to assess whether the new treatment is superior to the reference treatment using the appropriate statistical test. Therefore, results of the meta-analysis for the primary outcomes of overall clinical success, function (ODI/NDI) success, pain success, and neurological success were all interpreted using the following steps:
1. The results were evaluated for superiority; was the ADR superior to the comparator treatment in both the ITT and completer-only analyses?
2. If so, what effect do the missing data have on the results (sensitivity analysis)? 3. If not, check for non-inferiority; was the L-ADR non-inferior to comparator treatment in both the
ITT and completer-only analyses using a-10% non-inferiority boundary as per the FDA analyses of the Blumenthal et al. study? Was the C-ADR non-inferior to the cervical fusion in both the ITT and completer-only analyses using a -10% non-inferiority boundary as per the FDA request for the Prestige ST and Prodisc-C studies?
4. If non-inferiority is supported, what effect does missing data have on the results (sensitivity analysis)? Does sensitivity analysis support non-inferiority using -12.5%1 non-inferiority boundary?
The remaining outcome measures were interpreted for superiority and were based on completer analysis. For Key Question 2, the focus was placed on the overall incidence of the following adverse events as summarized and defined by the study: secondary surgery at the index level, serious/major adverse events, device-related complications, secondary surgery at the adjacent level, and any adverse event. The incidence of these adverse events was calculated using the number of patients who received treatment as the denominator; thus those who withdrew from the study prior to receiving treatment were excluded from analysis of adverse events. In addition, all adverse event/safety data reported by each study were abstracted.

WA – Health Technology Assessment December 19, 2016
Artificial disc replacement – Re-review: Final evidence report Page - 116
4 Results
4.1 Key Question 1: Efficacy and effectiveness
4.1.1 Number of studies retained Table 7. Comparative studies retained to answer key questions for L-ADR
Study (Self-identification)*
Index trial (additional publications included) Key Questions Addressed
L-ADR vs. Fusion (1-level) RCTs Charité IDE trial (Non-inferiority trial) Blumenthal 200518 (2 additional publications61,167) 1,2 ProDisc-L IDE trial (Non-inferiority trial) Zigler 2007194 (3 additional publications168,196,197) 1,2 Cohort studies Lee 201591 - 2 Administrative database studies Eliasberg 201647 - 2 Economic evaluations Parkinson 2013119 - 4 L-ADR vs. Fusion (2-level) RCTs ProDisc-L (2-level) IDE trial (Non-inferiority trial) Delamarter 201141 1,2 Non-randomized comparative studies (none) 2 Economic evaluations (none) L-ADR vs. Fusion (1- or 2-level) RCTs Berg 2009 Berg 200913 (2 additional publications11,153) 1,2 Cohort studies Lindley 201293 Registry studies Berg 201012 - 1,2 Administrative database studies Kurtz 201090 Economic evaluations Fritzell 201154 4 L-ADR vs. Multidisciplinary Rehabilitation RCTs Hellum 2011 Hellum 201165 1,2 Non-randomized comparative studies (none) Economic evaluations Johnsen 201482 4

WA – Health Technology Assessment December 19, 2016
Artificial disc replacement – Re-review: Final evidence report Page - 117
*Applies to randomized controlled trials only; if a trial did not specify whether it was self-identified as non-inferiority or superiority then nothing was listed.
Table 8. Comparative studies retained to answer key questions for C-ADR
Study (Self-identification)*
Index trial (additional publications included) Key Questions Addressed
C-ADR vs. ACDF (1-level) RCTs BRYAN IDE trial (Non-inferiority trial) Heller 200964 (6 additional publications8,139,140,147,158,171) 1,2,3 Prestige ST IDE trial (Non-inferiority trial)
Mummaneni 2007109 (6 additional publications22,23,139,140,158,169) 1,2,3
ProDisc-C IDE trial (Non-inferiority trial) Murrey 2009111 (6 additional publications42,43,80,149,170,195) 1,2 PCM IDE trial (Non-inferiority trial) Phillips 2013126 (3 additional publications101,125,172) 1,2 Mobi-C (1-level) IDE trial (Non-inferiority trial) Hisey 201470 (4 additional publications71,72,78,148,174) 1,2 Secure-C IDE trial (Non-inferiority trial) Vaccaro 2013177 (1 additional publication173) 1,2 Karabag 2014 Karabag 201485 1,2 Nabhan 2007 Nabhan 2007112 (1 additional publication114) 1,2 Nabhan 2011 Nabhan 2011113 1,2 Peng-Fei 2008 Peng-Fei 2008121 1,2 Rozankovic 2016 Rozankovic 2016146 1,2 Zhang 2012 Zhang 2012190 1,2 Zhang 2014 Zhang 2014189 1,2 Cohort studies Kim 200987 - 1 Hou 201474 - 1,2 Registry studies Staub 2016157 - 1 Administrative database studies Radcliff 2015134 - 2 Economic evaluations Radcliff 2016133 - 4 Quereshi 2013131 - 4 McAnany 2014102 - 4 Lewis 201492 - 4 C-ADR vs. ACDF (2-level) RCTs Mobi-C (2-level) IDE trial (Non-inferiority trial) Davis 201338 (4 additional publications39,78,132,175) 1,2 Cheng 2009 Cheng 200930 1,2 Cohort studies Kim 200987 - 1 Hou 201474 - 1,2 Economic evaluations Ament 20144 - 4

WA – Health Technology Assessment December 19, 2016
Artificial disc replacement – Re-review: Final evidence report Page - 118
Ament 20165 - 4 C-ADR vs. ACDF (Mixed levels (1-, 2-, or 3-level)) RCTs Skeppholm 2015 Skeppholm 2015151 (1 additional publication152) 1,2 Cheng 201129
Cheng 2011 1,2
Rohl 2009 Rohl 2009143 3 Cohort studies Cappelletto 201324 - 1,2 Peng 2011122 - 1,2 Registry studies Grob 201060 - 1,2 Administrative database studies Nandyala 2014115 - 2 Economic evaluations (none) C-ADR vs. ACDF with a zero-profile device (2 non-contiguous levels) RCTs Qizhi 2016 Qizhi 2016130 1,2 Non-randomized comparative studies (none) Economic evaluations (none)
*Applies to randomized controlled trials only; if a trial did not specify whether it was self-identified as non-inferiority or superiority then nothing was listed.
4.1.2 Lumbar Spine
4.1.2.1 L-ADR vs. Fusion: 1-level Studies included The two index trials comparing L-ADR at one level with fusion (Blumenthal for the Charité and Zigler for the Prodisc-L)18,194 were each conducted as a randomized, multicenter, FDA regulated Investigational Device Exemption (IDE), non-inferiority clinical trial and were included in the 2008 HTA report together with related FDA reports. Subsequent publications with follow-up to 60 months on efficacy outcomes were identified for both the Charité trial (Guyer 2009)61 and the Prodisc-L trial (Zigler 2012)196. RCTs Study characteristics Treatments: Both trials randomized patients to receive either L-ADR or fusion at a single level between L4-L5 or L5-S1 (Charite IDE trial) and L3-S1 (ProDisc-L IDE trial), Table 9. The Charite device was compared with fusion using autograft18 and ProDisc-L compared with fusion using allograft194. (see Appendix Table G1 for details). Inclusion criteria and patient characteristics: The two trials included adults (age 18-60 years) with symptomatic degenerative disc disease (DDD) confirmed by radiographic assessment. Patients were required to have back and/or leg pain with no nerve root compression and demonstrate a minimum ODI

WA – Health Technology Assessment December 19, 2016
Artificial disc replacement – Re-review: Final evidence report Page - 119
score of 30 (Charité trial)18 or 40% (ProDisc-L trial)194 impairment. All patients had failed a minimum of 6 months of appropriate conservative care. The primary exclusion criteria were multilevel symptomatic DDD, previous thoracic or lumbar fusion (Charité) or previous fusion at any vertebral level (ProDisc-L), current or previous lower lumbar fracture, osteoporosis, spondylolisthesis >3 mm (Charité) or grade >1 (ProDisc-L), and scoliotic deformity >11° (Charité). Complete inclusion and exclusion criteria are provided in Appendix Table G1. Patient demographics are details in Table 10. In general, the level most commonly treated was L5-S1 in both trials (69% for Charité; 65% for ProDisc-L). Male patients comprised approximately half the study populations (49%-52%), and mean patient age was 40 years. Mean body mass index ranged from 26.0 to 27.3 kg/m2. The vast majority of patients were Caucasian. At baseline, approximately one-fourth of patients in the ProDisc-L trial were using tobacco (not report in the Charité trial). One-third of the patients in both trials had undergone previous spinal surgery. The majority of baseline characteristics were equally distributed between L-ADR and fusion treatment groups. Risk of bias: Neither trial met all the criteria needed to be considered low risk of bias and both were considered at moderately high risk of bias. Neither had blinded outcome assessment. Patient accounting was poorly described in the publications and SSED related to the Charité trial.18,167 At 60 months follow-up, data were available for eight of the original 14 clinical sites for Charité trial or 43.8% of the original participants (Guyer 2009)61 and follow-up for the Prodisc-L trial (Zigler 2012)196 was 69.9%. For Charité trial, authors do not describe the number of patients randomized who did not receive treatment, so it is unclear whether true intention to treat analysis was performed. In the Prodisc-L trial of the 183 ADR and 93 fusion enrolled originally,168 22 in the ADR group did not receive treatment and 18 from the fusion group did not receive treatment. Authors did not account for these losses for intention to treat analysis. There was differential loss to follow-up at 60 months in the Prodisc-L trial; data were available for 73% of ADR recipients compared with 56% of fusion recipients. A summary of the methodological quality for these two studies is reported in Appendix Table E1.

WA – Health Technology Assessment December 19, 2016
Artificial disc replacement – Re-review: Final evidence report Page - 120
Table 9. RCT Study Characteristics: 1-Level L-ADR vs. Fusion
(n randomized/treated) Follow-up (%)* RCT N L-ADR Device Fusion Graft 24 mos. 48-60 mos. 84 mos. Country Funding Risk of Bias
Charite IDE trial 304† Charité (n=NR†/205) Autograft (n=NR†/99) 87.2% 43.8% – US Industry Moderately High
ProDisc-L IDE trial 276 Prodisc L (n=183/161) Allograft (n=93/75) 79.3% 67.4%‡ – US Industry§ Moderately High
N: number of patients randomized to the study. * % follow-up was calculated using the number of patients randomized (or treated if the number randomized was not reported), and was generally based on the number of
patients with data available for the primary outcome (see Appendix Table E1 for information on exceptions to this rule). † Number of patients treated; it was unclear if there were randomized patients who did not receive the allotted treatment. ‡ Differential loss to follow-up between L-ADR vs. Fusion groups (i.e., ≥10% difference) at 60 months: 73% vs. 56%, respectively. § The authors state that no funds were received; SRI assumed the trial was funded by the device manufacturer since the trial was conducted to obtain FDA approval of the device. Table 10. RCT Patient Demographics: 1-Level L-ADR vs. Fusion
RCT Group Level treated: L3-4/L4-5/L5-S1 (%)
Male (%) Age (mean ± SD)
BMI (kg/m2) (mean ± SD )
Caucasian (%)
Current tobacco use (%)
Working (%)
Prior surgical treatment (%)
Preop Activity Level (% moderate)
Charité IDE trial
L-ADR 0%/30%/70% 55.1% 39.6 ± 8.16 26 ± 4.23 91.7% NR 53.2% 34%* 17.1%
Fusion 0%/32%/68% 44.4% 39.6 ± 9.07 27 ± 4.76 87.9% NR 57.6% 33%* 6.0% Prodisc-L IDE trial
L-ADR 2%/34%/65% 51% 38.7 ± 8.0 26.7 ± 4.2 82.6% 21%† NR 35%‡ 5.6%
Fusion 4%/29%/67% 45% 40.4 ± 7.6 27.3 ± 4.3 78.7% 32%† NR 31%‡ 6.2% * Type of surgery not specified; however, prior thoracic or lumbar fusion and other spinal surgery at affected level (except discectomy, laminotomy/laminectomy, without
accompanying facetotomy or nucleolysis at the same level to be treated) were exclusion criteria. † Former smoking status was 25% (L-ADR) and 23% (fusion). ‡ Included discectomy, Intradiscal Electrothermal Therapy (IDET), laminectomy, laminotomy and other; prior fusion surgery at any vertebral level was an exclusion criteria

WA – Health Technology Assessment December 19, 2016
Artificial disc replacement – Re-review: Final evidence report Page - 121
Efficacy Results All analyses are based on completers only (i.e., those with data available) unless otherwise indicated. The primary outcomes of interest (overall clinical success, ODI success, neurological success, and pain success) were evaluated using both intention to treat (ITT) analysis and completer analysis if data were available. Overall Clinical Success The FDA criterion of at least a 15-point improvement from baseline ODI scores was used for both RCTs to minimize heterogeneity in the meta-analysis. The definition of overall clinical success was similar in the two studies, but not identical. In the Prodisc-L trial,194 success was defined more conservatively than the Charité trial18 in that it required improvement in the SF-36 and radiological success as additional criteria. The addition of these parameters would make success more difficult to achieve resulting in a lower proportion of patients attaining overall clinical success, but not likely biasing the results between study groups. Therefore, these two studies were pooled. Both trials were at moderately high risk of bias. 24 months: In meta-analysis across the two IDE trials,18,194 ITT analysis suggests that L-ADR may be better than fusion (pooled RD 9.9%, (95% CI 1.5%, 18.3%), I2=0%, N = 580) in terms of overall clinical success (Figure 3a) however the completer analysis does not (pooled RD 7.9% (95% CI -1.7%, 17.4%), I2=0%, N = 484) (Figure 4a) so superiority of L-ADR is rejected. Non-inferiority at a -10% inferiority margin was then assessed and non-inferiority was found to be supported by evaluating the lower bounds of the confidence intervals of the pooled results (1.5% ITT and -1.7% for completer-only analysis). Sensitivity analyses to assess the effect of missing data supported non-inferiority at the -12.5% non-inferiority margin for lumbar ADR compared with spinal fusion except when missing in the ADR group were considered failures and missing in the fusion group were considered success (lower bound -18.1%); in this later case, non-inferiority is inconclusive.(Figure 5a) Both the Charite and ProDisc-L trial authors reported analyses based on additional, alternate definitions for overall success at 24 months (Appendix Table I1):
• When overall success included an ODI threshold of ≥25% from baseline, based on completer analysis, authors of the Charité trial report that significantly more L-ADR recipients (63.6%) than fusion recipients (56.8%) achieved success18,167; our calculations however did not confirm this (RD 6.7%, 95% CI -6.0%, 19.6%) and is consistent with the conclusion that L-ADR is as good as fusion.
• When overall success included an ODI threshold of ≥15% from baseline, based on completer analysis, authors of the ProDisc-L trial report that significantly more L-ADR (63.5%) compared with fusion (45.1%) patients achieved success168,196; our calculation confirmed this (RD 18.4%, 95% CI 4.5%, 32.4%) although the confidence interval was wide.
60 months: Neither the ITT (pooled RD 7.5%, (95% CI -1.5%, 16.6%), I2=23%, N= 580) nor the completer analysis (pooled RD 7.1%, (95% CI -4.9%, 18.9%), I2=0%, N = 319) demonstrated superiority of L-ADR versus fusion based on pooled analysis across the two trials reporting 60 month follow-up61,196; the results suggest that L-ADR is as good as fusion (Figures 3b and 4b). Non-inferiority at -10% inferiority margin was found to be supported by evaluating the lower bounds of the confidence intervals of the pooled results for ITT (-1.5%) and for completers only (-4.9). Sensitivity analyses to assess the effect of missing

WA – Health Technology Assessment December 19, 2016
Artificial disc replacement – Re-review: Final evidence report Page - 122
data supported non-inferiority at the -12.5% non-inferiority margin of lumbar ADR compared with spinal fusion except when missing in the ADR group were considered failures and missing in the fusion group were considered success (lower bound -48.7%) where ADR would be considered inferior to fusion. (Figure 5b) For the Charité trial data were available for 8 of the original 14 clinical sites leading to a follow up at 60 months of 43.8%.61; authors do report results of additional analyses evaluating the impact of loss to follow-up which suggested that at participants and nonparticipants were generally statistically similar at key time points on ODI and support the conclusion that L-ADR was not inferior to fusion. For ProDisc-L, follow-up was 69.9% at 60 months.196 Both the Charite and ProDisc-L trial authors reported analyses based on additional, alternate definitions for overall success at 60 months (Appendix Table I1): Overall, these findings suggest that L-ADR is as good as fusion.
• When overall success included an ODI threshold of ODI ≥15 points in an analysis of completers only that included early device failures, in the Charité trial 54% L-ADR and 50% of fusion recipients achieved success61; authors do not report results of statistical testing and did not provide sufficient data to calculate effect size. Only 43% of the original trial subjects had data for 60 months.
• When overall success included an ODI threshold of ≥15% from baseline, authors of the ProDisc-L trial report an ITT analysis (using last observation carried forward imputation for missing data, effect size not reported, p = 0.744) and completer only analysis (RD 3.5%, 95% CI -12.3%, 19.7%, p=0.6474) which both suggest that L-ADR is as good as fusion with regard to achieving overall success.196 This is consistent with the pooled findings across both trials using the FDA cut off of 15 point improvement described above.
ODI: Success ODI success was defined based on the FDA criterion as an improvement of at least 15 points from baseline; variations in this definition are noted below. 24 months: In meta-analysis across the two IDE trials18,194 using a 15 point improvement threshold for ODI from baseline, ITT analysis suggests superiority of L-ADR over fusion (pooled RD 11.4%, (95% CI 2.8%, 20.0%), I2=0%, N = 580) for this outcome (Figure 6a); however, completer analysis does not (pooled RD 8.9% (95% CI -0.5%, 18.3%), I2=0%, N = 485). Wide confidence intervals bring the stability of these estimates into question (Figure 7a). Both studies reported analyses based on additional, alternate definitions for ODI success at 24 months (Appendix Table I2). Overall, it appears that L-ADR is as good as fusion when these definitions are used.
• Using a threshold of ≥25% improvement in ODI relative to baseline, for completers in the Charité trial, no statistical difference between treatments was observed (RD 8.9%, 95% CI -3.5%, 21.4%).18,167
• Using a threshold of ≥15% improvement authors of the ProDisc- L trial report that for completers, significantly more L-ADR versus fusion recipients achieved success (p<0.05),168,194 however our effect size calculation did not reach statistical significance (RD 12.4%, 95% CI -0.6%, 25.4%).
60 months:

WA – Health Technology Assessment December 19, 2016
Artificial disc replacement – Re-review: Final evidence report Page - 123
Across the two trials,61,196 the ITT analysis (pooled RD 9.0%, (95% CI -6.2%, 24.2%), I2=72%, N = 580) (Figure 6b) and completer analysis (pooled RD 7.8%, (95% CI -3.6%, 19.2%), I2=0%, N =310) (Figure 7b) both suggest that L-ADR is as good as fusion in terms of functional improvement measured with ODI; no statistical differences between treatments were observed. Low follow-up at 60 months in these trials is again noted (43.8% for Charité; 69.9% for ProDisc-L). Authors of the ProDisc- L trial reported analyses based on additional, alternate definitions for ODI success at 60 months (Appendix Table I2): Results suggest L-ADR is as good as fusion.
• Using a threshold of ≥15% improvement for completers only, there was no difference in the proportion of L-ADR (78.6%) versus fusion (76.5%) recipients that achieved success. Authors do report that of the patients who had ODI score improvements ≥ 15% at 2 years compared with baseline, a substantial proportion of patients maintained ≥ 15% improvement from baseline at 5 years (89.1% for L-ADR, 86.1% for fusion).196
ODI: Scores No differences between L-ADR and fusion in mean ODI scores was observed in either the Charite18 or ProDisc-L61 trial at 24 or 60 months (Appendix Table I4). Neurological success Neurological success was defined as no neurological change (i.e. defined as lack of neurological deterioration compared with preoperative status, at any point of time in the Charité trial18 and as neurological status improved or maintained (motor, sensory, reflex, straight leg raise) in the ProDisc-L trial.194 24 months: The ITT analysis (pooled RD 7.4%, (95% CI -1.3%, 16.1%), I2= 25%, N = 580) (Figure 8a) and completer analysis (pooled RD 2.2%, (95% CI -12.6%, 17.1%), I2=84%, N=483) both suggest that L-ADR is as good as fusion with regard to neurological success. (Figure 9a) Heterogeneity is noted and may in part be due to differences in definitions between the two studies. 60 months: The ITT analysis (pooled RD 7.6%, (95% CI -5.3%, 20.6%), I2= 57%, N = 580) (Figure 8b) and completer analysis (pooled RD 0.2%, (95% CI -7.9%, 8.3%), I2= 0%, N = 306) (Figure 9b) both suggest that L-ADR is as good as fusion with regard to neurological success (n = 483). Pain: VAS (0-100 [worst]) 24 months: Pooled analysis across the two IDE trails18,194 suggests that pain at 24 months may be somewhat less following L-ADR compared with fusion (pooled mean difference 6.84, 95% CI 0.63, 12.32, I2= 0%, N = 488) however the difference of 6.84 is likely not clinically meaningful (Figure 10a). Neither trial individually reported a significant difference between treatments. L-ADR may be as good as fusion with regard to pain relief. 60 months:

WA – Health Technology Assessment December 19, 2016
Artificial disc replacement – Re-review: Final evidence report Page - 124
At 60 months, VAS pain scores were similar for L-ADR and fusion across the two trials61,196; (pooled mean difference 1.16, 95% CI -6.43, 8.74 I2= 0%, N =309) (Figure 10b). As noted previously there was substantial loss to follow-up in the Charité trial.61 SF-36: PCS and MCS Success 24 months: Across both trials at 24 months, there were no differences between single level L-ADR and fusion with regard to SF-36 PCS success defined as ≥15% improvement in the Charité trial (N=265)167 or in PCS success defined as maintenance or improvement in score in the ProDisc-L trial (N = 219)168,196; thus L-ADR appears to be as good as fusion. Similarly, with regard to SF-36 MCS success (defined as ≥15% improvement from baseline), L-ADR appears to be as good as fusion.167 (Table 11) 60 months In the one ProDisc-L trial (N = 177) reporting SF-36 PCS success (defined as maintenance or improvement in score) at 60 months,196 L-ADR appears to be as good as fusion; there were no statistical differences between groups, however confidence intervals were large (Table 11). Table 11. L-ADR vs. Fusion (1 level): SF-36 Success Completer analysis
Risk of Bias Study F/U L-ADR % (n/N)
Fusion % (n/N)
RD (95% CI)* RR (95% CI)*
p-value*
SF-36 PCS: ≥15% improvement Moderately High RoB
Charite IDE trial (FDA SSED 2004)
24 mos.
72% (132/184)
63% (51/81)
8.8% (-3.6%, 21.1%) 1.1 (0.9, 1.4)
0.16
SF-36 MCS: ≥15% improvement Moderately High RoB
Charite IDE trial (FDA SSED 2004)
24 mos.
50% (92/184)
51% (41/81)
-0.6% (-13.7%, 12.5%) 1.0 (0.8, 1.3)
0.93
SF-36 PCS success: score maintained or improved from baseline Moderately High RoB
ProDisc-L IDE trial (FDA SSED 2006, Zigler 2012 Five-year results)
24 mos.
79.2% (118/149)
70.0% (49/70)
9.2% (-3.4%, 21.8%) 1.1 (1.0, 1.3)
0.14
Moderately High RoB
ProDisc-L IDE trial (Zigler 2012 Five-year results)
60 mos.
81.3% (102/126)†
74.0% (38/51)†
6.4% (-7.3%, 20.2%) 1.1 (0.9, 1.3)
0.34
CI: confidence interval; F/U: follow-up; L-ADR: lumbar artificial disc replacement; RD: risk difference; RoB: risk of bias; RR: risk ratio; SF-36 PCS and MCS: Short-Form 36 questionnaire Physical Component Score and Mental Component Score. *Calculated by SRI. †Numerators back-calculated based on percentages provided in text and total N at 5 years for SF-36 PCS scores in Table 5 of article. SF-36: PCS Scores At 24 months, SF-36 PCS scores were somewhat higher, indicating better physical health status, in the ProDisc-L trial (n = 217)194, however this may not be a clinically significant difference. The difference did not persist to 60 months (n = 177).196 No difference between L-ADR and fusion was seen at 60 months in the Charité trial,61 however there was substantial loss to follow-up (N =133). (Table 12).

WA – Health Technology Assessment December 19, 2016
Artificial disc replacement – Re-review: Final evidence report Page - 125
Table 12. L-ADR vs. Fusion (1 level): SF-36 PCS scores Completer analysis
Risk of Bias Study F/U L-ADR mean ± SD
Fusion mean ± SD
MD (95% CI)* p-value*
SF-36 PCS (0-100); higher score = better quality of life Moderately High RoB
ProDisc-L IDE trial (Zigler 2012 Five-year results)
24 mos.
42.8 ± 11.1 (n=147)†
38.8 ± 11.3 (n=70)†
4.0 (0.8, 7.2) 0.01
Moderately High RoB
Charite IDE trial‡ (Guyer 2009)
60 mos.
mean NR (change score: 12.6) (n=90)
mean NR (change score: 12.3) (n=43)
NR NS
Moderately High RoB
ProDisc-L IDE trial (Zigler 2012 Five-year results)
60 mos.
42.0 ± 11.3 (n=126)
40.1 ± 13.6 (n=51)
1.9 (-2.0, 5.8) 0.34
CI: confidence interval; F/U: follow-up; L-ADR: lumbar artificial disc replacement; MD: mean difference; RoB: risk of bias; SD: standard deviation; SF-36 PCS: Short-Form 36 questionnaire Physical Component Score. *Calculated by SRI. †At 24 months, some patients had incomplete data sets. ‡Of the 14 initial sites involved in the Charite IDE trial, 6 declined participation in the 60-month continuation study; furthermore, Guyer 2009 reported outcomes only for patients with both 24 and 60 month follow-up, thus data reported is likely not representative of the total number of patients with follow-up at 60 months. Patient Satisfaction 24 months: Results from both the Charité18 and ProDisc-L194 trials suggest that patient satisfaction was greater in those receiving L-ADR compared with those receiving fusion (Figure 11, Table 13). Across the two trials, patients who received L-ADR were somewhat more likely to report that they would have the same surgery again compared with those who received fusion (pooled RR 1.25, 95% CI 1.06, 1.48; pooled RD 15.6%, 95% CI 6.5%, 25.0%). VAS Patient Satisfaction scores (0-100, best) in the ProDisc-L trial, were higher in the L-ADR group compared with the fusion group (mean difference 9.4 (1.0, 17.8), however there is substantial variability in the estimates,196 (Table 13). 60 months In the ProDisc-L trial, more patients in the L-ADR group (82.5%) reported that they would have the same surgery compared with those receiving fusion (68%, RR 1.2 (95% CI 1.0, 1.5) at 60 months, however, no statistical difference between treatments in VAS Patient Satisfaction scores (0-100 (best), mean difference 0.2 (95% CI -8.2, 8.6))196 was observed (Figure 11, Table 13).
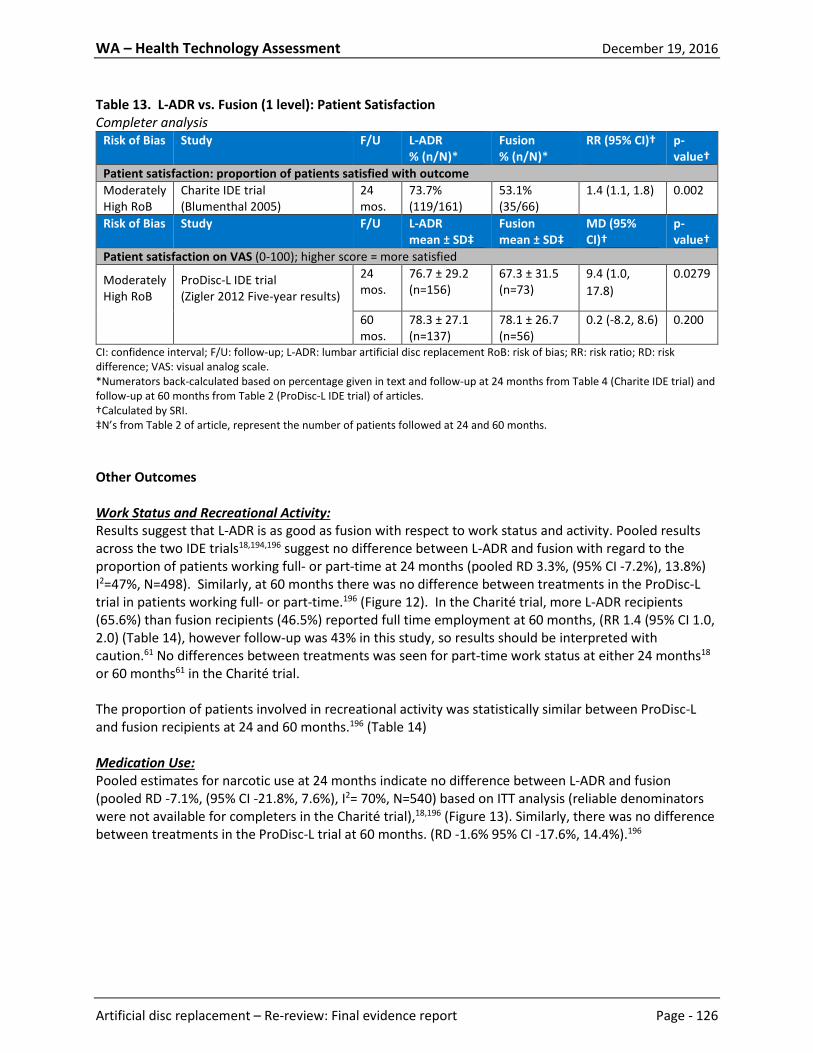
WA – Health Technology Assessment December 19, 2016
Artificial disc replacement – Re-review: Final evidence report Page - 126
Table 13. L-ADR vs. Fusion (1 level): Patient Satisfaction Completer analysis
Risk of Bias Study F/U L-ADR % (n/N)*
Fusion % (n/N)*
RR (95% CI)†
p-value†
Patient satisfaction: proportion of patients satisfied with outcome Moderately High RoB
Charite IDE trial (Blumenthal 2005)
24 mos.
73.7% (119/161)
53.1% (35/66)
1.4 (1.1, 1.8)
0.002
Risk of Bias Study F/U L-ADR mean ± SD‡
Fusion mean ± SD‡
MD (95% CI)†
p-value†
Patient satisfaction on VAS (0-100); higher score = more satisfied
Moderately High RoB
ProDisc-L IDE trial (Zigler 2012 Five-year results)
24 mos.
76.7 ± 29.2 (n=156)
67.3 ± 31.5 (n=73)
9.4 (1.0, 17.8)
0.0279
60 mos.
78.3 ± 27.1 (n=137)
78.1 ± 26.7 (n=56)
0.2 (-8.2, 8.6) 0.200
CI: confidence interval; F/U: follow-up; L-ADR: lumbar artificial disc replacement RoB: risk of bias; RR: risk ratio; RD: risk difference; VAS: visual analog scale. *Numerators back-calculated based on percentage given in text and follow-up at 24 months from Table 4 (Charite IDE trial) and follow-up at 60 months from Table 2 (ProDisc-L IDE trial) of articles. †Calculated by SRI. ‡N’s from Table 2 of article, represent the number of patients followed at 24 and 60 months. Other Outcomes Work Status and Recreational Activity: Results suggest that L-ADR is as good as fusion with respect to work status and activity. Pooled results across the two IDE trials18,194,196 suggest no difference between L-ADR and fusion with regard to the proportion of patients working full- or part-time at 24 months (pooled RD 3.3%, (95% CI -7.2%), 13.8%) I2=47%, N=498). Similarly, at 60 months there was no difference between treatments in the ProDisc-L trial in patients working full- or part-time.196 (Figure 12). In the Charité trial, more L-ADR recipients (65.6%) than fusion recipients (46.5%) reported full time employment at 60 months, (RR 1.4 (95% CI 1.0, 2.0) (Table 14), however follow-up was 43% in this study, so results should be interpreted with caution.61 No differences between treatments was seen for part-time work status at either 24 months18 or 60 months61 in the Charité trial. The proportion of patients involved in recreational activity was statistically similar between ProDisc-L and fusion recipients at 24 and 60 months.196 (Table 14) Medication Use: Pooled estimates for narcotic use at 24 months indicate no difference between L-ADR and fusion (pooled RD -7.1%, (95% CI -21.8%, 7.6%), I2= 70%, N=540) based on ITT analysis (reliable denominators were not available for completers in the Charité trial),18,196 (Figure 13). Similarly, there was no difference between treatments in the ProDisc-L trial at 60 months. (RD -1.6% 95% CI -17.6%, 14.4%).196

WA – Health Technology Assessment December 19, 2016
Artificial disc replacement – Re-review: Final evidence report Page - 127
Table 14. L-ADR vs. Fusion (1 level): Work Status and Recreational Activity Completer Analysis
Risk of Bias Study F/U L-ADR % (n/N)
Fusion % (n/N)
RR (95% CI)* p-value*
Work status: proportion of patients working full-time Moderately High RoB
Charite IDE trial (Blumenthal 2005)
0 mos. 44.9% (92/205)
49.5% (49/99)
0.9 (0.7, 1.2) 0.45
24 mos. 55.9% (104/186)
52.5% (42/80)
1.1 (0.8, 1.4) 0.61
(Guyer 2009)† 60 mos. 65.6% (59/90)‡
46.5% (20/43)‡
1.4 (1.0, 2.0) 0.04
Work status: proportion of patients working part-time Moderately High RoB
Charite IDE trial (Blumenthal 2005)
0 mos. 8.3% (17/205)
8.1% (8/99)
1.0 (0.5, 2.3) 0.95
24 mos. 6.5% (12/186)
12.5% (10/80)
0.5 (0.2, 1.1) 0.10
(Guyer 2009)† 60 mos. 7% (6/90)§
12% (5/43)§
0.6 (0.2, 1.8) 0.33
Recreational activity: proportion of patients participating in recreational activities Moderately High RoB
ProDisc-L IDE trial (Zigler 2012 Five-year results)
0 mos. 42.2% (68/161)‡
49.3% (37/75)‡
0.9 (0.6, 1.1) 0.31
24 mos. 88.4% (130/147)‡
78.3% (54/69)‡
1.1 (1.0, 1.3) 0.05
60 mos. 82.4% (103/125)‡
90.0% (45/50)‡
0.9 (0.8, 1.0) 0.21
CI: confidence interval; F/U: follow-up; L-ADR: lumbar artificial disc replacement RoB: risk of bias; RR: risk ratio. *Calculated by SRI. †Of the 14 initial sites involved in the Charite IDE trial, 6 declined participation in the 60-month continuation study; furthermore, Guyer 2009 reported outcomes only for patients with both 24 and 60 month follow-up, thus data reported is likely not representative of the total number of patients with follow-up at 60 months. ‡Numerators back-calculated based on percentage and total N provided. §Estimated from graph and numerators back-calculated.
4.1.2.2 L-ADR vs. Fusion: 2-level Studies included One non-inferiority IDE trial compared 2-level L-ADR (ProDisc-L) with 2-level fusion (Delamarter 2011)41 with follow-up to 24 months. The trial is registered under the same number in ClinicalTrials.gov as the ProDisc-L IDE trial comparing one level interventions.194,196 RCTs Study characteristics Treatments: The trial randomized patients to receive either 2-level L-ADR with ProDisc-L or circumferential fusion using allograft.41,194 Interventions were at contiguous vertebral levels from L3-S1 (Table 15); (see Appendix Table G3 for details). Inclusion criteria and patient characteristics: The trial included adults with DDD at two contiguous levels with or without leg pain, who had at least 6 months of unsuccessful non-operative care. Patients with spondylolisthesis classified as greater than grade I, DDD at more than two levels, previous arthrodesis,

WA – Health Technology Assessment December 19, 2016
Artificial disc replacement – Re-review: Final evidence report Page - 128
and those who were not able to comply with the study protocol were excluded. For more detailed information on inclusion/exclusion criteria see Appendix Table G3. The population was predominately working males with an average age of 42 years; 41.8% had prior surgical treatment. Patient demographics are details in Table 16; the majority of baseline characteristics were equally distributed between L-ADR and fusion treatment groups. The levels most commonly treated were L4-S1. Risk of bias: This trial was considered to be at moderately high risk of bias. Blinded outcome assessment was not performed. No statement of intention to treat analysis was provided. There were 10 fusion patients and nine ADR patients who did not received the treatments to which they were randomized and are not accounted for in any analysis. There were other losses to follow-up that do not appear to be accounted for in analysis or patient accounting. It is unclear whether co-interventions were applied equally to the treatment groups. A summary of the methodological quality for these two studies is reported in Appendix Table E1.
Table 15. RCT Study Characteristics: 2-Level L-ADR vs. Fusion (n randomized/treated) Follow-up (%)* RCT N L-ADR Device Fusion
Graft 24 mos.
48-60 mos.
84 mos.
Country Funding Risk of Bias
ProDisc-L (2-level) IDE trial
256 ProDisc L (n=174/165)
Allograft (n=82/72)
84.0% – – US Industry Moderately High
L-ADR: lumbar artificial disc replacement. N: number of patients randomized to the study. * % follow-up was calculated using the number of patients randomized (or treated if the number randomized was not
reported), and was generally based on the number of patients with data available for the primary outcome (see Appendix Table E1 for information on exceptions to this rule).
Table 16. RCT Patient Demographics: 2-Level L-ADR vs. Fusion
RCT Group Level treated: L3-5/ L4-S1 (%)
Male (%)
Age (mean ± SD)
BMI (kg/m2) (mean ± SD )
Cauca-sian (%)
Current tobacco use (%)
Working (%)
Dis-ability Pension (%)
Prior surgical treatment (%)
ProDisc- L (2-level) IDE trial
L-ADR 8.5%/ 91.5%
57.6% 41.8 ± 7.7
27.0 ± 4.5
NR 28.7* 79.4% NR 41.8%†
Fusion 11.1%/ 88.9%
54.2% 41.8 ± 7.8
27.1 ± 4.1
NR 30.6* 83.3% NR 40.3%†
BMI: body mass index; L-ADR: lumbar artificial disc replacement; SD: standard deviation. * Former smoking status was reported as 18.9% (L-ADR) and 29.2% (Fusion). † Included discectomy, Intradiscal Electrothermal Therapy (IDET), laminectomy, laminotomy and other; previous fusion was an exclusion criteria.

WA – Health Technology Assessment December 19, 2016
Artificial disc replacement – Re-review: Final evidence report Page - 129
Efficacy Results All analyses are based on completers only (i.e., those with data available) unless otherwise indicated. The primary outcomes of interest (overall clinical success, ODI scores, neurological success,) were evaluated using both intention to treat (ITT) analysis and completer analysis. Data were not available to perform both types of analysis for ODI scores or VAS Pain scores, so completer only analysis is reported. Overall Clinical Success The FDA criterion of at least a 15-point improvement from baseline ODI scores was used in conjunction with the following criteria were used to define overall clinical success; 1) Improvement in SF-36 PCS compared with baseline; 2) Neurological status improved or maintained from baseline; 3) No secondary surgical procedures to remove or modify the total disc replacement implant or arthrodesis implant/site; 4) no subsidence >3 mm; 5) no migration >3 mm; 6) no radiolucency/loosening; 7) no loss of disc height >3 mm); and 8) for ADR, range of motion improved for maintained from baseline and for fusion, no motion (<10⁰ angulation, total for two levels combined) on flexion and extension radiographs. As noted previously for the single level trial results, this definition of success was conservative. 24 months: In the only available trial,41 the ITT and completer analysis both suggest that 2-level L-ADR is as good as fusion at 24 months with no statistical difference observed between treatments (Table 17). Non-inferiority at a -10% inferiority margin was assessed and non-inferiority was found to be supported by evaluating the lower bounds of the confidence intervals of the results (1.9% ITT and -3.3% for completer-only analysis). Sensitivity analyses to assess the effect of missing data supported non-inferiority at the -12.5% non-inferiority margin for lumbar ADR compared with spinal fusion except when missing in the L-ADR group were considered failures and missing in the fusion group were considered success (lower bound -18.3%); in this later case, non-inferiority is inconclusive (Figure 14). Authors do not report results past 24 months. Table 17. L-ADR vs. Fusion (2-levels): Overall Success
Risk of bias Study Analysis F/U L-ADR % (n/N)
Fusion % (n/N)
RD (95% CI)* p-value*
Overall success: 1) ≥15% improvement in ODI compared with baseline; 2) Improvement in SF-36 PCS compared with baseline; 3) Neurological status improved or maintained from baseline; 4) No secondary surgical procedures to remove or modify the total disc replacement implant or arthrodesis implant/site; 5) no subsidence >3 mm; 6) no migration >3 mm; 7) no radiolucency/loosening; 8) no loss of disc height >3 mm); and 9) for ADR, range of motion improved for maintained from baseline and for Fusion, no motion (<10⁰ angulation, total for two levels combined) on flexion and extension radiographs. Moderately High RoB
ProDisc-L IDE (Delamarter 2011)
ITT 24 mos. 50.0% (87/174)
39.0% (32/82)
11.0% (-1.9, 23.9) 0.10
Completer 24 mos. 58.8% (87/148)†
47.8% (32/67)†
11.0% (-3.3, 25.4)
0.13
CI: confidence interval; F/U: follow-up; L-ADR: artificial disc replacement; RD: risk difference; RoB: risk of bias. *Calculated by SRI. †There is a discrepancy in the article between the consort diagram and the text regarding the number of patients analyzed at 24 months. We have reported the data as reported in the text; the authors provided the % (n/N) for both outcomes in the text.

WA – Health Technology Assessment December 19, 2016
Artificial disc replacement – Re-review: Final evidence report Page - 130
ODI: Success ODI success was not reported. ODI: Scores (0-100 [worst]) 24 months: Patients receiving 2-level L-ADR had significant improvement (lower) in ODI scores (mean 30.3 ± 24.3) compared with those receiving fusion (38.7 ± 24.1) at 24 months with a mean difference of -8.4 (-15.4, -1.4), p=0.0195.41 It is not clear that this is a clinically meaningful difference (Table 18). Change from baseline for ADR was 52.4% ± 38.1% and for fusion was 40.9% ± 36.0%. Table 18. L-ADR vs. Fusion (2-levels): ODI scores Completer analysis
Risk of Bias Study F/U L-ADR mean ± SD
Fusion mean ± SD
MD (95% CI)* p-value*
ODI (0-100), higher score = greater disability Moderately High RoB
ProDisc-L IDE (Delamarter 2011)
24 mos. 30.3 ± 24.3 (n=148)†
38.7 ± 24.1 (n=67)†
-8.4 (-15.4, -1.4) 0.02
CI: confidence interval; F/U: follow-up; L-ADR: lumbar artificial disc replacement; MD: mean difference; ODI: Oswestry Disability Index; RoB: risk of bias; SD: standard deviation. *Calculated by SRI. †The number of patients providing data for ODI scores at 24 months was not provided; the n’s reported reflect the number of patients who had data for the primary endpoint – overall success – of which the ODI is a component. Neurological success Neurological success was defined as maintenance or improvement of patient responses to all neurological criteria, including motor status, sensory status, reflexes, and a straight leg raise test. 24 months: ITT analysis suggests that of 2-level L-ADR may be better than fusion (RD 14.9% , 95% CI 2.6, 27.2) in terms of neurological success however the completer analysis does not41; 2-Level ADR may therefore be as good as fusion at 24 months (Table 19). Neurological success was reported at 6 weeks, 3 months, 6 months, 12 months and 18 months, however the only statistical difference between groups favoring L-ADR was seen at 6 months (87.3% for ADR, 71.6% for fusion, p=0.0068). Authors do not report results past 24 months.

WA – Health Technology Assessment December 19, 2016
Artificial disc replacement – Re-review: Final evidence report Page - 131
Table 19. L-ADR vs. Fusion (2-levels): Neurological Success Risk of bias Study Analysis F/U L-ADR
% (n/N) Fusion % (n/N)
RD (95% CI)* p-value*
Neurological success: maintenance or improvement of patient responses to all neurological criteria, including motor status, sensory status, reflexes, and a straight leg raise test.
Moderately High RoB
ProDisc-L IDE (Delamarter 2011)
ITT 24 mos. 75.7% (132/174)
61.0% (50/82)
14.9% (2.6, 27.2)
0.01
Completer 24 mos. 89.2% (132/148)†
80.6% (50/62)†
8.5% (-2.5, 19.6)
0.10
CI: confidence interval; F/U: follow-up; L-ADR: artificial disc replacement; RD: risk difference; RoB: risk of bias. *Calculated by SRI. †There is a discrepancy in the article between the consort diagram and the text regarding the number of patients analyzed at 24 months. We have reported the data as reported in the text; the authors provided the % (n/N) for both outcomes in the text. Pain: VAS Scores 24 months: VAS pain scores at 24 months were similar for 2-level L-ADR and Fusion,41 suggesting that L-ADR is as good as fusion (Table 20). Change from baseline was 43.3% ± 33.3% for L-ADR and for fusion 36.7% ± 30.3% (Appendix I6). Table 20. L-ADR vs. Fusion (2-levels): VAS pain scores Completer analysis
Risk of Bias Study F/U L-ADR mean ± SD
Fusion mean ± SD
MD (95% CI)* p-value*
VAS pain (0-100), higher score = greater pain Moderately High RoB
ProDisc-L IDE (Delamarter 2011)
24 mos. 31.9 ± 30.5 (n=143)†
38.4 ± 29.8 (n=60)†
-6.5 (-15.7, 2.7) 0.16
CI: confidence interval; F/U: follow-up; L-ADR: lumbar artificial disc replacement; MD: mean difference; RoB: risk of bias; SD: standard deviation; SF-36: Short-Form 36 questionnaire; VAS: visual analog scale. *Calculated by SRI. †The number of patients providing data for VAS pain scores at 24 months was not provided; the n’s reported reflect the number of patients with complete data sets at 24 months (this outcome is not part of the composite primary outcome). SF-36: PCS Scores 24 months: Higher mean SF-36 PCS scores were observed for 2-level L-ADR recipients compared with fusion recipients, mean difference 4.7 (95% CI 1.3, 8.1),41 suggesting better physical health for L-ADR recipients (Table 21).

WA – Health Technology Assessment December 19, 2016
Artificial disc replacement – Re-review: Final evidence report Page - 132
Table 21. L-ADR vs. Fusion (2-levels): SF-36 PCS scores Completer analysis
Risk of Bias Study F/U L-ADR mean ± SD
Fusion mean ± SD
MD (95% CI)* p-value*
SF-36 PCS (0-50), higher score = better health Moderately High RoB
ProDisc-L IDE (Delamarter 2011)
24 mos. 43.9 ± 11.9 (n=148)
39.2 ± 11.2 (n=67)
4.7 (1.3, 8.1) 0.007
CI: confidence interval; EQ-5D: EuroQol 5 Dimensions; F/U: follow-up; L-ADR: lumbar artificial disc replacement; MD: mean difference; RoB: risk of bias; SD: standard deviation. *Calculated by SRI. Patient Satisfaction 24 months: At 24 months, more 2-level ADR reported that they would have the same surgery again (78.2%) compared with fusion (62.1%), however, the results were of marginal significance (RR 1.3, 95% CI 1.0, 1.6),41 (Table 22). Study authors report greater satisfaction following 2-level L-ADR compared with fusion based on VAS Patient Satisfaction Scores, citing a p-value of 0.0126; Spectrum’s calculation suggests that the difference is not statically significant, however authors do not provide sufficient data on the number of patients with available data for this outcome to perform independent verification. Table 22. L-ADR vs. Fusion (2-levels): Patient satisfaction Completer analysis
Risk of Bias Study F/U L-ADR % (n/N)
Fusion % (n/N)
RR (95% CI)* p-value*
Patient satisfaction: would have the same surgery again Moderately High RoB
ProDisc-L IDE (Delamarter 2011)
24 mos. 78.2% (111/142)
62.1% (36/58)
1.3 (1.0, 1.6) 0.02
Risk of Bias Study F/U L-ADR mean ± SD
Fusion mean ± SD
MD (95% CI)* p-value*
Patient satisfaction on VAS (0-100), higher score = more satisfied Moderately High RoB
ProDisc-L IDE (Delamarter 2011)
24 mos. 77.7 ± 28.0 (n=143)†
68.9 ± 30.5 (n=60)†
8.8 (0.08, 17.5) 0.048
CI: confidence interval; F/U: follow-up; L-ADR: lumbar artificial disc replacement; MD: mean difference; RoB: risk of bias; RR: relative risk; VAS; visual analog scale. *Calculated by SRI. †The number of patients providing data for VAS patient satisfaction scores at 24 months was not provided; the n’s reported reflect the number of patients with complete data sets at 24 months (this outcome is not part of the composite primary outcome).

WA – Health Technology Assessment December 19, 2016
Artificial disc replacement – Re-review: Final evidence report Page - 133
Other Outcomes Work Status and Recreational Activity: There were no differences between 2-level LADR and fusion with regard to the proportion of patients working full or part time or in the proportion participating in recreational activities at 24 months,41 (Table 23). Narcotic Use: Narcotic use at 24 months was significantly less common in the 2-level L-ADR group compared with the fusion group (RD -23.2%, 95% CI -38.0%, -8.4%)41 (Table 23). The L-ADR group experienced a 47.8% decrease in use relative to baseline compared with the 7.2% decrease from baseline observed in the fusion group. Table 23. L-ADR vs. Fusion (2-levels): Work status, recreational activities and narcotic use Completer analysis
Risk of Bias Study F/U L-ADR % (n/N)
Fusion % (n/N)
RR (95% CI)* p-value*
Work status: working full- or part-time Moderately High RoB
ProDisc-L IDE (Delamarter 2011)
24 mos. 80.4% (115/143)
86.0% (49/57)
RR 0.9 (0.8, 1.1) 0.36
Recreational activities: participating Moderately High RoB
ProDisc-L IDE (Delamarter 2011)
24 mos. 84.6% (121/143)
79.7% (47/59)
RR 1.1 (0.9, 1.2) 0.39
Narcotic Use Moderately High RoB
ProDisc-L IDE (Delamarter 2011)
0 mos. 69.1% (114/165)
63.9% (46/72)
NR NS
24 mos. 36.1% (52/144)
59.3% (35/59)
RR 0.6 (0.4, 0.8) RD -23.2% (-38.0, -8.4)
0.0025
CI: confidence interval; F/U: follow-up; L-ADR: lumbar artificial disc replacement; MD: mean difference; RoB: risk of bias; RR: relative risk. *Calculated by SRI.
4.1.2.3 L-ADR vs. Fusion: 1- or 2-level Studies included One trial from Sweden, with publications reflecting 24 month13 and 60 month153 follow-up, compared L-ADR at one or two levels with fusion at one or two levels on the primary outcomes of interest. A third publication from this trial evaluated the impact of interventions on sex life at 24 months.11 In addition, one non-randomized comparative study – a registry – was included.12 RCTs Study characteristics Treatments: Patients were randomized to one of three L-ADR devices available in Sweden (Charité, ProDisc-L or Maverick) or to fusion. Authors do not report the proportion of patients receiving specific

WA – Health Technology Assessment December 19, 2016
Artificial disc replacement – Re-review: Final evidence report Page - 134
devices; the Maverick prosthesis did not receive FDA approval and is no longer available in the U.S. Two different fusion techniques were employed, posterolateral fusion (PLF) and posterior lumbar interbody fusion (PLIF); local or iliac crest autograft was used for fusion. Randomization was stratified for the number of levels (1 or 2); 56% of the L-ADR group and 46% of the fusion group received 1-level interventions (see Appendix Table G4 for details). Inclusion criteria and patient characteristics: Symptomatic adults (age 20-55 years) with mechanical or discogenic DDD at one or two segments between L3 and S1 (confirmed on magnetic resonance imaging) who had failed at least 3 months of conservative care were included. Patients were required to have had low back pain with or without leg pain for a minimum of 1 year duration and to score over 30 on the ODI or 50 on the VAS back pain scale in the week before inclusion. Patients with three or more painful levels, spinal stenosis requiring decompression, spondylolisthesis >3 mm, major deformity, osteoporosis, and previous lumbar fusion or decompression with postoperative instability were excluded. For more details on inclusion/exclusion criteria, see Appendix Table G4. Participants were predominately female with an average age of 39 years; the duration of low back pain was 2 year or longer in 79% of the ADR and 87% of the fusion group. In both groups, 10% of patients were current tobacco users. In the ADR and fusion groups, respectively, 12% and 11% of patients had undergone previous spinal surgery. Authors do not report on levels treated. The majority of baseline characteristics were equally distributed between L-ADR and fusion treatment groups. Patient demographics and study characteristics are detailed in Tables 24 and 25. Risk of bias: The trial was considered to be at moderately high risk of bias. Methodological limitations of this study included lack of blinded outcome assessment, unclear randomization methods and differences in baseline VAS leg pain and SF-36 MCS between groups that were not controlled in analyses. The authors report on number of patients randomized who receive treatment and completed evaluations but do not describe whether there were randomized subjects who did not receive allocated treatment, so it is not clear if true intention to treat analysis was performed. A summary of the methodological quality for these two studies is reported in Appendix Table E1. Table 24. RCT Study Characteristics: 1- or 2-Level L-ADR vs Fusion
(n randomized/treated) Follow-up (%)* RCT N L-ADR Device Fusion
Graft 24 mos.
60 mos.
84 mos.
Country Funding Risk of Bias
Berg 2009/ Skold 2013
152† Charite, Prodisc-L or Maverick (n=NR†/80)
NR (n=NR†/72)
100% 99% – Sweden NR Moderately High
N: number of patients randomized to the study. * % follow-up was calculated using the number of patients randomized (or treated if the number randomized was not reported), and was generally based on the number of patients with data available for the primary outcome (see Appendix Table E1 for information on exceptions to this rule). † Number of patients treated; it was unclear if there were randomized patients who did not receive the allotted treatment.

WA – Health Technology Assessment December 19, 2016
Artificial disc replacement – Re-review: Final evidence report Page - 135
Table 25. RCT Patient Demographics: 1-or 2 Level L-ADR vs. Fusion RCT Group Level
treated: L3-4/L4-5/L5-S1 (%)
Male (%)
Age (mean ± SD)
BMI (kg/m2) (mean ± SD )
Cauca-sian (%)
Current tobacco use (%)
Working (%)
Dis-ability Pension (%)
Previous spinal surgery (%)
Berg 2009/ Skold 2013
L-ADR NR/NR/NR* 40% 40.2 ± 8.1
NR NR 10% NR 56% 12%†
Fusion NR/NR/NR* 42% 38.5 ± 7.8
NR NR 11% NR 46% 11%†
* 1- level surgery was performed in 56% of ADR vs. 46% of fusion patients and 2-level surgery in 44% vs. 54%, respectively; no other details provided. † Type of surgery not specified; however, previous lumbar fusion or decompression with postoperative instability (e.g. facet joint damage or wide laminectomy) were exclusion criteria. Efficacy Results Analyses are based on completers only (i.e., those with data available) unless otherwise indicated. The primary outcomes of interest (overall clinical success, ODI success) were evaluated using both intention to treat (ITT) analysis and completer analysis at 60 months. It is not clear if there were randomized patients who did not receive the allotted treatment and we used number reported for baseline for ITT analysis. Authors report that after study initiation, no patient was lost to follow-up at 24 months and only one patient was lost to follow-up at 60 months. Thus, for the 60 month analysis, the ITT and completer analyses are similar and sensitivity analyses were not performed. Authors state that there were no differences in improvement for any clinical outcome between 1 and 2 level procedures. Similarly authors state that there were no differences in outcomes based on fusion technique (PLF and PLIF). Data were not stratified by level, type of disc or type of fusion. Overall Clinical Success Overall clinical success was defined differently across the two primary publications reporting on efficacy from this trial. The index/parent report (Berg 2009)13 defined clinical success as being totally pain free based on a global assessment of back pain while the follow-up report for 60 months (Skold 2013)153 defined it as being totally pain free OR much better using the same global assessment of pain (Table 26). 24 months: There were no differences between treatment groups at 24 months when clinical success included those who were totally pain free and those whose pain was “much better”, RD 6.1% (95% CI -8.9%, 21.1%) N = 152, however, twice as many L-ADR recipients (30%) reported being totally pain free compared with fusion recipients (15%), RD 14.7% , 95% CI 1.7%, 27.8%).13 Wide confidence intervals suggesting substantial imprecision of estimates, calling the stability of the estimates into question (Table 26). 60 months: Similarly, there was no difference between treatment groups at 60 months when clinical success included those who were totally pain free and those whose pain was “much better”, RD 4.9% (95% CI – 9.7%, 19.5%), N = 151.153 When clinical success was defined as being totally pain free, again a significantly larger proportion of L-ADR recipients met this criterion compared with fusion, RD 22% (95% CI 8.5, 35.5). Wide confidence intervals are again noted (Table 26).

WA – Health Technology Assessment December 19, 2016
Artificial disc replacement – Re-review: Final evidence report Page - 136
Table 26. L-ADR vs. Fusion (1- or 2-levels): Overall Success
Risk of bias Study Analysis F/U L-ADR % (n/N)*
Fusion % (n/N)*
RD (95% CI)† p-value†
Overall success: Global Assessment of back pain, “totally pain free” OR “much better”‡ Moderately High RoB
Berg trial (Skold 2013)
ITT§ 24 mos.
70.0% (56/80)
63.9% (46/72)
6.1% (-8.9, 21.1)
0.42
ITT 60 mos.
72.5% (58/80)
66.7% (48/72)
5.8% (-8.8, 20.5)
0.44
Completer 60 mos.
72.5% (58/80)
67.6% (48/71)
4.9% (-9.7, 19.5) 0.51
Overall success: Global Assessment of back pain, “totally pain free”‡ Moderately High RoB
Berg trial (Skold 2013)
ITT§ 24 mos.
30% (24/80)
15% (11/72)
14.7% (1.7, 27.8)
0.03
ITT 60 mos.
38% (30/80)
15% (11/72)
22.2% (8.8, 35.7)
0.002
Completer 60 mos.
38% (30/80)
15% (11/71)
22.0% (8.5, 35.5) 0.003
CI: confidence interval; F/U: follow-up; L-ADR: artificial disc replacement; RD: risk difference; RoB: risk of bias. *For the ITT analyses, it is not clear if there were randomized patients who did not receive the allotted treatment and we used the numbers reported at baseline for the denominator. †Calculated by SRI. ‡Overall clinical success was defined differently in the Berg 2009 (totally pain free) and Skold 2013 (totally pain free OR much better) publications so we included both as measures of success. §No patient was lost-to-follow-up at 24 months, however, authors do not report on number randomized who may not have received treatment. ODI: Success ODI success was defined as an improvement of at >25% from baseline. 24 months: L-ADR appears to be as good as fusion for improving patient function based on ODI success at 24 months; RD 8.2% (-7.4%, 23.8%), however there is substantial variability in the estimate,13 (Table 27). 60 months: L-ADR appears to be as good as fusion for improving patient function based on ODI success at 60 months; RD 12.7% (95% CI -1.7%, 27.1%).153 Again, wide confidence intervals are noted (Table 27).

WA – Health Technology Assessment December 19, 2016
Artificial disc replacement – Re-review: Final evidence report Page - 137
Table 27. L-ADR vs. Fusion (1- or 2-levels): ODI Success Risk of bias Study Analysis F/U L-ADR
% (n/N) Fusion % (n/N)
RD (95% CI)* p-value*
ODI success: ≥25% improvement on ODI Moderately High RoB
Berg trial (Skold 2013)
ITT† 24 mos.
64% (51/80)‡
55% (40/72)‡
8.2% (-7.4, 23.8)
0.31
Completer 60 mos.
77.5% (62/80)
64.8% (46/71)
12.7% (-1.7, 27.1) 0.09
CI: confidence interval; F/U: follow-up; L-ADR: artificial disc replacement; RD: risk difference; RoB: risk of bias. *Calculated by SRI. †No patient was lost-to-follow-up at 24 months, however, authors do not report on number randomized who may not have received treatment. ‡Numerators were back-calculated based on percentages and denominators provided by the authors. ODI Scores (higher score, greater disability) Authors report that there was no difference between L-ADR and fusion with respect to ODI scores at 24 months (means: ADR 20.0 ± 19.6, fusion 23.0 ± 17.0),13 but report a significant difference between treatments favoring L-ADR at 60 months (means for ADR 17.3 ± 19.0 and fusion 22.5 ± 17.1),153 with lower ODI scores reflecting less disability (Appendix Table I10). The differences between treatments are likely not clinically meaningful and the large standard deviations suggest estimate instability. Neurological success Neurological success was not reported. Pain: VAS and SF-36 Pain Scores 24 months: Results suggest that L-ADR is as good as fusion. No difference between L-ADR and fusion for VAS back pain scores (0-100, higher score, greater pain) was seen at 24 months.13 Authors report that that VAS leg pain scores were significantly better (lower) for L-ADR recipients compared with fusion recipients (see Appendix Table I10), however our calculations did not reach statistical significance (Table 28). The differences are not likely to be clinically significant. VAS leg pain was significantly different between groups at baseline (32.8 vs. 43.7, p=0.016) but was not controlled for in analysis. 60 months Results suggest that L-ADR is as good as fusion. There were no statistical differences between L-ADR and fusion on VAS back pain scores, VAS leg pain scores or the SF-36 pain subscale at 60 months153 based on our calculations (Table B28). Authors reported that differences were statistically significant for VAS pain measures (Appendix X), however the differences are not likely to be clinically meaningful. There were baseline differences between groups for VAS leg pain.

WA – Health Technology Assessment December 19, 2016
Artificial disc replacement – Re-review: Final evidence report Page - 138
Table 28. L-ADR vs. Fusion (1- or 2- levels): Pain scores Completer analysis
Risk of Bias Study F/U L-ADR mean ± SD
Fusion mean ± SD
MD (95% CI)* p-value*
VAS back pain (0-100), higher score = greater pain Moderately High RoB
Berg trial (Skold 2013) 24 mos. 25.4 ± 29.8 (n=80)
29.2 ± 24.6 (n=72)
-3.8 (-12.6, 5.0) 0.40
60 mos. 22.7 ± 29.2 (n=80)
30.5 ± 26.9 (n=71)
-7.8 (-16.9, 1.3) 0.09
VAS leg pain (0-100), higher score = greater pain Moderately High RoB
Berg trial (Skold 2013) 24 mos. 16.4 ± 24.5 (n=80)
20.7 ± 24.3 (n=72)
-4.3 (-12.1, 3.5) 0.28
60 mos. 14.0 ± 23.1 (n=80)
20.3 ± 24.7 (n=71)
-6.3 (-14.0, 1.4) 0.11
SF-36 pain subscale (0-100), higher score = less pain Moderately High RoB
Berg trial (Skold 2013) 60 mos. 67.6 ± 31.8 (n=80)
56.8 ± 27.3 (n=71)
10.8 (1.2, 20.4) 0.03
CI: confidence interval; F/U: follow-up; L-ADR: lumbar artificial disc replacement; MD: mean difference; RoB: risk of bias; SD: standard deviation; SF-36: Short-Form 36 questionnaire; VAS: visual analog scale. *Calculated by SRI. EQ-5D scores Results suggest that L-ADR is as good as fusion. EQ-5D scores at 24 months were not significantly different between groups.13 Authors report that the scores were statistically different at 60 months153 (Appendix Table I10), however our calculations did not confirm this (Table 29).
Table 29. L-ADR vs. Fusion (1- or 2- levels): EQ-5D scores Completer analysis
Risk of Bias Study F/U L-ADR mean ± SD
Fusion mean ± SD
MD (95% CI)* p-value*
EQ-5D (-0.59 to 1), higher score = better health Moderately High RoB
Berg trial (Skold 2013) 24 mos. 0.67 ± 0.33 (n=80)
0.69 ± 0.25 (n=72)
-0.02 (-0.11, 0.07) 0.68
60 mos. 0.76 ± 0.30 (n=80)
0.68 ± 0.30 (n=71)
0.08 (-0.02, 0.18) 0.10
CI: confidence interval; EQ-5D: EuroQol 5 Dimensions; F/U: follow-up; L-ADR: lumbar artificial disc replacement; MD: mean difference; RoB: risk of bias; SD: standard deviation. *Calculated by SRI. Patient Satisfaction Results suggest that L-ADR is as good as fusion. Patient satisfaction with outcome did not differ based on treatment group at 24 months13 or 60 months153 (Table 30).

WA – Health Technology Assessment December 19, 2016
Artificial disc replacement – Re-review: Final evidence report Page - 139
Table 30. L-ADR vs. Fusion (1- or 2- levels): Patient satisfaction Completer analysis
Risk of Bias Study F/U L-ADR % (n/N)
Fusion % (n/N)
RR (95% CI)* p-value*
Patient satisfaction: satisfied with outcome Moderately High RoB
Berg trial (Berg 2009 Total disc)
24 mos. 71% (57/80)†
67% (48/72)†
1.1 (0.9, 1.3) 0.54
Berg trial (Skold 2013)
60 mos. 79% (63/80)†
69% (49/71)†
1.1 (0.9, 1.4) 0.17
CI: confidence interval; F/U: follow-up; L-ADR: lumbar artificial disc replacement; RoB: risk of bias; RR: relative risk. *Calculated by SRI. †Numerators were back-calculated based on percentages and denominators provided by the authors in the text. Other Outcomes Work Status: There were no differences between L-ADR and fusion in the proportion of patients engaged in full- or part-time work at 24 months.13 At 60 months, however, fewer L-ADR recipients reported being employed full or part-time (Table 31). The change in in percentage of those who returned to work between the 2- and 5-year follow-ups was greater in the fusion group (72% to 90%) compared with the L-ADR group (76% to 78%).153 Similar proportions of patients in the L-ADR group (84%) and fusion group (83%) reported using no sickness benefits (Appendix Table I11). Table 31. L-ADR vs. Fusion (1- or 2- levels): Work status Completer analysis
Risk of Bias Study F/U L-ADR % (n/N)
Fusion % (n/N)
RR (95% CI)* p-value*
Work status: working full- or part-time Moderately High RoB
Berg trial (Berg 2009 Total disc)
24 mos. 76% (61/80)
72% (52/72)
1.1 (0.9, 1.3) 0.57
Berg trial (Skold 2013)
60 mos. 78% (62/80)
90% (64/71)
0.9 (0.7, 1.0) 0.04
CI: confidence interval; F/U: follow-up; L-ADR: lumbar artificial disc replacement; RoB: risk of bias; RR: relative risk. *Calculated by SRI. Sex Life Based on detailed analysis of the ODI domain related to sexual life, there were no differences between L-ADR and fusion with regard to restriction of sex due to pain at 24 months.11 (Appendix Table I12) Non-randomized comparative studies One registry study met the inclusion criteria12; study characteristics and patient demographics are summarized below and in Table 32. The study identified patients from the Swedish Spine Register (SweSpine) who underwent 1- or 2-level L-ADR or posterior lumbar instrumented fusion (PLIF) for symptomatic lumbar degenerative disc disease treated at the same clinic as patients enrolled in a recent RCT (results of this trial by Berg 2009 are discussed in the efficacy section above). Only patients with clinical follow-up over 12 months were included (L-ADR, n=163; PLIF, n=178) out of a total of 455 (75%). The treatment groups differed

WA – Health Technology Assessment December 19, 2016
Artificial disc replacement – Re-review: Final evidence report Page - 140
significantly in several baseline characteristics: compared with fusion, those who underwent L-ADR were younger (39.8 vs. 42.7 years; p<0.0002), had less disability (ODI score 41 vs. 45; p<0.005), and were more often non-smokers (data NR; p=0.04). One- and two-level surgery was performed in 60% and 40% of patients, respectively, in both groups. Due to various methodological limitations including substantial loss to follow-up, no control for confounding, lack of patient blinding (although assessors were blinded, many of the outcomes were patient-reported) and no validation data quality, this study is considered to be at moderately high risk of bias (see Appendix Table E3 for details). Table 32. Non-randomized Study Characteristics
L-ADR vs. Fusion Study N L-ADR
Device* (n)
Fusion Graft (n)
F/U (%) Age, yrs. (mean)
Male (%)
Prior Surgery (%)
Worker’s Comp (%)
Country/ Funding
Risk of Bias
Registry study Berg (2010)
341† Charite, Prodisc-L or Maverick (n=229)
NR (n=226)
24 mos.: 30.1% ‡
40 vs. 43 p<0.01
51% vs. 46%
26% vs. 31%§
NR Sweden/NR Mod-erately High
F/U: follow-up; L-ADR: lumbar artificial disc replacement; NR: not reported; SD: standard deviation. *Though not explicitly stated in the article, this population was comprised solely of patients treated at the same clinic as the randomized trial by Berg 2009, therefore we assume that the same devices were used. †Demographics/baseline data are reported only for the 341 patients (163 ADR, 178 Fusion) with ≥12 mos. follow-up out of a total of 455 (75%) patients. ‡Percentage of patients that have passed 24 months and who responded to the questionnaires: L-ADR (n=53) vs. fusion (n=84). §Type of prior surgery not reported; however, exclusion criteria included previous lumbar fusion or decompression with potential instability (e.g., facet joint damage or wide laminectomy). Effectiveness Results Data for all effectiveness results are summarized briefly below and are available in table format in Appendix Table I13. Based on differences in baseline characteristics between treatment groups and the potential for section bias resulting from inclusion only of patients who had 12 month follow up and substantial loss to follow-up at 24 months, results from this study should be interpreted cautiously. Clinical success Authors defined clinical success as being totally pain free as measured by the Global Assessment of Back Pain. At 24 months more L-ADR recipients (32%) versus fusion recipients (14%) reported being totally pain free (RD 17.8%; 95% CI,3.2%, 32.4%).12 Using a clinical success definition of being totally pain free or better pain, while more L-ADR versus fusion patients achieved this (85% versus 76%), the results were not statistically significant (RD 8.7%; 95% CI -4.6%, 22.0%). The pattern of these findings is consistent with what is reported in the Berg RCT. Function Mean ODI scores were better in the L-ADR versus the PLIF group at 24 months (18 ± 16 vs. 30 ± 21, respectively).12 It is unclear if the mean difference of -10 (95% CI -14.8, -5.12) is clinically meaningful. Wide confidence intervals likely reflect the small sample size at 24 months. The impact of baseline differences in ODI is not clear; authors do not report control for this.

WA – Health Technology Assessment December 19, 2016
Artificial disc replacement – Re-review: Final evidence report Page - 141
Pain Back pain was assessed using the VAS (0-100); L-ADR patents reported significantly less pain (lower scores) than those who received PLIF at 24 months (22 ± 25 vs. 38 ± 32; MD -16, 95% CI -26.2, -5.7). This may not represent a clinically meaningful difference in pain. Again wide confidence intervals are noted. Quality of Life EQ-5D scores were better in the L-ADR versus the PLIF group at 24 months (0.70 ± 0.29 vs. 0.58 ± 0.36, respectively; MD 0.12 (95% CI 0.004, 0.24)). The result was similar when health state was measured using the EQ-VAS (MD 12.0; 95% CI 3.4, 20.6).12 Other outcomes Work status and patient satisfaction were reported at 12 months only. Significantly fewer L-ADR patients were on full sick-leave (i.e., not working) compared with PLIF (24% vs. 37%; p=0.02). More patients who had received L-ADR were satisfied with their outcome (75% vs. 65% with fusion); however this difference did not reach statistical significance (p=0.08).12
4.1.2.4 L-ADR vs. Multidisciplinary Rehabilitation Studies included One RCT (Hellum)65 conducted in Norway compared L-ADR with multidisciplinary rehabilitation over a period of 24 months. The trial was in patients with low back pain for ≥1 year with degenerative intervertebral disc changes in L4/L5 or L5/S1 who had structured physical therapy or chiropractic care for ≥ 6 months that didn’t provide relief and an ODI of ≥ 30. RCT characteristics Treatments: Patients were randomized patients to receive either 1- or 2-level L-ADR using the ProDisc II device or multidisciplinary rehabilitation. Multidisciplinary rehabilitation consisted of a cognitive behavioral approach, education and supervised physical exercised based on the treatment model described by Brox, et al.20 delivered in an outpatient setting for approximately 60 hours over 3 to 5 weeks (see Appendix Table G6 for details). One patient crossed over between 6 months and 1 year and five patients between 1 year and 2 years. Five patients underwent surgery with disc prosthesis and one patient with fusion. Inclusion criteria and patient characteristics: The trial included adults (age 25-55 years) with low back pain for at least a year, failure of structured physiotherapy or chiropractic care for at least 6 months, and an ODI score of ≥30. All patients were required to have degenerative intervertebral disc changes at L4/L5 or L5/S1, or both; degeneration had to be restricted to the two lower levels. Exclusion criteria included degeneration in more than two levels, disc protrusion or recess stenosis with involvement of nerve roots, symptoms of spinal stenosis, spondylolysis, previous fracture of L1-S1, osteoporosis, or deformity (Appendix Table G6). The L-ADR group was 53% male compared with 41% in the rehabilitation group and the mean age of participants was 41 years. Almost one-third of patients reported having prior surgical treatment; only one-third of patients were working (including part time sick leave) at the time of enrollment. Almost half of the patients in both groups were current tobacco users (49% ADR, 43% rehabilitation). Patient

WA – Health Technology Assessment December 19, 2016
Artificial disc replacement – Re-review: Final evidence report Page - 142
demographics and study characteristics are detailed in Tables 33 and 34. In general, the level most commonly treated was L4-L5. Risk of bias: The trial was considered to be at moderately high risk of bias. Methodological limitations of this study included lack of blinded outcome assessment and lack of control for confounding and lack of intention to treat analysis. Three patients in each group were excluded shortly after randomization and not included in analyses. Low back pain scores and SF-36 mental health sub-scores were significantly worse in the rehabilitation group than in the surgery group; authors report various statistical methods but it is not clear to what extent baseline differences were controlled for in primary analyses. A summary of the methodological quality for these two studies is reported in Appendix Table E1. Table 33. RCT Study Characteristics: L-ADR (1- or 2-levels) vs Multidisciplinary Rehabilitation
(n randomized/treated) Follow-up (%)* RCT N L-ADR
Device Rehabilitation† 24
mos. 60 mos.
84 mos.
Country Funding Risk of Bias
Hellum 2011
179 ProDisc II (n=89/86)
Multidisciplinary (n=90/86)
77.7% – – Norway Government, professional society
Moderately High
L-ADR: lumbar artificial disc replacement. N: number of patients randomized to the study. * % follow-up was calculated using the number of patients randomized (or treated if the number randomized was not
reported), and was generally based on the number of patients with data available for the primary outcome (see Appendix Table E1 for information on exceptions to this rule).
† Outpatient multidisciplinary rehabilitation (60 hours over 3-5 weeks) consisted of a cognitive approach (e.g., lectures/education and discussion on relevant topics, challenging patient’s thoughts about physical activities previously labelled as not recommended) and supervised physical exercise (endurance, strength, coordination, specific training of the abdominal and the lumbar multifidus muscles).

WA – Health Technology Assessment December 19, 2016
Artificial disc replacement – Re-review: Final evidence report Page - 143
Table 34. RCT Patient Demographics: L-ADR (1- or 2-levels) vs Multidisciplinary Rehabilitation RCT Group Level treated:
L4-5/L5-S1/ L4-5 and L5-S1 (%)
Male (%)
Age (mean ± SD)
BMI (kg/m2) (mean ± SD )
Caucasian (%)
Current tobacco use (%)
Working (%)
Disability Pension (%)
Prior surgery (%)
Hellum 2011
L-ADR 22%/46%/ 33%
53% 41.1 ± 7.1
25.6 ± 3.1
NR 49% 28% 4% 27%*
Rehab NA/NA/NA 41% 40.8 ± 7.1
25.5 ± 3.5
NR 43% 26% 0% 29%*
BMI: body mass index; L-ADR: lumbar artificial disc replacement; SD: standard deviation. * Type of prior surgery not specified; however, randomization was stratified by whether the patient had had “previous surgery
(microsurgical decompression) or not. Efficacy Results All analyses are based on completers only (i.e., those with data available) unless otherwise indicated. The primary outcome of interest, overall clinical success (≥15 point ODI improvement) was evaluated using both intention to treat (ITT) analysis and completer analysis and sensitivity analysis was performed. Data for doing both ITT and completer analysis were not available for VAS Pain. Author ITT analysis is reported for quality of life measures as authors didn’t provide data that allowed for independent anlaysis for completers. Authors do not report data beyond 24 months. Overall Clinical Success Overall clinical success was defined as a ≥15 point ODI improvement relative to baseline. 24 months: Significantly more L-ADR recipients achieved a ≥15 point ODI improvement relative to baseline compared with fusion recipients in both the ITT (RD, 22.9% , 95% CI 8.7%, 37.1%) and completer (RD 22.9% 95% CI 6.9%, 38.9%) analyses,65 (Table 35). Sensitivity analysis on missing data suggests that L-ADR is better than multidisciplinary rehabilitation except when all missing values for ADR are failures and all missing values for rehabilitation are success; results are inconclusive for this scenario (Figure 15). Table 35. L-ADR vs. Multidisciplinary rehabilitation: ODI Success
Risk of bias Study Analysis F/U L-ADR % (n/N)
Rehab % (n/N)
RD (95% CI)* p-value*
ODI success: ≥15 point improvement from baseline† Moderately High RoB
Hellum 2011 ITT 24 mos. 57.3% (51/89)
34.4% (31/90)
22.9% (8.7, 37.1) 0.0022
Completer 24 mos. 70% (51/73)‡
47% (31/66)‡
22.9% (6.9, 38.9) 0.0063
CI: confidence interval; F/U: follow-up; ITT: intention-to-treat; L-ADR: lumbar artificial disc replacement; ODI: Oswestry Disability Index; RD: risk difference; Rehab: Rehabilitation; RoB: risk of bias. *Calculated by SRI. †This was an unplanned analysis: per-protocol analysis using FDA criteria for ODI success. ‡Denominator back-calculated based on the percentage and number of patients reported.

WA – Health Technology Assessment December 19, 2016
Artificial disc replacement – Re-review: Final evidence report Page - 144
Treatment Failure: Treatment failure was defined as the need for surgical intervention in those patients randomized to rehabilitation. Over 24 months, a total of 6 (7.5%) patients crossed-over to receive operative care; 6.3% (5/80) underwent L-ADR and 1.3% (1/80) received fusion. ODI: Scores 24 months: Authors report three analyses of ODI scores, all of which suggest L-ADR may be superior to multidisciplinary rehabilitation with regard to improving function measured by ODI scores.65 It is not clear that these differences are clinically meaningful. It is not clear which statistical models adjusted for baseline differences between groups. It is unclear if the differences between groups are clinically meaningful (Appendix Table I16).
• ITT analysis based on imputation of missing values using last observation carried forward methods suggested less disability (lower ODI scores) compared with these participating in in multidisciplinary rehabilitation (mean difference −8.4 , 95% CI −13.2, −3.6)
• ITT analysis using a mixed model likewise suggested better function following L-ADR compared with fusion (mean difference −6.9 , 95% CI −11.7, −2.1)
• Per-protocol analysis using a multivariate mixed model also suggests better function following L-ADR compared with fusion (mean difference −8.1 , 95% CI −12.9, −3.2)
Neurological success Neurological success was not reported. Pain: VAS Scores (0-100 [worst]) 24 months: Results for VAS pain scores for suggest that L-ADR may be associated with less pain at 24 months compared with multidisciplinary rehabilitation (mean difference -14.3, 95% CI -23.0, -5.6)65 (Table 36); however, baseline low back pain scores were significantly worse in the rehabilitation group than in the surgery group and it is not clear whether adjustment was made in author-reported analyses. The clinical significance of these differences is not clear and wide confidence intervals suggest substantial variation. Authors report two analyses (Appendix Table I16):
• ITT analysis based on imputation of missing values using last observation carried forward methods suggested less disability (lower VAS pain scores) compared with these participating in in multidisciplinary rehabilitation (mean difference −12.2 , 95% CI −21.3, −3.1).
• ITT mixed model analysis provided similar results; (mean difference 12.7, 95% CI −21.1, −4.2)

WA – Health Technology Assessment December 19, 2016
Artificial disc replacement – Re-review: Final evidence report Page - 145
Table 36. L-ADR vs. Multidisciplinary rehabilitation: VAS pain scores Author ITT analysis*
Risk of Bias Study F/U L-ADR mean ± SD
Rehab mean ± SD
MD (95% CI)† p-value†
VAS pain (0-100), higher score = greater pain Moderately High RoB
Hellum 2011 24 mos. 35.4 ± 29.1 (n=86)
49.7 ± 28.4 (n=86)
-14.3 (-23.0, -5.6) 0.001
CI: confidence interval; F/U: follow-up; ITT: intention-to-treat; L-ADR: lumbar artificial disc replacement; MD: mean difference; RoB: risk of bias; SD: standard deviation; VAS: visual analog scale. *ITT performed with the assumption that patients who dropped out had no improvement after drop-out using last observation carried forward (LOCF) method to account for missing data; author’s ITT does not include 6 patients (3 in each group) that were excluded shortly after randomization and 1 patient who underwent rehabilitation that was excluded because of missing baseline and follow-up values. †Calculated by SRI. Quality of Life Measures 24 months: At 24 months, SF-36 PCS scores were higher in the L-ADR group suggesting better quality of live related to physical function,65 however it is not clear than the difference is clinically significant (Table 37). Baseline SF-36 mental health sub-scores were significantly worse in the rehabilitation group than in the surgery group. Again, it is not clear which author analyses controlled for baseline differences. No differences between treatments was observed for the SF-36 MCS or EQ-5D (Table 37). Author reported ITT analyses were consist with these results (Appendix Table I16). Table 37. L-ADR vs. Multidisciplinary rehabilitation: Quality of Life measures Author ITT analysis*
Risk of Bias Study F/U L-ADR mean ± SD
Rehab mean ± SD
MD (95% CI)† p-value†
SF-36 PCS (0-100), higher score = better health Moderately High RoB
Hellum 2011 24 mos. 43.3 ± 11.7 (n=86)
37.7 ± 10.1 (n=86)
5.6 (2.3, 8.9) 0.001
SF-36 MCS (0-100), higher score = better health Moderately High RoB
Hellum 2011 24 mos. 50.7 ± 11.6 (n=86)
48.6 ± 12.8 (n=86)
2.1 (-1.6, 5.8) 0.26
EQ-5D (−0.59 to 1), higher score = better health Moderately High RoB
Hellum 2011 24 mos. 0.69 ± 0.33 (n=86)
0.63 ± 0.28 (n=86)
0.06 (-0.03, 0.15) 0.20
CI: confidence interval; EQ-5D: EuroQoL 5 Dimensions; F/U: follow-up; ITT: intention-to-treat; L-ADR: lumbar artificial disc replacement; MD: mean difference; RoB: risk of bias; SD: standard deviation; SF-36 PCS and MCS: Short Form-36 questionnaire Physical Component Score and Mental Component Score. *ITT performed with the assumption that patients who dropped out had no improvement after drop-out using last observation carried forward (LOCF) method to account for missing data; author’s ITT does not include 6 patients (3 in each group) that were excluded shortly after randomization and 1 patient who underwent rehabilitation that was excluded because of missing baseline and follow-up values. †Calculated by SRI.

WA – Health Technology Assessment December 19, 2016
Artificial disc replacement – Re-review: Final evidence report Page - 146
Patient Satisfaction 24 months: Patient satisfaction was reported with two different measures (Table 38), both of which suggest that more L-ADR recipients were satisfied with their outcomes at 24 months and care at 12 months.65 Other Outcomes Work Status: There were no differences between treatments with regard to return to work by 24 months65 (Table 38). Medication Use: There were no differences between treatments with regard to daily use of medications by 24 months65 (Table 38). Table 38. L-ADR vs. Multidisciplinary rehabilitation: Patient satisfaction, work status, and medication use Completer analysis
Risk of Bias Study F/U L-ADR % (n/N)*
Rehab % (n/N)*
RR (95% CI)† p-value†
Patient satisfaction: satisfied with outcome (i.e., completely recovered or much improved)‡ Moderately High RoB
Hellum 2011 24 mos. 63% (46/73) 39% (26/66) 1.6 (1.1, 2.3) 0.006
Patient satisfaction: satisfied with care§ Moderately High RoB
Hellum 2011 12 mos. 90% (66/73) 73% (48/66) 1.2 (1.1, 1.5) 0.007
Work status: net back to work rate** Moderately High RoB
Hellum 2011 24 mos. 31% (21/68) 23% (15/65) 1.3 (0.8, 2.4) 0.31
Medication usage: use of drugs daily†† Moderately High RoB
Hellum 2011 24 mos. 22% (16/73) 18% (14/78) 1.2 (0.6, 2.3) 0.54
CI: confidence interval; F/U: follow-up; ITT: intention-to-treat; L-ADR: lumbar artificial disc replacement; RoB: risk of bias; RR: risk ratio. *Denominators were back-calculated based on the percentage and number of patients reported. †Calculated by SRI. ‡Self-assessed on a 7 point Likert scale (1=completely recovered, 2=much recovered to 7=vastly worsened); slightly improved not included as satisfied with outcome. §Assessed using a 4-point global rating scale, not including slightly satisfied as satisfied with care. This outcome was not reported at 24 month (only at 12 months). **Net back to work rate calculated by subtracting patients who went back to work from patients who stopped working (includes part-time sick leave). ††Authors do not specify the type of medication.

WA – Health Technology Assessment December 19, 2016
Artificial disc replacement – Re-review: Final evidence report Page - 147
4.1.3 Cervical Spine
4.1.3.1 C-ADR vs. Fusion: 1-level Studies included Thirteen RCTs met the inclusion criteria; these trials compared C-ADR with ACDF in patients with radiculopathy and/or myelopathy attributed to single-level cervical degenerative disc disease.64,70,85,109,111-113,121,126,146,177,189,190 Six of the 13 trials were conducted as IDE (investigational device exemption) trials for the US FDA.169-174 In addition, three non-randomized comparative studies were included: two of these were prospective cohort studies74,87 and one was a registry study.157 RCTs Study characteristics Treatments: All trials randomized patients to receive either C-ADR or ACDF at a single level between C3-C4 and C6-C7. A variety of artificial disc devices were used across the trials (see Table 39); the majority of trials employed autograft and a plating system in the ACDF group (see Appendix Table H1 for details).64,70,85,109,111-113,121,126,146,177,189,190 Inclusion criteria and patient characteristics: In general, the trials included adults with radiculopathy and/or myelopathy attributed to single-level cervical degenerative disc disease.64,70,85,109,111-
113,121,126,146,177,189,190 Eight trials enrolled patients with radiculopathy and/or myelopathy (BRYAN, Prestige ST, ProDisc-C, PCM, Mobi-C (1-level), and Secure-C IDE trials; Rozankovic 2016; Zhang 2012) while two trials included only patients with radiculopathy (Nabhan 2007, Nabhan 2011). In addition, three trials specified only that patients have single-level degenerative disc disease (Karabag 2014, Peng-Fei 2008, Zhang 2014). All of the trials required patients to have failed at least six weeks (BRYAN, Prestige ST, ProDisc-C, PCM, Mobi-C, Secure-C IDE trials; Zhang 2012) or 12 weeks (Rozankovic 2016, Zhang 2014) of nonsurgical treatment; alternatively, patients who had not received the minimum duration of nonsurgical treatment but who demonstrated worsening symptoms or had signs indicative of nerve root or spinal cord compression were considered eligible for inclusion by seven trials (BRYAN, Prestige ST, ProDisc-C, PCM, Mobi-C, Secure-C IDE trials; Nabhan 2007). Some trials placed restrictions on patient age such that patients over a specific age (ranging from 60 to 69 years) (ProDisc-C, PCM, Mobi-C, Secure-C, Nabhan 2007, Zhang 2014) were excluded; moreover, IDE trials excluded patients who had previously undergone surgery at the index level (except for the PCM trial, which permitted prior decompression). Complete inclusion and exclusion criteria are provided in Appendix Table H1. Patient demographics are detailed in Table 40. In general, the level most commonly treated was C5-C6, followed by C6-C7, C4-C5, and C3-C4 (in decreasing order of frequency). Male patients comprised approximately half the study population (range, 44.4%-65%), and mean patient age was in the mid-40s (range, 41.3-46.7 years old). In the studies that reported it, mean body mass index (BMI) ranged from 26.4 to 29.0 kg/m2. The vast majority of patients were Caucasian. At baseline, approximately one third of patients were using tobacco (range, 24.0%-51.8%) as reported in five trials. The majority of baseline characteristics were equally distributed between C-ADR and ACDF treatment groups. Risk of bias: None of the trials met all the criteria needed to be considered at low risk of bias; none had blinded outcome assessment. Three trials (ProDisc-C, Mobi-C (1-level) IDE trials; and at 24 months only, the Prestige ST IDE trial) were found to be at moderately low risk of bias; that is, they met all but one or

WA – Health Technology Assessment December 19, 2016
Artificial disc replacement – Re-review: Final evidence report Page - 148
two criteria of a good RCT. The remaining trials (including the Prestige ST IDE trial at 60 and 84 months) were considered to be at moderately high risk of bias, as they did not meet three or more criteria of a good quality RCT. Methodological limitations included unclear random sequence generation in five trials,85,121,126,177,189 unclear allocation concealment in nine trials,85,109,112,113,121,126,146,189,190 lack of blinded outcome assessment in all trials; insufficient information to determine whether co-interventions were applied equally between groups in seven trials,85,112,113,121,126,146,189 unequal application of co-interventions between groups,190 complete follow-up of less than 80% of patients at one or more time points in eight trials,64,70,85,109,111,113,126,189 differential follow-up between groups by 10% or more in three trials,64,111,177, and failure to control for (or provide sufficient detail to evaluate) potentially confounding differences between groups in six trials.85,112,113,121,126,146 The risk of bias evaluation table and reasons for not giving credit can be found in Appendix Table E5.
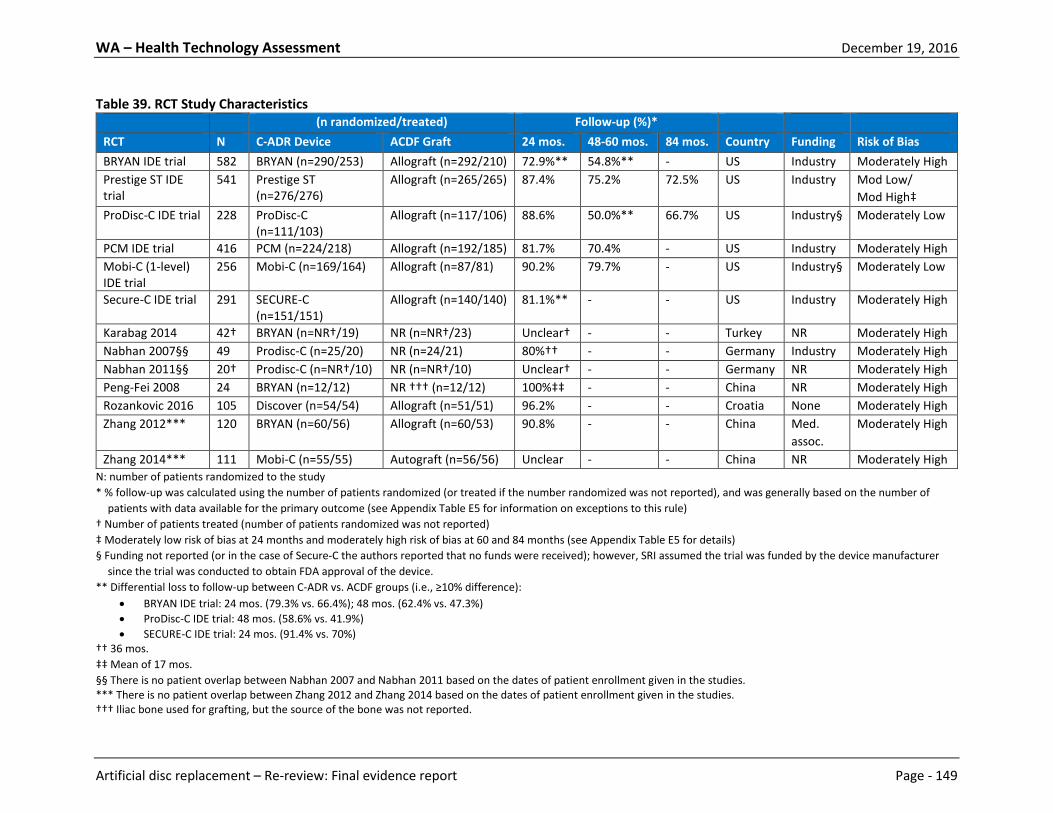
WA – Health Technology Assessment December 19, 2016
Artificial disc replacement – Re-review: Final evidence report Page - 149
Table 39. RCT Study Characteristics (n randomized/treated) Follow-up (%)* RCT N C-ADR Device ACDF Graft 24 mos. 48-60 mos. 84 mos. Country Funding Risk of Bias BRYAN IDE trial 582 BRYAN (n=290/253) Allograft (n=292/210) 72.9%** 54.8%** - US Industry Moderately High Prestige ST IDE trial
541 Prestige ST (n=276/276)
Allograft (n=265/265) 87.4% 75.2% 72.5% US Industry Mod Low/ Mod High‡
ProDisc-C IDE trial 228 ProDisc-C (n=111/103)
Allograft (n=117/106) 88.6% 50.0%** 66.7% US Industry§ Moderately Low
PCM IDE trial 416 PCM (n=224/218) Allograft (n=192/185) 81.7% 70.4% - US Industry Moderately High Mobi-C (1-level) IDE trial
256 Mobi-C (n=169/164) Allograft (n=87/81) 90.2% 79.7% - US Industry§ Moderately Low
Secure-C IDE trial 291 SECURE-C (n=151/151)
Allograft (n=140/140) 81.1%** - - US Industry Moderately High
Karabag 2014 42† BRYAN (n=NR†/19) NR (n=NR†/23) Unclear† - - Turkey NR Moderately High Nabhan 2007§§ 49 Prodisc-C (n=25/20) NR (n=24/21) 80%†† - - Germany Industry Moderately High Nabhan 2011§§ 20† Prodisc-C (n=NR†/10) NR (n=NR†/10) Unclear† - - Germany NR Moderately High Peng-Fei 2008 24 BRYAN (n=12/12) NR ††† (n=12/12) 100%‡‡ - - China NR Moderately High Rozankovic 2016 105 Discover (n=54/54) Allograft (n=51/51) 96.2% - - Croatia None Moderately High Zhang 2012*** 120 BRYAN (n=60/56) Allograft (n=60/53) 90.8% - - China Med.
assoc. Moderately High
Zhang 2014*** 111 Mobi-C (n=55/55) Autograft (n=56/56) Unclear - - China NR Moderately High N: number of patients randomized to the study * % follow-up was calculated using the number of patients randomized (or treated if the number randomized was not reported), and was generally based on the number of
patients with data available for the primary outcome (see Appendix Table E5 for information on exceptions to this rule) † Number of patients treated (number of patients randomized was not reported) ‡ Moderately low risk of bias at 24 months and moderately high risk of bias at 60 and 84 months (see Appendix Table E5 for details) § Funding not reported (or in the case of Secure-C the authors reported that no funds were received); however, SRI assumed the trial was funded by the device manufacturer
since the trial was conducted to obtain FDA approval of the device. ** Differential loss to follow-up between C-ADR vs. ACDF groups (i.e., ≥10% difference):
• BRYAN IDE trial: 24 mos. (79.3% vs. 66.4%); 48 mos. (62.4% vs. 47.3%) • ProDisc-C IDE trial: 48 mos. (58.6% vs. 41.9%) • SECURE-C IDE trial: 24 mos. (91.4% vs. 70%)
†† 36 mos. ‡‡ Mean of 17 mos. §§ There is no patient overlap between Nabhan 2007 and Nabhan 2011 based on the dates of patient enrollment given in the studies. *** There is no patient overlap between Zhang 2012 and Zhang 2014 based on the dates of patient enrollment given in the studies. ††† Iliac bone used for grafting, but the source of the bone was not reported.

WA – Health Technology Assessment December 19, 2016
Artificial disc replacement – Re-review: Final evidence report Page - 150
Table 40. RCT Patient Demographics RCT Group Level treated:
C3-4/C4-5/C5-6/C6-7 (%) Male (%)
Age (mean ± SD)
BMI (kg/m2) (mean)
Caucasian (%)
Current tobacco use (%)
Working (%)
Worker’s Comp (%)
Involved in spinal litigation (%)
Prior surgery at index level (%)
BRYAN IDE trial
C-ADR 1.2%/5.0%/57.9%/36.0% 45.5% 44.4 ± 7.9 26.6 95.5% 25.5% 64.5% 6.2% 2.5% 0%† ACDF 0%/7.7%/49.8%/42.5% 51.1% 44.7 ± 8.6 27.6 92.3% 24.0% 65.0% 5.0% 2.7% 0%†
Prestige ST IDE trial
C-ADR 2.5%/5.1%/51.4%/40.9% 46.4% 43.3 ± 7.6 NR 94.2% 34.4% 65.9% 11.6% 10.9% 0%† ACDF 3.8%/5.7%/56.2%/34.3% 46.0% 43.9 ± 8.8 NR 91.7% 34.7% 62.6% 13.2% 12.1% 0%†
ProDisc-C IDE trial
C-ADR 2.9%/9.7%/56.3%/31.1% 44.7% 42.1 ± 8.4 26.4 85.4% 33.0% 82.5% NR NR 0%† ACDF 0.9%/5.7%/57.5%/35.8% 46.2% 43.5 ± 7.1 27.3 91.5% 34.9% 84.9% NR NR 0%†
PCM IDE trial C-ADR 0%/14.2%/50.0%/34.9%§ 51.8% 45.3 ± 9.0 28.2 92.7% 51.8% NR 11.9% 0%† 0%†** ACDF 4.3%/9.2%/53.0%/33.5%§ 51.9% 43.7 ± 8.3 27.3 91.9% 48.6% NR 11.4% 0%† 0%†**
Mobi-C (1-level) IDE trial
C-ADR 0.6%/6.7%/56.1%/36.6% 47.6% 43.3 ± 9.2 27.3 92.7% NR†† 65.9%‡‡ 0%† 0%† 0%† ACDF 4.9%/2.5%/56.8%/35.8% 44.4% 44.0 ± 8.2 27.4 85.2% NR†† 56.8%‡‡ 0%† 0%† 0%†
Secure-C IDE trial
C-ADR 3.3%/5.3%/49.7%/41.7% 53.6% 43.4 ± 7.5 28.9 90.1% 33.8% NR NR NR 0%† ACDF 2.9%/7.9%/50.0%/39.3% 48.6% 44.4 ± 7.9 29.0 90.0% 37.9% NR NR NR 0%†
Karabag 2014 C-ADR 0%/15.7%/52.6%/31.5% NR 43.1 ± 6.1 NR NR NR NR NR NR NR ACDF 0%/13.0%/47.8%/39.0% NR 46.2 ± 4.7 NR NR NR NR NR NR NR
Nabhan 2007§§
C-ADR NR 56%* NR NR NR NR NR NR NR NR ACDF NR NR NR NR NR NR NR NR
Nabhan 2011§§
C-ADR NR 65%* 43.0 ± 7* NR NR NR NR NR NR NR ACDF NR NR NR NR NR NR NR NR
Peng-Fei 2008 C-ADR NR 71%* 42* NR NR NR NR NR NR NR ACDF NR NR NR NR NR NR NR NR
Rozankovic 2016
C-ADR 2.0%/8.0%/53.0%/37.0% 49% 41.3 ± 8.8 NR NR NR NR NR NR NR ACDF 2.0%/10.0%/52.0%/36.0% 50% 41.9 ± 9.4 NR NR NR NR NR NR NR
Zhang 2012***
C-ADR 11.7%/31.7%/43.3%/13.3% 58.3% 44.8 ± 5.6 NR NR NR NR NR NR NR ACDF 6.7%/33.3%/41.6%/18.3% 53.3% 45.6 ± 5.8 NR NR NR NR NR NR NR
Zhang 2014***
C-ADR 18.1%/30.9%/29.1%/21.8% 45% 44.8 25.3 NR NR NR NR NR NR ACDF 21.4%/32.1%/28.5%/21.4% 46% 46.7 26.5 NR NR NR NR NR NR
N/n: number of patients randomized to the study/group; NR: not reported * Data were not stratified by treatment group. † As per the trial’s inclusion/exclusion criteria (some details of which were only available in the FDA SSED report).

WA – Health Technology Assessment December 19, 2016
Artificial disc replacement – Re-review: Final evidence report Page - 151
§ C7-T1: 0.9% vs. 0.0% ** Patients were excluded on the basis of failed fusion at the index level; however, the following surgeries had been performed (C-ADR vs. ACDF):
• Prior laminoforaminotomy without facetectomy: 0.5% vs. 1.6% • Prior laminoforaminotomy with facetectomy: 0.5% vs. 2.2%
†† Current tobacco use was only reported in terms of the percentage of patients that smoke ≥1 pack per day (0% vs. 0%). ‡‡ Defined as able to work. §§ There is no patient overlap between Nabhan 2007 and Nabhan 2011 based on the dates of patient enrollment given in the studies. *** There is no patient overlap between Zhang 2012 and Zhang 2014 based on the dates of patient enrollment given in the studies.

WA – Health Technology Assessment December 19, 2016
Artificial disc replacement – Re-review: Final evidence report Page - 152
Efficacy Results All analyses are based on completers only (i.e., those with data available) unless otherwise indicated. The primary outcomes of interest (overall clinical success, NDI success, neurological success, and pain success) were evaluated using both intention to treat (ITT) analysis and completer analysis. Overall Clinical Success Overall clinical success was defined in a number of ways across the included trials. Three definitions of overall success were similar enough that results could be pooled and included the following components:
• NDI score improvement ≥ 15 points (from baseline) • Maintenance or improvement in neurological status • No additional surgery from device failure (removal, revision, supplemental fixation) • No device-related adverse events and/or major complications • In addition, one trial required patients to achieve radiological success for motion (PCM trial);
another stipulated no changes to the treatment plan made intraoperatively (SECURE-C trial) 24 months: Meta-analysis across five trials suggests that C-ADR was superior to ACDF in terms of the percentage of patients who achieved overall success at 24 months; this conclusion was supported by ITT analysis (pooled RD 14.0% (95% CI 9.9%, 18.2%), I2=0%, N=2058) (Figure 16a) as well as by completer-only analysis (pooled RD 9.5% (95% CI 5.3%, 13.7%), I2=0%, N=1681) (Figure 17a).23,64,111,126,177 Sensitivity analysis was employed to determine what effect the missing data had on conclusions; the results of this analysis supported the superiority of C-ADR compared with ACDF except in the extreme scenario favoring ACDF (in which all missing C-ADR patients were considered failures and all missing ACDF patients were considered successes); in this latter case, non-inferiority is inconclusive using the -10% margin (Figure 18a). One additional trial at moderately low risk of bias (Mobi-C trial, N=230) reported no difference between groups in overall success (76.3% vs. 72.0%, RD 4.1% (95% CI -8.1%, 16.3%) based on analysis of completers only), but used a slightly different definition of NDI success (if baseline NDI ≥ 60 then required improvement of ≥ 30 points; if baseline NDI < 60 then required improvement of ≥ 50%).70 Several studies also evaluated results using different definitions of overall success:
• The following changes to the definition of overall success did not alter the 24 month conclusions made by individual studies (Appendix X, based on analysis of completers): changing the NDI requirement to an improvement of 20% or more from baseline (ProDisc-C and PCM trials);111,126 changing the NDI requirement to an improvement of 20% or more from baseline, eliminating the requirement for neurological status maintenance or improvement, and requiring radiographic fusion in the ACDF group (SECURE-C trial);177 requiring radiographic success (Mobi-C trial);70 or adding a disc height requirement (Prestige ST trial)23 (Appendix Table J1).
• In contrast, the ProDisc-C trial found that defining overall success in a way that focused on the MCID (minimum clinically important difference) of various patient-reported outcome measures altered the conclusions such that more C-ADR than ACDF patients achieved this measure of success (73.5% vs. 60.5%, MD 12.9% (95% CI 0.0%, 25.7%), although the difference did not reach statistical significance.111 The outcomes evaluated in this alternate definition were NDI, patient satisfaction, and neck or arm pain success as well as no device failure, fusion (C-ADR)/pseudarthrosis (ACDF), or strong narcotic/muscle relaxant use (Appendix Table J1).

WA – Health Technology Assessment December 19, 2016
Artificial disc replacement – Re-review: Final evidence report Page - 153
48-60 months: Pooled analysis across three trials suggests that significantly more C-ADR than ACDF patients achieved overall success at 48 to 60 months based on ITT analysis (pooled RD 14.9% (95% CI 9.6%, 20.1%), I2=0%, N=1379) (Figure 16b) and on completer-only analysis (pooled RD 9.6% (95% CI 3.9%, 15.3%), I2=0%, N=933) (Figure 17b).23,72,147 In order to evaluate what impact missing data had on these conclusions, sensitivity analysis was performed using a -10% non-inferiority margin. The results of this analysis suggest that if all patients with missing data were successes, then C-ADR was non-inferior to ACDF. In the extreme scenarios favoring C-ADR (in which all missing C-ADR patients were considered successes and all missing ACDF patients were considered failures), C-ADR was superior to ACDF; in the opposite extreme scenario favoring ACDF, non-inferiority is inconclusive (Figure 18b). The addition of a disc height requirement did not change the results at 60 months in the Prestige ST trial (Appendix Table J1).23 84 months: One trial (Prestige ST trial) suggests that at 84 months, overall success was significantly more common in the C-ADR group than the ACDF group based on both ITT analysis (RD 13.5% (95% CI 5.1%, 21.8%), N=541) (Figure 16c) and completer-only analysis (RD 11.8% (95% CI 2.0%, 20.1%), N=395) (Figure 17c).23 Sensitivity analysis of the 84-month data yielded similar conclusions to those of the 48 to 60 month data; that is, ITT analysis that assumed all patients with missing data were successes suggested non-inferiority of C-ADR compared with ACDF, while the extreme scenarios favoring C-ADR (or ACDF) resulted in superiority (or non-inferiority) of ACDF (Figure 18c). Adding a disc height requirement did not change these conclusions (Appendix Table J1).23 NDI: Success NDI success was most commonly defined as an improvement of at least 15 points from baseline; variations in this definition are noted below. 24 months: Pooled analysis across five trials suggests that slightly more C-ADR than fusion patients achieved NDI success (≥15-point improvement) at 24 months based on both ITT analysis (pooled RD 10.0% (95% CI 6.0%, 14.1%), I2=0%, N=2058) (Figure 19a) and completer-only analysis (pooled RD 4.3% (95% CI 0.6%, 8.1%) I2=0%, N=1640) (Figure 20a).23,64,111,126,177 The pooled effect size was probably attributable to the large sample size, few individual trials reported a significant effect. The impact of study quality was explored using subgroup analysis. While the pooled subtotal from the two moderately risk of bias trials (N=623) was not statistically significant in either analysis, that from the three moderately high risk of bias trials (N=1017) suggested a significant effect in favor of C-ADR. However, a statistical test for subgroup differences found no significant difference between these two subgroups (p≥0.20); moreover, the difference may be attributed to the larger sample sizes in the moderately high risk of bias trials. One additional moderately low risk of bias trial (Mobi-C trial, N=230) found no difference between groups in the percentage of patients who achieved NDI success (79.4% vs. 77.1%, RD 2.0% (-9.4%, 13.4%)); the trial used a slightly different definition of NDI success (≥30-point improvement if baseline NDI ≥60 points; ≥50% improvement if baseline NDI <60 points) which precluded its inclusion in the pooled analysis.70

WA – Health Technology Assessment December 19, 2016
Artificial disc replacement – Re-review: Final evidence report Page - 154
The following changes to the definition of NDI success did not alter the 24-month conclusions from individual studies (Appendix Table J2): changing the NDI requirement to an improvement of at least 20% (ProDisc-C and PCM trials)111,126 or 25% from baseline (SECURE-C trial).177 48-60 months: Pooled analysis across three trials indicates that C-ADR is as good as or slightly better than ACDF in terms of NDI success at 48 to 60 months: while the ITT analysis suggests superiority of C-ADR (pooled RD 12.6% (95% CI 4.6%, 20.6%), I2=55%, N=1379) (Figure 19b), the analysis of completers only indicates similar results between groups (pooled RD 5.8% (95% CI -1.8%, 13.3%), I2=51%, N=933) (Figure 20b).23,72,147 However, there was statistical heterogeneity in the pooled estimates (I2≥51%): one moderately high risk of bias trial (Bryan trial) found that significantly more C-ADR patients achieved NDI success at 48 months, while the other two trials (Prestige ST, Mobi-C trials) showed no difference between groups at 60 months. One additional moderately high risk of bias trial (PCM trial, N=288) found that significantly more C-ADR than ACDF patients achieved NDI success at 60 months (85.0% vs. 74.2%, RD 10.8% (95% CI 1.4%, 20.2%)), but used a different definition of NDI success than the pooled trials (NDI ≥20%).70 84 months: Data from one trial suggest no or possibly some benefit with C-ADR over ACDF at 84 months: while the ITT analysis indicates superiority of C-ADR (RD 8.7% (95% CI 0.42%, 16.9%), N=541) (Figure 19c), the completer analysis suggested equivalence between groups (RD 3.2% (95% CI -4.5%, 10.8%), N=395) (Figure 20c).23 NDI: Scores 24 months: Pooled analysis across nine RCTs (N=2183) suggests that C-ADR conferred a slight benefit over ACDF in terms of mean NDI scores at 24 months, however the difference did not reach statistical significance (WMD 1.11 (95% CI -0.06, 2.27), I2=39%) (Figure 21a).23,72,80,85,126,147,177,189,190 One additional moderately high risk of bias trial (Rozankovic 2016, N=101) reported significantly better mean NDI scores with C-ADR than ACDF (MD 8.1 (95% CI 6.0, 10.2));146 the RCT was excluded from the pooled analysis because its mean difference was considerably different from that reported by any other trial. 48-60 months: Pooled analysis (6 RCTs, N=1443) shows slightly but significantly better NDI scores with C-ADR than ACDF at 48 to 60 months (WMD 4.21 (95% CI 1.67, 6.75), I2=37%).23,42,72,125,147,189 However, this effect appears to stem largely from three moderately high risk of bias trials, as the two moderately low risk of bias trials together suggest equivalence (Figure 21b). Regardless, the difference seen in the pooled effect of 4.2 points is probably not clinically meaningful. 84 months: At 84 months, one moderately low risk of bias trial (ProDisc-C trial, N=152) reported similar NDI scores in both groups,80 while one moderately high risk of bias trial (Prestige ST trial, N=392) reported significantly better NDI scores with C-ADR than with ACDF.23 As such, the resulting pooled effect, which suggests a slight benefit with C-ADR (WMD 4.41 (95% CI 0.68, 8.14), I2=9%)) (Figure 21c) should be interpreted with caution.

WA – Health Technology Assessment December 19, 2016
Artificial disc replacement – Re-review: Final evidence report Page - 155
Neurological success Neurological success was defined as the maintenance or improvement of all of the following: motor function, sensory function, and deep tendon reflexes. 24 months: Pooled analysis from six trials suggests superiority of C-ADR over ACDF at 24 months based on both the ITT (pooled RD 11.6% (95% CI 8.2%, 15.1%), I2=0%, N=2314) (Figure 22a) and completer-only analyses (pooled RD 3.2% (95% CI 0.8%, 5.7%), I2=14%, N=1882) (Figure 23a).23,64,72,80,126,177 48-60 months: Overall results from four trials similarly suggest superiority of C-ADR at 48 to 60 months based on the ITT analysis (pooled RD 11.6% (95% CI 7.1%, 16.2%), I2=0%, N=1767) (Figure 22b) as well as the completer-only analysis (pooled RD 4.0% (95% CI 0.5%, 7.5%), I2=0%, N=1147) (Figure 23b).23,125,147,195 Although the single moderately low risk of bias trial (ProDisc-C trial) found no difference between groups in both analyses, a test for subgroup differences suggested no statistically meaningful difference between results from trials at moderately low versus moderately high risk of bias (p≥0.23). 84 months: At 84 months, results were mixed, with one moderately low risk of bias trial (ProDisc-C trial) reporting no difference between groups in both analyses,80 and one moderately high risk of bias trial (Prestige ST trial) indicating that neurological success was more common with C-ADR than ACDF in both analyses,23 (Figures 22c and 23c). Therefore, C-ADR may be at least as effective as ACDF. Arm Pain: Success Arm pain success was defined as an improvement of at least 20 points in VAS scores (measured on a 100-point scale) from baseline. 24 months: Two moderately high risk of bias trials (N=578) found no difference between groups in the percentage of patients who achieved arm pain success at 24 months (PCM trial, SECURE-C trial)126,177 (Table 41). While the PCM trial reported this outcome for the arm with the worst pain, the SECURE-C trial reported data for both the right and left arms separately; data were not pooled because of these differences. Altering the definition of arm pain success (≥20-point improvement or score = 0) did not change the results at 24 months in the SECURE-C trial (Appendix Table J5). 60 months: Results from the PCM trial (N=288) suggest no difference between groups at 60 months (Table 41).125 84 months: No data reported.

WA – Health Technology Assessment December 19, 2016
Artificial disc replacement – Re-review: Final evidence report Page - 156
Table 41. C-ADR vs. ACDF (1-level): Arm pain success Completer analysis
Study F/U ADR % (n/N)
ACDF % (n/N)
RD (95% CI)* p-value*
Arm pain success: postoperative ≥20-point improvement on VAS SECURE-C trial (SECURE-C SSED): Left arm
24 mos. 55.6% (74/133)
50.9% (55/108)
4.7% (-7.9%, 17.4%) 0.47
SECURE-C trial (SECURE-C SSED): Right arm
42.9% (57/133)
45.4% (49/108)
-2.5% (-15.1%, 10.1%) 0.70
Arm (worst) pain success: postoperative ≥20-point improvement on VAS PCM trial (Phillips 2013)
24 mos. 79.1% (148/187)
75.3% (113/150)
3.8% (-5.2%, 12.8%) 0.41
PCM trial (Phillips 2015)
60 mos. 80.6% (129/160)
71.1% (91/128)
9.5% (-0.4%, 19.5%) 0.06
Arm Pain: VAS/NRS Scores 24 months: Pooled analysis across seven RCTs (N=2015) suggests that C-ADR conferred a slight benefit over ACDF in terms of mean arm pain VAS or NRS scores at 24 months (WMD 1.60 (95% CI 0.51, 2.70), I2=0%));23,72,80,126,147,177,190 however, this difference is probably not clinically meaningful (Figure 24a). In general, no details were reported regarding which arm was evaluated, with two exceptions: the Mobi-C trial reported only on the arm with the worst pain, and the Secure-C IDE trial reported scores for both arms. Two additional moderately high risk of bias trials (Rozankovic 2016 (N=101), Nabhan 2007 (N=39)) also reported significantly better mean arm pain VAS scores with C-ADR than ACDF (MD for both was 7.0) (Appendix Table J6);112,146 these trials were excluded from the pooled analysis because their mean differences were both considerably different from those reported by other trials and their inclusion led to high statistical heterogeneity (resulting I2=79%; data not shown). One moderately high risk of bias trial (Nabhan 2011, N=20) reported no difference between groups at 12 months; no data were reported for longer timepoints.113 48-60 months: Pooled analysis across five trials (N=1332) suggests slightly better arm pain scores with C-ADR versus ACDF at 48 to 60 months (WMD 3.82 (95% CI 1.15, 6.48), I2=0%) (Figure 24b).23,42,72,125,147 Again, this difference is small and probably not clinically meaningful. 84 months: Pooled analysis across two RCTs (N=543) indicates that there was no difference between groups at 84 months (WMD 2.21 (95% CI -2.08, 6.50), I2=0%) (Figure 24c).23,80 Neck Pain: Success Neck pain success was defined as an improvement of at least 20 points in the 100-point VAS score.
WA – Health Technology Assessment December 19, 2016
Artificial disc replacement – Re-review: Final evidence report Page - 157
24 months: Pooled analysis across two trials (N=578) equivalence between groups in terms of neck pain success at 24 months based on the ITT analysis (pooled RD 9.2% (95% CI -3.2%, 21.5%), I2=66%) (Figure 25a) and the completer-only analysis (pooled RD 3.6% (95% CI -6.1%, 13.4%), I2=47%) (Figure 26a).126,177 Although there was some statistical heterogeneity present in the pooled estimate, both trials reported no statistical difference between groups. 60 months: Results from one trial (N=416) suggest no difference between groups in neck pain success at 60 months based on ITT analysis (RD 0.8% (95% CI -8.8%, 10.5%)) (Figure 25b) and on completer-only analysis (RD -4.0% (95% CI -14.1%, 6.3%)) (Figure 26b).126 84 months: No data reported. Neck Pain: VAS/NRS Scores 24 months: Pooled analysis across nine trials (N=2155) suggests that there were slightly better neck pain scores with C-ADR versus ACDF at 24 months (WMD 5.11 (95% CI 2.55, 7.66), I2=80%) (Figure 27a);23,72,80,112,126,145,147,177,190 this difference is probably not clinically meaningful. The pooled estimate had high statistical heterogeneity (I2=80%), so results should be interpreted cautiously. Subgroup analysis based on risk of bias was performed; the three trials at moderately low risk of bias (N=905) together indicate no difference between groups (WMD 1.29 (95% CI -1.28, 3.86), I2=0%)). In contrast, results from the six moderately high risk of bias trials (N=1250) favor C-ADR but have high statistical heterogeneity (I2=84%). 48-60 months: The pooled estimate across the five trials reporting (N=1331) suggests a small benefit with C-ADR over ACDF at 48 to 60 months (WMD 6.63 (95% CI 3.29, 9.97), I2=25%) (Figure 27b);23,42,72,125,147 again, whether this difference would be clinically meaningful is unclear. 84 months: At 84 months, results were mixed, with one moderately low risk of bias trial (ProDisc-C trial, N=136) finding no difference between groups,80 and one moderately high risk of bias trial (Prestige ST trial, N=395) reporting better neck pain scores with C-ADR versus ACDF 23 (Figure 27c). As such, the pooled estimate, which suggests a slight benefit with C-ADR over ACDF (WMD 5.59 (95% CI 1.31, 9.86), I2=0%), should be interpreted cautiously. SF-36: Success SF-36 success was defined as an improvement of 15% or more from baseline unless otherwise specified. Success for both the SF-36 PCS (physical component score) and the SF-36 MCS (mental component score) was reported. 24 months: No statistical difference was found in the percentage of patients achieving SF-36 PCS or MCS success between groups based on pooled analysis across three trials (N=779) (Figures 28a and 29a, respectively).126,156

WA – Health Technology Assessment December 19, 2016
Artificial disc replacement – Re-review: Final evidence report Page - 158
60 months: One trial (N=283) reported that significantly more C-ADR patients had SF-36 PCS success at 60 months compared with ACDF patients (Figure 28b), but found that SF-36 MCS success results were similar between groups (Figure 29b).125 At 48 months, one trial reported no difference between groups in the percentage of patients who had achieved any improvement from baseline in SF-36 PCS and MCS scores (assessed individually) (Appendix Table J10).42 84 months: No data reported. SF-36: PCS and MCS Scores 24 months: For SF-36 PCS scores, pooled analysis of data from six trials (N=1912) indicates that scores were slightly better with C-ADR versus ACDF (WMD 1.50 (95% CI 0.47, 2.54), I2=0%) (Figure 30a)23,72,80,126,147,177; this difference is probably not clinically significant. SF-36 MCS scores from the same six trials23,72,80,126,147,177 all suggest no difference between groups (Appendix Table J12); however, the majority of studies did not report standard deviations, precluding pooled analysis. 48-60 months: The pooled estimate of SF-36 PCS scores from four trials (N=1211) indicates a very small benefit with C-ADR over ACDF at 48 to 60 months (WMD 2.02 (95% CI 0.19, 3.84), I2=46%) (Figure 30b).23,72,125,147 SF-36 MCS scores at 60 months were reported by two trials. The trial at moderately low risk of bias (Mobi-C trial, N=212) reported identical scores in both groups,71 while the trial at moderately high risk of bias (PCM trial, N=100) indicated a small but statistically significant difference in scores between groups that favored C-ADR (MD 4, p<0.01)125 (Appendix Table J12). 84 months: SF-36 PCS (2 trials, N=540)23,80 (WMD 1.27 (95% CI -0.67, 3.22), I2=0%) and MCS (1 trial, N=152)80 (MD 2.0 (95% CI -1.9, 5.9)) scores were similar between groups at 84 months (Figure 30c and Appendix Table J12, respectfully). Patient Satisfaction 24 months: Across four trials (N=1028), slightly more C-ADR patients reported being very or somewhat satisfied42,72,126 (or definitely or mostly satisfied as reported in one trial177) compared with ACDF patients (pooled RD 5.1% (95% CI 1.1%, 9.1%), I2=16%) (Figure 31a). However, three out of the four trials (including those at moderately low risk of bias) individually reported no significant difference between groups. Two of the trials also reported similar patient satisfaction VAS scores between groups (Figure 32a).80,126 Two trials70,126 reported no difference between groups in the percentage of patients who would definitely or probably recommend the procedure to a friend and one trial42 indicated a similar

WA – Health Technology Assessment December 19, 2016
Artificial disc replacement – Re-review: Final evidence report Page - 159
proportion of C-ADR and ACDF patients said they would undergo the same surgery again (Appendix Table J13). 48-60 months: The pooled estimate from three trials (N=606) suggests a small benefit with C-ADR versus ACDF in terms of patients being very or somewhat satisfied, however the difference did not reach statistical significance (pooled RD 6.2% (95% CI -1.2%, 13.7%), I2=51%) (Figure 31b).42,72,125 Two of the trials together reported slightly better patient satisfaction VAS scores (scale, 0-100) in the C-ADR group, however, the clinical relevance of the difference is unclear (WMD 8.7 (95% CI 3.5, 14.0), I2=0%) (Figure 32b).42,125 In addition, two RCTs72,125 each indicated that significantly more C-ADR patients would definitely or probably recommend the surgery to a friend, and one trial42 reported no difference between groups in the percentage of patients who said they would undergo the same surgery again (Appendix Table J13). 84 months: The ProDisc-C trial (N=152) reported similar 84-month patient satisfaction VAS scores across both groups (Figure 32c).80 Other Outcomes Odom’s Criteria: Across three moderately high risk of bias trials (N=407), there was no significant difference in the percentage of patients rated as “excellent” or “good” according to Odom’s criteria (Figure 33a) at 24 months (or at a mean of 17 months in one study).85,121,126 Return to Work: There were no differences between groups in the percentage of patients who returned to work at 24 months (4 trials, N=1184),64,109,111,151 48 to 60 months (2 trials, N=590),22,147 or 84 months (1 trial, N=395) (Figures 34a, b, c).23 Two additional trials reported similar mean times to return to work as measured at 24 months (N=521) (Figure 35a).39,177 In contrast, one trial indicated that the C-ADR returned to work in significantly less time than the ACDF group did (as measured at 84 months), although no data were reported (Appendix Table J16).23 Nurick Grade: The PCM trial (N=338) found that slightly more C-ADR patients had maintained or improved their Nurick Grade as evaluated at 24 (100% vs. 96.7%, p=0.01) and 60 months (99.4% vs. 96.9%, p=0.11) (Appendix Table J18).125,126 JOA Scores: JOA scores were reported to be similar between groups by two studies, with outcomes reported at a mean of 17 months in one trial121 as well as at 24 and 48 months in another trial (Appendix Table J19).189 Medication Use: Medication use was reported only by the ProDisc-C trial (N=209); there were no differences between groups in the percentage of patients using schedule 2 or 3 narcotics or muscle relaxants (evaluated separately) at 24 and 84 months.80,111 However, slightly more C-ADR than ACDF patients had “medication use success” (which was defined as the absence of strong narcotic and/or muscle relaxant use) at 24 months (90.0% vs. 79.2% (RD 10.9% (95% CI 1.1%, 20.7%)) (Appendix Table J20).111

WA – Health Technology Assessment December 19, 2016
Artificial disc replacement – Re-review: Final evidence report Page - 160
Non-randomized comparative studies Three non-randomized comparative studies74,87,157 met the inclusion criteria (one additional study134 was included that reported on safety only- see Key Question 2 results for details); study characteristics and patient demographics are summarized below and in Table 42. Due to methodological limitations, all three studies were considered to be at moderately high risk of bias (see Appendix Tables E6 and E7 for details). One prospective and one retrospective cohort study74,87 compared C-ADR to ACDF at 1- or 2-levels – data were stratified and results for the 1-level cohorts are presented here. Kim et al. reported that the majority of single-level patients had radiculopathy (89.2%), while the remaining patients had myelopathy (10.8%); patients were followed for a mean of 18 months (range, 12-40 months). Hou et al. also included patients with radiculopathy (40%), myelopathy (28%), or both (32%); patients were followed for 24 months. One study was a registry study (Staub 2016)157; this publication conducted three sub-studies, the results from which are reported separately. The study identified patients from the Spine Tango international registry who underwent single-level C-ADR or ACDF for cervical degenerative disc disease with no history of surgery in the cervical spine and for whom follow-up data was available between 3 and 24 months. The “matching” sub-study was designed to represent a patient population similar to that included in RCTs; this sub-study additionally excluded patients 60 years or older who had more than 24 months’ follow-up or atypical conditions (i.e., spondylosis, trauma, facet joint degeneration, or spondylolisthesis) and those C-ADR and ACDF patients who met the inclusion criteria were then selected through a matching process using propensity scores. The “atypical” sub-study was conducted to evaluate treatment effect in patients who are generally excluded from RCTs – these patients did not meet the inclusion criteria to be in the matching study, primarily because of older age (62.9% were aged ≥60) or a spondylosis diagnosis (42.8%). In this sub-study, C-ADR patients were significantly younger than those who received ACDF (mean age 53.8 vs. 61.1 years) and had longer follow-up (mean 17.5 vs. 14.2 months) (Table 42).The “long-term” sub-study included only those patients for which follow-up data was available past 24 months post-surgery (mean follow-up 55.0 ± 12.2 months, range 27.0-76.5 months); while these patients could not overlap with those in the “matching” sub-study, it was not clear whether they could overlap with those in the “atypical” sub-study. In this sub-study, C-ADR patients were significantly younger than those who received ACDF (mean age 44.3 vs. 50.6 years, p<0.01).

WA – Health Technology Assessment December 19, 2016
Artificial disc replacement – Re-review: Final evidence report Page - 161
Table 42. Non-randomized Study Characteristics C-ADR vs. ACDF Study N C-ADR
Device (n)
ACDF Graft (n)
F/U (%) Age (mean ± SD)
Male (%) Prior Surgery (%)
Worker’s Comp (%)
Country/ Funding
Risk of Bias
Prospective cohort studies Kim 2009* 65* Bryan
(n=39) Autograft† (n=26)
Mean 18 (12-40) mos. (% NR)
43.6 (24-74) vs. 47.4 (33-74)
51.3% vs. unclear‡
NR NR South Korea/NR
Moderately High
Retrospective cohort studies Hou 2014*‡‡ 225 Discover
(n=117) Autograft (n=108)
24 mos. (89.3%)
45.6 (31-70) vs. 44.1 (30-74)
56.4% vs. 55.6%
0%§ NR China/None Moderately High
Registry studies Staub 2016 (matching sub-study)
380 NR (n=190)
NR (n=190)
16.8 ± 8 mos. (% NR)
44.4 ± 7.5 vs. 44.2 ±7.7
46.3% vs. 44.7%
0%§ NR Switzerland**/NR
Moderately High
Staub 2016 (atypical patients sub-study)
248 NR (n=27)
NR (n=221)
17.5 ± 7.5 vs. 14.2 ± 8.0 (% NR) p=0.04
53.8 ± 12.8 vs. 61.1 ± 11.5 (p<0.01)††
66.7% vs. 51.6%
0%§ NR Switzerland**/NR
Moderately High
Staub 2016 (long-term f/u sub-study)
149 NR (n=55)
NR (n=95)
55.0 ± 12.2 mos. (% NR)
44.3 ± 8.7 vs. 50.6 ± 10.9 (p<0.01)
49.1% vs. 43.6%
0%§ NR Switzerland**/NR
Moderately High
F/U: follow-up; N: number of patients enrolled in the study * Data for 1-level population only; those who underwent 2-level surgery are discussed in the next section. † Autograft details not reported. ‡ The study reported that there were 17 males and 19 females in the ACDF group, however there were only 26 patients in this group. § As per the trial’s inclusion/exclusion criteria. ** The study used an international spine registry. †† There were significantly fewer C-ADR than ACDF patients aged ≥60 years (40.7% vs. 65.6%, p=0.01). ‡‡ Although the authors stated the study was conducted prospectively, a number of methodological factors suggested that it was likely to be conducted retrospectively: no information regarding obtaining informed consent, only provide mean follow-up (as opposed to prestated follow-up times), and give no indication of patient flow/loss to follow-up.

WA – Health Technology Assessment December 19, 2016
Artificial disc replacement – Re-review: Final evidence report Page - 162
Effectiveness Results Data for all effectiveness results are summarized briefly below and are available in table format in Appendix Tables J21 and J22. Function Both cohort studies reported no difference between groups in mean NDI scores at final follow-up (Appendix Table J21).74,87 Pain No differences were found between groups in mean VAS scores at final follow-up in either cohort study (Appendix Table J21).74,87 The matching sub-study, which was designed to mimic a RCT population, found that significantly more patients treated with C-ADR than ACDF achieved clinically meaningful improvement (≥2-point improvement in pain scores measured on a 0-10 scale) in arm pain at a mean of 17 months follow-up (78.4% vs. 67.4%, p=0.02); the mean change scores suggest a similar trend, although the difference was not significant (-4.0 vs. -3.3, p=0.06). In contrast, the matching sub-study reported no differences between groups in neck pain (% responders or change scores). The other two registry sub-studies found no difference between groups in the percentage of patients who achieved clinically meaningful improvement in neck or arm pain scores (Appendix Table J22) – or in the mean change scores (see Appendix Table J21 for data).157 Global Distress The registry matching sub-study reported significantly more improvement in Core Outcome Measures Index (COMI) scores with C-ADR than with ACDF at a mean of 17 months follow-up, although it is unclear whether the difference would be clinically meaningful (-4.7 vs. -3.7, p<0.01). In contrast, there was no difference between groups at final follow-up for the atypical patient sub-study (Appendix Table J21).157 The long-term sub-study reported greater improvement in C-ADR patients compared with ACDF patients at 24 months (change scores: -5.2 vs. -3.7, p<0.01); by 60 months, the trend was similar but the difference was no longer statistically significant (change scores: -4.8 vs. -3.8, p=0.08) (Appendix Table J21).157 Other outcomes No other effectiveness outcomes of interest were reported.
4.1.3.2 C-ADR vs. Fusion: 2-level Studies included Two RCTs were identified that compared C-ADR with ACDF at two contiguous levels in patients with radiculopathy and/or myelopathy attributed to two-level cervical degenerative disc disease.30,38 One of the trials was conducted as an IDE (investigational device exemption) trial for the US FDA.175 In addition, two non-randomized comparative studies74,87 were identified that compared two-level C-ADR to ACDF. RCT characteristics Treatments: Both trials randomized patients to receive C-ADR or ACDF at two contiguous levels between C3-C4 and C6-C7. The IDE trial used the Mobi-C disc in C-ADR patients (n=232) and corticocancellous allograft with a plating system in ACDF patients (n=115)38; Cheng et al. used the Bryan disc in C-ADR

WA – Health Technology Assessment December 19, 2016
Artificial disc replacement – Re-review: Final evidence report Page - 163
patients (n=31) and iliac crest autograft plus a plating system in ACDF patients (n=34) (Table 43);30 see Appendix Table H3 for details). Inclusion criteria and patient characteristics: Both trials included adults with radiculopathy and/or myelopathy attributed to two-level cervical degenerative disc disease.30,38 In addition, patients were required to have failed at least six weeks (Mobi-C) or 12 weeks (Cheng 2009) of conservative treatment; alternatively, patients who had not received the minimum duration of nonsurgical treatment but who demonstrated worsening symptoms or had signs indicative of nerve root or spinal cord compression were considered eligible for inclusion by the Mobi-C trial. The Mobi-C trial also required patients be less than 70 years of age, have a baseline NDI score of at least 30, and a diagnosis confirmed by imaging. Complete inclusion and exclusion criteria are provided in Appendix Table H3. Patient demographics are detailed in Table 44. By far, the levels between C5 and C7 were most commonly treated, followed by those between C4 and C6 and then those between C3 and C5 (in decreasing order of frequency). Male patients comprised approximately half the study population (range, 42-51%) and mean patient age was 46. The Mobi-C trial indicated a mean BMI of 28 kg/m2; 94% of patients in this trial were Caucasian. There were no differences between groups in tobacco use at baseline. The majority of baseline characteristics were equally distributed between C-ADR and ACDF treatment groups; although there were slightly more males in the C-ADR versus ACDF group (50.2% vs. 42.9%) in the Mobi-C trial, the difference did not reach statistical significance (p=0.24).

WA – Health Technology Assessment December 19, 2016
Artificial disc replacement – Re-review: Final evidence report Page - 164
Table 43. RCT Study Characteristics (n randomized/treated) Follow-up (%)* RCT N C-ADR Device ACDF Graft 24 mos. 48-60 mos. 84 mos. Country Funding Risk of Bias Mobi-C (2-level) IDE trial
347 Mobi-C (n=232/225) Allograft (n=115/105) 92.2% 85.6% - US Industry§ Moderately Low
Cheng 2009† 65 BRYAN (n=31/31) Autograft (ICBG) (n=34/34)
95.4% - - China NR Moderately High
ICBG: iliac crest bone graft; N: number of patients randomized to the study * % follow-up was calculated using the number of patients randomized (or treated if the number randomized was not reported), and was generally based on the number of
patients with data available for the primary outcome (see Appendix Table E5 for information on exceptions to this rule) † There is likely to be patient overlap between Cheng 2009 (2-level) and Cheng 2011 (mixed number of levels) based on the dates of patient enrollment given in the studies. Table 44. RCT Patient Demographics
RCT Group Levels treated: C3-4,C4-5/C4-5, C5-6/ C5-6, C6-7 (%)
Male (%)
Age (mean ± SD)
BMI (kg/m2) (mean)
Caucasian (%)
Current tobacco use (%)
Working (%)
Worker’s Comp (%)
Involved in spinal litigation (%)
Prior surgery at index level (%)
Mobi-C (2-level) IDE trial
C-ADR 0.4%/26.7%/72.9% 50.2%‡ 45.3 ± 8.1 27.6 94.2% NR§ 62.7%** 4.9% 0%†† 0%†† ACDF 1.9%/21.9%/76.2% 42.9%‡ 46.2 ± 7.9 28.1 94.3% NR§ 61.0%** 6.7% 0%†† 0%††
Cheng 2009† C-ADR NR‡‡ 51.6% 45 NR NR 19.7% NR NR NR NR ACDF NR‡‡ 50.0% 47 NR NR 20.6% NR NR NR NR
N/n: number of patients randomized to the study/group; NR: not reported * Data were not stratified by treatment group. † There is likely to be patient overlap between Cheng 2009 (2-level) and Cheng 2011 (mixed number of levels) based on the dates of patient enrollment given in the studies. ‡ Study reported p=0.24 between groups. § Current tobacco use was only reported in terms of the percentage of patients that smoke ≥1 pack per day (0% vs. 0%). ** Defined as able to work. †† As per the trial’s inclusion/exclusion criteria (some details of which were only available in the FDA SSED report). ‡‡ Two adjacent levels between C3-4 and C6-7 were treated; no other details were provided.

WA – Health Technology Assessment December 19, 2016
Artificial disc replacement – Re-review: Final evidence report Page - 165
Efficacy Results All analyses are based on completers only (i.e., those with data available) unless otherwise indicated. The primary outcomes of interest (overall clinical success, NDI success, neurological success, and pain success) were evaluated using both intention to treat (ITT) analysis and completer analysis. Overall Clinical Success The composite outcome of overall success incorporated all of following requirements:
• NDI improvement of at least 15 points (out of 50) from baseline • Maintenance or improvement in all components of neurological status • No subsequent surgical intervention at the index level or levels; • No potentially (possibly or probably) device-related adverse event; • No Mobi-C intraoperative changes in treatment.
24 months: Results from one moderately low risk of bias trial (Mobi-C trial) suggested that C-ADR was superior to ACDF in terms of overall success at 24 months based on both ITT (RD 26.0% (95% CI 15.2%, 36.8%)) and completer (RD 23.2% (95% CI 11.6%, 34.8%)) analyses (Table 45).132 In order to determine whether missing data had an impact on conclusions, sensitivity analysis was performed using a -10% non-inferiority margin. Results of this analysis support superiority of C-ADR over ACDF in all scenarios (Figure 36a). 60 months: The same trial also found superiority of C-ADR over ACDF in terms of overall success at 60 months based on both ITT (RD 28.2% (95% CI 18.0%, 38.4%)) and completer (RD 29.6% (95% CI 18.1%, 41.2%)) analyses (Table 45).132 Sensitivity analysis supported the conclusion that C-ADR was superior to ACDF in all scenarios except in the extreme favoring ACDF (in which all missing C-ADR patients were considered failures and all missing ACDF patients were considered successes); in this latter case, non-inferiority is inconclusive using the -10% margin (Figure 36b). Altering the NDI requirement and adding a radiographic success requirement did not change these conclusions (Appendix Table J23).38,39 Table 45. C-ADR vs. ACDF (2-level): Overall Success
Risk of bias Study Analysis F/U ADR % (n/N)
ACDF % (n/N)
RD (95% CI)* p-value*
Overall success: 1) NDI improvement of at least 15 points (out of 50) from baseline; 2) maintenance or improvement in all components of neurological status; 3) no subsequent surgical intervention at the index level or levels; 4) no potentially (possibly or probably) device-related adverse event; and 5) no Mobi-C intraoperative changes in treatment. Moderately Low RoB
Mobi-C trial (2-level) (Radcliff 2016)
ITT 24 mos.
62.5% (145/232)
36.5% (42/115)
26.0% (15.2%, 36.8%) <0.01
Completer 24 mos.
65.6% (145/221)
42.4% (42/99)
23.2% (11.6%, 34.8%) <0.01
ITT 60 mos.
53.4% (124/232)
25.2% (29/115)
28.2% (18.0%, 38.4%) <0.01
Completer 60 mos.
60.8% (124/204)
31.2% (29/93)
29.6% (18.1%, 41.2%) <0.01
RoB: risk of bias * Calculated by SRI

WA – Health Technology Assessment December 19, 2016
Artificial disc replacement – Re-review: Final evidence report Page - 166
NDI Success 24 & 48 months: One trial (Mobi-C trial) found NDI success was achieved by significantly more C-ADR than ACDF patients at both 24 and 48 months according to both ITT and completer analyses (Table 46).38,39 Table 46. C-ADR vs. ACDF (2-level): NDI success
Risk of bias Study Analysis F/U ADR % (n/N)
ACDF % (n/N)
RD (95% CI)* p-value*
NDI success: postoperative ≥30-point improvement on the NDI if the baseline score was ≥60, or ≥50% improvement if the baseline score was <60 Moderately Low RoB
Mobi-C trial (2-level) (Davis 2013)†
ITT 24 mos.
74.6% (173/232)
53.0% (61/115)
21.5% (10.8%, 32.2%) <0.01
Completer 24 mos.
78.2% (173/221)
61.8% (61/99)
16.7% (5.7%, 27.7%) <0.01
Mobi-C trial (2-level) (Davis 2015)†
ITT 48 mos.
68.5% (159/232)
39.1% (45/115)
29.4% (18.7%, 40.1%) <0.01
Completer 48 mos.
79.3% (159/200)
53.4% (45/85)
26.6% (14.6%, 38.6%) <0.01
RoB: risk of bias * Calculated by SRI † Numerators were back-calculated using the percentage reported. NDI Scores 24 months: Two trials (Mobi-C (2-level) trial, Cheng 2009) found that mean NDI scores were significantly better at 24 months in the C-ADR group compared with the ACDF group (Table 47).30,132 Because the Cheng trial did not report standard deviations, data were not pooled across studies. 60 months: One trial (Mobi-C (2-level)) reported significantly better 60-month NDI scores with C-ADR versus ACDF (Table 47).132 Table 47. C-ADR vs. ACDF (2-level): NDI scores Completer analysis
Risk of bias Study F/U C-ADR Mean ± SD†
ACDF Mean ± SD†
MD (95% CI)* p-value*
NDI (0-100) higher score = greater disability‡ Moderately Low RoB
Mobi-C trial (2-levels) (Radcliff 2016)
24 mos.
16.5 ± 16.9 (n=208)
24.0 ± 19.3 (n=83)
-7.5 (-12.0, -3.0) <0.01
Moderately High RoB
Cheng 2009† 24 mos.
11 (n=30)
19 (n=32)
-8 (NC) 0.02†
Moderately Low RoB
Mobi-C trial (2-levels) (Radcliff 2016)
60 mos.
16.8 ± 17.4 (n=186)
26.4 ± 20.4 (n=72)
-9.6 (-14.6, -4.6) <0.01
RoB: risk of bias * Calculated by SRI. † Reported by the study ‡ NDI scale not clearly reported; the raw score (0-50) should be converted to a final score (0-100), and we assumed this was
done (because the baseline scores were commonly >50).
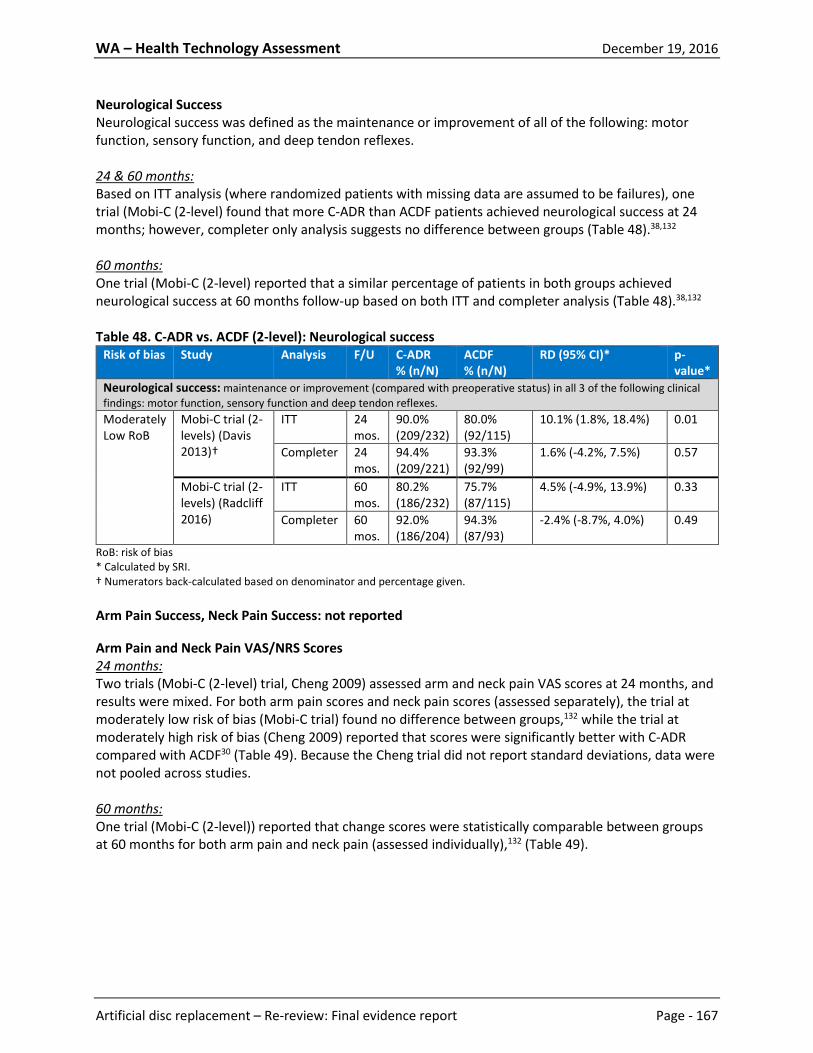
WA – Health Technology Assessment December 19, 2016
Artificial disc replacement – Re-review: Final evidence report Page - 167
Neurological Success Neurological success was defined as the maintenance or improvement of all of the following: motor function, sensory function, and deep tendon reflexes. 24 & 60 months: Based on ITT analysis (where randomized patients with missing data are assumed to be failures), one trial (Mobi-C (2-level) found that more C-ADR than ACDF patients achieved neurological success at 24 months; however, completer only analysis suggests no difference between groups (Table 48).38,132 60 months: One trial (Mobi-C (2-level) reported that a similar percentage of patients in both groups achieved neurological success at 60 months follow-up based on both ITT and completer analysis (Table 48).38,132 Table 48. C-ADR vs. ACDF (2-level): Neurological success
Risk of bias Study Analysis F/U C-ADR % (n/N)
ACDF % (n/N)
RD (95% CI)* p-value*
Neurological success: maintenance or improvement (compared with preoperative status) in all 3 of the following clinical findings: motor function, sensory function and deep tendon reflexes. Moderately Low RoB
Mobi-C trial (2-levels) (Davis 2013)†
ITT 24 mos.
90.0% (209/232)
80.0% (92/115)
10.1% (1.8%, 18.4%) 0.01
Completer 24 mos.
94.4% (209/221)
93.3% (92/99)
1.6% (-4.2%, 7.5%) 0.57
Mobi-C trial (2-levels) (Radcliff 2016)
ITT 60 mos.
80.2% (186/232)
75.7% (87/115)
4.5% (-4.9%, 13.9%) 0.33
Completer 60 mos.
92.0% (186/204)
94.3% (87/93)
-2.4% (-8.7%, 4.0%) 0.49
RoB: risk of bias * Calculated by SRI. † Numerators back-calculated based on denominator and percentage given. Arm Pain Success, Neck Pain Success: not reported Arm Pain and Neck Pain VAS/NRS Scores 24 months: Two trials (Mobi-C (2-level) trial, Cheng 2009) assessed arm and neck pain VAS scores at 24 months, and results were mixed. For both arm pain scores and neck pain scores (assessed separately), the trial at moderately low risk of bias (Mobi-C trial) found no difference between groups,132 while the trial at moderately high risk of bias (Cheng 2009) reported that scores were significantly better with C-ADR compared with ACDF30 (Table 49). Because the Cheng trial did not report standard deviations, data were not pooled across studies. 60 months: One trial (Mobi-C (2-level)) reported that change scores were statistically comparable between groups at 60 months for both arm pain and neck pain (assessed individually),132 (Table 49).

WA – Health Technology Assessment December 19, 2016
Artificial disc replacement – Re-review: Final evidence report Page - 168
Table 49. C-ADR vs. ACDF (2-level): Arm pain VAS scores Completer analysis
Risk of bias Study F/U C-ADR Mean ± SD
ACDF Mean ± SD
MD (95% CI)* p-value*
Arm pain VAS (0-100) higher score = greater pain Moderately Low RoB
Mobi-C trial (2-levels)‡ (Radcliff 2016)
24 mos.
11.9 ± 19.5 (n=208)
16.2 ± 21.9 (n=83)
-4.3 (-9.5, 0.9) 0.10
Moderately High RoB
Cheng 2009† 24 mos.
14 (n=30)
27 (n=32)
-13 (NC) 0.01§
Moderately Low RoB
Mobi-C trial (2-levels)‡ (Davis 2015)
48 mos.
∆ score: -56 ± 31 (n=186)
∆ score: -53 ± 31 (n=69)
-3.0 (-11.6, 5.6) 0.49
Moderately Low RoB
Mobi-C trial (2-levels)‡,** (Radcliff 2016)
60 mos.
∆ score: -56.8 (n=186)
∆ score: -50.5 (n=72)
-6.3 (NC) 0.15§
Neck pain VAS (0-100) higher score = greater pain Moderately Low RoB
Mobi-C trial (2-levels) (Radcliff 2016)
24 mos.
16.6 ± 24.2 (n=208)
20.5 ± 24.0 (n=83)
-3.9 (-10.1, 2.3) 0.21
Moderately High RoB
Cheng 2009† 24 mos.
15 (n=30)
26 (n=32)
-11 (NC) 0.01§
Moderately Low RoB
Mobi-C trial (2-levels) (Davis 2015)
48 mos.
∆ score: -53 ± 30 (n=186)
∆ score: -48 ± 29 (n=69)
-5.0 (-13.3, 3.3) 0.23
Moderately Low RoB
Mobi-C trial (2-levels)†† (Radcliff 2016)
60 mos.
∆ score: -52.5 (n=186)
∆ score: -45.8 (n=72)
-6.7 (NC) 0.07§
*Calculated by SRI † Score was reported on 0-10 scale; SRI converted the score to a 0-100 scale ‡For the Mobi-C trial, the arm with the worst pain at baseline was followed up at each subsequent time-point. §As reported by the study ** Study reported follow-up scores (ADR: 11.9 ± 21.2; ACDF: 22.2 ± 27.4) but reported that the difference between groups in change scores was not statistically significant (p=0.15). SRI reported change scores here, as it was the more conservative estimate. †† Study reported follow-up scores (ADR: 18.7 ± 26.1; ACDF: 28.5 ± 28.8) but reported that the difference between groups in change scores was not statistically significant (p=0.15). SRI reported change scores here, as it was the more conservative estimate. SF-36 Success: not reported SF-36 PCS Scores 24 months: Two trials (Mobi-C (2-level) trial, Cheng 2009) reported slightly better 24-month SF-36 PCS scores in the C-ADR group compared with the ACDF group (Table 50).30,132 60 months: SF-36 PCS scores were significantly better at 60 months with C-ADR versus ACDF, however the clinical significance of the result is unclear (Table 50).30

WA – Health Technology Assessment December 19, 2016
Artificial disc replacement – Re-review: Final evidence report Page - 169
Table 50. C-ADR vs. ACDF (2-level): SF-36 PCS scores Completer analysis
Study F/U C-ADR Mean ± SD
ACDF Mean ± SD
MD (95% CI)* p-value*
SF-36 PCS (0-100) higher score = less disability Mobi-C trial (2-levels) (Radcliff 2016)†
24 mos. 46.9 ± 10.7 (n=208)
43.4 ± 12.6 (n=83)
3.5 (0.6, 6.4) 0.02
Cheng 2009 24 mos. 50 (n=30)
45 (n=32)
5 (NC) 0.01‡
Mobi-C trial (2-levels) (Radcliff 2016)†
60 mos. 46.8 ± 11.3 (n=186)
42.2 ± 12.3 (n=72)
4.6 (1.4, 7.8) <0.01
* Calculated by SRI. † Reported the SF-12 PCS. ‡ As reported by the study. Patient Satisfaction 24 months: One RCT (Mobi-C trial, N=320) reported that while there was no difference between C-ADR and ACDF groups in terms of being very or somewhat satisfied (95.8% vs. 92.0%), significantly more C-ADR patients than ACDF patients said they would definitely or probably recommend the surgery to a friend (95.8% vs. 88.5% (RD 7.0% (95% CI 0.3%, 13.8%)) (Appendix Table J30).38 60 months: Patients in the C-ADR group of the Mobi-C trial were more likely to be very or somewhat satisfied compared with patients in the ACDF group at 60 months (96.4% vs. 89.5% (RD 7.4% (95% CI -0.4%, 15.1%), p=0.02). C-ADR patients were also more likely to say they would definitely or probably recommend the surgery to a friend than were ACDF patients (94.8% vs. 84.2% (95% CI 1.0%, 18.8%)) (Appendix Table J30).132 Other Outcomes Odom’s Criteria: One moderately high risk of bias trial (Cheng 2009, N=62) reported that a similar percentage of C-ADR and ACDF patients received Odom’s criteria ratings of “excellent” or “good” at 24 months (97% vs. 84%, RD 12% (95% CI -2%, 26%)) (Appendix Table J31).30 Return to Work: At 48 months, one trial (Mobi-C, N=277) reported that patients who were working returned to work somewhat sooner in the C-ADR group compared with the ACDF group, although the difference did not reach statistical significance (MD -21 days (95% CI -48, 6)) (Appendix Table J32).39 Non-randomized comparative studies Two non-randomized comparative studies74,87 were identified that compared two-level C-ADR to ACDF; study characteristics and patient demographics are summarized below and in Table 51. One prospective and one retrospective cohort study74,87 both compared C-ADR to ACDF at 1- or 2-levels – data were stratified and results for only the 2-level cohorts are presented here. In the study by Kim et al., patients had either radiculopathy (85%) or myelopathy (15%); mean follow-up was three months shorter in C-ADR patients compared with ACDF patients (see Table 51). Hou et al. also included patients with radiculopathy (44%), myelopathy (25%), or both (31%); patients were followed for 24 months. Due to methodological limitations, both studies were considered to be at moderately high risk of bias (see Appendix Table E6 for details).

WA – Health Technology Assessment December 19, 2016
Artificial disc replacement – Re-review: Final evidence report Page - 170
Table 51. Non-randomized Study Characteristics C-ADR vs. ACDF Study N C-ADR
Device (n)
ACDF Graft (n)
F/U (%) Age (mean ± SD)
Male (%) Prior Surgery (%)
Worker’s Comp (%)
Country/ Funding Risk of Bias
Prospective cohort studies Hou 2014* 120 Discover
(n=32) Autograft (n=88)
24 mos. (92.5%)
46.3 (30-69) vs. 51.2 (29-77)
62.5% vs. 43.2%**
0%§ NR China/None Moderately High
Retrospective cohort studies Kim 2009*†† 40* Bryan
(n=12) Autograft† (n=28)
Mean 18 (13-37) mos. vs. mean 21 (14-38) mos. (% NR)
46.9 (30-58) vs. 52.7 (30-78)
66.7% vs. 60.7%
NR NR South Korea/NR Moderately High
F/U: follow-up; N: number of patients enrolled in the study * Data for 2-level population only; those who underwent 1-level surgery are discussed in the prior section. † Autograft details not reported. ‡ The study reported that there were 17 males and 19 females in the ACDF group, however there were only 26 patients in this group. § As per the trial’s inclusion/exclusion criteria. ** p=0.062 †† Although the authors stated the study was conducted prospectively, a number of methodological factors suggested that it was likely to be conducted retrospectively: no information regarding obtaining informed consent, only provide mean follow-up (as opposed to prestated follow-up times), and give no indication of patient flow/loss to follow-up.

WA – Health Technology Assessment December 19, 2016
Artificial disc replacement – Re-review: Final evidence report Page - 171
Effectiveness Results Data for all effectiveness results are summarized briefly below and are available in table format in Appendix Table J33. Function Both cohort studies reported no difference between groups in mean NDI scores at final follow-up (Appendix Table J33).74,87 Pain No differences were found between groups in mean VAS scores at final follow-up in either cohort study (Appendix Table J33).74,87 Other outcomes No other effectiveness outcomes of interest were reported.
4.1.3.3 C-ADR vs. Fusion: Mixed levels (1-, 2-, or 3-level) Studies included Two trials were identified that compared C-ADR with ACDF at one, two, or three levels29,151; these trials did not stratify results based on the number of levels treated. (A third trial (Rohl 2009) was identified that was conducted in paraplegics with degenerative disc disease and radiculopathy; this trial is discussed as part of Key Question 3 due to its unique population.) In addition, three non-randomized comparative studies24,60,122 were included. RCT characteristics Treatments: Both trials randomized patients to receive either C-ADR or ACDF; one trial used the Discover disc, and the other used the Bryan disc. Both trials used iliac crest autograft for ACDF (Table 52; see Appendix Table H5 for details).29,151 Inclusion criteria and patient characteristics: The two trials had different inclusion criteria. Skeppholm et al. enrolled patients aged 25 to 60 with radiculopathy; patients were required to have ongoing pain for at least three months, symptoms needed to correlate to one or two cervical levels, and diagnostic imaging was required.151 Cheng et al. enrolled patients with myelopathy at one, two, or three levels that had not responded to 12 weeks of nonsurgical treatment; alternatively, patients who had not received the full course of nonsurgical treatment but who had had evidence of severe disease were also eligible.29 Complete inclusion and exclusion criteria are provided in Appendix Table H5. Patient demographics are available in Table 53. The majority of patients in both trials had surgery at one level. Male patients comprised about half the study population and mean patient age was 47. In the trial that reported it, mean body mass index (BMI) was from 26 kg/m2.151 One trial reported that less than a fifth of patients were tobacco users at baseline.29 Risk of bias: Neither trial met all the criteria needed to be considered at low risk of bias; both were considered to be at moderately high risk of bias, as they did not meet three or more criteria of a good quality RCT (unclear allocation concealment,29 failure to perform intention to treat analysis,151 lack of blinded outcome assessment,29,151 and failure to control for (or provide sufficient information to assess) baseline differences between groups).29,151 The risk of bias evaluation table and reasons for not giving credit can be found in Appendix Table E5.

WA – Health Technology Assessment December 19, 2016
Artificial disc replacement – Re-review: Final evidence report Page - 172
Table 52. RCT Study Characteristics (n randomized/treated) Follow-up (%)* RCT N C-ADR Device ACDF Graft 24 mos. 48-60 mos. 84 mos. Country Funding Risk of Bias Skeppholm 2015 153 Discover (n=83/81) Autograft (ICBG)
(n=70/70) 89.5% - - Sweden Industry Moderately High
Cheng 2011† 83 Bryan (n=41/41) Autograft (ICBG)
(n=42/42) 98% - - China NR Moderately High
ICBG: iliac crest bone graft; N: number of patients randomized to the study * % follow-up was calculated using the number of patients randomized (or treated if the number randomized was not reported), and was generally based on the number of patients with data available for the primary outcome (see Appendix Table E5 for information on exceptions to this rule) † There is likely to be patient overlap between Cheng 2009 (2-level) and Cheng 2011 (mixed number of levels) based on the dates of patient enrollment given in the studies.
Table 53. RCT Patient Demographics
RCT Group Number of levels treated: 1-level/2-level/3-level (%)
Male (%)
Age (mean ± SD)
BMI (kg/m2) (mean)
Caucasian (%)
Current tobacco use (%)
Working (%)
Worker’s Comp (%)
Involved in spinal litigation (%)
Prior surgery at index level (%)
Skeppholm 2015
C-ADR 72%/28%/0% 49.4% 46.7 ± 6.7 26 NR NR NR NR NR 0%‡ ACDF 71%/29%/0% 47.1% 47.0 ± 6.9 26 NR NR NR NR NR 0%‡
Cheng 2011†
C-ADR 59%/34%/7% 51% 47.2 ± 5.7 NR NR 15% NR NR NR NR ACDF 50%/40%/10% 55% 47.7 ± 5.8 NR NR 18% NR NR NR NR
N/n: number of patients randomized to the study/group; NR: not reported * Data were not stratified by treatment group. † There is likely to be patient overlap between Cheng 2009 (2-level) and Cheng 2011 (mixed number of levels) based on the dates of patient enrollment given in the studies. ‡ As per the trial’s inclusion/exclusion criteria.

WA – Health Technology Assessment December 19, 2016
Artificial disc replacement – Re-review: Final evidence report Page - 173
Efficacy Results All analyses are based on completers only (i.e., those with data available) unless otherwise indicated. Overall Clinical Success, NDI Success, Neurological Success, Arm Pain Success, Neck Pain Success, SF-36 Success, Patient Satisfaction Not reported NDI Scores 24 & 36 months: One trial of patients with radiculopathy (Skeppholm) found that 24-month NDI scores were statistically similar between groups (Table 54).151 Another trial of myelopathy patients indicated that both 24- and 36-month NDI scores were statistically better with C-ADR than ACDF (Table 54),29 although the differences between groups were small and not likely to be clinically meaningful. Table 54. C-ADR vs. ACDF (Mixed levels): NDI scores Completer Analysis
Risk of bias Study F/U C-ADR Mean ± SD†
ACDF Mean ± SD†
MD (95% CI)* p-value*
NDI (0-100) higher score = greater disability† Moderately High RoB
Skeppholm 2015 (radiculopathy)
24 mos.
39.1 ± 20.2 (n=76)
40.1 ± 18.5 (n=67)
-1.0 (-7.4, 5.4) 0.76
Cheng 2011§ (myelopathy)
24 mos.
13 (n=41) 16 (n=40) -3 (NC) <0.01‡
Cheng 2011§ (myelopathy)
36 mos.
12 (n=41) 17 (n=40) -5 (NC) <0.01‡
* Calculated by SRI. † NDI scale not clearly reported by the majority of studies; the raw score (0-50) should be converted to a final score (0-100),
and we assumed this was done (because the baseline scores were commonly >50) except for Qizhi, which reported mean baseline NDI scores of 13.
‡ Reported by the study § Data estimated from graph Arm and Neck Pain VAS Scores 24 months: One moderately high risk of bias trial (Skeppholm 2015) reported that arm pain and neck pain VAS scores were statistically similar between groups at 24 months (Table 55).151

WA – Health Technology Assessment December 19, 2016
Artificial disc replacement – Re-review: Final evidence report Page - 174
Table 55. C-ADR vs. ACDF (Mixed levels): Arm and neck pain VAS scores Completer Analysis
Risk of bias Study F/U C-ADR Mean ± SD
ACDF Mean ± SD
MD (95% CI)* p-value*
Arm pain VAS (0-100) higher score = greater pain Moderately High RoB
Skeppholm 2015 24 mos.
20.7 ± 23.1 (n=76)
20.3 ± 25.7 (n=67)
0.4 (-7.7, 8.5) 0.40
Neck pain VAS (0-100) higher score = greater pain Moderately High RoB
Skeppholm 2015 24 mos.
27.4 ± 27.3 (n=76)
28.6 ± 24.8 (n=67)
-1.2 (-9.9, 7.5) 0.78
* Calculated by SRI. Quality of Life Scores 24 & 36 months: While one moderately high risk of bias trial of myelopathy patients (Cheng 2011) indicated slightly (but significantly) better SF-36 PCS scores with C-ADR versus ACDF at both 24 and 36 months,29 another moderately high risk of bias trial of radiculopathy patients (Skeppholm 2015) reported similar EQ-12 scores in both groups at 24 months,151 (Table 56). Table 56. C-ADR vs. ACDF (Mixed levels): Quality of Life Scores Completer analysis
Study F/U C-ADR Mean ± SD
ACDF Mean ± SD
MD (95% CI)* p-value*
SF-36 PCS (0-100) higher score = less disability Cheng 2011† 24 mos. 50 (n=41) 45.5 (n=40) 4.5 (NC) <0.05‡ Cheng 2011† 36 mos. 50.5 (n=41) 44.5 (n=40) 6 (NC) <0.05‡ EQ-12 (-0.109 - 1) higher score = less disability Skeppholm 2015 24 mos. 0.70 ± 0.30
(n=76) 0.71 ± 0.26 (n=67)
-0.01 (-0.10, 0.08) 0.83
ACDF: anterior cervical discectomy and fusion; ADR: artificial disc replacement; Adj: adjusted; CI: confidence interval; F/U: follow-up; MD: mean difference; NDI: Neck Disability Index; NR: not reported; NS: not significant; SD standard deviation. * Calculated by SRI. † Data estimated from graph ‡ As reported by the study Other Outcomes Odom’s Criteria: Results from one small trial (Cheng 2011, N=81) suggested no difference between groups in the percentage of patients who received Odom’s criteria ratings of “excellent” or “good” at 36 months (93% vs. 83%, RD 10% (95% CI -4%, 24%)) (Appendix Table J38).29 Return to Work: Cheng et al. 2011 indicated that C-ADR patients returned to work in significantly fewer days compared with ACDF patients (median 20 vs. 84 days, p<0.01) (Appendix Table J39).29 JOA Scores: C-ADR patients had slightly better mean JOA scores than ACDF patients at 24 and 36 months (p=0.02 for both) (Appendix Table J40).29

WA – Health Technology Assessment December 19, 2016
Artificial disc replacement – Re-review: Final evidence report Page - 175
Non-randomized comparative studies Three non-randomized comparative studies24,60,122 met the inclusion criteria (one additional study115 was included that reported on safety only- see Key Question 2 results for details); study characteristics and patient demographics are summarized below and in Table 57. Due to methodological limitations, all three studies were considered to be at moderately high risk of bias (see Appendix Tables E6 and E7 for details). Cappelletto et al. conducted a retrospective study in which patients with disc herniation or spondylosis who had myelopathy or cervico-brachial pain underwent C-ADR or ACDF.24 There were a number of statistically significant differences between C-ADR and ACDF groups that were not controlled for: C-ADR patients were more likely to be treated at a single level 95% vs. 77%), younger (mean age 42 vs. 51 years), and working (100% vs. 80%); they were also less likely to have myelopathy (12% vs. 42%) and more likely to have radiculopathy (88% vs. 92%). Peng et al. compared outcomes following C-ADR to those following ACDF in patients with radiculopathy and arm pain; while C-ADR data were collected prospectively, ACDF data were collected retrospectively, although all procedures were performed during the same time period.122 There were differences between C-ADR and ACDF groups that were not controlled for: C-ADR patients were more likely to be treated at a single level 63% vs. 39%) and for disc herniation (50% vs. 21%), and be younger (mean age 44 vs. 55 years); they were also less likely to be treated at two levels (28% vs. 48%) and for spondylosis (45% vs. 71%). One registry study (Grob 2010) was also identified; patients degenerative disc disease at up to three levels were identified from the Spine Tango international registry who were treated at a single institution with C-ADR or ACDF between 2005 and 2008.60 Not all of the 342 patients who met the inclusion criteria had reached 12 month (284/342) or 24 month (178/342) follow-up; thus the complete follow-up rate was quite low (12 months: 77.8% (266/342); 24 months: 49.4% (169/342)). There were differences between C-ADR and ACDF at baseline, such that C-ADR patients were younger (mean age 45.8 vs. 56.1), more likely to have 1-level than 2- or 3-level disease (1-level disease: 68.5% vs. 46.5%; 2-3-level disease: 32.5% vs. 53.5%), fewer comorbidities (ASA 1: 68.1% vs. 29.2%; ASA 2: 30% vs. 58.7%), and only a single pathology (69.5% vs. 45.7%); however, the study performed multivariate analysis to control for the impact of these confounding variables on COMI scores at 12- and 24-months.

WA – Health Technology Assessment December 19, 2016
Artificial disc replacement – Re-review: Final evidence report Page - 176
Table 57. Non-randomized Study Characteristics C-ADR vs. ACDF Study N C-ADR
Device (n)
ACDF Graft (n)
Number of levels treated: 1-level/2-level/3-level (%)
F/U (%) Age (mean ± SD)
Male (%)
Prior Surgery (%)
Worker’s Comp (%)
Country/ Funding
Risk of Bias
Retrospective cohort studies Cappelletto 2013
176 Discover (63%) or Bryan (37%) (n=84)
Xenograft* (70%) or tricalcium phosphate (30%) (n=92)
95%†/5%† vs. 77%†/22%†/1%
12 mos. (% NR)
42 (25-60) vs. 51 (26-79)†
50% vs. 55.4%
NR NR Italy/NR Moderately High
Peng 2011 115 Prestige (n=40)‡
NR (n=75)‡
62.5%†/27.5%†/10% vs. 38.7%†/48%†/13.3%
Mean 34.8 (24-42) mos. (% NR)
43.9 (16-59) vs. 54.9 (28-77)
47.5% vs. 61.4%
NR NR Singapore/None Moderately High
Registry studies Grob 2010 342 Prestige
(86%), Discover (22%), Bryan (5%), or Prodisc-C (3%) (n=73)
Autograft (91%), allograft (1%), both (1%), or other (7%) (n=269)
1/ 2-3 levels**: 68.5%†/32.5%† vs. 46.5%†/53.5%†
12 mos.: 79.5% vs. 77.3†† 24 mos.: 41.1% vs. 51.7%††
45.8 ± 7.9 vs. 56.1 ± 10.8
46.6% vs. 50.6%
4.1% vs. 7.4%
NR Switzerland/ Grant§
Moderately High
F/U: follow-up; N: number of patients enrolled in the study * Unilab Surgibone (Unilab Surgibone, Inc.) – bovine xenograft † p<0.05 ‡ Peng 2011: C-ADR data collected prospectively; ACDF data collected retrospectively; procedures performed during the same time period. § Switzerland/Schulthess Klinic Research Fund ** Number of affected segments; there was no explicit statement regarding the number of levels operated on. †† The study states that of the 342 patients included in the study, only 284 had reached 12 month follow-up, and only 178 had reached 24 month follow-up.

WA – Health Technology Assessment December 19, 2016
Artificial disc replacement – Re-review: Final evidence report Page - 177
Effectiveness Results Data for all effectiveness results are summarized briefly below and are available in table format in Appendix Tables J41 and J42. Function Both retrospective cohort studies reported no difference between groups in mean NDI scores at final follow-up (Appendix Table J41).24,122 Pain While one retrospective cohort study (Capelletto 2013) reported significantly better 12-month pain scores with C-ADR versus ACDF (3.1 vs. 6.0, p<0.043) (Appendix Table J41), the authors found no significant differences between groups in the percentage of patients who achieved complete resolution of radicular pain or complete disappearance of myelopathy signs (Appendix Table J42).24 The other retrospective cohort study (Peng 2011) found no differences between groups in 24-month arm pain or neck pain scores (despite worse baseline scores in the C-ADR group versus the ACDF group) (Appendix Table J41).122 Global Distress The registry study reported significantly greater improvement in Core Outcome Measures Index (COMI) scores with C-ADR than with ACDF at both 12 (-4.8 vs. -3.7, p<0.01) and 24 months (-5.1 vs. -3.8, p=0.03), however the 24-month data was based only on 49% of the study’s population (Appendix Table J41).60 The authors reported that these conclusions did not change when differences at baseline were controlled for. Other outcomes One retrospective cohort study (Peng 2011) reported that there were significant differences between groups at 24 months in the following outcomes: SF-36 (all subdomains), AAOS Neck Disability Score, AAOS Neurogenic Symptom Score, JOA score, and patient satisfaction (see Appendix Table J41 for data). However, there were baseline imbalances in some of these measures that favored C-ADR that weren’t controlled for (JOA, SF-36 physical role functioning, and SF-36 social functioning).122 The registry study found that a similar percentage of patients between C-ADR and ACDF groups achieved a good global outcome (i.e., the surgery helped or helped a lot in terms of their neck pain) at both 12 and 24 months; there was also no difference between groups in the percentage of patients who achieved good patient satisfaction at both time points (Appendix Table J42).60

WA – Health Technology Assessment December 19, 2016
Artificial disc replacement – Re-review: Final evidence report Page - 178
4.1.3.4 C-ADR vs. ACDF with a zero-profile device: 2 non-contiguous levels Studies included One trial was identified that compared C-ADR with ACDF plus a zero-profile device in patients with spondylosis at two non-contiguous cervical levels.130 RCT characteristics Treatments: Patients were randomized to receive either C-ADR using the Discover device (n=14) or ACDF plus a zero-profile device (n=16), 130 (Table 58). Inclusion criteria and patient characteristics: The trial enrolled patients with cervical spondylosis at two non-contiguous levels; only one level was permitted between the two affected levels. Patients were required to have not responded to at least six weeks of conservative treatment.130 Complete inclusion and exclusion criteria are provided in Appendix Table H7. Patient demographics are available in Table 59, although very few details were provided. The levels most commonly treated were C3-C4 and C5-C6 (57%); C4-C5 and C6-C7 were treated in 43% of patients. Male patients comprised about two thirds of the study population, and mean patient age was 47.130 Risk of bias: The trial was considered to be at moderately high risk of bias, as it did not meet three or more criteria of a good quality RCT. Methodological limitations included unclear allocation concealment, unclear application of the intention to treat principle, lack of blinded outcome assessment, insufficient information to determine whether co-interventions were applied equally between groups, unclear follow-up rate, and insufficient baseline characteristics data to determine whether there were any potentially confounding differences between groups. The risk of bias evaluation table and reasons for not giving credit can be found in Appendix Table E5.

WA – Health Technology Assessment December 19, 2016
Artificial disc replacement – Re-review: Final evidence report Page - 179
Table 58. RCT Study Characteristics (n randomized/treated) Follow-up (%)* RCT N C-ADR Device ACDF Graft, Device Mean 32.4 (24-46) mos. Country Funding Risk of Bias Qizhi 2016
30 Discover (n=14/14) Zero-P, NR (n=16/16) Unclear China NR Moderately High
ICBG: iliac crest bone graft; N: number of patients randomized to the study * % follow-up was calculated using the number of patients randomized (or treated if the number randomized was not reported), and was generally based on the number of patients with data available for the primary outcome (see Appendix Table E5 for information on exceptions to this rule)
Table 59. RCT Patient Demographics
RCT Group Levels treated: C3-4 + C5-6/ C4-5 + C6-7 (%)
Male (%) Age (mean ± SD)
BMI (kg/m2) (mean)
Caucasian (%)
Current tobacco use (%)
Working (%)
Worker’s Comp (%)
Involved in spinal litigation (%)
Prior surgery at index level (%)
Qizhi 2016
C-ADR 57%/43% 64% 46.8 ± 5.2 NR NR NR NR NR NR 0%* Fusion 56%/44% 69% 48.1 ± 6.0 NR NR NR NR NR NR 0%*
N/n: number of patients randomized to the study/group; NR: not reported * As per the trial’s exclusion criteria.

WA – Health Technology Assessment December 19, 2016
Artificial disc replacement – Re-review: Final evidence report Page - 180
Efficacy Results All analyses are based on completers only (i.e., those with data available) unless otherwise indicated. Overall Clinical Success, NDI Success, Neurological Success, Pain Success, Pain Scores No data reported. NDI Scores Mean 32.4 months: Mean NDI and JOA scores were similar between groups (Table 60). Table 60. C-ADR vs. ACDF + zero-profile device (2 non-contiguous levels): NDI and JOA scores Completer Analysis
Risk of bias Study F/U C-ADR Mean ± SD†
ACDF Mean ± SD†
MD (95% CI)* p-value*
NDI (assumed 0-50 scale); higher score = greater disability† Moderately High RoB
Qizhi 2016
Mean 32.4 mos. (24-46)
3.6 ± 0.9 (n=14)
3.3 ± 0.9 (n=16)
0.3 (-0.4, 1.0) 0.30
JOA (0-17) higher score = better outcome Moderately High RoB
Qizhi 2016
Mean 32.4 mos. (24-46)
13.79 ± 1.05 (n=14)
13.69 ± 1.49 (n=16)
0.1 (-0.9, 1.1) 0.84
RoB: risk of bias * Calculated by SRI. † NDI scale not reported; the raw score (0-50) should be converted to a final score (0-100), and we assumed this not done by
Qizhi, as mean baseline NDI scores were much lower than those reported by other studies.
4.2 Key Question 2: Harms and Complications
4.2.1 Number of studies retained All included comparative studies were evaluated for harms and complications. In addition, case series specifically designed to evaluate harms were considered for inclusion, however none were identified that met the inclusion criteria.
4.2.2 Lumbar Spine
4.2.2.1 L-ADR vs. Fusion: 1-level Adverse events reported in RCTs Both L-ADR IDE trials18,194 and related follow-up publications61,196 comparing 1-level ADR and fusion reported on safety data. Percentages were calculated based on the number of patients who received treatment (i.e., excludes those who dropped out after randomization but prior to undergoing surgery) unless otherwise noted. Adverse events are summarized below; complete lists of all adverse events reported by study are available in Appendix Tables L1-2. Subsequent Surgery at the Index Level Subsequent surgery included any additional procedure performed at the index level (alone or in addition to surgery at the adjacent level), including reoperation, revision, device removal, or supplemental

WA – Health Technology Assessment December 19, 2016
Artificial disc replacement – Re-review: Final evidence report Page - 181
fixation. Detail regarding the frequency of each type of secondary procedure is available in Appendix Table K2.
Subsequent surgery at the index level across the two IDE trials occurred in 4.9% of L-ADR and 7.5% of fusion patients by 24 months18,194; there was no statistical difference between the treatments (pooled RD 2.3% (95% CI -2.1%, 6.6%), I2=0%, N = 540). Similarly, there were no differences in subsequent surgery frequency in the ProDisc-L trial between 24 and 60 months (RD 2.9%, 95% CI -3.4%, 9.3%) or in cumulative events at by 60 months (RD 3.9% (95% CI -4.6%, 12.4%),196 (Figure 37). Serious/Major Adverse Events Serious/major adverse events were defined as major vessel injury, neurological damage, nerve root injury, and death for the 24 month period as defined in the trials. Major adverse events were rare across both trials18,194; no differences were observed between treatments at 24 months, with such events occurring in ≤ 1% of patients across both trials for both treatments. At 60 months, no adverse events were observed in the Charité trial, however, data were only available for 43% of the original study population.61 The ProDisc-L trial authors reported rates of serious or life threatening adverse events as 0.58 and 0.38 per patient for L-ADR and fusion respectively, p = 0.036. Sample sizes may have precluded detection of rare events, thus firm conclusions regarding the comparability of L-ADR and fusion regarding the frequency of major adverse events are not possible (Table 61). Table 61. L-ADR vs. Fusion (1 level) RCTs: Major adverse events and any adverse events
Risk of Bias Outcome F/U Study L-ADR* % (n/N)
Fusion* % (n/N)
RD (95% CI)† RR (95% CI)†
p-value†
Moderately High RoB (both RCTs)
Major adverse events‡
24 mos.
Charite IDE trial (Blumenthal 2005)
1.0% (2/205)
1.0% (1/99)
0.03% (-2.4, 2.4) 1.0 (0.9, 10.5)
0.98
ProDisc-L IDE trial (Zigler 2007)
0% (0/161)
0% (0/75)
0% (NC) NC
NS
60 mos.
Charite IDE trial (Guyer 2009)
0% (0/90)
0% (0/43)
0% (NC) NC
NS
Severe or life-threatening adverse events§
60 mos.
ProDisc-L IDE trial (Zigler 2012 Five-year results)
0.58 per patient (n=161)
0.38 per patient (n=75)
NR 0.036**
Any adverse event
60 mos.
ProDisc-L IDE trial (Zigler 2012 Five-year results)
5.1 per patient (n=161)
5.4 per patient (n=75)
NR 0.507**
CI: confidence interval; F/U: follow-up; L-ADR: lumbar artificial disc replacement; NR: not reported; NS: not significant; RCT: randomized controlled trial; RD: risk difference; RoB: risk of bias; RR: relative risk. *All analyses are based on the baseline, as-treated population:
• For the ProDisc-L IDE trial (Zigler 2007/2012), of a total of 242 patients treated (162 ADR and 80 fusion), 6 patients (1 ADR and 5 fusion) were treated off-protocol and were excluded from the analyses.
• For the Charite IDE trial, of the 14 initial sites, 6 declined participation in the 60-month continuation study, which eliminated 64 randomized patients. Furthermore, the patient numbers reported at 60 months include only those patients with both 24- AND 60-month follow-up and therefore may not accurately represent the number of patients with 60 month data.

WA – Health Technology Assessment December 19, 2016
Artificial disc replacement – Re-review: Final evidence report Page - 182
†Calculated. ‡Defined as major vessel injury, neurological damage, nerve root injury, and death. §Unclear if these events were defined the same way as “major adverse events”, so they were kept separate. **As reported by the study. Death Death was reported by both IDE trials (Table 62). Across the trials through 24 months, one treatment-related death was reported in the Charité Trial in the L-ADR group which was attributed to narcotic use; no deaths were observed in the fusion group.18,167 No treatment related deaths were observed in the ProDisc-L trial at 24 months.168,194 (Detail available in Appendix Table K1). Authors of the ProDisc-L trial report four deaths in the L-ADR group (2.5%) and one death unrelated to surgery or implant (1.3%) at 60 months. It is unclear whether lack of statistical difference between treatments is due to the small sample size or if it represents a true effect. Table 62. L-ADR vs. Fusion (1 level) RCTs: Death
Risk of Bias Outcome F/U Study L-ADR* % (n/N)
Fusion* % (n/N)
RD (95% CI)† RR (95% CI)†
p-value†
Moderately High RoB (both RCTs)
Death (related to treatment)
24 mos. Charite IDE trial (Blumenthal 2005, FDA SSED 2004)
0.5% (1/205)‡
0% (0/99)
0.5% (NC) NC
0.49
ProDisc IDE trial (Zigler 2007, FDA SSED 2006)
0% (0/161)
0% (0/75)
0% (NC) NC
NS
Death (unrelated to surgery or implants)
60 mos. ProDisc-L IDE trial (Zigler 2012 Five-year results)
2.5% (4/161)
1.3% (1/75)
1.2% (-2.4, 4.7) 1.9 (0.2, 16.4)
0.57
CI: confidence interval; F/U: follow-up; L-ADR: lumbar artificial disc replacement; NS: not significant; RCT: randomized controlled trial; RD: risk difference; RoB: risk of bias; RR: relative risk. *All analyses are based on the baseline, as-treated population:
• For the ProDisc-L IDE trial (Zigler 2007/2012), of a total of 242 patients treated (162 ADR and 80 fusion), 6 patients (1 ADR and 5 fusion) were treated off-protocol and were excluded from the analyses.
• For the Charite IDE trial, of the 14 initial sites, 6 declined participation in the 60-month continuation study, which eliminated 64 randomized patients. Furthermore, the patient numbers reported at 60 months include only those patients with both 24- AND 60-month follow-up and therefore may not accurately represent the number of patients with 60 month data.
†Calculated. ‡Narcotics-related death. Device-Related Adverse Events Data were available for a both the Charite and ProDisc-L IDE trials at 24 months.167,168 Device-related adverse events were analyzed two ways. The first uses the definition of device-related adverse events to include back and lower extremities pain, nerve root injury, implant displacement, and subsidence, excluding secondary surgery at the index level as this was reported above. The second analysis includes secondary surgery at the index level in addition to back and lower extremities pain, nerve root injury, implant displacement, and subsidence.

WA – Health Technology Assessment December 19, 2016
Artificial disc replacement – Re-review: Final evidence report Page - 183
Across the two IDE trials at 24 months, device-related adverse events (excluding secondary surgery at index level) were reported in 11.5% (42/366) L-ADR and 9.2% (16/174) fusion recipients; there were no statistical differences between treatments (pooled RD -2.7% (95% CI -7.4 %, 1.9%), I2=0%, N=540) (Figure 38). Similarly, no statistical differences between treatments were observed when secondary surgery at the index level was included in the calculation (Table 63). Table 63. L-ADR vs. Fusion (1 level) RCTs: Any device-related adverse event
Risk of Bias Outcome F/U Study L-ADR* % (n/N)
Fusion* % (n/N)
RD (95% CI)† RR (95% CI)†
p-value†
Moderately High RoB (both RCTs)
Device related adverse events‡ (including secondary surgery at index level)
24 mos.
Charite IDE trial (FDA SSED 2004)
7.8% (16/205)
4.0% (4/99)
3.8% (-1.6, 9.1) 1.9 (0.7, 5.6)
0.22
ProDisc IDE trial (FDA SSED 2006)
18.0% (29/161)
21.3% (16/75)
-3.3% (-14.3, 7.7) 0.8 (0.5, 1.5)
0.55
Catastrophic device failure resulting in death or injury
24 mos.
Charite IDE trial (Blumenthal 2005)
0% (0/205)
0% (0/99)
0% (NC) NC
NS
CI: confidence interval; F/U: follow-up; L-ADR: lumbar artificial disc replacement; NS: not significant; RCT: randomized controlled trial; RD: risk difference; RoB: risk of bias; RR: relative risk. *All analyses are based on the baseline, as-treated population:
• For the ProDisc-L IDE trial (Zigler 2007/2012), of a total of 242 patients treated (162 ADR and 80 fusion), 6 patients (1 ADR and 5 fusion) were treated off-protocol and were excluded from the analyses.
• For the Charite IDE trial, of the 14 initial sites, 6 declined participation in the 60-month continuation study, which eliminated 64 randomized patients. Furthermore, the patient numbers reported at 60 months include only those patients with both 24- AND 60-month follow-up and therefore may not accurately represent the number of patients with 60 month data.
†Calculated. ‡Defined as adverse events considered by the investigators to be device-related, including back and lower extremities pain, nerve root injury, implant displacement, and subsidence. Secondary Surgery at the Adjacent Level In the Charité trial at 60 months,61 adjacent surgery for adjacent segment disease was done less frequently in the L-ADR (1.1%, n/N = 1/90) group compared with fusion (4.7%, n/N = 2/43); RD -8.1% 95% CI -17.1, 0.76%). Of the 14 initial sites, 6 declined participation in the 60-month continuation study, eliminating 64 randomized patients; only those patients with both 24- AND 60-month follow-up are included thus, results should be interpreted cautiously. The ProDisc-L trial reported on surgery at an adjacent level after the index procedure.196 Although surgery at an adjacent level was less common groups through 60 months in the L-ADR group (2.5%, n/N = 3/119) compared with fusion (7.1%, n/N = 3/42), there was no statistical difference between treatment groups, RD -4.6%, 95% CI -12.9%, 3.7%. Any Adverse Event Across the two IDE trials, any adverse event (regardless of relationship to treatment) was reported for 79.5% (291/366) of L-ADR recipients and 84.5% (147/174) of fusion recipients at 24 months167,168; differences between groups were not statistically significant (pooled RD 6.2% (95% CI -0.7 %, 13.0%), I2=

WA – Health Technology Assessment December 19, 2016
Artificial disc replacement – Re-review: Final evidence report Page - 184
16%, N = 540)) (Figure 39). At 60 months, the ProDisc-L trial reported similar rates of any adverse event per patient for L-ADR (5.1 per patient) and fusion (5.4 per patient), p = 0.507,196 (Table 61). Complete lists of all adverse events reported by category are available in Appendix Tables K1-6. Individual adverse events occurred similarly between treatment groups and no statistical differences were noted for complications including infection, retrograde ejaculation, approach related adverse events, thrombosis, hematoma, blood loss. Adverse events reported in non-randomized comparative studies Two nonrandomized comparative studies were identified that reported on adverse events (but not effectiveness outcomes). Study characteristics A retrospective cohort (moderately high risk of bias) analyzed 74 Asian patients who had undergone L-ADR using the ProDisc-L device (n=54) or transforaminal lumbar interbody fusion (TLIF) with autograft (n=20).91 For inclusion, patients were required to have lumbar DDD and pure chronic lower back pain without radiculopathy that involved only the L4/5 spinal level or L5/S1 spinal level, confirmed by discogram. Compared with the fusion group, the L- ADR group was significantly younger (34 vs. 52 years, p<0.05) and had a greater proportion of male patients (76% vs. 50%; p=0.03). Methodological limitations included loss to follow-up (>80%), no control for confounding, and it was unclear if outcome assessment was blinded and if co-interventions were equally applied between groups (see Appendix Table E2 for details). The second study was an administrative database study which evaluated 52,877 patients in the California Office of Statewide Health Planning and Development discharge database who had undergone single-level L-ADR (n=2415) or fusion (n=50,462).47 For inclusion, patients were required to be between 18 and 65 years and to have single-level degenerative disc disease; patients undergoing revision surgery (as the primary indication) were excluded. Mean patient age in the L-ADR and fusion groups was 47 and 52 years, respectively, and just over half of the patients were male in both groups. This study only met 6/12 criteria for a well-conducted administrative database study; documentation of key criteria was poor. Primary methodological concerns included lack of description of methods for bias reduction in the database or for coding validity or accuracy. This may impact accuracy of classifications for both outcomes and exposures of interest. Additionally clinical significance was not described (see Appendix Table E4 for details). Additional details on these studies are available in Appendix Table G2. Results The retrospective cohort study91 reported no difference between the L-ADR and TLIF groups in the incidence of any surgical approach-related complication (16.7% vs. 5.0%, p=0.19) or of any such individual complication including peritoneal injuries, superficial abdominal infection, retrograde ejaculation, and dural tear. Through a mean follow-up of 68.4 months (range, 25.2 to 122.4) – 59.0 vs. 89.2 months for L-ADR vs. fusion, respectively – a similar proportion of patients in both groups underwent revision surgery: 10.5% following L-ADR versus 12.5% following fusion.91 (Note: only patients with ≥24 month follow-up were included in the revision surgery analysis). (Appendix Table K8).No data were reported on serious/major complications (including death).

WA – Health Technology Assessment December 19, 2016
Artificial disc replacement – Re-review: Final evidence report Page - 185
The administrative database study reported no differences between the L-ADR and TLIF groups at 3 months in all-cause readmissions following the index procedure (4.8% vs. 6.0%, respectively) and subsequent lumbar surgery (2.9% vs. 4.0%, respectively; p=0.05), after adjusting for several independent variables (not specified).47 The latter outcome was also evaluated at 12, 36, and 60 months with a statistical difference between groups seen only at 12 months (3.5% vs. 4.8%; p=0.009) (only unadjusted estimates were reported at these later time-points). Wound infection was less common following L-ADR vs. fusion: 0.25% vs. 1.0% (adjusted OR 0.29 (95% CI, 0.13, 0.66); p=0.003). Although statistically significance is commonly achieved with large sample sizes in administrative database studies, it is not always the case that results are clinically meaningful. All other outcomes evaluated through 3 months, to include mechanical complication, pulmonary embolism, septicemia, surgical site bleeding, pneumonia, myocardial infarction, periprosthetic joint infection and death, were not statistically different between groups.47 (Appendix Table K8).
4.2.2.2 L-ADR vs. Fusion: 2-level Adverse events reported in RCTs One IDE trial (N = 237)41 compared L-ADR with fusion at two contiguous levels in patients with degenerative disc disease (with or without leg pain) who had ≥6 months of unsuccessful non-operative care and ODI score of ≥40 reported limited safety data. A complete lists of all adverse events reported by study are available in Appendix Table L3. Secondary Surgery at the Index Level Secondary surgery at the index level (including revision, secondary decompression or device/implant removal) occurred less frequently in the L-ADR group compared with fusion patients through 24 months, RD -5.9% (95% CI -12.7, 0.09) (Table 64). Serious/Major Adverse Events Major surgical complications included dural tear, blood loss of ≥ 1500 ml, iliac artery tear and deep vein thrombosis and occurred less frequently in the L-ADR group (0.7%) compared with the fusion group (4.9%); RD -6.7 (95% CI -14.0%, 0.6%) (Table 64). Death One death occurred in the L-ADR group and was not considered to be treatment related; no deaths occurred in the fusion group (Table 64). Device-Related Adverse Events and Other Adverse Events Through 24 months, implant subsidence of >3 mm (not clinically relevant) or migration occurred in four (2.4%) L-ADR patients and implant migration or subsidence of >3 mm was reported in one (1.4%) fusion patient, RD 1.0% (95% CI - 2.5%, 4.6%.41 There was one anterior migration of L-ADR which resulted in need for revision. Radiolucency or halo around the implant did not occur in with L-ADR but was present in three patients (4.2%) of the fusion group (RD -4.2 95% CI -8.8, 0.05).
No other adverse events were reported. A complete listing of adverse events by category is available in Appendix Tables K9-11.

WA – Health Technology Assessment December 19, 2016
Artificial disc replacement – Re-review: Final evidence report Page - 186
Table 64. L-ADR vs. Fusion (2 levels) RCTs: Subsequent surgery at the index level, major adverse events and device-related adverse events
Risk of Bias Outcome Study F/U L-ADR* % (n/N)
Fusion* % (n/N)
RD (95% CI)† RR (95% CI)†
p-value†
Subsequent index-level surgery Moderately High
Secondary surgical procedure at index level(s)§
ProDisc-L IDE trial–2 levels (Delamarter 2011)
24 mos.
2.4% (4/165)
8.3% (6/72)
-5.9% (-12.7%, 0.09%) 0.3 (0.1, 0.9)
0.04
Major adverse events Moderately High
Major surgery-related complications‡
ProDisc-L IDE trial–2 levels (Delamarter 2011)
24 mos.
0.7% (5/165)
4.9% (7/72)
-6.7% (-14.0%, 0.6%) 0.3 (0.1, 0.9)
0.03
Death (unrelated to treatment)
ProDisc-L IDE trial–2 levels (Delamarter 2011)
24 mos.
0.6% (1/165)
0% (0/72)
0.6% (NC) NC
0.51
Device-Related Adverse Events** Moderately High
Subsidence or migration
ProDisc-L IDE trial–2 levels (Delamarter 2011)
24 mos.
2.4% (4/165)
1.4% (1/72)
1.0% (- 2.5%, 4.6%) 1.7 (0.2, 15.3)
0.51
CI: confidence interval; F/U: follow-up; L-ADR: lumbar artificial disc replacement; NC: not calculable; RCT: randomized controlled trial; RD: risk difference, RR: risk ratio. * All analyses are based on the baseline, as-treated population: 10 Fusion patients and 9 ADR patients did not received the treatment they were randomized to and they are not accounted for in any analysis. † Calculated by SRI. ‡ Included dural tear (1 ADR, 3 fusion; all successful repaired), blood loss >1500 mL (2 ADR, 2 fusion; 1 iliac artery tear in ADR group while all others had excessive oozing from the surgical site), and deep vein thrombosis (2 ADR, 2 fusion; all successfully treated). While dural tear was the only outcome clearly described as a major surgery-related complication, we assumed the authors may have considered these other outcomes major as well as so they are included under this category. § Includes revision (1 ADR, 1 fusion), decompression (3 ADR, 1 fusion), and device/implant removal (0 ADR, 6 fusion). One fusion patients underwent implant removal, decompression and revision of the bone fusion sites due to pseudarthrosis at L5-S1; this patient is only counted once in the overall estimate. ** Based on radiographic evaluation, implant subsidence of >3 mm for L-ADR patients (not clinically relevant) or migration and implant migration or subsidence of > 3mm was reported for fusion.
4.2.2.3 L-ADR vs. Fusion: 1- or 2-level (or levels not specified) Adverse events reported in RCTs Two publications for one RCT from Sweden which included patients with symptomatic mechanical or discogenic degenerative disc disease at one or two segments who had failed at least 3 months of conservative care reported safety outcomes at 24 months13 and 60 months.153 A complete list of all adverse events reported by study are available in Appendix Table L4. Secondary Surgery at the Index Level Secondary surgery at the index level was significantly less common following L-ADR compared with fusion (RD -20.6%, 95% CI -33.1%, -8.1%) at 24 months. Similarly, cumulative incidence of additional index level surgery through 60 months was also lower for L-ADR compared with fusion (RD-19.1%, 95%
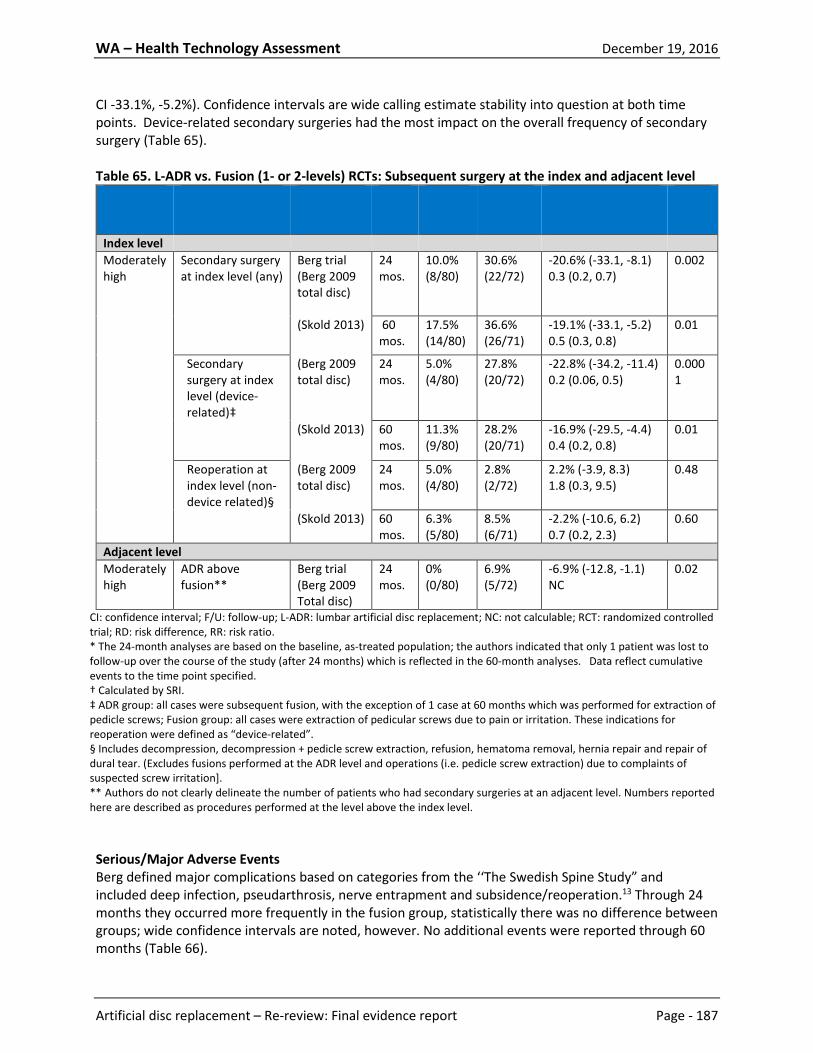
WA – Health Technology Assessment December 19, 2016
Artificial disc replacement – Re-review: Final evidence report Page - 187
CI -33.1%, -5.2%). Confidence intervals are wide calling estimate stability into question at both time points. Device-related secondary surgeries had the most impact on the overall frequency of secondary surgery (Table 65). Table 65. L-ADR vs. Fusion (1- or 2-levels) RCTs: Subsequent surgery at the index and adjacent level
Risk of Bias Outcome Study F/U* ADR* % (n/N)
Fusion* % (n/N)
RD (95% CI)† RR (95% CI)†
p-value†
Index level Moderately high
Secondary surgery at index level (any)
Berg trial (Berg 2009 total disc)
24 mos.
10.0% (8/80)
30.6% (22/72)
-20.6% (-33.1, -8.1) 0.3 (0.2, 0.7)
0.002
(Skold 2013) 60 mos.
17.5% (14/80)
36.6% (26/71)
-19.1% (-33.1, -5.2) 0.5 (0.3, 0.8)
0.01
Secondary surgery at index level (device- related)‡
(Berg 2009 total disc)
24 mos.
5.0% (4/80)
27.8% (20/72)
-22.8% (-34.2, -11.4) 0.2 (0.06, 0.5)
0.0001
(Skold 2013) 60 mos.
11.3% (9/80)
28.2% (20/71)
-16.9% (-29.5, -4.4) 0.4 (0.2, 0.8)
0.01
Reoperation at index level (non-device related)§
(Berg 2009 total disc)
24 mos.
5.0% (4/80)
2.8% (2/72)
2.2% (-3.9, 8.3) 1.8 (0.3, 9.5)
0.48
(Skold 2013) 60 mos.
6.3% (5/80)
8.5% (6/71)
-2.2% (-10.6, 6.2) 0.7 (0.2, 2.3)
0.60
Adjacent level Moderately high
ADR above fusion**
Berg trial (Berg 2009 Total disc)
24 mos.
0% (0/80)
6.9% (5/72)
-6.9% (-12.8, -1.1) NC
0.02
CI: confidence interval; F/U: follow-up; L-ADR: lumbar artificial disc replacement; NC: not calculable; RCT: randomized controlled trial; RD: risk difference, RR: risk ratio. * The 24-month analyses are based on the baseline, as-treated population; the authors indicated that only 1 patient was lost to follow-up over the course of the study (after 24 months) which is reflected in the 60-month analyses. Data reflect cumulative events to the time point specified. † Calculated by SRI. ‡ ADR group: all cases were subsequent fusion, with the exception of 1 case at 60 months which was performed for extraction of pedicle screws; Fusion group: all cases were extraction of pedicular screws due to pain or irritation. These indications for reoperation were defined as “device-related”. § Includes decompression, decompression + pedicle screw extraction, refusion, hematoma removal, hernia repair and repair of dural tear. (Excludes fusions performed at the ADR level and operations (i.e. pedicle screw extraction) due to complaints of suspected screw irritation]. ** Authors do not clearly delineate the number of patients who had secondary surgeries at an adjacent level. Numbers reported here are described as procedures performed at the level above the index level. Serious/Major Adverse Events Berg defined major complications based on categories from the ‘‘The Swedish Spine Study” and included deep infection, pseudarthrosis, nerve entrapment and subsidence/reoperation.13 Through 24 months they occurred more frequently in the fusion group, statistically there was no difference between groups; wide confidence intervals are noted, however. No additional events were reported through 60 months (Table 66).

WA – Health Technology Assessment December 19, 2016
Artificial disc replacement – Re-review: Final evidence report Page - 188
Death Authors do not report on death. Table 66. L-ADR vs. Fusion (1- or 2-levels) RCTs: Any, major and minor complications
Risk of Bias Outcome Study F/U L-ADR* % (n/N)
Fusion* % (n/N)
RD (95% CI)† RR (95% CI)†
p-value†
Moderately High
Total major complications‡
Berg trial (Berg 2009 Total disc/ Skold 2013)
60 mos. 2.5% (2/80)
8.3% (6/72)
-5.8% (-13.1, 1.4) 0.3 (0.6, 1.4)
0.11
Any adverse event or complication§
60 mos. 17.5% (14/80)
20.8% (15/72)
-3.3% (-15.9, 9.2) 0.8 (0.4, 1.6)
0.60
Total minor complications**
60 mos. 15.0% (12/80)
12.5% (9/72)
2.5% (-8.4, 13.4) 1.2 (0.5, 2.7)
0.66
CI: confidence interval; F/U: follow-up; L-ADR: lumbar artificial disc replacement; RCT: randomized controlled trial; RD: risk difference, RR: risk ratio. * The 24-month analyses are based on the baseline, as-treated population; the authors indicated that only 1 patient was lost to follow-up over the course of the study (after 24 months) which is reflected in the 60-month analyses. All events occurred within 24 months with no additional events reported through 60 months. † Calculated by SRI. ‡ Major complications reported here include deep infection (4 fusion), pseudarthrosis (2 fusion), nerve entrapment (1 ADR), and subsidence/reoperation (1 ADR). § The grading of complications into major and minor used in ‘‘The Swedish Spine Study’’ as reported in Berg 2009 are applied to both 24 and 60 months. Major complications were defined as potentially life threatening or cause of considerable suffering and minor as reversible relevant minor event/cause of minor suffering. ** Minor complications reported here include “adjacent” (1 ADR, 6 fusion), facet joint problem (6 ADR), hematoma (2 ADR, 1 fusion), dural tear (1 ADR, 1 fusion), wound hernia (1 ADR), meralgia paresthetica (1 ADR), and donor site pain (1 fusion). Device-Related Adverse Events Only data on device re-operation were reported and were significantly less common following L-ADR compared with fusion at 24 months, RD -22.8% (95% CI -34.2%, -11.4%),13 and cumulatively through 60 months, RD -16.9% (-29.5, -4.4).153 Authors do not report on other device-related harms (Table 65).
Secondary Surgery at the Adjacent Level Authors do not clearly delineate the number of patients who had secondary surgeries at an adjacent level.13,153 It appears that at 24 months, none of the L-ADR group had adjacent level surgery compared with 6.9% of the fusion group; RD -6.9% (95% CI -12.8%, -1.1%, P = 0.02) (Table 65). Authors report that 7 procedures were done in the L-ADR group and 11 were done in the fusion group at a new level, however it is not clear if these were adjacent levels and the number of patients and denominators are not clear. Authors report the number of patients who had reoperation, new operation, or both with substantially fewer patients in the in the L-ADR group (20%, n/N =16/80) compared with 42% (30/71) in the fusion group who had reoperation, new operation or both through 60 months. Any Adverse Event Complications overall were more common following L-ADR compared with fusion with through 60 months, however the differences were not statistically significant. All events occurred by 24 months with no additional events reported by 60 months13,153 (Table 66).

WA – Health Technology Assessment December 19, 2016
Artificial disc replacement – Re-review: Final evidence report Page - 189
A complete list of all adverse events reported for this trial by category is available in Appendix Tables K12-13. Most individual adverse events occurred similarly between treatment groups and no statistical differences were noted for complications including hematoma, pseudarthrosis, wound hernia, or nerve entrapment. Statistical differences between treatment groups were noted for major infection (L-ADR 0%, fusion 5.6%), suspected facet joint pain (L-ADR 7.5%, fusion 0%), and “adjacent” complications (not defined further) (L-ADR 1.3%, fusion 8.3%). These events are detailed in Appendix Table K12. Adverse events reported in non-randomized comparative studies A total of three nonrandomized comparative studies reported on safety outcomes. One non-randomized comparative study – a registry – included in Key Question 1 for 1- or 2-level procedures reported safety on reoperations. Two additional nonrandomized comparative studies were identified that reported adverse events only (did not report effectiveness outcomes). One retrospective cohort reported on retrograde ejaculation and the other, an administrative data study, evaluated revision procedures. Study characteristics: The registry study (moderately high risk of bias) identified patients from the Swedish Spine Register (SweSpine) who underwent 1- or 2-level L-ADR or posterior lumbar instrumented fusion (PLIF) for symptomatic lumbar degenerative disc disease.12 Only patients with clinical follow-up over 12 months were included (L-ADR, n=163; PLIF, n=178). (See Table 32 above and accompanying paragraph for further details on study and patient characteristic as well as methodological limitations). The retrospective cohort (moderately high risk of bias), analyzed 95 male patients who had undergone L-ADR using the ProDisc-L or Activ-L devices (n=41) or anterior lumbar interbody fusion (ALIF) with bone morphogenetic protein (BMP) (n=54).93 For inclusion, patients were required to have had surgery on at least the L5-S1 level; 58.5% versus 31.5% of patients (p<0.05) in the ADR and fusion groups, respectively, had single-level procedures at L5-S1, however, it was unclear how many levels total were operated on in the remaining patients. Patients who underwent revision surgery for previous anterior spine procedures were excluded. Compared with the fusion group, the L-ADR group was significantly younger (35 vs. 49 years, p<0.001). Methodological limitations included loss to follow-exceeding 80% (including differential follow-up of >10% between groups), no control for confounding, and it was unclear if outcome assessment was blinded and if co-interventions were equally applied between groups (see Appendix Table E2 for details). The administrative database study evaluated 377,660 procedures (7170 L-ADRs; 370,490 fusions) identified using the Nationwide Inpatient Sample (NIS); both primary and revision L-ADR and fusion were included.90 For the purposes of this report, safety outcomes were assessed for primary procedures only (6370 L-ADRs and 344,140 fusions); revision procedures were included only to provide an estimate of the national revision burden. The number of levels treated or types of devices used were not reported; the authors did state that although the codes used to search the database do not allow distinction between single and multiple level ADRs or fusions, multilevel procedures are thought to comprise about 20% of procedures both groups. Compared with the primary fusion group, the primary L-ADR group was significantly younger (93% vs. 52% age <55 years) and had a greater proportion of males (53% vs. 44%). This study met 9/12 criteria for a good administrative database study (see Appendix Table E4 for details). Database criteria were reasonably well documented, however, there was no description of methods used for verifying code accuracy or validity. Additional details on these studies are available in Appendix Table G5.

WA – Health Technology Assessment December 19, 2016
Artificial disc replacement – Re-review: Final evidence report Page - 190
Results: The registry study included in Key Question 1 (Berg 2010, N=341)12 reported on reoperations Through 12 months, a similar proportion of patients in both groups underwent reoperation (8% L-ADR vs. 10% fusion). At 24 months, however, there were no reoperations reported in the L-ADR group compared with 10% of the fusion group having undergone reoperation (p=0.02). It should be noted that only patients with a minimum of 12 month follow-up were included at baseline, and follow-up at each time-point was based on the number of patient who completed outcomes questionnaires at those times; at both 12 and 24 months there was substantial loss to follow-up (only 61.3% and 30.1%, respectively, had data) (Appendix Table K14). No other adverse events or complications were evaluated by the study. The retrospective cohort study93 reported no difference between the L-ADR and ALIF groups in the incidence of retrograde ejaculation (RE): 9.8% (4/41) vs. 7.4% (4/54), respectively. At latest follow-up (duration not report) one patient in each group reported resolution of the RE. In addition, two patients (3.7%) who underwent ALIF with BMP reported sexual dysfunction other than RE, including difficulty obtaining an erection, painful erection, and a decrease in sexual desire. (Appendix Table K14). No other complications (including death) were evaluated. The administrative database study90 reported similar low incidences of in-hospital mortality (0.1% vs. 0.2%) and device-related infections (0% vs. 0.3%) between the primary L-ADR and fusion groups, respectively. Compared with the fusion group, device-related mechanical complications occurred less frequently following L-ADR (0.7% vs. 2.9%) and routine discharge to home was more common (89% vs. 70%). Considering all L-ADR and fusion procedures identified in the NIS, the average revision burden was higher following L-ADR vs. fusion over a 24-month period (11.2% vs. 7.1%). Results were further stratified by anterior and posterior fusion and are available in Appendix Table K14.
4.2.2.4 L-ADR vs. Multidisciplinary Rehabilitation Adverse events reported in RCTs Data on safety from the one RCT (Hellum)65 conducted in Norway which compared L-ADR with multidisciplinary rehabilitation were not well reported. The trial was in patients with low back pain for ≥1 year with degenerative intervertebral disc changes in L4/L5 or L5/S1 who had structured physical therapy or chiropractic care for ≥ 6 months that didn’t provide relief and an ODI of ≥ 30. A complete list of all adverse events reported by study are available in Appendix Table L5. Secondary Surgery at the Index Level Additional surgery of any type at the index level was reported in 6.5% (5/77) of L-ADR recipients (Table 67). Further details are available in Appendix Table K16. Major Adverse Events/Events Resulting in Impairment Major adverse events were only reported for the L-ADR group and were defined as major complications resulting in impairment, which occurred in 7.8% (6/77) patients, 65 (Table 67). Impairment was not explicitly defined but the following events were included: polyethylene inlay dislodgement requiring revision surgery, during which injury to the left common iliac artery led to compartment syndrome resulting in a lower leg amputation (n=1); arterial thrombosis of dorsalis pedis artery resulting in a slightly colder foot (n=1); retrograde ejaculation (n=1); sensory loss in the thigh (n=2); and new radicular pain (n=2); there were a total of 7 events in 6 patients.

WA – Health Technology Assessment December 19, 2016
Artificial disc replacement – Re-review: Final evidence report Page - 191
Surgery-Related Adverse Events Treatment-related adverse events were only reported for the L-ADR group and are detailed in Appendix Table K15. In addition to the events described as major events resulting in impairment, authors report the following events and their frequency65:
• 5.2%: Blood loss of >1500ml; temporary sensory loss; temporary radicular pain • 2.6%: New radicular pain, sensory loss (thigh); temporary warm left foot • 1.3%: Retrograde ejaculation, abdominal hernia, superficial hernia, ileus, nausea
It is not clear if patients could experience more than one complication. Any Adverse Event Total (any) complications were only reported for the L-ADR group. Overall, 33.8% (26/77) experienced some sort of complication following L-ADR and included perioperative adverse events such as dural tear, blood loss >1500 mL, hematoma, infection as well as adverse events resulting in impairment that are described above. Worsening of back pain was reported in 10.4% of L-ADR recipients and 7.5% of multidisciplinary rehabilitation recipients65 (Table 67). Further details are available in Appendix Table K15. Table 67. L-ADR vs. Multidisciplinary Rehabilitation (1 to 2 levels) RCTs: Subsequent surgery at the index level, major and any adverse event
Risk of Bias Outcome Study F/U L-ADR* % (n/N)
Rehab* % (n/N)
Subsequent index-level surgery Moderately High Total with
reoperation/operation at index level†
Hellum 2011 24 mos. 6.5% (5/77)
NA
Major adverse events Moderately High Major complication
resulting in impairment‡ Hellum 2011 24 mos. 7.8% (6/77)
NA
Any adverse event Moderately High Total with any
complication§ Hellum 2011 ≤24 mos. 33.8% (26/77) NA
Other Moderately High Worsening of Back pain Hellum 2011 24 mos. 10.4% (8/77) 7.5% (6/80)
F/U: follow-up; L-ADR: artificial disc replacement; NA: not applicable; NR: not reported; RCT: randomized controlled trial; Rehab: rehabilitation; RD: risk difference; RR: risk ratio. * Analyses are based on the baseline, as-treated population: Six patients (3 in each group) were excluded shortly after
randomization and not accounted for in the studies analyses. † Surgeries included fusion at level with disc prosthesis and level above (n=1); insertion of new polyethylene inlay (n=1); and partial resection of spinous process because of possible painful contact between adjacent levels (n=2; both patients were experiencing persistent back pain) ‡ Includes: polyethylene inlay dislodgement requiring revision surgery, during which injury to the left common iliac artery led to compartment syndrome resulting in a lower leg amputation (n=1); arterial thrombosis of dorsalis pedis artery resulting in a

WA – Health Technology Assessment December 19, 2016
Artificial disc replacement – Re-review: Final evidence report Page - 192
slightly colder foot (n=1); retrograde ejaculation (n=1); sensory loss in the thigh (n=2); and new radicular pain (n=2); there were a total of 7 events in 6 patients. § Includes “major complications resulting in impairment” as well as perioperative adverse events such as dural tear, blood loss
>1500 mL, hematoma, infection, etc.; the authors did not report on adverse events in the rehabilitation group.
4.2.3 Cervical Spine
4.2.3.1 C-ADR vs. Fusion: 1-level Adverse events reported in RCTs All 13 RCTs reported safety data; these trials compared C-ADR with ACDF in patients with radiculopathy and/or myelopathy attributed to single-level cervical degenerative disc disease. Percentages were calculated based on the number of patients who received treatment (i.e., excludes those who dropped out after randomization but prior to undergoing surgery). Adverse events are summarized below; complete lists of all adverse events reported by study are available in Appendix N. Secondary Surgery at the Index Level Secondary surgery included any additional procedure performed at the index level (alone or in addition to surgery at the adjacent level), including reoperation, revision, device removal, or supplemental fixation. The incidence of each type of secondary procedure is available in Appendix Table M1. Secondary surgery at the index level was significantly less common in the C-ADR group than in the ACDF group through 24 months (pooled RD 3.1% (95% CI 1.1%, 5.1%), I2=23%) based on data from eight RCTs (N=2299) (Figure 40a).23,70,85,111,146,147,172,177 The effect was more pronounced across the three moderately low risk of bias trials (pooled RD 4.7% (95% CI 2.0%, 7.5%)) than across the five moderately high risk of bias trials (pooled RD 2.0% (95% CI -0.8%, 4.8%)). Secondary surgery at the index level was performed in slightly fewer C-ADR patients than ACDF patients through 48 to 60 months based on data from four trials (pooled RD 4.8% (95% CI 0.8%, 8.8%), I2=48%, N=1335) (Figure 40b)43,78,125,147; the same effect was also seen through 84 months (pooled RD 7.5% (95% CI 3.6%, 11.4%), I2=0%, N=750),23,80 (Figure 40c). Serious/Major Adverse Events Serious/major adverse events were reported as classified by the trial, and commonly included those that were life threatening, required medical intervention, or resulted in a permanent disability or death (definitions varied slightly between trials, see Figure 41 footnotes for details). Based on data across five trials, serious adverse events were reported in significantly fewer C-ADR than ACDF patients through 24 months (pooled RD 6.8% (95% CI 2.0%, 11.6%), I2=16%, N=2388) (Figure 41a).8,170,172,174,177 No difference was found between groups for later time points based on data from one trial per time point (24-48 months, 0-48 months, 24-84 months) (Figure 41b-d).71,126,147 Death was reported by five trials (see Appendix Table M3)8,23,70,114,177; no deaths were attributed to the procedure. In the C-ADR group, a total of four deaths were reported – one was due to a severe subarachnoid hemorrhage at six weeks, while the cause of the other three were not reported. In the ACDF group, a total of seven deaths were reported – three were due to myocardial infarction, and one was due to a motor vehicle crash, while the cause of the other three were not reported. Device-Related Adverse Events

WA – Health Technology Assessment December 19, 2016
Artificial disc replacement – Re-review: Final evidence report Page - 193
Device-related adverse events were reported as classified by the trial, which included (but was not limited to) malpositioned implant, implant displacement/loosening, infection, non-union, dysphagia, and trauma (definitions varied between trials, see Figure 42 footnotes for details). While device-related adverse events were less common in the C-ADR group than in the ACDF group through 24 months (pooled RD 5.0% (95% CI 2.7%, 7.4%), I2=21%, N=2167) (Figure 42a),169-174 these events occurred similarly between groups through 60 months based on data from two trials72,195 (pooled RD 0.4% (95% CI -3.4%, 4.3%), I2=34%, N=469) (Figure 42b) and through 84 months based on data from one trial80 (RD 1.1% (95% CI -11.0%, 13.3%), 1 RCT, N=209) (Figure 42c). Secondary Surgery at the Adjacent Level Secondary surgery at the adjacent level occurred similarly between groups through 24 months (pooled RD 0.8% (95% CI -0.5%, 2.0%), I2=0%) based on data from eight trials (N=2388) (Figure 43a),23,85,170-
172,174,177,190 while it was slightly less common in C-ADR patients compared with ACDF patients through 48 to 60 months (pooled RD 3.6% (95% CI 0.8%, 6.4%), I2=34%, 5 RCTs, N=1446) (Figure 43b)43,147,172,190 and through 84 months (RD 5.4% (95% CI 1.7%, 9.0%), I2=0%, 2 RCTs, N=750) (Figure 43c).23,80 One additional trial also reported no difference between groups through 36 months (RD -4.8% (95% CI -13.9%, 4.4%)) (Nabhan 2007) (Appendix Table M5).114 Any Adverse Event Pooled data across six trials suggested no difference between groups in the incidence of any adverse event through 24 months (pooled RD 3.1% (95% CI -1.8%, 8.1%), I2=60%, N=2190) (Figure 44a).23,70,170-173 Through 84 months, one trial found that significantly more C-ADR patients had experienced any adverse event than ACDF patients (RD -6.5% (95% CI -11.2%, -1.4%), N=541) (Figure 44b).23 Complete lists of all adverse events reported by study are available in Appendix N. The majority of individual adverse events occurred similarly between treatment groups. However, some adverse events occurred more frequently in one of the treatment groups, although no trends were observed for any of these events when considering data across all trials. These events are detailed in Appendix M7and M8. Adverse events reported in non-randomized comparative studies Of the three non-randomized comparative studies included in Key Question 1, one reported on adverse events – a prospective cohort study (Hou 2014, N=225). In addition, one administrative database study reported only on safety (but not effectiveness) outcomes (Radcliff 2015); the study evaluated 6962 patients in the Blue Health Intelligence (BHI) national claims database who had undergone single-level C-ADR (n=327) or ACDF (n=6962) in 2008 or 2009.134 For inclusion, patients were required to be between 18 and 60 years and to have single-level degenerative disc disease that had not responded to six weeks or more of conservative care and had not previously undergone surgery in the cervical spine. This study had significant methodological limitations as it met only 3 of the 12 criteria of a high-quality administrative database study (Appendix Table E8); Additional detail on this study is available in Appendix Table H2. The prospective cohort study (Hou 2014) reported no difference between C-ADR and ACDF groups in any individual complication through a mean follow-up of 18 (range, 12-26) months. Device-related events reported included dysphagia (6.8% vs. 8.9%) and migration or subsidence (range 0-1.7% vs. 0.9%); other adverse events occurred in 0-1.7% of C-ADR patients and in 0-2.8% of ACDF patients. The incidence of any complication was similar between groups (15.4% vs. 21.3%) (Appendix Table N8).74 No data were reported on serious/major complications (including death).

WA – Health Technology Assessment December 19, 2016
Artificial disc replacement – Re-review: Final evidence report Page - 194
The administrative database study134 (Radcliff 2015) found that the cumulative incidence of a first reoperation as measured through the last available follow-up for each patient (mean 26 months) was significantly lower in C-ADR than ACDF patients (5.7% vs. 10.5%, p=0.02); it was not specified whether this procedure was limited to the index level or could also include procedures at the adjacent level. However, there was no significant difference in the reoperation rates between groups in any of the individual time periods evaluated (0-1.5, 1.5-3, 3-6, 6-12, 12-18, 18-24, 24-36, or 36-48 months). No data were reported on serious/major complications (including death). There was no difference between groups in the incidence of device-related “mechanical” complications (0% vs. 0.06-0.21%) or in that of dysphagia (0% vs. 0-0.05%) in any time period evaluated; the cumulative incidence was not reported for either category. Cumulative pain-related complications were similar between groups as evaluated through last available follow-up (mean 26 months) (3.8% vs. 3.5%) and across all individual time periods. The percentage of patients with any adverse event was evaluated for individual time periods only, some of which showed significantly lower rates of adverse events with C-ADR than ACDF, including 3-6 months (0% vs. 1.3%), 12-18 months (0.38% vs. 2.17%), and 24-36 months (0% vs. 2.16%) (Appendix Table N8).134
4.2.3.2 C-ADR vs. Fusion: 2-level Adverse events reported in RCTs Both RCTs reported safety data; the trials compared C-ADR with ACDF at two contiguous levels in patients with radiculopathy and/or myelopathy attributed to two-level cervical degenerative disc disease.38 Adverse events are summarized below; complete lists of all adverse events reported by study are available in Appendix N. Secondary Surgery at the Index Level Secondary surgery at the index level (either alone or in addition to the adjacent level) was performed in significantly fewer C-ADR than ACDF patients through 24 months (RD -8.3% (95% CI -14.8%, -1.8%)) and through 60 months (RD -7.7% (95% CI -14.5%, -0.8%)) in the Mobi-C (2-level) IDE trial (Table 68).38,78 Cheng et al. reported no C-ADR patients required additional surgery at the index level through 24 months but did not report data for the ACDF group.30 The incidence of each type of secondary procedure is available in Appendix Table M9. Serious/Major Adverse Events The Mobi-C (2-level) IDE trial reported that serious adverse events – those that were life threatening, required hospitalization or a surgical procedure, or resulted in significant disability or death – were slightly less common in the C-ADR group compared with the ACDF group through 24 months, although the difference did not reach statistical significance (RD -7.9% (95% CI -18.5%, 2.6%)) (Table 68).175 Device-Related Adverse Events Adverse events considered definitely or possibly related to the device occurred in significantly fewer C-ADR patients that ACDF patients through 24 months in the Mobi-C (2-level) IDE trial (RD -18.3% (95% CI -28.6%, -8.0%)) (Table 68).175 When these events were stratified by the likelihood of their relationship to the device, there was no difference between groups in those considered definitely device-related, while those considered to be possibly device-related were significantly less common with C-ADR (Table 68).

WA – Health Technology Assessment December 19, 2016
Artificial disc replacement – Re-review: Final evidence report Page - 195
Secondary Surgery at the Adjacent Level In the Mobi-C (2-level) IDE trial Secondary surgery at the adjacent level (either alone or in addition to that at the index) was slightly less common in the C-ADR group compared to the ACDF group through 24 months, though the difference was not statistically meaningful (RD -2.9% (-6.8%, 0.9%)) (Table 68).175 When measured through 60 months, the difference achieved statistical significance such that these events were performed in considerably fewer C-ADR than ACDF patients (RD -8.0% (-14.5%, -1.5%)) (Table 68).78 Any Adverse Event The Mobi-C (2-level) IDE trial 24 months found that the C-ADR group had a slightly lower risk of experiencing any adverse event compared with the ACDF group, although the difference was not statistically meaningful (RD -5.9% (-11.6%, -0.2%)) (Table 68).175 A complete list of all adverse events reported in both trials are available in Appendix Tables N8 and N9. Aside from secondary surgeries (as discussed above), all adverse events occurred similarly between groups with two exceptions: in the Mobi-C (2-level) IDE trial, spinal events and neck (neurological) adverse events were less common in the C-ADR group than in the ACDF group through 24 months (Appendix Table N8).38 Table 68. C-ADR vs. ACDF (2-level): Summary of Adverse Events from RCTs
Outcome Study F/U ADR % (n/N)
ACDF % (n/N)
RD (95% CI)* p-value*
Secondary surgery at the index level Any secondary surgery at index level†
Mobi-C IDE trial (2-level) (Davis 2013)
0-24 mos.
3.1% (7/225)
11.4% (12/105)
-8.3% (-14.8%, -1.8%) <0.01
Device failure or removal
Cheng 2009 0-24 mos.
0% (0/31) NR NC NC
Any secondary surgery at index level‡
Mobi-C IDE trial (2-level) (Jackson 2016)
0-60 mos.
4.7% (11/234)
12.4% (13/105)
-7.7% (-14.5%, -0.8%) 0.01
Serious/major adverse events Serious adverse event§
Mobi-C (2-level) IDE trial (FDA SSED)
0-24 mos.
24.4% (55/225)
32.4% (34/105)
-7.9% (-18.5%, 2.6%) 0.13
Device-related adverse events Device-related adverse event**
Mobi-C (2-level) IDE trial (FDA SSED)
0-24 mos.
16.0% (36/225)
34.3% (36/105)
-18.3% (-28.6%, -8.0%) <0.01
Definitely related to the device**
Mobi-C (2-level) IDE trial (FDA SSED)
0-24 mos.
4.0% (9/225)
4.8% (5/105)
-0.8% (-5.6%, 4.1%) 0.75
Possibly related to the device**
Mobi-C (2-level) IDE trial (FDA SSED)
0-24 mos.
15.1% (34/225)
32.4% (34/105)
-17.3% (-27.4%, -7.2%) <0.01
Secondary surgery at an adjacent level Secondary surgery at an adjacent level††
Mobi-C (2-level) (FDA SSED)
0-24 mos.
0.9% (2/225)
3.8% (4/105)
-2.9% (-6.8%, 0.9%) 0.065
Secondary surgery at an adjacent level††
Mobi-C IDE trial (2-level)
0-60 mos.
3.4% (8/234)
11.4% (12/105)
-8.0% (-14.5%, -1.5%) <0.01

WA – Health Technology Assessment December 19, 2016
Artificial disc replacement – Re-review: Final evidence report Page - 196
Outcome Study F/U ADR % (n/N)
ACDF % (n/N)
RD (95% CI)* p-value*
(Jackson 2016)
Any adverse event Any adverse event‡‡ Mobi-C (2-
level) IDE trial (FDA SSED)
0-24 mos.
89.3% (201/225)
95.2% (100/105)
-5.9% (-11.6%, -0.2%) 0.08
* Calculated by SRI. † Numbers include patients who had surgery at the index level alone or in addition to the adjacent level. ‡ Data includes procedures at index level alone or that involved both the index and adjacent levels: 2 C-ADR and 9 ACDF
patients underwent secondary procedures that involved both the index and adjacent levels; totals do not include 6 patients in the ACDF group who underwent plate removal as a result of adjacent-level indications only. Denominator used by Jackson 2016 included 9 non-randomized training cases in the ADR group. (225 vs. 234); SRI was unable to obtain the number of procedures for the randomized patients only.
§ Serious adverse events met one or more of the following criteria: 1) resulted in death; 2) was life-threatening (immediate risk of death); 3) required inpatient hospitalization or prolonged hospitalization; 4) resulted in persistent or significant disability or incapacity; 5) necessitated medical or surgical intervention to preclude permanent impairment of a body function or permanent damage to a body structure; or 6) was a congenital anomaly or birth defect. Reported events included: anatomy/technical difficulty, cancer, cardiovascular, death, dysphagia/dysphonia, gastrointestinal, infection (systemic or local), malpositioned implant, migration of implant, neck and/or arm pain, neurological, non-union, other, other pain, respiratory, spinal disorder, trauma, upper extremity nerve entrapment, urogenital, non-infectious wound issue (hematoma, CSF leakage).
** Classified by the Clinical Events Committee as possibly or definitely related to the device, and included anatomy/technical difficulty, dysphagia/dysphonia, gastrointestinal, heterotopic ossification, malpositioned implant, neck and/or arm pain, neurological, non-union, other, other pain, respiratory, spinal disorder, trauma.
†† Secondary surgery at an adjacent level alone or in addition to the index levels. For 60 month data, the denominator used by Jackson 2016 included 9 non-randomized training cases in the ADR group. (225 vs. 234); SRI was unable to obtain the number of procedures for the randomized patients only.
‡‡ Trial-reported totals only. Adverse events reported in non-randomized comparative studies One of the two prospective cohort studies included in Key Question 1 reported on adverse events (Hou 2014, N=225). The authors reported no difference between C-ADR and ACDF groups in any complication, with patients followed through a mean of 24 (range, 12-27) months. Device-related events reported included dysphagia (9.4% vs. 11.4%), migration (0% vs. 1.1%), and subsidence (0% vs. 2.3%). The percentage of patients who had any complication was statistically similar between groups (21.9% vs. 29.5%); other adverse events occurred in 0-3.1% of C-ADR patients and in 0-3.4% of ACDF patients (Appendix Table N11).74 No data were reported on serious/major complications (including death).
4.2.3.3 C-ADR vs. Fusion: Mixed levels (1-, 2-, or 3-level) Adverse events reported in RCTs Both RCTs that compared C-ADR with ACDF at one, two, or three levels29,151 (but did not stratify results based on the number of levels treated) reported safety data. Adverse events are summarized below; complete lists of all adverse events reported by study are available in Appendix N. Secondary Surgery at the Index Level The incidence of secondary surgery at the index level was similar between groups through 24 or 36 months as reported by both trials (Table 69).29,151 Serious/Major Adverse Events

WA – Health Technology Assessment December 19, 2016
Artificial disc replacement – Re-review: Final evidence report Page - 197
No overall summary of serious adverse events was reported by either trial; and no complications were reported that were clearly considered to be serious by the authors.29,151 Device-Related Adverse Events No overall summary of device-related adverse events was reported by either trial. With the exception of dysphagia, which was less common in the C-ADR group than in the ACDF group (Skeppholm: 11.8% vs. 19.9% through 24 months, p=0.31; Cheng 2011: 2.4% vs. 16.7% through 36 months, p<0.01), complications attributable to the device occurred similarly between groups, and occurred in relatively few patients (0-2.4% of the C-ADR group; 0% in the ACDF group) across both trials (detailed abstraction table available in Appendix Table N10).29,151 Secondary Surgery at an Adjacent Level One trial reported no difference between groups in the percentage of patients who underwent secondary surgery at an adjacent level through 24 months (Table 69).151 Any Adverse Event No overall summary of device-related adverse events was reported by either trial. With the exception of dysphagia (as discussed above in device-related adverse events), there were no significant differences in complications between groups (detailed abstraction table available in Appendix Table N10).29,151 Table 69. C-ADR vs. ACDF (Mixed levels (1-, 2-, or 3-level): Adverse Events
Outcome Study F/U ADR % (n/N)
ACDF % (n/N)
RD (95% CI)* p-value*
Secondary surgery at the index level Reoperation at index level
Skeppholm 2015
0-24 mos.
6.2% (5/81)
1.4% (1/70) 4.7% (-1.2%, 10.7%) 0.14
Second surgical procedure at the index level
Cheng 2011 0-36 mos.
0% (0/41) 0% (0/42) 0% (NC) 1.0
Secondary surgery at an adjacent level Secondary surgery at an adjacent level
Skeppholm 2015
0-24 mos.
2.5% (2/81)
2.9% (2/70) -0.4% (-5.6%, 4.8%) 0.88
* Calculated by SRI. Adverse events reported in non-randomized comparative studies All three of the non-randomized comparative studies included in Key Question 1 reported on adverse events.24,60,122 In addition, one administrative database study reported only on safety (but not effectiveness) outcomes (Nandyala 2014); the study evaluated 143,060 adults in the Nationwide Inpatient Sample (NIS) database who had undergone 1- or 2-level C-ADR (n=1830) or ACDF (n=141,230) between 2002 and 2009. Although patients treated with C-ADR were younger (46.4 vs. 51.1, p<0.01) and had fewer comorbidities (Charlson Comorbidity Index: 1.4 vs. 2.0), differences were controlled for using multivariate regression analysis.115 This study met 6 of the 12 criteria of a high-quality administrative database study (Appendix Table EZ); additional detail on this study is available in Appendix Table H6. The retrospective cohort studies reported limited data on complications, and found no difference between groups in any adverse event, including: secondary surgery or dysphagia through 12 months;24
WA – Health Technology Assessment December 19, 2016
Artificial disc replacement – Re-review: Final evidence report Page - 198
and implant failures (migrations, dislocations, subsidence) or approach- or device-related complications through 24 months (Appendix Table N13).122 The registry study reported that complications attributed to the index procedure occurred in fewer C-ADR than ACDF patients at 12 months (19.0% vs. 26.1%, p>0.05) and at 24 months (7.0% vs. 23.0%, p=0.045), however the latter time point had follow-up data available from less than 50% of the patient population. There were no differences between groups in the rate of perioperative complications, secondary surgery at the index or any other level (Appendix Table N13).60 The administrative database study115 (Nandyala 2014) found that the overall rate of in-hospital complications was slightly lower in C-ADR (n=1830) than ACDF (n=141,230) patients, although the difference did not reach statistical significance (31.9 vs. 40.0 cases per 1000 patients, unadjusted p=0.058). There was no difference between groups in the incidence of any individual in-hospital adverse event (after controlling for baseline differences between groups, including: dysphagia (19.2% vs. 23.2%), pulmonary embolism (0.5% vs. 0.8%), deep vein thrombosis (2.2% vs. 2.4%), infection (2.2% vs. 3.6%) cardiac (3.3% vs. 3.1%), hematoma (2.2% vs. 5.0%), cerebrospinal fluid leak (0.5% vs. 0.2%), and neurological complications (1.6% vs. 1.7%). In addition, the in-hospital mortality rate was similar between C-ADR and ACDF groups (0.5 vs. 2.2 per 1000 cases, adjusted p=0.57) (Appendix Table N13).115
4.2.3.4 C-ADR vs. ACDF with a zero-profile device: 2 non-contiguous levels Adverse events reported in RCTs The single RCT that compared C-ADR with ACDF plus a zero-profile device in patients with spondylosis at two non-contiguous cervical levels130 reported on adverse events. Adverse events are summarized below; complete lists of all adverse events reported by study are available in Appendix N. Secondary Surgery at the Index Level No data reported. Serious/Major Adverse Events No overall summary of serious adverse events was reported by either trial; and no complications were reported that were clearly considered to be serious by the authors.130 Device-Related Adverse Events No overall summary of device-related adverse events was reported; all events attributable to a device occurred similarly between C-ADR and ACDF with a zero-profile device groups (range of rates: 0-7.1% vs. 0-6.3%) (see Appendix Table N11).130 Secondary Surgery at an Adjacent Level No data reported. Any Adverse Event No overall summary of device-related adverse events was reported; all events occurred similarly between groups (see Appendix Table N11).130

WA – Health Technology Assessment December 19, 2016
Artificial disc replacement – Re-review: Final evidence report Page - 199
4.3 Key Question 3: Differential Efficacy and Harms in Subpopulations
4.3.1 Number of studies retained For this key question, RCTs that stratified on baseline patient characteristics and evaluated effect modification were sought. Subgroups of interest included (but were not limited to): age, sex, race, ethnicity, socioeconomic status, payer, and worker’s compensation. All RCTs included to evaluate the efficacy or safety of PRP or ABI versus comparators of interest were assessed.
4.3.2 C-ADR vs. Fusion No studies were identified that formally stratified on any patient characteristics in such a way that effect modification could be evaluated. Two post hoc analyses were identified that evaluated outcomes from patient subgroups (workers’ compensation158 and myelopathy139 patients) from two IDE trials that compared 1-level C-ADR to ACDF, and one RCT was identified that evaluated the impact of these treatments in tetraplegic patients with degenerative disc disease and symptoms of radiculopathy.143 The results from these studies are briefly summarized below. Steinmetz et al. conducted a post hoc subgroup analysis of all workers’ compensation patients from the Prestige ST and Bryan IDE trials.158 Less than 10% of patients across both trials (93/1004) were enrolled in this type of payer program, half of which received C-ADR (n=47) and ACDF (n=46). While there were no statistically significant differences in baseline characteristics between groups, there were some differences which may be large enough to confound results: the C-ADR was comprised of fewer males (48.9% vs. 69.6%, p=0.058) and patients who used alcohol (27.7% vs. 45.7%, p=0.087); moreover, C-ADR patients had a lower mean body weight (176.9 vs. 192.5, p=0.063). At baseline, approximately 20% of patients were involved in litigation (23.4% vs. 19.6% of C-ADR vs. ACDF patients), and a third of patients were working (36.2% vs. 32.6%, respectively). Post-operatively, fewer patients in the C-ADR group patients wore rigid collars (35% vs. 62%, p<0.01). At 24 months, there were no differences between C-ADR and ACDF groups in any efficacy outcome evaluated, including: mean NDI scores (~32 vs. ~36), neck pain scores (3.9 vs. 3.9), arm pain scores (3.1 vs. 3.6), SF-36 PCS scores (42.5 vs. 38.1), SF-36 MCS scores (46.2 vs. 44.6), or return to work (63% vs. 53%, p=0.39). Of the patients working up to the time of surgery, the median time to return to work was lower in the C-ADR group (75 vs. 99 days, p=NR); while results across all patients similar showed a similar trend (median 101 vs. 222 days), the difference was not significant after controlling for sex, work status at baseline, and trial (p=0.105). In terms of safety outcomes, C-ADR and ACDF groups had similar rates of all adverse events evaluated: revision (0% vs. 0%), removal (2.1% vs. 8.7%, p=0.203), supplemental fixation (0% vs. 6.5%, p=0.117), reoperation (4.3% vs. 0%, p=0.494), neurological adverse events (data NR, p>0.05), and pain-related adverse events (data NR, p>0.05). Overall, the results suggest no differences between C-ADR and ACDF in a workers’ compensation population; however, a larger trial that formally evaluates whether workers’ compensation status modifies efficacy or safety results is needed to validate these conclusions.158 Riew et al. performed a post hoc subgroup analysis of myelopathy patients enrolled in the Prestige ST and Bryan IDE trials.139 Approximately 20% of the total patient population across both trials had cervical myelopathy (199/1007) and were distributed evenly across C-ADR (n=106) and ACDF (n=93) groups. Groups were comparable in all baseline characteristics examined (age, sex, tobacco use, work status, workers’ compensation, and litigation status). At 24 months, there were no significant differences between groups in NDI success (i.e., improvement of ≥15 points from baseline, data NR), patient satisfaction, or neurological success. Other efficacy results for myelopathy patients were different

WA – Health Technology Assessment December 19, 2016
Artificial disc replacement – Re-review: Final evidence report Page - 200
between the trials: while the Prestige ST IDE trial had similar NDI, neck pain, arm pain, SF-36 PCS, and SF-36 MCS scores between groups, the Bryan IDE trial found that C-ADR was associated with greater improvements in all of these outcome measures. No overall conclusions were provided for myelopathy patients across both trials, however. In terms of adverse events, secondary surgery at the index level was performed in a similar percentage of C-ADR and ACDF patients (1.9% vs. 3.2%), however implant-related complications (not defined) occurred in significantly fewer C-ADR than ACDF patients (0.9% vs. 8.6%, p=0.01).139 One small RCT (Rohl 2009) was identified that compared C-ADR (ProDisc-C) to ACDF (iliac crest autograft) in tetraplegic patients with degenerative disc disease and radicular pain; the level of paralysis ranged from C5 to C7.143 The number of levels treated was not reported. Mean age was 46 years (range, 28-53 years), and half of patients were male. The study was considered to be at moderately high risk of bias (Appendix Table E5). At six months, the C-ADR and ACDF had similar clinical outcomes, including NDI scores (21 vs. 22), “neurological remission” of radicular symptoms (data not reported), and SF-36 mental health functioning scores (64 vs. 62). No other clinical outcomes of interest were reported.143
4.4 Key Question 4: Cost effectiveness
4.4.1 Number of studies retained For L-ADR, three cost utility analyses (CUA) met the inclusion criteria,54,82,119 one evaluated 1 or 2 -level L-ADR versus fusion54 and one which did not specify the number of levels compared L-ADR with various types of fusion,119 and the third compared 1 or 2 level L-ADR with multidisciplinary rehabilitation (MDR).82 For C-ADR, six cost utility analyses (CUA) met the inclusion criteria, four of which compared 1-level C-ADR to ACDF,92,102,131,133 while two studies compared 1-level C-ADR to ACDF.4,5 No studies were identified which compared C-ADR to non-surgical treatment.
4.4.2 Lumbar Spine
4.4.2.1 L-ADR vs. Fusion: 1- or 2-level or levels not specified Study characteristics: Two cost-utility analyses compared L-ADR with fusion in patients with chronic low back pain due to degenerative disc disease who had failed nonoperative care.54,119 One industry-funded study conducted in Sweden compared 1 or 2-level L-ADR with fusion.54 The other study was funded by the Australian Department of Health and employed claims data for 2,749 patients (L-ADR n = 219, fusion n = 2,418, combination of L-ADR and fusion n = 111).119 The Australian study did not specify the number of levels treated from the administrative data and compared L-ADR with different types of fusion. Study characteristics, results and conclusions are summarized in Table 70. The Swedish study employed probabilistic bootstrapping methods and reported incremental cost-effectiveness ratios (ICER) as well as Net Monetary Benefit (NMB) for both societal and healthcare perspectives.54 The Australian study did Markov modeling to determine ICERs from a healthcare perspective.119 Each did one-way sensitivity analysis as the sole method of testing the robustness of their results.

WA – Health Technology Assessment December 19, 2016
Artificial disc replacement – Re-review: Final evidence report Page - 201
Both studies reported the clinical effectiveness in terms of quality-adjusted life years (QALY), the values for which were derived from RCTs. The Swedish study used outcomes data, including EQ-5D utility information, from the Berg 2009 RCT13 (moderately high risk of bias) included in the current report (N = 152). Clinical outcomes included ODI, back pain VAS and a 5 category success measure based on pain relief. The Australian study employed utility weights from the Berg 2009 trial and outcome frequency data from FDA IDE trials of L-ADR (both were considered at moderately high risk of bias) for the Charite18 and ProDisc-L194 devices which are also included in this current report as well as data from other RCTs. The Australian study authors indicate that a systematic review and meta-analysis were done to provide outcomes data, but details of the analyses are limited and not clearly reported. Clinical outcomes included clinical success based on FDA criteria, ODI success (≥25% improvement) and narcotic use. Costs were reported in 2006 Swedish Krone and 2011 Australian Dollars (which are presented here in that same years equivalent US dollar value). Both studies employed a 24 month time horizon, one evaluated discounting as part of sensitivity analysis54; the other did not discount citing the short follow-up time as a rationale.119 Both focused on direct costs. In the Australian study, cost data primarily came from the Australian Medicare Benefits Schedule and expert opinion. The cost of pre-surgical care, initial surgery, hospital costs, post-surgery follow up and any associated reoperation cost were included.119 In the Swedish study,54 direct costs for diagnostic tests/imaging, index procedure/episode, complications, medication costs and primary care we captured. In addition, Australian authors report indirect costs for care by relatives and reimbursement for sick leave were captured to evaluate the societal perspective. In both studies, reoperation was the primary harm evaluated. Two reviewers assessed the quality of the CUA using the Quality of Health Economic Study (QHES) metric. Both economic analyses were considered to be of moderate quality based on QHES evaluation, with QHES scores ranging from 81 to 86. (Table 70; see Appendix Table E9 for full scoring details). Primary study limitations included lack of discounting in primary analyses and inadequate discussion of study/model limitations or potential sources and direction of bias; the scope and details of sensitivity analysis were limited in the Swedish study and not well described in the Australian study. Results Base Case In the Swedish study,54 from a societal perspective L-ADR was determined to cost $81,241 and $108,309 (Average = $94,775) and estimated to provide 1.29 additional QALY (($108,309/1.29QALY = $83,960/QALY). The societal cost of fusion was $92,942 and from a strictly healthcare point of view $23,136. Clinical superiority of either treatment based on VAS for pain, ODI or SF-36 was not demonstrated in the Berg Trial, although they do report significantly more patients in the L-ADR group were “totally-pain free” after 24 months. The authors of the cost utility study noted the insignificant differences between the two treatments leading to an ICER of $252,519 and consider it not meaningful given no difference in EQ-5 D between L-ADR and fusion. There was no significant difference in society costs through 24 months. Based on probabilistic analysis, the net benefit was reported to be $12,366 but the confidence interval was large (95% CI $-9,970to $33,755); authors concluded that L-ADR was not a cost-effective strategy. In the Australian study, the cost-effectiveness of L-ADR was dependent on the outcome used for effectiveness. The total healthcare cost in USD for L-ADR was $22,933 and when grouping all the fusion approaches together the cost was $24,716 for fusion. The cost per QALY gained when using L-ADR was $17,374. The cost per QALY gained using fusion was not reported. The incremental cost effectiveness was presented for based on EQ-5D and three primary clinical outcomes (overall success, ODI success and

WA – Health Technology Assessment December 19, 2016
Artificial disc replacement – Re-review: Final evidence report Page - 202
narcotic use). There was no difference in treatment with respect to QALYs, thus an ICER based on EQ-5D was not provided. L-ADR dominated fusion (it was less costly and more effective) with respect to cost/discontinuation of narcotics and cost/overall success. In terms of cost/ODI success L-ADR was less costly and less effective with an estimated cost of $73,038 per additional QALY gained by fusion. Sensitivity Analyses One-way sensitivity analysis was reported in both studies. In the Swedish study,54 reoperation was more common in the fusion group (due to implant removal), thus its exclusion in sensitivity analysis resulted in diminishing the cost differences between L-ADR and fusion favoring fusion from a healthcare perspective; there was no effect from the societal perspective. Discounting at 3% resulted in a small cost advantage for L-ADR. In the Australian study,119 although authors indicate sensitivity analysis was done, details are not clearly reported; it appears to have been primarily related to comparison of different types of fusion with L-ADR (which is not part of the scope of this HTA) to assess cost effectiveness. They also evaluated various clinical outcomes as measures of effectiveness as previously described. Conclusions and Limitations Results across the two moderate quality studies are mixed with regard to the cost-effectiveness of L-ADR versus fusion. In the Swedish study,54 although L-ADR was somewhat less costly (particularly when reoperation costs were excluded) differences in EQ-5D, ODI, VAS for pain or SF-36 were not significant, thus an ICER is not meaningful suggesting L-ADR is as effective as fusion. Based on a net benefit approach, authors state that L-ADR could not be demonstrated to be cost-effective. The same findings for EQ-5D were reported in the Australian study.119 Results from other effectiveness outcomes suggest that L-ADR may be less costly. The ICER was dependent on which clinical outcome was chosen. Although L-ADR dominated fusion when overall clinical success and narcotic discontinuation were the outcomes, it was less costly but also less effective than fusion when ODI success was the outcome. One limitation of these studies is their applicability to practice in the United States; the medical systems, pricing and costs of care in the U.S. differ from those in Sweden and Australia. Both studies used data from RCTs that were considered to be at moderately high risk of bias. Neither study provided detail about sensitivity analyses, particularly related to the impact of factors that may be driving the results or major adverse events, even though both did account for re-operation. A general consensus in both studies and a common limitation noted was the necessity for a longer follow-up period to better evaluate the impact of the treatments on factors that may impact need for future surgical intervention and productivity.
4.4.2.2 L-ADR vs. Fusion and Multidisciplinary Rehabilitation: 1 or 2-level Study characteristics: One study from Norway evaluated the cost-effectiveness of L-ADR versus multidisciplinary rehabilitation (MDR).82 This study from Norway evaluated the cost-effectiveness of 1 or 2 level L-ADR versus multidisciplinary rehabilitation (MDR) in patients with chronic low back pain due to DDD who had failed structured physical therapy or chiropractic care.82 Rehabilitation was delivered for approximately 60 hours over three to five weeks and consisted of education, physical activity, and challenging patient thoughts regarding physical activity. Study funding came from Jönköping län grant funds and the South Eastern Norway Regional Health Authority and EXTRA funds from the Norwegian Foundation for Health and

WA – Health Technology Assessment December 19, 2016
Artificial disc replacement – Re-review: Final evidence report Page - 203
Rehabilitation, through the Norwegian Back Pain Association funds. The average age ranged between 39 and 41-years-old. Study characteristics, results and conclusions are summarized in Table 70. Bootstrapping methods were used to calculate ICERs and net monetary benefits and address uncertainty; 2000 bootstrap estimates for the ICER were obtained and plotted. A follow-up time horizon of 24 months was used; authors cite the short follow-up time as a rationale for not discounting. The analysis was from a societal perspective. The study reported the clinical effectiveness in terms of quality-adjusted life years (QALY) based on EQ-5D and SF-6D. Data were derived from the Hellum multicenter RCT (N = 173, moderately high risk of bias) which is included in this HTA report. Costing was based on 2012 Norwegian Krone which was converted to USD by Spectrum. Index treatment/episode, primary care, loss of production for patients and relatives and hospital costs were included and appear to be in part based on actual patient costs from the trial as well as the Statistics Norway, prosthesis manufactures and various literatures sources related to rehabilitation and low back pain. One-way sensitivity analyses were performed using both the EQ-5D and SF6-D and included comparison of ITT and per-protocol analyses, analysis without imputing missing data, varying estimate of production loss and excluding the costs of care provided by relatives. The quality of the study was assessed by two reviewers using the Quality of Health Economic Study (QHES) metric with a score 87/100 (Table 70; see Appendix Table E9 for full scoring details). The primary limitation was failure to describe or incorporate information on potential adverse events for L-ADR in particular. As noted in the safety section of this HTA, reoperation occurred in 6.5% of L-ADR recipients and treatment related complications occurred in 7.8% of patients. The 24 month follow-up time as with the other economic studies for L-ADR may be short. Results Base Case MDR was estimated to cost $91,614 and add 0.95 QALYs implying the additional cost per QALY to be $96,436. The cost difference per patient between L-ADR and MDR was $10,676 (95% CI $-8,742 to $26,027) but appears to have substantial variability as noted in the wide confidence interval. Compared with L-ADR, MDR yielded an ICER of $49,132 based on data from the EQ-5D. Sensitivity Analysis One-way sensitivity analysis revealed the following: 1) Using SF 6D, L-ADR was no longer cost-effective with an ICER of $158,514/QALY and authors point out fundamental differences between the two measures with regard to psychometric properties including sensitivity to change. 2) L-ADR was no longer cost-effective when per-protocol analysis was done; 3) When multiple imputation was not used, it appears that missing values are not at random; 4) Changing the cost of lost days did not substantially impact cost-effectiveness; and 5) When cost for relatives providing care were excluded, the likelihood of L-ADR being cost effective increased. Conclusions and Limitations The cost effectiveness of L-ADR appears to be dependent on the utility measure used. Compared with multidisciplinary rehabilitation, L-ADR appears to be a cost effective alternative given a willingness to

WA – Health Technology Assessment December 19, 2016
Artificial disc replacement – Re-review: Final evidence report Page - 204
pay greater than $49,132 based on utilities derived from the EQ-5D. The probability of L-ADR being cost effective was 90% when this measure was used. By contrast, when SF-6D utilities were used, L-ADR no longer appeared to be cost effective and authors estimate that the chance of L-ADR being cost effective form a societal perspective was 40%, i.e. not cost effective The primary limitation was failure to describe or incorporate information on potential adverse events for L-ADR in particular. In addition, the health care system in Norway and costs likely differ substantially from those in the U.S, possibly limiting the applicability of the findings to the U.S. system. Overall reporting and execution of this study was good as reflected in the QHES score of 87 suggesting high quality. Table 70. Summary of Economic Evaluation Study Characteristics and Results: L-ADR vs. Fusion or Multidisciplinary Rehabilitation
L-ADR vs. Fusion L-ADR vs. Rehabilitation Fritzell 2011 Parkinson 2013 Johnsen 2014 Population 1 or 2-levels CLBP>1yr
from DDD who failed nonoperative treatment. mean age: 39.4 years
Number of levels not specified; Patients with symptomatic CLBP due to DDD who failed nonoperative treatment; based on Australian Medicare Benefits Schedule claims data for the following procedures: 219 L-ADR, 2,418 fusion, 111 combination of L-ADR and fusion
1 or 2-levels with CLBP >1yr due to DDD who had failed nonoperative or chiropractic care ; mean age: 40.9 years
Intervention(s) L-ADR Charite, ProDisc, or Maverick prostheses
L-ADR (devices not specified) L-ADR (ProdDisc L)
Comparator(s) Fusion PLF or PLIF Fusion: PLF, PLIF, ALIF, COMB (ADR + Fusion), CIRC
Multidisciplinary Rehab (MDR) 60 hours over 3-5 weeks
Country Sweden Australia Norway Funding Sponsored by DePuy
Spine, Synthes, and Medtronic
Australian Dept. of Health Grant –Norwegian Back Pain Association; Authors note relevant financial activities related to consultancy, payment for lectures and grants.
Study design CUA CUA CUA Perspective Societal and Healthcare Healthcare Societal Time horizon 24 months 24 months 24 months Analytic model
Bootstrapping; Incremental Net Monetary Benefit (NMB)
Markov Model Bootstrapping; Based on Hellum RCT; Net Monetary Benefit (NMB)
Effectiveness outcome
QALY QALY QALY
Effectiveness outcome Components
Utility values fromEQ-5D; other outcomes ODI, Back pain VAS, and 5-category patient reported success measure based on pain relief
Utility values: EQ-5D; other outcomes; reoperation, narcotic use, ODI, clinical success
Utility values: EQ-5D, SF-6D used for comparison

WA – Health Technology Assessment December 19, 2016
Artificial disc replacement – Re-review: Final evidence report Page - 205
L-ADR vs. Fusion L-ADR vs. Rehabilitation Fritzell 2011 Parkinson 2013 Johnsen 2014 Source for effectiveness data
RCT (Berg 2009, N = 152); authors state outcome data taken from Swedish Spine Register: unclear which data were taken from each source
Published Literature: Berg 2009 for Utility weights (N = 152); FDA IDE RCTs (Charite, ProDisc-L,) for efficacy data
Multicenter RCT: Hellum 2011 (N=173)
Costing year 2006 2011 2012 Currency* Swedish SEK Australian $ Norwegian Krone Cost sources Statistics Sweden
Stockholm Spine Center Study Center Patient cost diary FASS (Drug prices)
Australian Medicare Benefits Schedule Expert Opinion
L-ADR: Resource Use x Unit cost; Statistics Norway, prosthesis manufactures and various literatures sources For MDR: Top-down approach for determining spine clinic costs†
Components of cost data
Direct (healthcare resources) and Indirect cost (absenteeism from work). Direct costs: Diagnostics/imaging, index episode/procedure, complications, medications, primary care; Indirect cost patient caregiver time, sick leave reimbursement
Pre-surgery, initial surgery hospital costs, post-surgery F/U and reoperation cost
Index treatment, hospital care, primary care, private patient costs, loss of production;
Discounting 3% in sensitivity analysis; was a significant factor
Notes short f/u time as rationale for not discounting
Short f/u time as rationale for not discounting
Sensitivity analysis
3 Alternative One-way SA
• Exclusion of reoperation costs,
• 3% per annum discount
• Inpatient costs for rehabilitation post op
Specific parameters not described
Four One-way SA
• Per protocol analysis presented in sensitivity analysis
• Analysis without multiple imputation
• Varying estimates of production loss
• Excluding cost of care provided by relatives
QHES 86/100 81/100 87/100 Results: Cost / QALY of L-ADR
-Converted to 2006 USD- Societal: $81,241/ NR Healthcare: $20,020 / NR
AU$23,117 ($22,933) / 1.32 = $17,374
€87,622 ($108,309)/ 1.29 =$83,960/QALY
Cost / QALY of comparator
Societal: $92,942 / NR
Fusion Overall: AU$24,716 ($24,519) / NR
€74,116 ($91,614) / 0.95 = $96,435/QALY

WA – Health Technology Assessment December 19, 2016
Artificial disc replacement – Re-review: Final evidence report Page - 206
L-ADR vs. Fusion L-ADR vs. Rehabilitation Fritzell 2011 Parkinson 2013 Johnsen 2014
Healthcare: $ 23,136/ NR
ICER
Authors report an ICER of $252,519 and consider it not meaningful given no-difference in treatment outcome based on EQ-5D. No significant societal cost difference at2 years;
Based on net benefit approach, L-ADR could not be demonstrated to be cost effective vs. fusion.
Depends on efficacy outcome for L-ADR vs. any type of fusion:
• Cost/QALY gained: not calculated; No difference between treatment in QALYs
• Cost/ODI Success (≥25% improvement): $73,662 (L-ADR less costly, but less effective than fusion)
• Cost/overall success (FDA definition): L-ADR dominates-less costly, more effective than fusion
• Cost/narcotic discontinuation: L-ADR dominates (less costly, more effective)
€39,748 /QALY ($49,132/QALY) based on EQ-5D
Model SA NR NR NR One-way SA
• Exclusion of all reoperation cost: resulted in reducing cost difference between treatments favoring L-ADR. Non-significant from societal, but significant from healthcare perspective
• Assuming 3% discount per F/U year: gave L-ADR a small but significant cost advantage
• Limited information presented for comparison of interest for this HTA; L-ADR vs. any fusion); Analyses based on different outcomes reflected in ICERs above
• Using SF-6D (EQ-5D listed above) yields ICER of €128,238/QALY ($158,514/QALY)
• For Per protocol analysis TDR was not cost effective regardless of outcome measure.
• Not using multiple imputation suggests missing cannot be assumed to be random
• Changing cost of lost day didn’t have large impact.
• Excluding cost of relatives providing care increased likelihood of L-ADR being cost effective
Two-way SA NR NR NR Probabilistic SA
NR NR NR
Author’s Conclusion
Inconclusive. However, reoperation rates cause fusion to be more costly
ICER depends which efficacy outcome is considered and type of fusion compared. ADR is
L-ADR is a cost-effective alternative to MDR when QALY’s measured with EQ-5D

WA – Health Technology Assessment December 19, 2016
Artificial disc replacement – Re-review: Final evidence report Page - 207
L-ADR vs. Fusion L-ADR vs. Rehabilitation Fritzell 2011 Parkinson 2013 Johnsen 2014
from a healthcare perspective. Cost should be monitored over longer period of time.
potentially cost saving compared with lumbar fusion, depending on the outcome. Further research and longer follow-up are necessary before drawing firm conclusions.
but was not cost effective based on SF-6D. However, L-ADR is not cost-effective when using SF-6D. Longer follow-up is needed
ALIF: anterior lumbar interbody fusion; CLBP: chronic low back pain; COMB (ADR + Fusion); CIRC: circumferential fusion; COMB: ADR + Fusion; CUA: cost utility analysis; DDD: degenerative disc disease; EQ-5D: EuroQoL 5 Dimensions; FDA: U.S. Food and Drug Administration; F/U: follow-up; ICER: Incremental cost-effectiveness ratio; L-ADR: lumbar artificial disc disease; ODI: Oswestry Disability Index; QALYs: Quality-adjusted life years; MDR: multidisciplinary rehabilitation; NR: not reported; PLF: posterior lumbar fusion; PLIF: posterior lumbar interbody fusion; SA: sensitivity analysis; SF-6D: Short Form 6 dimensions; VAS: visual analog scale. * Exchange Rates Used: 1USD = 0.809 EURO in 2012, 1USD = 1.008 AU$ in 2011 https://www.irs.gov/individuals/international-taxpayers/yearly-average-currency-exchange-rates; 1USD = 7.38 SEK as cited in Fritzell 2010. † The total cost of a spine clinic was estimated, and then how much of the clinic's costs were associated with MDR was determined. A consequence of this approach is that the costs are the same for all patients.
4.4.3 Cervical Spine
4.4.3.1 C-ADR vs. Fusion: 1-level Study characteristics: Four CUAs92,102,131,133 evaluated the cost effectiveness of C-ADR versus ACDF, one of which delineated between four different types of cervical discectomy (with and without fusion).92 The primary population was patients suffering from 1-level symptomatic disc disease with radiculopathy and who were unresponsive to conservative treatment. Three studies modeled results from hypothetical cohorts, which had a mean age ranging from 40 to 45,92,102,131 while the remaining study used patients enrolled in the ProDisc-C IDE trial.133 Study characteristics, results and conclusions are summarized in Table 71. All four studies were conducted in the US. Two reported that no funding was received92,102; the other two did not clearly report funding, but authors of both studies had relationships with industry.131,133 Three of the studies assumed a payer perspective102,131,133 and while the fourth stated that a societal perspective was used, only limited indirect costs were used.92 Time horizons were 60 months,92,102 84 months,133 and lifetime.131 Regarding the analytic models used, one study calculated the incremental net monetary benefit (NMB) and standard errors using Monte Carlo simulations with bootstrapping,133 while the other three studies used either decision tree analysis92,131 or a Markov process model102 to compute incremental cost effectiveness ratios (ICERs). Two of the studies relied solely on one-way sensitivity analysis to test the robustness of their results.102,131 A third study used a probabilistic approach to sensitivity analysis,92 while the forth used scenario analysis- letting several parameters vary simultaneously- along with NMB regression to adjust for possible baseline differences across groups.133 All studies reported the clinical effectiveness in terms of quality-adjusted life years (QALY), the values for which were derived from RCTs (ProDisc-C, Prestige ST, BRYAN, and/or Kineflex C IDE trials) in three studies102,131,133 and from case series in one study.92 Utility values were derived from SF-36 scores as well as other outcomes such as NDI scores, neurological status, range of motion, complications, and reoperation rates.

WA – Health Technology Assessment December 19, 2016
Artificial disc replacement – Re-review: Final evidence report Page - 208
Costs were reported in 2010 to 2014 US Dollars. Direct costs were the primary focus in all four studies. In three of the four studies a discounting rate of 3% was applied102,131,133; discounting was unreported in the fourth.92 Several sources were cited for obtaining the cost data, and commonly included Medicare reimbursement rates. Other cost sources included FDA Adverse Events (AE) data, Truven Marketscan Commercial Claims and Encounters Data, Nationwide Inpatient Sample (NIS), and direct hospital inquiry. All studies included the costs of index and secondary surgeries, while the costs of hospitalization were included in three and those of outpatient care were included in two. The quality of the CUAs were assessed using the Quality of Health Economic Study (QHES) metric. The average across the four studies was 75/100 (range: 62 to 91) (Table 71; see Appendix Table E10 for full scoring details). Limitations included inadequate details provided regarding the analytical perspective used,92,131 data abstraction methodology,102,131 and the funding source.131,133 Other limitations included failure to employ the highest quality effectiveness data available,92 perform incremental analysis between resource and cost alternatives,92 perform discounting,92 use sufficient cost data,102 include all relevant outcomes,92,133 clearly state methods of the economic model and how utility values were derived,131 and justify data used and choice of data sources.92 Results Base Case All four studies found that C-ADR was the dominant treatment, that is, C-ADR was less costly and more effective than ACDF – this conclusion held despite time horizons that ranged from 60 months to lifetime.92,102,131,133 Across all studies, C-ADR was found to be less expensive than ACDF with an average cost savings of $8,682. The mean overall cost of C-ADR was $41,028 (range, $11,987 – $102,274); in contrast, the mean overall cost of ACDF was $49,706 (range $16,823 – $119,814). In terms of QALYs gained, C-ADR was associated with a greater gain in QALYs than occurred with ACDF. C-ADR yielded gains that ranged from 2.84 to 4.52 QALYs per patient, while those gained from ACDF ranged from 1.92 to 4.79 QALYs. The overall cost per QALY (i.e., the dollar amount needed to produce one additional quality year of life) for C-ADR ranged from $3,042/QALY to $35,976/QALY, while that for ACDF ranged from $8,760/QALY to $42,617/QALY. One study reported the incremental net monetary benefit to be $20,679 (95% CI $6,053, $35,377), which any amount greater than zero implies C-ADR is cost effective assuming a willingness to pay (WTP) of $50,000.133 Sensitivity Analyses One-way sensitivity analysis was performed by two studies.102,131 If the willingness to pay (WTP) threshold was assumed to be $50,000 per QALY gained, then C-ADR was more cost effective than ACDF in the following scenarios: device survival was greater than 9.75 years,131 C-ADR’s utility was greater than 0.713102 or 0.796,131 ACDF’s utility value was greater than 0.747,102 C-ADR’s cost was less than $16,319131 or $20,486102, ACDF’s cost was less than $18,607,102 C-ADR’s complication rate was less than 4.37% or ACDF complication rate was greater than 2.2%,131 C-ADR revision rate was less than 27% at 60 months, C-ADR adjacent surgery rate was less than 10.5%, Further sensitivity analyses were conducted using scenario and NMB regression methods in one study.133 C-ADR was reported to remain cost effective when testing realistic variations of parameters such as age, sex, race, and baseline SF-6D scores. The largest mean NMB was $23,015 which accounted for secondary surgery loss of productivity. Conclusions and Limitations
WA – Health Technology Assessment December 19, 2016
Artificial disc replacement – Re-review: Final evidence report Page - 209
Overall, results from all four CUAs found that both C-ADR and ACDF were cost effective options based on a WTP threshold of $50,000. However, C-ADR was more effective and less costly than ACDF for 1-level disc procedures. One study found ACD (without fusion) to be the dominant intervention, which outperformed both C-ADR and ACDF. A general consensus in many of the studies and a common limitation noted was the necessity for a longer follow-up period. The complicated nature of estimating some of the necessary effectiveness and cost variables resulted in what some authors admit to be overly simplistic assumptions, particularly in terms of arriving at utility values for health states and/or determining greater encompassing health state possibilities. Nevertheless, given the nature of the unknown variables, the studies were relatively well-conducted as reflected in their QHES scores.

WA – Health Technology Assessment December 19, 2016
Artificial disc replacement – Re-review: Final evidence report Page - 210
Table 71. Summary of Economic Evaluation Study Characteristics and Results: C-ADR vs. ACDF (1-level) Radcliff 2016 Qureshi 2013 McAnany 2014 Lewis 2014
Population 1-level symptomatic DDD unresponsive to 12 weeks of conservative treatment (based on data from ProDisc-C IDE trial)
1-level cervical disc disease with radiculopathy (hypothetical cohort with a mean age of 45 years)
Acute disc herniation and associated myelopathy/ radiculopathy, failure of conservative treatment (duration not specified) (hypothetical cohort with a mean age of 40 years)
Adult with 1-level cervical DDD and radiculopathy with no previous surgery; no cervical kyphosis or hypermobility (hypothetical cohort)
Intervention(s) C-ADR C-ADR C-ADR C-ADR Comparator(s) ACDF ACDF ACDF ACDF-autograft,
ACDF-allograft, ACDF-w/spacer, or ACD (no fusion)
Country US US US US Funding NR† NR** No funding received No funding received Study design CUA CUA CUA CUA Perspective Payer Payer (assumed) Payer Claims societal: no
indirect Time horizon 84 months Lifetime 60 months 60 months Analytic model Monte Carlo
simulations with bootstrapping; Incremental Net Monetary Benefit (NMB) used (alternative method of representing ICER*)
Decision tree analysis
Markov Model Decision tree analysis
Effectiveness outcome
QALY QALY QALY QALY
Effectiveness outcome components
Utility values: SF-6D (converted from SF-36 data)
Utility values inferred using conclusions based on published data: SF-36, NDI, neurological status, range of motion, overall success‡
Utility values: SF-6D (converted from SF-36 data) In addition, NDI, neurological improvement, avoidance of reoperation, and complications data were used to inform health states and transitions.
Utility values: Perioperative complications, reoperation (transient complications or those with minimal impact on quality of life not included)
Source for effectiveness data
RCT (ProDisc-C) IDE trial (N=209)
Published literature: various (4 RCTs (Prestige ST IDE trial, BRYAN IDE trial, ProDisc-C IDE trial,
Published literature: various (4 RCTs (Prestige ST IDE trial, BRYAN IDE trial, ProDisc-C IDE trial,
Systematic literature review; data abstracted from 156 case series (total N=16,922)

WA – Health Technology Assessment December 19, 2016
Artificial disc replacement – Re-review: Final evidence report Page - 211
Radcliff 2016 Qureshi 2013 McAnany 2014 Lewis 2014
Kineflex C IDE trial§) & 1 meta-analysis; infers utility values from results§)
Kineflex C IDE trial§); utility values taken from ProDisc-C IDE trial only
Costing year 2014 2010 2010 2014 Currency USD USD USD USD Cost sources FDA AE data,
Truven Marketscan Commercial Claims and Encounters Data, & Payments to physicians
Gross-cost methodology using Medicare and reimbursement data. ICD-9, DRG (with Nationwide Inpatient Sample (NIS)) and CPT codes were used to estimate resource use and direct costs.
Gross-cost methodology using 140% Medicare and reimbursement data. ICD-9, DRG (with NIS) and CPT were used to estimate resource use and direct cost
Medicare reimbursement; Implant cost inquired from hospitals
Components of cost data
Index surgery, complications (including secondary surgeries), physical therapy, diagnostic radiology, office visits, trigger point injections, steroid injections. (Costs associated with routine non-operative care were excluded).
Index surgery, secondary surgery
Direct costs (index surgery including hospitalization costs, revision surgery)
Direct healthcare costs (index surgery and hospitalization, outpatient follow-up, secondary surgery)
Discounting 3% 3% 3% NR Sensitivity analysis
• “Scenario” SA (variations in input parameters and perspectives)
• NMB Regression (adjusts for potential baseline differences between groups (although no significant differences were observed); variations in treatment, age, sex, race,
One-way SA (variations in length of prosthesis survival, rate of hardware failure, health state utilities)
One-way SA (variations in costs, health utility states, and transition probabilities)
Probabilistic 2-dimensional SA using Monte Carlo simulations (appears to have included variations in both effectiveness and cost data)

WA – Health Technology Assessment December 19, 2016
Artificial disc replacement – Re-review: Final evidence report Page - 212
Radcliff 2016 Qureshi 2013 McAnany 2014 Lewis 2014
baseline SF-6D utility values)
QHES 91/100 73/100 87/100 62/100 Results: BASE CASE Cost / QALY of C-ADR
$29,697 (95% CI $26,137, $33,721) / 4.52 (95% CI 4.36, 4.68) = $6,570/QALY (95% CI $5995/QALY, $7205/QALY)
$11,987 / 3.94 = $3,042/QALY
$102,274 / 2.84 = $35,976/QALY
$20,154/4.843 = $4,161/QALY
Cost / QALY of comparator(s)
$42,486 (95% CI $36,100, $49,790) / 4.36 (95% CI 4.19, 4.53) = $9,744/QALY (95% CI $8616/QALY, $10991/QALY)
$16,823 / 1.92 = $8,760/QALY
$119,814 / 2.81 = $42,617/QALY
ACFD-auto: $20,511/4.714 = $4,351/QALY
ACFD-allo: $19,793/4.781 = $4,139/QALY
ACDF-spacer: $19,539/4.787 = $4,081/QALY
ACD: $16,558/4.885 = $3,389/QALY
ICER
Incremental NMB*: $20,679 (95% CI $6053, $35,377)
(greater than 0 implies cost-effective with WTP=$50,000)
C-ADR dominates (ICER = $-2,394)
C-ADR dominates (ICER = $-557,849)
NR
SENSITIVITY ANALYSIS One-way SA NR Based on WTP
threshold of $50,000/QALY gained, C-ADR more cost-effective than ACDF only if: • C-ADR device
survival ≥ 9.75 years, or
• C-ADR utility value ≥ 0.796, or
• C-ADR cost < $16,319
Variations in secondary surgery
Based on WTP threshold of $50,000/QALY gained, C-ADR dominates ACDF only if: • C-ADR device survival
≥ 27% at 60 months (i.e., revision rate <27% at 60 months), or
• C-ADR complication rate < 4.37%, or
• ACDF complication rate < 2.2%, or
NR

WA – Health Technology Assessment December 19, 2016
Artificial disc replacement – Re-review: Final evidence report Page - 213
Radcliff 2016 Qureshi 2013 McAnany 2014 Lewis 2014
rates did not affect conclusions.
• C-ADR adjacent segment surgery rate < 10.5%
• C-ADR utility value > 0.713, or
• C-ADR cost < $20,486, or,
• ACDF cost < $18,607, or
• ACDF utility > 0.747 Two-way SA NR NR NR NR Scenario SA
In all scenarios ADR had NMB greater than zero. The largest mean NMB was $23,015 which accounted for secondary surgery loss of productivity
NR NR NR
NMB Regression SA
ADR remained cost-effective when varying age, sex, race and baseline SF-6D.
NR NR NR
Probabilistic SA
NR NR NR Monte Carlo simulations of varying beta results were not reported but used to calculate SDs.
Author’s Conclusion
Over a 7 years f/u, C-ADR was found to be a more effective and less costly intervention than ACDF for 1-level DDD.
Early indications suggest both C-ADR and ACDF to be cost-effective, though C-ADR was generally more cost-effective. Longer F/U necessary to address questions of device durability.
C-ADR is dominant at 60 months, however both C-ADR and ACDF are cost-effective with WTP threshold of $50,000.
ACD was found to be a more effective and less costly intervention than C-ADR or ACDF for 1-level DDD. Authors were inconclusive regarding whether C-ADR was more cost-effective than ACDF.
ACD: anterior cervical discectomy; ACDF: anterior cervical discectomy and fusion; C-ADR: cervical artificial disc disease; CUA: cost utility analysis; DDD: degenerative disc disease; EQ-5D: EuroQoL 5 Dimensions; FDA: U.S. Food and Drug Administration; F/U: follow-up; ICER: Incremental cost-effectiveness ratio; QALYs: Quality-adjusted life years; NDI: Neck Disability Index; NMB: Net Monetary Benefit; NR: not reported; SA: sensitivity analysis; SD: standard deviation; SF-6D: Short Form 6 dimensions; VAS: visual analog scale.

WA – Health Technology Assessment December 19, 2016
Artificial disc replacement – Re-review: Final evidence report Page - 214
* Incremental NMB converts QALYs into monetary units by assuming a fixed willingness to pay threshold (WTP) such that NMB = (WTP * ∆QALY) - ∆Costs
† Funding not explicitly stated, but disclosures were made that several authors were employees of or consultants for DePuy Synthes.
‡ Unclear how utility values were estimated, but estimates were based on the conclusions that C-ADR was superior to ACDF for all outcomes listed
§ Kineflex-C was excluded from this report (the device was not FDA approved and the manufacturer is no longer pursuing approval of the device (based on personal communication)
** Funding not explicitly stated, but disclosures were made that two authors were of consultants for Zimmer, Medtronic, Stryker, DePuy, and OrthoFix.
4.4.3.2 C-ADR vs. Fusion: 2-level Study characteristics: Two CUAs were identified that reported on 2-level C-ADR versus ACDF, both of which were conducted by the same author and used many of the same assumptions.4,5 One of which was the later follow-up of previous work done by the same author. Both studies used data from the Mobi-C (2-level) IDE trial to model hypothetical cohorts consisting of patients with 2-level symptomatic DDD with radiculopathy or myelopathy who were unresponsive to at least six weeks of conservative treatment. Study characteristics, results and conclusions are summarized in Table 72. The studies were conducted from a societal perspective and used direct and indirect costs; one study5 also reported results based on a healthcare perspective, which used direct costs only. Findings were derived the Mobi-C (2-level) IDE trials’ 24-month4 and 60-month5 data. A Markov model was constructed to quantify the health states of each hypothetical cohort. Each study conducted a thorough sensitivity analysis testing a range of assumptions and employing a variety of strategies from univariate and scenario to subgroup and probabilistic sensitivity analysis. The studies measured clinical effectiveness in terms of QALYs, which were derived from trial data. The individual components considered to derive the QALY were SF-12 scores, NID, VAS neck and arm pain; in addition, supplemental fixation, revision, reoperation and device removal were noted possible complications. Costs were reported in 2012 and 2014 USD and sourced from Institutional billing data based on various code types and Medicare reimbursement rates. Initial surgery, complications (supplemental fixation, revision, reoperation, device removal), medications, ancillary services, and productivity loss were included in the final cost measure. A discount rate of 3% was applied. Both papers were determined to have sufficiently met all specifications of a well conducted economic evaluation using the QHES scale and received a score of 100/100 (see Appendix Table E10 for full scoring details). Results Base Case Assuming a US societal perspective, the 24-month cost of C-ADR was $43,060 while that of ACDF was ACDF was $40,920, thus C-ADR cost $2140 more than ACDF. C-ADR was associated with a slightly greater gain in QALYs per patient than ACDF (1.59 vs. 1.50). Therefore, the cost per QALY for C-ADR was $22,662 and for ACDF was $27,081, resulting in an incremental cost effectiveness ratio (difference in cost/ difference in QALY) of $24,594 – C-ADR cost an additional $24,594 per QALY gained compared with ACDF.4

WA – Health Technology Assessment December 19, 2016
Artificial disc replacement – Re-review: Final evidence report Page - 215
The 60-month societal cost of C-ADR was $80,906 while that of ACDF $113,596, thus C-ADR was associated with a cost savings of $32,690 compared with ACDF. The number of QALYs gained per patient was slightly greater with C-ADR than ACDF (3.57 vs. 3.38). Taken together, the cost per QALY was lower for C-ADR than ACDF ($22,662 vs. $21,772), and the resulting ICER was -$165,103 – meaning that C-ADR dominated ACDF (i.e., was less costly and more effective).5 The cost effectiveness at 60 months was also evaluated using a healthcare perspective, which included direct costs only (compared with the societal perspective, which also included indirect costs). Using this perspective, the ICER was found to be $8,518, indicating that C-ADR cost an additional $8,519 per QALY gained compared with ACDF.5 Sensitivity Analyses Both studies performed one-way sensitivity analysis, which showed that the ICER remained below the cost-effective threshold of $50,000/QALY under all variables tested except one (when the utility of being in the least-severe health state group was valued less).4,5 The cost of the device cost was also influential but statistically non-significant. Subgroup analysis showed that for severely disabled patients (i.e. bedbound, crippled at baseline), C-ADR remained cost-effective at 24 months.4 In a scenario analysis C-ADR was less cost-effective than ACDF at 24 months only when 12-month costs and quality-of-life parameters were varied, however details were not reported. The same study found that C-ADR continued to be dominant for 4- and 10-year time horizons.4 The other study found that the 60-month ICER remained below a $50,000 WTP threshold in all variations of age (30, 55, or 70 years) and time horizons (24 months, 96 months) evaluated.5 Lastly, in a probabilistic sensitivity test, 3,000 Monte Carlo sample simulations found C-ADR to be cost-effective more than 95% of the time from both societal and healthcare perspectives. Conclusions and Limitations Based on a WTP threshold of $50,000/QALY, C-ADR was highly cost-effective when compared to ACDF for 2-level degenerative disc disease with radiculopathy or myelopathy that had not responded to six weeks of conservative care. Given the parallels between the two studies, the 60-month cost-effectiveness of C-ADR was shown to be even more dramatic than in the previous 24-month study. The notably large difference between the societal (includes direct and indirect costs) and healthcare (includes direct costs only) perspective ICERs (-$165,103 and $8518, respectively) was credited to the differences in 60-month productivity loss for C-ADR versus ACDF ($57,447 vs. $91,824, respectively), which was the result of different return to work rates for C-ADR versus ACDF (80.6% vs. 65.4%, respectively, at 24 months). To reconcile the large difference between the studies of different follow-up time, the authors suggest the greater QALYs and reduced cost as well as more realistic return to work data are the key driving factors. While both studies received high QHES scores there were inherent limitations relating to time horizon (noting the significant difference in the two studies given the different follow-up) as well as availability of complete cost information- operating times and length of hospitalization were not captured. A variety of sensitivity measures were undertaken to address concerns stemming from the inherent limitations.

WA – Health Technology Assessment December 19, 2016
Artificial disc replacement – Re-review: Final evidence report Page - 216
Table 72. Summary of Economic Evaluation Study Characteristics and Results: C-ADR vs. ACDF (2-level) Ament 2014 Ament 2016 Population 2-level symptomatic DDD with
radiculopathy or myelopathy unresponsive to 6 weeks of conservative treatment (Hypothetical cohort based on data from Mobi-C (2-level) IDE trial)
(same as Ament 2014)
Intervention(s) C-ADR C-ADR Comparator(s) ACDF ACDF Country US US Funding LDR Medical LDR Medical Study design CUA CUA Perspective Base case: societal
Sensitivity analysis: payer Societal (includes direct + indirect costs) Healthcare (includes direct costs only)
Time horizon Base case: 24 months Sensitivity analysis: 12-120 months
60 months Sensitivity analysis: 24 & 96 months
Analytic model Markov Processes Markov Processes Effectiveness outcome
QALY QALY
Effectiveness outcome components
Utility values: SF-6D (converted from SF-12 data) Health states: NDI, VAS neck and arm pain Complications: supplemental fixation, revision, reoperation, device removal
(same as Ament 2014)
Source for effectiveness data
RCT (Mobi-C (2-level) IDE trial) (N=330) (same as Ament 2014)
Costing year 2012 2014 Currency USD USD Cost sources Institutional billing data (based on various
code types) with Medicare reimbursement rates
(same as Ament 2014)
Components of cost data
Initial surgery, complications (supplemental fixation, revision, reoperation, device removal), medications, ancillary services, and productivity loss
(same as Ament 2014, except: productivity loss included return to work; follow-up office visits included). Indirect costs were only included in the societal perspective analyses.
Discounting 3% 3% Sensitivity analysis
• One-way SA (varied costs, complication risks, quality of life values)
• Subgroup SA (tested results in different population subgroups)
• “Scenario” SA (varied time horizon, costing method)
• One-way “threshold” SA (varied costs and clinical variables to assess impact on conclusions)
• Probabilistic SA (Monte Carlo simulation (3000 iterations) with variations in all probability parameters based on point estimates and 95% CI from trial data)
• “Scenario” SA (varied time horizon, age) QHES 100/100 100/100 Results: BASE CASE Cost / QALY of C-ADR
$43,060 / 1.59 (per patient) = $27,081/QALY
Societal: $80,906 / 3.57 (per patient) = $22,662/QALY

WA – Health Technology Assessment December 19, 2016
Artificial disc replacement – Re-review: Final evidence report Page - 217
Ament 2014 Ament 2016 Healthcare:
$23,459 / 3.57 (per patient) = $6,571/QALY Cost / QALY of comparator(s)
$40,920 / 1.50 ACDF (per patient) = $27,280/QALY
Societal: $113,596 / 3.38 (per patient) = $33,608/QALY Healthcare: $21,772 / 3.38 (per patient) = $6,441/QALY
ICER (∆$/∆QALY) (C-ADR vs. comparator)
$24,594 Societal: $-165,103* Healthcare: $8,518* *see footnote for explanation of the large
difference in results between perspectives SENSITIVITY ANALYSIS One-way SA ICER remained below cost-effective
threshold of $50,000/QALY under all variables tested except one (when the utility of being in the least-severe health state group was valued less). The cost of the device cost was also influential but statistically non-significant.
ICER remained below cost-effective threshold of $50,000/QALY under all but “extreme” values (e.g., only when C-ADR reimbursement value was $26,217 (healthcare perspective) or $62,637 (societal perspective))
Subgroup SA Subgroup, severely disabled patients (i.e., bedbound, crippled at baseline) - C-ADR is cost-effective. Subgroup: age (<45 vs. ≥46 years) - C-ADR is cost-effective for both age groups.
NR
Scenario SA C-ADR is less cost-effective than ACDF only when 12-month costs and QoL are varied (details NR). 4-, 10-year time horizons: C-ADR dominates
ICER remained below $50,000 willingness to pay threshold in all variations of age (30, 55, or 70 years) and time horizons (24 months, 96 months)
Probabilistic SA
NR 3,000 Monte Carlo sample simulations found ADR cost-effective more than 95% of the time from both societal and healthcare perspectives
Author’s Conclusion
Based on a cost-effective threshold of $50,000/QALY, C-ADR appears to be highly cost-effective when compared to ACDF for 2-level DDD.
The cost-effectiveness of C-ADR is shown to be even more dramatic than in the previous two-year study. Authors reason that the greater QALYs and reduced cost as well as more realistic return to work data are the driving factors.
ACDF: anterior cervical discectomy and fusion; C-ADR: cervical artificial disc disease; CUA: cost utility analysis; DDD: degenerative disc disease; F/U: follow-up; ICER: Incremental cost-effectiveness ratio; NDI: Neck Disability Index; NR: not reported; QALYs: Quality-adjusted life years; SA: sensitivity analysis; SD: standard deviation; SF-6D: Short Form 6 dimensions; VAS: visual analog scale. * The large difference between the societal (includes direct and indirect costs) and healthcare (includes direct costs only) perspective ICERs (-$165,103 and $8518, respectively) was attributed to the differences in 60-month productivity loss for C-ADR versus ACDF ($57,447 vs. $91,824, respectively), which was in turn attributed to differences in return to work rates for C-ADR versus ACDF (80.6% vs. 65.4%, respectively, at 24 months).

WA – Health Technology Assessment December 19, 2016
Artificial disc replacement – Re-review: Final evidence report Page - 218
5 Strength of Evidence (SoE) Summary Tables
An overall summary of results across outcomes comparing the 2008 and current reports is found in the Executive Summary. The following detailed summaries of evidence have been based on the highest quality of studies available. Additional information on lower quality studies is available in the report. A summary of the primary outcomes for each key question are provided in the tables below and are sorted by comparator. Details of other outcomes are available in the report.
5.1 Strength of Evidence Summary: L-ADR vs. Fusion (1-level) Efficacy Results
Outcome Follow-up RCTs N* Serious
Risk of Bias Serious
Inconsistency Serious
Indirectness Serious
Imprecision Conclusion* Quality
L-ADR vs. fusion (1-level)
Overall success†
24 mos. 2 RCTs (Charité, ProDisc-L IDE trials)
N=484
Yes1 (-1) No No Yes3 (-1)
Pooled RD 7.9% (95% CI -1.7%, 17.4%), Conclusion: L-ADR is comparable with single level anterior lumbar interbody fusion or circumferential fusion up to 24 months following surgery in terms of the proportion of patients achieving overall clinical success
⨁⨁◯◯
LOW
60 mos. 2 RCTs (Charité, ProDisc-L IDE trials)
N = 319 Yes1 (-1) No No Yes3 (-1)
Pooled RD 7.1%, (95% CI -4.9%, 18.9%) Conclusion: L-ADR is comparable with single level anterior lumbar interbody fusion or circumferential fusion up to 60 months following surgery in terms of the proportion of patients achieving overall clinical success
⨁⨁◯◯
LOW
ODI success (≥15-point improvement)
24 mos. 2 RCTs (Charité, ProDisc-L IDE trials)
N=485
Yes1 (-1) No No Yes3 (-1)
Pooled RD 8.9% (95% CI -0.5%, 18.3%), Conclusion: L-ADR is comparable with single level anterior lumbar interbody fusion or circumferential fusion up to 24 months following surgery in terms
⨁⨁◯◯
LOW

WA – Health Technology Assessment December 19, 2016
Artificial disc replacement – Re-review: Final evidence report Page - 219
Outcome Follow-up RCTs N* Serious
Risk of Bias Serious
Inconsistency Serious
Indirectness Serious
Imprecision Conclusion* Quality
of the proportion of patients achieving ODI success
60 mos. 2 RCTs (Charité, ProDisc-L IDE trials)
N=310
Yes1 (-1) No NO Yes3 (-1)
Pooled RD 7.8%, (95% CI -3.6%, 19.2%) Conclusion: L-ADR is comparable with single level anterior lumbar interbody fusion or circumferential fusion up to 60 months following surgery in terms of the proportion of patients achieving ODI success
⨁⨁◯◯
LOW
Neurological success‡
24 mos. 2 RCTs (Charité, ProDisc-L IDE trials)
N=483
Yes1 (-1)
Yes2 (-1) No Yes3 (-1) Pooled RD 2.2%, (95% CI -12.6%, 17.1%) Conclusion: L-ADR is comparable with single level anterior lumbar interbody fusion or circumferential fusion up to 24 months following surgery in terms of the proportion of patients achieving neurological success
⨁◯◯◯
INSUFFICIENT
60 mos. 2 RCTs (Charité, ProDisc-L IDE trials)
N=306
Yes1 (-1)
No No Yes3 (-1) Pooled RD 0.2%, (95% CI -7.9%, 8.3%) Conclusion: L-ADR is comparable with single level anterior lumbar interbody fusion or circumferential fusion up to 60 months following surgery in terms of the proportion of patients achieving neurological success
⨁⨁◯◯
LOW
VAS Pain scores (0-100)
24 mos. 2 RCTs (Charité, ProDisc-L IDE trials)
N=488
Yes1 (-1) No No Yes4 (-1) WMD 6.84, 95% CI 0.63, 12.32) Conclusion: L-ADR may be comparable to fusion with regard to pain relief at 24 months. Neither trial individually reported a significant difference between treatments. Based on pooled estimates, VAS pain at 24 months may be somewhat less following L-ADR compared with
⨁⨁◯◯
LOW

WA – Health Technology Assessment December 19, 2016
Artificial disc replacement – Re-review: Final evidence report Page - 220
Outcome Follow-up RCTs N* Serious
Risk of Bias Serious
Inconsistency Serious
Indirectness Serious
Imprecision Conclusion* Quality
fusion (pooled mean difference however the difference is likely not clinically meaningful.
60 mos. 2 RCTs (Charité, ProDisc-L IDE trials)
N=309
Yes1 (-1) No No Yes4 (-1) WMD MD 1.16, 95% CI -6.43, 8.74 Conclusion: L-ADR may be as good as fusion with regard to pain relief at 24 months.
⨁⨁◯◯
LOW
* Unless otherwise specified, conclusion and patient numbers were based on completer analysis, for which the effect estimate was more conservative than that of the ITT analysis.
† Overall clinical success: The FDA criterion of at least a 15-point improvement from baseline ODI scores was used for both RCTs to minimize heterogeneity in the meta-analysis. The definition of overall clinical success was similar in the two studies, but not identical. In the Prodisc-L trial (Zigeler 2007), success was defined more conservatively than the Charité (Blumenthal 2005) trial in that it required improvement in the SF-36 and radiological success as additional criteria. The addition of these parameters would make success more difficult to achieve resulting in a lower proportion of patients attaining overall clinical success, but not likely biasing the results between study groups. Therefore, these two studies were pooled; ‡Neurological success was defined as no neurological change (i.e. defined as lack of neurological deterioration compared with preoperative status, at any point of time in the Charité trial and as neurological status improved or maintained (motor, sensory, reflex, straight leg raise) in the ProDisc-L trial. Reasons for downgrading:
1. Serious risk of bias: the majority of studies violated one or more of the criteria for good quality RCT (or cohort study) related to the outcome reported (see Appendix for details) 2. Inconsistency: differing estimates of effects across trials 3. Imprecise effect estimate for a dichotomous outcome: small sample size and/or confidence interval includes both negligible effect and appreciable benefit or harm with ADR 4. Imprecise effect estimate for a continuous outcome: wide (or unknown) confidence interval and/or small sample size

WA – Health Technology Assessment December 19, 2016
Artificial disc replacement – Re-review: Final evidence report Page - 221
5.2 Strength of Evidence Summary: L-ADR vs. Fusion (2-level) Efficacy Results
Outcome Follow-up RCTs N* Serious
Risk of Bias Serious
Inconsistency Serious
Indirectness Serious
Imprecision Conclusion* Quality
L-ADR vs. Fusion (2-level)
Overall success†
24 mos. 1 RCTs (Delamarter)
N=215
Yes1 (-1) Unknown No Yes3 (-1) RD 11.0% (95% CI -3.3%, 25.4%) Conclusion: At 24 months, 2-level L-ADR is as good as fusion with regard to the proportion of patients achieving clinical success; no statistical difference was observed between treatments observed.
⨁⨁◯◯
LOW
ODI Scores (0-100)
Yes1 (-1) Unknown No Yes4 (-1) MD -8.4 (95% CI -15.4, -1.4) Conclusion: Two-level ADR may be as good as or slightly better than fusion with respect to function measured via ODI. Patients receiving 2-level L-ADR had significant improvement (lower) in ODI scores; It is not clear if this difference is clinically meaningful. Change from baseline for ADR was 52.4% ± 38.1% and for fusion was 40.9% ± 36.0%.
⨁⨁◯◯
LOW
Neurological success‡
Yes1 (-1)
Unknown No Yes3 (-1) RD 8.5% (95% CI -2.5%, 19.6%) Conclusion: Two-level ADR may be as good as fusion by 24 months in terms of neurological success; no statistical difference was observed between treatments observed
⨁⨁◯◯
LOW
VAS Pain scores (0-100)
Yes1 (-1) Unknown No Yes4 (-1) MD -6.5 (-15.7, 2.7) Conclusion: Two-level ADR may be as good as fusion with regard to pain relief; no statistical difference was observed between treatments observed
⨁⨁◯◯
LOW

WA – Health Technology Assessment December 19, 2016
Artificial disc replacement – Re-review: Final evidence report Page - 222
* Unless otherwise specified, conclusion and patient numbers were based on completer analysis, for which the effect estimate was more conservative than that of the ITT analysis.
† Overall clinical success: The FDA criterion of at least a 15-point improvement from baseline ODI scores was used, other components of the composite: 1) Improvement in SF-36 PCS compared with baseline; 2) Neurological status improved or maintained from baseline; 3) No secondary surgical procedures to remove or modify the total disc replacement implant or arthrodesis implant/site; 4) no subsidence >3 mm; 5) no migration >3 mm; 6) no radiolucency/loosening; 7) no loss of disc height >3 mm); and 8) for ADR, range of motion improved for maintained from baseline and for Fusion, no motion (<10⁰ angulation, total for two levels combined) on flexion and extension radiographs.
‡ Neurological success was defined as neurological status improved or maintained (motor, sensory, reflex, straight leg raise). Reasons for downgrading:
1. Serious risk of bias: the majority of studies violated one or more of the criteria for good quality RCT (or cohort study) related to the outcome reported (see Appendix for details) 2. Inconsistency: differing estimates of effects across trials

WA – Health Technology Assessment December 19, 2016
Artificial disc replacement – Re-review: Final evidence report Page - 223
5.3 Strength of Evidence Summary: L-ADR vs. Fusion (1 or 2-level) Efficacy Results
Outcome Follow-up RCTs N* Serious
Risk of Bias Serious
Inconsistency Serious
Indirectness Serious
Imprecision Conclusion* Quality
L-ADR vs. fusion (1- or 2-level)
Overall success†
24 mos. 1 RCT (Berg/Skold)
N= 152
Yes1 (-1) Unknown No Yes3 (-1) RD 5.8% (95% CI -8.8%, 20.5%) Conclusion: L-ADR is comparable to fusion with regard to the proportion of patients who reported being totally pain free or much better.
⨁⨁◯◯
LOW
60 mos. N=151
Yes1 (-1) Unknown No Yes3 (-1) RD 4.9% (95% CI -9.7%, 19.5%) Conclusion: L-ADR is comparable to fusion with regard to the proportion of patients who reported being totally pain free or much better.
⨁⨁◯◯
LOW
ODI success (≥ 25% improvement)
24 mos. N= 152
Yes1 (-1) Unknown No Yes3 (-1) RD 8.2% (95% CI -7.4%, 23.8%) Conclusion: L-ADR is comparable to fusion with regard to the proportion of patients who achieved ODI success
⨁⨁◯◯
LOW
60 mos. N=151
Yes1 (-1) Unknown No Yes4 (-1) RD 12.7% (95% CI -1.7%, 27.1%) Conclusion: L-ADR is comparable to fusion with regard to the proportion of patients achieved ODI success.
⨁⨁◯◯
LOW
Back Pain VAS scores (0-100)
24 mos. N= 152
Yes1 (-1) Unknown No Yes4 (-1) MD -3.8 (95% CI -12.6, 5.0) Conclusion: L-ADR is comparable to fusion with regard to back pain relief at 24 months.
⨁⨁◯◯
LOW
60 mos. N=151
Yes1 (-1) Unknown No Yes4 (-1) MD -7.8 (-16.9, 1.3) Conclusion: L-ADR is comparable to fusion with regard to back pain relief at 60 months
⨁⨁◯◯
LOW
Leg Pain VAS scores (0-100)
24 mos. N= 152
Yes1 (-1) Unknown No Yes4 (-1) MD -4.3 (-12.1, 3.5) ⨁⨁◯◯
LOW
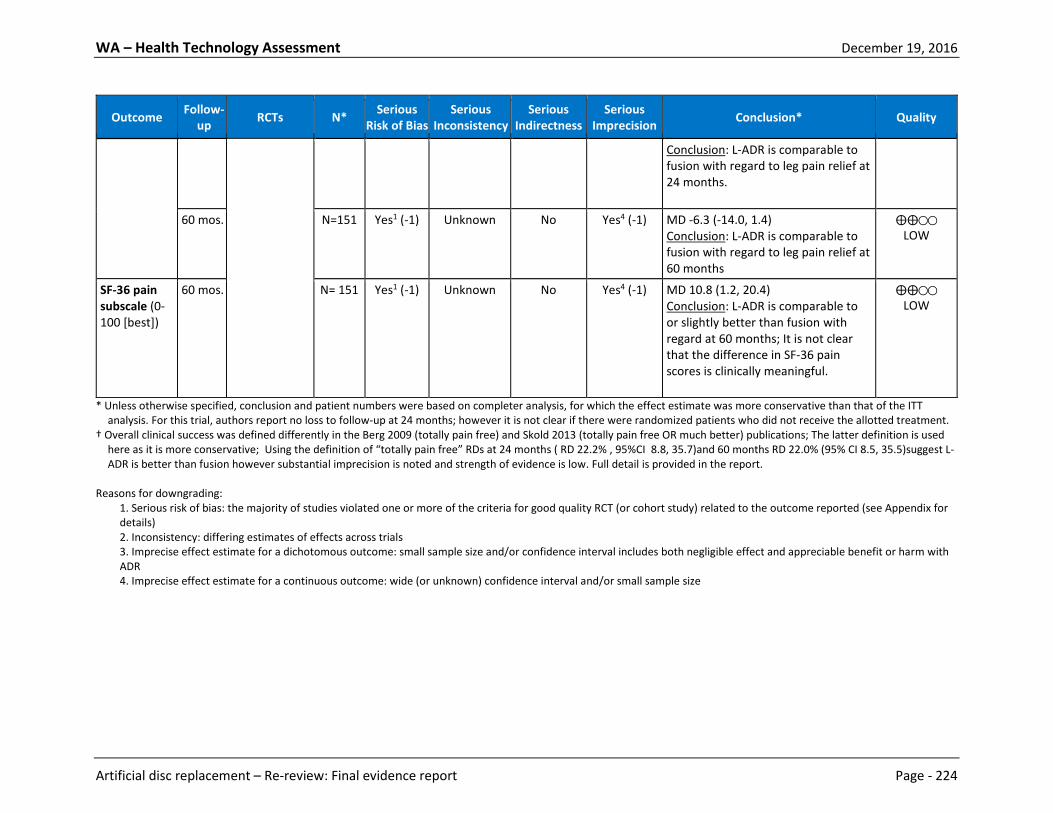
WA – Health Technology Assessment December 19, 2016
Artificial disc replacement – Re-review: Final evidence report Page - 224
Outcome Follow-up RCTs N* Serious
Risk of Bias Serious
Inconsistency Serious
Indirectness Serious
Imprecision Conclusion* Quality
Conclusion: L-ADR is comparable to fusion with regard to leg pain relief at 24 months.
60 mos. N=151
Yes1 (-1) Unknown No Yes4 (-1) MD -6.3 (-14.0, 1.4) Conclusion: L-ADR is comparable to fusion with regard to leg pain relief at 60 months
⨁⨁◯◯
LOW
SF-36 pain subscale (0-100 [best])
60 mos. N= 151
Yes1 (-1) Unknown No Yes4 (-1) MD 10.8 (1.2, 20.4) Conclusion: L-ADR is comparable to or slightly better than fusion with regard at 60 months; It is not clear that the difference in SF-36 pain scores is clinically meaningful.
⨁⨁◯◯
LOW
* Unless otherwise specified, conclusion and patient numbers were based on completer analysis, for which the effect estimate was more conservative than that of the ITT analysis. For this trial, authors report no loss to follow-up at 24 months; however it is not clear if there were randomized patients who did not receive the allotted treatment.
† Overall clinical success was defined differently in the Berg 2009 (totally pain free) and Skold 2013 (totally pain free OR much better) publications; The latter definition is used here as it is more conservative; Using the definition of “totally pain free” RDs at 24 months ( RD 22.2% , 95%CI 8.8, 35.7)and 60 months RD 22.0% (95% CI 8.5, 35.5)suggest L-ADR is better than fusion however substantial imprecision is noted and strength of evidence is low. Full detail is provided in the report.
Reasons for downgrading:
1. Serious risk of bias: the majority of studies violated one or more of the criteria for good quality RCT (or cohort study) related to the outcome reported (see Appendix for details) 2. Inconsistency: differing estimates of effects across trials 3. Imprecise effect estimate for a dichotomous outcome: small sample size and/or confidence interval includes both negligible effect and appreciable benefit or harm with ADR 4. Imprecise effect estimate for a continuous outcome: wide (or unknown) confidence interval and/or small sample size

WA – Health Technology Assessment December 19, 2016
Artificial disc replacement – Re-review: Final evidence report Page - 225
5.4 Strength of Evidence Summary: L-ADR vs. Multidisciplinary Rehabilitation Efficacy Results
Outcome Follow-up RCTs N* Serious
Risk of Bias Serious
Inconsistency Serious
Indirectness Serious
Imprecision Conclusion* Quality
L-ADR vs. Multidisciplinary Rehabilitation
Overall success/ODI success† (≥15-point improvement in ODI)
24 mos. 1 RCT (Hellum)
N=139
Yes1 (-1) Unknown No Yes3 (-1) RD 22.9% (95% CI 6.9%, 38.9%) Conclusion: L-ADR appears to be superior to multidisciplinary rehabilitation; the proportions of L-ADR participants achieving clinical success based on ODI improvement of at least 15 points is significantly higher (57.3%) than the proportion in the rehabilitation group (34.4%).
⨁⨁◯◯
LOW
VAS Pain scores (0-100)
Yes1 (-1) Unknown No Yes4 (-1) MD -14.3 (95% CI -23.0, -5.6) Conclusion: Results for VAS pain scores for suggest that L-ADR may be associated with less pain at 24 months compared with multidisciplinary rehabilitation however, baseline low back pain scores were significantly worse in the rehabilitation group than in the surgery group.
⨁⨁◯◯
LOW
* Unless otherwise specified, conclusion and patient numbers were based on completer analysis, for which the effect estimate was more conservative than that of the ITT analysis.
† Overall clinical success: The FDA criterion of at least a 15-point improvement from baseline ODI scores was used to define clinical success Reasons for downgrading:
1. Serious risk of bias: the majority of studies violated one or more of the criteria for good quality RCT (or cohort study) related to the outcome reported (see Appendix for details) 2. Inconsistency: differing estimates of effects across trials 3. Imprecise effect estimate for a dichotomous outcome: small sample size and/or confidence interval includes both negligible effect and appreciable benefit or harm with ADR 4. Imprecise effect estimate for a continuous outcome: wide (or unknown) confidence interval and/or small sample size

WA – Health Technology Assessment December 19, 2016
Artificial disc replacement – Re-review: Final evidence report Page - 226
5.5 Strength of Evidence Summary: L-ADR vs. Fusion (1-level) Safety Results
Outcome Follow-up RCTs N* Serious
Risk of Bias Serious
Inconsistency Serious
Indirectness Serious
Imprecision Conclusion* Quality
L-ADR vs. fusion (1-level)
Secondary Surgery at Index Level+
24 mos. 2 RCTs (Charité, ProDisc-L IDE trials)
N=540
Yes1 (-1) No No Yes3 (-1)
L-ADR 4.9%, Fusion 1.4% Pooled RD 2.3% (95% CI -2.1%, 6.6%) Conclusion: L-ADR is comparable with single level anterior lumbar interbody fusion or circumferential fusion up to 24 months following surgery in terms of the proportion of patients who had subsequent surgery at the index level.
⨁⨁◯◯
LOW
24–60 mos.
1 RCTs (ProDisc-L IDE trial)
N = 236 Yes1 (-1) Unknown No Yes3 (-1)
L-ADR 6.6%, Fusion 3.7% RD 2.9% (95% CI -3.4%, 9.3%) Conclusion: L-ADR is comparable with single level anterior lumbar interbody fusion or circumferential fusion between 24 and 60 months following surgery in terms of the proportion of patients
⨁⨁◯◯
LOW
60 mos.
1 RCTs (ProDisc-L IDE trial)
N= 236
Yes1 (-1) Unknown No Yes3 (-1)
L-ADR 12.0%, Fusion 8.1% RD 3.9% (95% CI -4.6%, 12.4% Conclusion: L-ADR is comparable with single level anterior lumbar interbody fusion or circumferential fusion up to 24 months following surgery in terms of the proportion of patients achieving ODI success
⨁⨁◯◯
LOW
Major Adverse Events‡
24 mos. 2 RCTs (Charité, ProDisc-L IDE trials)
N= 540
Yes1 (-1) No No Yes3 (-2)
Frequency ≤ 1% of patients for both treatments across both trials. Conclusion: Firm conclusions regarding the comparability of L-ADR and fusion regarding the frequency of major adverse events are not possible: sample sizes may be inadequate to
⨁◯◯◯
INSUFFICIENT

WA – Health Technology Assessment December 19, 2016
Artificial disc replacement – Re-review: Final evidence report Page - 227
Outcome Follow-up RCTs N* Serious
Risk of Bias Serious
Inconsistency Serious
Indirectness Serious
Imprecision Conclusion* Quality
detect rare events. It is possible that reported frequency of such events is underestimated.
Major‡, serious or life-threatening adverse event§
60 mos.
2 RCTs (Charité, ProDisc-L IDE trials)
N = 133 (Charité) N = 236 (ProDisc-
L)
Yes1 (-1)
Yes (-1)
No Yes3 (-1) Charité: No major adverse events were reported for L-ADR or fusion however the small sample size and substantial loss to follow-up preclude drawing firm conclusion ** Prodisc- L: Serious or life-threatening event risks for L-ADR were 0.58 per patient, fusion 0.38 per patient, p = 0.036; They appear to be more common with L-ADR than with fusion. Conclusion: Firm conclusions regarding the comparability of L-ADR and fusion across these studies at 60 months is not possible. Differing definitions of what may constitute such events may impact the discrepancy across studies in addition to factors related to the population available for the Charité trial at 60 months.
⨁◯◯◯
INSUFFICIENT
Device-related adverse events (excluding secondary surgery at index level)
24 mos. 2 RCTs (Charité, ProDisc-L IDE trials)
N=540
Yes1 (-1)
No No Yes3 (-1) 11.5% L-ADR, 9.2% fusion Pooled RD -2.7% (95% CI -7.4 %, 1.9%) Conclusion: L-ADR is comparable with single level anterior lumbar interbody fusion or circumferential fusion up to 60 months following surgery in terms of the proportion of patients
⨁⨁◯◯
LOW

WA – Health Technology Assessment December 19, 2016
Artificial disc replacement – Re-review: Final evidence report Page - 228
Outcome Follow-up RCTs N* Serious
Risk of Bias Serious
Inconsistency Serious
Indirectness Serious
Imprecision Conclusion* Quality
Any Adverse Event
24 mos. 2 RCTs (Charité, ProDisc-L IDE trials)
N= 540
Yes1 (-1) No No Yes4 (-1) 84.5% L-ADR, 79.5% fusion Pooled RD 6.2% (95% CI -0.7 %, 13.0%) Conclusion: L-ADR may be comparable to fusion with regard to experiencing any adverse event by 24 months.
⨁⨁◯◯
LOW
60 mos. 1 RCT (ProDisc-L IDE trials)
N=236
Yes1 (-1) Unknown No Yes4 (-1) L-ADR 5.1 per patient, fusion 5.4 per patient, p = 0.507 Conclusion: L-ADR may be comparable with fusion with regard frequency of any adverse event by 60 months.
⨁⨁◯◯
LOW
*Percentages were calculated based on the number of patients who received treatment (i.e., excludes those who dropped out after randomization but prior to undergoing surgery) unless otherwise noted.
†Secondary surgery at index level included revision, reoperation, device/hardware removal, supplemental fixation, hemilaminectomy and discectomy with decompression ‡Major adverse event defined as major vessel injury, neurological damage, nerve root injury, and death. §Zigler 2012 does not provide detail regarding what constitutes a serious or life threatening event; unclear if these events were defined the same way as “major adverse events” for the ProDisc-L trial at 24 months. **For the Charite IDE trial, of the 14 initial sites, 6 declined participation in the 60-month continuation study, which eliminated 64 randomized patients and only those with both 24 month and 60 month data were included. Reasons for downgrading:
1. Serious risk of bias: the majority of studies violated one or more of the criteria for good quality RCT (or cohort study) related to the outcome reported (see Appendix for details) 2. Inconsistency: differing estimates of effects across trials 3. Imprecise effect estimate for a dichotomous outcome: small sample size and/or confidence interval includes both negligible effect and appreciable benefit or harm with ADR. If sample size is likely too small to detect rare outcomes, evidence may be downgraded twice. 4. Imprecise effect estimate for a continuous outcome: wide (or unknown) confidence interval and/or small sample size

WA – Health Technology Assessment December 19, 2016
Artificial disc replacement – Re-review: Final evidence report Page - 229
5.6 Strength of Evidence Summary: L-ADR vs. Fusion (2-level) Safety Results
Outcome Follow-up RCTs N* Serious
Risk of Bias Serious
Inconsistency Serious
Indirectness Serious
Imprecision Conclusion* Quality
L-ADR vs. Fusion (2-level)
Secondary surgical procedure at index level(s)†
24 mos. 1 RCTs (Delamarter)
N=237
Yes1 (-1) Unknown No Yes3 (-1) L-ADR 2.4%, fusion 8.3% RD -5.9% (9%% CI -12.7, 0.09) Conclusion: At 24 months, additional surgery at the index level was less common following 2-level L-ADR vs. fusion.
⨁⨁◯◯
LOW
Major surgery-related complications‡
Yes1 (-1) Unknown No Yes4 (-1) L-ADR 0.7%, fusion 4.9% RD -6.7% (95% CI -14.0, 0.6%) Conclusion: Major surgery-related complications were less common with L-ADR compared with fusion, however there was no statistical difference between groups, perhaps partly due to sample size.
⨁⨁◯◯
LOW
Device related complications (Subsidence or migration)§
24 mos. 1 RCTs (Delamarter)
N=237
Yes1 (-1)
Unknown No Yes3 (-2) L-ADR 2.4%, Fusion 1.4% RD 1.0% (-2.5%, 4.6%) Conclusion: There was no statistical difference between groups; however, this may be in part be a function of sample size. The frequency of device-related events may be underestimated.
⨁◯◯◯
INSUFFICIENT
* Percentages were calculated based on the number of patients who received treatment (i.e., excludes those who dropped out after randomization but prior to undergoing surgery) unless otherwise noted.
† Includes revision (1 ADR, 1 fusion), decompression (3 ADR, 1 fusion), and device/implant removal (0 ADR, 6 fusion). One fusion patients underwent implant removal, decompression and revision of the bone fusion sites due to pseudarthrosis at L5-S1; this patient is only counted once in the overall estimate. ‡ Included dural tear (1 ADR, 3 fusion; all successful repaired), blood loss >1500 mL (2 ADR, 2 fusion; 1 iliac artery tear in ADR group while all others had excessive oozing from the surgical site), and deep vein thrombosis (2 ADR, 2 fusion; all successfully treated). § Based on radiographic evaluation, implant subsidence of >3 mm for L-ADR patients (not clinically relevant) or migration and implant migration or subsidence of > 3mm was reported for fusion. There was one anterior migration of L-ADR which resulted in need for revision. Reasons for downgrading:
1. Serious risk of bias: the majority of studies violated one or more of the criteria for good quality RCT (or cohort study) related to the outcome reported (see Appendix for details)

WA – Health Technology Assessment December 19, 2016
Artificial disc replacement – Re-review: Final evidence report Page - 230
2. Inconsistency: differing estimates of effects across trials 3. Imprecise effect estimate for a dichotomous outcome: small sample size and/or confidence interval includes both negligible effect and appreciable benefit or harm with ADR. If sample size is likely too small to detect rare outcomes, evidence may be downgraded twice. 4. Imprecise effect estimate for a continuous outcome: wide (or unknown) confidence interval and/or small sample size.

WA – Health Technology Assessment December 19, 2016
Artificial disc replacement – Re-review: Final evidence report Page - 231
5.7 Strength of Evidence Summary: L-ADR vs. Fusion (1 or 2-level) Safety Results
Outcome Follow-up RCTs N* Serious
Risk of Bias Serious
Inconsistency Serious
Indirectness Serious
Imprecision Conclusion* Quality
L-ADR vs. fusion (1- or 2-level)
Any Secondary Surgical Procedure at Index Level†
24 mos. 1 RCT (Berg/Skold)
N= 152
Yes1 (-1) Unknown No Yes3 (-1) L-ADR 10.0%, fusion 30.6% RD -20.6% (-33.1, -8.1) Conclusion: L-ADR was associated with significantly fewer secondary surgeries compared with fusion up to 24 months; the majority were device related
⨁⨁◯◯
LOW
60 mos. N=151
Yes1 (-1) Unknown No Yes3 (-1) L-ADR 17.5%, fusion 36.6% RD -19.1% (-33.1, -5.2) Conclusion: L-ADR was associated with significantly fewer secondary surgeries compared with fusion through 60 months; the majority was device related.
⨁⨁◯◯
LOW
Device-related reoperation†
24 mos. N= 152
Yes1 (-1) Unknown No Yes3 (-1) L-ADR 5.0%, fusion 27.8% RD -22.8% (95% CI -34.2%, -11.4%) Conclusion: L-ADR was associated fewer device-related surgeries compared with fusion up to 24 months; these are the only device-related adverse events that authors report.
⨁⨁◯◯
LOW
60 mos. N=151
Yes1 (-1) Unknown No Yes3 (-1) L-ADR 11.3%, fusion 28.2% RD -16.9% (95% CI -29.5%, -4.4%) Conclusion: L-ADR was associated fewer device-related surgeries compared with fusion through 60 months; these are the only device-
⨁⨁◯◯
LOW

WA – Health Technology Assessment December 19, 2016
Artificial disc replacement – Re-review: Final evidence report Page - 232
Outcome Follow-up RCTs N* Serious
Risk of Bias Serious
Inconsistency Serious
Indirectness Serious
Imprecision Conclusion* Quality
related adverse events that authors report.
Total major complications§
60 mos. N= 152
Yes1 (-1) Unknown No Yes3 (-1) L-ADR 2.5%, fusion 8.3% RD -5.8% (95% CI -13.1%, 1.4%) Conclusion: Fewer major complications occurred following L-ADR compared with fusion; however statistical significance was not reached, possibly in part due to sample size. All events occurred within 24 months with no additional events reported through 60 months.
⨁⨁◯◯
LOW
Any (total) complication
60 mos. N= 152
Yes1 (-1) Unknown No Yes4 (-1) L-ADR 17.5%, fusion 20.8% RD -3.3% (95% CI -15.9%, 9.2%)
Conclusion: L-ADR was comparable to fusion with regard to frequency of any complications through 24 months. All events occurred within 24 months with no additional events reported through 60 months.
⨁⨁◯◯
LOW
* Percentages were calculated based on the number of patients who received treatment (i.e., excludes those who dropped out after randomization but prior to undergoing surgery) unless otherwise noted. † Based on authors’ description: Subsequent device-related procedures included subsequent fusion (in the ADR group), pedicle screw extraction due to pain or irritation. Non-device related secondary procedures includes decompression, decompression + pedicle screw extraction, re-fusion, hematoma removal, hernia repair and repair of dural tear. § Major complications include deep infection (4 fusion), pseudarthrosis (2 fusion), nerve entrapment (1 ADR), and subsidence/reoperation (1 ADR). Reasons for downgrading:
1. Serious risk of bias: the majority of studies violated one or more of the criteria for good quality RCT (or cohort study) related to the outcome reported (see Appendix for details) 2. Inconsistency: differing estimates of effects across trials 3. Imprecise effect estimate for a dichotomous outcome: small sample size and/or confidence interval includes both negligible effect and appreciable benefit or harm with ADR. If sample size is likely too small to detect rare outcomes, evidence may be downgraded twice. 4. Imprecise effect estimate for a continuous outcome: wide (or unknown) confidence interval and/or small sample size.

WA – Health Technology Assessment December 19, 2016
Artificial disc replacement – Re-review: Final evidence report Page - 233
5.8 Strength of Evidence Summary: L-ADR vs. Multidisciplinary Rehabilitation Safety Results
Outcome Follow-up RCTs N* Serious Risk of Bias
Serious Inconsistency
Serious Indirectness
Serious Imprecision Conclusion* Quality
L-ADR vs. Multidisciplinary Rehabilitation
Secondary Surgery at Index Level†
24 mos. 1 RCT (Hellum)
N=77
Yes1 (-1) Unknown No Yes3 (-1) L-ADR: 6.5% (5/77) Conclusion: Secondary surgery risk is only applicable to the L-ADR group; conclusions regarding comparative safety are not possible
⨁⨁◯◯
LOW
Major complication resulting in impairment‡
Yes1 (-1) Unknown No Yes4 (-1) L-ADR: 7.8% (6/77) Conclusion: Conclusions regarding comparative safety are not possible. As defined in this study, major complications resulting in impairment are only applicable to those receiving L-ADR
⨁⨁◯◯
LOW
Any complication§ Yes1 (-1) Unknown No Yes4 (-1) L-ADR: 33.8% (26/77) Conclusion: Over 1/3 of L-ADR recipients experienced some type of complication. Conclusions regarding comparative safety with respect to any complications as defined are not possible; authors do not provide information
⨁⨁◯◯
LOW

WA – Health Technology Assessment December 19, 2016
Artificial disc replacement – Re-review: Final evidence report Page - 234
Outcome Follow-up RCTs N* Serious Risk of Bias
Serious Inconsistency
Serious Indirectness
Serious Imprecision Conclusion* Quality
on any events in the rehabilitation group.
* ITT analyses are based on the baseline, as-treated population: Six patients (3 in each group) were excluded shortly after randomization and not accounted for in the studies analyses. Safety events were only reported for L-ADR, thus although the total study populations was 139, only 77 received ADR. † Surgeries included fusion at level with disc prosthesis and level above (n=1); insertion of new polyethylene inlay (n=1); and partial resection of spinous process because of possible painful contact between adjacent levels (n=2) ‡ Includes: polyethylene inlay dislodgement requiring revision surgery, during which injury to the left common iliac artery led to compartment syndrome resulting in a lower leg amputation (n=1); arterial thrombosis of dorsalis pedis artery resulting in a slightly colder foot (n=1); retrograde ejaculation (n=1); sensory loss in the thigh (n=2); and new radicular pain (n=2); there were a total of 7 events in 6 patients. § Includes “major complications resulting in impairment” as well as perioperative and other surgery-related adverse events such as dural tear, blood loss >1500 mL, hematoma, infection, etc. Authors report the most frequent treatment-related events as blood loss >1500 mL; temporary sensory loss and temporary radicular pain occurring in 5.2% of LADR patients (4/77). It is not clear if patients could experience more than one complication. Reasons for downgrading:
1. Serious risk of bias: the majority of studies violated one or more of the criteria for good quality RCT (or cohort study) related to the outcome reported (see Appendix for details) 2. Inconsistency: differing estimates of effects across trials 3. Imprecise effect estimate for a dichotomous outcome: small sample size and/or confidence interval includes both negligible effect and appreciable benefit or harm with ADR. If sample size is likely too small to detect rare outcomes, evidence may be downgraded twice. 4. Imprecise effect estimate for a continuous outcome: wide (or unknown) confidence interval and/or small sample size

WA – Health Technology Assessment December 19, 2016
Artificial disc replacement – Re-review: Final evidence report Page - 235
5.9 Strength of Evidence Summary: Differential Efficacy and Safety Results – L-ADR
Outcome Follow-up RCTs N* Serious
Risk of Bias Serious
Inconsistency Serious
Indirectness Serious
Imprecision Conclusion* Quality
L-ADR vs. Fusion or Multidisciplinary Rehabilitation
Any Any No studies were identified which stratified on patient characteristics or evaluated effect modification.
⨁◯◯◯
INSUFFICIENT
WA – Health Technology Assessment December 19, 2016
Artificial disc replacement – Re-review: Final evidence report Page - 236
5.10 Strength of Evidence Summary: Cost-effectiveness Results – L-ADR Assessment of the overall strength of evidence for formal economic analyses does not appear to be documented in the literature. As such, a summary of the primary results from these studies is provided below. L-ADR vs. Fusion Conclusions and Limitations No full economic specific to the evaluation of single level or 2-level L-ADR versus fusion were identified. Two moderate to high quality (QHES scores of 81/100 and 86/100) cost utility (CUA) analyses in patients receiving 1 or 2 level L-ADR for treatment of chronic low back pain secondary to degenerative disc disease were identified. Results across the two studies mixed with regard to the cost-effectiveness of L-ADR versus fusion. A Swedish study examining both societal and healthcare perspectives,54 reported that although L-ADR was somewhat less costly (particularly when reoperation costs were excluded) differences in EQ-5D, ODI, VAS for pain or SF-36 were not significant, thus an ICER is not meaningful suggesting L-ADR is as effective as fusion. Based on a net benefit approach, authors state that L-ADR could not be demonstrated to be cost-effective. The same findings for EQ-5D were reported in an Australian study119 which used a healthcare perspective. Results from other effectiveness outcomes suggest that L-ADR may be less costly. The ICER was dependent on which clinical outcome was chosen. Although L-ADR dominated fusion when overall clinical success and narcotic discontinuation were the outcomes, it was less costly but also less effective than fusion when ODI success was the outcome. One limitation of these studies is their applicability to practice in the United States; the medical systems, pricing and costs of care in the U.S. differ from those in Sweden and Australia. Both studies used data from RCTs that were considered to be at moderately high risk of bias. Neither study provided detail about sensitivity analyses, particularly related to the impact of factors that may be driving the results or major adverse events, even though both did account for re-operation. A general consensus in both studies and a common limitation noted was the necessity for a longer follow-up period to better evaluate the impact of the treatments on factors that may impact need for future surgical intervention and productivity. L-ADR vs. Multidisciplinary Rehabilitation Conclusions and Limitations One high quality CUA (QHES 87/100) was based on an RCT comparing patients receiving 1 or 2 level L-ADR with multidisciplinary rehabilitation for treatment of chronic low back pain secondary to degenerative disc disease was identified.82 A societal perspective was employed. The cost effectiveness of L-ADR appears to be dependent on the utility measure used. Compared with multidisciplinary rehabilitation, L-ADR appears to be a cost effective alternative given a willingness to pay greater than $49,132 based on utilities derived from the EQ-5D. The probability of L-ADR being cost effective was 90% when this measure was used. By contrast, when SF-6D utilities were used, L-ADR no longer appeared to be cost effective and authors estimate that the chance of L-ADR being cost effective form a societal perspective was 40%, i.e. not cost effective.

WA – Health Technology Assessment December 19, 2016
Artificial disc replacement – Re-review: Final evidence report Page - 237
The primary limitation was failure to describe or incorporate information on potential adverse events for L-ADR in particular. In addition, the health care system in Norway and costs likely differ substantially from those in the U.S, possibly limiting the applicability of the findings to the U.S. system. The 24 month follow- up was considered to be short.

WA – Health Technology Assessment December 19, 2016
Artificial disc replacement – Re-review: Final evidence report Page - 238
5.11 Strength of Evidence Summary: C-ADR vs. ACDF (1-level) Efficacy Results
Outcome Follow-up RCTs N* Serious
Risk of Bias Serious
Inconsistency Serious
Indirectness Serious
Imprecision Conclusion* Quality
C-ADR vs. ACDF (1-level)
Overall success†
24 mos. 5 RCTs (Prestige ST, ProDisc-C, Bryan, SECURE-C, & PCM IDE trials)
N= 1681
Yes1 (-1) No No No Pooled RD 9.5% (95% CI 5.3%, 13.7%) Conclusion: C-ADR was superior to ACDF in terms of the percentage of patients who achieved overall success at 24 months.
⨁⨁⨁◯
MODERATE
48-60 mos.
3 RCTs (Mobi-C, Prestige ST, & Bryan IDE trials)
N= 933
Yes1 (-1) No No No Pooled RD 9.6% (95% CI 3.9%, 15.3%) Conclusion: C-ADR was superior to ACDF in terms of the percentage of patients who achieved overall success at 48 to 60 months.
⨁⨁⨁◯
MODERATE
84 mos. 1 RCT (Prestige ST IDE trial)
N= 933
Yes1 (-1) Unknown No Yes3 (-1)
RD 11.8% (95% CI 2.0%, 20.1%) Conclusion: C-ADR was superior to ACDF in terms of the percentage of patients who achieved overall success at 84 months.
⨁⨁◯◯
LOW
NDI success (≥15-point improvement)
24 mos. 5 RCTs (Prestige ST, ProDisc-C, Bryan, SECURE-C, & PCM IDE trials)
N= 1640
Yes1 (-1) No No No Pooled RD 4.3% (95% CI 0.6%, 8.1%) Conclusion: Slightly more C-ADR than ACDF patients achieved NDI success (≥15-point improvement from baseline) at 24 months.
⨁⨁⨁◯
MODERATE
48-60 mos.
3 RCTs (Mobi-C, Prestige ST, & Bryan IDE trials)
N= 933
Yes1 (-1) No No Yes3 (-1)
Pooled RD 5.8% (95% CI -1.8%, 13.3%) Conclusion: C-ADR and ACDF appear to be comparable; no significant difference between groups.
⨁⨁◯◯
LOW
84 mos. 1 RCT (Prestige ST IDE trial)
N= 395
Yes1 (-1) No No Yes3 (-1)
RD 3.2% (95% CI -4.5%, 10.8%) Conclusion: C-ADR and ACDF appear to be comparable; no significant difference between groups.
⨁⨁◯◯
LOW

WA – Health Technology Assessment December 19, 2016
Artificial disc replacement – Re-review: Final evidence report Page - 239
Outcome Follow-up RCTs N* Serious
Risk of Bias Serious
Inconsistency Serious
Indirectness Serious
Imprecision Conclusion* Quality
NDI scores (0-100)
24 mos. 9 RCTs (Prestige ST, ProDisc-C, Mobi-C, Bryan, PCM, & SECURE-C IDE trials; Karabag 2014; Zhang 2012; Zhang 2014)
N= 2183
Yes1 (-1) No No No WMD 1.11 (95% CI -0.06, 2.27) Conclusion: C-ADR may be comparable to ACDF in terms of mean NDI scores at 24 months; the difference between groups was not significant.
⨁⨁⨁◯
MODERATE
48-60 mos.
6 RCTs (ProDisc-C, Mobi-C, Bryan, Prestige ST, & PCM IDE trials; Zhang 2014)
N= 1443
Yes1 (-1) No No No WMD 4.21 (95% CI 1.67, 6.75) Conclusion: C-ADR patients had slightly higher NDI scores than did ACDF patients at 48 to 60 months, although the difference between groups is probably not clinically meaningful. Additionally, this effect appears to stem largely from three moderately high risk of bias trials, as the two moderately low risk of bias trials together suggest equivalence.
⨁⨁⨁◯
MODERATE
84 mos. 2 RCTs (ProDisc-C & Prestige ST IDE trials)
N= 544
Yes1 (-1)
No No Yes4 (-1)
WMD 4.41 (95% CI 0.68, 8.14) Conclusion: C-ADR conferred a slight benefit over ACDF in mean NDI scores, although the difference between groups is probably not clinically meaningful. Additionally, this effect appears to stem largely from the moderately high risk of bias trial, as the moderately low risk of bias trial found no difference between groups.
⨁⨁◯◯
LOW
Neurological success (maintenance/ improvement of motor function, sensory
24 mos. 6 RCTs (Mobi-C, ProDisc-C, Prestige ST, Bryan, PCM, & SECURE-C IDE trials)
N= 1882
Yes1 (-1)
No No No
Pooled RD 3.2% (95% CI 0.8%, 5.7%) Conclusion: C-ADR may be slightly better than ACDF in terms of neurological success at 24 months.
⨁⨁⨁◯
MODERATE

WA – Health Technology Assessment December 19, 2016
Artificial disc replacement – Re-review: Final evidence report Page - 240
Outcome Follow-up RCTs N* Serious
Risk of Bias Serious
Inconsistency Serious
Indirectness Serious
Imprecision Conclusion* Quality
function, and deep tendon reflexes) 48-60
mos. 4 RCTs (ProDisc-C, Bryan, Prestige ST, & PCM IDE trials)
N= 1147
Yes1 (-1)
No No No
Pooled RD 4.0% (95% CI 0.5%, 7.5%), Conclusion: C-ADR may be slightly better than ACDF in terms of neurological success at 48 to 60 months.
⨁⨁⨁◯
MODERATE
84 mos. 2 RCTs (ProDisc-C & Prestige ST IDE trials)
N= 531
Yes1 (-1)
No No Yes3 (-1)
Pooled RD 4.5% (95% CI -4.9%, 13.8%) Conclusion: C-ADAR and ACDF appear to be comparable; no significant difference between groups.
⨁⨁◯◯
LOW
Arm pain success (≥20-point VAS improvement)
24 mos. 2 RCTs (SECURE-C & PCM IDE trials)
N= 578
Yes1 (-1)
No No Yes3 (-1)
Conclusion: Two trials each found no difference between groups in the percentage of patients who achieved arm pain success at 24 months:‡ • SECURE-C trial: RD 4.7% (95% CI -
7.9%, 17.4%) (left arm); RD -2.5% (95% CI -15.1%, 10.1%) (right arm)
• PCM trial: RD 3.8% (95% CI -5.2%, 12.8%) (worst arm)
⨁⨁◯◯
LOW
60 mos. 1 RCT (PCM IDE trial)
N= 288
Yes1 (-1)
Unknown No Yes3 (-1)
RD 9.5% (95% CI -0.4%, 19.5%) Conclusion: C-ADR and ACDF appear to be comparable, no significant difference between groups.
⨁⨁◯◯
LOW
84 mos. No trials No data reported. ⨁◯◯◯
INSUFFICIENT Arm pain VAS scores (0-100)
24 mos. 7 RCTs (Prestige ST, ProDisc-C, Mobi-C, Bryan, PCM, & SECURE-C IDE trials; Zhang 2012)
N= 2015
Yes1 (-1) No No No WMD 1.60 (95% CI 0.51, 2.70) Conclusion: Arm pain VAS scores may be slightly better with C-ADR versus ACDF; however, the difference
⨁⨁⨁◯
MODERATE

WA – Health Technology Assessment December 19, 2016
Artificial disc replacement – Re-review: Final evidence report Page - 241
Outcome Follow-up RCTs N* Serious
Risk of Bias Serious
Inconsistency Serious
Indirectness Serious
Imprecision Conclusion* Quality
between groups is probably not clinically meaningful. Two additional trials (Rozankovic 2016 (N=101), Nabhan 2007 (N=39)), reached similar conclusions but were not included in the pooled analysis.§
48-60 mos.
5 RCTs (ProDisc-C, Mobi-C, Bryan, Prestige ST, & PCM IDE trials)
N= 1332
Yes1 (-1) No No No WMD 3.82 (95% CI 1.15, 6.48) Conclusion: Arm pain VAS scores may be slightly better with C-ADR versus ACDF; however, the difference between groups is probably not clinically meaningful.
⨁⨁⨁◯
MODERATE
84 mos. 2 RCTs (ProDisc-C & Prestige ST IDE trials)
N= 543
Yes1 (-1)
No No Yes4 (-1)
WMD 2.21 (95% CI -2.08, 6.50) Conclusion: C-ADR and ACDF appear to be comparable; no significant difference between groups.
⨁⨁◯◯
LOW
Neck pain success (≥20-point VAS improvement)
24 mos. 2 RCTs (SECURE-C & PCM IDE trials)
N= 578
Yes1 (-1)
No No Yes3 (-1)
Pooled RD 3.6% (95% CI -6.1%, 13.4%) Conclusion: C-ADR and ACDF appear to be comparable; no significant difference between groups.
⨁⨁◯◯
LOW
60 mos. 1 RCT (PCM IDE trial)
N= 288
Yes1 (-1)
Unknown No Yes3 (-1)
-4.0% (95% CI -14.1%, 6.3% Conclusion: C-ADR and ACDF appear to be comparable; no significant difference between groups.
⨁⨁◯◯
LOW
84 mos. No trials No data reported. ⨁◯◯◯
INSUFFICIENT Neck pain VAS scores (0-100)
24 mos. 3 RCTs (Prestige ST, ProDisc-C, Mobi-C IDE trials)
N= 905
Yes1 (-1) No No No WMD 1.29 (95% CI -1.28, 3.86) Conclusion: C-ADR is as good as ACDF. For the three trials at moderately low risk of bias only, no difference was seen between groups. Six additional trials (Bryan, PCM, & SECURE-C IDE trials; Nabhan 2007; Rozankovic 2016;
⨁⨁⨁◯
MODERATE

WA – Health Technology Assessment December 19, 2016
Artificial disc replacement – Re-review: Final evidence report Page - 242
Outcome Follow-up RCTs N* Serious
Risk of Bias Serious
Inconsistency Serious
Indirectness Serious
Imprecision Conclusion* Quality
Zhang 2012) (N=1250) reported this outcome; however, the resulting pooled estimate, which favored C-ADR, had high statistical heterogeneity (I2=80%) (WMD 5.11 (95% CI 2.55, 7.66)).
48-60 mos.
5 RCTs (ProDisc-C, Mobi-C, Bryan, Prestige ST, & PCM IDE trials)
N= 1331
Yes1 (-1) No No No WMD 6.63 (95% CI 3.29, 9.97) Conclusion: C-ADR is as good as or slightly better than ACDF; C-ADR may confer a slight benefit over ACDF in mean NDI scores, although the difference between groups is most likely not clinically meaningful.
⨁⨁⨁◯
MODERATE
84 mos. 2 RCTs (ProDisc-C & Prestige ST IDE trials)
N= 543
Yes1 (-1) No No Yes4 (-1)
WMD 5.59 (95% CI 1.31, 9.86) Conclusion: C-ADR is as good as or slightly better than ACDF; C-ADR may confer a slight a slight benefit over ACDF in terms of mean neck pain VAS scores, although the difference between groups is probably not clinically meaningful. Additionally, this effect appears to stem largely from the moderately high risk of bias trial, as the moderately low risk of bias trial found no difference between groups.
⨁⨁◯◯
LOW
* Unless otherwise specified, conclusion and patient numbers were based on completer analysis, for which the effect estimate was more conservative than that of the ITT analysis.
† Overall clinical success included the following components: • NDI score improvement ≥ 15 points (from baseline) • Maintenance or improvement in neurological status • No additional surgery from device failure (removal, revision, supplemental fixation) • No device-related adverse events and/or major complications • In addition, one trial required patients to achieve radiological success for motion (PCM trial); another stipulated no changes to the treatment plan made
intraoperatively (SECURE-C trial) ‡ Results could not be pooled due to differences in data reporting between the trials.

WA – Health Technology Assessment December 19, 2016
Artificial disc replacement – Re-review: Final evidence report Page - 243
§ Two trials were excluded from the pooled analysis because their mean differences were both considerably different from those reported by other trials and their inclusion led to high statistical heterogeneity
Reasons for downgrading: 1. Serious risk of bias: the majority of studies violated one or more of the criteria for good quality RCT (or cohort study) related to the outcome reported (see Appendix for
details) 2. Inconsistency: differing estimates of effects across trials 3. Imprecise effect estimate for a dichotomous outcome: small sample size and/or confidence interval includes both negligible effect and appreciable benefit or harm with
ADR 4. Imprecise effect estimate for a continuous outcome: wide (or unknown) confidence interval and/or small sample size

WA – Health Technology Assessment December 19, 2016
Artificial disc replacement – Re-review: Final evidence report Page - 244
5.12 Strength of Evidence Summary: C-ADR vs. ACDF (2-level) Efficacy Results
Outcome Follow-up RCTs N* Serious
Risk of Bias Serious
Inconsistency Serious
Indirectness Serious
Imprecision Conclusion* Quality
C-ADR vs. ACDF (2-level)
Overall success†
24 mos. 1 RCT (Mobi-C (2-level) ST IDE trial))
N= 320
Yes1 (-1) Unknown No No RD 23.2% (95% CI 11.6%, 34.8%) Conclusion: C-ADR was superior to ACDF in terms of the percentage of patients who achieved overall success at 24 months.
⨁⨁⨁◯
MODERATE
60 mos. 1 RCT (Mobi-C (2-level) ST IDE trial))
N= 297
Yes1 (-1) Unknown No No RD 29.6% (95% CI 18.1%, 41.2%) Conclusion: C-ADR was superior to ACDF in terms of the percentage of patients who achieved overall success at 60 months.
⨁⨁⨁◯
MODERATE
84 mos. No trials No data reported. ⨁◯◯◯
INSUFFICIENT NDI success‡ 24 mos. 1 RCT
(Mobi-C (2-level) ST IDE trial))
N= 320
Yes1 (-1) Unknown No No RD 16.7% (95% CI 5.7%, 27.7%) Conclusion: C-ADR was superior to ACDF in terms of the percentage of patients who achieved NDI success at 24 months.
⨁⨁⨁◯
MODERATE
48 mos. 1 RCT (Mobi-C (2-level) ST IDE trial))
N= 285
Yes1 (-1) Unknown No No RD 26.6% (95% CI 14.6%, 38.6%) Conclusion: C-ADR was superior to ACDF in terms of the percentage of patients who achieved NDI success at 24 months.
⨁⨁⨁◯
MODERATE
84 mos. No trials No data reported. ⨁◯◯◯
INSUFFICIENT NDI scores 24 mos. 2 RCTs
(Mobi-C (2-level) ST IDE trial), Cheng 2009)
N= 353
Yes1 (-1) Unknown No Yes4 (-1)
Conclusion: C-ADR may be slightly better than ACDF in terms of NDI scores; both trials reported significantly better scores following C-ADR: one moderately low risk of bias trial (Mobi-C, N=291) (MD -7.5 (95% CI -12.0, -3.0))
⨁⨁◯◯
LOW

WA – Health Technology Assessment December 19, 2016
Artificial disc replacement – Re-review: Final evidence report Page - 245
Outcome Follow-up RCTs N* Serious
Risk of Bias Serious
Inconsistency Serious
Indirectness Serious
Imprecision Conclusion* Quality
and another moderately high risk of bias trial (Cheng 2009, N=62) (11 vs. 19, MD -8 (95% CI NR), p=0.02). Differences may not be clinically meaningful.
60 mos. 1 RCT (Mobi-C (2-level) ST IDE trial))
N= 258
Yes1 (-1) No No Yes4 (-1)
MD -9.6 (95% CI -14.6, -4.6) Conclusion: NDI scores may be slightly better with C-ADR versus ACDF; however, differences may not be clinically meaningful.
⨁⨁◯◯
LOW
84 mos. No trials No data reported. ⨁◯◯◯
INSUFFICIENT Neurological success (maintenance/ improvement of motor function, sensory function, and deep tendon reflexes)
24 mos. 1 RCT (Mobi-C (2-level) ST IDE trial))
N= 320
Yes1 (-1) Unknown No Yes3 (-1)
RD 1.6% (95% CI -4.2%, 7.5%) Conclusion: C-ADR and ACDF appear to be comparable; no significant difference between groups.
⨁⨁◯◯
LOW
60 mos. 1 RCT (Mobi-C (2-level) ST IDE trial))
N= 297
Yes1 (-1) Unknown No Yes3 (-1)
RD -2.4% (95% CI -8.7%, 4.0%) Conclusion: C-ADR and ACDF appear to be comparable; no significant difference between groups.
⨁⨁◯◯
LOW
84 mos. No trials No data reported. ⨁◯◯◯
INSUFFICIENT
Arm or neck pain success
Any No trials No data reported. ⨁◯◯◯
INSUFFICIENT
Arm pain VAS scores (0-100)
24 mos. 2 RCTs (Mobi-C (2-level) ST IDE trial), Cheng 2009)
N= 353
Yes1 (-1) No No Yes4 (-1)
Conclusion: C-ADR is as good as or slightly better than ACDF in terms of arm pain scores: while one moderately low risk of bias trial (Mobi-C, N=291) found no difference between groups (MD -4.3 (95% CI -9.5, 0.9)), another moderately high risk of bias trial (Cheng 2009, N=62) found better scores with C-ADR than with ACDF (14 vs. 27, MD -
⨁⨁◯◯
LOW

WA – Health Technology Assessment December 19, 2016
Artificial disc replacement – Re-review: Final evidence report Page - 246
Outcome Follow-up RCTs N* Serious
Risk of Bias Serious
Inconsistency Serious
Indirectness Serious
Imprecision Conclusion* Quality
13 (95% CI NR), p=0.01). Differences may not be clinically meaningful.
48 mos. 1 RCT (Mobi-C (2-level) ST IDE trial))
N= 255
Yes1 (-1) No No Yes4 (-1)
MD in ∆ scores: -3.0 (95% CI -11.6, 5.6) Conclusion: C-ADR and ACDF appear to be comparable; no significant difference between groups.
⨁⨁◯◯
LOW
84 mos. No trials No data reported. ⨁◯◯◯
INSUFFICIENT
Neck pain VAS scores (0-100)
24 mos. 2 RCTs (Mobi-C (2-level) ST IDE trial), Cheng 2009)
N= 353
Yes1 (-1) No No Yes4 (-1)
Conclusion: C-ADR is as good as or slightly better than ACDF in terms of neck pain scores: while one moderately low risk of bias trial (Mobi-C, N=291) found no difference between groups (MD -3.9 (95% CI -10.1, 2.3)), another moderately high risk of bias trial (Cheng 2009, N=62) reported better scores with C-ADR than with ACDF (15 vs. 26, MD -11 (95% CI NR), p=0.01). Differences may not be clinically meaningful
⨁⨁◯◯
LOW
48 mos. 1 RCT (Mobi-C (2-level) ST IDE trial))
N= 255
Yes1 (-1) No No Yes4 (-1)
MD in ∆ scores: -5.0 (95% CI -13.3, 3.3) Conclusion: C-ADR and ACDF appear to be comparable; no significant difference between groups.
⨁⨁◯◯
LOW
84 mos. No trials No data reported. ⨁◯◯◯
INSUFFICIENT * Unless otherwise specified, conclusion and patient numbers were based on completer analysis, for which the effect estimate was more conservative than that of the ITT
analysis. † Overall clinical success required all of the following:
• NDI improvement of at least 15 points (out of 50) from baseline • Maintenance or improvement in all components of neurological status • No subsequent surgical intervention at the index level or levels; • No potentially (possibly or probably) device-related adverse event; • No Mobi-C intraoperative changes in treatment.

WA – Health Technology Assessment December 19, 2016
Artificial disc replacement – Re-review: Final evidence report Page - 247
‡ NDI success was defined as postoperative ≥30-point improvement on the NDI if the baseline score was ≥60, or ≥50% improvement if the baseline score was <60. Reasons for downgrading: 1. Serious risk of bias: the majority of studies violated one or more of the criteria for good quality RCT (or cohort study) related to the outcome reported (see Appendix for
details) 2. Inconsistency: differing estimates of effects across trials 3. Imprecise effect estimate for a dichotomous outcome: small sample size and/or confidence interval includes both negligible effect and appreciable benefit or harm with
ADR 4. Imprecise effect estimate for a continuous outcome: wide (or unknown) confidence interval and/or small sample size

WA – Health Technology Assessment December 19, 2016
Artificial disc replacement – Re-review: Final evidence report Page - 248
5.13 Strength of Evidence Summary: C-ADR vs. ACDF (Mixed levels (1-, 2-, or 3-level)) Efficacy Results
Outcome Follow-up RCTs N* Serious
Risk of Bias Serious
Inconsistency Serious
Indirectness Serious
Imprecision Conclusion* Quality
C-ADR vs. ACDF (Mixed levels (1-, 2-, or 3-level))
Overall, NDI, or neurological success
Any No trials No data reported. ⨁◯◯◯
INSUFFICIENT
NDI scores 24 mos. 1 RCT (Skeppholm 2015)
N= 143
Yes1 (-1) Unknown No Yes4 (-1)
MD -1.0 (95% CI -7.4, 5.4) Conclusion: C-ADR and ACDF appear to be comparable .No significant difference between groups in one trial of radiculopathy patients.
⨁⨁◯◯
LOW
24-36 mos.
1 RCT (Cheng 2011)
N= 81
Yes1 (-1) Unknown No Yes4 (-1)
Conclusion: C-ADR is as good as or slightly better. One trial of myelopathy patients reported better scores with C-ADR than with ACDF at 24 months (13 vs. 16, MD -3 (95% CI NR), p=0.01) and 36 months (12 vs. 17, MD -5 (95% CI NR), p<0.01), although this difference is not likely to be clinically meaningful.
⨁⨁◯◯
LOW
48-60 or 84 mos.
No trials No data reported. ⨁◯◯◯
INSUFFICIENT
Arm or neck pain success
Any No trials No data reported. ⨁◯◯◯
INSUFFICIENT
Arm pain VAS scores (0-100)
24 mos. 1 RCT (Skeppholm 2015)
N= 143
Yes1 (-1) Unknown No Yes4 (-1)
MD 0.4 (95% CI -7.7, 8.5) Conclusion: C-ADR and ACDF appear to be comparable. No significant difference between groups.
⨁⨁◯◯
LOW

WA – Health Technology Assessment December 19, 2016
Artificial disc replacement – Re-review: Final evidence report Page - 249
Outcome Follow-up RCTs N* Serious
Risk of Bias Serious
Inconsistency Serious
Indirectness Serious
Imprecision Conclusion* Quality
48-60, 84 mos.
No trials No data reported. ⨁◯◯◯
INSUFFICIENT
Neck pain VAS scores (0-100)
24 mos. 1 RCT (Skeppholm 2015)
N= 143
Yes1 (-1) Unknown No Yes4 (-1)
MD -1.2 (95% CI -9.9, 7.5) Conclusion: C-ADR and ACDF appear to be comparable. No significant difference between groups.
⨁⨁◯◯
LOW
48-60, 84 mos.
No trials No data reported. ⨁◯◯◯
INSUFFICIENT * Unless otherwise specified, conclusion and patient numbers were based on completer analysis, for which the effect estimate was more conservative than that of the ITT
analysis. Reasons for downgrading: 1. Serious risk of bias: the majority of studies violated one or more of the criteria for good quality RCT (or cohort study) related to the outcome reported (see Appendix for
details) 2. Inconsistency: differing estimates of effects across trials 3. Imprecise effect estimate for a dichotomous outcome: small sample size and/or confidence interval includes both negligible effect and appreciable benefit or harm with
ADR 4. Imprecise effect estimate for a continuous outcome: wide (or unknown) confidence interval and/or small sample size

WA – Health Technology Assessment December 19, 2016
Artificial disc replacement – Re-review: Final evidence report Page - 250
5.14 Strength of Evidence Summary: C-ADR vs. ACDF with a zero-profile device (2 non-contiguous levels) Efficacy Results
Outcome Follow-up RCTs N* Serious
Risk of Bias Serious
Inconsistency Serious
Indirectness Serious
Imprecision Conclusion* Quality
C-ADR vs. ACDF with a zero-profile device (2 non-contiguous levels)
Overall, NDI, or neurological success
Any No trials No data reported. ⨁◯◯◯
INSUFFICIENT
NDI scores Mean 32.4 (24-46) mos.
1 RCT (Qizhi 2016)
N= 30
Yes1 (-1) Unknown No Yes4 (-1)
MD 0.3 (95% CI -0.4, 1.0) Conclusion: C-ADR and ACDF appear to be comparable No significant difference between groups possibly due in part to small sample size.
⨁⨁◯◯
LOW
Arm or neck pain success or scores
Any No trials No data reported. ⨁◯◯◯
INSUFFICIENT
* Unless otherwise specified, conclusion and patient numbers were based on completer analysis, for which the effect estimate was more conservative than that of the ITT analysis.
Reasons for downgrading: 1. Serious risk of bias: the majority of studies violated one or more of the criteria for good quality RCT (or cohort study) related to the outcome reported (see Appendix for
details) 2. Inconsistency: differing estimates of effects across trials 3. Imprecise effect estimate for a dichotomous outcome: small sample size and/or confidence interval includes both negligible effect and appreciable benefit or harm with
ADR 4. Imprecise effect estimate for a continuous outcome: wide (or unknown) confidence interval and/or small sample size

WA – Health Technology Assessment December 19, 2016
Artificial disc replacement – Re-review: Final evidence report Page - 251
5.15 Strength of Evidence Summary: C-ADR vs. ACDF (1-level) Safety Results
Outcome Follow-up RCTs N* Serious
Risk of Bias Serious
Inconsistency Serious
Indirectness Serious
Imprecision Conclusion* Quality
C-ADR vs. ACDF (1-level)
Secondary surgery at the index level
24 mos. 8 RCTs (Prestige ST, Mobi-C, ProDisc-C, Bryan, PCM, & SECURE-C IDE trials; Karabag 2014; Rozankovic 2016)
N= 2299
Yes1 (-1) No No No C-ADR 2.9%, ACDF 6.2% Pooled RD 3.1% (95% CI 1.1%, 5.1%) Conclusion: Fewer patients in the C-ADR group underwent secondary surgery at the index level through 24 months compared with those in the ACDF group.
⨁⨁⨁◯
MODERATE
48-60 mos.
4 RCTs (Mobi-C, ProDisc-C, Bryan, & PCM IDE trials)
N= 1335
Yes1 (-1) No No Yes3 (-1)
C-ADR 4.6%, ACDF 9.3% Pooled RD 4.8% (95% CI 0.8%, 8.8%) Conclusion: Fewer patients in the C-ADR group underwent secondary surgery at the index level through 48 or 60 months compared with those in the ACDF group.
⨁⨁◯◯
LOW
84 mos. 2 RCTs (ProDisc-C & Prestige ST IDE trials)
N= 750
Yes1 (-1) No No Yes3 (-1)
C-ADR 4.5%, ACDF 12.1% RD 7.5% (95% CI 3.6%, 11.4%) Conclusion: C-ADR was superior to ACDF in terms of the percentage of patients who underwent secondary surgery at the index level through 84 months.
⨁⨁◯◯
LOW
Serious/ major adverse events* (as classified by the trial)
24 mos. 5 RCTs (Prestige ST, ProDisc-C, Bryan, SECURE-C, & PCM IDE trials)
N= 2388
Yes1 (-1) No No Yes3 (-1)
C-ADR 24.3%, ACDF 31.0% Pooled RD 6.8% (95% CI 2.0%, 11.6%) Conclusion: Slightly fewer C-ADR than ACDF patients had serious adverse events (as classified by the trial) through at 24 months.
⨁⨁◯◯
LOW
24-48 mos.
1 RCT (Bryan ST IDE trial)
N= 463
Yes1 (-1) Unknown No Yes3 (-1)
C-ADR 17.4%, ACDF 17.1% RD -0.3% (95% CI -7.2%, 6.7%) Conclusion: No significant difference between groups.
⨁⨁◯◯
LOW

WA – Health Technology Assessment December 19, 2016
Artificial disc replacement – Re-review: Final evidence report Page - 252
Outcome Follow-up RCTs N* Serious
Risk of Bias Serious
Inconsistency Serious
Indirectness Serious
Imprecision Conclusion* Quality
0-48 mos.
1 RCT (Mobi-C IDE trial)
N= 260
Yes1 (-1) Unknown No Yes3 (-1)
C-ADR 10.1%, ACDF 9.9% RD -0.2% (95% CI -8.0%, 7.7%) Conclusion: No significant difference between groups.
⨁⨁◯◯
LOW
24-84 mos.
1 RCT (PCM ST IDE trial)
N= 404
Yes1 (-1) Unknown No Yes3 (-1)
C-ADR 21.0%, ACDF 17.4% RD -3.7% (95% CI -11.3%, 4.0%) Conclusion: No significant difference between groups.
⨁⨁◯◯
LOW
Device-related adverse events† (as classified by the trial)
24 mos. 6 RCTs (Prestige ST, ProDisc-C, Mobi-C, Bryan, PCM, & SECURE-C IDE trials)
N= 2167
Yes1 (-1) No No No C-ADR 4.9%, ACDF 10.8% Pooled RD 4.9% (95% CI 2.8%, 7.1%) Conclusion: Device-related adverse events (as classified by the trial) were less common with C-ADR than ACDF through at 24 months.
⨁⨁⨁◯
MODERATE
60 mos. 2 RCTs (Mobi-C & ProDisc-C IDE trials)
N= 469
Yes1 (-1) No No No C-ADR 3.9%, ACDF 3.2% Pooled RD 0.4% (95% CI -3.4%, 4.3%) Conclusion: No significant difference between groups.
⨁⨁⨁◯
MODERATE
84 mos. 1 RCT (ProDisc-C IDE trial)
N= 209
Yes1 (-1) Unknown No Yes3 (-1)
C-ADR 27.2%, ACDF 28.3% RD 1.1% (95% CI -11.0%, 13.3%) Conclusion: No significant difference between groups.
⨁⨁◯◯
LOW
* Defined as: • Bryan IDE trial: Most serious adverse events were related to medical conditions and not to the procedure, implant, or cervical spine disease. Classified as WHO grade 3
or 4 (taken from Anderson 2008) (grade 3 events required medical treatment or may have had a long-term health effect; grade 4 events required an operation, were life threatening, permanent disability, or caused death).
• PCM IDE trial: any event that results in death, serious injury, permanent impairment; or that prolongs hospitalization or requires surgical intervention to prevent death or serious injury; classified by the Clinical Events Committee.
• Mobi-C IDE trial: any event that results in death, serious injury, permanent impairment; or that prolongs hospitalization or requires surgical intervention to prevent death or serious injury; or that was a congenital anomaly or birth defect; classified by the Clinical Events Committee.
• ProDisc-C IDE trial: “Severe or life-threatening adverse event”: defined as any event requiring hospitalization or surgery (see SSED Table 18). • Secure-C IDE trial: “Severe or life-threatening adverse event”: a severe event was defined as any event that significantly limits the patient’s ability to perform routine
activities despite symptomatic therapy; a life-threatening event was defined as any event that required removal of the implant or put the patient at immediate risk of death (including death) (see SSED Table 19).
† Defined as:

WA – Health Technology Assessment December 19, 2016
Artificial disc replacement – Re-review: Final evidence report Page - 253
• Prestige ST IDE trial: events included anatomical/technical difficulty, implant displacement/loosening, infection, neck and/or arm pain, neurological, non-union, pending non-union, and subsidence.
• Bryan IDE trial: events included malpositioned implant, neck and/or arm pain, non-union, other, pending non-union, spinal event, and trauma. • Mobi-C IDE trial: events included spinal ligament ossification, neck pain, muscle spasms, radiculopathy, subsidence, medical device complication, misplaced screw
coded as device complication. • ProDisc-C IDE trial (0-24 months): events included dysphagia, superficial wound infection, musculoskeletal, neck pain, and index-level surgery. • ProDisc-C IDE trial (0-84 months): adjacent-level degenerative disc disease or degenerative joint changes, cardiovascular, dysphagia, headache, musculoskeletal,
musculoskeletal neck spasms, neurologic, numbness, ossification, other, back and lower extremity pain, incision site pain, neck pain, neck and other pain, neck and shoulder pain, neck and upper extremity pain, neck and upper extremity pain with numbness, surgery for device related events (index or other level), wound issues.
• Secure-C IDE trial: device-related adverse events were classified by the Clinical Events Committee and included those events that were linked to the device (revision, removal, reoperation, or supplemental fixation at the index level; fracture or mechanical failure of the device, pseudarthrosis, radiolucency around the device, migration, subsidence, loosening, etc. Neck and arm pain were excluded from this category of adverse events.
Reasons for downgrading: 1. Serious risk of bias: the majority of studies violated one or more of the criteria for good quality RCT (or cohort study) related to the outcome reported (see Appendix for details) 2. Inconsistency: differing estimates of effects across trials 3. Imprecise effect estimate for a dichotomous outcome: small sample size and/or confidence interval includes both negligible effect and appreciable benefit or harm with ADR. If sample size is likely too small to detect rare outcomes, evidence may be downgraded twice.
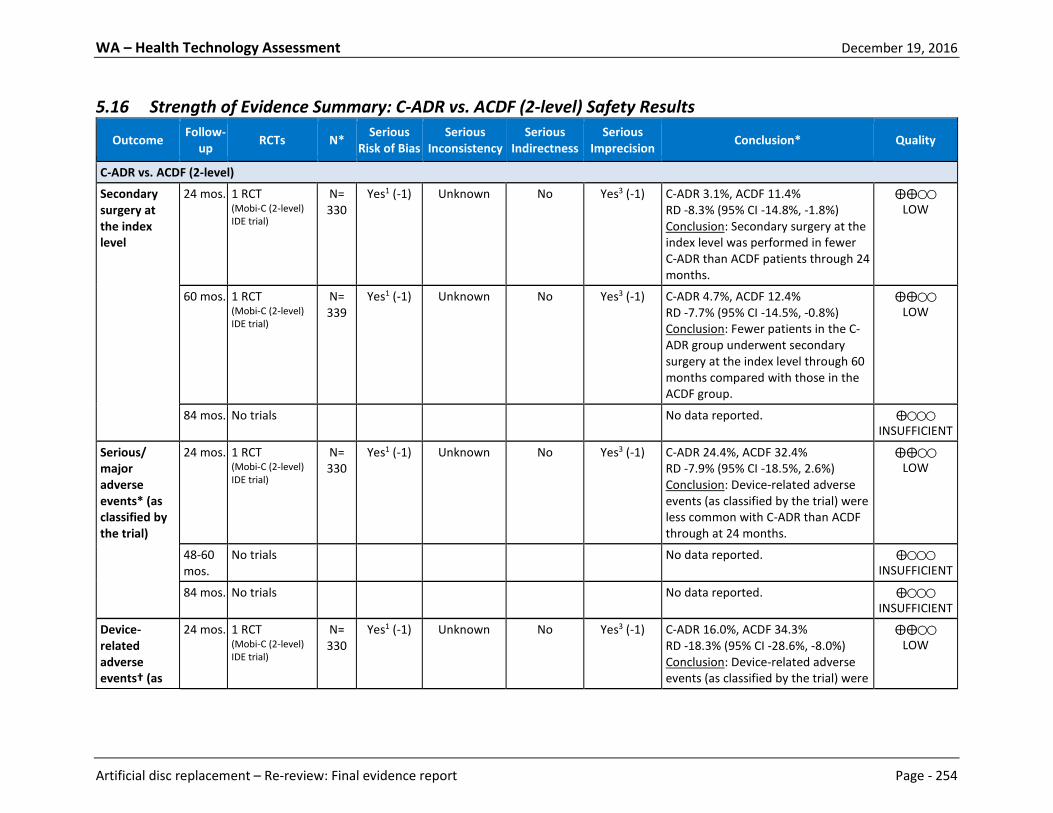
WA – Health Technology Assessment December 19, 2016
Artificial disc replacement – Re-review: Final evidence report Page - 254
5.16 Strength of Evidence Summary: C-ADR vs. ACDF (2-level) Safety Results
Outcome Follow-up RCTs N* Serious
Risk of Bias Serious
Inconsistency Serious
Indirectness Serious
Imprecision Conclusion* Quality
C-ADR vs. ACDF (2-level)
Secondary surgery at the index level
24 mos. 1 RCT (Mobi-C (2-level) IDE trial)
N= 330
Yes1 (-1) Unknown No Yes3 (-1)
C-ADR 3.1%, ACDF 11.4% RD -8.3% (95% CI -14.8%, -1.8%) Conclusion: Secondary surgery at the index level was performed in fewer C-ADR than ACDF patients through 24 months.
⨁⨁◯◯
LOW
60 mos. 1 RCT (Mobi-C (2-level) IDE trial)
N= 339
Yes1 (-1) Unknown No Yes3 (-1)
C-ADR 4.7%, ACDF 12.4% RD -7.7% (95% CI -14.5%, -0.8%) Conclusion: Fewer patients in the C-ADR group underwent secondary surgery at the index level through 60 months compared with those in the ACDF group.
⨁⨁◯◯
LOW
84 mos. No trials No data reported. ⨁◯◯◯
INSUFFICIENT Serious/ major adverse events* (as classified by the trial)
24 mos. 1 RCT (Mobi-C (2-level) IDE trial)
N= 330
Yes1 (-1) Unknown No Yes3 (-1)
C-ADR 24.4%, ACDF 32.4% RD -7.9% (95% CI -18.5%, 2.6%) Conclusion: Device-related adverse events (as classified by the trial) were less common with C-ADR than ACDF through at 24 months.
⨁⨁◯◯
LOW
48-60 mos.
No trials No data reported. ⨁◯◯◯
INSUFFICIENT 84 mos. No trials No data reported. ⨁◯◯◯
INSUFFICIENT Device-related adverse events† (as
24 mos. 1 RCT (Mobi-C (2-level) IDE trial)
N= 330
Yes1 (-1) Unknown No Yes3 (-1)
C-ADR 16.0%, ACDF 34.3% RD -18.3% (95% CI -28.6%, -8.0%) Conclusion: Device-related adverse events (as classified by the trial) were
⨁⨁◯◯
LOW

WA – Health Technology Assessment December 19, 2016
Artificial disc replacement – Re-review: Final evidence report Page - 255
Outcome Follow-up RCTs N* Serious
Risk of Bias Serious
Inconsistency Serious
Indirectness Serious
Imprecision Conclusion* Quality
classified by the trial)
less common with C-ADR than ACDF through at 24 months.
48-60 mos.
No trials No data reported. ⨁◯◯◯
INSUFFICIENT 84 mos. No trials No data reported. ⨁◯◯◯
INSUFFICIENT * Classified by the Clinical Events Committee as possibly or definitely related to the device, and included anatomy/technical difficulty, dysphagia/dysphonia, gastrointestinal,
heterotopic ossification, malpositioned implant, neck and/or arm pain, neurological, non-union, other, other pain, respiratory, spinal disorder, trauma. † Serious adverse events met one or more of the following criteria: 1) resulted in death; 2) was life-threatening (immediate risk of death); 3) required inpatient hospitalization or
prolonged hospitalization; 4) resulted in persistent or significant disability or incapacity; 5) necessitated medical or surgical intervention to preclude permanent impairment of a body function or permanent damage to a body structure; or 6) was a congenital anomaly or birth defect. Reported events included: anatomy/technical difficulty, cancer, cardiovascular, death, dysphagia/dysphonia, gastrointestinal, infection (systemic or local), malpositioned implant, migration of implant, neck and/or arm pain, neurological, non-union, other, other pain, respiratory, spinal disorder, trauma, upper extremity nerve entrapment, urogenital, non-infectious wound issue (hematoma, CSF leakage).
Reasons for downgrading: 1. Serious risk of bias: the majority of studies violated one or more of the criteria for good quality RCT (or cohort study) related to the outcome reported (see Appendix for
details) 2. Inconsistency: differing estimates of effects across trials 3. Imprecise effect estimate for a dichotomous outcome: small sample size and/or confidence interval includes both negligible effect and appreciable benefit or harm with
ADR. If sample size is likely too small to detect rare outcomes, evidence may be downgraded twice.

WA – Health Technology Assessment December 19, 2016
Artificial disc replacement – Re-review: Final evidence report Page - 256
5.17 Strength of Evidence Summary: C-ADR vs. ACDF (Mixed level (1-, 2-, or 3-level) Safety Results
Outcome Follow-up RCTs N* Serious
Risk of Bias Serious
Inconsistency Serious
Indirectness Serious
Imprecision Conclusion* Quality
C-ADR vs. ACDF (Mixed level (1-, 2-, or 3-level)
Secondary surgery at the index level
24-36 mos.
2 RCTs (Skeppholm 2015, Cheng 2011)
N= 234
Yes1 (-1) No No Yes3 (-1)
24 mos. (N=151): C-ADR 6.2%, ACDF 1.4% RD 4.7% (95% CI -1.2%, 10.7%)
36 mos. (N=83): C-ADR 0%, ACDF 0% RD 0% (95% CI not calculable)
Conclusion: No significant difference between groups.
⨁⨁◯◯
LOW
48-60 mos.
No trials No data reported. ⨁◯◯◯
INSUFFICIENT 84 mos. No trials No data reported. ⨁◯◯◯
INSUFFICIENT Serious/ major adverse events
24-36 mos.
2 RCTs (Skeppholm 2015, Cheng 2011)
N= 234
Yes1 (-1) No No Yes3 (-1)
Conclusion: No serious adverse events were reported by either trial.
⨁⨁◯◯
LOW
48-60 mos.
No trials No data reported. ⨁◯◯◯
INSUFFICIENT
84 mos. No trials No data reported. ⨁◯◯◯
INSUFFICIENT Device-related adverse events
24-36 mos.
2 RCTs (Skeppholm 2015, Cheng 2011)
N= 234
Yes1 (-1) No No Yes3 (-1)
Conclusion: No overall summary of device-related adverse events was reported by either trial. With the exception of dysphagia, which was less common in the C-ADR group than in the ACDF group (Skeppholm: 11.8% vs. 19.9% through 24 months, p=0.31; Cheng 2011: 2.4% vs. 16.7% through 36 months, p<0.01), complications attributable to the device occurred
⨁⨁◯◯
LOW

WA – Health Technology Assessment December 19, 2016
Artificial disc replacement – Re-review: Final evidence report Page - 257
Outcome Follow-up RCTs N* Serious
Risk of Bias Serious
Inconsistency Serious
Indirectness Serious
Imprecision Conclusion* Quality
similarly between groups, and occurred in relatively few patients (0-2.4% of the C-ADR group; 0% in the ACDF group) across both trials.
48-60 mos.
No trials No data reported. ⨁◯◯◯
INSUFFICIENT 84 mos. No trials No data reported. ⨁◯◯◯
INSUFFICIENT Reasons for downgrading: 1. Serious risk of bias: the majority of studies violated one or more of the criteria for good quality RCT (or cohort study) related to the outcome reported (see Appendix for
details) 2. Inconsistency: differing estimates of effects across trials 3. Imprecise effect estimate for a dichotomous outcome: small sample size and/or confidence interval includes both negligible effect and appreciable benefit or harm with
ADR. If sample size is likely too small to detect rare outcomes, evidence may be downgraded twice.

WA – Health Technology Assessment December 19, 2016
Artificial disc replacement – Re-review: Final evidence report Page - 258
5.18 Strength of Evidence Summary: C-ADR vs. ACDF with a zero-profile device (2 non-contiguous levels) Safety Results
Outcome Follow-up RCTs N* Serious
Risk of Bias Serious
Inconsistency Serious
Indirectness Serious
Imprecision Conclusion* Quality
C-ADR vs. ACDF with a zero-profile device (2 non-contiguous levels)
Secondary surgery at the index level
Any No data reported. ⨁◯◯◯
INSUFFICIENT
Serious/ major adverse events
Mean 32.4 (24-46) mos.
1 RCT (Qizhi 2016)
N=30 Yes1 (-1) Unknown No Yes3 (-2)
Conclusion: No serious adverse events were reported.
⨁◯◯◯
INSUFFICIENT
Device-related adverse events
Mean 32.4 (24-46) mos.
1 RCT (Qizhi 2016)
N=30 Yes1 (-1) Unknown No Yes3 (-2)
Conclusion: All events that could be attributed to the device occurred similarly between groups, but no summary of device-related adverse events was reported.
⨁◯◯◯
INSUFFICIENT
Reasons for downgrading: 1. Serious risk of bias: the majority of studies violated one or more of the criteria for good quality RCT (or cohort study) related to the outcome reported (see Appendix for
details) 2. Inconsistency: differing estimates of effects across trials 3. Imprecise effect estimate for a dichotomous outcome: small sample size and/or confidence interval includes both negligible effect and appreciable benefit or harm with
ADR. If sample size is likely too small to detect rare outcomes, evidence may be downgraded twice.
5.19 Strength of Evidence Summary: Differential Efficacy and Safety Results – C-ADR
Outcome Follow-up RCTs N* Serious
Risk of Bias Serious
Inconsistency Serious
Indirectness Serious
Imprecision Conclusion* Quality
C-ADR vs. ACDF
Any Any No studies were identified which stratified on patient characteristics or evaluated effect modification.
⨁◯◯◯
INSUFFICIENT

WA – Health Technology Assessment December 19, 2016
Artificial disc replacement – Re-review: Final evidence report Page - 259
5.20 Strength of Evidence Summary: Cost-effectiveness Results – C-ADR Assessment of the overall strength of evidence for formal economic analyses does not appear to be documented in the literature. As such, a summary of the primary results from these studies is provided below. C-ADR vs. Fusion 1-level Conclusions and Limitations Overall, results from four CUAs92,102,131,133 found that both C-ADR and ACDF were cost effective options based on a WTP threshold of $50,000. However, C-ADR was more effective and less costly than ACDF for 1-level disc procedures. One study found ACD (without fusion) to be the dominant intervention, which outperformed both C-ADR and ACDF. A general consensus in many of the studies and a common limitation noted was the necessity for a longer follow-up period. The complicated nature of estimating some of the necessary effectiveness and cost variables resulted in what some authors admit to be overly simplistic assumptions, particularly in terms of arriving at utility values for health states and/or determining greater encompassing health state possibilities. QHES scores ranged from 62 to 91. C-ADR vs. Fusion 2-level Conclusions and Limitations Two studies assuming a U.S. societal perspective were identified.4,5 Both were conducted by the same author and used many of the same assumptions. Based on a WTP threshold of $50,000/QALY, C-ADR was cost-effective when compared to ACDF for 2-level degenerative disc disease with radiculopathy or myelopathy that had not responded to six weeks of conservative care. Given the parallels between the two studies, the 60-month cost-effectiveness of C-ADR was shown to be even more dramatic than in the previous 24-month study. The notably large difference between the societal (includes direct and indirect costs) and healthcare (includes direct costs only) perspective ICERs (-$165,103 and $8518, respectively) was credited to the differences in 60-month productivity loss for C-ADR versus ACDF ($57,447 vs. $91,824, respectively), which was the result of different return to work rates for C-ADR versus ACDF (80.6% vs. 65.4%, respectively, at 24 months). To reconcile the large difference between the studies of different follow-up time, the authors suggest the greater QALYs and reduced cost as well as more realistic return to work data are the key driving factors. While both studies received high QHES scores (100/00) there were inherent limitations relating to time horizon (noting the significant difference in the two studies given the different follow-up) as well as availability of complete cost information- operating times and length of hospitalization were not captured. A variety of sensitivity measures were undertaken to address concerns stemming from the inherent limitations.

WA – Health Technology Assessment December 19, 2016
Artificial disc replacement – Re-review: Final evidence report Page - 260
Figures
Figure 3. L-ADR vs. Fusion (1 level): Overall Clinical Success*, ITT Analysis a. 24 months
b. 60 months†
* The FDA criterion of at least a 15-point improvement from baseline ODI scores was used for both RCTs to minimize heterogeneity in the meta-analysis. The definition of overall clinical success was similar in the two studies, but not identical. In the Prodisc-L study, success was defined more conservatively than the Charité study in that it required improvement in the SF-36 and radiological success as additional criteria. The addition of these parameters would make success more difficult to achieve resulting in a lower proportion of patients attaining overall clinical success, but not likely biasing the results between study groups. Detailed criteria are presented in the text.
† Guyer 2009: Data available for 8 of the original 14 clinical sites; follow-up at 60 months, 43.8%. Zigler follow-up 69.9% at 60 months.
‡For overall success, a ≥15 point improvement from baseline in ODI was requested by the FDA and not a planned analysis; thus the authors performed additional analyses (see Alternative Analyses section of Zigler 2012). We used the N’s provided for protocol-defined overall success (ODI improvement ≥15%) and back-calculated the numerators; author analysis excludes 4 deaths and 4 early device removal as “failures” from the total population initially. It is unclear which groups they belong to so n/N that includes these cannot be calculated

WA – Health Technology Assessment December 19, 2016
Artificial disc replacement – Re-review: Final evidence report Page - 261
Figure 4. L-ADR vs. Fusion (1 level): Overall Clinical Success*, Completer Analysis a. 24 months
b. 60 months†
* The FDA criterion of at least a 15-point improvement from baseline ODI scores was used for both RCTs to minimize heterogeneity in the meta-analysis. The definition of overall clinical success was similar in the two studies, but not identical. In the Prodisc-L study, success was defined more conservatively than the Charité study in that it required improvement in the SF-36 and radiological success as additional criteria. The addition of these parameters would make success more difficult to achieve resulting in a lower proportion of patients attaining overall clinical success, but not likely biasing the results between study groups. Detailed criteria are presented in the text.
†Guyer 2009: Data available for 8 of the original 14 clinical sites; follow up at 60 months was 43.8% .Zigler follow-up 69.9% at 60 months.
‡For overall success, a ≥15-point improvement from baseline in ODI was requested by the FDA and not a planned analysis; thus the authors performed additional analyses (see Alternative Analyses section of Zigler 2012). We used the N’s provided for protocol-defined overall success (ODI improvement ≥15%) and back-calculated the numerators; author analysis excludes 4 deaths and 4 early device removal as “failures” from the total population initially. It is unclear which groups they belong to so n/N that includes these cannot be calculated

WA – Health Technology Assessment December 19, 2016
Artificial disc replacement – Re-review: Final evidence report Page - 262
Figure 5. L-ADR vs. fusion (1-level): Overall Success, Sensitivity Analysis* a. 24 months†
† Missing/unknown at 24 months: L-ADR n = 56, Fusion n = 40 b. 60 months†
*Vertical line corresponds to the -12.5% inferiority margin for the following analyses: (1): Completer-only (2): ITT assuming failure for all missing data (3): ITT assuming success for all missing data (4): Missing data in ADR group = success, fusion group = failure (5): Missing data in ADR group = failure, fusion group = success
† Missing/unknown at 60 months: L-ADR n = 164, Fusion n = 97.

WA – Health Technology Assessment December 19, 2016
Artificial disc replacement – Re-review: Final evidence report Page - 263
Figure 6. L-ADR vs. Fusion (1 level): ODI success (≥ 15 point improvement), ITT Analysis a. 24 months
b. 60 months*
*Guyer 2009: Data available for 8 of the original 14 clinical sites; follow up at 60 months was 43.8% .Zigler follow-up 69.9% at 60 months.
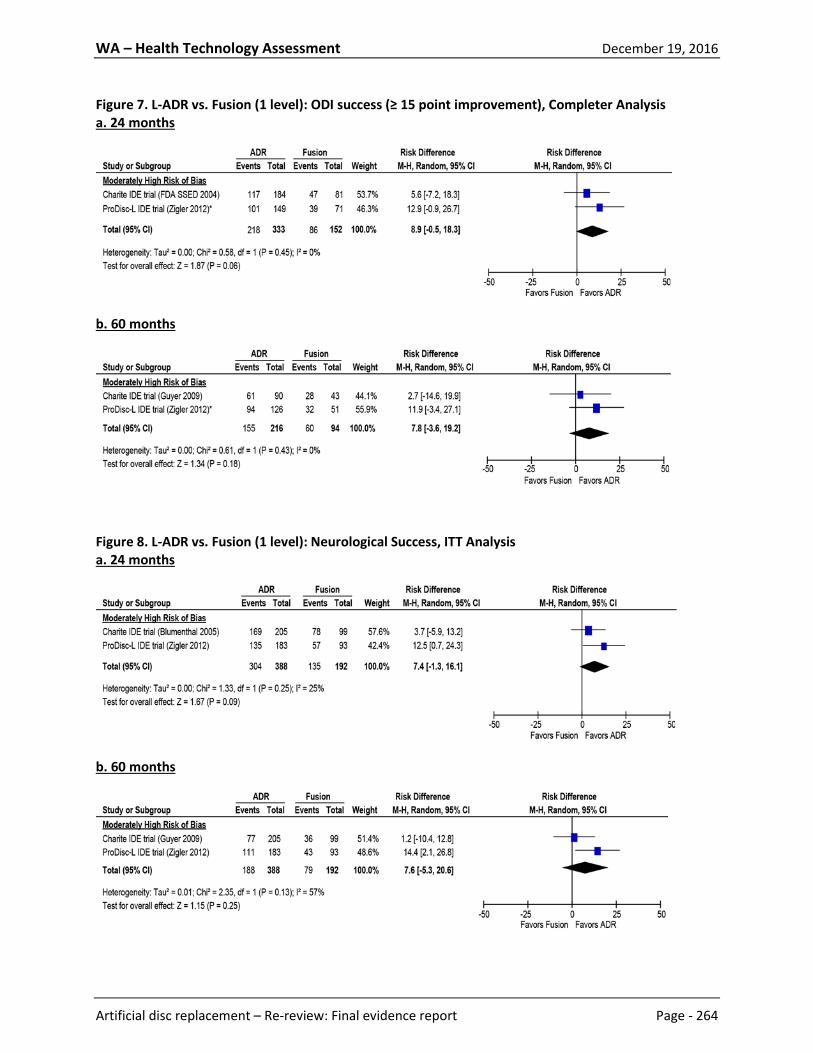
WA – Health Technology Assessment December 19, 2016
Artificial disc replacement – Re-review: Final evidence report Page - 264
Figure 7. L-ADR vs. Fusion (1 level): ODI success (≥ 15 point improvement), Completer Analysis a. 24 months
b. 60 months
Figure 8. L-ADR vs. Fusion (1 level): Neurological Success, ITT Analysis a. 24 months
b. 60 months

WA – Health Technology Assessment December 19, 2016
Artificial disc replacement – Re-review: Final evidence report Page - 265
Figure 9. L-ADR vs. Fusion (1 level): Neurological Success, Completer Analysis a. 24 months
b. 60 months
Figure 10. L-ADR vs. Fusion (1 level): VAS Pain (0-100 [worst]), Completer Analysis a. 24 months
b. 60 months

WA – Health Technology Assessment December 19, 2016
Artificial disc replacement – Re-review: Final evidence report Page - 266
Figure 11. L-ADR vs. Fusion (1 level): Patient Satisfaction at 24 and 60 months*
Pooled RD results: 15.6% (6.5%, 25.0%) at 24 months *Numerators back-calculated based on percentage given in text and numbers evaluated at 24 months (per protocol) from Table
4 in Blumenthal 2005 (Charite IDE trial) and at 24 and 60 months from Table 2 in Zigler 2012 (ProDisc-L IDE trial).
Figure 12. L-ADR vs. Fusion (1 level): Work Status (working full- or part-time), Completer Analysis
*Denominators are after loss to follow-up as reported by Zigler 2007; numerators back calculated based off of 161 and 75
treated at baseline †Full- and part-time work status added together.

WA – Health Technology Assessment December 19, 2016
Artificial disc replacement – Re-review: Final evidence report Page - 267
Figure 13. L-ADR vs. Fusion (1 level): Narcotic Use, ITT Analysis a. 24 months and 60 months
*Denominators are for number randomized/treated at baseline; Blumenthal does not report numerators for completers at 24 months.
†Numerators back-calculated based on percentage and total N provided for completers
Figure 14. L-ADR vs. fusion (2-level): Overall Success, Sensitivity Analysis at 24 months*
*Vertical line corresponds to the -12.5% inferiority margin for the following analyses for missing data on ADR n=26 and fusion n=15:
(1): Completer-only (2): ITT assuming failure for all missing data (3): ITT assuming success for all missing data (4): Missing data in ADR group = success, fusion group = failure (5): Missing data in ADR group = failure, fusion group = success
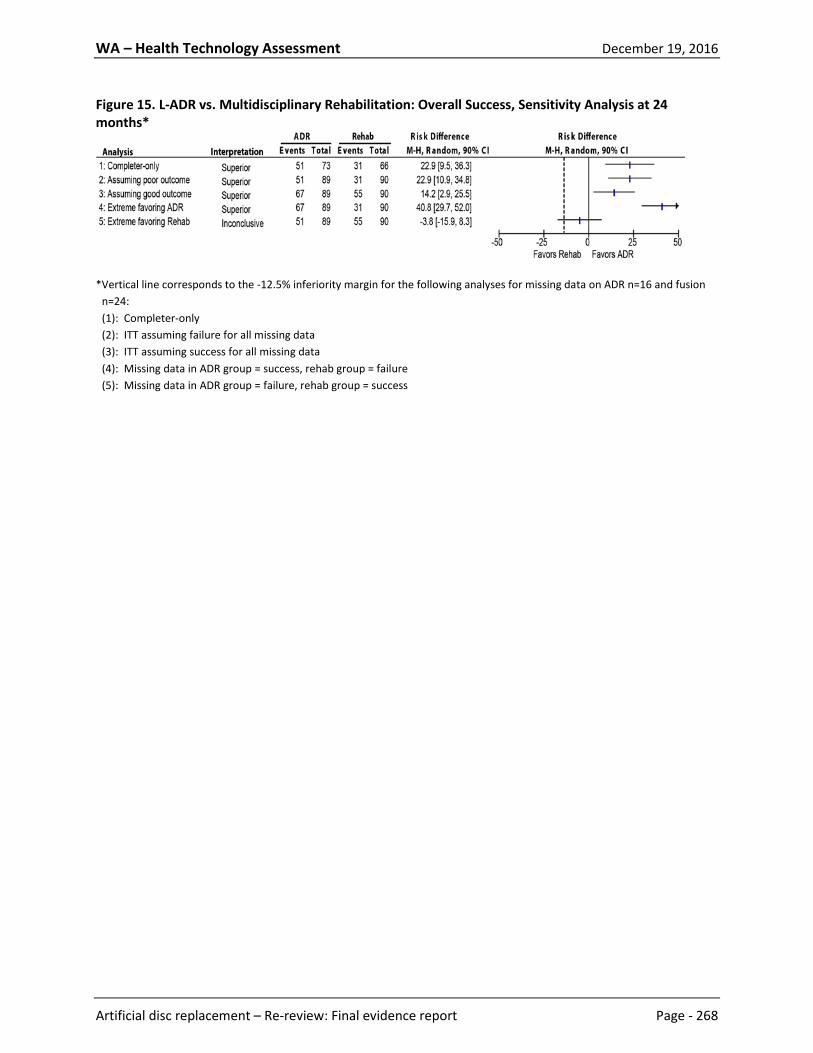
WA – Health Technology Assessment December 19, 2016
Artificial disc replacement – Re-review: Final evidence report Page - 268
Figure 15. L-ADR vs. Multidisciplinary Rehabilitation: Overall Success, Sensitivity Analysis at 24 months*
*Vertical line corresponds to the -12.5% inferiority margin for the following analyses for missing data on ADR n=16 and fusion n=24: (1): Completer-only (2): ITT assuming failure for all missing data (3): ITT assuming success for all missing data (4): Missing data in ADR group = success, rehab group = failure (5): Missing data in ADR group = failure, rehab group = success

WA – Health Technology Assessment December 19, 2016
Artificial disc replacement – Re-review: Final evidence report Page - 269
Figure 16. C-ADR vs. ACDF (1-level): Overall Success, ITT Analysis a. 24 months
b. 48-60 months
c. 84 months
* Percentages were estimated from graphs; numerators were back-calculated using the estimated percentage and denominator
provided. † Overall success defined as: 1) postoperative NDI score improvement of ≥15 points from preoperative score; 2) maintenance
or improvement in neurological status; 3) no serious adverse event classified as implant associated or implant/surgical procedure associated; and 4) no additional surgical procedure classified as a “failure” (removal, revision, or supplemental fixation).
‡ Overall success defined as: 1) NDI improvement of at least 15 points (out of 50) from baseline; 2) No subsequent surgical intervention at the index level or levels; 3) No potentially (possibly or probably) device-related adverse event; 4)

WA – Health Technology Assessment December 19, 2016
Artificial disc replacement – Re-review: Final evidence report Page - 270
Maintenance or improvement in all components of neurological status; and 5) No SECURE-C intraoperative changes in treatment.
§ Overall success defined as: 1) improvement of ≥15 points on the NDI from baseline; 2) no reoperation, revision, or removal; 3) maintenance or improvement in neurological status; 4) no major complications; and 5) meeting radiographical criteria of motion for PCM and fusion for ACDF (i.e., ADR group: ≥2° angular motion in flexion/extension or no evidence of bridging trabecular bone across the disc space; ACDF group: fusion of both treated levels—≤2° of angular motion in flexion/extension and evidence of bridging bone across the disc space and radiolucent lines at no more than 50% of the graft vertebral interfaces.
** n/N not reported in Vaccaro 2013 publication so were obtained from the SECURE-C FDA SSED report. †† For all outcomes, N for follow-up at 60 months in the Mobi-C trial are calculated based on the percent follow-up provided by
authors (85.5% vs. 78.9% for ADR vs. fusion, respectfully), as no patient consort flow chart was provided.

WA – Health Technology Assessment December 19, 2016
Artificial disc replacement – Re-review: Final evidence report Page - 271
Figure 17. C-ADR vs. ACDF (1-level): Overall Success, Completer Analysis a. 24 months
b. 48-60 months
c. 84 months
* Percentages were estimated from graphs; numerators were back-calculated using the estimated percentage and denominator
provided. † Overall success defined as: 1) postoperative NDI score improvement of ≥15 points from preoperative score; 2) maintenance
or improvement in neurological status; 3) no serious adverse event classified as implant associated or implant/surgical procedure associated; and 4) no additional surgical procedure classified as a “failure” (removal, revision, or supplemental fixation).

WA – Health Technology Assessment December 19, 2016
Artificial disc replacement – Re-review: Final evidence report Page - 272
‡ Overall success defined as: 1) NDI improvement of at least 15 points (out of 50) from baseline; 2) No subsequent surgical intervention at the index level or levels; 3) No potentially (possibly or probably) device-related adverse event; 4) Maintenance or improvement in all components of neurological status; and 5) No SECURE-C intraoperative changes in treatment.
§ Overall success defined as: 1) improvement of ≥15 points on the NDI from baseline; 2) no reoperation, revision, or removal; 3) maintenance or improvement in neurological status; 4) no major complications; and 5) meeting radiographical criteria of motion for PCM and fusion for ACDF (i.e., ADR group: ≥2° angular motion in flexion/extension or no evidence of bridging trabecular bone across the disc space; ACDF group: fusion of both treated levels—≤2° of angular motion in flexion/extension and evidence of bridging bone across the disc space and radiolucent lines at no more than 50% of the graft vertebral interfaces.
** n/N not reported in Vaccaro 2013 publication so were obtained from the SECURE-C FDA SSED report. †† For all outcomes, N for follow-up at 60 months in the Mobi-C trial are calculated based on the percent follow-up provided by
authors (85.5% vs. 78.9% for ADR vs. fusion, respectfully), as no patient consort flow chart was provided.

WA – Health Technology Assessment December 19, 2016
Artificial disc replacement – Re-review: Final evidence report Page - 273
Figure 18. C-ADR vs. ACDF (1-level): Overall Success, Sensitivity Analysis a. 24 months
b. 48-60 months
c. 84 months

WA – Health Technology Assessment December 19, 2016
Artificial disc replacement – Re-review: Final evidence report Page - 274
Figure 19. C-ADR vs. ACDF (1-level): NDI Success (≥15-point improvement), ITT Analysis a. 24 months
b. 48-60 months
c. 84 months
* Percentages were estimated from graphs; numerators were back-calculated using the estimated percentage and the
denominator provided. † n/N not reported in Vaccaro 2013 publication so were obtained from the SECURE-C FDA SSED report.

WA – Health Technology Assessment December 19, 2016
Artificial disc replacement – Re-review: Final evidence report Page - 275
Figure 20. C-ADR vs. ACDF (1-level): NDI Success (≥15-point improvement), Completer Analysis a. 24 months
b. 48-60 months
c. 84 months
* Percentages were estimated from graphs; numerators were back-calculated using the estimated percentage and the
denominator provided. † n/N not reported in Vaccaro 2013 publication so were obtained from the SECURE-C FDA SSED report.

WA – Health Technology Assessment December 19, 2016
Artificial disc replacement – Re-review: Final evidence report Page - 276
Figure 21. C-ADR vs. ACDF (1-level): NDI Scores, Completer Analysis a. 24 months
b. 48-60 months
c. 84 months

WA – Health Technology Assessment December 19, 2016
Artificial disc replacement – Re-review: Final evidence report Page - 277
* Scores for ACDF were estimated from graphs in the article; patient numbers obtained from the corresponding Secure-C SSED. † SD not reported; imputed from the other data for the same time frame (for the Secure-C trial, this applied to the ACDF group
only) ‡ Mean change scores are used here as they were adjusted for any difference in baseline scores between the groups; the
authors reported the adjusted change scores and the corresponding 95% CI (which was converted to SD by SRI) ** NDI scale not clearly reported by the majority of studies; the raw score (0-50) should be converted to a final score (0-100),
and we assumed this was done (because the baseline scores were commonly >50) unless otherwise indicated. †† Follow-up scores unless otherwise indicated ‡‡ Data obtained from the Mobi-C (1-level) SSED

WA – Health Technology Assessment December 19, 2016
Artificial disc replacement – Re-review: Final evidence report Page - 278
Figure 22. C-ADR vs. ACDF (1-level): Neurological Success, ITT Analysis a. 24 months
b. 48-60 months
c. 84 months

WA – Health Technology Assessment December 19, 2016
Artificial disc replacement – Re-review: Final evidence report Page - 279
* As reported by the study. † Numerators back-calculated based on denominator and percentage given. ‡ Numerators back-calculated based on denominator and percentage given. § n/N taken from the SECURE-C SSED
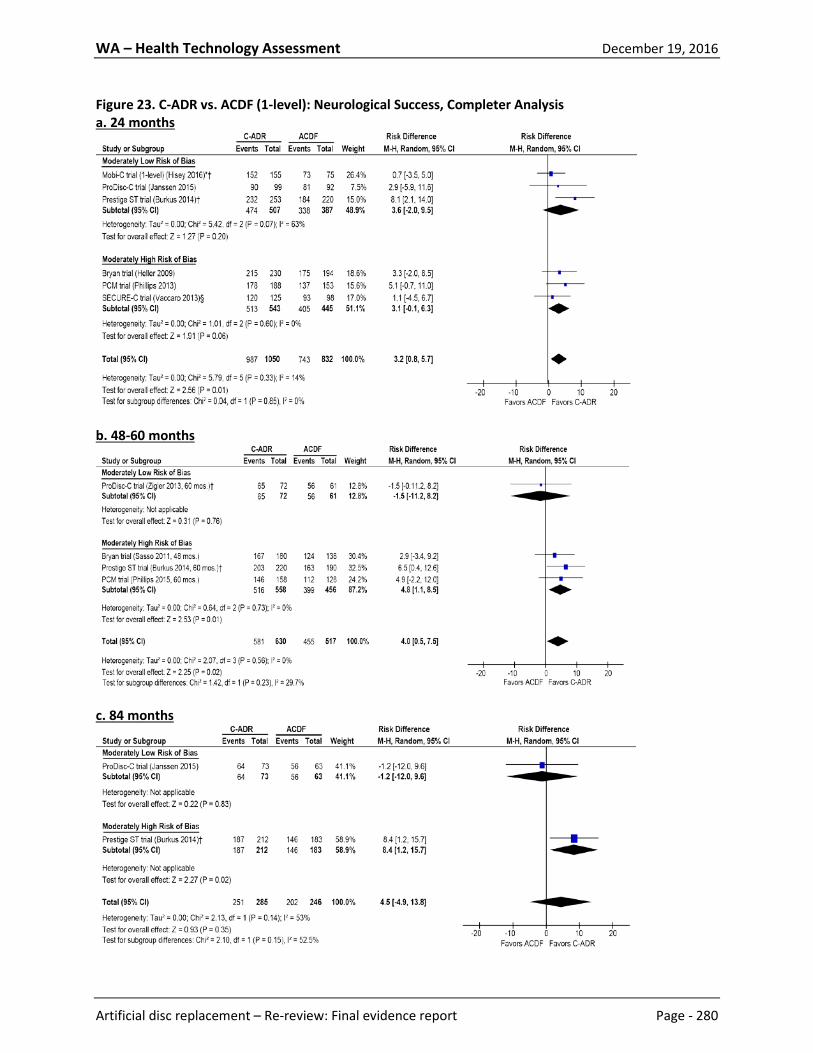
WA – Health Technology Assessment December 19, 2016
Artificial disc replacement – Re-review: Final evidence report Page - 280
Figure 23. C-ADR vs. ACDF (1-level): Neurological Success, Completer Analysis a. 24 months
b. 48-60 months
c. 84 months

WA – Health Technology Assessment December 19, 2016
Artificial disc replacement – Re-review: Final evidence report Page - 281
* As reported by the study. † Numerators back-calculated based on denominator and percentage given. ‡ Numerators back-calculated based on denominator and percentage given. § n/N taken from the SECURE-C SSED

WA – Health Technology Assessment December 19, 2016
Artificial disc replacement – Re-review: Final evidence report Page - 282
Figure 24. C-ADR vs. ACDF (1-level): Arm Pain VAS/NRS Scores, Completer Analysis a. 24 months
b. 48-60 months
c. 84 months
* Pain score was calculated by multiplying the duration score (0-10) by the intensity score (0-10) † Pain measured using the NRS ‡ Score was reported on 0-10 scale; SRI converted the score to a 0-100 scale

WA – Health Technology Assessment December 19, 2016
Artificial disc replacement – Re-review: Final evidence report Page - 283
§ Study reported individual mean scores (but no SD) from the left and right arm; SRI reported the mean of these scores. **Scores were estimated from graphs in the articles. †† Mean change scores are used here as they were adjusted for any difference in baseline scores between the groups; the
authors reported the adjusted change scores and the corresponding 95% CI (which was converted to SD by SRI) ‡‡ SD not reported; imputed from the other data for the same time frame (for the Secure-C trial, this applied to the ACDF group
only) §§ For the Mobi-C trial, the arm with the worst pain at baseline was followed at each subsequent time-point. *** For the SECURE-C trial (Vaccaro 2013), per FDA, VAS data excludes one site in which some scores were reported verbally.

WA – Health Technology Assessment December 19, 2016
Artificial disc replacement – Re-review: Final evidence report Page - 284
Figure 25. C-ADR vs. ACDF (1-level): Neck Pain Success (≥20-point improvement), ITT Analysis a. 24 months
b. 60 months
Figure 26. C-ADR vs. ACDF (1-level): Neck Pain Success (≥20-point improvement), Completer Analysis a. 24 months
b. 60 months

WA – Health Technology Assessment December 19, 2016
Artificial disc replacement – Re-review: Final evidence report Page - 285
Figure 27. C-ADR vs. ACDF (1-level): Neck Pain VAS/NRS Scores, Completer Analysis a. 24 months
b. 48-60 months
c. 84 months

WA – Health Technology Assessment December 19, 2016
Artificial disc replacement – Re-review: Final evidence report Page - 286
* Pain score was calculated by multiplying the duration score (0-10) by the intensity score (0-10) † Pain measured using the NRS ‡ Score was reported on 0-10 scale; SRI converted the score to a 0-100 scale **Scores were estimated from graphs in the articles. †† Mean change scores are used here as they were adjusted for any difference in baseline scores between the groups; the
authors reported the adjusted change scores and the corresponding 95% CI (which was converted to SD by SRI) ‡‡ SD not reported; imputed from the other data for the same time frame (for the Secure-C trial, this applied to the ACDF group
only) *** For the SECURE-C trial (Vaccaro 2013), per FDA, VAS data excludes one site in which some scores were reported verbally.

WA – Health Technology Assessment December 19, 2016
Artificial disc replacement – Re-review: Final evidence report Page - 287
Figure 28. C-ADR vs. ACDF (1-level): SF-36 PCS Success (≥15% improvement), Completer Analysis a. 24 months
b. 60 months
*n/N taken from the FDA SSED

WA – Health Technology Assessment December 19, 2016
Artificial disc replacement – Re-review: Final evidence report Page - 288
Figure 29. C-ADR vs. ACDF (1-level): SF-36 MCS Success (≥15% improvement), Completer Analysis a. 24 months
b. 60 months
*n/N taken from the FDA SSED

WA – Health Technology Assessment December 19, 2016
Artificial disc replacement – Re-review: Final evidence report Page - 289
Figure 30. C-ADR vs. ACDF (1-level): SF-36 PCS Scores, Completer Analysis a. 24 months
b. 48-60 months
c. 84 months
* SDs not reported so were imputed by SRI. † The Mobi-C trial used the SF-12 PCS.

WA – Health Technology Assessment December 19, 2016
Artificial disc replacement – Re-review: Final evidence report Page - 290
‡Scores were estimated from graphs in the articles. §Mean change scores were adjusted for any difference in baseline scores between the groups; the authors reported the
adjusted change scores and the corresponding 95% CI (which was converted to SD by SRI). **n/N obtained from the SECURE-C SSED.

WA – Health Technology Assessment December 19, 2016
Artificial disc replacement – Re-review: Final evidence report Page - 291
Figure 31. C-ADR vs. ACDF (1-level): Patient Satisfaction, Completer Analysis a. 24 months
b. 48-60 months
† Estimated from graph in article. Numerators back-calculated using estimated percentage. ‡ Numerators back-calculated using estimated percentage. § n/N taken from SECURE-C SSED, Table 34. ** Very or somewhat satisfied (Mobi-C, PCM trials) †† Very or somewhat satisfied (60-100 on VAS; ProDisc-C trial) ‡‡ Definite or mostly satisfied (SECURE-C trial)

WA – Health Technology Assessment December 19, 2016
Artificial disc replacement – Re-review: Final evidence report Page - 292
Figure 32. C-ADR vs. ACDF (1-level): Patient Satisfaction VAS Scores (0-100, higher scores are better), Completer Analysis a. 24 months
b. 48-60 months
c. 84 months
* The ProDisc-C trial also reported 60 month data (mean scores, 86.56 vs. 82.74) but no standard deviations were given for this
time point.

WA – Health Technology Assessment December 19, 2016
Artificial disc replacement – Re-review: Final evidence report Page - 293
Figure 33. C-ADR vs. ACDF (1-level): Odom’s Criteria “Excellent” or “Good”, Completer Analysis a. 24 months
*Peng-Fei 2008 reported data at a mean of 17 months.

WA – Health Technology Assessment December 19, 2016
Artificial disc replacement – Re-review: Final evidence report Page - 294
Figure 34. C-ADR vs. ACDF (1-level): Return to Work, Completer Analysis a. 24 months
b. 48-60 months
c. 84 months
* Working, not otherwise specified † Working full- or part-time ‡ Working full-time § Numerators back-calculated using estimated percentage.

WA – Health Technology Assessment December 19, 2016
Artificial disc replacement – Re-review: Final evidence report Page - 295
Figure 35. C-ADR vs. ACDF (1-level): Time to Return to Work, Completer Analysis a. 24 months
Figure 36. C-ADR vs. ACDF (2-level): Overall Success, Sensitivity Analysis a. 24 months
b. 60 months

WA – Health Technology Assessment December 19, 2016
Artificial disc replacement – Re-review: Final evidence report Page - 296
Figure 37. Lumbar ADR vs. Fusion at 1 Level: Any Subsequent Surgery at the Index Level*
* Surgeries included revision, reoperation, device/hardware removal, supplemental fixation, hemi-laminectomy and discectomy with decompression. Number of events at 60 months is cumulative.
Figure 38. Lumbar ADR vs. Fusion at 1 level: Device Related Adverse Events (excluding secondary surgery at index level)*
*Defined as adverse events considered by the investigators to be device-related, including back and lower extremities pain, nerve root injury, implant displacement, and subsidence; calculations excludes secondary surgery at the index level.

WA – Health Technology Assessment December 19, 2016
Artificial disc replacement – Re-review: Final evidence report Page - 297
Figure 39. Lumbar ADR vs. Fusion at 1 Level: All Adverse Events/Complications Regardless of Relationship to Treatment

WA – Health Technology Assessment December 19, 2016
Artificial disc replacement – Re-review: Final evidence report Page - 298
Figure 40. C-ADR vs. ACDF (1-level): Secondary Surgery at the Index Level a. 24 months (cumulative)
b. 48-60 months (cumulative)
c. 84 months (cumulative)
WA – Health Technology Assessment December 19, 2016
Artificial disc replacement – Re-review: Final evidence report Page - 299
* All data may include procedures at index level alone or that involved both the index and adjacent levels: • Prestige ST IDE trial (84 months): 3 C-ADR and 14 ACDF patients underwent secondary procedures that involved both
the index and adjacent levels. • Bryan IDE trial: data not stratified by the number of procedures performed at index level alone or that involved both
the index and adjacent levels. • Mobi-C IDE trial (1-level) (60 months): 2 C-ADR and 2 ACDF patients underwent secondary procedures that involved
both the index and adjacent levels; totals do not include 3 patients in the ACDF group who underwent plate removal as a result of adjacent-level indications only.
• PCM IDE trial: data not stratified by the number of procedures performed at index level alone or that involved both the index and adjacent levels.
• ProDisc-C IDE trial (24/60/84 months): 0/2/NR C-ADR and 3/7/11 ACDF patients underwent secondary procedures that involved both the index and adjacent levels. (Note that the 24 month data came from the FDA SSED report’s Table 5).
† Prestige ST IDE trial: C-ADR: Index trial doesn’t report the total number of second surgeries at the index level, but reported 5 hardware removals, 0 revisions, and 0 supplemental fixations. The IDE trial additionally reported 4 reoperations; Burkus 2014 reports 6 removals and 4 reoperations in 9 patients total at the index level. ACDF: Index trial doesn’t report the total number of second surgeries at the index level, but reported hardware removal in 9 patients, revisions in 5 patients, and supplemental fixations in 8 patients (9 procedures) (at the index level). The IDE trial additionally reported 2 reoperations; Burkus 2014 reported 12 removals and 4 revisions, 3 supplemental fixations, and 2 reoperations in 19 patients total (at the index level).
‡ PCM IDE trial: C-ADR: index trial reported 11 patients (8 removals, 2 reoperations, 0 revisions, 0 supplemental fixations); the SSED reported 12 patients using the modified ITT analysis (includes all treated patients) & 11 patients using per protocol (pts who received treatment and adhered to protocol); Phillips 2015 reported 11 procedures total. ACDF: index trial reported 10 patients but gave no details other than that all were removals “which were predominately nonunions and adjacent-level procedures;” however the SSED reported 10 patients underwent subsequent secondary surgical interventions at the index level (see Table 20 and preceding paragraph) for both mITT and per protocol populations; Phillips 2015 reports 10 procedures total but that 6 were for ASD (Table 2).
§ ProDisc-C IDE trial: ACDF: Delamarter 2013 reports this to be 8 patients, but the index trial reported that 9 patients underwent secondary surgery at the index level, while the FDA SSED reports this to be 10 patients.
** Secure-C IDE trial: C-ADR group included 151 randomized patients plus 89 nonrandomized patients; SRI was unable to obtain the number of procedures for the randomized patients only. ACDF: SSED reported 17/144 (Table 14) but then only accounted for 14 patients in the detailed table (Table 16); index study reported 17 events in 14 patients (Table 5).
†† Mobi-C trial, 60 months: denominator used by Jackson 2016 included 15 non-randomized training cases in the ADR group. (179 vs. 164); SRI was unable to obtain the number of procedures for the randomized patients only.

WA – Health Technology Assessment December 19, 2016
Artificial disc replacement – Re-review: Final evidence report Page - 300
Figure 41. C-ADR vs. ACDF (1-level): Serious/Major Adverse Events (as classified by the trial†) a. 24 months (cumulative)
b. 24-48 months (cumulative)
c. 48 months (cumulative)
d. 24-84 months (cumulative)
† Defined as:
• Bryan IDE trial: Most serious adverse events were related to medical conditions and not to the procedure, implant, or cervical spine disease. Classified as WHO grade 3 or 4 (taken from Anderson 2008) (grade 3 events required medical treatment or may have had a long-term health effect; grade 4 events required an operation, were life threatening, permanent disability, or caused death).

WA – Health Technology Assessment December 19, 2016
Artificial disc replacement – Re-review: Final evidence report Page - 301
• PCM IDE trial: any event that results in death, serious injury, permanent impairment; or that prolongs hospitalization or requires surgical intervention to prevent death or serious injury; classified by the Clinical Events Committee.
• Mobi-C IDE trial: any event that results in death, serious injury, permanent impairment; or that prolongs hospitalization or requires surgical intervention to prevent death or serious injury; or that was a congenital anomaly or birth defect; classified by the Clinical Events Committee.
• ProDisc-C IDE trial: “Severe or life-threatening adverse event”: defined as any event requiring hospitalization or surgery (see SSED Table 18).
• Secure-C IDE trial: “Severe or life-threatening adverse event”: a severe event was defined as any event that significantly limits the patient’s ability to perform routine activities despite symptomatic therapy; a life-threatening event was defined as any event that required removal of the implant or put the patient at immediate risk of death (including death) (see SSED Table 19).
‡ Numerators back-calculated. § Mobi-C trial: denominator used included 15 non-randomized training cases in the ADR group. (179 vs. 164); SRI was unable to
obtain the number of events for the randomized patients only. ** Majority were systemic or medical in nature and not related to device or surgery. For 24 months, the index trial (Phillips
2013) reported serious adverse events occurred in 46 ADR and 41 ACDF patients but this was calculated in an as-treated population. For 24-84 months, the denominators represent as-treated patients include crossover between treatment groups.

WA – Health Technology Assessment December 19, 2016
Artificial disc replacement – Re-review: Final evidence report Page - 302
Figure 42. C-ADR vs. ACDF (1-level): Device-Related Adverse Events (as classified by the trial†) a. 24 months (cumulative)
b. 60 months (cumulative)
c. 84 months (cumulative)
* Device-related or device/surgical procedure-related † Defined as:
• Prestige ST IDE trial: events included anatomical/technical difficulty, implant displacement/loosening, infection, neck and/or arm pain, neurological, non-union, pending non-union, and subsidence.
• Bryan IDE trial: events included malpositioned implant, neck and/or arm pain, non-union, other, pending non-union, spinal event, and trauma.
• Mobi-C IDE trial: events included spinal ligament ossification, neck pain, muscle spasms, radiculopathy, subsidence, medical device complication, misplaced screw coded as device complication.
• ProDisc-C IDE trial (0-24 months): events included dysphagia, superficial wound infection, musculoskeletal, neck pain, and index-level surgery.

WA – Health Technology Assessment December 19, 2016
Artificial disc replacement – Re-review: Final evidence report Page - 303
• ProDisc-C IDE trial (0-84 months): adjacent-level degenerative disc disease or degenerative joint changes, cardiovascular, dysphagia, headache, musculoskeletal, musculoskeletal neck spasms, neurologic, numbness, ossification, other, back and lower extremity pain, incision site pain, neck pain, neck and other pain, neck and shoulder pain, neck and upper extremity pain, neck and upper extremity pain with numbness, surgery for device related events (index or other level), wound issues.
• Secure-C IDE trial: device-related adverse events were classified by the Clinical Events Committee and included those events that were linked to the device (revision, removal, reoperation, or supplemental fixation at the index level; fracture or mechanical failure of the device, pseudarthrosis, radiolucency around the device, migration, subsidence, loosening, etc. Neck and arm pain were excluded from this category of adverse events.
‡ Numerators back-calculated. § Mobi-C trial: denominator used included 15 non-randomized training cases in the ADR group. (179 vs. 164); SRI was unable to
obtain the number of events for the randomized patients only. ** ProDisc-C (60 months): it is unclear why the number of implant-related adverse events at 60 months was lower than that
reported through 24 months.

WA – Health Technology Assessment December 19, 2016
Artificial disc replacement – Re-review: Final evidence report Page - 304
Figure 43. C-ADR vs. ACDF (1-level): Secondary Surgery at the Adjacent Level a. 24 months (cumulative)
b. 48-60 months (cumulative)
c. 84 months (cumulative)
* PCM IDE trial: there is a discrepancy in the number of adjacent level surgeries reported between the FDA SSED report (5 vs. 7
for PCM vs. ACDF, see Table 43) and Phillips 2015 (which doesn’t clearly report the number of surgeries at the adjacent level,

WA – Health Technology Assessment December 19, 2016
Artificial disc replacement – Re-review: Final evidence report Page - 305
but indicates 0 vs. 6 for PCM vs. ACDF were performed for adjacent segment disease (Table 2)). Because of this discrepancy and because the latter did not clearly report the number of surgeries at the adjacent level, data from this report were not used for 24 months or for 60 months.
† PCM IDE trial, 48 month cumulative data: the SSED report indicated not all patients had completed 48 month follow-up, but no details were reported. The cumulative 36-month incidence of surgery at the adjacent level was 6 ADR patients and 7 ACDF patients.
‡ Mobi-C trial, 60 months: denominator used by Jackson 2016 included 15 non-randomized training cases in the ADR group. (179 vs. 164); SRI was unable to obtain the number of procedures for the randomized patients only.
§ Secure-C IDE trial: C-ADR group included 151 randomized patients plus 89 nonrandomized patients; SRI was unable to obtain the number of procedures for the randomized patients only.
** Secondary surgery at adjacent level ONLY (procedures at both index and adjacent not included)

WA – Health Technology Assessment December 19, 2016
Artificial disc replacement – Re-review: Final evidence report Page - 306
Figure 44. C-ADR vs. ACDF (1-level): Any Adverse Event (as reported by the trial†) a. 24 months (cumulative)
b. 84 months (cumulative)
† Cumulative number of events reported by the study ‡ Prestige ST IDE trial: Burkus 2014 reported the cumulative rate of adverse events based on the life-table method for ADR vs. ACDF to be 86.4% vs. 87.5% (0-24 months) and 97.7% vs. 94.5% (0-84 months). § Mobi-C trial: denominator used included 15 non-randomized training cases in the ADR group. (179 vs. 164); SRI was unable to
obtain the number of events for the randomized patients only. ** Prestige ST IDE trial: events included anatomical/technical difficulty, cancer, cardiovascular, carpal tunnel syndrome, death, dysphagia/dysphonia, gastrointestinal, implant displacement/loosening, infection, neck and/or arm pain, neurological, non-union, other, other pain, pending non-union, respiratory, spinal event, subsidence, trauma, urogenital, and vascular intra-op.

WA – Health Technology Assessment December 19, 2016
Artificial disc replacement – Re-review: Final evidence report Page - 307
References
1. (ACOEM) ACoOaEM. Cervical and thoracic spine disorders. Occupational medicine practice guidelines. Evaluation and management of common health problems and functional recovery in workers. 3rd ed. Elk Grove Village (IL)2011. 2. (ACOEM) ACoOaEM. Low back disorders. Occupational medicine practice guidelines. Evaluation and management of common health problems and functional recovery in workers. 3rd ed.: Elk Grove Village (IL); 2011. 3. Abd-Alrahman N, Dokmak AS, Abou-Madawi A. Anterior cervical discectomy (ACD) versus anterior cervical fusion (ACF), clinical and radiological outcome study. Acta neurochirurgica 1999;141:1089-92. 4. Ament JD, Yang Z, Nunley P, Stone MB, Kim KD. Cost-effectiveness of cervical total disc replacement vs fusion for the treatment of 2-level symptomatic degenerative disc disease. JAMA surgery 2014;149:1231-9. 5. Ament JD, Yang Z, Nunley P, Stone MB, Lee D, Kim KD. Cost Utility Analysis of the Cervical Artificial Disc vs Fusion for the Treatment of 2-Level Symptomatic Degenerative Disc Disease: 5-Year Follow-up. Neurosurgery 2016. 6. An HS, Anderson PA, Haughton VM, et al. Introduction: disc degeneration: summary. Spine 2004;29:2677-8. 7. Anderson PA, Rouleau JP. Intervertebral disc arthroplasty. Spine 2004;29:2779-86. 8. Anderson PA, Sasso RC, Riew KD. Comparison of adverse events between the Bryan artificial cervical disc and anterior cervical arthrodesis. Spine 2008;33:1305-12. 9. Andersson G. The Epidemiology of Spinal Disorders. In: Frymoyer JE, ed. The Adult Spine: Principles and Practice. 2nd ed. New York, NY: Raven Press; 1997; 93-141. 10. Atkins D, Best D, Briss PA, et al. Grading quality of evidence and strength of recommendations. BMJ (Clinical research ed) 2004;328:1490. 11. Berg S, Fritzell P, Tropp H. Sex life and sexual function in men and women before and after total disc replacement compared with posterior lumbar fusion. The spine journal : official journal of the North American Spine Society 2009;9:987-94. 12. Berg S, Tropp H. Results from a randomized controlled study between total disc replacement and fusion compared with results from a spine register. SAS journal 2010;4:68-74. 13. Berg S, Tullberg T, Branth B, Olerud C, Tropp H. Total disc replacement compared to lumbar fusion: a randomised controlled trial with 2-year follow-up. European spine journal : official publication of the European Spine Society, the European Spinal Deformity Society, and the European Section of the Cervical Spine Research Society 2009;18:1512-9. 14. Berkman ND, Lohr KN, Ansari M, al. e. Chapter 15. Grading the Strength of a Body of Evidence When Assessing Health Care Interventions for the Effective Health Care Program of the Agency for Healthcare Research and Quality: An Update. 2013. 15. Blue Cross Blue Shield Association. Artificial Intervertebral Disc Arthroplasty for Treatment of Degenerative Disc Disease of the Cervical Spine. Technology Evaluation Center, Assessment Program. Volume 28, No. 13. April 2014. 16. Blue Cross Blue Shield Association. Artificial Lumbar Disc Arthroplasty. Technology Evaluation Center, Assessment Program. Volume 28, No. 7. January 2014. 17. Artificial vertebral disc replacement [report on the Internet]. Technology Evaluation Center Assessment Program, 2005. at http://www.bcbs.com/tec/Vol20/20_01.pdf ) 18. Blumenthal S, McAfee PC, Guyer RD, et al. A prospective, randomized, multicenter Food and Drug Administration investigational device exemptions study of lumbar total disc replacement with the CHARITE artificial disc versus lumbar fusion: part I: evaluation of clinical outcomes. Spine 2005;30:1565-75; discussion E387-91.

WA – Health Technology Assessment December 19, 2016
Artificial disc replacement – Re-review: Final evidence report Page - 308
19. Brox JI, Reikeras O, Nygaard O, et al. Lumbar instrumented fusion compared with cognitive intervention and exercises in patients with chronic back pain after previous surgery for disc herniation: a prospective randomized controlled study. Pain 2006;122:145-55. 20. Brox JI, Sorensen R, Friis A, et al. Randomized clinical trial of lumbar instrumented fusion and cognitive intervention and exercises in patients with chronic low back pain and disc degeneration. Spine 2003;28:1913-21. 21. Buchbinder R, Blyth FM, March LM, Brooks P, Woolf AD, Hoy DG. Placing the global burden of low back pain in context. Best practice & research Clinical rheumatology 2013;27:575-89. 22. Burkus JK, Haid RW, Traynelis VC, Mummaneni PV. Long-term clinical and radiographic outcomes of cervical disc replacement with the Prestige disc: results from a prospective randomized controlled clinical trial. Journal of neurosurgery Spine 2010;13:308-18. 23. Burkus JK, Traynelis VC, Haid RW, Jr., Mummaneni PV. Clinical and radiographic analysis of an artificial cervical disc: 7-year follow-up from the Prestige prospective randomized controlled clinical trial: Clinical article. Journal of neurosurgery Spine 2014;21:516-28. 24. Cappelletto B, Giorgiutti F, Veltri C, Trevigne MA, Facchin P, Del Fabro P. Disc prosthesis replacement and interbody fusion in the treatment of degenerative cervical disc disease: comparative analysis of 176 consecutive cases. European spine journal : official publication of the European Spine Society, the European Spinal Deformity Society, and the European Section of the Cervical Spine Research Society 2013;22 Suppl 6:S894-9. 25. Carroll LJ, Hogg-Johnson S, Cote P, et al. Course and prognostic factors for neck pain in workers: results of the Bone and Joint Decade 2000-2010 Task Force on Neck Pain and Its Associated Disorders. Spine 2008;33:S93-100. 26. Centers for Disease Control and Prevention. National Health Interview Survey (NHIS), Trend Tables, 2015. Severe headache or migraine, low back pain, and neck pain among adults 18 years of age and over, by selected characteristics: United States, selected years 1997–2014. 27. Cepoiu-Martin M, Faris P, Lorenzetti D, Prefontaine E, Noseworthy T, Sutherland L. Artificial cervical disc arthroplasty: a systematic review. Spine 2011;36:E1623-33. 28. Chapman JH, BP; Dettori JR; Norvell, DC. Spine Outcomes Measures and Instruments. New York: Thieme; 2007. 29. Cheng L, Nie L, Li M, Huo Y, Pan X. Superiority of the Bryan((R)) disc prosthesis for cervical myelopathy: a randomized study with 3-year followup. Clinical orthopaedics and related research 2011;469:3408-14. 30. Cheng L, Nie L, Zhang L, Hou Y. Fusion versus Bryan Cervical Disc in two-level cervical disc disease: a prospective, randomised study. International orthopaedics 2009;33:1347-51. 31. Cho KJ, Suk SI, Park SR, et al. Complications in posterior fusion and instrumentation for degenerative lumbar scoliosis. Spine 2007;32:2232-7. 32. Chou R, Loeser JD, Owens DK, et al. Interventional therapies, surgery, and interdisciplinary rehabilitation for low back pain: an evidence-based clinical practice guideline from the American Pain Society. Spine 2009;34:1066-77. 33. Chou WY, Hsu CJ, Chang WN, Wong CY. Adjacent segment degeneration after lumbar spinal posterolateral fusion with instrumentation in elderly patients. Archives of orthopaedic and trauma surgery 2002;122:39-43. 34. Cihangiroglu M, Yildirim H, Bozgeyik Z, et al. Observer variability based on the strength of MR scanners in the assessment of lumbar degenerative disc disease. Eur J Radiol 2004;51:202-8. 35. Compensation SoCDoLaEDoWs. Cervical Spine Injury: Medical Treatment Guidelines. 2014:1-96. 36. Compensation SoCDoLaEDoWs. Low Back Pain: Medical Treatment Guidelines. 2014:1-112.

WA – Health Technology Assessment December 19, 2016
Artificial disc replacement – Re-review: Final evidence report Page - 309
37. Dagenais S, Caro J, Haldeman S. A systematic review of low back pain cost of illness studies in the United States and internationally. The spine journal : official journal of the North American Spine Society 2008;8:8-20. 38. Davis RJ, Kim KD, Hisey MS, et al. Cervical total disc replacement with the Mobi-C cervical artificial disc compared with anterior discectomy and fusion for treatment of 2-level symptomatic degenerative disc disease: a prospective, randomized, controlled multicenter clinical trial: clinical article. Journal of neurosurgery Spine 2013;19:532-45. 39. Davis RJ, Nunley PD, Kim KD, et al. Two-level total disc replacement with Mobi-C cervical artificial disc versus anterior discectomy and fusion: a prospective, randomized, controlled multicenter clinical trial with 4-year follow-up results. Journal of neurosurgery Spine 2015;22:15-25. 40. de Kleuver M, Oner FC, Jacobs WC. Total disc replacement for chronic low back pain: background and a systematic review of the literature. European spine journal : official publication of the European Spine Society, the European Spinal Deformity Society, and the European Section of the Cervical Spine Research Society 2003;12:108-16. 41. Delamarter R, Zigler JE, Balderston RA, Cammisa FP, Goldstein JA, Spivak JM. Prospective, randomized, multicenter Food and Drug Administration investigational device exemption study of the ProDisc-L total disc replacement compared with circumferential arthrodesis for the treatment of two-level lumbar degenerative disc disease: results at twenty-four months. The Journal of bone and joint surgery American volume 2011;93:705-15. 42. Delamarter RB, Murrey D, Janssen ME, et al. Results at 24 months from the prospective, randomized, multicenter Investigational Device Exemption trial of ProDisc-C versus anterior cervical discectomy and fusion with 4-year follow-up and continued access patients. SAS journal 2010;4:122-8. 43. Delamarter RB, Zigler J. Five-year reoperation rates, cervical total disc replacement versus fusion, results of a prospective randomized clinical trial. Spine 2013;38:711-7. 44. Derogatis LR, Lipman RS, Rickels K, Uhlenhuth EH, Covi L. The Hopkins Symptom Checklist (HSCL): a self-report symptom inventory. Behav Sci 1974;19:1-15. 45. Deyo RA, Battie M, Beurskens AJ, et al. Outcome measures for low back pain research. A proposal for standardized use. Spine 1998;23:2003-13. 46. Dowd GC, Wirth FP. Anterior cervical discectomy: is fusion necessary? J Neurosurg 1999;90:8-12. 47. Eliasberg CD, Kelly MP, Ajiboye RM, SooHoo NF. Complications and Rates of Subsequent Lumbar Surgery Following Lumbar Total Disc Arthroplasty and Lumbar Fusion. Spine 2016;41:173-81. 48. Errico TJ. Lumbar disc arthroplasty. Clinical orthopaedics and related research 2005:106-17. 49. Etebar S, Cahill DW. Risk factors for adjacent-segment failure following lumbar fixation with rigid instrumentation for degenerative instability. J Neurosurg 1999;90:163-9. 50. EuroQol G. EuroQol--a new facility for the measurement of health-related quality of life. Health Policy 1990;16:199-208. 51. Fairbank J, Frost H, Wilson-MacDonald J, et al. Randomised controlled trial to compare surgical stabilisation of the lumbar spine with an intensive rehabilitation programme for patients with chronic low back pain: the MRC spine stabilisation trial. BMJ (Clinical research ed) 2005;330:1233. 52. Fairbank JC, Pynsent PB. The Oswestry Disability Index. Spine 2000;25:2940-52; discussion 52. 53. Frelinghuysen P, Huang RC, Girardi FP, Cammisa FP, Jr. Lumbar total disc replacement part I: rationale, biomechanics, and implant types. The Orthopedic clinics of North America 2005;36:293-9. 54. Fritzell P, Berg S, Borgstrom F, Tullberg T, Tropp H. Cost effectiveness of disc prosthesis versus lumbar fusion in patients with chronic low back pain: randomized controlled trial with 2-year follow-up. European spine journal : official publication of the European Spine Society, the European Spinal Deformity Society, and the European Section of the Cervical Spine Research Society 2011;20:1001-11. 55. Fritzell P, Hagg O, Wessberg P, Nordwall A, Swedish Lumbar Spine Study G. 2001 Volvo Award Winner in Clinical Studies: Lumbar fusion versus nonsurgical treatment for chronic low back pain: a

WA – Health Technology Assessment December 19, 2016
Artificial disc replacement – Re-review: Final evidence report Page - 310
multicenter randomized controlled trial from the Swedish Lumbar Spine Study Group. Spine 2001;26:2521-32; discussion 32-4. 56. Fu, R., Gartlehner G, Grant M, al. e. Chapter 12. Conducting Quantitative Synthesis When Comparing Medical Interventions for the Effective Health Care Program of the Agency for Healthcare Research and Quality: An Update. . 2014. 57. Ghiselli G, Wang JC, Bhatia NN, Hsu WK, Dawson EG. Adjacent segment degeneration in the lumbar spine. The Journal of bone and joint surgery American volume 2004;86-A:1497-503. 58. Goetz C. Textbook of Clinical Neurology. Edited, Philadelphia, PA; Saunders Elsevier, 2003. 59. Goffin J, Geusens E, Vantomme N, et al. Long-term follow-up after interbody fusion of the cervical spine. Journal of spinal disorders & techniques 2004;17:79-85. 60. Grob D, Porchet F, Kleinstuck FS, et al. A comparison of outcomes of cervical disc arthroplasty and fusion in everyday clinical practice: surgical and methodological aspects. European spine journal : official publication of the European Spine Society, the European Spinal Deformity Society, and the European Section of the Cervical Spine Research Society 2010;19:297-306. 61. Guyer RD, McAfee PC, Banco RJ, et al. Prospective, randomized, multicenter Food and Drug Administration investigational device exemption study of lumbar total disc replacement with the CHARITE artificial disc versus lumbar fusion: five-year follow-up. The spine journal : official journal of the North American Spine Society 2009;9:374-86. 62. Hallab N, Link HD, McAfee PC. Biomaterial optimization in total disc arthroplasty. Spine 2003;28:S139-52. 63. Hambly MF, Wiltse LL, Raghavan N, Schneiderman G, Koenig C. The transition zone above a lumbosacral fusion. Spine 1998;23:1785-92. 64. Heller JG, Sasso RC, Papadopoulos SM, et al. Comparison of BRYAN cervical disc arthroplasty with anterior cervical decompression and fusion: clinical and radiographic results of a randomized, controlled, clinical trial. Spine 2009;34:101-7. 65. Hellum C, Johnsen LG, Storheim K, et al. Surgery with disc prosthesis versus rehabilitation in patients with low back pain and degenerative disc: two year follow-up of randomised study. BMJ (Clinical research ed) 2011;342:d2786. 66. Herkowitz HN, Kurz LT, Overholt DP. Surgical management of cervical soft disc herniation. A comparison between the anterior and posterior approach. Spine 1990;15:1026-30. 67. Hestbaek L, Leboeuf-Yde C, Manniche C. Low back pain: what is the long-term course? A review of studies of general patient populations. European spine journal : official publication of the European Spine Society, the European Spinal Deformity Society, and the European Section of the Cervical Spine Research Society 2003;12:149-65. 68. Hilibrand AS, Carlson GD, Palumbo MA, Jones PK, Bohlman HH. Radiculopathy and myelopathy at segments adjacent to the site of a previous anterior cervical arthrodesis. The Journal of bone and joint surgery American volume 1999;81:519-28. 69. Hiratzka J, Rastegar F, Contag AG, Norvell DC, Anderson PA, Hart RA. Adverse Event Recording and Reporting in Clinical Trials Comparing Lumbar Disk Replacement with Lumbar Fusion: A Systematic Review. Global spine journal 2015;5:486-95. 70. Hisey MS, Bae HW, Davis R, et al. Multi-center, prospective, randomized, controlled investigational device exemption clinical trial comparing Mobi-C Cervical Artificial Disc to anterior discectomy and fusion in the treatment of symptomatic degenerative disc disease in the cervical spine. International journal of spine surgery 2014;8. 71. Hisey MS, Bae HW, Davis RJ, et al. Prospective, Randomized Comparison of Cervical Total Disk Replacement Versus Anterior Cervical Fusion: Results at 48 Months Follow-up. Journal of spinal disorders & techniques 2015;28:E237-43.

WA – Health Technology Assessment December 19, 2016
Artificial disc replacement – Re-review: Final evidence report Page - 311
72. Hisey MS, Zigler JE, Jackson R, et al. Prospective, Randomized Comparison of One-level Mobi-C Cervical Total Disc Replacement vs. Anterior Cervical Discectomy and Fusion: Results at 5-year Follow-up. International journal of spine surgery 2016;10:10. 73. Holdt Henningsen K., Thiry N., De Laet C., Stordeur S., Camberlin C. Cervical and lumbar total disc replacements. Health Technology Assessment (HTA) Brussels: Belgian Health Care Knowledge Centre (KCE). 2015. KCE Reports 254. D/2015/10.273/94. . 74. Hou Y, Liu Y, Yuan W, et al. Cervical kinematics and radiological changes after Discover artificial disc replacement versus fusion. The spine journal : official journal of the North American Spine Society 2014;14:867-77. 75. Hu Y, Lv G, Ren S, Johansen D. Mid- to Long-Term Outcomes of Cervical Disc Arthroplasty versus Anterior Cervical Discectomy and Fusion for Treatment of Symptomatic Cervical Disc Disease: A Systematic Review and Meta-Analysis of Eight Prospective Randomized Controlled Trials. PloS one 2016;11:e0149312. 76. Hukuda S, Mochizuki T, Ogata M, Shichikawa K, Shimomura Y. Operations for cervical spondylotic myelopathy. A comparison of the results of anterior and posterior procedures. The Journal of bone and joint surgery British volume 1985;67:609-15. 77. Ishihara H, Kanamori M, Kawaguchi Y, Nakamura H, Kimura T. Adjacent segment disease after anterior cervical interbody fusion. The spine journal : official journal of the North American Spine Society 2004;4:624-8. 78. Jackson RJ, Davis RJ, Hoffman GA, et al. Subsequent surgery rates after cervical total disc replacement using a Mobi-C Cervical Disc Prosthesis versus anterior cervical discectomy and fusion: a prospective randomized clinical trial with 5-year follow-up. Journal of neurosurgery Spine 2016;24:734-45. 79. Jacobs W, Van der Gaag NA, Tuschel A, et al. Total disc replacement for chronic back pain in the presence of disc degeneration. The Cochrane database of systematic reviews 2012;9:Cd008326. 80. Janssen ME, Zigler JE, Spivak JM, Delamarter RB, Darden BV, 2nd, Kopjar B. ProDisc-C Total Disc Replacement Versus Anterior Cervical Discectomy and Fusion for Single-Level Symptomatic Cervical Disc Disease: Seven-Year Follow-up of the Prospective Randomized U.S. Food and Drug Administration Investigational Device Exemption Study. The Journal of bone and joint surgery American volume 2015;97:1738-47. 81. Johannes CB, Le TK, Zhou X, Johnston JA, Dworkin RH. The prevalence of chronic pain in United States adults: results of an Internet-based survey. J Pain 2010;11:1230-9. 82. Johnsen LG, Hellum C, Storheim K, et al. Cost-effectiveness of total disc replacement versus multidisciplinary rehabilitation in patients with chronic low back pain: a Norwegian multicenter RCT. Spine 2014;39:23-32. 83. Kanayama M, Hashimoto T, Shigenobu K, et al. Adjacent-segment morbidity after Graf ligamentoplasty compared with posterolateral lumbar fusion. J Neurosurg 2001;95:5-10. 84. Kaplan W, Wirtz VJ, Mantel-Teeuwisse A, Stolk P, Duthey B, Laing R. Priority Medicines for Europe and the World 2013 Update. World Health Organization; July 9, 2013. 85. Karabag H, Cakmak E, Celik B, Iplikcioglu AC, Soran AF. Arthroplasty versus fusion for single-level cervical disc disease. JPMA The Journal of the Pakistan Medical Association 2014;64:1348-51. 86. Katsuura A, Hukuda S, Saruhashi Y, Mori K. Kyphotic malalignment after anterior cervical fusion is one of the factors promoting the degenerative process in adjacent intervertebral levels. European spine journal : official publication of the European Spine Society, the European Spinal Deformity Society, and the European Section of the Cervical Spine Research Society 2001;10:320-4. 87. Kim SW, Limson MA, Kim SB, et al. Comparison of radiographic changes after ACDF versus Bryan disc arthroplasty in single and bi-level cases. European spine journal : official publication of the European

WA – Health Technology Assessment December 19, 2016
Artificial disc replacement – Re-review: Final evidence report Page - 312
Spine Society, the European Spinal Deformity Society, and the European Section of the Cervical Spine Research Society 2009;18:218-31. 88. Kulkarni V, Rajshekhar V, Raghuram L. Accelerated spondylotic changes adjacent to the fused segment following central cervical corpectomy: magnetic resonance imaging study evidence. J Neurosurg 2004;100:2-6. 89. Kumar MN, Jacquot F, Hall H. Long-term follow-up of functional outcomes and radiographic changes at adjacent levels following lumbar spine fusion for degenerative disc disease. European spine journal : official publication of the European Spine Society, the European Spinal Deformity Society, and the European Section of the Cervical Spine Research Society 2001;10:309-13. 90. Kurtz SM, Lau E, Ianuzzi A, et al. National revision burden for lumbar total disc replacement in the United States: epidemiologic and economic perspectives. Spine 2010;35:690-6. 91. Lee WT, Liu G, Thambiah J, Wong HK. Clinical outcomes of single-level lumbar artificial disc replacement compared with transforaminal lumbar interbody fusion in an Asian population. Singapore medical journal 2015;56:208-11. 92. Lewis DJ, Attiah MA, Malhotra NR, Burnett MG, Stein SC. Anterior surgical management of single-level cervical disc disease: a cost-effectiveness analysis. Spine 2014;39:2084-92. 93. Lindley EM, McBeth ZL, Henry SE, et al. Retrograde ejaculation after anterior lumbar spine surgery. Spine 2012;37:1785-9. 94. Lorig K, Chastain RL, Ung E, Shoor S, Holman HR. Development and evaluation of a scale to measure perceived self-efficacy in people with arthritis. Arthritis Rheum 1989;32:37-44. 95. Lunsford LD, Bissonette DJ, Jannetta PJ, Sheptak PE, Zorub DS. Anterior surgery for cervical disc disease. Part 1: Treatment of lateral cervical disc herniation in 253 cases. J Neurosurg 1980;53:1-11. 96. Mafi JN, McCarthy EP, Davis RB, Landon BE. Worsening trends in the management and treatment of back pain. JAMA Intern Med 2013;173:1573-81. 97. Marquez-Lara A, Nandyala SV, Fineberg SJ, Singh K. Current trends in demographics, practice, and in-hospital outcomes in cervical spine surgery: a national database analysis between 2002 and 2011. Spine 2014;39:476-81. 98. Martins AN. Anterior cervical discectomy with and without interbody bone graft. J Neurosurg 1976;44:290-5. 99. Mayer HM. Total lumbar disc replacement. The Journal of bone and joint surgery British volume 2005;87:1029-37. 100. McAfee PC. The indications for lumbar and cervical disc replacement. The spine journal : official journal of the North American Spine Society 2004;4:177S-81S. 101. McAfee PC, Cappuccino A, Cunningham BW, et al. Lower incidence of dysphagia with cervical arthroplasty compared with ACDF in a prospective randomized clinical trial. Journal of spinal disorders & techniques 2010;23:1-8. 102. McAnany SJ, Overley S, Baird EO, et al. The 5-year cost-effectiveness of anterior cervical discectomy and fusion and cervical disc replacement: a Markov analysis. Spine 2014;39:1924-33. 103. McCaffery M, Beebe A. Pain: Clinical Manual for Nursing Practice. St. Louis: C.V. Mosby Company; 1989. 104. McCullen G, Yuan HA. Artificial disc: current developments in artificial disc replacement. Curr Opin Orthop 2003;14(3):138-43. 105. Medical Advisory Secretariat. Artificial discs for lumbar and cervical degenerative disc disease–update: an evidence-based analysis. Ontario Health Technology Assessment Series 2006; 6(10). 106. Medical Services Advisory Committee. Artificial intervertebral disc replacement (Total disc arthroplasty). MSAC application 1090. Assessment Report. February/March 2006. 107. Medical Services Advisory Committee. Use of Artificial Disc Replacement in Patients with Cervical Degenerative Disc Disease. Prepared by the Spine Society of Australia. 2010.

WA – Health Technology Assessment December 19, 2016
Artificial disc replacement – Re-review: Final evidence report Page - 313
108. Miyakoshi N, Abe E, Shimada Y, Okuyama K, Suzuki T, Sato K. Outcome of one-level posterior lumbar interbody fusion for spondylolisthesis and postoperative intervertebral disc degeneration adjacent to the fusion. Spine 2000;25:1837-42. 109. Mummaneni PV, Burkus JK, Haid RW, Traynelis VC, Zdeblick TA. Clinical and radiographic analysis of cervical disc arthroplasty compared with allograft fusion: a randomized controlled clinical trial. Journal of neurosurgery Spine 2007;6:198-209. 110. Murphy MG, Gado M. Anterior cervical discectomy without interbody bone graft. J Neurosurg 1972;37:71-4. 111. Murrey D, Janssen M, Delamarter R, et al. Results of the prospective, randomized, controlled multicenter Food and Drug Administration investigational device exemption study of the ProDisc-C total disc replacement versus anterior discectomy and fusion for the treatment of 1-level symptomatic cervical disc disease. The spine journal : official journal of the North American Spine Society 2009;9:275-86. 112. Nabhan A, Ahlhelm F, Shariat K, et al. The ProDisc-C prosthesis: clinical and radiological experience 1 year after surgery. Spine 2007;32:1935-41. 113. Nabhan A, Ishak B, Steudel WI, Ramadhan S, Steimer O. Assessment of adjacent-segment mobility after cervical disc replacement versus fusion: RCT with 1 year's results. European spine journal : official publication of the European Spine Society, the European Spinal Deformity Society, and the European Section of the Cervical Spine Research Society 2011;20:934-41. 114. Nabhan A, Steudel WI, Nabhan A, Pape D, Ishak B. Segmental kinematics and adjacent level degeneration following disc replacement versus fusion: RCT with three years of follow-up. Journal of long-term effects of medical implants 2007;17:229-36. 115. Nandyala SV, Marquez-Lara A, Fineberg SJ, Singh K. Comparison between cervical total disc replacement and anterior cervical discectomy and fusion of 1 to 2 levels from 2002 to 2009. Spine 2014;39:53-7. 116. Nie H, Chen G, Wang X, Zeng J. Comparison of Total Disc Replacement with lumbar fusion: a meta-analysis of randomized controlled trials. Journal of the College of Physicians and Surgeons--Pakistan : JCPSP 2015;25:60-7. 117. Odom GL, Finney W, Woodhall B. Cervical disk lesions. J Am Med Assoc 1958;166:23-8. 118. Ofman JJ, Sullivan SD, Neumann PJ, et al. Examining the value and quality of health economic analyses: implications of utilizing the QHES. J Manag Care Pharm 2003;9:53-61. 119. Parkinson B, Goodall S, Thavaneswaran P. Cost-effectiveness of lumbar artificial intervertebral disc replacement: driven by the choice of comparator. ANZ journal of surgery 2013;83:669-75. 120. Patel RK, Slipman CW. Lumbar degenerative disc disease. eMedicine Physical Medicine and Rehabilitation Topic 67. Edited, Omaha, N.E. 2007. http://emedicine.medscape.com/article/309767-overview2007. 121. Peng-Fei S, Yu-Hua J. Cervical disc prosthesis replacement and interbody fusion: a comparative study. International orthopaedics 2008;32:103-6. 122. Peng CW, Yue WM, Basit A, et al. Intermediate Results of the Prestige LP Cervical Disc Replacement: Clinical and Radiological Analysis With Minimum Two-Year Follow-up. Spine 2011;36:E105-11. 123. Petersilge CA. Lumbar disc replacement. Semin Musculoskelet Radiol 2006;10:22-9. 124. Levels of evidence and grades of recommendation. Available at: http://www.cebm.net/wp-content/uploads/2014/06/CEBM-Levels-of-Evidence-2.1.pdf (Accessed July 23, 2015). 125. Phillips FM, Geisler FH, Gilder KM, Reah C, Howell KM, McAfee PC. Long-term Outcomes of the US FDA IDE Prospective, Randomized Controlled Clinical Trial Comparing PCM Cervical Disc Arthroplasty With Anterior Cervical Discectomy and Fusion. Spine 2015;40:674-83.

WA – Health Technology Assessment December 19, 2016
Artificial disc replacement – Re-review: Final evidence report Page - 314
126. Phillips FM, Lee JY, Geisler FH, et al. A prospective, randomized, controlled clinical investigation comparing PCM cervical disc arthroplasty with anterior cervical discectomy and fusion. 2-year results from the US FDA IDE clinical trial. Spine 2013;38:E907-18. 127. Piaggio G, Elbourne DR, Altman DG, Pocock SJ, Evans SJ, Group C. Reporting of noninferiority and equivalence randomized trials: an extension of the CONSORT statement. JAMA 2006;295:1152-60. 128. Pickett GE, Van Soelen J, Duggal N. Controversies in cervical discectomy and fusion: practice patterns among Canadian surgeons. Can J Neurol Sci 2004;31:478-83. 129. Prolo DJ, Oklund SA, Butcher M. Toward uniformity in evaluating results of lumbar spine operations. A paradigm applied to posterior lumbar interbody fusions. Spine 1986;11:601-6. 130. Qizhi S, Lei S, Peijia L, et al. A Comparison of Zero-Profile Devices and Artificial Cervical Disks in Patients With 2 Noncontiguous Levels of Cervical Spondylosis. Clinical spine surgery 2016;29:E61-6. 131. Qureshi SA, McAnany S, Goz V, Koehler SM, Hecht AC. Cost-effectiveness analysis: comparing single-level cervical disc replacement and single-level anterior cervical discectomy and fusion: clinical article. Journal of neurosurgery Spine 2013;19:546-54. 132. Radcliff K, Coric D, Albert T. Five-year clinical results of cervical total disc replacement compared with anterior discectomy and fusion for treatment of 2-level symptomatic degenerative disc disease: a prospective, randomized, controlled, multicenter investigational device exemption clinical trial. Journal of neurosurgery Spine 2016:1-12. 133. Radcliff K, Lerner J, Yang C, Bernard T, Zigler JE. Seven-year cost-effectiveness of ProDisc-C total disc replacement: results from investigational device exemption and post-approval studies. Journal of neurosurgery Spine 2016;24:760-8. 134. Radcliff K, Zigler J, Zigler J. Costs of cervical disc replacement versus anterior cervical discectomy and fusion for treatment of single-level cervical disc disease: an analysis of the Blue Health Intelligence database for acute and long-term costs and complications. Spine 2015;40:521-9. 135. Rao MJ, Cao SS. Artificial total disc replacement versus fusion for lumbar degenerative disc disease: a meta-analysis of randomized controlled trials. Archives of orthopaedic and trauma surgery 2014;134:149-58. 136. Rao MJ, Nie SP, Xiao BW, Zhang GH, Gan XR, Cao SS. Cervical disc arthroplasty versus anterior cervical discectomy and fusion for treatment of symptomatic cervical disc disease: a meta-analysis of randomized controlled trials. Archives of orthopaedic and trauma surgery 2015;135:19-28. 137. Rao RD, Gourab K, David KS. Operative treatment of cervical spondylotic myelopathy. The Journal of bone and joint surgery American volume 2006;88:1619-40. 138. Ratliff JK, Cooper PR. Cervical laminoplasty: a critical review. J Neurosurg 2003;98:230-8. 139. Riew KD, Buchowski JM, Sasso R, Zdeblick T, Metcalf NH, Anderson PA. Cervical disc arthroplasty compared with arthrodesis for the treatment of myelopathy. The Journal of bone and joint surgery American volume 2008;90:2354-64. 140. Riina J, Anderson PA, Holly LT, Flint K, Davis KE, Riew KD. The effect of an anterior cervical operation for cervical radiculopathy or myelopathy on associated headaches. Journal of Bone and Joint Surgery - Series A 2009;91:1919-23. 141. Rodts MF. Total disc replacement arthroplasty. Orthop Nurs 2004;23:216-9. 142. Roh JS, Teng AL, Yoo JU, Davis J, Furey C, Bohlman HH. Degenerative disorders of the lumbar and cervical spine. The Orthopedic clinics of North America 2005;36:255-62. 143. Rohl K, Rohrich F. Artificial disc versus spinal fusion in the treatment of cervical spine degenerations in tetraplegics: a comparison of clinical results. Spinal cord 2009;47:705-8. 144. Roland M, Morris R. A study of the natural history of back pain. Part I: development of a reliable and sensitive measure of disability in low-back pain. Spine 1983;8:141-4.
WA – Health Technology Assessment December 19, 2016
Artificial disc replacement – Re-review: Final evidence report Page - 315
145. Rozankovic M, Marasanov SM, Vukic M. Cervical Disc Replacement With Discover Versus Fusion In A Single Level Cervical Disc Disease: A Prospective Single Center Randomized Trial With A Minimum Two-Year Follow - Up. Journal of spinal disorders & techniques 2014. 146. Rozankovic M, Marasanov SM, Vukic M. Cervical Disc Replacement With Discover Versus Fusion In A Single Level Cervical Disc Disease: A Prospective Single Center Randomized Trial With A Minimum Two-Year Follow - Up. Clinical spine surgery 2016. 147. Sasso RC, Anderson PA, Riew KD, Heller JG. Results of cervical arthroplasty compared with anterior discectomy and fusion: four-year clinical outcomes in a prospective, randomized controlled trial. The Journal of bone and joint surgery American volume 2011;93:1684-92. 148. Schrot RJ, Mathew JS, Li Y, Beckett L, Bae HW, Kim KD. Headache relief after anterior cervical discectomy: post hoc analysis of a randomized investigational device exemption trial: clinical article. Journal of neurosurgery Spine 2014;21:217-22. 149. Segebarth B, Datta JC, Darden B, et al. Incidence of dysphagia comparing cervical arthroplasty and ACDF. SAS journal 2010;4:3-8. 150. Seitsalo S, Schlenzka D, Poussa M, Osterman K. Disc degeneration in young patients with isthmic spondylolisthesis treated operatively or conservatively: a long-term follow-up. European spine journal : official publication of the European Spine Society, the European Spinal Deformity Society, and the European Section of the Cervical Spine Research Society 1997;6:393-7. 151. Skeppholm M, Lindgren L, Henriques T, Vavruch L, Lofgren H, Olerud C. The Discover artificial disc replacement versus fusion in cervical radiculopathy--a randomized controlled outcome trial with 2-year follow-up. The spine journal : official journal of the North American Spine Society 2015;15:1284-94. 152. Skeppholm M, Olerud C. Comparison of dysphagia between cervical artificial disc replacement and fusion: data from a randomized controlled study with two years of follow-up. Spine 2013;38:E1507-10. 153. Skold C, Tropp H, Berg S. Five-year follow-up of total disc replacement compared to fusion: a randomized controlled trial. European spine journal : official publication of the European Spine Society, the European Spinal Deformity Society, and the European Section of the Cervical Spine Research Society 2013;22:2288-95. 154. Snapinn SM. Noninferiority trials. Curr Control Trials Cardiovasc Med 2000;1:19-21. 155. Society NAS. Diagnosis and Treatment of Cervical Radiculopathy from Degenerative Disorders2010. 156. Spine S. Summary of Safety and Effectiveness Data (ProDisc-C Total Disc Replacement); http://www.accessdata.fda.gov/cdrh_docs/pdf7/p070001b.pdf2007. 157. Staub LP, Ryser C, Roder C, et al. Total disc arthroplasty versus anterior cervical interbody fusion: use of the Spine Tango registry to supplement the evidence from randomized control trials. The spine journal : official journal of the North American Spine Society 2016;16:136-45. 158. Steinmetz MP, Patel R, Traynelis V, Resnick DK, Anderson PA. Cervical disc arthroplasty compared with fusion in a workers' compensation population. Neurosurgery 2008;63:741-7; discussion 7. 159. Strand LI, Moe-Nilssen R, Ljunggren AE. Back Performance Scale for the assessment of mobility-related activities in people with back pain. Phys Ther 2002;82:1213-23. 160. Taher F, Essig D, Lebl DR, et al. Lumbar degenerative disc disease: current and future concepts of diagnosis and management. Advances in orthopedics 2012;2012:970752. 161. Tarulli AW, Raynor EM. Lumbosacral radiculopathy. Neurol Clin 2007;25:387-405. 162. Teramoto T, Ohmori K, Takatsu T, Inoue H, Ishida Y, Suzuki K. Long-term results of the anterior cervical spondylodesis. Neurosurgery 1994;35:64-8. 163. Thavaneswaran P, Vandepeer M. Lumbar artificial intervertebral disc replacement: a systematic review. ANZ journal of surgery 2014;84:121-7.

WA – Health Technology Assessment December 19, 2016
Artificial disc replacement – Re-review: Final evidence report Page - 316
164. The Cochrane Collaboration. Cochrane Handbook for Systematic Reviews of Interventions. 17.8.1. Study Summaries Focusing on a Single Patient-Reported Outcome. Available at: http://handbook.cochrane.org/chapter_17/17_8_1_study_summaries_focusing_on_a_single_patient_reported.htm. 2011. 165. Tropiano P, Huang RC, Girardi FP, Cammisa FP, Jr., Marnay T. Lumbar total disc replacement. Seven to eleven-year follow-up. The Journal of bone and joint surgery American volume 2005;87:490-6. 166. Truumees E, Herkowitz HN. Cervical spondylotic myelopathy and radiculopathy. Instructional course lectures 2000;49:339-60. 167. US Food & Drug Administration (FDA). Summary of Safety and Effectiveness Data (SSED): CHARITE Artifical Disc. http://www.accessdata.fda.gov/cdrh_docs/pdf4/P040006B.pdf2004. 168. US Food & Drug Administration (FDA). Summary of Safety and Effectiveness Data (SSED): PRODISC-L Total Disc Replacement. http://www.accessdata.fda.gov/cdrh_docs/pdf5/P050010B.pdf2006. 169. US Food & Drug Administration (FDA). Summary of Safety and Effectiveness Data (SSED): PRESTIGE Cervical Disc System. http://www.accessdata.fda.gov/cdrh_docs/pdf6/P060018b.pdf2007. 170. US Food & Drug Administration (FDA). Summary of Safety and Effectiveness Data (SSED): ProDisc-C Total Disc Replacement. http://www.accessdata.fda.gov/cdrh_docs/pdf7/p070001b.pdf2007. 171. US Food & Drug Administration (FDA). Summary of Safety and Effectiveness Data (SSED): Bryan Cervical Disc. http://www.accessdata.fda.gov/cdrh_docs/pdf6/P060023b.pdf 2009. 172. US Food & Drug Administration (FDA). Summary of Safety and Effectiveness Data (SSED): PCM Cervical Disc. http://www.accessdata.fda.gov/cdrh_docs/pdf10/P100012b.pdf2012. 173. US Food & Drug Administration (FDA). Summary of Safety and Effectiveness Data (SSED): SECURE-C Cervical Artificial Disc. http://www.accessdata.fda.gov/cdrh_docs/pdf10/p100003b.pdf2012. 174. US Food & Drug Administration (FDA). Summary of Safety and Effectiveness Data (SSED): Mobi-C Cervical Disc Prosthesis (1-level indication). http://www.accessdata.fda.gov/cdrh_docs/pdf11/p110002b.pdf2013. 175. US Food & Drug Administration (FDA). Summary of Safety and Effectiveness Data (SSED): Mobi-C Cervical Disc Prosthesis (2-level indication). http://www.accessdata.fda.gov/cdrh_docs/pdf11/P110009B.pdf2013. 176. US Food & Drug Administration (FDA). Summary of Safety and Effectiveness Data (SSED): activL Artificial Disc (activL). http://www.accessdata.fda.gov/cdrh_docs/pdf12/p120024b.pdf2015. 177. Vaccaro A, Beutler W, Peppelman W, et al. Clinical outcomes with selectively constrained SECURE-C cervical disc arthroplasty: two-year results from a prospective, randomized, controlled, multicenter investigational device exemption study. Spine 2013;38:2227-39. 178. Vernon H, Mior S. The Neck Disability Index: a study of reliability and validity. J Manipulative Physiol Ther 1991;14:409-15. 179. Waddell G, Newton M, Henderson I, Somerville D, Main CJ. A Fear-Avoidance Beliefs Questionnaire (FABQ) and the role of fear-avoidance beliefs in chronic low back pain and disability. Pain 1993;52:157-68. 180. Walsh J. Artificial Disc Replacement for Degenerative Disc Disease of the Cervical Spine. California Technology Assessment Forum (CTAF). San Francisco, CA. October 2009. 181. Ware JE, Jr., Sherbourne CD. The MOS 36-item short-form health survey (SF-36). I. Conceptual framework and item selection. Medical care 1992;30:473-83. 182. Ware JE KM, Keller SD. SF-36 Physical and Mental Health Summary Scales: A User's Manual. Boston, MA: The Health Institute, New England Medical Cente; 1994. 183. Wei J, Song Y, Sun L, Lv C. Comparison of artificial total disc replacement versus fusion for lumbar degenerative disc disease: a meta-analysis of randomized controlled trials. International orthopaedics 2013;37:1315-25.

WA – Health Technology Assessment December 19, 2016
Artificial disc replacement – Re-review: Final evidence report Page - 317
184. West S KV, Carey TS, et. al. Systems to Rate the Strength of Scientific Evidence. Evidence Report/Technology Assessment No. 47 (Prepared by the Research Triangle Institute-University of North Carolina Evidence-based Practice Center, Contract No. 290-97-0011). In: Agency for Healthcare Research and Quality, Rockville, MD; 2002. 185. Yao Q, Liang F, Xia Y, Jia C. A meta-analysis comparing total disc arthroplasty with anterior cervical discectomy and fusion for the treatment of cervical degenerative diseases. Archives of orthopaedic and trauma surgery 2016;136:297-304. 186. Young WF. Cervical spondylotic myelopathy: a common cause of spinal cord dysfunction in older persons. Am Fam Physician 2000;62:1064-70, 73. 187. Yue WM, Brodner W, Highland TR. Long-term results after anterior cervical discectomy and fusion with allograft and plating: a 5- to 11-year radiologic and clinical follow-up study. Spine 2005;30:2138-44. 188. Zdeblick TA. The treatment of degenerative lumbar disorders. A critical review of the literature. Spine 1995;20:126S-37S. 189. Zhang HX, Shao YD, Chen Y, et al. A prospective, randomised, controlled multicentre study comparing cervical disc replacement with anterior cervical decompression and fusion. International orthopaedics 2014;38:2533-41. 190. Zhang X, Zhang X, Chen C, et al. Randomized, controlled, multicenter, clinical trial comparing BRYAN cervical disc arthroplasty with anterior cervical decompression and fusion in China. Spine 2012;37:433-8. 191. Zhang Y, Liang C, Tao Y, et al. Cervical total disc replacement is superior to anterior cervical decompression and fusion: a meta-analysis of prospective randomized controlled trials. PloS one 2015;10:e0117826. 192. Zhong ZM, Li M, Han ZM, et al. Does cervical disc arthroplasty have lower incidence of dysphagia than anterior cervical discectomy and fusion? A meta-analysis. Clinical neurology and neurosurgery 2016;146:45-51. 193. Zhong ZM, Zhu SY, Zhuang JS, Wu Q, Chen JT. Reoperation After Cervical Disc Arthroplasty Versus Anterior Cervical Discectomy and Fusion: A Meta-analysis. Clinical orthopaedics and related research 2016;474:1307-16. 194. Zigler J, Delamarter R, Spivak JM, et al. Results of the prospective, randomized, multicenter Food and Drug Administration investigational device exemption study of the ProDisc-L total disc replacement versus circumferential fusion for the treatment of 1-level degenerative disc disease. Spine 2007;32:1155-62; discussion 63. 195. Zigler JE, Delamarter R, Murrey D, Spivak J, Janssen M. ProDisc-C and anterior cervical discectomy and fusion as surgical treatment for single-level cervical symptomatic degenerative disc disease: five-year results of a Food and Drug Administration study. Spine 2013;38:203-9. 196. Zigler JE, Delamarter RB. Five-year results of the prospective, randomized, multicenter, Food and Drug Administration investigational device exemption study of the ProDisc-L total disc replacement versus circumferential arthrodesis for the treatment of single-level degenerative disc disease. Journal of neurosurgery Spine 2012;17:493-501. 197. Zigler JE, Glenn J, Delamarter RB. Five-year adjacent-level degenerative changes in patients with single-level disease treated using lumbar total disc replacement with ProDisc-L versus circumferential fusion. Journal of neurosurgery Spine 2012;17:504-11.