articulation and transfer in tennessee higher education · mr. david h. lillard, ... articulation...
TRANSCRIPT
Articulation and Transfer in Tennessee
Higher Education
2016-2017
Tennessee Higher Education Commission

Articulation and Transfer in Tennessee Higher Education | 2016-2017 Tennessee Higher Education Commission ii
Tennessee Higher Education Commission
2017-18 Commission Members
Mr. Jeremy Chisenhall, Austin Peay State University, voting student member
Mr. Evan Cope, Chair, Murfreesboro (Middle Tennessee)
Dr. Nancy Dishner, Johnson City (East Tennessee)
Mr. Tre Hargett, Secretary of State
Mr. Jimmy Johnston, Gallatin (Middle Tennessee)
Dr. Sara Heyburn Morrison, Executive Director, State Board of Education, non-voting ex-officio
Ms. Pam Koban, Nashville (Middle Tennessee)
Mr. David H. Lillard, Jr., State Treasurer
Ms. Mintha Roach, Vice-Chair, Knoxville (East Tennessee)
Mr. Vernon Stafford, Jr., Vice-Chair, Memphis (West Tennessee)
Mr. Frank L. Watson, Jr., Memphis (West Tennessee)
Mayor A C Wharton, Jr., Secretary, Memphis (West Tennessee)
Mr. Justin P. Wilson, State Comptroller
Ms. Dakasha Winton, Chattanooga (East Tennessee)

Articulation and Transfer in Tennessee Higher Education | 2016-2017 Tennessee Higher Education Commission iii
Table of Contents I. Executive Summary ............................................................................................................................... 1
II. Background .............................................................................................................................................. 2
Definitions ............................................................................................................................................. 2
Articulation and Transfer Policies .................................................................................................. 3
Protecting Personally Identifiable Information .......................................................................... 3
Acknowledgments ............................................................................................................................... 4
III. Complete College Tennessee Act: Articulation and Transfer Policies ....................................... 5
Tennessee Transfer Pathways .......................................................................................................... 5
Reverse Transfer Policy ..................................................................................................................... 6
Prior Learning Assessment................................................................................................................ 7
IV. Tennessee Transfer Student Profile: AY 2016-17 ............................................................................ 9
Statewide Student Transfer Activity .............................................................................................. 9
Transfer Activity in Public Higher Education .............................................................................. 15
Student Transfer Activity by Public Institution .......................................................................... 20
Academic Characteristics of Transfer Students ........................................................................... 25
V. Student Mobility from Tennessee Colleges of Applied Technology .......................................... 28
Institutional Migration Patterns of TCAT Transfers .................................................................. 28
Demographic and Academic Characteristics of TCAT Transfers ............................................. 30
VI. Transfer History of 2015-16 Bachelor’s Degree Completers ......................................................... 33
VII. Conclusion ................................................................................................................................................ 34
Appendix A. Transfers by Sector of Origin and as a Percent of Undergraduate Enrollment, Public Institutions, AY 2016-17 ................................................................................................................................... 36
Appendix B. Transfers by Sector of Origin, TICUA Member Institutions, AY 2016-17 ........................... 37
Appendix C. Transfers by Sending Institution and Receiving University, AY 2016-17 .......................... 38
Articulation and Transfer in Tennessee Higher Education | 2016-2017 Tennessee Higher Education Commission iv
Table of Contents (continued) Appendix D. Transfers by Sending Institution and Receiving Community College, AY 2016-17......... 39
Appendix E. Transfers by Credits and Degrees Brought to Receiving Institutions, AY 2016-17 .......... 40
Appendix F. Transfers by Credit Hours Earned at Sending Institutions, AY 2016-17 ............................. 42

Articulation and Transfer in Tennessee Higher Education | 2016-2017 Tennessee Higher Education Commission v
List of Tables Table 1. Student Transfer Activity by Sector of Origin, AY 2016-17 ................................................. 11
Table 2. Transfers by Sending State, Semester, and Receiving Sector, AY 2016-17 ...................... 14
Table 3. Fall Transfer Activity within Tennessee Public Sector, Fall 2010-Fall 2016 ................... 20
Table 4. Transfers as a Percent of Undergraduate Enrollment, Fall 2012-Fall 2016 ..................... 22
Table 5. Transfers as a Percent of Undergraduate Enrollment by Sector and Semester ............ 23
Table 6. Each Institution’s Share of Total Public Transfer Activity, AY 2016-17 ........................... 24
Table 7. Outmigration of TCAT Transfers by Sending Institution, AY 2016-17 ............................. 29
Table 8. Outmigration of TCAT Transfers by Receiving Institution, AY 2016-17 .......................... 30
Table 9. Student Registration Types of TCAT Transfers, AY 2016-17 ............................................... 31
Table 10. TCAT Transfers by Major and Post-transfer Major Change, AY 2016-17 ......................... 32

Articulation and Transfer in Tennessee Higher Education | 2016-2017 Tennessee Higher Education Commission vi
List of Figures Figure 1. Student Transfer by Receiving Sector and Semester, AY 2016-17 ..................................... 9
Figure 2. Student Transfer Patterns, AY 2016-17 .................................................................................... 10
Figure 3. Transfers by Originating Location, In-State vs. Out-of-State, AY 2016-17 ...................... 12
Figure 4. Out-of-State Transfers into Tennessee Institutions by State of Origin, AY 2016-17 .... 13
Figure 5. Total Public Undergraduate and New Transfer Headcount, Fall 2008-Fall 2016 .......... 16
Figure 6. Demographic Characteristics of Transfer and Native Students, AY 2016-17 .................. 17
Figure 7. Transfers and Non-transfers by Enrollment Status and Semester, Ay 2016-17 ............. 18
Figure 8. Transfers into Public Institutions, AY 2016-17 ....................................................................... 19
Figure 9. Public Transfer Activity, AY 2016-17 ........................................................................................ 19
Figure 10. Transfers as a Percent of Public Undergraduate Enrollment, AY 2016-17 ...................... 21
Figure 11. Transfers as a Percent of TICUA Undergraduate Enrollment, Fall 2016 ......................... 23
Figure 12. Academic Majors of Transfer Students at Receiving Institutions, AY 2016-17 ............... 25
Figure 13. New Transfer Students by Credits and Degrees Transferred In, AY 2016-17 ................. 26
Figure 14. Academic Major at Transfer, Students with >60 Credits and No Degree, AY 2016-17 .. 27
Figure 15. Demographic Characteristics of TCAT and Traditional Transfers, AY 2016-17.............. 31

Articulation and Transfer in Tennessee Higher Education | 2016-2017 Tennessee Higher Education Commission 1
I. Executive Summary
During academic year (AY) 2016-17, comparable proportions of undergraduate students transferred into the public sector and member institutions of the Tennessee Independent Colleges and Universities Association (TICUA) in each semester. The majority of new transfers—62.4 percent in the public sector and 65.8 percent at TICUA institutions—occurred in the fall semester (Figure 1). Most transfer activity (58.7 percent) occurred within the Tennessee higher education system, while 37.2 percent of transfer students arrived from out-of-state (Figure 2). Approximately half of students transferring from out-of-state institutions (49.7 percent) were actually Tennessee residents returning home (Figure 3).
55.3 percent of transfers into the public sector were from other Tennessee public institutions (Figure 2), and transfer activity within the public sector was multidirectional. The majority of transfers were vertical (70.9 percent), with community college-to-university transfers outnumbering university-to-community college transfers 2.5 to 1. The direction and relative shares of transfers among Tennessee public institutions have been consistent for the past several years (Table 3). The traditional model of transfer—from community colleges to universities—accounted for half of all new transfer activity within Tennessee public higher education (50.8 percent).
Among public universities, the share of new transfer students in the fall semester, measured as a percent of public undergraduate enrollment, has been consistent across institutions and systems over time (Table 4). The community college sector, however, has seen a slight decline in the share of transfer students over the last five years, from 6.8 percent to 5.5 percent of undergraduate fall enrollment. In Fall 2016, new transfers made up 6.9 percent of all public undergraduate enrollment (Figure 5).
Transfer students are very similar to native students in terms of their demographic and academic characteristics, with the exception that adult students make up a larger share of the transfer student population (Figure 6). 15 percent of public students transferred before earning more than 12 credits, and 53.3 percent transferred before earning more than 48 credits (Figure 13). More than one-third (34.1 percent) of students transferred with more than 60 credit hours, and the majority students transferred before earning an associate degree (Figure 13).
During AY 2016-17, the number of students transferring from Tennessee Colleges of Applied Technology (TCATs) to the state’s public colleges and universities (1,072 students) was much smaller than the number of traditional transfers (Table 7, Table 8). TCAT transfers1 were similar to traditional public transfers in terms of their demographic characteristics but included a larger percentage of traditional age students (Figure 15). Approximately 80 percent of TCAT transfers changed majors after transferring (Table 10).
Tennessee’s student population has become highly mobile. Among 2015-16 bachelor’s degree completers, 44.9 percent changed institutions at least once during their prior academic history. Of all 2015-16 bachelor’s degree completers, 29.4 percent previously attended a Tennessee community college. 1 TCAT transfer is defined on page 9.

Articulation and Transfer in Tennessee Higher Education | 2016-2017 Tennessee Higher Education Commission 2
II. Background
The annual Articulation and Transfer Report fulfills the statutory requirement of the Tennessee Higher Education Commission (THEC) to report to the chairs of the Senate and House education and finance, ways and means committees of the General Assembly each year on the progress made toward full articulation between all public institutions.2
The 2017 Articulation and Transfer Report presents an update on the implementation of the articulation and transfer mandate of the Complete College Tennessee Act (CCTA) of 2010. It also examines student transfer activity in AY 2016-17, as well as characteristics and mobility patterns of former students of the TCATs.
This report analyzes student transfer activity for the entire academic year. Specifically, it looks at new transfer students at Tennessee higher education institutions in Summer 2016, Fall 2016, and Spring 2017. To be consistent with the reports published prior to 2013, select tables and figures present data for the fall semester only.
In the coming years, we will report on transfer behavior of Tennessee Promise students and will examine changes in transfer patterns at the institution level, in light of the Focus on College and University Success (FOCUS) Act of 2016.
Definitions
In the postsecondary context, articulation is the process of comparing the content of courses transferred between institutions. Seamless articulation ensures that courses completed at the sending institution need not be repeated at the receiving institution. Articulation agreements between postsecondary institutions or systems may differ relative to courses in the general education curriculum, the pre-major block, and the academic major.
In this report, a transfer student is a student who enrolled as an undergraduate at the receiving institution (transfer-to institution) for the first time (that is, was not a returning or readmitted student) and brought in credits earned at another postsecondary institution (sending institution). Transfer students include individuals returning to higher education with degrees at the baccalaureate level or above. This definition differs from those used in the Tennessee Higher Education Fact Book and in the outcomes based funding formula.3 Therefore, the reader should not compare the number of transfer students and the number of credit hours transferred that are produced by these distinct methodologies.
A native student is a student at a Tennessee public institution who never transferred from another institution during his/her academic career. However, native students include individuals who took 2 Tenn. Code Ann. § 49-7-202(r)(5) 3 The Fact Book relies on transfer data reported by institutions, while this report checks institutional codes for transfer students against student enrollment history and registration type in the current and prior terms.

Articulation and Transfer in Tennessee Higher Education | 2016-2017 Tennessee Higher Education Commission 3
courses at a higher education institution different from their current institution of enrollment while in high school (dual enrollment).
A non-transfer student is a student at a public Tennessee institution who was not identified as a transfer student at any time during the academic year of interest. By definition, non-transfer students include native students as well as students who transferred into the Tennessee public sector prior to AY 2016-17.
A TCAT transfer is a student who was enrolled at a Tennessee public institution in AY 2016-17 and had taken classes at a TCAT in the previous semester of enrollment. For fall public enrollees, enrollment in TCAT classes may have occurred in either summer or spring. No assumption of transferred credit is made with these students.
Articulation and Transfer Policies
To meet the requirements of CCTA, the Tennessee Board of Regents (TBR), University of Tennessee (UT) System, and THEC developed a Tennessee Transfer Pathways program. This program designated 51 transfer pathways between the state’s community colleges and public universities. These pathways—and the common general education requirements—provide seamless transfer for community college students to any Tennessee public university in certain fields of study.4
Additionally, the systems and THEC have developed a reverse transfer policy and accompanying transcript analysis system, which allows transfer students who have accrued the appropriate number and distribution of credits after transferring to a public university to retroactively earn an associate degree from the originating community college.5
The Tennessee Prior Learning Assessment (PLA) initiative promotes the evaluation of non-traditional learning for academic credit at Tennessee public institutions and ensures transferability of PLA credit among systems and institutions.
To further expand the opportunities available to students in Tennessee, THEC invited participation from TICUA in the development of each of the above initiatives. To date, 22 private not-for-profit institutions accept all or some of the 51 transfer pathways; six private not-for-profit institutions are involved with the reverse transfer initiative; and many private not-for-profit institutions accept PLA credit.
Protecting Personally Identifiable Information
Throughout this report, THEC seeks to comply with federal Family Educational Rights and Privacy Act (FERPA) requirements to protect students’ personally identifiable information by suppressing individual
4 Additional information about the Tennessee Transfer Pathways is available at http://www.tntransferpathway.org/ 5 The Reverse Transfer Policies, Procedures, and Guidelines are available at https://policies.tbr.edu/policies/reverse-transfer-policies-procedures-and-guidelines-0

Articulation and Transfer in Tennessee Higher Education | 2016-2017 Tennessee Higher Education Commission 4
cells containing five observations or fewer. As a result, the totals reported in some tables may not equal the actual total due to the omission of these suppressed values. All such cases are identified with a special note under the respective table, and the unsuppressed grand total is reported separately.
Acknowledgments
This report is made possible through the ongoing efforts of UT, TBR, and their member institutions to provide quality data on their student populations and updates on articulation and transfer policy implementation. Additionally, THEC gratefully acknowledges the unremitting effort of TICUA and its member institutions to provide data on transfer students. This collaboration has made possible statewide snapshots of student transfer activity in the public and private sectors.

Articulation and Transfer in Tennessee Higher Education | 2016-2017 Tennessee Higher Education Commission 5
III. Complete College Tennessee Act: Articulation and Transfer Policies
The State of Tennessee continues to develop and implement policies that provide for better articulation among institutions and a more efficient transfer of college credit. A central focus of CCTA was to improve the transferability and articulation of college credit between the community college and university sectors. Specifically, CCTA directed THEC, in cooperation with UT and TBR, to ensure that the 60 hours of instruction in defined Tennessee Transfer Pathways can be fully transferred from community colleges and applied toward the requirements for a bachelor’s degree at public universities.
Tennessee is making great strides to implement the articulation and transfer mandate of CCTA. The systems, in collaboration with THEC, continue to monitor the health and productivity of the transfer process and implement new policies to support that effort. In the area of articulation and transfer, CCTA implementation has been structured around the following key initiatives: (a) establishing Tennessee Transfer Pathways; (b) developing a reverse transfer policy; and (c) ensuring transferability of PLA credit.
Tennessee Transfer Pathways
The Tennessee Transfer Pathways are designed to expedite student progression toward a bachelor’s degree. A transfer pathway provides for 60 hours of fully transferrable instruction in a designated major. The 60 hours of instruction in a transfer pathway consists of 41 hours of general education and 19 hours of pre-major or elective courses. Students can earn an associate degree from a Tennessee community college that ensures a smooth transition into the corresponding baccalaureate degree program at a public university. These pathways provide seamless transfer for community college students to any participating four-year institution in Tennessee that offers the baccalaureate degree in those majors (including participating TICUA institutions). Currently, there are 51 pathways within eight academic focus areas6 that have been developed by UT and TBR. A curricular map is available for each pathway, which lists all degree requirements (including general education courses and major-specific electives).
A key method of communicating information about transfer pathways to students is through the Tennessee Transfer Pathways website (www.tntransferpathway.org). In July 2017, TBR launched a redesigned Tennessee Transfer Pathways website, with the goal of providing a more comprehensive, user-friendly resource for students, faculty, advisors, and administrators. The website provides essential information for students concerning steps for successful transfer, degree requirements for each pathway, and curricular maps that provide a four-semester sequence for completing each pathway at the community college. Additionally, the website provides salary and employment outlook information.
6 The eight academic focus areas are as follows: Applied Technology, Arts, Business, Education, Health Sciences, Humanities, Social Sciences, and STEM.

Articulation and Transfer in Tennessee Higher Education | 2016-2017 Tennessee Higher Education Commission 6
Reverse Transfer Policy
In April 2012, Governor Haslam signed HB 2827, which “authorized and encouraged” the TBR community colleges to enter into reverse transfer agreements with the state’s public and private four-year institutions accredited by the Southern Association of Colleges and Schools Commission on Colleges. Likewise, the TBR and UT four-year institutions were “authorized and encouraged” to enter into reverse transfer agreements with the TBR community colleges.
In July 2012, a task force was convened to develop and implement a reverse transfer policy for the state. The task force was comprised of members from THEC, TBR, UT, and TICUA and provided policy recommendations that informed the Reverse Transfer Policies, Procedures, and Guidelines currently in place.7 This policy allows students who transferred to a participating four-year institution to also receive an associate degree from their originating Tennessee community college if, after transferring, they accumulated the number and distribution of credit hours required for that degree. Potential reverse transfer degree candidates must have earned a minimum of 15 college credits at the Tennessee community college (to meet regional accreditation residency requirements) and a minimum of 60 combined credits from the community college and the four-year institution.
Significant progress has been made in the development and implementation of the reverse transfer process to award associate degrees to students who transfer from community colleges to participating four-year institutions before receiving an associate degree. In 2014, UT Knoxville received nearly $400,000 from a Lumina Foundation grant program, entitled “Credit When It’s Due.” This grant, coupled with generous state support, has provided the funding for software development and personnel required to facilitate marketing, research, and training for community college and university staff.
Through a competitive bid process, AcademyOne, Inc. was selected as the software vendor for the reverse transfer project in 2014. Statewide implementation of the reverse transfer software was phased in, with half of the institutions participating in December 2014 reverse transfer graduations and the remainder participating in May 2015 reverse transfer graduations. Of the 1,200 potential degree candidates, 350 associate degrees were awarded by Spring 2015.
During the Fall 2015 term, implementation of the reverse transfer project was launched statewide. Participation included all public community college and universities, along with eight private universities. A total of 828 associate degrees were awarded through reverse transfer in AY 2015-16, representing an 8.7 percent increase over total associate degrees awarded in AY 2014-15. Data for reverse transfer associate degrees awarded in AY 2016-17 will be available in October 2017.
7 The Reverse Transfer Policies, Procedures, and Guidelines are available at https://policies.tbr.edu/policies/reverse-transfer-policies-procedures-and-guidelines-0

Articulation and Transfer in Tennessee Higher Education | 2016-2017 Tennessee Higher Education Commission 7
Prior Learning Assessment
THEC continues to lead statewide and national efforts for promoting and expanding the evaluation of postsecondary credit through PLA. While THEC continues to support efforts aimed at standardizing PLA at public and private institutions, THEC’s activities have shifted to providing direct assistance to public campuses in their own efforts to grow their PLA programs. Beginning in 2014, THEC (with support from the Ford Foundation) provided marketing, awareness, and technical assistance to Tennessee’s public institutions to grow capacity and enhance program offerings related to PLA.
While Tennessee has made great strides to develop clearer, more comprehensive PLA standards and to provide more PLA options, some students still find it difficult to locate information about PLA opportunities. In early 2015, THEC began working with a marketing firm to develop a common identity for all PLA programs in the state. The result is Timewise TN: Turn Your Years of Knowledge into College Credit. An associated logo, student orientation brochure, and video have been made available to any institution that chooses to use the Timewise TN moniker. Institutional PLA programs will not change in form; however, the goal is to develop a common language that will be clear to students and allow them to easily find PLA resources on campus. The adoption of the logo and program name (Timewise TN) is voluntary.8
In April 2015, Public Chapter 219 was signed into law and directed THEC to coordinate the improvement of institutional polices relevant to awarding PLA to student veterans and service members. The legislation directed THEC to convene representatives from UT and TBR to “identify and develop uniform methods to assess and maximize academic credit awarded by public institutions of higher education to veterans and military service members for military experience, education, and training obtained during military service.” THEC convened representatives from both UT and TBR in March 2016 to discuss best practices in awarding academic credit for military training and experience. UT and TBR subsequently worked to revise policies relevant to awarding academic credit for military experience between March and August of 2016. The resulting changes, which include provisions for addressing excess credit and prioritizing the Joint Services Transcript, were enacted by institutions in Fall 2016. These changes help ensure that student veterans and service members receive an appropriate amount of academic credit for their prior military training and experience.
Regarding articulation and transfer policies, the main goal is to ensure that relevant PLA credits accepted by one institution will continue to be accepted by all other institutions at the time of transfer in the same manner as traditional classroom credit. In Fall 2012, the Tennessee Prior Learning Assessment Task Force drafted Recommended Standards in Prior Learning Assessment (PLA) Policy and Practice for Tennessee Public Colleges and Universities, which included guidelines for the transcription and transfer of PLA credit at public institutions. The standards were formally adopted by TBR in September 2013. Although UT has not adopted the standards as a formal system-wide policy, it uses them to improve practice: PLA that is
8 Additional information about Timewise TN is available at http://tn.gov/thec/article/timewise-about

Articulation and Transfer in Tennessee Higher Education | 2016-2017 Tennessee Higher Education Commission 8
recognized as a course equivalent in a completed pathway, course cluster, or associate degree program will transfer accordingly. Therefore, both systems have agreed to accept PLA credit in transfer if the credit falls within the aforementioned parameters. Furthermore, the standards were formally endorsed by the TICUA Board in Fall 2013.
As THEC has worked with UT and TBR to standardize the tracking and collection of PLA-related data, PLA credits that meet the standards agreed upon will now be used to trigger progression and transfer-out metrics within the public higher education funding formula. Additionally, articulation and transfer policies play through Tennessee’s outcomes based funding formula for public higher education. They impact, directly and indirectly, the metrics for degree completion, progression, graduation rate (for universities only), and Prior Learning Assessment. This fact has elevated the stakes around the articulation and transfer policy, an important aspect of academic policy. This is desirable in that it ensures incentives for students and institutions are aligned on this issue, as both have an interest in sound articulation and transfer policy and practices. However, care must be taken that concerns about the outcomes based funding formula do not drive articulation and transfer policy.

Articulation and Transfer in Tennessee Higher Education | 2016-2017 Tennessee Higher Education Commission 9
IV. Tennessee Transfer Student Profile: AY 2016-17
This section examines patterns in Tennessee student transfers in AY 2016-17 and, when appropriate, trends over time. The analysis of student transfer activity is conducted and presented at the following levels: (a) statewide student transfer activity, (b) transfer activity in public higher education, (c) student transfer activity by public institution, and (d) academic characteristics of transfer students. This section also compares various characteristics of transfer and native students.
Statewide Student Transfer Activity
Patterns in Student Transfer Activity During AY 2016-17, 21,929 students transferred into Tennessee public higher education institutions, and 6,071 students transferred into TICUA member institutions (Figure 1). Roughly commensurate proportions of students moved into both sectors in each semester of the academic year. Most students transferred in the fall semester: 62.4 percent in the public sector and 65.8 percent at TICUA institutions. 27.7 percent of public transfers and 23.1 percent of TICUA transfers arrived in spring. The smallest share of transfer students arrived in the summer semester: 9.9 percent into public institutions and 11.2 percent into TICUA institutions.
Figure 1. Student Transfer by Receiving Sector and Semester, AY 2016-17

Articulation and Transfer in Tennessee Higher Education | 2016-2017 Tennessee Higher Education Commission 10
During AY 2016-17, a total of 28,000 students transferred into a Tennessee public or TICUA member institution (Figure 2).
• The majority of students (58.7 percent or 16,423 students) moved within Tennessee higher education, from one state public or private non-profit institution to another. This number comprises 12,121 within-public-sector transfers, 302 within-TICUA transfers, 2,324 transfers from publics to TICUA, and 1,676 transfers from all independent institutions into the public sector.
• 37.2 percent (10,420 students: 8,132 public and 2,288 private transfers) transferred in from out-of-state institutions.
• The remaining 4.1 percent of students transferred into TICUA institutions from unknown locations (1,157 students).
Comparable proportions of out-of-state students moved into the public sector (37.1 percent) and TICUA institutions (37.7 percent). In sharp contrast, within-sector transfers accounted for 55.3 percent (12,121 students of 21,929 transfers) of the public institution total, but only 5 percent (302 students of 6,071 transfers) of TICUA transfers were from other TICUA institutions. This indicates that more intense internal transfer activity takes place within the public sector, as compared to transfers among TICUA member institutions.
Figure 2. Student Transfer Patterns, AY 2016-17
Student Transfer Activity by Sector of Origin In AY 2016-17, the public sector received 21,929 transfer students (78.3 percent of the total), while TICUA institutions received 6,071 transfers (21.7 percent of the total). A majority of students (14,445 students or 51.6 percent) came from Tennessee public institutions; out-of-state institutions sent 10,420 students (37.2 percent); and 1,978 students (7.1 percent) transferred from Tennessee’s independent sector (Table 1).

Articulation and Transfer in Tennessee Higher Education | 2016-2017 Tennessee Higher Education Commission 11
Table 1. Student Transfer Activity by Sector of Origin, AY 2016-17
Receiving Sector Transfers by Sector of Origin
Total Transfers
Overall Enrollment9 Tennessee
Public Tennessee
Independent Out-of-State
Unknown
Public University Total 7,841 902 4,682
13,425 128,655 Community College Total 4,280 774 3,450
8,504 114,173
Public Higher Education Total 12,121 1,676 8,132
21,929 242,828 TICUA Total 2,324 302 2,288 1,157 6,071 -
Grand Total 14,445 1,978 10,420 1,157 28,000 -
Appendix A and Appendix B contain detailed tables of AY 2016-17 enrollment and transfer activity by sector and institution.
Out-of-state Student Transfer Activity The following caveats should be considered when interpreting the data on out-of-state transfers. First, for different graphs on public institutions, this report relies on either the resident status of transfer students or the state in which the previous institution is located. Due to the data structure at TICUA, the report uses only the state of the prior institution when examining the private sector. Second, transfers from out-of-state are not homogeneous. They comprise two large groups: residents of other states and Tennessee residents transferring from out-of-state colleges and universities to institutions in Tennessee. These two groups of transfer students, out-of-state residents and returning Tennessee residents, are reported separately (Figure 3).
As Figure 3 shows, Tennessee residents transferring within the state’s public and private institutions accounted for 58.7 percent of all AY 2016-17 transfers into Tennessee higher education. The general group of out-of-state students accounted for 37.2 percent of all transfers and included the following categories: transfers into TICUA institutions (8.2 percent), transfers by residents of other states (10.6 percent), and transfers of Tennessee residents returning to their home state (18.5 percent).
For public transfers, the group of returning Tennessee residents is 1.8 times larger than the group of “true” out-of-state students and constitutes 49.7 percent of all out-of-state transfers. From a policy perspective, this observation is critical because it allows us to better understand the reasons why a student might transfer. One may suppose that Tennessee students return due to a combination of financial, academic, and personal considerations. The substantial number of returning residents suggests that, in the long run, Tennessee may be losing fewer students to other states than traditional data on the out-migration of high school graduates suggest. Availability of lottery scholarships could be a factor in a student’s decision to transfer to a home state’s public institution.10
9 Count is duplicated if students enrolled at more than one institution during the academic year. 10 Tennessee residents who were eligible for a Tennessee Education Lottery Scholarship (TELS) upon completion of high school requirements, but who enrolled in a regionally accredited out-of-state postsecondary institution after high school graduation, may transfer to an eligible Tennessee postsecondary institution and receive a TELS award.

Articulation and Transfer in Tennessee Higher Education | 2016-2017 Tennessee Higher Education Commission 12
Figure 3. Transfers by Originating Location, In-State vs. Out-of-State, AY 2016-17
Figure 4 shows the state of origin for transfer students based on the location of their sending institution. To provide a holistic picture of out-of-state transfers, this report examines transfers into the public sector and TICUA institutions together. As the figure shows, most out-of-state transfer students come from the Southeast region. In AY 2016-17, ten states accounted for 52.7 percent of all out-of-state transfers. These states included six neighboring states: Mississippi (8.7 percent), Georgia (6.3 percent), Virginia (6.0 percent), Alabama (6.0 percent), Kentucky (5.7 percent), and North Carolina (3.9 percent). This group also included three traditionally large providers of transfer students: Florida (5.3 percent), California (3.7 percent), and Texas (3.7 percent). This year, Illinois also contributed 3.5 percent of out-of-state transfers. Table 2 presents this information by state, semester, and sector.

Articulation and Transfer in Tennessee Higher Education | 2016-2017 Tennessee Higher Education Commission 13
Inte
rnat
iona
l: 30
4 U
nkno
wn:
1,
334
Tota
l Out
-of-
Stat
e:
10,4
20
Figu
re 4
. Out
-of-S
tate
Tra
nsfe
rs in
to T
enne
ssee
Inst
itutio
ns b
y St
ate
of O
rigi
n, A
Y 20
16-1
7

Articulation and Transfer in Tennessee Higher Education | 2016-2017 Tennessee Higher Education Commission 14
Table 2. Transfers by Sending State, Semester, and Receiving Sector, AY 2016-17*
Summer 2016 Fall 2016 Spring 2017
Total
Public sector TICUA Public sector TICUA Public sector TICUA Alabama 63 14 275 84 156 29 621 Alaska 2 1 5 2 2 2 14 Arizona 34 12 124 68 68 28 334 Arkansas 28 3 105 37 78 12 263 California 31 10 173 81 66 21 382 Colorado 7 47 15 29 4 102 Connecticut 3 3 20 14 6 6 52 Delaware
2 1
3 District of Columbia 5 6 22 11 13 7 64 Florida 56 18 232 94 136 21 557 Georgia 68 9 312 78 160 28 655 Hawaii 3 11 3 8 1 26 Idaho 3 10 1 3 1 18 Illinois 29 5 167 76 64 24 365 Indiana 18 10 63 26 34 9 160 Iowa 6 6 44 21 16 8 101 Kansas 8 2 43 19 25 4 101 Kentucky 45 10 294 75 145 28 597 Louisiana 13 2 33 10 14 3 75 Maine
7 2 9 18 Maryland 12 2 63 21 27 5 130 Massachusetts 2 1 15 7 14 9 48 Michigan 17 6 98 53 39 14 227 Minnesota 4 4 13 13 16 1 51 Mississippi 65 13 383 179 206 56 902 Missouri 16 3 82 38 31 9 179 Montana 2 1 8 2 4 17 Nebraska 3 12 9 5 1 30 Nevada 7 2 6 1 16 New Hampshire 12 1 1 1 15 New Jersey 5 2 38 11 20 6 82 New Mexico 2 1 9 7 8 1 28 New York 15 3 89 42 41 12 202 North Carolina 41 7 186 65 86 18 403 North Dakota 2 1 5 3 11 Ohio 25 5 106 45 49 19 249 Oklahoma 3 3 36 17 12 3 74 Oregon 4 13 6 16 2 41 Pennsylvania 11 2 50 21 19 6 109 Rhode Island 1 3 4 4 12 South Carolina 16 3 88 28 34 11 180

Articulation and Transfer in Tennessee Higher Education | 2016-2017 Tennessee Higher Education Commission 15
Table 2. Transfers by Sending State, Semester, and Receiving Sector (continued)
Summer 2016 Fall 2016 Spring 2017
Total
Public sector TICUA Public sector TICUA Public sector TICUA South Dakota 1 3 3 7 Texas 43 11 163 54 93 17 381 Utah 1 2 18 2 8 31 Vermont
3 1
4
Virginia 40 46 229 157 98 60 630 Washington 9 2 40 16 15 6 88 West Virginia 6 1 23 14 8 5 57 Wisconsin 8 3 28 5 9 4 57 Wyoming
7 2 3 1 13 International 31 179 5 89 304
Unknown 234 725 375 1,334 Total 1,038 236 4,723 1,548 2,371 504 10,420
*In this case, cells with five or fewer observations are not suppressed because students are not segregated by characteristic or institution. Therefore, student identities are protected.
Transfer Activity in Public Higher Education
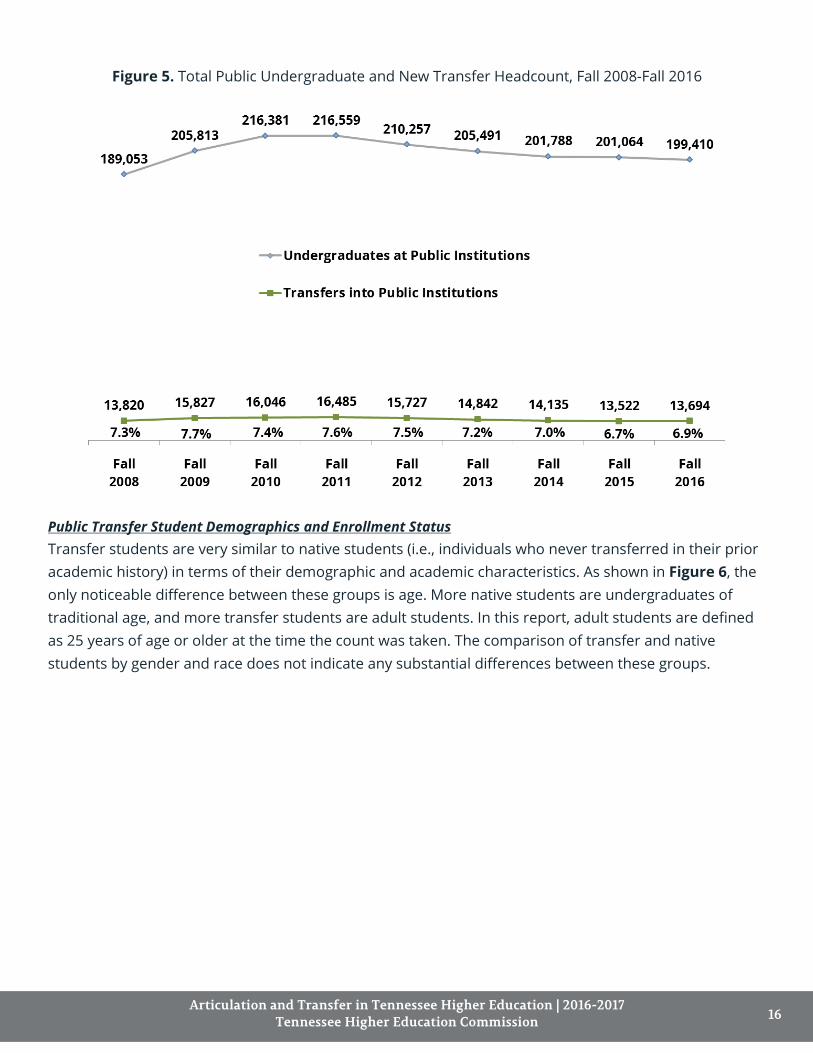
Trends in Public Transfer Enrollment For consistency with past reports, Figure 5 examines public transfer trends in the fall semester. In Fall 2016, new transfer students constituted 6.9 percent of the undergraduate enrollment in Tennessee public higher education. This figure is consistent with transfer enrollment in previous years. While undergraduate enrollment has increased by 5.5 percent since Fall 2008, the Fall 2016 semester experienced a decrease in enrollment of 1,654 students relative to the previous year and 17,149 students compared to Fall 2011 (the largest fall enrollment since 2008). Since 2008, the proportion of transfer enrollment has remained generally stable, decreasing by 0.4 percentage points over eight years. In absolute figures, this change from 2008 translates to a decline of 126 transfer students in the fall semester.
Articulation and Transfer in Tennessee Higher Education | 2016-2017 Tennessee Higher Education Commission 16
Figure 5. Total Public Undergraduate and New Transfer Headcount, Fall 2008-Fall 2016
Public Transfer Student Demographics and Enrollment Status Transfer students are very similar to native students (i.e., individuals who never transferred in their prior academic history) in terms of their demographic and academic characteristics. As shown in Figure 6, the only noticeable difference between these groups is age. More native students are undergraduates of traditional age, and more transfer students are adult students. In this report, adult students are defined as 25 years of age or older at the time the count was taken. The comparison of transfer and native students by gender and race does not indicate any substantial differences between these groups.

Articulation and Transfer in Tennessee Higher Education | 2016-2017 Tennessee Higher Education Commission 17
Figure 6. Demographic Characteristics of Transfer and Native Students, AY 2016-17
Figure 7 compares full-time and part-time enrollment of transfer and non-transfer students by semester. As defined in the Background section, non-transfer students include individuals who did not transfer in the term of interest; however, they include students who transferred in their prior academic history. In each semester, transfer and non-transfer students enrolled full-time and part-time at similar rates, indicating that transfer students were working toward a degree at the same level of intensity as non-transfer students. The largest difference between full-time and part-time enrollment was in Spring 2017 when 67.9 percent of non-transfer students—versus 60.6 percent of transfers—enrolled full-time. This drop in full-time enrollment in spring semester is likely related to the general reasons for transfer, such as inadequate academic performance at the prior institution in fall and family/ work obligations.

Articulation and Transfer in Tennessee Higher Education | 2016-2017 Tennessee Higher Education Commission 18
Figure 7. Transfers and Non-transfers by Enrollment Status and Semester, AY 2016-17
Public Transfer Activity Public higher education institutions in Tennessee receive transfer students from three main sources: other public colleges and universities in the state, private non-profit institutions in Tennessee, and out-of-state institutions. Based on the definition of transfer students in the Background section, this section omits students migrating from TCATs and for-profit institutions. TCAT transfers are examined in Section V of this report.
For the purpose of this analysis, transfers into the public sector have two destinations: community colleges and universities (Figure 8). The comparative analysis shows that the relative size of each source of transfer students for these two sectors is different. Most of the students transferring into community colleges come from other in-state public institutions (50.3 percent) and out-of-state institutions (40.6 percent); the independent sector provides only 9.1 percent of all transfers into community colleges. Relative to community colleges, public universities rely more heavily on other in-state public institutions for their transfer students (58.4 percent of transfers into universities) and slightly less heavily on out-of-state institutions (34.9 percent) and private institutions (6.7 percent).

Articulation and Transfer in Tennessee Higher Education | 2016-2017 Tennessee Higher Education Commission 19
Figure 8. Transfers into Public Institutions, AY 2016-17
Transfer activity within the public sector is multidirectional (Figure 9). In AY 2016-17, 55.3 percent (12,121 students) of all transfers into the public sector took place among public institutions. Most transfer activity is vertical: 50.8 percent of students moved from community colleges into public universities, and 20.1 percent transferred from universities to community colleges. Horizontal transfer activity is less prevalent but is still sizeable: 13.9 percent of students moved among public universities, and 15.2 percent transferred from one community college to another.
Figure 9. Public Transfer Activity, AY 2016-17

Articulation and Transfer in Tennessee Higher Education | 2016-2017 Tennessee Higher Education Commission 20
When restricted to the fall semester, the observed patterns of within-public-sector transfers are consistent with the data from previous reports (Table 3). One may conclude that transfers among Tennessee public institutions have maintained the same relative size and direction for the past several years. Even with a decline in the headcount for students transferring within the public sector over time, the transfer rates among different types of institutions remained relatively stable.
The share of transfers from universities into community colleges has seen a slight decline over time. In Fall 2015, it fell below 19 percent of all fall public transfers for the first time in six years, and it fell even lower in Fall 2016 (16.3 percent). This is likely related to the implementation of Tennessee Promise in Fall 2015. The share of university-to-community college transfers is higher for the entire academic year (20.1 percent), as shown in Figure 9.
Table 3. Fall Transfer Activity within Tennessee Public Sector, Fall 2010-Fall 2016
Fall
2010 Fall
2011 Fall
2012 Fall
2013 Fall
2014 Fall
2015 Fall
2016
Vertical Transfers from community colleges to universities 50.3% 49.9% 48.9% 50.6% 52.1% 55.2% 55.7% from universities to community colleges 22.2% 22.9% 24.2% 22.4% 21.9% 18.6% 16.3%
Horizontal Transfers among community colleges 12.4% 12.7% 12.3% 12.2% 12.2% 11.3% 14.8% among universities 15.1% 14.4% 14.6% 14.9% 13.8% 14.9% 13.2%
Public Transfers Total 9,008 9,388 8,873 8,558 8,071 7,729 7,989
Student Transfer Activity by Public Institution
Transfer Students as a Percent of Undergraduate Enrollment Figure 10 presents incoming transfer students as a percentage of undergraduate enrollment by institution and sector. In AY 2016-17, the total public undergraduate enrollment was 242,495 students.11 Of that total, 21,929 (9 percent) were new transfer students. Of the 114,173 students enrolled at community colleges, 7.4 percent (8,504 students) were new transfers. In the university sector, 10.5 percent of undergraduate students were new transfers (13,425 students).
Except for Tennessee Technological University, all the Locally Governed Institutions (LGIs) were at or above the average share of transfers relative to total undergraduate enrollment at public universities (10.5 percent). In contrast, all three of the University of Tennessee campuses were below the average share of transfer students at public universities. For community colleges, six of the thirteen institutions enrolled transfer students at a proportion higher than the average for the sector (7.4 percent), while seven colleges were below this sector-wide average. Austin Peay State University and East Tennessee State University had the largest proportions of new transfers: 13.4 percent and 12 percent of their
11 Count is duplicated if students enrolled in more than one institution during the academic year.

Articulation and Transfer in Tennessee Higher Education | 2016-2017 Tennessee Higher Education Commission 21
undergraduate enrollment, respectively. Walters State Community College and Jackson State Community College enrolled the smallest percentages of transfer students: 4.6 percent and 4.7 percent, respectively.
Figure 10. Transfers as a Percent of Public Undergraduate Enrollment, AY 2016-17
The share of transfer students measured as a percent of total undergraduate fall enrollment at public institutions is shown in Table 4. Among universities, the trends have been consistent across institutions and systems over time. The LGIs have a greater percentage of new transfers than the UT System, and public universities, on average, enroll a higher share of new transfer students than community colleges. The community college sector has seen a steady decline in the share of transfer students over the last five years, from 6.8 percent to 5.5 percent of undergraduate fall enrollment. Except for Roane State Community College and Volunteer State Community College, each of the thirteen community colleges experienced a decrease in the share of transfer students during this time.

Articulation and Transfer in Tennessee Higher Education | 2016-2017 Tennessee Higher Education Commission 22
Table 4. Transfers as a Percent of Undergraduate Enrollment, Fall 2012-Fall 2016
Institution Fall Fall Fall Fall Fall
2012 2013 2014 2015 2016 Austin Peay State University 9.1% 9.4% 8.9% 9.4% 9.5% East Tennessee State University 9.7% 9.6% 9.1% 8.3% 9.3% Middle Tennessee State University 9.1% 9.0% 8.9% 10.0% 9.5% Tennessee State University 10.0% 9.7% 8.6% 7.6% 7.5% Tennessee Technological University 7.5% 6.7% 7.1% 6.8% 7.8% University of Memphis 8.8% 8.4% 8.5% 8.2% 8.2%
Locally Governed Institutions 9.0% 8.7% 8.6% 8.6% 8.7% University of Tennessee, Chattanooga 8.2% 7.2% 7.7% 8.3% 8.0% University of Tennessee, Knoxville 5.0% 6.0% 5.1% 5.5% 5.5% University of Tennessee, Martin 5.6% 6.1% 6.6% 6.3% 6.6%
UT System 6.0% 6.3% 6.0% 6.4% 6.3% All Public Universities 8.0% 7.9% 7.7% 7.8% 7.9%
Chattanooga State Community College 7.4% 6.8% 7.3% 6.3% 6.3% Cleveland State Community College 5.1% 5.2% 5.1% 4.7% 3.8% Columbia State Community College 9.0% 6.0% 6.9% 6.3% 5.6% Dyersburg State Community College 5.8% 5.1% 5.9% 6.1% 4.9% Jackson State Community College 5.1% 5.5% 4.6% 3.7% 3.7% Motlow State Community College 7.1% 7.1% 6.8% 5.0% 4.5% Nashville State Community College 9.1% 9.1% 8.3% 6.9% 6.4% Northeast State Community College 6.4% 5.7% 4.7% 4.7% 4.2% Pellissippi State Community College 7.2% 6.6% 6.1% 5.9% 6.2% Roane State Community College 4.3% 5.3% 5.4% 4.4% 4.4% Southwest Tennessee Comm. College 8.0% 6.3% 5.9% 5.0% 5.8% Volunteer State Community College 6.5% 6.5% 5.8% 4.8% 8.2% Walters State Community College 3.6% 2.8% 3.5% 2.9% 3.1%
All Community Colleges 6.8% 6.3% 6.1% 5.3% 5.5% Public Higher Education 7.5% 7.2% 7.0% 6.7% 6.9%
Figure 11 presents transfer students as a percent of the fall undergraduate enrollment for TICUA member institutions. For TICUA, enrollment information was available only for Fall 2016. The sector-wide percentage of TICUA transfer students (6.6 percent) was slightly lower than that of transfers at public institutions (6.9 percent, Table 4). In contrast to public institutions, the differences among TICUA institutions were larger. Baptist College of Health Sciences enrolled the largest percentage of transfer students at 19 percent, while Martin Methodist had the lowest proportion at 0.2 percent. Six TICUA institutions had transfer enrollment of more than 10 percent, while nine institutions had transfer enrollment of less than 5 percent.

Articulation and Transfer in Tennessee Higher Education | 2016-2017 Tennessee Higher Education Commission 23
Figure 11. Transfers as a Percent of TICUA Undergraduate Enrollment, Fall 2016
Table 5 presents a summary of transfers as a percent of undergraduate enrollment by sector and semester.
Table 5. Transfers as a Percent of Undergraduate Enrollment by Sector and Semester
Institutional Sector Summer 2016 Fall 2016 Spring 2017 Total* Locally Governed Institutions 4.0% 8.7% 3.8% 11.5% UT Universities 2.2% 6.3% 2.3% 8.2% TBR Community Colleges 4.7% 5.5% 3.5% 7.4% Public Sector Total 3.9% 6.9% 3.4% 9.0% TICUA Institutions** - 6.6% - - All Tennessee Transfers - 6.8% - - *Excluding double counting students within the same institution in different semesters.
**For TICUA institutions, enrollment information is available only for Fall 2016.

Articulation and Transfer in Tennessee Higher Education | 2016-2017 Tennessee Higher Education Commission 24
Top Sending and Receiving Public Institutions Table 6 presents each institution’s share of transfer-in and transfer-out students. Middle Tennessee State University received the largest proportion of transfers (14.2 percent) of all institutions. The other top receiving institutions were the University of Memphis (10 percent), UT Knoxville (8.9 percent), and East Tennessee State University (7.9 percent). Nashville State was the top sending institution (10.4 percent), followed by Pellissippi State (8.5 percent), Southwest Tennessee (7.1 percent), UT Chattanooga (6.7 percent), and Volunteer State (5.7 percent). Appendix C and Appendix D offer a detailed count of transfer activity among all public institutions, showing the sending and receiving partners for each institution.
Table 6. Each Institution’s Share of Total Public Transfer Activity, AY 2016-17
Institution Sent* Received* Austin Peay State University 2.8% 3.7% East Tennessee State University 3.7% 7.9% Middle Tennessee State University 5.2% 14.2% Tennessee State University 2.5% 3.8% Tennessee Technological University 3.3% 6.7% University of Memphis 3.3% 10.0%
Locally Governed Institutions 20.6% 46.3% University of Tennessee, Chattanooga 6.7% 6.3% University of Tennessee, Knoxville 4.5% 8.9% University of Tennessee, Martin 2.1% 3.2%
University of Tennessee System 13.3% 18.4% Chattanooga State Community College 5.0% 3.4% Cleveland State Community College 2.3% 0.8% Columbia State Community College 4.1% 2.3% Dyersburg State Community College 2.1% 1.5% Jackson State Community College 3.3% 1.3% Motlow State Community College 5.0% 2.4% Nashville State Community College 10.4% 3.7% Northeast State Community College 3.9% 1.9% Pellissippi State Community College 8.5% 5.0% Roane State Community College 4.3% 2.2% Southwest Tennessee Community College 7.1% 3.5% Volunteer State Community College 5.7% 6.1% Walters State Community College 4.3% 1.2%
Community Colleges 66.0% 35.3% Public Higher Education 100% 100%
*Percent of the total transfers by category (Sent or Received)

Articulation and Transfer in Tennessee Higher Education | 2016-2017 Tennessee Higher Education Commission 25
Academic Characteristics of Transfer Students
Academic Major at Transfer A few academic program choices were dominant among new transfer students in AY 2016-17. Three broad areas were chosen by over half (54.1 percent) of all transfers into the public sector: (1) Liberal Arts and Sciences; (2) Health Professions and Related Services; and (3) Business Management and Administrative Services. Additionally, 4 percent transferred with an undeclared major, while the remaining 41.9 percent of transfer students selected from 24 other fields of study (Figure 12).
Figure 12. Academic Majors of Transfer Students at Receiving Institutions, AY 2016-17*
N = 21,929

Articulation and Transfer in Tennessee Higher Education | 2016-2017 Tennessee Higher Education Commission 26
Credit Hours and Degrees at Transfer Students transfer in the public sector at various points in their academic careers. During AY 2016-17, 15 percent of public students transferred before they earned more than 12 credit hours and 53.3 percent before they earned over 48 credit hours (Figure 13).
It is nearly twice as common for students with more than 60 credit hours to transfer without a degree (associate or bachelor’s degree) than with a degree: 4,704 transfer students (22.5 percent of students with reported credit hours) had accumulated more than 60 hours without earning a degree. In contrast, only 2,415 students (11.6 percent of students with reported credit hours) transferred with more than 60 hours after obtaining a degree. Only 13.3 percent of all public transfers (2,769 students) arrived at their receiving institution with an associate degree.
Another small group of transfers (496 students) already earned a degree at the baccalaureate level or higher, accounting for 2.4 percent of the AY 2016-17 public transfers. The total number of degree holders (3,265 students) exceeds the number of undergraduates who transfer with more than 60 hours and with a degree (2,415 students). This happens because institutions do not always report all past credit hours and because prior awards include degrees earned over the entire academic career. As a result, 850 students with previously earned degrees are included in various credit categories below 60 credit hours.
Appendix E presents the headcount and percentage of new transfer students by credit hours and degrees brought to receiving institutions. Appendix F displays a headcount and percentage of transfer students by credit hours earned at their sending institutions.
Figure 13. New Transfer Students by Credits and Degrees Transferred In, AY 2016-17

Articulation and Transfer in Tennessee Higher Education | 2016-2017 Tennessee Higher Education Commission 27
Figure 14 presents academic majors selected by students who transferred with more than 60 credit hours but without an associate degree. A comparison of Figures 12 and 14 shows that these students predominantly chose the same broad academic fields as the majority of all transfer students. Liberal Arts and Sciences is the most popular field among all transfer students and among students with many pre-transfer credit hours but no prior degree. Health Professions and Related Services occupies the second position for both groups of transfer students, and Business Management and Administrative Services ranks third for both groups.
Figure 14. Academic Major at Transfer, Students with >60 Credits and No Degree, AY 2016-17*
N = 4,704

Articulation and Transfer in Tennessee Higher Education | 2016-2017 Tennessee Higher Education Commission 28
V. Student Mobility from Tennessee Colleges of AppliedTechnology
This section examines mobility patterns as well as demographic and academic characteristics of students migrating from TCATs. Given the recent emphasis on improving articulation between TCATs and community colleges, student migration among TCATs and Tennessee public colleges and universities warrants special examination.
Students analyzed in this section do not meet the traditional definition of transfer students specified in the Background. Most of them originally enroll at a public institution, subsequently take courses at a TCAT, and then return to their originating institution. Thus, they are not considered first-time students when they return to their originating institution. They are classified as returning students (individuals who were enrolled at the institution in the preceding semester) or readmitted students (individuals returning to that institution after a gap in their attendance). Because of program stipulations and the definition of “contact hours” at TCATs, many former TCAT enrollees do not transfer credits from a TCAT to a public institution, unless they do so as a 30-hour block toward the attainment of an Associate of Applied Science degree.
To differentiate TCAT students from the general transfer population, this report refers to them as TCAT transfers. A TCAT transfer is a student who was enrolled at a Tennessee public institution in AY 2016-17 and had taken classes at a TCAT in the previous semester of enrollment; for fall public enrollees, TCAT enrollment may have taken place either in summer or in spring. This definition includes returning and readmitted students as well as students who had been simultaneously enrolled at a TCAT and some other institution. Finally, this definition does not consider whether any credit hours were transferred from the TCAT to the receiving institution.
Institutional Migration Patterns of TCAT Transfers
Since this section examines only student mobility within the public sector, transfer patterns are limited to one type of sending institution—TCATs—and two possible types of receiving institution—community colleges and public universities.
Table 7 presents the institutional migration patterns of TCAT transfers, by sending TCAT and receiving sector. In AY 2016-17, 1,072 students migrated from TCATs into the state’s public colleges and universities. Community colleges received 851 students from all 27 sending TCATs, while public universities received 221 students from 23 TCATs.
Nine TCATs (Livingston, Jackson, Knoxville, Pulaski, Chattanooga, Nashville, Murfreesboro, Ripley, and Hartsville) each sent over 40 students to the public sector, accounting for 69.1 percent of all TCAT transfers. In contrast, six TCATs (Jacksboro, Covington, McKenzie, Whiteville, Paris, and Crump) sent fewer than 15 students each for a total of 4.3 percent of all TCAT transfers. The average number of transfers

Articulation and Transfer in Tennessee Higher Education | 2016-2017 Tennessee Higher Education Commission 29
per TCAT is 39.7, ranging from 1 to 130 students. Because of data suppression to ensure student privacy, not all numbers are directly retrievable from Table 7.
Table 7. Outmigration of TCAT Transfers by Sending Institution, AY 2016-17
Sending Institution Community Colleges Public Universities TCAT Athens 28 0 TCAT Chattanooga 61 9 TCAT Covington * 0 TCAT Crossville 23 7 TCAT Crump 10 * TCAT Dickson 11 10 TCAT Elizabethton 18 * TCAT Harriman 28 0 TCAT Hartsville 44 * TCAT Hohenwald 20 * TCAT Jacksboro * 0 TCAT Jackson 92 18 TCAT Knoxville 85 17 TCAT Livingston 91 39 TCAT McKenzie * * TCAT McMinnville 12 7 TCAT Memphis 18 * TCAT Morristown 23 * TCAT Murfreesboro 38 20 TCAT Nashville 52 18 TCAT Newbern 13 * TCAT Oneida 28 6 TCAT Paris 7 6 TCAT Pulaski 80 19 TCAT Ripley 40 16 TCAT Shelbyville 17 * TCAT Whiteville 7 * Unsuppressed Total: 1,072 students 851 221 *To comply with FERPA requirements, cells containing 5 observations or fewerare suppressed. Data suppression makes it impossible to directly retrieve datadescribed in the narrative from this table.
Table 8 shows the receiving public institutions that accepted TCAT transfers during AY 2016-17. Tennessee Technological University received 61 TCAT transfer students, the most among public universities. UT Martin followed with 38 TCAT transfers, and Middle Tennessee State University received 37 TCAT transfers. At the other end of the spectrum, East Tennessee State University accepted fewer than 6 TCAT transfers. The average number of TCAT transfers for public universities is 25.
Articulation and Transfer in Tennessee Higher Education | 2016-2017 Tennessee Higher Education Commission 30
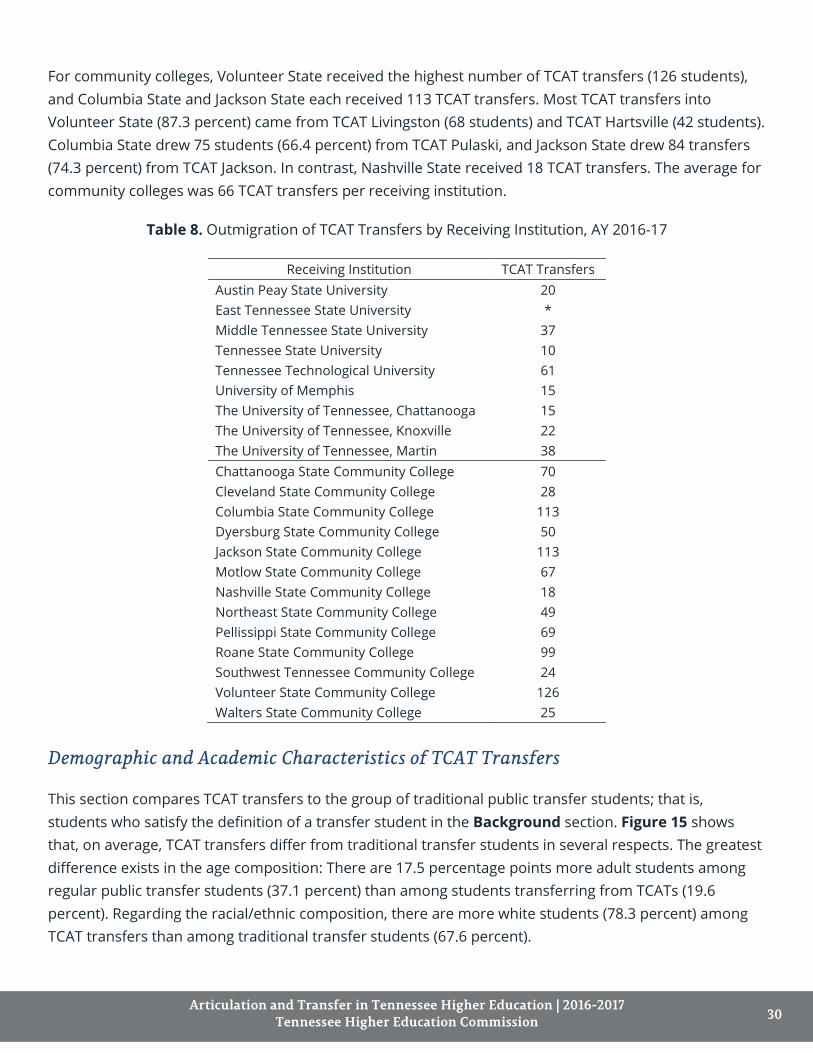
For community colleges, Volunteer State received the highest number of TCAT transfers (126 students), and Columbia State and Jackson State each received 113 TCAT transfers. Most TCAT transfers into Volunteer State (87.3 percent) came from TCAT Livingston (68 students) and TCAT Hartsville (42 students). Columbia State drew 75 students (66.4 percent) from TCAT Pulaski, and Jackson State drew 84 transfers (74.3 percent) from TCAT Jackson. In contrast, Nashville State received 18 TCAT transfers. The average for community colleges was 66 TCAT transfers per receiving institution.
Table 8. Outmigration of TCAT Transfers by Receiving Institution, AY 2016-17
Receiving Institution TCAT Transfers Austin Peay State University 20 East Tennessee State University * Middle Tennessee State University 37 Tennessee State University 10 Tennessee Technological University 61 University of Memphis 15 The University of Tennessee, Chattanooga 15 The University of Tennessee, Knoxville 22 The University of Tennessee, Martin 38 Chattanooga State Community College 70 Cleveland State Community College 28 Columbia State Community College 113 Dyersburg State Community College 50 Jackson State Community College 113 Motlow State Community College 67 Nashville State Community College 18 Northeast State Community College 49 Pellissippi State Community College 69 Roane State Community College 99 Southwest Tennessee Community College 24 Volunteer State Community College 126 Walters State Community College 25
Demographic and Academic Characteristics of TCAT Transfers
This section compares TCAT transfers to the group of traditional public transfer students; that is, students who satisfy the definition of a transfer student in the Background section. Figure 15 shows that, on average, TCAT transfers differ from traditional transfer students in several respects. The greatest difference exists in the age composition: There are 17.5 percentage points more adult students among regular public transfer students (37.1 percent) than among students transferring from TCATs (19.6 percent). Regarding the racial/ethnic composition, there are more white students (78.3 percent) among TCAT transfers than among traditional transfer students (67.6 percent).

Articulation and Transfer in Tennessee Higher Education | 2016-2017 Tennessee Higher Education Commission 31
Figure 15. Demographic Characteristics of TCAT and Traditional Transfers, AY 2016-17
Table 9 clearly shows why TCAT transfers do not fall under the traditional definition of transfer students and, as a rule, are not coded as such by institutions. During AY 2016-17, 309 students (28.8 percent) moving from TCATs into Tennessee public institutions were either returning students (individuals who had been already registered at that institution during the preceding term) or readmitted students (individuals who had previously attended that institution but had a gap in their attendance). 246 TCAT transfers were pre-college students (high school students taking college courses in advance of high school graduation); those were high school students using the dual enrollment grant to attend TCATs. Out of 517 students who enrolled at the institution for the first time, 377 were first-time college students, and only 100 former TCAT students (9.3 percent) were coded as transfer students by receiving institutions.
Table 9. Student Registration Types of TCAT Transfers, AY 2016-17
Registration Type First-Time Student at Institution
Pre-College Student
Readmitted Student
Returning Student
Total
First-Time College Student 377 377
Transfer Student 100
1
101 Transient Student 6
1 7 All Others 34 246 151 156 587
Total 517 246 152 157 1,072 Approximately 40.8 percent of TCAT transfers in AY 2016-17 had some prior college experience.12 The majority of students migrating from TCATs attended a Tennessee public institution before enrolling at a
12 Estimated from the available data but not presented in tables.

Articulation and Transfer in Tennessee Higher Education | 2016-2017 Tennessee Higher Education Commission 32
TCAT. Specifically, 361 such students (33.7%) had been enrolled in a Tennessee community college and 76 students (7.1%) had attended a Tennessee public university prior to enrolling at a TCAT.
Regarding academic majors, TCAT transfers predominantly chose the following fields at their TCATs, as shown in Table 10: Health Professions and Related Services (434 students or 40.5 percent), Trades and Industrial (340 students or 31.7 percent), and Business Management and Administrative Services (127 students or 11.8 percent). At the new institution, 60.5 percent of all TCAT transfers opted for four major academic fields: Liberal Arts and Sciences (319 students), Health Professions and Related Services (219 students), Engineering (74 students), and Business Management and Administrative Services (36 students).13 Out of 1,072 TCAT transfers, 866 students (80.8 percent) changed their broad major field after transferring into a public institution from a TCAT.
Table 10. TCAT Transfers by Major and Post-transfer Major Change, AY 2016-17
TCAT Major TCAT Transfers Changed Major After Transfer
Students Percent of Total Students Percent of Total Health Professions and Related Services 434 40.5% 262 24.4% Trades and Industrial 340 31.7% 333 31.1% Business, Management, and Administrative Services
127 11.8% 120 11.2%
Engineering 61 5.7% 45 4.2% Personal and Miscellaneous Services 47 4.4% 46 4.3% Personal Improvement and Leisure Programs
17 1.6% 17 1.6%
Home Economics 10 0.9% 8 0.7% Computer and Information Sciences 4 0.4% 4 0.4% Visual and Performing Arts 3 0.3% 2 0.2% Agriculture 1 0.1% 1 0.1% Unknown 28 2.6% 28 2.6%
Did not change major
206 19.2%
13 Estimated from the available data but not presented in tables.

Articulation and Transfer in Tennessee Higher Education | 2016-2017 Tennessee Higher Education Commission 33
VI. Transfer History of 2015-16 Bachelor’s Degree Completers
In addition to analyzing student transfer activity in AY 2016-17, this report also examines past transfer history of 2015-16 bachelor’s degree completers at Tennessee public universities. The choice of AY 2015-16 is determined by data availability; the graduation data for Spring 2017 will not be available until after the legislative submission date for this report.
The main statistics of interest include the percent of bachelor’s degree graduates who ever changed institutions (from outside or within the Tennessee public sector) and the percent of bachelor’s degree graduates who ever attended a community college. In AY 2015-16:
• Tennessee public universities awarded 21,714 bachelor’s degrees to 21,505 students.14
• 9,660 bachelor’s graduates (44.9 percent) changed institutions at least once in their prior academic history.
• 7,291 bachelor’s graduates (33.9 percent) previously attended a two-year college (including Tennessee, out-of-state, and private colleges).
• 6,312 baccalaureate graduates (29.4 percent) previously attended a Tennessee community college.
14 The Tennessee Higher Education Fact Book reports the number of degrees awarded and not the number of graduates. For AY 2015-16, the number of bachelor’s degrees awarded to graduates was reported to be 21,714.

Articulation and Transfer in Tennessee Higher Education | 2016-2017 Tennessee Higher Education Commission 34
VII. Conclusion
This examination of student transfer activity in AY 2016-17 has identified several implications for articulation and transfer policy implementation.
1. Although Tennessee’s student population is highly mobile (44.9 percent of bachelor’s degree completers transfer at least once in their academic career), new transfer students’ share of undergraduate enrollment has remained stable over time.
2. A considerable number of “out-of-state” students are actually returning Tennessee residents. Although the exact reasons for their decision to transfer back to their home state remains speculative, Tennessee should continue the current practice of offering lottery scholarship opportunities to its returning students and strive to facilitate the efficient transfer of credits for these students.
3. Interestingly, many students transfer from universities to community colleges. During the entire academic year, this transfer direction accounted for 20.1 percent of all transfers among Tennessee public institutions. This trend could mean that some of these students did not find a proper fit at universities. This finding signifies a number of issues ranging from decreased probability of graduation for such students to less efficient use of state and institutional resources. At the same time, it offers an opportunity for creating policies that better direct students toward institutions in which they can succeed.
4. A consistent finding from past versions of the Articulation and Transfer Report is that many transfer students arrive at their destination institution with a large number of credits; however, the majority of them do so without having earned an associate degree. Prior studies have shown that transfer students take longer to graduate than native students. These findings confirm the uniqueness of transfer students as a group that requires targeted responses at the state and institutional level. Such policies should aim to optimize time and credits to degree, both prior to and after transferring.
Tennessee is making great strides in developing innovative policy solutions to support the Drive to 55 and the Complete College Tennessee Act of 2010. However, a number of potential impediments may dampen the impact of new policies. One of the biggest issues of the transfer policy is low degree efficiency; on average, transfer students take longer to graduate and accumulate more extra credits by graduation than native (non-transfer) students. In this regard, Tennessee should continue its efforts to develop standards for transferring credit hours for programs and degrees that are not included in the current Tennessee Transfer Pathways and for transferring credits from out-of-state institutions. Also, high school students need better guidance on their college plans, which may require special training of high school counselors. Based on students’ personality type, career plans, academic performance, and

Articulation and Transfer in Tennessee Higher Education | 2016-2017 Tennessee Higher Education Commission 35
aptitude, this training should focus on how to enable students to find institutions in which they can thrive academically and socially.
Due to Tennessee Promise implementation in Fall 2015, it is expected that the number and share of students transferring from community colleges to universities will change. Future iterations of the Articulation and Transfer Report will examine this type of transfer behavior related to Tennessee Promise. Additionally, it is expected that the implementation of the FOCUS Act of 2016 will result in changes to the number and share of transfer students at the institutional level, specifically at the LGIs. Future versions of this report will include longitudinal analyses of transfer patterns at public institutions.

Articulation and Transfer in Tennessee Higher Education | 2016-2017 Tennessee Higher Education Commission 36
Appendix A. Transfers by Sector of Origin and as a Percent of Undergraduate Enrollment, Public Institutions, AY 2016-17
Receiving Institution
Transfers by Sector of Origin Transfer Student Count*
Transfers as Percent of
Undergrad. Enrollment
Total Undergad.
Enrollment** Tennessee
Public Tennessee
Independent Out-of-State
Austin Peay State University 454 80 986 1,520 13.4% 11,385
East Tennessee State University 953 81 490 1,524 12.0% 12,746
Middle Tennessee State University 1,717 197 840 2,754 11.8% 23,266
Tennessee State University 458 59 315 832 10.6% 7,877
Tennessee Technological University 809 51 157 1,017 9.7% 10,499
University of Memphis 1,217 160 878 2,255 11.2% 20,081
Locally Governed Institutions 5,608 628 3,666 9,902 11.5% 85,854 University of Tennessee, Chattanooga 767 79 294 1,140 10.1% 11,262
University of Tennessee, Knoxville 1,083 108 527 1,718 7.1% 24,326
University of Tennessee, Martin 383 87 195 665 9.2% 7,213
UT System 2,233 274 1,016 3,523 8.2% 42,801 Public University Total 7,841 902 4,682 13,425 10.4% 128,655
Chattanooga State 418 76 440 934 8.3% 11,286
Cleveland State 97 29 81 207 4.8% 4,275
Columbia State 273 61 269 603 8.0% 7,543
Dyersburg State 186 19 77 282 7.9% 3,553
Jackson State 152 40 114 306 4.7% 6,469
Motlow State 290 48 185 523 7.3% 7,205
Nashville State 453 71 677 1,201 9.2% 13,110
Northeast State 231 36 203 470 6.2% 7,640
Pellissippi State 610 110 408 1,128 7.9% 14,364
Roane State 265 47 133 445 6.1% 7,336
Southwest Tennessee 427 95 393 915 7.3% 12,475
Volunteer State 737 85 331 1,153 10.0% 11,542
Walters State 141 57 139 337 4.6% 7,375
Community College Total 4,280 774 3,450 8,504 7.4% 114,173 Public Higher Education Total 12,121 1,676 8,132 21,929 9.0% 242,828
*Transfer students include individuals meeting the definition on page 8.
**Excluding double counting students within the same institution in different semesters.

Articulation and Transfer in Tennessee Higher Education | 2016-2017 Tennessee Higher Education Commission 37
Appendix B. Transfers by Sector of Origin, TICUA Member Institutions, AY 2016-17
Receiving Institution Transfers by Sector of Origin* Transfer
Student Count**
Tennessee Public
TICUA Non-
TICUA Out-of-state
Unknown
Aquinas College 38 *
30 8 76 Baptist College of Health Sciences 150 14
118 22 304
Belmont University 71 21
286 121 499 Bethel University 365 45 9 202 202 823 Bryan College 52 12 * 50 6 120 Carson-Newman College 27
28 74 129
Christian Brothers University 75 11 * 59 11 156 Cumberland University 168 16
80 6 270
Fisk University *
* 23 14 37 Freed-Hardeman University 52 *
47 24 123
Johnson University 16 * * 55 29 100 King College 385 30 * 311 58 784 Lane College 35 * * 48 24 107 Le Moyne-Owen College 51 14 * 41 7 113 Lee University 131 13 * 273 87 504 Lincoln Memorial University 82 8 * 45 43 178 Lipscomb University 77 20
108 48 253
Martin Methodist College 23 *
11 11 45 Maryville College 47 6
33 6 92
Memphis College of Art 8 17
12 * 37 Milligan College 19 *
15 38 72
Rhodes College
* 6 6 Sewanee: The University of the South *
16 * 16
Southern Adventist University 35 *
165 27 227 Tennessee Wesleyan College 99 10
57 18 184
Trevecca Nazarene University 35 7
34 * 76 Tusculum College 157 9 * 36 10 212 Union University 114 7
79 12 212
Vanderbilt University***
234 234 Watkins College of Art, Design & Film 6 *
16 * 22
Welch College *
* * 0 Suppressed Total* 2,318 260 9 2,278 1,146 6,011
Unsuppressed Total 2,324 276 26 2,288 1,157 6,071 *To comply with FERPA requirements, cells containing 5 observations or fewer are suppressed. Suppressed Total does not include the values of the suppressed cells. **Includes only values of the unsuppressed cells.
***Vanderbilt University does not report sending institution of transfer students.

Articulation and Transfer in Tennessee Higher Education | 2016-2017 Tennessee Higher Education Commission 38
Appendix C. Transfers by Sending Institution and Receiving University, AY 2016-17
Sending Institution Total
Sent** Receiving Institution*
APSU ETSU MTSU TSU TTU UM UTC UTK UTM
Austin Peay State University 146 - * 40 28 16 20 15 12 15
East Tennessee State University 117 8 - 27 * 13 * 23 46 *
Middle Tennessee State University 240 34 12 - 39 25 53 27 39 11
Tennessee State University 165 16 * 72 - 8 41 18 * 10
Tennessee Technological University 136 12 12 57 6 - 9 17 23 *
University of Memphis 121 8 * 31 10 - - 12 25 35
University of Tennessee, Chattanooga 244 16 11 75 6 15 56 - 49 16
University of Tennessee, Knoxville 372 17 50 91 8 36 87 57 - 26
University of Tennessee, Martin 101 13 * 16 14 * 51 7 * -
Chattanooga State 499 8 42 54 11 32 * 333 19 *
Cleveland State 153 * 23 11 - 15 * 77 27 *
Columbia State 396 23 9 231 22 17 * 42 22 30
Dyersburg State 188 10 - 13 - * 69 - 6 90
Jackson State 293 19 * 31 7 * 135 * 9 92
Motlow State 510 15 7 327 13 107 * 28 13 *
Nashville State 731 127 * 265 167 109 12 17 19 15
Northeast State 420 * 379 8 - 12 * * 21 -
Pellissippi State 824 28 78 69 * 80 9 36 518 6
Roane State 354 * 58 22 * 184 * 15 75 *
Southwest Tennessee 776 13 * 51 22 * 658 8 11 13
Volunteer State 558 72 11 209 90 113 * 24 39 *
Walters State 388 6 239 17 * 15 * 6 105 *
Suppressed Total** 7,732 445 931 1,717 443 797 1,200 762 1,078 359 Unsuppressed Total 7,841 454 953 1,717 458 809 1,217 767 1,083 383
*To comply with FERPA requirements, cells containing 5 observations or fewer are suppressed.
**Total Sent and Suppressed Total do not include the values of the suppressed cells.

Articulation and Transfer in Tennessee Higher Education | 2016-2017 Tennessee Higher Education Commission 39
Appendix D. Transfers by Sending Institution and Receiving Community College, AY 2016-17
Sending Institution
Total Sent**
Receiving Institution*
CHSCC CLSCC COSCC DSCC JSCC MSCC NASCC NESCC PSCC RSCC STCC VSCC WSCC
APSU 163 * * 11 6 9 * 98 * * * 12 27 -
ETSU 341 17 * 7 - * * * 195 57 15 * 7 43
MTSU 432 22 * 67 10 7 136 75 * 24 8 25 58 *
TSU 141 6 - * * 6 * 65 * 8 * 39 17 *
TTU 288 20 7 15 * * 17 91 6 21 32 * 79 *
UM 234 * - * 31 14 * 6 - * * 183 * -
UTC 385 176 15 32 - 6 21 45 8 33 7 13 29 *
UTK 479 17 6 25 9 * 10 19 17 293 36 11 14 22
UTM 175 * * 15 56 62 * 17 * * * 18 7 *
CHSCC 120 - 65 * * * 13 8 * 14 13 * 7 *
CLSCC 107 71 - - * - * * * 22 14 - * *
COSCC 85 12 * - * * 14 31 * 6 - * 22 *
DSCC 46 * - * - 25 * * - * - 21 - *
JSCC 73 * - * 50 - * 8 - 6 * 9 * *
MSCC 116 25 * 34 - * - 31 - * * * 26 -
NASCC 188 13 * 40 * * 24 - * 14 * * 97 *
NESCC 14 * - * - - - * - * * * - 14
PSCC 192 12 8 * * * * 8 10 - 131 6 * 17
RSCC 124 7 * * * - * 7 6 97 - * * 7
STCC 57 * * * 39 8 * 10 * * * - * *
VSCC 153 20 * 18 * * 18 80 * 10 7 * - *
WSCC 110 * * * - * * * 30 61 19 - * - Supp.
Total** 4,023 418 101 264 201 137 253 599 272 666 282 337 390 103
Unsupp. Total 4,307 443 131 291 215 156 279 613 289 694 298 356 416 126
*To comply with FERPA requirements, cells containing 5 observations or fewer are suppressed.
**Total Sent and Supp. Total do not include the values of the suppressed cells.

Articulation and Transfer in Tennessee Higher Education | 2016-2017 Tennessee Higher Education Commission 40
Appendix E. Transfers by Credits and Degrees Brought to Receiving Institutions, AY 2016-17
Receiving Institution
Credit Hours at Transfer Total Transfers*
*
Degree at Transfer
<= 12 13-24 25-36 37-48 49-60 > 60 no degree
> 60 with degree
Associate Bachelor's or higher
APSU 90 156 159 178 142 533 115 1,373 127 23
ETSU 72 94 121 106 186 431 389 1,399 432 16
MTSU 134 179 321 286 437 789 473 2,619 509 32
TSU 99 85 91 83 77 241 105 781 130 21
TTU 38 59 97 137 230 179 258 998 344 15
UM 113 190 320 281 333 678 217 2,132 284 52
UTC 43 96 126 138 197 271 239 1,110 296 -
UTK 55 132 301 176 327 356 319 1,666 425 27
UTM 58 74 72 81 105 168 91 649 108 * Unsuppressed
University Total 702 1,065 1,608 1,466 2,034 3,646 2,206 12,727 2,655 189
CHSCC 188 184 138 118 83 149 22 882 8 36
CLSCC 52 40 35 28 15 33 * 203 * *
COSCC 162 128 103 59 41 74 12 579 7 16
DSCC 55 47 46 34 33 37 6 258 10 9
JSCC 119 61 46 28 11 22 11 298 * 16
MSCC 155 83 80 57 40 61 17 493 7 29
NASCC 442 208 159 109 73 136 27 1,154 8 42
NESCC 124 97 75 55 26 66 11 454 * 10
PSCC 363 216 144 109 74 143 39 1,088 26 37
RSCC 124 64 69 47 23 62 23 412 20 25
STCC 299 195 139 94 60 93 15 895 8 36
VSCC 284 237 230 129 82 128 15 1,105 8 38
WSCC 64 52 62 46 35 54 8 321 * 11 Unsuppressed
Community College Total
2,431 1,612 1,326 913 596 1,058 209 8,145 114 307
Unsuppressed Grand Total 3,133 2,677 2,934 2,379 2,630 4,704 2,415 20,872 2,769 496
*To comply with FERPA requirements, cells containing 5 observations or fewer are suppressed.
**Table excludes 1,057 students with missing data on credits.

Articulation and Transfer in Tennessee Higher Education | 2016-2017 Tennessee Higher Education Commission 41
Appendix E. Transfers by Credits and Degrees Brought to Receiving Institutions, AY 2016-17 (continued)
Receiving Institution
Credit Hours at Transfer Total
Transfers*
Degree at Transfer
<= 12 13-24 25-36 37-48 49-60 > 60 no degree
> 60 with degree
Associate Bachelor's or higher
APSU 6.6% 11.4% 11.6% 13.0% 10.3% 38.8% 8.4% 1,373 9.2% 1.7%
ETSU 5.1% 6.7% 8.6% 7.6% 13.3% 30.8% 27.8% 1,399 30.9% 1.1%
MTSU 5.1% 6.8% 12.3% 10.9% 16.7% 30.1% 18.1% 2,619 19.4% 1.2%
TSU 12.7% 10.9% 11.7% 10.6% 9.9% 30.9% 13.4% 781 16.6% 2.7%
TTU 3.8% 5.9% 9.7% 13.7% 23.0% 17.9% 25.9% 998 34.5% 1.5%
UM 5.3% 8.9% 15.0% 13.2% 15.6% 31.8% 10.2% 2,132 13.3% 2.4%
UTC 3.9% 8.6% 11.4% 12.4% 17.7% 24.4% 21.5% 1,110 26.7% 0.0%
UTK 3.3% 7.9% 18.1% 10.6% 19.6% 21.4% 19.1% 1,666 25.5% 1.6%
UTM 8.9% 11.4% 11.1% 12.5% 16.2% 25.9% 14.0% 649 16.6% 0.5% University
Total 5.5% 8.4% 12.6% 11.5% 16.0% 28.6% 17.3% 12,727 20.9% 1.5%
CHSCC 21.3% 20.9% 15.6% 13.4% 9.4% 16.9% 2.5% 882 0.9% 4.1%
CLSCC 25.2% 19.4% 17.0% 13.6% 7.3% 16.0% 1.5% 206 0.5% 1.0%
COSCC 28.0% 22.1% 17.8% 10.2% 7.1% 12.8% 2.1% 579 1.2% 2.8%
DSCC 21.3% 18.2% 17.8% 13.2% 12.8% 14.3% 2.3% 258 3.9% 3.5%
JSCC 39.9% 20.5% 15.4% 9.4% 3.7% 7.4% 3.7% 298 1.0% 5.4%
MSCC 31.4% 16.8% 16.2% 11.6% 8.1% 12.4% 3.4% 493 1.4% 5.9%
NASCC 38.3% 18.0% 13.8% 9.4% 6.3% 11.8% 2.3% 1,154 0.7% 3.6%
NESCC 27.3% 21.4% 16.5% 12.1% 5.7% 14.5% 2.4% 454 0.7% 2.2%
PSCC 33.4% 19.9% 13.2% 10.0% 6.8% 13.1% 3.6% 1,088 2.4% 3.4%
RSCC 30.1% 15.5% 16.7% 11.4% 5.6% 15.0% 5.6% 412 4.9% 6.1%
STCC 33.4% 21.8% 15.5% 10.5% 6.7% 10.4% 1.7% 895 0.9% 4.0%
VSCC 25.7% 21.4% 20.8% 11.7% 7.4% 11.6% 1.4% 1,105 0.7% 3.4%
WSCC 19.9% 16.2% 19.3% 14.3% 10.9% 16.8% 2.5% 321 1.6% 3.4% Community
College Total
29.8% 19.8% 16.3% 11.2% 7.3% 13.0% 2.6% 8,145 1.4% 3.8%
Grand Total 15.0% 12.8% 14.1% 11.4% 12.6% 22.5% 11.6% 20,872 13.3% 2.4%
*Table excludes 1,057 students with missing data on credits.

Articulation and Transfer in Tennessee Higher Education | 2016-2017 Tennessee Higher Education Commission 42
Appendix F. Transfers by Credit Hours Earned at Sending Institutions, AY 2016-17
Sending Institution Credit Hours at Transfer* Total Public
Transfers** <12 12-23 24-35 36-47 48-59 >= 60 Austin Peay State University 42 59 59 43 27 89 319 East Tennessee State University 68 72 83 48 39 119 429 Middle Tennessee State University 72 105 101 71 61 198 608 Tennessee State University 28 50 44 38 32 79 271 Tennessee Technological University 51 46 59 53 48 123 380 University of Memphis 35 65 62 64 56 95 377 University of Tennessee, Chattanooga 75 115 100 55 54 135 534 University of Tennessee, Knoxville 113 106 129 100 73 261 782 University of Tennessee, Martin 27 35 43 20 25 93 243
University Total 511 653 680 492 415 1,192 3,943 Chattanooga State 41 44 46 53 39 378 601 Cleveland State 33 30 34 30 30 116 273 Columbia State 38 42 53 35 61 251 480 Dyersburg State 20 30 37 29 28 106 250 Jackson State 28 40 39 55 45 179 386 Motlow State 27 45 69 49 60 354 604 Nashville State 97 163 241 150 147 415 1,213 Northeast State 34 20 30 29 52 299 464 Pellissippi State 57 72 139 78 102 544 992 Roane State 51 46 42 36 47 289 511 Southwest Tennessee 48 81 111 100 116 381 837 Volunteer State 41 54 74 83 97 326 675 Walters State 47 48 46 33 48 291 513
Community College Total 562 715 961 760 872 3,929 7,799 Closed public institutions 2 4 2 4 4 4 20
Grand Total 1,075 1,372 1,643 1,256 1,291 5,125 11,762 *Cumulative credits at a prior institution could have been earned at any time and are not necessarily transferable toward a degree. **Table excludes 34 students with missing data on credits.

Articulation and Transfer in Tennessee Higher Education | 2016-2017 Tennessee Higher Education Commission 43
Appendix F. Transfers by Credit Hours Earned at Sending Institutions, AY 2016-17 (continued)
Sending Institution Credit Hours at Transfer* Total Public
Transfers** <12 12-23 24-35 36-47 48-59 >= 60 Austin Peay State University 13.2% 18.5% 18.5% 13.5% 8.5% 27.9% 319 East Tennessee State University 15.9% 16.8% 19.3% 11.2% 9.1% 27.7% 429 Middle Tennessee State University 11.8% 17.3% 16.6% 11.7% 10.0% 32.6% 608 Tennessee State University 10.3% 18.5% 16.2% 14.0% 11.8% 29.2% 271 Tennessee Technological University 13.4% 12.1% 15.5% 13.9% 12.6% 32.4% 380 University of Memphis 9.3% 17.2% 16.4% 17.0% 14.9% 25.2% 377 University of Tennessee, Chattanooga 14.0% 21.5% 18.7% 10.3% 10.1% 25.3% 534 University of Tennessee, Knoxville 14.5% 13.6% 16.5% 12.8% 9.3% 33.4% 782 University of Tennessee, Martin 11.1% 14.4% 17.7% 8.2% 10.3% 38.3% 243
University Total 13.0% 16.6% 17.2% 12.5% 10.5% 30.2% 3,943 Chattanooga State 6.8% 7.3% 7.7% 8.8% 6.5% 62.9% 601 Cleveland State 12.1% 11.0% 12.5% 11.0% 11.0% 42.5% 273 Columbia State 7.9% 8.8% 11.0% 7.3% 12.7% 52.3% 480 Dyersburg State 8.0% 12.0% 14.8% 11.6% 11.2% 42.4% 250 Jackson State 7.3% 10.4% 10.1% 14.2% 11.7% 46.4% 386 Motlow State 4.5% 7.5% 11.4% 8.1% 9.9% 58.6% 604 Nashville State 8.0% 13.4% 19.9% 12.4% 12.1% 34.2% 1,213 Northeast State 7.3% 4.3% 6.5% 6.3% 11.2% 64.4% 464 Pellissippi State 5.7% 7.3% 14.0% 7.9% 10.3% 54.8% 992 Roane State 10.0% 9.0% 8.2% 7.0% 9.2% 56.6% 511 Southwest Tennessee 5.7% 9.7% 13.3% 11.9% 13.9% 45.5% 837 Volunteer State 6.1% 8.0% 11.0% 12.3% 14.4% 48.3% 675 Walters State 9.2% 9.4% 9.0% 6.4% 9.4% 56.7% 513
Community College Total 7.2% 9.2% 12.3% 9.7% 11.2% 50.4% 7,799 Closed public institutions 10.0% 20.0% 10.0% 20.0% 20.0% 20.0% 20
Grand Total 9.1% 11.7% 14.0% 10.7% 11.0% 43.6% 11,762 *Cumulative credits at a prior institution could have been earned at any time and are not necessarily transferable toward a degree. **Table excludes 34 students with missing data on credits.