articles and research journals about diabetic diet regimen.docx
TRANSCRIPT
7/27/2019 ARTICLES AND RESEARCH JOURNALS ABOUT DIABETIC DIET REGIMEN.docx
http://slidepdf.com/reader/full/articles-and-research-journals-about-diabetic-diet-regimendocx 1/9
ARTICLES AND RESEARCH JOURNALS ABOUT DIABETes
The Regression-Discontinuity Design
The regression-discontinuity design. What a terrible name! In everyday language both parts of the term have connotations that are primarily negative. To most people
"regression" implies a reversion backwards or a return to some earlier, more primitive state while "discontinuity" suggests an unnatural jump or shift in what might otherwise be a
smoother, more continuous process. To a research methodologist, however, the term regression-discontinuity (hereafter labeled "RD") carries no such negative meaning.
Instead, the RD design is seen as a useful method for determining whether a program or treatment is effective.
The label "RD design" actually refers to a set of design variations. In its simplest most traditional form, the RD design is a pretest-posttest program-comparison group strategy.
The unique characteristic which sets RD designs apart from other pre-post group designs is the method by which research participants are assigned to conditions. In RD
designs, participants are assigned to program or comparison groups solely on the basis of a cutoff score on a pre-program measure. Thus the RD design is distinguished
from randomized experiments (or randomized clinical trials) and from other quasi-experimental strategies by its unique method of assignment. This cutoff criterion implies the
major advantage of RD designs -- they are appropriate when we wish to target a program or treatment to those who most need or deserve it. Thus, unlike its randomized or
quasi-experimental alternatives, the RD design does not require us to assign potentially needy individuals to a no-program comparison group in order to evaluate the
effectiveness of a program.
The RD design has not been used frequently in social research. The most common implementation has been in compensatory education evaluation where school children who
obtain scores which fall below some predetermined cutoff value on an achievement test are assigned to remedial training designed to improve their performance. The low
frequency of use may be attributable to several factors. Certainly, the design is a relative latecomer. Its first major field tests did not occur until the mid-1970s when it was
incorporated into the nationwide evaluation system for compensatory education programs funded under Title I of the Elementary and Secondary Education Act (ESEA) of 1965.
In many situations, the design has not been used because one or more key criteria were absent. For instance, RD designs force administrators to assign participants to
conditions solely on the basis of quantitative indicators thereby often impalatably restricting the degree to which judgment, discretion or favoritism may be used. Perhaps the
most telling reason for the lack of wider adoption of the RD design is that at first glance the design doesn't seem to make sense. In most research, we wish to have comparison
groups that are equivalent to program groups on pre-program indicators so that post-program differences may be attributed to the program itself. But because of the cutoff
criterion in RD designs, program and comparison groups are deliberately and maximally different on pre-program characteristics, an apparently insensible anomaly. An
understanding of how the design actually works depends on at least a conceptual familiarity with regression analysis thereby making the strategy a difficult one to convey to
nonstatistical audiences.
Despite its lack of use, the RD design has great potential for evaluation and program research. From a methodological point of view, inferences which are drawn from a well-
implemented RD design are comparable in internal validity to conclusions from randomized experiments. Thus, the RD design is a strong competitor to randomized designs
when causal hypotheses are being investigated. From an ethical perspective, RD designs are compatible with the goal of getting the program to those most i n need. It is not
necessary to deny the program from potentially deserving recipients simply for the sake of a scientific test. From an administrative viewpoint, the RD design is often directly

7/27/2019 ARTICLES AND RESEARCH JOURNALS ABOUT DIABETIC DIET REGIMEN.docx
http://slidepdf.com/reader/full/articles-and-research-journals-about-diabetic-diet-regimendocx 2/9
usable with existing measurement efforts such as the regularly collected statistical information typical of most management information systems. The advantages of the RD
design warrant greater educational efforts on the part of the methodological community to encourage its use where appropriate.
The Basic Design
The "basic" RD design is a pretest-posttest two group design. The term "pretest- posttest" implies that the same measure (or perhaps alternate forms of the same measure) is
administered before and after some program or treatment. (In fact, the RD design does not require that the pre and post measures are the same.) The term "pretest" implies that
the same measure is given twice while the term "pre-program" measure implies more broadly that before and after measures may be the same or different. It is assumed that a
cutoff value on the pretest or pre-program measure is being used to assign persons or other units to the program. Two group versions of the RD design might imply either that
some treatment or program is being contrasted with a no-program condition or that two alternative programs are being compared. The description of the basic design as a two
group design implies that a single pretest cutoff score is used to assign participants to either the program or comparison group. The term "participants" refers to whatever unit is
assigned. In many cases, participants are individuals, but they could be any definable units such as hospital wards, hospitals, counties, and so on. The term "program" will be
used throughout to refer to any program, treatment or manipulation whose effects we wish to examine. In notational form, the basic RD design might be depicted as shown in
the figure where:
C indicates that groups are assigned by means of a cutoff score,
an O stands for the administration of a measure to a group,
an X depicts the implementation of a program,
and each group is described on a single line (i.e., program group on top, control group on the bottom).
To make this initial presentation more concrete, we can imagine a hypothetical study where the interest is i n examining the effect of a new treatment protocol for inpatients with
a particular diagnosis. For simplicity, we can assume that we wish to t ry the new protocol on patients who are considered most ill and that for each patient we have a continuous
quantitative indicator of health that is a composite rating which can take values from 1 to 100 where high scores indicate greater health. Furthermore, we can assume that a
pretest cutoff score of 50 was (more or less arbitrarily) chosen as the assignment criterion or that all those scoring lower than 50 on the pretest are to be given the new
treatment protocol while those with scores greater than or equal to 50 are given the standard treatment.
7/27/2019 ARTICLES AND RESEARCH JOURNALS ABOUT DIABETIC DIET REGIMEN.docx
http://slidepdf.com/reader/full/articles-and-research-journals-about-diabetic-diet-regimendocx 3/9
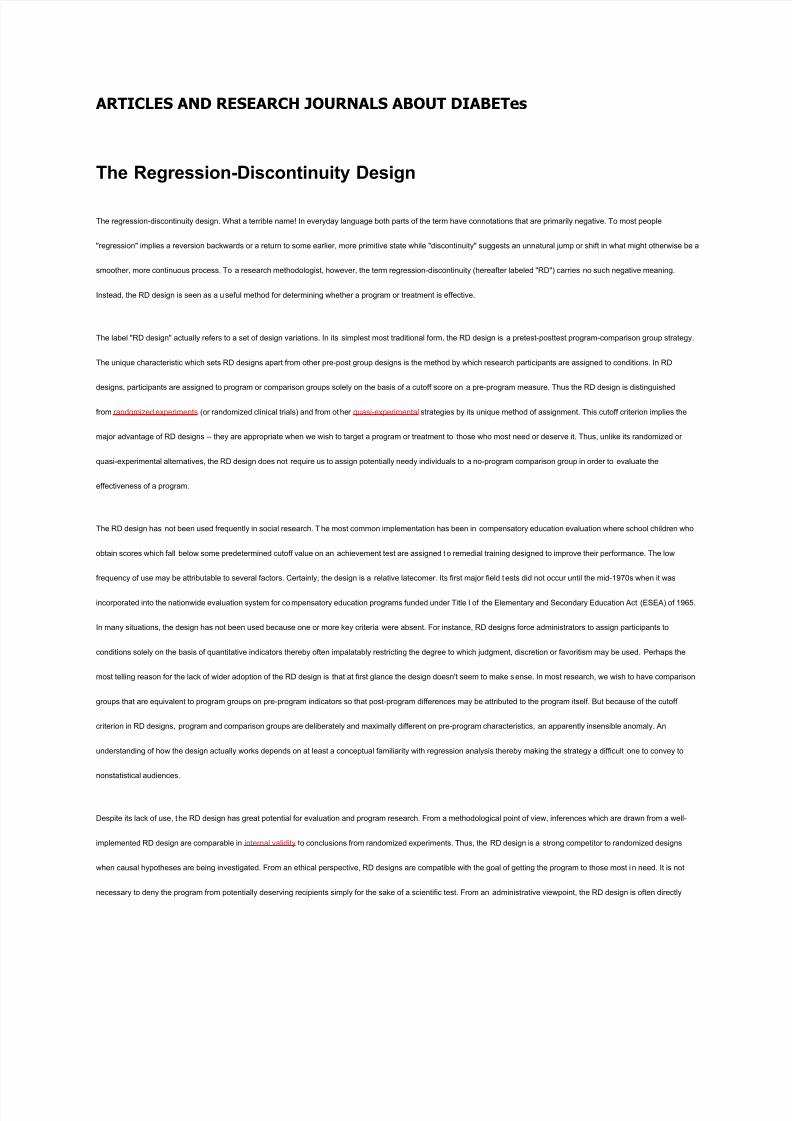
It is useful to begin by considering
what the data might look like if we
did not administer the treatment
protocol but instead only measured
all participants at two points in
time. Figure 1 shows the
hypothetical bivariate distribution
for this situation. Each dot on the
figure indicates a single person's
pretest and posttest scores. The
blue Xs to the left of the cutoff
show the program cases. They are
more severely ill on both the
pretest and posttest. The green
circles show the comparison group that is comparatively healthy on both measures. The vertical line at the pretest score of 50 indicates the cutoff point (although for Figure 1 we
are assuming that no treatment has been given). The solid line through the bivariate distribution is the linear regression line. The distribution depicts a strong positive
relationship between the pretest and posttest -- in general, the more healthy a person is at the pretest, the more healthy they'll be on the posttest, and, the more severely ill a
person is at the pretest, the more ill they'll be on the posttest.
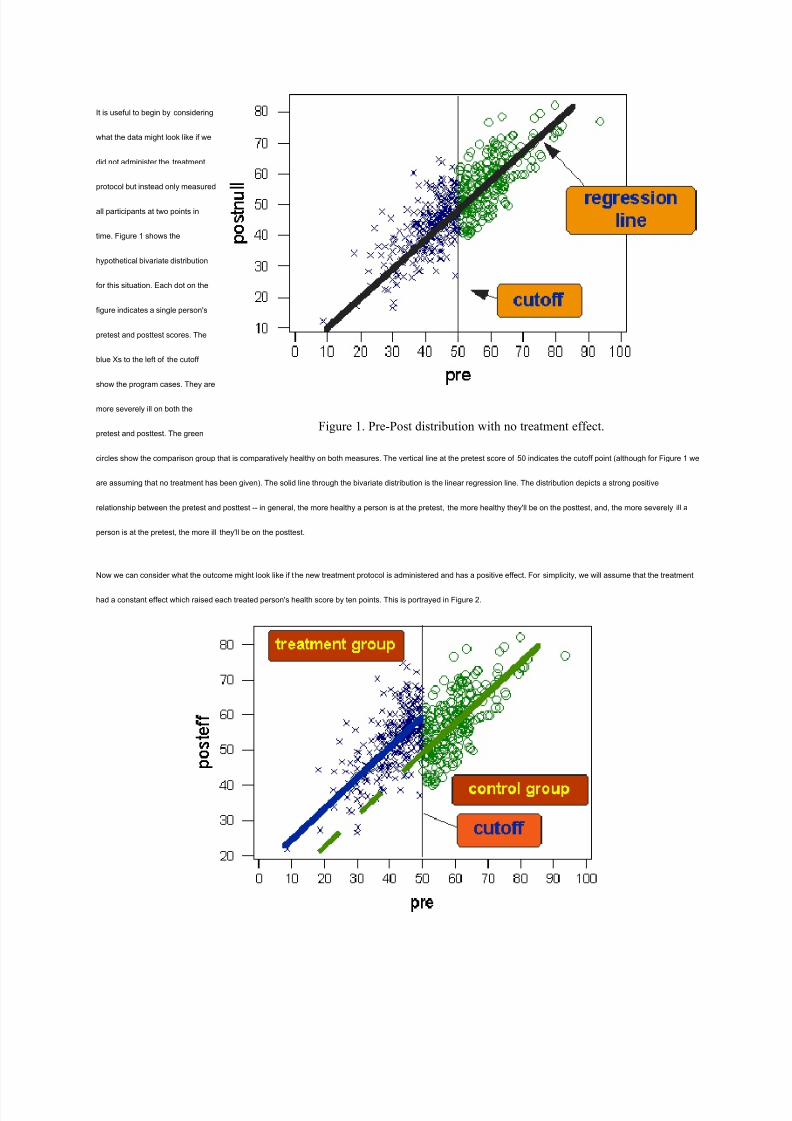
Now we can consider what the outcome might look like if t he new treatment protocol is administered and has a positive effect. For simplicity, we will assume that the treatment
had a constant effect which raised each treated person's health score by ten points. This is portrayed in Figure 2.
Figure 1. Pre-Post distribution with no treatment effect.

7/27/2019 ARTICLES AND RESEARCH JOURNALS ABOUT DIABETIC DIET REGIMEN.docx
http://slidepdf.com/reader/full/articles-and-research-journals-about-diabetic-diet-regimendocx 4/9
Figure 2. Regression-Discontinuity Design with Ten-point Treatment Effect.
Figure 2 is identical to Figure 1 except that all points to the left of the cutoff (i.e., the treatment group) have been raised by 10 points on the posttest. The dashed line in Figure 2
shows what we would expect the treated group's regression line to look like if the program had no effect (as was the case in Figure 1).
It is sometimes difficult to see the forest for the trees in these types of bivariate plots. So, let's remove the individual data points and look only at the regression lines. The plot of
regression lines for the treatment effect case of Figure 2 is shown in Figure 3.
Figure 3. Regression lines for the data shown in Figure 2.
On the basis of Figure 3, we can now see how the RD design got its name - - a program effect is suggested when we observe a " jump" or discontinuity in the regression lines
at the cutoff point. This is illustrated in Figure 4.
7/27/2019 ARTICLES AND RESEARCH JOURNALS ABOUT DIABETIC DIET REGIMEN.docx
http://slidepdf.com/reader/full/articles-and-research-journals-about-diabetic-diet-regimendocx 5/9
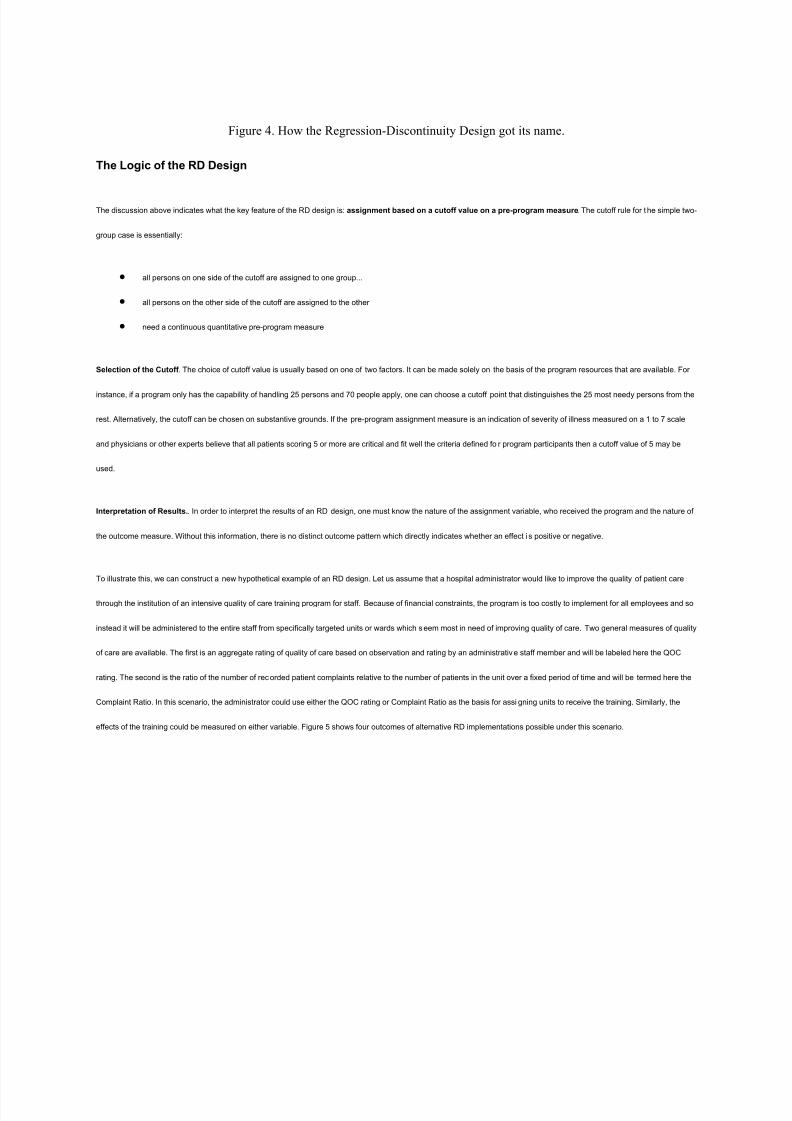
Figure 4. How the Regression-Discontinuity Design got its name.
The Logic of the RD Design
The discussion above indicates what the key feature of the RD design is: assignment based on a cutoff value on a pre-program measure. The cutoff rule for the simple two-
group case is essentially:
all persons on one side of the cutoff are assigned to one group...
all persons on the other side of the cutoff are assigned to the other
need a continuous quantitative pre-program measure
Selection of the Cutoff . The choice of cutoff value is usually based on one of two factors. It can be made solely on the basis of the program resources that are available. For
instance, if a program only has the capability of handling 25 persons and 70 people apply, one can choose a cutoff point that distinguishes the 25 most needy persons from the
rest. Alternatively, the cutoff can be chosen on substantive grounds. If the pre-program assignment measure is an indication of severity of illness measured on a 1 to 7 scale
and physicians or other experts believe that all patients scoring 5 or more are critical and fit well the criteria defined fo r program participants then a cutoff value of 5 may be
used.
Interpretation of Results.. In order to interpret the results of an RD design, one must know the nature of the assignment variable, who received the program and the nature of
the outcome measure. Without this information, there is no distinct outcome pattern which directly indicates whether an effect i s positive or negative.
To illustrate this, we can construct a new hypothetical example of an RD design. Let us assume that a hospital administrator would like to improve the quality of patient care
through the institution of an intensive quality of care training program for staff. Because of financial constraints, the program is too costly to implement for all employees and so
instead it will be administered to the entire staff from specifically targeted units or wards which seem most in need of improving quality of care. Two general measures of quality
of care are available. The first is an aggregate rating of quality of care based on observation and rating by an administrative staff member and will be labeled here the QOC
rating. The second is the ratio of the number of recorded patient complaints relative to the number of patients in the unit over a fixed period of time and will be termed here the
Complaint Ratio. In this scenario, the administrator could use either the QOC rating or Complaint Ratio as the basis for assi gning units to receive the training. Similarly, the
effects of the training could be measured on either variable. Figure 5 shows four outcomes of alternative RD implementations possible under this scenario.

7/27/2019 ARTICLES AND RESEARCH JOURNALS ABOUT DIABETIC DIET REGIMEN.docx
http://slidepdf.com/reader/full/articles-and-research-journals-about-diabetic-diet-regimendocx 6/9
Only the regression lines are shown in the figure. It is worth noting that even though all four outcomes have the same pattern of regression lines, they do not imply the s ame
result. In Figures 5a and 5b, hospital units were assigned to training because they scored below some cutoff score on the QOC rating. In Figures 5c and 5d units were given
training because they scored above the cutoff score value on the Complaint Ratio measure. In each figure, the dashed line indicates the regression line we would expect to find
for the training group if the training had no effect. This dashed line represents the no-discontinuity projection of the comparison group regression line into the region of the
program group pretest scores.
We can clearly see that even though the outcome regression lines are the same in all four groups, we would interpret the four graphs differently. Figure 5a depicts a positive
effect because training raised the program group regression line on the QOC rating over what would have been expected. Figure 5b however shows a negative effect because
7/27/2019 ARTICLES AND RESEARCH JOURNALS ABOUT DIABETIC DIET REGIMEN.docx
http://slidepdf.com/reader/full/articles-and-research-journals-about-diabetic-diet-regimendocx 7/9
the program raised training group scores on the Complaint Ratio indicating increased complaint rates. In Figure 5c we see a positive effect because the regression line has
been lowered on the Complaint Ratio relative to what we would have expected. Finally, Figure 5d shows a negative effect where the training resulted in lower QOC ratings than
we would expect otherwise. The point here is a simple one. A discontinuity in regression lines indicates a program effect in the RD design. But the discontinuity alone is not
sufficient to tell us whether the effect i s positive or negative. In order to make this determination, we need to know who received the program and how to interpret the direction of
scale values on the outcome measures.
The Role of the Comparison Group in RD Designs. With this introductory discussion of the design in mind, we can now see what constitutes the benchmark for comparison
in the RD design. In experimental or other quasi- experimental designs we either assume or try to provide evidence that the program and comparison groups are equivalent
prior to the program so that post-program differences can be attributed to the manipulation. The RD design involves no such assumption. Instead, with RD designs we assume
that in the absence of the program the pre-post relationship would be equivalent for the two groups. Thus, the strength of the RD design is dependent on two major factors. The
first is the assumption that there is no spurious discontinuity in the pre-post relationship which happens to coincide with the cutoff point. The second factor concerns the degree
to which we can know and correctly model the pre-post relationship and constitutes the major problem in the statistical analysis of the RD design which will be discussed below.
The Internal Validity of the RD Design. Internal validity refers to whether one can i nfer that the treatment or program being investigated caused a change in outcome
indicators. Internal validity as conceived is not concerned with our ability to generalize but rather focuses on whether a causal relationship can be demonstrated for the
immediate research context. Research designs which address causal questions are often compared on their relative ability to yield internally valid results.
In most causal hypothesis tests, the central inferential question is whether any observed outcome differences between groups are attributable to the program or instead to some
other factor. In order to argue for the internal validity of an inference, the analyst must attempt to demonstrate that the program -- and not some plausible alternative explanation
-- is responsible for the effect. In the li terature on internal validity, these plausible alternative explanations or factors are often termed "threats" to internal validity. A number of
typical threats to internal validity have been identified. For instance, in a one-group pre-post study a gain from pretest to posttest may be attributable to the program or to other
plausible factors such as historical events occurring between pretest and posttest, or natural maturation over time.
Many threats can be ruled out with the inclusion of a control group. Assuming that the control group is equivalent to the program group prior to the study, the control group pre-
post gain will provide evidence for the change which should be attributed to all factors other than the program. A different rate of gain in the program group provides evidence for
the relative effect of the program itself. Thus, we consider randomized experimental designs to be strong in internal validity because of our confidence in the probabilistic pre-
program equivalence between groups which results from random assignment and helps assure that the control group will provide a legitimate reflection of all non-program
factors that might affect outcomes.
In designs that do not use random assignment, the central internal validity concern revolves around the possibility that groups may not be equivalent prior to the program. We
use the term "selection bias" to refer to the case where pre-program differences between groups are responsible for post-program differences. Any non-program factor which is
differentially present across groups can constitute a selection bias or a selection threat to internal validity.
In RD designs, because of the deliberate pre-program differences between groups, there are severalselection threats to internal validity which might, at first glance, appear to be
a problem. For instance, a selection-maturation threat implies that different rates of maturation between groups might explain outcome differences. For the sake of argument,
7/27/2019 ARTICLES AND RESEARCH JOURNALS ABOUT DIABETIC DIET REGIMEN.docx
http://slidepdf.com/reader/full/articles-and-research-journals-about-diabetic-diet-regimendocx 8/9
let's consider a pre-post distribution with a linear relationship having a slope equal to two units. This implies that on the average a person with a given pretest score will have a
posttest score two times as high. Clearly there is maturation in this situation, that is, people are getting consistently higher scores over time. If a person has a pretest score of 10
units, we would predict a posttest score of 20 for an absolute gain of 10. But, if a person has a pretest score of 50 we would predict a posttest score of 100 for an absolute gain
of 50. Thus the second person naturally gains or matures more in absolute units (although the rate of gain relative to the pr etest score is constant). Along these lines, in the RD
design we expect that all participants may mature and that in absolute terms this maturation may be different for the two groups on average. Nevertheless, a program effect in
the RD design is not indicated by a difference between the posttest averages of the groups, but rather by a change in the pre-post relationship at the cutoff point. In this
example, although we expect different absolute levels of maturation, a single continuous regression line with a slope equal t o 2 would describe these different maturational
rates. More to the point, in order for selection-maturation to be a threat to internal validity in RD designs, it must induce a discontinuity in the pre -post relationship which happens
to coincide with the cutoff point -- an unlikely scenario in most studies.
Another selection threat to internal validity which might intuitively seem likely concerns the possibility of differential regression to the mean or a selection-regression threat. The
phenomenon of regression to the mean arises when we asymmetrically sample groups from a distribution. On any subsequent measure the obtained sample group mean will be
closer to the population mean for that measure (in standardized units) than the sample mean from the original distribution is to its population mean. In RD designs we
deliberately create asymmetric samples and consequently expect regression towards the mean in both groups. In general we expect the low-scoring pretest group to evidence a
relative gain on the posttest and the high-scoring pretest group to show a relative loss. As with selection-maturation, even though we expect to see differential regression to the
mean this poses no problem for the internal validity of the RD design. We don't expect that regression to the mean will result in a discontinuity in the bivariate relationship
coincidental with the cutoff point. In fact, the regression to the mean that will occur is expected to be continuous across t he range of the pretest scores and is described by the
regression line itself. (We should recall that the term "regression" was originally used by Galton to refer to the fact that a regression line describes regression to the mean.)
Although the RD design may initially seem susceptible to selection biases, it is not. The above discussion demonstrates that only factors that would naturally induce a
discontinuity in the pre-post relationship could be considered threats to the internal validity of inferences from the RD design. In principle then the RD design is as strong in
internal validity as its randomized experimental alternatives. In practice, however, the validity of the RD design depends directly on how well the analyst can model the true pre-
post relationship, certainly a nontrivial statistical problem as is discussed in the statistical analysis of the regression-discontinuity design.
The RD Design and Accountability. It makes sense intuitively that the accountability of a program is largely dependent on the explicitness of the assignment or allocation of
the program to recipients. Lawmakers and administrators need to recognize that programs are more evaluable and accountable when the allocation of the program is more
public and verifiable. The three major pre-post designs -- the Pre-Post Randomized Experiments, the RD Design, and the Nonequivalent Groups Design -- are analogous to the
three types of program allocation schemes which legislators or administrators might choose. Randomized experiments are analogous to the use of a lottery for allocating the
program. RD designs can be considered explicit, accountable methods for assigning program recipients on the basis of need or merit. Nonequivalent group designs might be
considered a type of political allocation because they enable the use of unverifiable, subjective or politically-motivated assignment. Most social programs are politically allocated.
Even when programs are allocated primarily on the basis of need or merit, the regulatory agency usually reserves some discretionary capability in deciding who receives the
program. Without debating the need for such discretion, it is clear that the methodological community should encourage administrators and legislators who wish their programs
to be accountable to make explicit their criteria for program eligibility by either using probabilistically based lotteries or by relying on quantitative eligibility ratings and cutoff
7/27/2019 ARTICLES AND RESEARCH JOURNALS ABOUT DIABETIC DIET REGIMEN.docx
http://slidepdf.com/reader/full/articles-and-research-journals-about-diabetic-diet-regimendocx 9/9
values as in the RD design. To the extent that legislators and administrators can be convinced to move toward more explicit assignment criteria, both the potential utility of the
RD design and the accountability of the programs will be increased.
Ethics and the RD Design
The discussion above argues that the RD Design is strong in internal validity, certainly stronger than the Nonequivalent Groups Design, and perhaps as strong as the
Randomized Experiments. But we know that the RD Designs are not as statistically powerful as the Randomized Experiments. That is, in order to achieve the same level of
statistical accuracy, an RD Design needs as much as 2.75 times the participants as a randomized experiment. For instance, if a Randomized Experiment needs 100 participants
to achieve a certain level of power, the RD design might need as many as 275.
So why would we ever use the RD Design instead of a randomized one? The real allure of the RD Design is that it allows us to assign the treatment or program to those who
most need or deserve it. Thus, the real attractiveness of the design is ethical -- we don't have to deny the program or treatment to participants who might need it as we do in
randomized studies.