article widening access to uk medical education for...
TRANSCRIPT
Article
Widening access to UK medical education for underrepresented socioeconomic groups : modelling the impact of the UKCAT in the 2009 cohort
Tiffin, P. A., Dowell, J. S. and Mclachlan, John Charles
Available at http://clok.uclan.ac.uk/14823/
Tiffin, P. A., Dowell, J. S. and Mclachlan, John Charles (2012) Widening access to UK medical education for underrepresented socioeconomic groups : modelling the impact of the UKCAT in the 2009 cohort. British Medical Journal (BMJ) (344). e1805. ISSN 09598138
It is advisable to refer to the publisher’s version if you intend to cite from the work.http://dx.doi.org/10.1136/bmj.e1805
For more information about UCLan’s research in this area go to http://www.uclan.ac.uk/researchgroups/ and search for <name of research Group>.
For information about Research generally at UCLan please go to http://www.uclan.ac.uk/research/
All outputs in CLoK are protected by Intellectual Property Rights law, includingCopyright law. Copyright, IPR and Moral Rights for the works on this site are retained by the individual authors and/or other copyright owners. Terms and conditions for use of this material are defined in the http://clok.uclan.ac.uk/policies/
CLoKCentral Lancashire online Knowledgewww.clok.uclan.ac.uk

Widening access to UK medical education forunder-represented socioeconomic groups: modellingthe impact of the UKCAT in the 2009 cohort
OPEN ACCESS
Paul A Tiffin clinical senior lecturer 1, Jonathan S Dowell reader in general practice 2, John CMcLachlan professor of medical education 3
1School for Medicine and Health, Wolfson Research Institute, Durham University Queen’s Campus, Stockton-on-Tees TS17 6BH, UK; 2DundeeUniversity School of Medicine, Dundee, UK; 3The Holliday Building, Durham University Queen’s Campus, UK
AbstractObjective To determine whether the use of the UK clinical aptitude test(UKCAT) in the medical schools admissions process reduces the relativedisadvantage encountered by certain sociodemographic groups.
Design Prospective cohort study.
Setting Applicants to 22 UKmedical schools in 2009 that were membersof the consortium of institutions utilising the UKCAT as a component oftheir admissions process.
Participants 8459 applicants (24 844 applications) to UKCAT consortiummember medical schools where data were available on advancedqualifications and socioeconomic background.
Main outcome measures The probability of an application resulting inan offer of a place on a medicine course according to seven educationaland sociodemographic variables depending on how the UKCAT wasused by the medical school (in borderline cases, as a factor inadmissions, or as a threshold).
Results On univariate analysis all educational and sociodemographicvariables were significantly associated with the relative odds of anapplication being successful. The multilevel multiple logistic regressionmodels, however, varied between medical schools according to the waythat the UKCAT was used. For example, a candidate from anon-professional background was much less likely to receive aconditional offer of a place compared with an applicant from a highersocial class when applying to an institution using the test only inborderline cases (odds ratio 0.51, 95% confidence interval 0.45 to 0.60).No such effect was observed for such candidates applying to medicalschools using the threshold approach (1.27, 0.84 to 1.91). Thesedifferences were generally reflected in the interactions observed whenthe analysis was repeated, pooling the data. Notably, candidates fromseveral under-represented groups applying to medical schools that useda threshold approach to the UKCAT were less disadvantaged than thoseapplying to the other institutions in the consortium. These effects werepartially reflected in significant differences in the absolute proportion of
such candidates finally taking up places in the different types of medicalschools; stronger use of the test score (as a factor or threshold) wasassociated with a significantly increased odds of entrants being male(1.74, 1.25 to 2.41) and from a low socioeconomic background (3.57,1.03 to 12.39). There was a non-significant trend towards entrants beingfrom a state (non-grammar) school (1.60, 0.97 to 2.62) where a strongeruse of the test was employed. Use of the test only in borderline caseswas associated with increased odds of entrants having relatively lowacademic attainment (5.19, 2.02 to 13.33) and English as a secondlanguage (2.15, 1.03 to 4.48).
Conclusions The use of the UKCAT may lead to more equitableprovision of offers to those applying to medical school fromunder-represented sociodemographic groups. This may translate intohigher numbers of some, but not all, relatively disadvantaged studentsentering the UK medical profession.
IntroductionSince the Further and Higher Education Act was introduced in1992 efforts have beenmade to improve social mobility throughaccess to higher education. Nevertheless, access to theprofessions remains largely restricted to those from relativelyadvantaged backgrounds. In particular the situation in medicineremains largely unchanged since the 1970s, with only around5% of entrants having parents from a non-professionalbackground.1 2 This is in part a problem of application rates.3None the less, the success rate is lower for equivalent candidatesfrom different class backgrounds.4 This disparity may be at leastpartly due to the use of A levels (or equivalent advancedqualifications) as a primary selection tool for ability within theUnited Kingdom, as A levels are known to advantage applicantsfrom privileged backgrounds.5 A high degree of subjectivityhas been shown in the reasons given by selectors for short listingcandidates before interview.6 Personal statements may also berelied on, which tend to favour pupils from independent schools,7
Correspondence to: P A Tiffin [email protected]
No commercial reuse: See rights and reprints http://www.bmj.com/permissions Subscribe: http://www.bmj.com/subscribe
BMJ 2012;344:e1805 doi: 10.1136/bmj.e1805 (Published 17 April 2012) Page 1 of 27
Research
RESEARCH

and have been viewed as a poor way of selecting candidates formedical school. In addition, face-to-face interviews may addlittle information to the admissions process, having been shownto be only weakly predictive of subsequent academicperformance.8
Selection bias is problematic for several reasons. Firstly, ifcandidates of equal ability are disadvantaged by theirsocioeconomic or school background then this is unjust andunacceptable within society as a whole. Secondly, at least someevidence shows that doctors from particular social backgroundscan perform a particular service in dealing with the health needsin their original communities.9 Thirdly, diversity in studentpopulations can promote positive awareness of the value ofdiversity in society.10
Attempts have been made to deal with this situation throughseveral initiatives. These include the expansion of access coursesfor those without the requisite examination qualifications in thesciences and graduate entry courses. Access courses haveresulted in an increased proportion of medical students frombackgrounds that differ from those of students traditionallyentering medicine, but the overall impact has been small.Moreover, although graduate entrants are from a morerepresentative range of socioeconomic backgrounds11 theseprogrammes have similarly not led to the significant changesin the socioeconomic profile of UK medical students.12 It istherefore clear that new, wider approaches are required andmust prove their effectiveness. This desire to widen participationin medicine was partly the driver behind the development ofthe UK clinical aptitude test (UKCAT), introduced in 2006. Thetest, developed in detail and delivered by a computer basedtesting and assessment business,13 was intended to evaluateabilities (on an experimental basis) that were consideredpertinent to the success of a medical career.14 The UKCATscores are only modestly correlated with attainment at A levelexaminations and are significantly associated with severalsociodemographic variables, although the scores may be lesssensitive to the school type attended than to academicachievement.15 16 Nevertheless, the constructs measured by thetest may be sufficiently different from those estimated bytraditional educational attainment to tackle some of the relativedisadvantages encountered by certain sociodemographic groups,such as those from state schools rather than independent schools.The use of the UKCAT as a component of the medical selectionprocess has attracted considerable criticism, including that ofthe BMA students committee. Opponents of the test highlightthat A level achievement is predictive of medical performanceat undergraduate and postgraduate level, whereas the evidencefor the predictive validity of the UKCAT is currently lacking.17Moreover, it has been suggested that the fee of £65 (€78; $102)to £100 for taking the UKCAT may actually discourage thosefrom less economically advantage backgrounds from applyingto medical school.18 Consequently it is important to carry outresearch to establish whether including the UKCAT as acomponent of the selection process adds value beyond thatprovided by traditional measures of academic attainment.In the 2009 round of applications for admission to medicalschool in 2010, 25 of the 31 UK based medical schools utilisedthe UKCAT results as part of their admissions process. Wehypothesised that candidates from certain sociodemographicgroups applying to medical schools that utilised the UKCATscores relatively heavily as part of their admissions processeswould experience less disadvantage compared with thoseapplying to institutions with a relatively weak use of the test.More specifically, we proposed that those using performanceon the UKCAT as a “threshold” score would show the greatest
impact on reducing the relative disadvantage for certainunder-represented groups of candidates. We also anticipatedthat those institutions using the test as a factor in the admissionsprocess would have a more noticeable effect compared withthose using the test only in borderline cases.By using data from the 2009 application cohort we planned todevelop and populate models estimating the probability of anapplication being successful, given several availablesociodemographic and educational variables and the manner inwhich UKCATwas used by the medical schools. Moreover, weintended to utilise information relating to final placement toevaluate to what extent, if any, trends in the provision of offerswas reflected in the sociodemographic characteristics of thoseeventually taking up places at the three categories of medicalschool. Consequently we aimed to estimate the potential finalimpact on the demographic make-up of UK doctors of anydifferences between groups in the medical schools’ behavioursrelating to making offers.
MethodsData were available for candidates who applied during 2009 toone or more of the 25 UK based medical schools that weremembers of the consortium of institutions utilising the UKCATas a component of their admissions process. We excludedapplications specifically relating to graduate entry or “wideningparticipation” courses as they were considered a potential sourceof confounding. Thus we excluded data from three of theconsortium medical schools as these institutions exclusivelyoffered these medical courses, leaving 22 participatinginstitutions. At the outset we also excluded a small number ofcandidates with incomplete or missing UKCAT scores (n=227).In some cases this missingness may have been due to theunavailability of UKCAT centres in certain countries. Atregistration for the UKCAT, students were informed that theinformation would be used for educational research andevaluation of the UKCAT and that the results would bepublished in a form such that individual students could not beidentified. Thus the data were routinely contemporaneouslycollected and anonymised. We grouped the participatinguniversities into three categories (box) according to theirpredominant use of the test, as reported to the UKCATconsortium board during the annual telephone survey of medicalschools.19
We designed this modelling process to test whether these classesof medical schools could be ranked meaningfully in relation tosociodemographic factors. Occasionally an institution used thetest as both a factor and a threshold in selection. In these caseswe chose the strongest mode of use to categorise the medicalschool.
Data preparationAll data used in the analyses were abstracted in anonymousform from the combined Universities and Colleges AdmissionsService (UCAS) and UKCAT database. Figure 1⇓ depicts thedata included in the final modelling process. The structure ofoffer data is complex in that information relates to bothindividual candidates and specific applications to eachinstitution. The dependent variable was the outcome (offer orrejection) of an “application event” involving one candidate andone specific medical school. To each of these application eventswe attributed a unique identifier. We included both conditional(dependent on attainment of A level or equivalent examinations)and unconditional offers (academic requirements for entryfulfilled) as a positive outcome and analysed these separately,
No commercial reuse: See rights and reprints http://www.bmj.com/permissions Subscribe: http://www.bmj.com/subscribe
BMJ 2012;344:e1805 doi: 10.1136/bmj.e1805 (Published 17 April 2012) Page 2 of 27
RESEARCH
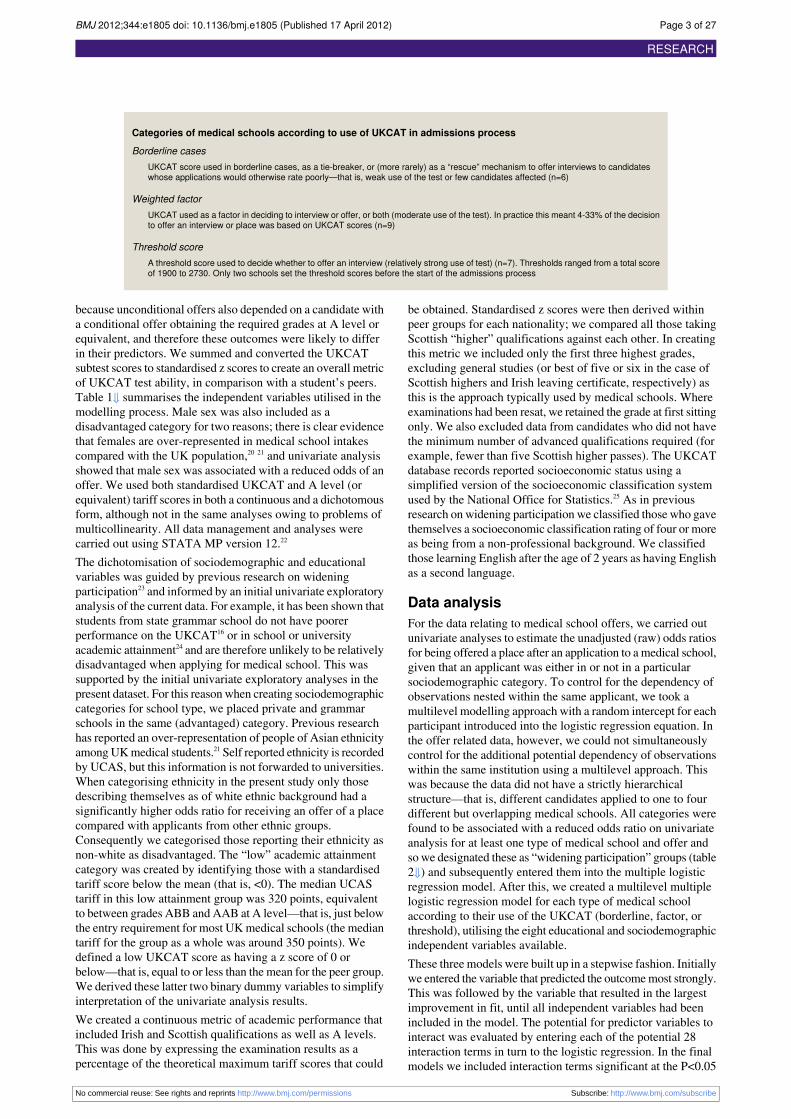
Categories of medical schools according to use of UKCAT in admissions process
Borderline casesUKCAT score used in borderline cases, as a tie-breaker, or (more rarely) as a “rescue” mechanism to offer interviews to candidateswhose applications would otherwise rate poorly—that is, weak use of the test or few candidates affected (n=6)
Weighted factorUKCAT used as a factor in deciding to interview or offer, or both (moderate use of the test). In practice this meant 4-33% of the decisionto offer an interview or place was based on UKCAT scores (n=9)
Threshold scoreA threshold score used to decide whether to offer an interview (relatively strong use of test) (n=7). Thresholds ranged from a total scoreof 1900 to 2730. Only two schools set the threshold scores before the start of the admissions process
because unconditional offers also depended on a candidate witha conditional offer obtaining the required grades at A level orequivalent, and therefore these outcomes were likely to differin their predictors. We summed and converted the UKCATsubtest scores to standardised z scores to create an overall metricof UKCAT test ability, in comparison with a student’s peers.Table 1⇓ summarises the independent variables utilised in themodelling process. Male sex was also included as adisadvantaged category for two reasons; there is clear evidencethat females are over-represented in medical school intakescompared with the UK population,20 21 and univariate analysisshowed that male sex was associated with a reduced odds of anoffer. We used both standardised UKCAT and A level (orequivalent) tariff scores in both a continuous and a dichotomousform, although not in the same analyses owing to problems ofmulticollinearity. All data management and analyses werecarried out using STATA MP version 12.22
The dichotomisation of sociodemographic and educationalvariables was guided by previous research on wideningparticipation23 and informed by an initial univariate exploratoryanalysis of the current data. For example, it has been shown thatstudents from state grammar school do not have poorerperformance on the UKCAT16 or in school or universityacademic attainment24 and are therefore unlikely to be relativelydisadvantaged when applying for medical school. This wassupported by the initial univariate exploratory analyses in thepresent dataset. For this reason when creating sociodemographiccategories for school type, we placed private and grammarschools in the same (advantaged) category. Previous researchhas reported an over-representation of people of Asian ethnicityamongUKmedical students.21 Self reported ethnicity is recordedby UCAS, but this information is not forwarded to universities.When categorising ethnicity in the present study only thosedescribing themselves as of white ethnic background had asignificantly higher odds ratio for receiving an offer of a placecompared with applicants from other ethnic groups.Consequently we categorised those reporting their ethnicity asnon-white as disadvantaged. The “low” academic attainmentcategory was created by identifying those with a standardisedtariff score below the mean (that is, <0). The median UCAStariff in this low attainment group was 320 points, equivalentto between grades ABB and AAB at A level—that is, just belowthe entry requirement for most UKmedical schools (the mediantariff for the group as a whole was around 350 points). Wedefined a low UKCAT score as having a z score of 0 orbelow—that is, equal to or less than the mean for the peer group.We derived these latter two binary dummy variables to simplifyinterpretation of the univariate analysis results.We created a continuous metric of academic performance thatincluded Irish and Scottish qualifications as well as A levels.This was done by expressing the examination results as apercentage of the theoretical maximum tariff scores that could
be obtained. Standardised z scores were then derived withinpeer groups for each nationality; we compared all those takingScottish “higher” qualifications against each other. In creatingthis metric we included only the first three highest grades,excluding general studies (or best of five or six in the case ofScottish highers and Irish leaving certificate, respectively) asthis is the approach typically used by medical schools. Whereexaminations had been resat, we retained the grade at first sittingonly. We also excluded data from candidates who did not havethe minimum number of advanced qualifications required (forexample, fewer than five Scottish higher passes). The UKCATdatabase records reported socioeconomic status using asimplified version of the socioeconomic classification systemused by the National Office for Statistics.25 As in previousresearch on widening participation we classified those who gavethemselves a socioeconomic classification rating of four or moreas being from a non-professional background. We classifiedthose learning English after the age of 2 years as having Englishas a second language.
Data analysisFor the data relating to medical school offers, we carried outunivariate analyses to estimate the unadjusted (raw) odds ratiosfor being offered a place after an application to a medical school,given that an applicant was either in or not in a particularsociodemographic category. To control for the dependency ofobservations nested within the same applicant, we took amultilevel modelling approach with a random intercept for eachparticipant introduced into the logistic regression equation. Inthe offer related data, however, we could not simultaneouslycontrol for the additional potential dependency of observationswithin the same institution using a multilevel approach. Thiswas because the data did not have a strictly hierarchicalstructure—that is, different candidates applied to one to fourdifferent but overlapping medical schools. All categories werefound to be associated with a reduced odds ratio on univariateanalysis for at least one type of medical school and offer andso we designated these as “widening participation” groups (table2⇓) and subsequently entered them into the multiple logisticregression model. After this, we created a multilevel multiplelogistic regression model for each type of medical schoolaccording to their use of the UKCAT (borderline, factor, orthreshold), utilising the eight educational and sociodemographicindependent variables available.These three models were built up in a stepwise fashion. Initiallywe entered the variable that predicted the outcomemost strongly.This was followed by the variable that resulted in the largestimprovement in fit, until all independent variables had beenincluded in the model. The potential for predictor variables tointeract was evaluated by entering each of the potential 28interaction terms in turn to the logistic regression. In the finalmodels we included interaction terms significant at the P<0.05
No commercial reuse: See rights and reprints http://www.bmj.com/permissions Subscribe: http://www.bmj.com/subscribe
BMJ 2012;344:e1805 doi: 10.1136/bmj.e1805 (Published 17 April 2012) Page 3 of 27
RESEARCH

level. Improvements in fit were estimated according to the χ2value relating to a Wald test. In the case of the initial choice ofvariable, the comparison was with the null model. Model nestingwas ensured by including only observations with no missingdata in this stage of analysis. To directly compare the threecategories of medical school, we pooled the data relating to allthe applications without missing values and developed amultilevel multiple logistic model.We entered this time categoryof UKCAT use as a factor variable with three levels (borderline,factor, and threshold). The association between probability ofoffer and group of medical school applied to was evaluated byassessing for interactions between this factor variable and thesociodemographic predictors. We explored all combinations ofinteractions with factor variables by changing the group ofmedical schools used as the baseline category.To evaluate the extent to which trends in offer related behaviourwere likely to influence the long term make up of the medicalwork force, we analysed data relating to the final uptake ofplaces at each medical school according to wideningparticipation status. These data had a less complex structure inthat there was only one entrant per institution. We carried outa univariate logistic regression to estimate the odds of an entrantto each category of medical school being from a wideningparticipation background. Amultilevel multiple regression wasalso done to control for the effects of potential confoundingvariables. To control and explore the impact of individualinstitutional effects (in contrast to membership of a UKCATusage group), we introduced a random intercept term for eachof the 22 medical schools.Most initial offers made to applicants are conditional. The twomain supervening factors between a conditional offer beingmade and the candidate entering a course are whether theapplicant accepts the offer and whether (in the case of aconditional offer) the appropriate grades are obtained at A levelor equivalent. Therefore we used multilevel multiple logisticregression analysis to estimate what the predictors of fulfillingthe academic requirements were for those applicants holdingconditional offers (the outcome being a conditional offerconverted to an unconditional offer). A random intercept wasintroduced to control for the dependency for observations withinindividual candidates and we tested for all combinations ofinteractions between independent variables. The additionalpotential dependency of observations within medical schoolscould not be controlled for in this model.We evaluated the relations between missing data status andother variables using logistic regression. Additionally, toestimate the extent to which missing data were missing atrandom (that is, missing values related to observed variables),we carried out a series of sensitivity analyses using multipleimputation procedures.26 The process involved generating twosets of 10 datasets, where values were imputed for the missingsocioeconomic status and advanced qualification values. Theimputed values were conditioned on the observed variables. Wethen repeated the analyses of the offer data using the imputeddata to evaluate the extent to which the missing values mayhave influenced the results. Full details of this procedure areavailable from the lead author’s website (www.dur.ac.uk/p.a.tiffin/fps).
ResultsDescriptive statistics: applicationsOverall, the percentages of each category of candidate (wherethe specific sociodemographic variable was available) were:44.8% male sex, 39.8% self reported ethnicity as non-white,
21.1% English as a second language, 22.8% aged over 20 yearsat the time of application, 64.5% attended a non-fee paying ornon-grammar school, 5.4% reported being from anon-professional social background, and 40.5% reportedacademic attainment below the level of AAB at A level (orequivalent). Table 1 shows the proportion of each category ofcandidate applying to the different categories of medical schoolalong with the standard deviation of the percentages acrossindividual institutions within each group. There was a numberof modest, albeit statistically significant, differences betweenthe proportions of widening participation candidates applyingto each category of medical school (table 1). Themost noticeabledifference was between medical schools that used the UKCATscore in borderline cases and those that used it as a factor inadmissions, with candidates who achieved relatively low gradesat A level or equivalent being more likely to apply to theinstitutions that used UKCAT as a factor. In general, thevariation between proportions of applications to institutions inthe same category of UKCAT usage wasmodest, at around 10%or less, with the exception of ethnicity, which showed morevariation within groups.The overall proportion of missing data for eachsociodemographic variable did not significantly vary betweengroups (table 1), with the exception of the data on advancedqualifications. Such data were missing for 26% of applicantsto medical schools using UKCAT in borderline cases, 29%usingUKCAT as a factor, and 28% usingUKCAT as a threshold(P<0.001 in all cases).At the time of application, candidates were aware at least ofbasic admissions policies in relation to the UKCAT and alsoknew their own test scores. We therefore anticipated thatapplications to universities with more robust use of the UKCATwould, on average, be made by candidates with higher testscores. Table 2 shows the average performances of candidatesapplying to each of the three groups of medical schools andadvanced level qualifications. Again, there weremodest absolutebut statistically significant differences between the performancesof candidates associated with applications to the three types ofinstitution. In general, candidates applying to medical schoolsthat used UKCAT as a threshold tended to achieve higherUKCAT scores compared with candidates applying to the othertwo groups of medical schools. Candidates applying to medicalschools using UKCAT as a factor tended to go on to obtainhigher grades at advanced qualifications, and this was the casewhether only the “best of three” A level (or equivalent) gradeswere counted or whether a total UCAS tariff score wascalculated from grades of all examinations taken (with theexception of resits and general studies).
Univariate analysis: applicationsFor the statistical modelling we utilised observations withcomplete data only on all variables (fig 1). Tables 3⇓ and 4⇓depict, respectively, the results of multilevel logistic univariateregressions for the probability of conditional and unconditionaloffers. Even after controlling for candidate level effects, theunadjusted odds of receiving a conditional offer variedsignificantly between all three groups of medical schools formost widening participation categories; age and sex being theonly exceptions (table 3). The intraclass correlation in this caserepresents the residual of the latent response variable of eachindividual candidate; each candidate is conceptualised as havinga certain level of a latent trait (an unobserved normallydistributed variable). The level of this trait would be manifestin the likelihood of the candidate receiving an offer, thus thistrait could be conceptualised as “offerability.” In a multiple
No commercial reuse: See rights and reprints http://www.bmj.com/permissions Subscribe: http://www.bmj.com/subscribe
BMJ 2012;344:e1805 doi: 10.1136/bmj.e1805 (Published 17 April 2012) Page 4 of 27
RESEARCH

logistic regression, the intraclass correlation is the correlationwithin each individual candidate, once fixed effects arecontrolled for, such as academic attainment. Thus intraclasscorrelations of 0.3 to 0.5 (table 3) would be consistent withmoderate individual level effects for candidates (as opposed tothe effect of group membership of the medical schools appliedto). As the odds ratios are raw, such individual level effectswould include UKCAT and predicted or actual A level (orequivalent) performance. On average the intraclass correlationswere highest for medical schools using UKCAT as a thresholdand lowest for those using UKCAT in borderline cases, withall between group differences being significant at the P<0.05level according to aWilcoxon test (table 3). This would suggestthat individual candidate effects and performance are morepredictive of the provision of a conditional offer in thoseinstitutions with a stronger use of the UKCAT. A similar patternwas observed for the raw odds of obtaining an unconditionaloffer, with the association between applicant age and sex weakerthan for the other variables. No significant association wasobserved with applicant age once only unconditional offers wereconsidered. The intraclass correlations were then smaller inmagnitude, reflecting weaker candidate level effects. Theintraclass correlations for medical schools using UKCAT as afactor were, on average, significantly larger than for the othermedical school groups (P<0.001), reflecting the increasedpredictive power of individual compared with group orunmodelled effects. A plausible reason for this may be a greateremphasis, for example, on A level performance when providingan offer, as some medical schools may insist on the originalconditions of an offer being met, whereas other may allow acertain latitude, especially if the number of applicants acceptingoffers falls short of expectation.
Multilevel multiple logistic regression:applicationsTables 5⇓ and 6⇓ show, respectively, the results for the separatemultilevel multiple logistic regressions for the probability ofconditional and unconditional offers. The results in table 5 depictthree varying models for the prediction of a conditional offer.For those applications relating tomedical schools using UKCATas borderline, six independent and statistically significantpredictor variables existed, including sex, socioeconomic status,ethnicity, type of school attended, and academic attainment,with academic achievement being most strongly predictive ofan offer. The UKCAT score was a relatively weak independentpredictor in applications relating to this group of medical schoolsin that the odds of receiving a conditional offer were onlyincreased by roughly 20% for every standard deviation ofstandardised score above the mean that was scored (odds ratio1.23, 95% confidence interval 1.11 to 1.37). The model forapplications to medical schools that used UKCAT in borderlinecases had three statistically significant interaction terms; ageand academic attainment, sex and school type attended, andUKCAT score and English as a second language. The first ofthese indicates that for candidates agedmore than 20 at the timeof application, A level (or equivalent) attainment conferredrelatively less advantage when a conditional offer was madecompared with younger applicants. This is highly plausiblegiven that many older applicants will be applying on the basisof a university degree rather than on A level attainment. Theinteraction term between male sex and school type attendedimplies that the relative disadvantage of having attended a stateschool was reduced for men compared with women. Lastly, theinteraction between UKCAT score and English as a secondlanguage suggests that an increased UKCAT score conferred a
greater advantage for those for whom English was a secondlanguage compared with native English speakers. Medicalschools using the UKCAT score as a factor in the admissionsprocess had five significant and independent predictors of theprobability of a conditional offer. In contrast with the medicalschools using UKCAT score in borderline cases, the strongestof these was standardised UKCAT score, with an increase in 1SD above the mean more than doubling the odds of an offer,all other factors being equal (odds ratio 2.31, 95% confidenceinterval 2.07 to 2.58). As in the model with medical schoolsthat used the UKCAT score in borderline cases, interactionswere significant between academic attainment and age andUKCAT score and English as a second language. In additionthe interaction term for academic attainment and UKCAT scorewas significant, indicating some degree of synergy between Alevel (or equivalent) grades and UKCAT score when predictingthe probability of a conditional offer. For medical schools withUKCAT used as a threshold score in the admissions processthe only significant independent predictors were UKCAT score(odds ratio 8.59, 95% confidence interval 6.96 to 10.62) and,to a lesser extent, academic attainment (1.63, 1.46 to 1.82). Aswith the other two categories of university the interactionbetween UKCAT score and English as second language wassignificant. Two other interaction terms were also significant.Firstly, the interaction between sex and UKCAT score,suggesting that for males an increase in UKCAT score conferredless of an advantage than for females when seeking a conditionalplace offer. This is interesting given that, on average, menoutperform women on the UKCAT.16 Secondly, the interactionbetween socioeconomic status and English as a second languagewas significant and suggested that those from a lowersocioeconomic background who were not native Englishspeakers were relatively disadvantaged compared withcandidates who did not belong to this subgroup.The results in table 6 depict the three models for the predictionof an unconditional offer, according to category of medicalschool. The results were broadly similar to those in table 5,according to the probability of conditional place offers. Medicalschool that used UKCAT scores in borderline cases and as afactor had six independent and statistically significant principalpredictor variables: sex, socioeconomic status, ethnicity, typeof school attended, UKCAT score, and academic attainment.For medical schools using UKCAT as a threshold, the onlysociodemographic variables that were independent andsignificant predictors of an offer were UKCAT score andacademic attainment. In addition there was a trend of borderlinestatistical significance for older candidates to more likely receivean unconditional offer than those under 20 at application (oddsratio 1.53, 95% confidence interval 0.99 to 2.38, P=0.06). Thisobservation is unsurprising as many older candidates havealready obtained the required qualifications for entry (althoughspecific graduate entry courses were excluded from the analysis).Each model also included between two and four statisticallysignificant interaction terms. In addition to the interaction termsthat were significant in the results outlined in table 5 the modelfor medical schools using UKCAT as a factor relating to theprobability of an unconditional model also showed a significantinteraction between ethnicity and English as a second language(2.10, 1.09 to 4.05, P=0.03). This implied that those whoreported their ethnicity as non-white and were not native Englishspeakers were relatively less disadvantaged compared withwhite non-native English speakers when obtaining anunconditional offer. This interaction term seemed to be theconsequence of a small number of white non-native English
No commercial reuse: See rights and reprints http://www.bmj.com/permissions Subscribe: http://www.bmj.com/subscribe
BMJ 2012;344:e1805 doi: 10.1136/bmj.e1805 (Published 17 April 2012) Page 5 of 27
RESEARCH

speaking candidates, relatively few of whom obtainedunconditional offers.Tables 7⇓ and 8⇓ present the results of the combined multilevelmultiple logistic regression. The models contained interactionterms concerning medical school group (entered as a factorvariable), where the baseline category was varied. Therefore itwas necessary to depict the results for the logistic regressionmodels where medical schools using UKCAT as a threshold(table 7) and using it as a factor (table 8) had been used as thebase categories separately. Consequently the odds ratios and Pvalues for all statistically significant combinations of interactionterms are presented as pairwise comparisons (for example,borderline group versus threshold group by age interaction)rather than overall interaction effects. This seemed moreappropriate given that UKCAT usage was a factor variable withmore than two levels but not ordinal (ordered categorical) innature—that is, failing to fulfil the “proportional odds”assumption. The odds of an applicant receiving a conditionaloffer did not significantly vary between the different categoriesof universities once the effects of other predictors and interactionterms were controlled for (tables 7 and 8). However, this wasnot true for unconditional offers, where it was less likely that acandidate applying to a medical school that used UKCAT as athreshold received an unconditional offer compared with theother two categories of medical school, implying that, onaverage, relatively fewer applicants to the medical schools usingUKCAT as a threshold were satisfying the academic conditionsset as part of their conditional offers. The interaction termsinvolving the group of medical school applied to largelymirrored the findings from the separate models (tables 5 and6); the interaction terms highlighted intergroup differences inrelation to UKCAT score, academic attainment, ethnicity, age,school type attended, and socioeconomic status. Interactionterms involving group and English as second language werenot statistically significant at the P<0.05 level for eitherconditional or unconditional offers. Likewise, significantinteractions between sex and type of university applied to werenot observed, although an interaction between an applicationto a medical school that used UKCAT scores in borderline cases(versus those using threshold scores) and sex was of marginalstatistical significance (odds ratio 0.83, 95% confidence interval0.68 to 1.01, P=0.06). This indicated a trend towards maleapplicants being slightly less likely to receive an offer from amedical school that used the UKCAT in borderline cases asopposed to in a threshold manner. Not all the intergroupdifferences were present or in the direction originallyhypothesised (tales 7 and 8). For example, interaction termssuggested that an applicant from a state school (in this caseexcluding grammar schools) was less likely to receive aconditional offer from amedical school that usedUKCAT scoresin borderline cases compared with one using threshold scores(0.74, 0.60 to 0.90, P=0.004) but were more likely to receivesuch an offer than from a medical school that used UKCAT asa factor (1.47, 1.21 to 1.80, P<0.001). Nevertheless this findingwas consistent with the results from the separate models for theprediction of conditional offer provision (table 5) in that medicalschools using UKCAT as a factor in the admissions processshowed a relatively high degree of disadvantage for state schoolstudents (0.52, 0.45 to 0.60, P<0.001) even after controlling forthe effects of other, potentially confounding, variables andinteractions. Medical schools that used UKCAT as a thresholdwere also less likely to provide a conditional offer to an olderapplicant compared with the other two categories of medicalschool.
Descriptive statistics and univariate analysis:medical school entrantsIn total, data related to 4456 medical school entrants to the 22universities analysed. Table 9⇓ and figure 2⇓ depict thebreakdown of the proportion of each medical school intake bywidening participation status. Some categories of institutionsappeared fairly homogenous in relation to the proportion ofcandidates of widening participation status taking up places,whereas others were relatively diverse. For example, medicalschools using UKCAT as a threshold consistently admittedmorethan around 55% of their medical students from state schools,whereas more variation was observed in medical schools usingUKCAT as a factor in the admissions process (fig 2).The proportion of missing data did not vary significantlybetween groups (table 9⇓), with the exception of advancedqualifications; this variable was missing for 26% of entrants tomedical schools that used UKCAT scores in borderline cases,29% for those that used UKCAT as a factor in the admissionsprocess, and 28% of those that used UKCAT as a threshold,with the difference between factor and threshold groups and theborderline group being significant (P<0.01 in all cases).Table 10⇓ illustrates the relative performance of entrants on theUKCAT and at A level examinations (or equivalent), the latterin terms of UCAS tariff. In table 10 the UCAS tariff is presentedin two ways; as absolute points from all advanced levelexaminations (excepting resits and general studies), and as astandardised z score calculated on the basis of the “best of three”(or equivalent number) of advanced level grades. Those entrantsto medical schools that used the UKCAT as a threshold hadsignificantly higher total scores, on average, than those entrantsto medical schools that used UKCAT as a factor, who, in turn,had on average higher scores than entrants to medical schoolsthat used the UKCAT in borderline cases (P<0.001 in all cases).Both “uncensored” (no maximum set) and censored (forexample, “best of three”) standardised UCAS tariff scores weresignificantly higher (P<0.05 and P<0.001, respectively) inentrants to medial schools that used UKCAT as a factorcompared with the other two categories of medical school.
Multilevel multiple logistic regression:medical school entrantsTo ensure nesting, only observations from 2679 entrants withcomplete data were utilised, out of the total of 4456 individuals(60%). Table 11⇓ shows the results for sex, ethnicity, Englishas second language, and age. The manner in which UKCATwas used was entered as a three level factor variable. Unlessstated otherwise, the group ofmedical schools that usedUKCATas a factor was used as the baseline category. This simplifiedthe presentation of the results because although all thecombinations of interactions were explored, those that weresignificant (P<0.05) mainly involved this group of medicalschools as one of the comparators. Several of the effectsobserved in the raw univariate single level analysis (table 9)were attenuated or not observed after controlling for individualinstitutional effects and potential confounding. For example,entrants to medical schools that used UKCAT as a factor or asa threshold continued to be more likely to be male than thoseadmitted to medical schools that used UKCAT in borderlinecases. In contrast, the trend for entrants to medical schools thatused UKCAT as a factor or threshold to be over 20 years atapplication was no longer apparent after controlling forindividual institutional and the effect other sociodemographicvariables. The intraclass correlation (0.22) was larger than forthe other widening participation categories depicted in table 11.
No commercial reuse: See rights and reprints http://www.bmj.com/permissions Subscribe: http://www.bmj.com/subscribe
BMJ 2012;344:e1805 doi: 10.1136/bmj.e1805 (Published 17 April 2012) Page 6 of 27
RESEARCH

This would suggest a relatively large institutional level effectcompared, for example, with that for the association with anentrant’s sex (intraclass correlation=0.002). This is supportedby the descriptive statistics observed in table 9 and figure 2where the relatively large variation between institutions in thesame UKCAT usage category for intake of older students couldbe contrasted with the relative homogeneity within groups forthe proportion of male entrants. These findings would suggestthat the trend for mature entrants reflects one or more individualuniversities taking in either large or small proportions of maturestudents, rather than an effect associated with type of UKCATusage (table 9). However, not all the trends observed wereattenuated after controlling for institutional effects and potentialconfounding variables; the difference between the odds of anentrant to a medical school using UKCAT in borderline casescompared with one from those using UKCAT as a factor havingEnglish as a second language actually increased in significance(P value from 0.2 to 0.04) once this more complex modellingwas performed.Table 12⇓ depicts the results of multilevel multiple logisticregression for the prediction of widening participation status ofentrants for school type attended, socioeconomic status, andachieving below average academic attainment (for this cohortof medical school applicants). Several trends that were highlystatistically significant on estimation of the raw odds ratio werenow absent or of only borderline significance. Notably, theintergroup differences in the probability of an entrant beingfrom a state school (as opposed to independent or grammarschool) attenuated to a difference of only borderline significance(odds ratio 1.60, 95% confidence interval 0.97 to 2.62, P=0.06)for medical schools using UKCAT as a threshold comparedwith those using UKCAT in borderline cases. In contrast, thefaint trends for entrants to medical schools using UKCAT as afactor and as a threshold to be more likely to be from lowsocioeconomic backgroundswere now of borderline significance(P=0.05 and P=0.06, respectively). The relatively highproportions of entrants to medical schools using UKCAT as afactor with below average academic attainment compared withthe other categories of medical schools remained statisticallysignificant, even after adjustment for institutional and potentialconfounding effects.
Modelling the prediction of achievingconditions for medical school entryOf 16 435 total applicants, 1189 were initially given 1507unconditional offers, having already achieved the requiredacademic conditions at the time of application. A further 5368candidates were initially provided with 7363 conditional offers(an average of 1.4 offers per successful candidate). Of theseindividuals, 4470 (83%) eventually obtained an unconditionaloffer, having obtained sufficient academic qualifications tosatisfy the relevant institutions that entry was merited. In most,but not all cases, this would involve achieving the initial A level(or equivalent) grades set as part of the conditions of theprovisional offer. To explore the predictors of an applicationbeing converted from a conditional to an unconditional offerdata were analysed from 3290 applications relating to 2803candidates holding conditional offers where complete data wereavailable. A multilevel multiple logistic regression model wasbuilt up in a stepwise fashion. A random intercept for eachcandidate was introduced, although it was not possible to modelthe random effects associated with individual institutionssimultaneously. All possible combinations of interactions wereexplored and those found to be significant and independentpredictors of successfully converting a conditional offer to an
unconditional one were included in the final model (table 13⇓).The strongest predictor of success was academic attainment(odds ratio 10.35, 95% confidence interval 8.01 to 13.27,P<0.001), in these cases measured using a standardised UCAStariff. Indeed, the only other significant and independentpredictor was the application being associated with a medicalschool using UKCAT in borderline cases or a factor in theadmissions process (compared with the remaining group).However, a trend of borderline statistical significance wasobserved for conditional offers associated with candidates oflow socioeconomic status to have less probability of beingconverted to unconditional ones (0.42, 0.18 to 0.99, P=0.05).Two interactions were also significant. Firstly, an interactionbetweenmature applicant status and academic achievement wasobserved (0.11, 0.07 to 0.17, P<0.001). This is interpreted asincreased A level achievement being relatively less of anadvantage to those applying to holding conditional offers andover 20 years old, compared with younger applicants. In practicemany mature candidates will be applying on the basis of auniversity degree, either achieved or pending, rather than Alevel achievement, and therefore this finding is readilyunderstood in this context. Perhaps a less anticipated interactionwas that observed for low socioeconomic status and non-whiteethnicity (8.56, 1.81 to 40.43, P=0.007). This implied that thoseapplicants holding conditional offers from low socioeconomicbackgrounds were more likely to convert them to unconditionalones if they were of non-white than of white ethnicity.
Missing data analysisThose applications with no data on socioeconomic backgroundof the candidate (n=12 562) were significantly less likely toresult in an offer (0.81, 0.76 to 0.85, P<0.001). Candidates withmissing socioeconomic status (n=4605) were significantly morelikely (P<00.01) to be male (1.13, 1.05 to 1.21), have attendeda private or grammar school (1.13, 1.05 to 1.21), be over 21years at application (1.33, 1.23 to 1.44), be of non-whiteethnicity (1.73, 1.62 to 1.86), speak English as a secondlanguage (1.39, 1.28 to 1.51), and have below average academicattainment (1.27, 1.17 to 1.39) and UKCAT score whencompared with those with socioeconomic background reported.Likewise, those applications with no attainment data onA levels,higher, or Irish leaving certificate (n=11 949) were significantlyless likely to result in an offer (0.58, 0.54 to 0.61, P<0.001).Candidates with missing or non-standard advanced qualificationdata (n=4917) were significantly more likely (P<0.01) to havemissing data on socioeconomic status (1.26, 0.17 to 1.36), befemale (1.10, 1.03 to 1.18), have attended a state school (3.65,3.36 to 3.96), be over 21 years at application (45.28, 40.61 to50.49), be of non-white ethnicity (1.42, 1.32 to 1.52), speakEnglish as a second language (2.15, 1.99 to 2.33), and have abelow average UKCAT score when compared with those withsocioeconomic background reported (1.86, 1.74 to 1.99). Thus,according to missing data theory, the missing socioeconomicstatus and advanced qualification data seemed to be not missingcompletely at random—that is, the value of the missing variableand the probability that it is missing is unrelated to observedvariables.The results of the sensitivity analyses using multiple imputeddata generally indicated that the missing values for advancequalification as socioeconomic status were missing at random.On average the odds ratio recovered from the analyses of theimputed data only varied by around 5-10% compared with thoseobtained for the non-imputed data. The only exception to thiswas the findings for the prediction of conditional offers usingimputed advanced qualification values. These results differed
No commercial reuse: See rights and reprints http://www.bmj.com/permissions Subscribe: http://www.bmj.com/subscribe
BMJ 2012;344:e1805 doi: 10.1136/bmj.e1805 (Published 17 April 2012) Page 7 of 27
RESEARCH
by a slightly larger degree, with, on average, odds ratio differingby an average of 12%. A fuller report of these results is availablefrom the lead author’s website (www.dur.ac.uk/p.a.tiffin/fps).
DiscussionThe main findings of this study at least partially supported ouroriginal hypothesis; the results suggest that important differencesexist, both in terms of the probability of an offer and that offinally taking up a place at medical school according to certainsociodemographic characteristics of the candidates and how themedical school applied to used the UKCAT. In terms of offers,the negative effect of being a member of a wideningparticipation group seemed to be mitigated by the admissionsprocesses utilised by medical schools using the UKCAT scoreas a threshold for interview or offer decisions. Indeed, onlyacademic achievement and UKCAT score were significant andindependent predictors of either a conditional or anunconditional offer at this category of medical school (tables 5and 6). The findings from these separate models were largelysupported by the interactions observed in the combined analyses(tables 7 and 8). Medical schools using the UKCAT score as afactor in the admissions process could largely be seen as anintermediate category, with some exceptions. For instance suchmedical schools were less likely than those that used UKCATas a threshold to provide a conditional offer to a candidate froma state school or a low socioeconomic background (table 8) butwere also more likely to provide a conditional offer to anindividual with below average academic achievement (table 7).Heavier use of UKCAT therefore seemed to promote wideningaccess as intended, at least to a degree, in terms of offers.Although it is important that universities act as fairly as possiblewhen providing offers, ultimately it is the characteristics of thecandidates finally taking up places at universities that willdetermine the demographics of the UK medical workforce.When analysing the raw proportions of under-represented groupsit appeared that many of the trends observed in the offer datawere translated into final uptake of placement. However, aftercontrolling for individual institutional effects and the potentialconfounding of other sociodemographic variables the pictureshifted somewhat. After these adjustments the clearest remainingdifferences were that entrants to medical schools that used theUKCATweakly (in borderline cases) were less likely to be malethan for the other two categories of medical school but weremore likely to have English as a second language than thosetaking up places in medical schools that used UKCAT as a factor(table 11). Several potentially important trends, albeit ofborderline statistical significance, were also observed in thatthose medical school using the UKCAT as a threshold scorewere more likely to admit students from state or non-grammarschools and from low socioeconomic backgrounds than weremedical schools that used UKCAT in borderline cases (table12). This latter trend for entrants of low socioeconomic statuswas also observed for medical schools using UKCAT as a factorcompared with those using it in borderline cases. A trend ofborderline statistical significance was also observed forapplicants from low socioeconomic backgrounds holdingconditional offers to be less likely to achieve the gradesnecessary for entry, although this effect might apply less tothose of non-white ethnicity. This in turn might weaken theimpact of UKCAT use on the final proportion of entrants fromlow socioeconomic backgrounds.
Comparison with previous findings andpossible interpretationsAfter controlling for factors such as UKCAT and academicperformance we estimated that non-white applicants were stillaround 40% less likely to receive a conditional offer from amedical school using UKCAT in borderline cases than acandidate reporting their ethnicity as white (table 5); an almostidentical finding to that reported by a study of ethnic minorityapplicants to medical school in 1990.27A subsequent study fromcandidates for admission from 1996 and 1997 also reported arelative disadvantage for applicants from ethnic minority groups,although the authors noted variation between individual medicalschools unrelated to the overall number of non-white applicantsto each institution. The present results from the separate modelswere largely echoed by the pooled analysis, which directlycompared the three types of medical school. Some authors havecited such findings as evidence of institutional discrimination.28Although UCAS does not pass on information of ethnicity touniversities it may be apparent from a candidate’s name orsubsequently at interview. Evidence of racial discriminationhas been uncovered previously within a medical school settingand as such cannot be entirely ruled out, deserving furtherexploration.29 It has been previously highlighted that racism isdefined as an attitude, and thus studies, such as the present one,that simply examine the probabilities of an offer to an applicantare unable to provide direct evidence of this.30 Moreover, theremay be more innocent, unmodelled effects that may explainsome of these observations. For example, it may be thatcandidates from certain under-represented groups are less likelyto have a relative in the medical profession and therefore findit more difficult to gain relevant work experience that wouldbolster their application and improve their performance atinterview. One possibility is that universities using the UKCATas a threshold may place less emphasis on personal statementsor the interview in deciding on offers and mitigating againstthis effect during the offer process (tables 7 and 8). Owing tothe nature of the structure of offer data, individual institutionaleffects could not be controlled for at the same time as withincandidate effects. However, whether these observations areassociated with a group effect or individual universities theydeserve further exploration.The relative over-representation of women entering medicalschool is a sensitive and contentious issue. The proportion ofwomen entering medical school in the United Kingdom andNorth America has steadily risen; in the United Kingdom mostgeneral practitioners are forecast to be women by 2013 andmostof all doctors by 2017.31 Some have argued against thisdisparity,32 highlighting that the current situation may increasethe risk of future workforce planning difficulties as women tendto take up posts in specialties perceived as more family friendly,such as general practice,33 and are more likely to work parttime.34 In contrast, it has been suggested that female doctors aremore likely to exhibit an empathic and caring communicationstyle, valued by patients, and that women perform better thanmen in both undergraduate and some postgraduateexaminations.35 In the present study, participating universitiesusing the UKCAT as a threshold score had an average intakeof 50% male entrants, which is representative of the generalpopulation (table 9). Thus, those in favour of reducing the excessof female medical students may choose to support UKCAT usedin this manner in the admissions process.Candidates with relatively low UKCAT scores may have agreater tendency to apply to universities with weak use of thetest (table 2). However, the absolute differences in the averagetest scores between candidates associated with applications to
No commercial reuse: See rights and reprints http://www.bmj.com/permissions Subscribe: http://www.bmj.com/subscribe
BMJ 2012;344:e1805 doi: 10.1136/bmj.e1805 (Published 17 April 2012) Page 8 of 27
RESEARCH
the three types of medical school were small. This implies that,at least in 2009, few applicants were making their universitychoices on the basis of UKCAT policy. It is important that theyhave the opportunity to do so, as we have shown it can have animportant impact on who receives offers.More non-native English speakers were in medical schools withthe weakest use of the UKCAT (tables 9 and 11). Performanceon the UKCAT was poorer in those with English as a secondlanguage, and therefore a more robust use of the test in theadmissions process could potentially disadvantage suchcandidates; although it is worth noting that once ethnicity wascontrolled for no such trend was noted for offers (tables 5-8).In addition, entrants to medical schools using UKCAT as afactor were less likely to have below average academicachievement compared with their peers.In terms of sex, generally males perform better than females onthe UKCAT16 and this may mitigate against their longestablished disadvantage when applying for a place at medicalschool. However, this situation is more complex, in that womenwho do well at the UKCAT gain a stronger advantage thanmales. Interestingly, the relative excess of males observedentering medical schools that had a stronger use of the UKCATremained even after controlling for individual institutionaleffects and UKCAT total score. This suggests that it was theway the test scores were being used, rather than absolute sexdifferences, that underlay this finding.Universities with the weakest use of the UKCAT (in borderlinecases) were most likely to admit entrants with relatively lowschool attainment. This observation is not easily interpreted,although several possible explanations exist. Firstly, thesemedical schools sometimes used the UKCAT as a rescuemechanism, interviewing or making offers to candidates whowould not normally be considered, for example, owing to lowpredicted academic attainment. Therefore the use of the UKCATin this way may compensate for relatively low A levelperformance in some cases. However, data held by the UKCATconsortium suggest that, in practice, this mechanism is invokedrelatively rarely and therefore is unlikely to fully account forthis observation. A second explanation may be that the intentionto use the UKCAT in a rescue manner may be a marker of aninstitutional attitude towards not prioritising academicachievement over other candidate attributes. Thus, in this casethe manner in which UKCAT was used would be acting as aninstrumental variable. Such institutions may be more likely toset lower academic conditions for entry or show latitude tocandidates who eventually did not quite achieve these requiredgrades. Lastly, it may be pure coincidence that, on average, themedical schools that used the UKCAT in this manner happenedto have had slightly lower entry requirements compared withother medical schools in 2009.Several mediators could potentially explain the disparitiesobserved between data relating to offers and those concerningmedical school entrants. Firstly, applicants holding more thanone unconditional offer could choose which, if any, of theuniversities to enter, and this is not something that medicalschool can influence. Secondly, a minority of applicants holdingconditional offers may fail to achieve the examination resultsrequired for admission. Indeed, those from a low socioeconomicbackgroundmay be over-represented in this category (table 13).Thirdly, it was not possible to control for the individual(random) effects associated with specific medical schoolsapplied to while adjusting for the dependency of observationsnested within each candidate. Therefore it is possible that someeffects that appear associated with how UKCAT is used were,at least, partly attributable to the behaviour of individual
universities. For example, to draw a comparison with the entrantdata, not all medical schools using UKCAT as a thresholdadmitted a higher than average proportion of students from lowsocioeconomic backgrounds (fig 2). Such variability was alsopresent in the offer data to some extent (see standard deviations,table 1). These differences are likely to be due to variations inadmissions policies aside from UKCAT usage. The effectswould have been unmasked once an adjustment for universitylevel effects was possible in the data on entrants.
Strengths and limitations of the studyThis is the first study to report in detail on the impact of theUKCAT on medical school selection. Missing data were sparseexcept for two predictor variables: socioeconomic backgroundand school qualifications. Therefore some caution must beexercised when drawing conclusions about the role of thesepredictors. However, the findings from the sensitivity analysisusing multiple imputation suggested that the data were largelymissing at random and thus should not affect the conclusionsdrawn from the multilevel multiple logistic regression modelspredicting offers. The case of missing advanced qualificationdata in relation to the prediction of conditional offers could beconsidered something of an exception to this; when thesemissing data were imputed the findings showed a relativelygreater degree of variation compared with the results for thenon-imputed data. Although graduate and other widening accesscourses make up a small fraction of overall UK medical schoolintake, these findings are unlikely to generalise to this populationof applicants, who were excluded from the analysis.Concerning the analysis of offers; it was not possible to controlfor the random effects associated with specific universitiesapplied to while also adjusting for the dependency ofobservations nested within each candidate. This was becauseof the offer data structure being hierarchical but not nested—thatis, more than one candidate could apply to more than oneuniversity. These effects would be particularly pronounced if,for example, a particular medical school had a strong policy ofrecruiting students from one or more widening participationcategories. However, the intraclass correlation values observedin the entrant data, where university effects could be explored,were relatively low (range 0.22 to <0.001) suggesting that most,if not all, of these within medical school effects were relativelytrivial once the association with education and demographicvariables were controlled for, although cautionmust be exercisedin extending this assumption from the entrant to the offer data.One of the most striking findings was how small the absolutenumbers of applicants and entrants to medical school were fromlow socioeconomic backgrounds; only around 5.5%of applicantsand 4.5% of entrants reported being from socioeconomic class4 or lower socioeconomic background (although this may bemildly underestimated owing to missing data).25 Because ofthese small numbers the study may have lacked power to detecta statistically significant difference between categories ofmedical school, although trends of borderline significancebetween those using UKCAT in borderline cases and those withstronger usage were detected.It could be argued that the use of the UKCAT may be an“instrumental variable” in that it could represent a marker of apro-widening participation attitude of a medical school, ratherthan be the main cause of an increase in candidates from awidening participation group being offered places. Althoughthis cannot be absolutely disproved, the UKCAT specific effectsobserved in the models would tend to counter this hypothesis.Moreover, if several institutions have changed their use of the
No commercial reuse: See rights and reprints http://www.bmj.com/permissions Subscribe: http://www.bmj.com/subscribe
BMJ 2012;344:e1805 doi: 10.1136/bmj.e1805 (Published 17 April 2012) Page 9 of 27
RESEARCH
test over the past few years it would be important to explorewhether the level of disadvantage encountered by wideningparticipation groups also altered in line with this. This wouldbe compelling evidence against the case for themode of UKCATuse as an instrumental variable. Moreover, the effect of thepredominant use of the UKCAT by each group or individualinstitutions might mask more subtle effects such as the use ofthe UKCAT as a rescue mechanism for certain subgroups ofcandidates or the effect of the level of the threshold scoreselected.Lastly, it has been pointed out that statistical models are usefulprecisely because they omit certain variables.36 As such theyprovide simplifications of reality. Admissions processes arecomplex and unique and for this reason the models may havelimited predictive power on an individual level. However, theabsolute proportions of each type of applicant from a wideningparticipation group observed to be taking up a place at medicalschool would support the models developed as being generallyvalid for this cohort studied.
Conclusions and implications for policyIs the creation of a population of medical students that isdemographically more representative of the United Kingdomas a whole likely to have entirely positive implications for thedelivery of British healthcare? Some would argue that medicalschoold should focus on admitting those most likely to makethe “best” doctors, and therefore medical student populationsmay not necessarily be representative of the populations fromwhich they are drawn. To date, research has generally definedpromising medical school entrants in negative terms—that is,those who are least likely to fail undergraduate or postgraduateexaminations or face future professional disciplinary action. Inthis respect, controversially, one could argue for the status quo(an excess of women, those with good academic performance,and those of a higher socioeconomic status), as male sex, lowersocial class, and poor academic performance have been reportedto be associated with subsequent professional disciplinaryaction.37 38 However, research from the United States suggeststhat students drawn from minority populations enrich theteaching environment of a medical school39 and may be morelikely to practice in areas underserved by healthcare facilities.40In addition, patient satisfaction with their doctor may beincreased in cases where they share the same ethnicity41 or sex42and, although research is lacking, this finding could potentiallyextend to other sociodemographic characteristics. Also, the issueof social equity and fair opportunities for all applicants ofcomparable ability cannot be overlooked, and the presentfindings suggest that the robust use of the UKCAT is a potentialtool for dealing with such disadvantage.In summary, our findings suggest that placing an increasedweight on an applicant’s UKCAT performance significantlyreduces the disadvantage faced by most candidates fromunder-represented groups when seeking an offer of a place fromamedical school. These benefits do not always seem to translateinto proportions of entrants from ethnic minority groups;candidate choice and academic performance are likely to beimportant mediating factors between offer and acceptance andthese are factors over which universities will have minimuminfluence. Nevertheless, medical schools have a duty to act inas fair a way as possible during the admissions process, and theUKCAT seems to be a tool that has the potential to produce amore level playing field for many of those seeking access to themedical profession.
We thank Sandra Nicholson (chair of the UKCAT consortium and readerin medical education) for advice on data analysis and interpretation;Rachel Greatrix (chief operating officer for the UKCAT consortium);Paul Dennis (fellow, Brasenose College, Oxford University) forassistance with data abstraction; and Adetayo Kasim (statistician, theWolfson Research Institute) for providing supplementary statisticaladvice in relation to the project.Contributors: PAT led on conception, design, statistical analysis, andinterpretation of data, and is the guarantor of the paper. JCMcLcontributed to the study conception design, literature review, drafting,revising the article, and critically appraising the content. JSD contributedto the study design, drafting, revising the article, and critically appraisingthe content. All authors approved the final version of the articlesubmitted.Funding: This study was funded by the UKCAT consortium ofUniversities via a grant to Durham University. JSD and JCMcL aremembers of the UKCAT Consortium board and research panel.Competing interests: All authors have completed the ICMJE uniformdisclosure form at www.icmje.org/coi_disclosure.pdf (available onrequest from the corresponding author) and declare: no support fromany organisation for the submitted work; no financial relationships withany organisations that might have an interest in the submitted work inthe previous three years; JSD and JCMcL are members of the UKCATConsortium board and research panel. They have received travelexpenses and may be seen to benefit, in reputational terms, from worksupporting the use of the UKCAT.Ethical approval: Exemption from an external ethical review wasconfirmed in writing by the chair of the ethics committee for DurhamUniversity School for Health Research.Data sharing: Individual UKCAT scores are currently not publicallyavailable. UCAS applicant level data are not made available outwithspecific contractual arrangements. Additional details of the sensitivityanalysis using multiple imputation are available from the lead author’swebsite (www.dur.ac.uk/p.a.tiffin/fps).
1 Panel for Fair Access to the Professions. The final report of the Panel for Fair Access tothe Professions. Department for Business Innovation and Skills, 2009.
2 Powis D, Hamilton J, McManus IC. Widening access by changing the criteria for selectingmedical students. Teaching Teacher Educ 2007;23:1235-45.
3 McLachlan JC. Outreach is better than selection for increasing diversity. Med Educ2005;39:873-5.
4 Mathers J, Parry J. Why are there so few working-class applicants to medical schools?Learning from the success stories. Med Educ 2009;43:219-28.
5 Schwartz S. Fair admissions to higher education: recommendations for good practice.Department for Education and Skills, 2004.
6 Turner R, Nicholson S. Reasons selectors give for accepting and rejecting medicalapplicants before interview. Med Educ 2011;45:298-307.
7 Ferguson E, O’Hehir F, James D. Predictive validity of personal statements and the roleof the five factor model of personality in relation to medical training. J Occup Organ Psych2000;73:321-44.
8 Goho J, Blackman A. The effectiveness of academic admission interviews: an exploratorymeta-analysis. Medical Teacher 2006;28:335-40.
9 Lakhan SE. Diversification of US medical schools via affirmative action implementation.BMC Med Educ 2003;3:6-20.
10 Saha S, Guiton G, Wimmers PF, Wilkerson L. Student body racial and ethnic compositionand diversity-related outcomes in US medical schools. JAMA 2008;300:1135-45.
11 James D, Ferguson E, Powis D, Symonds I, Yates J. Graduate entry to medicine: wideningacademic and socio-demographic access. Med Educ 2008;42:294-300.
12 Mathers J, Sitch A, Marsh JL, Parry J. Widening access to medical education forunder-represented socioeconomic groups: population based cross sectional analysis ofUK data, 2002-6. BMJ 2011;342:d918.
13 Pearson VUE. About us: the world’s leading computer-based testing and assessmentbusiness. 2008. www.pearsonvue.co.uk/aboutus/pages/Aboutus.aspx.
14 UKCAT Consortium. The UK Clinical Aptitude Test (UKCAT). 2009. www.ukcat.ac.uk/default.aspx.
15 Wright SR, Bradley PM. Has the UK Clinical Aptitude Test improved medical studentselection? Med Educ 2010;44:1069-76.
16 James D, Yates J, Nicholson S. Comparison of A level and UKCAT performance instudents applying to UK medical and dental schools in 2006: cohort study. BMJ2010;340:c478.
17 McManus I, Powis D, Wakeford R, Ferguson E, James D, Richards P. Intellectual aptitudetests and A levels for selecting UK school leaver entrants for medical school. BMJ2005;331:555-9.
18 Cassidy J. UKCAT among the pigeons. BMJ 2008;336:691-2.19 Adam J, Dowell J, Greatrix R. Use of UKCAT scores in student selection by UK medical
schools, 2006-2010. BMC Med Educ 2011;11:98.20 BMA Board of Medical Education. The demography of medical schools: a discussion
document. BMA, 2004.
No commercial reuse: See rights and reprints http://www.bmj.com/permissions Subscribe: http://www.bmj.com/subscribe
BMJ 2012;344:e1805 doi: 10.1136/bmj.e1805 (Published 17 April 2012) Page 10 of 27
RESEARCH

What is already known on this topic
The introduction of the UK clinical aptitude test (UKCAT) was part of an initiative to broaden the demography of medical school entrantsUKCAT scores are modestly correlated with A level attainment, and performance is associated with white ethnicity, professional ormanagerial background, independent or grammar school education, and male sexIt is unknown whether the UKCAT has tackled the relative disadvantage of certain socioeconomic groups when applying to UK medicalschools and how this impact might vary according to the use of the test in the admissions process
What this study adds
Being from an under-represented socioeconomic group was not a major disadvantage for candidates applying to medical schools thatused UKCAT as a threshold, after controlling for academic attainment and UKCAT score; this was not so for applications to universitiesusing the test more weaklyStronger use of the test (threshold score) was associated with increased proportions of males, possibly state school students, and thosefrom low socioeconomic status backgrounds entering medical schoolWeaker use of the test (borderline cases, weighted factor) was associated with higher proportions of entrants with relatively low academicattainment and English as a second language
21 Seyan K, Greenhalgh T, Dorling D. The standardised admission ratio for measuringwidening participation in medical schools: analysis of United Kingdom medical schooladmissions by ethnicity, socioeconomic status, and sex. BMJ 2004;328:1545-6.
22 Multi-Processor Edition Stata for Windows [program]. Version 12. Stata, 2011.23 Mathers J, Sitch A, Marsh JL, Parry J. Widening access to medical education for
under-represented socioeconomic groups: population based cross sectional analysis ofUK data, 2002-6. BMJ 2011;342:539.
24 Hoare A, Johnston R. Widening participation through admissions policy—a British casestudy of school and university performance. Stud Higher Educ 2011;36:21-41.
25 Office for National Statistics. The National Statistics socio-economic classification(NS-SEC). 2011. www.ons.gov.uk/ons/guide-method/classifications/current-standard-classifications/soc2010/soc2010-volume-3-ns-sec--rebased-on-soc2010--user-manual/index.html.
26 Verbeke G, Molenberghs G, Thijs H, Lesaffre E, Kenward MG. Sensitivity analysis fornon-random dropout: a local influence approach. Biometrics 2001;57:7-14.
27 McManus IC, Richards P, Winder BC, Sproston KA, Styles V. Medical school applicantsfrom ethnic minority groups: identifying if and when they are disadvantaged. BMJ1995;310:496-500.
28 Collier J, Burke A. Racial and sexual discrimination in the selection of students for Londonmedical schools. Med Educ 1986;20:86-90.
29 Commission for Racial Equality. Report of a formal investigation into St George’s HospitalMedical School. Commission for Racial Equality, 1988.
30 McManus IC. Factors affecting likelihood of applicants being offered a place in medicalschools in the United Kingdom in 1996 and 1997: retrospective study. BMJ1998;317:1111-6.
31 Royal College of Physicians. Women and medicine: the future—summary of findings fromRoyal College of Physicians research. RCP, 2009.
32 McKinstry B. Are there too many female medical graduates? Yes. BMJ 2008;336:748.33 Lambert TW, GoldacreMJ, Turner G. Career choices of United Kingdommedical graduates
of 1999 and 2000: questionnaire surveys. BMJ 2003;326:194-5.
34 Davidson JM, Lambert TW, Goldacre MJ. Career pathways and destinations 18 years onamong doctors who qualified in the United Kingdom in 1977: postal questionnaire survey.BMJ 1998;317:1425-8.
35 Dacre J. Are there too many female medical graduates? No. BMJ 2008;336:749.36 Paley J, Lilford R. Qualitative methods: an alternative view. BMJ 2011;342:d424.37 Yates J, James D. Risk factors at medical school for subsequent professional misconduct:
multicentre retrospective case-control study. BMJ 2010;340:c2040.38 Papadakis MA, Teherani A, Banach MA, Knettler TR, Rattner SL, Stern DT, et al.
Disciplinary action by medical boards and prior behavior in medical school. N Engl J Med2005;353:2673-82.
39 Whitla DK, Orfield G, Silen W, Teperow C, Howard C, Reede J. Educational benefits ofdiversity in medical school: a survey of students. Acad Med 2003;78:460-6.
40 KomaromyM, Grumbach K, DrakeM. The role of black and hispanic physicians in providinghealth care for underserved populations. N Engl J Med 1996;4:1305-10.
41 Saha S, Komaromy M, Koepsell TD, Bindman AB. Patient-physician racial concordanceand the perceived quality and use of health care. Arch Intern Med 1999;159:997-1004.
42 Fennema K, Meyer DL, Owen N. Sex of physician: patients’ preferences and stereotypes.J Fam Pract 1990;30:441-6.
Accepted: 6 February 2012
Cite this as: BMJ 2012;344:e1805This is an open-access article distributed under the terms of the Creative CommonsAttribution Non-commercial License, which permits use, distribution, and reproduction inany medium, provided the original work is properly cited, the use is non commercial andis otherwise in compliance with the license. See: http://creativecommons.org/licenses/by-nc/2.0/ and http://creativecommons.org/licenses/by-nc/2.0/legalcode.
No commercial reuse: See rights and reprints http://www.bmj.com/permissions Subscribe: http://www.bmj.com/subscribe
BMJ 2012;344:e1805 doi: 10.1136/bmj.e1805 (Published 17 April 2012) Page 11 of 27
RESEARCH
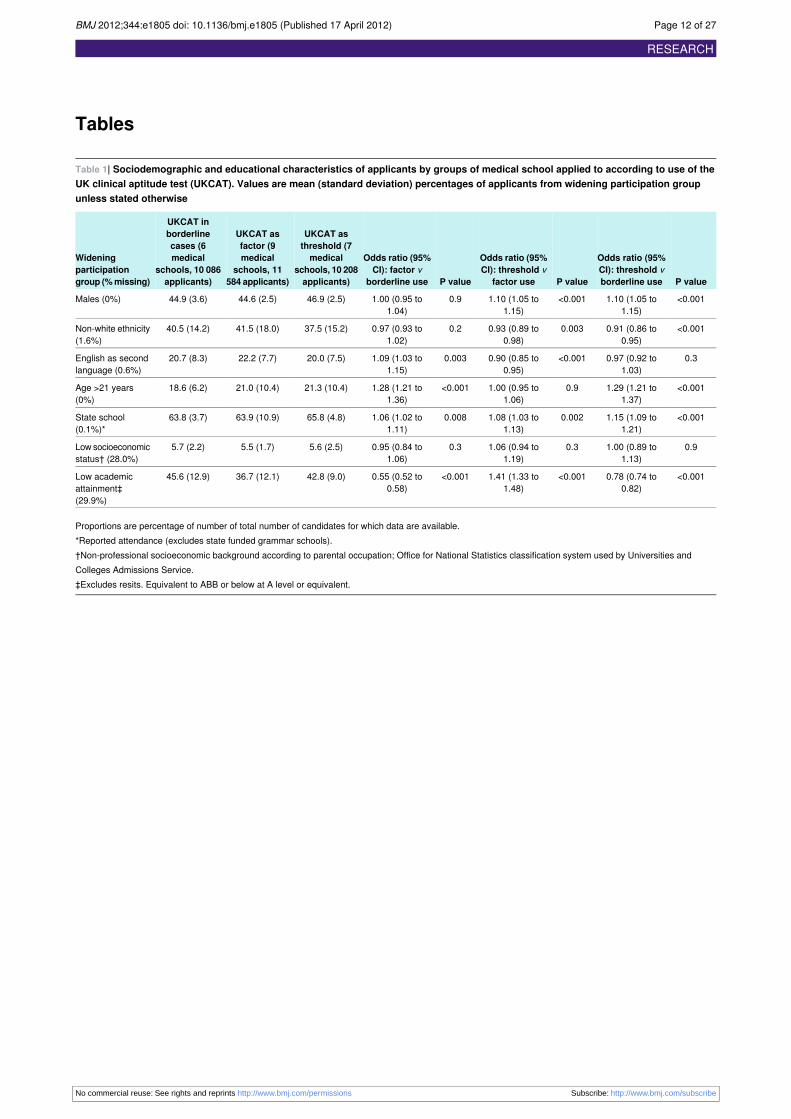
Tables
Table 1| Sociodemographic and educational characteristics of applicants by groups of medical school applied to according to use of theUK clinical aptitude test (UKCAT). Values are mean (standard deviation) percentages of applicants from widening participation groupunless stated otherwise
P value
Odds ratio (95%CI): threshold vborderline useP value
Odds ratio (95%CI): threshold v
factor useP value
Odds ratio (95%CI): factor v
borderline use
UKCAT asthreshold (7medical
UKCAT asfactor (9medical
UKCAT inborderlinecases (6
Wideningparticipationgroup (%missing)
schools, 10 208applicants)
schools, 11584 applicants)
medicalschools, 10 086applicants)
<0.0011.10 (1.05 to1.15)
<0.0011.10 (1.05 to1.15)
0.91.00 (0.95 to1.04)
46.9 (2.5)44.6 (2.5)44.9 (3.6)Males (0%)
<0.0010.91 (0.86 to0.95)
0.0030.93 (0.89 to0.98)
0.20.97 (0.93 to1.02)
37.5 (15.2)41.5 (18.0)40.5 (14.2)Non-white ethnicity(1.6%)
0.30.97 (0.92 to1.03)
<0.0010.90 (0.85 to0.95)
0.0031.09 (1.03 to1.15)
20.0 (7.5)22.2 (7.7)20.7 (8.3)English as secondlanguage (0.6%)
<0.0011.29 (1.21 to1.37)
0.91.00 (0.95 to1.06)
<0.0011.28 (1.21 to1.36)
21.3 (10.4)21.0 (10.4)18.6 (6.2)Age >21 years(0%)
<0.0011.15 (1.09 to1.21)
0.0021.08 (1.03 to1.13)
0.0081.06 (1.02 to1.11)
65.8 (4.8)63.9 (10.9)63.8 (3.7)State school(0.1%)*
0.91.00 (0.89 to1.13)
0.31.06 (0.94 to1.19)
0.30.95 (0.84 to1.06)
5.6 (2.5)5.5 (1.7)5.7 (2.2)Low socioeconomicstatus† (28.0%)
<0.0010.78 (0.74 to0.82)
<0.0011.41 (1.33 to1.48)
<0.0010.55 (0.52 to0.58)
42.8 (9.0)36.7 (12.1)45.6 (12.9)Low academicattainment‡(29.9%)
Proportions are percentage of number of total number of candidates for which data are available.*Reported attendance (excludes state funded grammar schools).†Non-professional socioeconomic background according to parental occupation; Office for National Statistics classification system used by Universities andColleges Admissions Service.‡Excludes resits. Equivalent to ABB or below at A level or equivalent.
No commercial reuse: See rights and reprints http://www.bmj.com/permissions Subscribe: http://www.bmj.com/subscribe
BMJ 2012;344:e1805 doi: 10.1136/bmj.e1805 (Published 17 April 2012) Page 12 of 27
RESEARCH
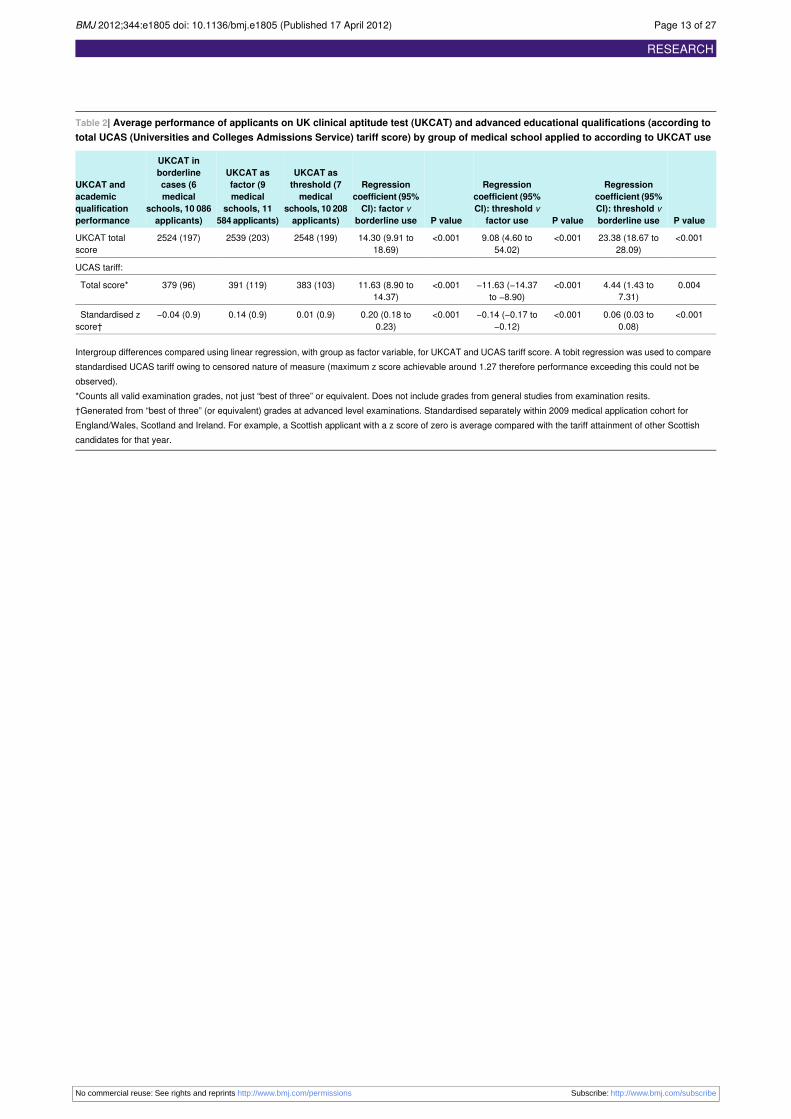
Table 2| Average performance of applicants on UK clinical aptitude test (UKCAT) and advanced educational qualifications (according tototal UCAS (Universities and Colleges Admissions Service) tariff score) by group of medical school applied to according to UKCAT use
P value
Regressioncoefficient (95%
P value
Regressioncoefficient (95%
P value
Regressioncoefficient (95%
UKCAT asthreshold (7
UKCAT asfactor (9
UKCAT inborderline
UKCAT andacademic
CI): threshold vborderline use
CI): threshold vfactor use
CI): factor vborderline use
medicalschools, 10 208applicants)
medicalschools, 11
584 applicants)
cases (6medical
schools, 10 086applicants)
qualificationperformance
<0.00123.38 (18.67 to28.09)
<0.0019.08 (4.60 to54.02)
<0.00114.30 (9.91 to18.69)
2548 (199)2539 (203)2524 (197)UKCAT totalscore
UCAS tariff:
0.0044.44 (1.43 to7.31)
<0.001−11.63 (−14.37to −8.90)
<0.00111.63 (8.90 to14.37)
383 (103)391 (119)379 (96)Total score*
<0.0010.06 (0.03 to0.08)
<0.001−0.14 (−0.17 to−0.12)
<0.0010.20 (0.18 to0.23)
0.01 (0.9)0.14 (0.9)−0.04 (0.9)Standardised zscore†
Intergroup differences compared using linear regression, with group as factor variable, for UKCAT and UCAS tariff score. A tobit regression was used to comparestandardised UCAS tariff owing to censored nature of measure (maximum z score achievable around 1.27 therefore performance exceeding this could not beobserved).*Counts all valid examination grades, not just “best of three” or equivalent. Does not include grades from general studies from examination resits.†Generated from “best of three” (or equivalent) grades at advanced level examinations. Standardised separately within 2009 medical application cohort forEngland/Wales, Scotland and Ireland. For example, a Scottish applicant with a z score of zero is average compared with the tariff attainment of other Scottishcandidates for that year.
No commercial reuse: See rights and reprints http://www.bmj.com/permissions Subscribe: http://www.bmj.com/subscribe
BMJ 2012;344:e1805 doi: 10.1136/bmj.e1805 (Published 17 April 2012) Page 13 of 27
RESEARCH

Table 3| Odds of an application resulting in a conditional offer of a place according to widening participation sociodemographic group andtype of medical school’s use of UK clinical aptitude test (UKCAT)
UKCAT as threshold (7medical schools,6564 applicants*)
UKCAT as factor (9 medical schools,8163 applicants*)
UKCAT in borderline cases (6 medicalschools, 7558 applicants*)Widening
participationgroup ICC†P value
Odds ratio (95%CI)ICC†P value
Odds ratio (95%CI)ICC†P value
Odds ratio (95%CI)
0.490.11.14 (0.96 to1.35)
0.380.060.86 (0.74 to1.00)
0.34<0.0010.70 (0.59 to0.83)
Sex (male vfemale)
0.48<0.0010.55 (0.46 to0.67)
0.38<0.0010.70 (0.59 to0.82)
0.33<0.0010.46 (0.38 to0.56)
Ethnicity(non-white vwhite)
0.48<0.0010.50 (0.34 to0.59)
0.38<0.0010.55 (0.44 to0.69)
0.34<0.0010.56 (0.44 to0.72)
English as secondlanguage
0.49<0.0010.34 (0.21 to0.56)
0.37<0.0010.50 (0.34 to0.73)
0.350.40.77 (0.44 to1.35)
Age (>21 years atapplication)
0.49<0.0010.62 (0.52 to0.74)
0.34<0.0010.34 (0.29 to0.39)
0.34<0.0010.58 (0.49 to0.68)
School type (statev private orgrammar)
0.490.0010.50 (0.33 to0.76)
0.38<0.0010.51 (0.40 to0.65)
0.34<0.0010.31 (0.19 to0.50)
Socioeconomicclass 4 or 5‡
0.45<0.0010.18 (0.14 to0.22)
0.30<0.0010.37 (0.25 to0.56)
0.29<0.0010.27 (0.22 to0.32)
Below averageacademicattainment
0.30<0.0010.04 (0.03 to0.05)
0.49<0.0010.18 (0.15 to0.22)
0.34<0.0010.42 (0.35 to0.51)
Below averageUKCAT total score
ICC=intraclass correlation. A random intercept was allowed for each candidate.*Applicants with complete data.†ICC represents residual correlation of latent responses within each applicant.‡According to Office for National Statistics classification system.
No commercial reuse: See rights and reprints http://www.bmj.com/permissions Subscribe: http://www.bmj.com/subscribe
BMJ 2012;344:e1805 doi: 10.1136/bmj.e1805 (Published 17 April 2012) Page 14 of 27
RESEARCH

Table 4| Unadjusted (raw) odds of an application resulting in an unconditional offer of a place according to widening participationsociodemographic group and use of UKCAT by medical school
UKCAT as threshold (7 medical schools,6725 applicants*)
UKCAT as factor (9 medical schools, 8692applicants*)
UKCAT in borderline cases (6 medicalschools, 7690 applicants*)Widening
participationgroup ICC†P value
Odds ratio (95%CI)ICC†P value
Odds ratio (95%CI)ICC†P value
Odds ratio (95%CI)
0.140.041.15 (1.01 to 1.32)0.220.10.90 (0.79 to1.03)
0.060.0020.79 (0.69 to 0.92)Sex (male v female)
0.12<0.0010.69 (0.59 to 0.80)0.21<0.0010.55 (0.47 to0.64)
0.05<0.0010.53 (0.45 to 0.62)Ethnicity (non-whitev white)
0.13<0.0010.55 (0.44 to 0.69)0.21<0.0010.54 (0.44 to0.66)
0.06<0.0010.67 (0.54 to 0.84)English as secondlanguage
0.130.10.74 (0.51 to 1.06)0.220.10.77 (0.56 to1.05)
0.070.80.93 (0.58 to 1.50)Age (>21 years atapplication)
0.13<0.0010.73 (0.64 to 0.84)0.21<0.0010.58 (0.51 to0.67)
0.05<0.0010.62 (0.53 to 0.71)School type (state vprivate orgrammar)‡
0.130.030.69 (0.49 to 0.96)0.21<0.0010.48 (0.34 to0.70)
0.06<0.0010.41 (0.27 to 0.63)Socioeconomicclass 4 or 5§
0.03<0.0010.27 (0.23 to 0.31)0.15<0.0010.18 (0.15 to0.22)
<0.01<0.0010.27 (0.23 to 0.31)Below averageacademicattainment¶
<0.001<0.0010.09 (0.08 to 0.12)0.16<0.0010.28 (0.24 to0.33)
0.05<0.0010.50 (0.43 to 0.58)Below averageUKCAT totalscore**
ICC=intraclass correlation. A random intercept was allowed for each candidate.*Applicants with complete data.†Represents residual correlation of latent responses within each applicant.‡Reported attendance at a state school, excludes state funded grammar schools.§ Non-professional socioeconomic background according to parental occupation; Office for National Statistics classification system used by Universities andColleges Admissions Service.¶Low academic attainment (excluding resits) equivalent to ABB or below at A level or equivalent.**Total UKCAT z score of zero or below.
No commercial reuse: See rights and reprints http://www.bmj.com/permissions Subscribe: http://www.bmj.com/subscribe
BMJ 2012;344:e1805 doi: 10.1136/bmj.e1805 (Published 17 April 2012) Page 15 of 27
RESEARCH

Table 5| Results of multilevel multiple logistic regression analyses with outcome variable a conditional offer of a place at medical school
ICC*P valueOdds ratio (95% CI) for receiving offerPredictor variables
UKCAT scores for borderline cases (n=7558)†:
0.23<0.0012.63 (2.27 to 3.05)Academic attainment (standardised tariff score in SDs)
<0.0010.60 (0.49 to 0.73)Non-white ethnicity
<0.0010.55 (0.43 to 0.70)Male sex
<0.0010.62 (0.51 to 0.76)Attendance at state (non-grammar) school
<0.0011.23 (1.11 to 1.37)Standardised UKCAT total score (SDs)
0.0040.51 (0.32 to 0.81)Socioeconomic class 4 or 5‡
0.11.64 (0.87 to 3.06)Age >21 years
—0.81.04 (0.79 to 1.36)English as second language
—0.0010.53 (0.36 to 0.77)Academic attainment-age interaction
—0.0051.57 (1.14 to 2.16)Male-school type interaction
—0.041.36 (1.01 to 1.84)UKCAT score-English as second language interaction
UKCAT scores as factor for admissions (n=8163)†:
0.12<0.0012.31 (2.07 to 2.58)Standardised UKCAT total test score (SDs)
<0.0012.27 (1.96 to 2.62)Academic attainment (standardised tariff score in SDs)
<0.0010.52 (0.45 to 0.60)Attendance at state (non-grammar) school
<0.0010.78 (0.68 to 0.89)Male
0.010.62 (0.42 to 0.91)Socioeconomic class 4 or 5‡
0.080.79 (0.61 to 1.03)English as second language
—0.51.17 (0.77 to 1.78)Age >21 years
—0.50.95 (0.81 to 1.12)Non-white ethnicity
—<0.0010.42 (0.33 to 0.52)Academic attainment-age interaction
—0.0031.17 (1.05 to 1.29)Academic attainment-UKCAT score interaction
—0.0051.54 (1.14 to 2.07)UKCAT score-English as second language interaction
UKCAT scores as threshold (n=6564)†:
0.13<0.0018.59 (6.96 to 10.62)Standardised UKCAT total score (SDs)
<0.0011.63 (1.46 to 1.82)Academic attainment (standardised tariff score in SDs)
0.31.27 (0.84 to 1.91)Socioeconomic class 4 or 5‡
0.31.16 (0.87 to 1.55)English as second language
—0.51.06 (0.88 to 1.28)Non-white ethnicity
—0.81.02 (0.88 1.18)Attendance at state (non-grammar) school
—0.81.02 (0.85 to 1.23)Male sex
—0.91.03 (0.65 to 1.64)Age >21 years
—0.0010.68 (0.53 to 0.84)Male-UKCAT score interaction
—0.020.68 (0.49 to 0.94)UKCAT score-English as second language interaction
—0.020.36 (0.15 to 0.86)Socioeconomic class 4 or 5-English as second languageinteraction
ICC=intraclass correlation. Average cluster size (UKCAT consortium applications per candidate): 1.4 for medical schools using UKCAT score in borderline cases,1.5 for those using UKCAT as factor in admissions, and 1.3 for those using UKCAT as threshold score.*Represents residual correlation of latent responses for each applicant.†Number of applications, rather than number of candidates.‡Office for National Statistics socioeconomic classification system.
No commercial reuse: See rights and reprints http://www.bmj.com/permissions Subscribe: http://www.bmj.com/subscribe
BMJ 2012;344:e1805 doi: 10.1136/bmj.e1805 (Published 17 April 2012) Page 16 of 27
RESEARCH

Table 6| Results of multilevel multiple logistic regression analyses with outcome variable an unconditional offer of a place at medicalschool
ICC*P valueOdds ratio (95% CI) for receiving offerPredictor variables
UKCAT scores for borderline cases (n=7690)†:
<0.001<0.0012.78 (2.41 to 3.20)Academic attainment (standardised tariff score in SDs)
<0.0010.63 (0.52 to 0.76)Non-white ethnicity
<0.0010.64 (0.53 to 0.76)Attendance at state (non-grammar) school
<0.0010.65 (0.53 to 0.81)Male sex
<0.0011.22 (1.09 to 1.36)Standardised UKCAT total score (SDs)
0.030.61 (0.39 to 0.95)Socioeconomic class 4 or 5‡
0.061.70 (0.98 to 2.93)Age >21 years
—0.51.09 (0.85 to 1.40)English as second language
—<0.0010.49 (0.35 to 0.68)Academic attainment-age interaction
—0.0010.79 (0.69 to 0.90)Academic attainment-UKCAT score interaction
—0.011.45 (1.09 to 1.94)Male-school type interaction
—0.031.36 (1.03 to 1.79)UKCAT score-English as second language interaction
UKCAT scores as factor in admissions (n=8692)†:
0.1<0.0012.00 (1.80 to 2.21)Standardised UKCAT total score (SDs)
<0.0012.28 (1.96 to 2.64)Academic attainment (standardised tariff score in SDs)
<0.0010.64 (0.53 to 0.76)Non-white ethnicity
<0.0010.75 (0.66 to 0.85)Attendance at state (non-grammar) school
0.010.85 (0.74 to 0.96)Male
0.010.46 (0.25 to 0.84)English as second language
0.080.72 (0.50 to 1.04)Socioeconomic class 4 or 5‡
0.11.35 (0.93 to 1.97)Age >21 years
—<0.0010.48 (0.39 to 0.60)Academic attainment-age interaction
—<0.0010.75 (0.67 to 0.84)Academic attainment-UKCAT score interaction
—0.0071.46 (1.11 to 1.93)UKCAT score-English as second language interaction
—0.032.10 (1.09 to 4.05)Ethnicity-English as second language interaction
UKCAT score as threshold (n=6725)†:
<0.001<0.0013.37 (3.03 to 3.74)Standardised UKCAT total score (SDs
<0.0012.07 (1.77 to 2.41)Academic attainment (standardised tariff score in SDs)
0.061.53 (0.99 to 2.38)Age >21 years
0.20.86 (0.66 to 1.10)English as second language
0.51.07 (0.90 to 1.28)Non-white ethnicity
—0.50.95 (0.83 to 1.09)Male sex
—0.70.97 (0.85 to 1.11)Attendance at state (non-grammar) school
—0.81.04 (0.74 to 1.46)Socioeconomic class 4 or 5‡
—0.0010.81 (0.71 to 0.92)Academic attainment-UKCAT score interaction
—0.020.72 (0.56 to 0.94)Academic attainment-age interaction
ICC=intraclass correlation. Average cluster size (UKCAT consortium applications per candidate): 1.4 for medical schools using borderline UKCAT score, 1.6 forthose using UKCAT score as a factor, and 1.3 for those using UKCAT score as a threshold.*Represents residual correlation of latent responses for observations within each applicant.†Number of applications rather than number of candidates.‡Office for National Statistics socioeconomic classification.
No commercial reuse: See rights and reprints http://www.bmj.com/permissions Subscribe: http://www.bmj.com/subscribe
BMJ 2012;344:e1805 doi: 10.1136/bmj.e1805 (Published 17 April 2012) Page 17 of 27
RESEARCH

Table 7| Results of multilevel multiple logistic regression analyses with outcome variable as conditional or unconditional offer of a placeto study medicine. Values are odds ratios (95% confidence intervals) unless stated otherwise
P valueUnconditional offer (23 107
applications, 8348 candidates)P valueConditional offer (22 285
applications, 8303 candidates)Predictor variables
<0.0013.56 (3.22 to 3.94)<0.0016.58 (5.86 to 7.61)Standardised UKCAT total score (SDs)
<0.0012.34 (2.07 to 2.64)<0.0011.85 (1.65 to 2.07)Academic attainment (standardised tariff scorein SDs)
<0.0010.86 (0.80 to 0.93)<0.0010.76 (0.70 to 0.84)Male sex
0.51.06 (0.90 to 1.25)0.90.99 (0.82 to 1.20)Non-white ethnicity
0.50.97 (0.85 to 1.12)0.50.95 (0.81 to 1.11)English as second language
<0.0011.78 (1.39 to 2.28)0.20.72 (0.42 to 1.21)Age >21 years
0.70.97 (0.85 to 1.12)0.81.02 (0.87 to 1.18)Attendance at state (non-grammar) school
0.030.79 (0.64 to 0.98)0.90.98 (0.67 to 1.42)Socioeconomic class 4 or 5*
Medical school group, according to UKCAT use:
0.0011.36 (1.13 to 1.64)0.11.16 (0.96 to 1.40)In borderline cases
<0.0011.44 (1.21 to 1.72)0.31.11 (0.91 to 1.34)As factor
NA1NA1Threshold use (base category)
<0.0010.37 (0.32 to 0.42)<0.0010.18 (0.16 to 0.22)UKCAT score-borderline use interaction
<0.0010.59 (0.52 to 0.67)<0.0010.39 (0.34 to 0.45)UKCAT score-factor use interaction
0.041.18 (1.01 to 1.39)<0.0011.39 (1.18 to 1.63)Academic achievement-borderline useinteraction
0.30.93 (0.81 to 1.06)0.011.22 (1.05 to 1.42)Academic achievement-factor use interaction
<0.0010.61 (0.49 to 0.77)<0.0010.62 (0.49 to 0.79)Non-white-borderline use interaction
<0.0010.65 (0.53 to 0.80)0.30.88 (0.71 to 1.10)Non-white- factor use interaction
NSNA0.032.21 (1.09 to 4.48)Age >21 years-borderline use interaction
NSNA0.0052.32 (1.29 to 4.18)Age >21 years-factor use interaction
0.0050.76 (0.62 to 0.92)0.0040.74 (0.60 to 0.90)School type-borderline use interaction
0.0060.78 (0.65 to 0.93)<0.0010.50 (0.41 to 0.61)School type-factor use interaction
NSNA0.020.52 (0.29 to 0.91)Socioeconomic class*-borderline use interaction
NSNA0.080.63 (0.37 to 1.06)Socioeconomic class*-factor use interaction
<0.0010.46 (0.49 to 0.65)<0.0010.52 (0.44 to 0.62)Academic attainment-age interaction
<0.0010.56 (0.43 to 0.72)0.0060.67 (0.50 to 0.89)UKCAT score-age interaction
NSNA0.011.19 (1.04 to 1.36)UKCAT score-non-white interaction
<0.0010.73 (0.49 to 0.65)NSNAAcademic attainment-UKCAT score interaction
NA=not applicable; NS=not significant. Only interaction terms that were significantly predictive of an offer at p<0.05 level are included in each model. Groupcomprising medical schools using UKCAT as threshold was base category.*Office for National Statistics socioeconomic classification.
No commercial reuse: See rights and reprints http://www.bmj.com/permissions Subscribe: http://www.bmj.com/subscribe
BMJ 2012;344:e1805 doi: 10.1136/bmj.e1805 (Published 17 April 2012) Page 18 of 27
RESEARCH

Table 8| Results of multilevel multiple logistic regression analyses with outcome variable conditional or unconditional offer of a place atmedical school. Values are odds ratios (95% confidence intervals) unless stated otherwise
P valueUnconditional offer (n=23 107applications, 8348 candidatesP value
Conditional offer (n=22 285applications, 8303 candidates)Predictor variable
<0.0012.11 (2.93 to 2.29)<0.0012.61 (2.36 to 2.90)Standardised UKCAT total score (SDs)
<0.0012.17 (1.94 to 2.42)<0.0012.26 (1.99 to 2.55)Academic attainment (standardised tariff scorein SDs)
<0.0010.86 (0.80 to 0.93)<0.0010.76 (0.70 to 0.84)Male sex
<0.0010.69 (0.60 to 0.80)0.10.87 (0.73 to 1.04)Non-white ethnicity
0.50.96 (0.83 to 1.10)0.50.95 (0.81 to 1.11)English as second language
<0.0011.78 (1.39 to 2.28)0.021.66 (1.10 to 2.49)Age >21 years
<0.0010.76 (0.67 to 0.85).<0.0010.51 (0.44 to 0.58)Attendance at state (non-grammar) school
0.030.79 (0.64 to 0.98)0.010.61 (0.42 to 0.91)Socioeconomic class 4 or 5*
Medical school group, according to UKCATuse:
0.50.95 (0.80 to 1.12)0.61.05 (0.87 to 1.25)In borderline cases
NA1NA1As factor (base category)
<0.0010.69 (0.58 to 0.83)0.30.90 (0.75 to 1.09)Threshold use
<0.0010.62 (0.56 to 0.70)<0.0010.47 (0.41 to 0.54)UKCAT score-borderline use interaction
<0.0011.69 (1.50 to 1.91)<0.0012.56 (2.20 to 2.96)UKCAT score-threshold use interaction
0.0011.28 (1.10 to 1.49)0.11.14 (0.96 to 1.34)Academic achievement-borderline useinteraction
0.31.08 (0.95 to 1.23)0.010.82 (0.70 to 0.95)Academic achievement-threshold useinteraction
0.60.94 (0.75 to 1.17)0.0030.71 (0.56 to 0.89)Non-white-borderline use interaction
<0.0011.53 (1.24 to 1.89)0.31.13 (0.91 to 1.42)Non-white-threshold use interaction
NSNA0.90.96 (0.50 to 1.82)Age-borderline use interaction
NSNA0.0050.43 (0.24 to 0.78)Age-threshold use interaction
0.80.98 (0.81 to 1.17)<0.0011.47 (1.21 to 1.80)School type-borderline use interaction
0.0061.29 (1.08 to 1.54)<0.0012.00 (1.64 to 2.44)School type-threshold use interaction
NSNA0.50.82 (0.46 to 1.47)Socioeconomic class*-borderline use interaction
NSNA0.081.59 (0.49 to 2.69)Socioeconomic class*-threshold use interaction
<0.0010.73 (0.68 to 0.79)NSNAAcademic attainment-UKCAT score interaction
<0.0010.56 (0.43 to 0.72)0.0060.67 (0.50 to 0.89)UKCAT score-age interaction
NSNA0.011.19 (1.04 to 1.36)UKCAT score-non-white interaction
<0.0010.56 (0.49 to 0.65)<0.0010.52 (0.44 to 0.62)Academic attainment-age interaction
NA=not applicable; NS=not significant. Only interaction terms that were significantly predictive of an offer at P<0.05 level are included in each respective model.Group comprising medical schools using UKCAT as factor was base category.*Office for National Statistics socioeconomic classification.
No commercial reuse: See rights and reprints http://www.bmj.com/permissions Subscribe: http://www.bmj.com/subscribe
BMJ 2012;344:e1805 doi: 10.1136/bmj.e1805 (Published 17 April 2012) Page 19 of 27
RESEARCH

Table 9| Sociodemographic and educational characteristics of medical school entrants according to type of medical school (use of UKclinical aptitude test (UKCAT)) to which they were admitted. Values are mean (SD) percentage of entrants from widening participationgroup unless stated otherwise
P value
Odds ratio (95%CI): threshold vborderline useP value
Odds ratio (95%CI): threshold v
factor useP value
Odds ratio (95%CI): factor v
borderline use
UKCAT asthreshold (7medical
UKCAT asfactor (9medical
UKCAT inborderlinecases (6
Wideningparticipationgroup (%missing)
schools, 1636entrants)
schools, 1793entrants)
medical school,1027 entrants)
<0.0011.55 (1.33 to1.82)
<0.0011.39 (1.21 to1.59)
0.21.12 (0.96 to1.31)
50.2 (4.9)41.2 (3.7)38.0 (6.6)Males (0%)
0.21.11 (0.93 to1.32)
0.11.13 (0.98 to1.31)
0.80.98 (0.83 to1.16)
32.3 (13.9)27.6 (16.9)31.0 (12.5)Non-white (1.4%)
0.060.80 (0.63 to1.01)
0.50.93 (0.75 to1.14)
0.20.86 (0.69 to1.08)
12.4 (4.8)12.7 (7.4)14.8 (4.4)English as secondlanguage (0.8%)
<0.0011.67 (1.32 to2.11)
0.71.03 (0.86 to1.23)
<0.0011.62 (1.28 to2.04)
18.4 (10.7)17.4 (12.2)11.4 (7.9)Age >21 years(0%)
0.0011.31 (1.12 to1.54)
<0.0011.46 (1.28 to1.68)
0.20.90 (0.77 to1.05)
61.2 (6.1)53.9 (13.1)53.5 (5.6)State school (0%)*
0.11.51 (0.90 to2.53)
0.21.28 (0.85 to1.94)
0.51.19 (0.70 to2.02)
4.4 (2.4)3.4 (1.7)2.8 (0.7)Lowsocioeconomicclass† (26.3%)
0.030.81 (0.66 to0.98)
<0.0012.23 (1.85 to2.79)
<0.0010.35 (0.28 to0.44)
22.6 (14.6)14.9 (12.9)29.3 (8.0)Low academicattainment‡(20.8%)
Proportions are percentage of number of total number of candidates for which data are available.*Excludes state funded grammar schools.†Non-professional socioeconomic background according to parental occupation; Office for National Statistics classification system used by Universities andColleges Admissions Service.‡Excludes resits, equivalent to ABB or below at A level or equivalent.
No commercial reuse: See rights and reprints http://www.bmj.com/permissions Subscribe: http://www.bmj.com/subscribe
BMJ 2012;344:e1805 doi: 10.1136/bmj.e1805 (Published 17 April 2012) Page 20 of 27
RESEARCH
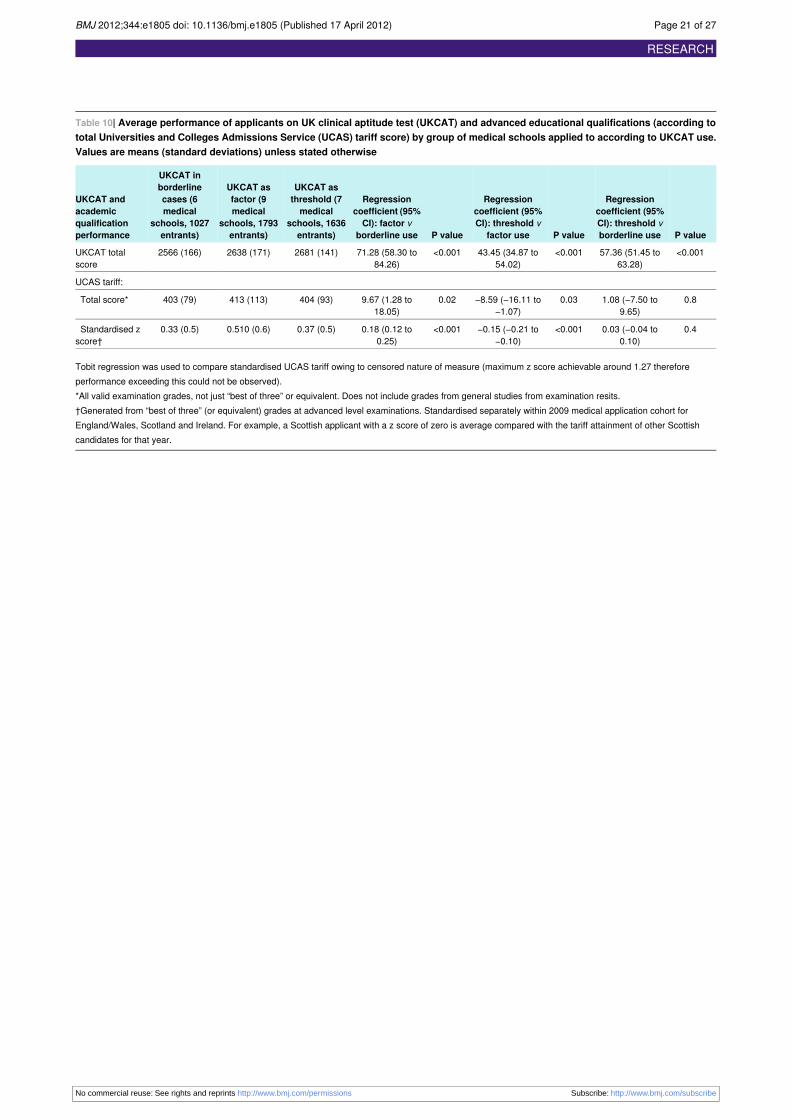
Table 10| Average performance of applicants on UK clinical aptitude test (UKCAT) and advanced educational qualifications (according tototal Universities and Colleges Admissions Service (UCAS) tariff score) by group of medical schools applied to according to UKCAT use.Values are means (standard deviations) unless stated otherwise
P value
Regressioncoefficient (95%
P value
Regressioncoefficient (95%
P value
Regressioncoefficient (95%
UKCAT asthreshold (7
UKCAT asfactor (9
UKCAT inborderline
UKCAT andacademic
CI): threshold vborderline use
CI): threshold vfactor use
CI): factor vborderline use
medicalschools, 1636entrants)
medicalschools, 1793entrants)
cases (6medical
schools, 1027entrants)
qualificationperformance
<0.00157.36 (51.45 to63.28)
<0.00143.45 (34.87 to54.02)
<0.00171.28 (58.30 to84.26)
2681 (141)2638 (171)2566 (166)UKCAT totalscore
UCAS tariff:
0.81.08 (−7.50 to9.65)
0.03−8.59 (−16.11 to−1.07)
0.029.67 (1.28 to18.05)
404 (93)413 (113)403 (79)Total score*
0.40.03 (−0.04 to0.10)
<0.001−0.15 (−0.21 to−0.10)
<0.0010.18 (0.12 to0.25)
0.37 (0.5)0.510 (0.6)0.33 (0.5)Standardised zscore†
Tobit regression was used to compare standardised UCAS tariff owing to censored nature of measure (maximum z score achievable around 1.27 thereforeperformance exceeding this could not be observed).*All valid examination grades, not just “best of three” or equivalent. Does not include grades from general studies from examination resits.†Generated from “best of three” (or equivalent) grades at advanced level examinations. Standardised separately within 2009 medical application cohort forEngland/Wales, Scotland and Ireland. For example, a Scottish applicant with a z score of zero is average compared with the tariff attainment of other Scottishcandidates for that year.
No commercial reuse: See rights and reprints http://www.bmj.com/permissions Subscribe: http://www.bmj.com/subscribe
BMJ 2012;344:e1805 doi: 10.1136/bmj.e1805 (Published 17 April 2012) Page 21 of 27
RESEARCH
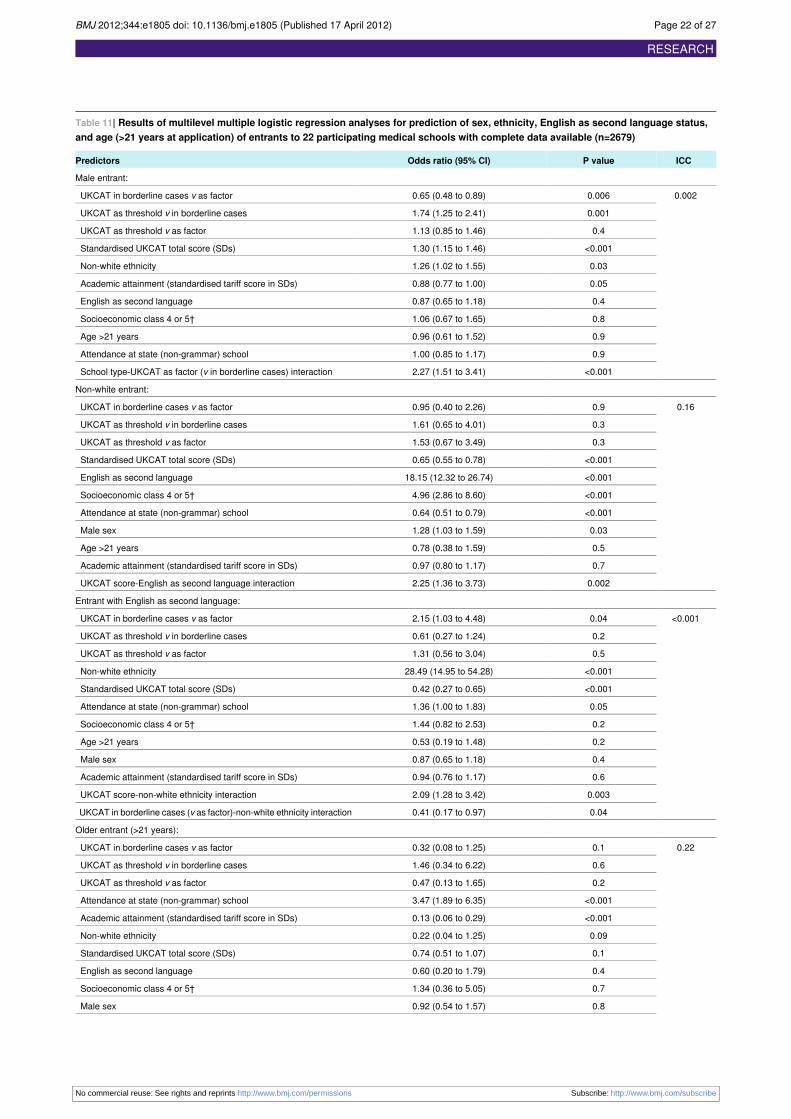
Table 11| Results of multilevel multiple logistic regression analyses for prediction of sex, ethnicity, English as second language status,and age (>21 years at application) of entrants to 22 participating medical schools with complete data available (n=2679)
ICCP valueOdds ratio (95% CI)Predictors
Male entrant:
0.0020.0060.65 (0.48 to 0.89)UKCAT in borderline cases v as factor
0.0011.74 (1.25 to 2.41)UKCAT as threshold v in borderline cases
0.41.13 (0.85 to 1.46)UKCAT as threshold v as factor
<0.0011.30 (1.15 to 1.46)Standardised UKCAT total score (SDs)
0.031.26 (1.02 to 1.55)Non-white ethnicity
0.050.88 (0.77 to 1.00)Academic attainment (standardised tariff score in SDs)
0.40.87 (0.65 to 1.18)English as second language
0.81.06 (0.67 to 1.65)Socioeconomic class 4 or 5†
0.90.96 (0.61 to 1.52)Age >21 years
0.91.00 (0.85 to 1.17)Attendance at state (non-grammar) school
<0.0012.27 (1.51 to 3.41)School type-UKCAT as factor (v in borderline cases) interaction
Non-white entrant:
0.160.90.95 (0.40 to 2.26)UKCAT in borderline cases v as factor
0.31.61 (0.65 to 4.01)UKCAT as threshold v in borderline cases
0.31.53 (0.67 to 3.49)UKCAT as threshold v as factor
<0.0010.65 (0.55 to 0.78)Standardised UKCAT total score (SDs)
<0.00118.15 (12.32 to 26.74)English as second language
<0.0014.96 (2.86 to 8.60)Socioeconomic class 4 or 5†
<0.0010.64 (0.51 to 0.79)Attendance at state (non-grammar) school
0.031.28 (1.03 to 1.59)Male sex
0.50.78 (0.38 to 1.59)Age >21 years
0.70.97 (0.80 to 1.17)Academic attainment (standardised tariff score in SDs)
0.0022.25 (1.36 to 3.73)UKCAT score-English as second language interaction
Entrant with English as second language:
<0.0010.042.15 (1.03 to 4.48)UKCAT in borderline cases v as factor
0.20.61 (0.27 to 1.24)UKCAT as threshold v in borderline cases
0.51.31 (0.56 to 3.04)UKCAT as threshold v as factor
<0.00128.49 (14.95 to 54.28)Non-white ethnicity
<0.0010.42 (0.27 to 0.65)Standardised UKCAT total score (SDs)
0.051.36 (1.00 to 1.83)Attendance at state (non-grammar) school
0.21.44 (0.82 to 2.53)Socioeconomic class 4 or 5†
0.20.53 (0.19 to 1.48)Age >21 years
0.40.87 (0.65 to 1.18)Male sex
0.60.94 (0.76 to 1.17)Academic attainment (standardised tariff score in SDs)
0.0032.09 (1.28 to 3.42)UKCAT score-non-white ethnicity interaction
0.040.41 (0.17 to 0.97)UKCAT in borderline cases (v as factor)-non-white ethnicity interaction
Older entrant (>21 years):
0.220.10.32 (0.08 to 1.25)UKCAT in borderline cases v as factor
0.61.46 (0.34 to 6.22)UKCAT as threshold v in borderline cases
0.20.47 (0.13 to 1.65)UKCAT as threshold v as factor
<0.0013.47 (1.89 to 6.35)Attendance at state (non-grammar) school
<0.0010.13 (0.06 to 0.29)Academic attainment (standardised tariff score in SDs)
0.090.22 (0.04 to 1.25)Non-white ethnicity
0.10.74 (0.51 to 1.07)Standardised UKCAT total score (SDs)
0.40.60 (0.20 to 1.79)English as second language
0.71.34 (0.36 to 5.05)Socioeconomic class 4 or 5†
0.80.92 (0.54 to 1.57)Male sex
No commercial reuse: See rights and reprints http://www.bmj.com/permissions Subscribe: http://www.bmj.com/subscribe
BMJ 2012;344:e1805 doi: 10.1136/bmj.e1805 (Published 17 April 2012) Page 22 of 27
RESEARCH

Table 11 (continued)
ICCP valueOdds ratio (95% CI)Predictors
0.0023.94 (1.67 to 9.29)UKCAT in borderline case (v as factor)-academic attainment interaction
0.012.77 (1.25 to 6.11)UKCAT as threshold (v as factor)-academic attainment interaction
0.048.77 (1.12 to 68.71)UKCAT in borderline cases (v as factor)-non-white ethnicity interaction
<0.0016.25 (2.54 to 15.41)Academic attainment-English as second language
0.0040.40 (0.22 to 0.75)Academic attainment-school type interaction
ICC=intraclass correlation; UKCAT=UK clinical aptitude test. Baseline category was group of medical schools using UKCAT score as a factor in admissionsprocess, unless stated otherwise.*Represents residual correlation of latent responses within each university.†Office for National Statistics socioeconomic classification.
No commercial reuse: See rights and reprints http://www.bmj.com/permissions Subscribe: http://www.bmj.com/subscribe
BMJ 2012;344:e1805 doi: 10.1136/bmj.e1805 (Published 17 April 2012) Page 23 of 27
RESEARCH
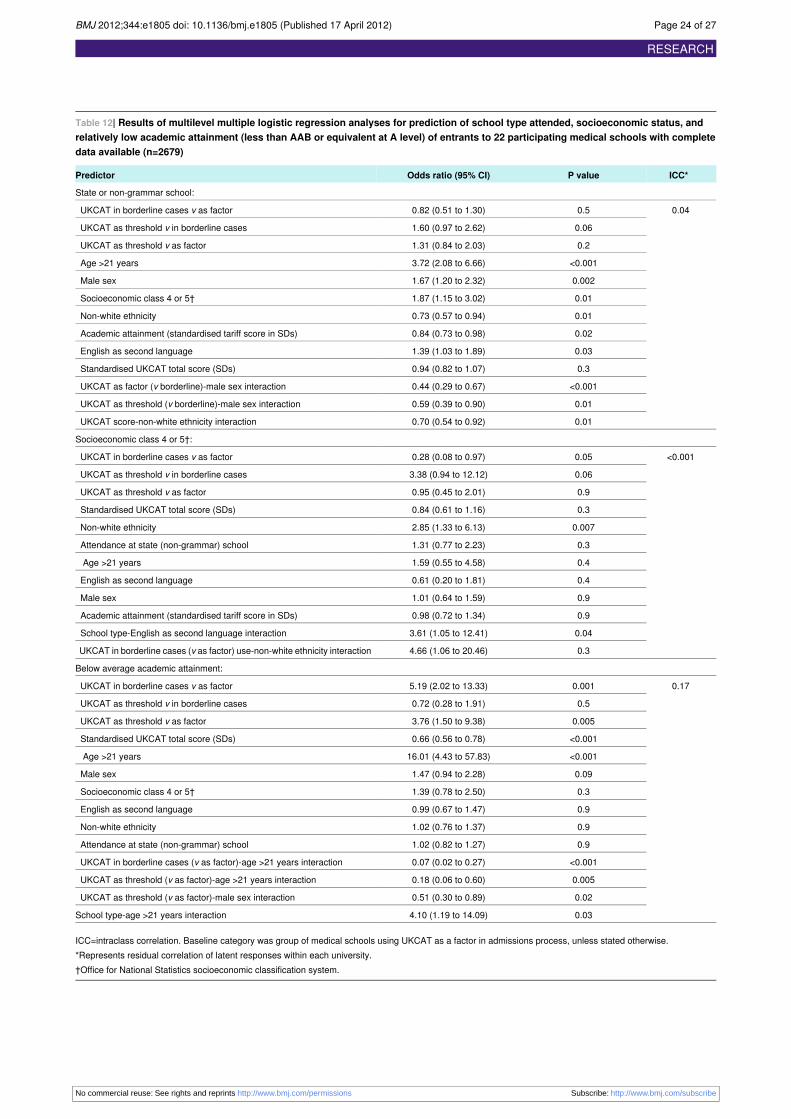
Table 12| Results of multilevel multiple logistic regression analyses for prediction of school type attended, socioeconomic status, andrelatively low academic attainment (less than AAB or equivalent at A level) of entrants to 22 participating medical schools with completedata available (n=2679)
ICC*P valueOdds ratio (95% CI)Predictor
State or non-grammar school:
0.040.50.82 (0.51 to 1.30)UKCAT in borderline cases v as factor
0.061.60 (0.97 to 2.62)UKCAT as threshold v in borderline cases
0.21.31 (0.84 to 2.03)UKCAT as threshold v as factor
<0.0013.72 (2.08 to 6.66)Age >21 years
0.0021.67 (1.20 to 2.32)Male sex
0.011.87 (1.15 to 3.02)Socioeconomic class 4 or 5†
0.010.73 (0.57 to 0.94)Non-white ethnicity
0.020.84 (0.73 to 0.98)Academic attainment (standardised tariff score in SDs)
0.031.39 (1.03 to 1.89)English as second language
0.30.94 (0.82 to 1.07)Standardised UKCAT total score (SDs)
<0.0010.44 (0.29 to 0.67)UKCAT as factor (v borderline)-male sex interaction
0.010.59 (0.39 to 0.90)UKCAT as threshold (v borderline)-male sex interaction
0.010.70 (0.54 to 0.92)UKCAT score-non-white ethnicity interaction
Socioeconomic class 4 or 5†:
<0.0010.050.28 (0.08 to 0.97)UKCAT in borderline cases v as factor
0.063.38 (0.94 to 12.12)UKCAT as threshold v in borderline cases
0.90.95 (0.45 to 2.01)UKCAT as threshold v as factor
0.30.84 (0.61 to 1.16)Standardised UKCAT total score (SDs)
0.0072.85 (1.33 to 6.13)Non-white ethnicity
0.31.31 (0.77 to 2.23)Attendance at state (non-grammar) school
0.41.59 (0.55 to 4.58)Age >21 years
0.40.61 (0.20 to 1.81)English as second language
0.91.01 (0.64 to 1.59)Male sex
0.90.98 (0.72 to 1.34)Academic attainment (standardised tariff score in SDs)
0.043.61 (1.05 to 12.41)School type-English as second language interaction
0.34.66 (1.06 to 20.46)UKCAT in borderline cases (v as factor) use-non-white ethnicity interaction
Below average academic attainment:
0.170.0015.19 (2.02 to 13.33)UKCAT in borderline cases v as factor
0.50.72 (0.28 to 1.91)UKCAT as threshold v in borderline cases
0.0053.76 (1.50 to 9.38)UKCAT as threshold v as factor
<0.0010.66 (0.56 to 0.78)Standardised UKCAT total score (SDs)
<0.00116.01 (4.43 to 57.83)Age >21 years
0.091.47 (0.94 to 2.28)Male sex
0.31.39 (0.78 to 2.50)Socioeconomic class 4 or 5†
0.90.99 (0.67 to 1.47)English as second language
0.91.02 (0.76 to 1.37)Non-white ethnicity
0.91.02 (0.82 to 1.27)Attendance at state (non-grammar) school
<0.0010.07 (0.02 to 0.27)UKCAT in borderline cases (v as factor)-age >21 years interaction
0.0050.18 (0.06 to 0.60)UKCAT as threshold (v as factor)-age >21 years interaction
0.020.51 (0.30 to 0.89)UKCAT as threshold (v as factor)-male sex interaction
0.034.10 (1.19 to 14.09)School type-age >21 years interaction
ICC=intraclass correlation. Baseline category was group of medical schools using UKCAT as a factor in admissions process, unless stated otherwise.*Represents residual correlation of latent responses within each university.†Office for National Statistics socioeconomic classification system.
No commercial reuse: See rights and reprints http://www.bmj.com/permissions Subscribe: http://www.bmj.com/subscribe
BMJ 2012;344:e1805 doi: 10.1136/bmj.e1805 (Published 17 April 2012) Page 24 of 27
RESEARCH
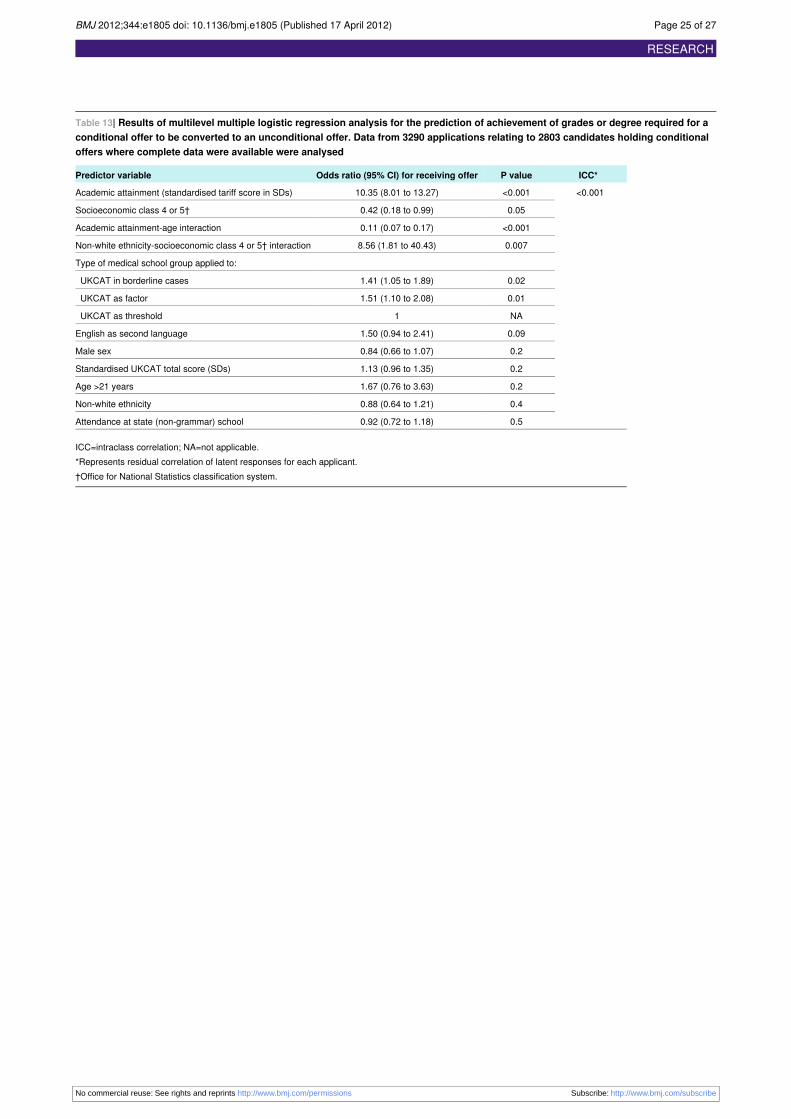
Table 13| Results of multilevel multiple logistic regression analysis for the prediction of achievement of grades or degree required for aconditional offer to be converted to an unconditional offer. Data from 3290 applications relating to 2803 candidates holding conditionaloffers where complete data were available were analysed
ICC*P valueOdds ratio (95% CI) for receiving offerPredictor variable
<0.001<0.00110.35 (8.01 to 13.27)Academic attainment (standardised tariff score in SDs)
0.050.42 (0.18 to 0.99)Socioeconomic class 4 or 5†
<0.0010.11 (0.07 to 0.17)Academic attainment-age interaction
0.0078.56 (1.81 to 40.43)Non-white ethnicity-socioeconomic class 4 or 5† interaction
Type of medical school group applied to:
0.021.41 (1.05 to 1.89)UKCAT in borderline cases
0.011.51 (1.10 to 2.08)UKCAT as factor
NA1UKCAT as threshold
0.091.50 (0.94 to 2.41)English as second language
0.20.84 (0.66 to 1.07)Male sex
0.21.13 (0.96 to 1.35)Standardised UKCAT total score (SDs)
0.21.67 (0.76 to 3.63)Age >21 years
0.40.88 (0.64 to 1.21)Non-white ethnicity
0.50.92 (0.72 to 1.18)Attendance at state (non-grammar) school
ICC=intraclass correlation; NA=not applicable.*Represents residual correlation of latent responses for each applicant.†Office for National Statistics classification system.
No commercial reuse: See rights and reprints http://www.bmj.com/permissions Subscribe: http://www.bmj.com/subscribe
BMJ 2012;344:e1805 doi: 10.1136/bmj.e1805 (Published 17 April 2012) Page 25 of 27
RESEARCH
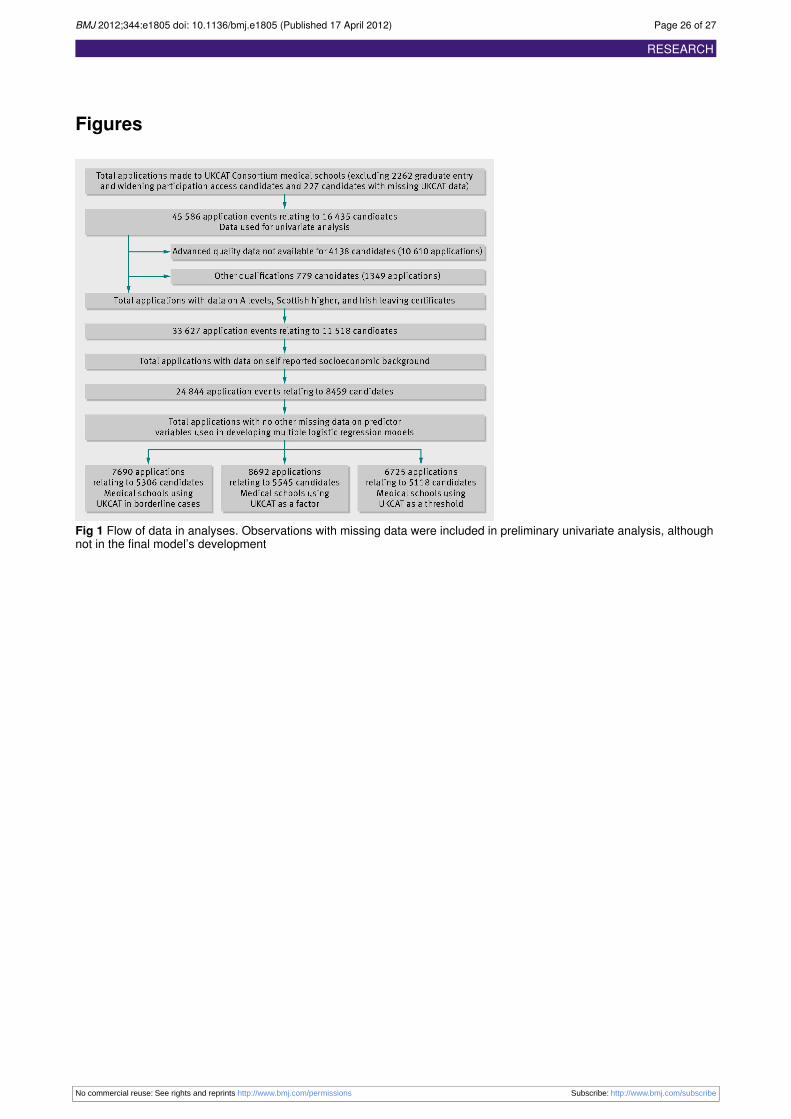
Figures
Fig 1 Flow of data in analyses. Observations with missing data were included in preliminary univariate analysis, althoughnot in the final model’s development
No commercial reuse: See rights and reprints http://www.bmj.com/permissions Subscribe: http://www.bmj.com/subscribe
BMJ 2012;344:e1805 doi: 10.1136/bmj.e1805 (Published 17 April 2012) Page 26 of 27
RESEARCH
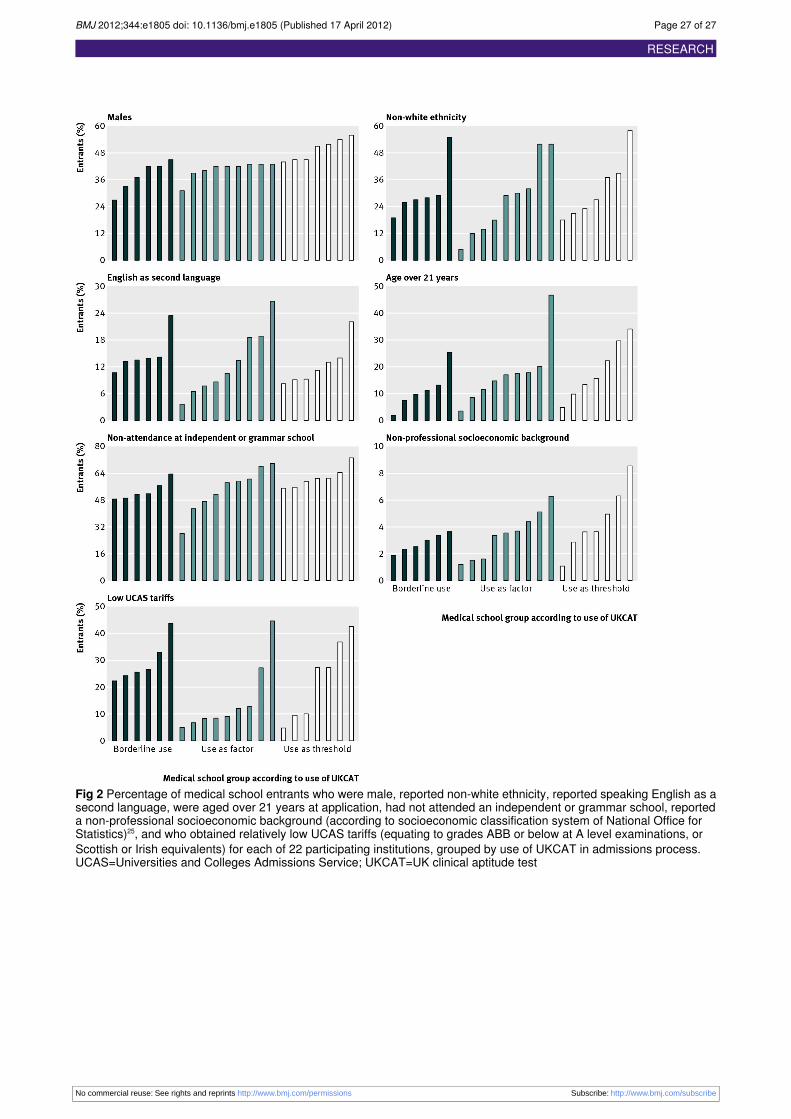
Fig 2 Percentage of medical school entrants who were male, reported non-white ethnicity, reported speaking English as asecond language, were aged over 21 years at application, had not attended an independent or grammar school, reporteda non-professional socioeconomic background (according to socioeconomic classification system of National Office forStatistics)25, and who obtained relatively low UCAS tariffs (equating to grades ABB or below at A level examinations, orScottish or Irish equivalents) for each of 22 participating institutions, grouped by use of UKCAT in admissions process.UCAS=Universities and Colleges Admissions Service; UKCAT=UK clinical aptitude test
No commercial reuse: See rights and reprints http://www.bmj.com/permissions Subscribe: http://www.bmj.com/subscribe
BMJ 2012;344:e1805 doi: 10.1136/bmj.e1805 (Published 17 April 2012) Page 27 of 27
RESEARCH