article in press - ben van der pluijm · finite strain ellipsoid, as described by ramsay (1981) in...
TRANSCRIPT

Magnetic fabrics and strain in pencil structures of the Knobs Formation,
Valley and Ridge Province, US Appalachians
Josep M. Pares*, Ben A. van der Pluijm
Department of Geological Sciences, University of Michigan, 2534 C.C. Little Building, Ann Arbor, MI 48109-1063, USA
Received 29 July 2002; received in revised form 10 October 2002; accepted 18 October 2002
Abstract
Pencil structures, which are found in weakly deformed mudrocks, reflect the bedding–cleavage intersection in weak- to moderately-
cleaved rocks. Their presence indicates conditions where bedding and cleavage fabrics are approximately equal in intensity. We have
determined the anisotropy of magnetic susceptibility (AMS) in pencil structures from a sequence of mudstones of the Ordovician Knobs
Formation in the Valley and Ridge Province of the US Appalachians. Magnetic mineralogy was determined by X-ray analysis and low-
temperature susceptibility measurements. Distribution of the magnetic ellipsoid axes is consistent with the incipient tectonic fabric of the
pencil mudstones. The maximum susceptibility axes parallel the pencils’ long axes, while the minimum axes of susceptibility are normal to
the primary sedimentary fabric. Independent strain quantification permits a correlation between magnetic fabric and tectonic strain. An
exponential relationship between the AMS shape parameter T and tectonic shortening has been found for the interval of 10–25% shortening:
shortening(%) ¼ 17 p exp(T). This relationship appears to be supported by tectonic strains up to 40%. The T parameter (T ¼ [lnF 2
lnL ]/[lnL þ lnF ]; where L, lineation is Kmax/Kint and F, foliation is Kint/Kmin) describes the shape of the magnetic susceptibility ellipsoid,
which appears more sensitive to strain than past correlation attempts with the magnetic intensity parameter P (or P0). Whereas this correlation
between strain and AMS is only valid within a restricted window of strain (10–40% shortening), it establishes the magnitude and directions
of tectonic strain in weakly deformed clay-rich rocks, where strain indicators are otherwise lacking or are poorly developed.
q 2003 Published by Elsevier Science Ltd.
Keywords: Pencil structures; Magnetic fabrics; Anisotropy of magnetic susceptibility (AMS); Appalachian Fold-and-Thrust Belt
1. Introduction
The potential of magnetic anisotropy as a strain gage in
deformed rocks has been recognized for many years.
Increasingly detailed studies that investigate the link
between strain and magnetic fabrics reflect both a better
understanding of the origin of magnetic anisotropy in rocks
and using more versatile and sensitive instrumentation and
approaches (such as high-field and low-temperature anal-
ysis; McCabe et al., 1985; Jackson, 1991; Richter and van
der Pluijm, 1994; Borradaile and Henry, 1997; Pares and
van der Pluijm, 2003). Anisotropy of remanence and
anisotropy of susceptibility have both been used to
characterize strain in rocks; the latter is most suitable for
sensing preferred orientation of iron sheet silicates, in
addition to ferromagnetic grains. Deformation environments
from low to very high strain have been studied, as well as
seemingly undeformed rocks (Goldstein, 1980; Kligfield
et al., 1981; Rathore et al., 1983; Siddans et al., 1984; Cogne
and Perroud, 1988; Aubourg et al., 1991; Hirt et al., 1993;
Sagnotti and Speranza, 1993; Averbuch et al., 1995; Housen
et al., 1995; Aranguren et al., 1996; Borradaile and Henry,
1997 and references therein; Saint-Blanquat and Tikoff,
1997; Luneburg et al., 1999; Pares and van der Pluijm,
2002). In most strain environments, the AMS axes
orientation shows a good correlation with the principal
strain directions (see reviews by Hrouda, 1982; Borradaile,
1987, 1988, 1991; Tarling and Hrouda, 1993; Borradaile
and Henry, 1997), making magnetic anisotropy a rapid and
powerful tool to structural analysis. When a tectonic
foliation is present, the principal magnetic susceptibility
directions parallel the flattening plane of the finite-strain
ellipsoid, with the minimum susceptibility perpendicular to
foliation and the maximum susceptibility typically parallel
to the tectonic extension direction or to the intersection of
0191-8141/03/$ - see front matter q 2003 Published by Elsevier Science Ltd.
PII: S0 19 1 -8 14 1 (0 2) 00 1 97 -9
Journal of Structural Geology xx (0000) 1–10
www.elsevier.com/locate/jsg
* Corresponding author.
E-mail address: [email protected] (J.M. Pares).
SG 1364—24/1/2003—13:26—GLIGHTFOOT—60712— MODEL 5 – br,ed
ARTICLE IN PRESS

bedding and cleavage (Singh et al., 1975; Coward and
Whalley, 1979; Kligfield et al., 1981; Hrouda, 1982;
Borradaile, 1987; Borradaile and Henry, 1997; Pares and
van der Pluijm, 2002). The magnitude of magnetic fabrics is
more complexly related to finite strain, but information
about this critical linkage improves by studying specific
deformation environments. In particular the transition from
compaction fabrics to tectonic fabrics shows large changes
(e.g. Housen et al., 1993) and has to be understood for
reliable applications of magnetic analysis to deformed
rocks. This study targets mudrocks in this low-strain realm,
which are characterized in the field by the occurrence of
pencil structures.
Among more significant realizations has been that AMS
tracks the finite-strain ellipsoid orientation in moderate to
strongly deformed rocks, but also in very weakly deformed
rocks, where penetrative tectonic fabrics are seemingly absent.
Yet, the magnetic ellipsoid orientation parallels mesoscale
structures, like regional folds axes. For example, Kissel et al.
(1986) investigated marine Cenozoic clays in Greece, and
observed a magnetic lineation that is characterized by a cluster
of the maximum susceptibility directions Kmax parallel to fold
axes. Grouping of Kmax under progressive deformation has
been observed in following studies, and is occasionally
accompanied by a girdle containing Kmin and Kint axes, which
is thought to be the first evidence for layer parallel shortening
in sedimentary rocks, as noted by Sagnotti and Speranza
(1993), Pares and Dinares-Turell (1993), Sagnotti et al. (1994)
and Pares et al. (1999) in sequences from low to moderately
deformed mudstones.
Pencil structures are representative of a deformation
environment where two competing anisotropies, bedding
and cleavage, are approximately equal in magnitude. This
represents the region of the greatest change in fabric
measurements (e.g. Borradaile and Tarling, 1981; Borra-
daile, 1988; Housen and van der Pluijm, 1990, 1991) and
therefore offer a special opportunity to understand the
properties of incipient magnetic fabrics and their tectonic
strain significance. This study examines the AMS of pencil
structures in mudrocks of the Knobs Formation, SW
Appalachians, which were previously studied by Reks and
Gray (1982), and offers a correlation with strain in this low
deformation regime.
2. Pencil structures
Weakly deformed mudrocks can break into long narrow
strips that are rhombohedral in cross-sections. The pencil
structures, as originally described by Cloos (1957), are
enhanced by weathering and typically reflects a bedding–
cleavage intersection fabric. Durney and Kisch (1994)
recognize two different types of pencil structures, depending
on their long axes orientation relative to the strain axes.
Pencils can develop parallel to the extension direction of the
finite strain ellipsoid, as described by Ramsay (1981) in the
Swiss Alps, where they also coincide with the bedding and
cleavage intersection (see also Ramsay and Huber, 1983). A
second type of pencils are described by Engelder and Geiser
(1979), Reks and Gray (1982) and Nickelsen (1986), as
elongated rock fragments defined by intersecting fracture
sets subparallel to pre-existing bedding fissility and
cleavage, and to the inferred Y-axis of the strain ellipsoid.
In all cases the pencil structure is related to weak strain and,
in a sequence of fabric development in mudrocks, pencil
structures represent the ‘early deformation stage’ that
predates the ‘embryonic cleavage stage’ of Ramsay and
Huber (1983). A corollary is that pencil structure represents
a stage where mineral reorientation or new mineral growth
is sufficient to produce a second mechanical anisotropy to
the rock, yet maintaining a primary fabric, so that the rock
will tend to break into elongate fragments.
3. Geologic setting
The western portion of the Appalachian orogen in the
Valley and Ridge Province constitutes the southern
Appalachian foreland fold-and-thrust belt (Wood and
Bergin, 1970; Kulander and Dean, 1986; Hatcher et al.,
1989). The Pulaski thrust sheet of southwestern Virginia is
one of the major thrusts in the area and comprises northeast-
trending folds and faults (Fig. 1). To the southeast it is
bounded by the Blue Ridge Province. Folds are symmetric
to slightly overturned and have strike lengths of 6–30 km
and half wavelengths of 1–3 km (Reks, 1981). Exposed
formations in the study area include the Early Cambrian to
Middle Ordovician Knobs Formation that is made up of
weakly deformed mudstones and siltstones. Most of the
sampled outcrops exhibit well developed pencil-like frag-
ments, characterized by two sets of parallel surfaces that
intersect at high angles, corresponding to bedding and
cleavage (Reks and Gray, 1982) (Fig. 2). A subhorizontal
set is parallel to bedding, and a second, steeply-dipping set,
which is less well visible, is parallel to regional cleavage.
Pencil structures vary in shape, producing a spectrum of
pencil types ranging in length from 20 to 140 mm (Reks,
1981). Reks and Gray (1982) showed that with increasing
strain, as determined from pressure fringes, fabric changes
in the mudrock produce higher length/width ratios, meaning
that pencil geometry is strain dependent. Pencil shape is
specified by the length (l) and width (w) ratios of fragments
measured in the bedding plane. On the basis of this
scheme, the intensity of pencil structure has been subdivided
as weak (l/w , 13), moderate (13 , l/w , 19) and strong
(l/w . 19) (Reks and Gray, 1982).
4. Methods
We sampled mudrocks of the Knobs formation at 20
different localities, of which 18 gave consistent results
(Table 1), matching as many sites as possible to the same
SG 1364—24/1/2003—13:26—GLIGHTFOOT—60712— MODEL 5 – br,ed
J.M. Pares, B.A. van der Pluijm / Journal of Structural Geology xx (0000) 1–102
ARTICLE IN PRESS

Fig. 1. Geological setting (modified from Reks and Gray, 1982) showing sampling localities for this study.
Table 1
Summary of the anisotropy of magnetic susceptibility results. Symbols: t—eigenvalues, s—standard deviation, Dec/Inc—declination/inclination
Site Eigenvector 1 Eigenvector 2 Eigenvector 3
t s Dec Inc t s Dec Inc t s Dec Inc
VA1 0.34405 0.00092 250.9 15.4 0.34022 0.00086 351.9 34.6 0.31573 0.0017 140.9 51.1
VA2 0.34404 0.00039 85 5.1 0.33552 0.00037 178.7 36.3 0.32043 0.00052 348.1 53.2
VA3 0.34127 0.00047 249 4 0.33731 0.00037 157.3 23.1 0.32141 0.0003 348.2 66.5
VA4 0.34263 0.00081 65.4 6 0.33046 0.00043 163.5 53.1 0.32691 0.00099 331 36.2
VA5 0.34603 0.00022 240.1 7.8 0.33193 0.00041 64 82.1 0.32204 0.00041 330.1 0.5
VA7 0.34548 0.00023 71.9 13.1 0.34049 0.00017 174.2 42.6 0.31403 0.00039 328.7 44.5
VA8 0.34402 0.00079 58 1.4 0.33948 0.00057 149.1 37.7 0.3165 0.00059 326.2 52.3
VA9 0.34562 0.00082 61.1 14.3 0.33498 0.00071 163.8 40.7 0.3194 0.00136 315.9 45.8
VA10 0.34595 0.00105 57.8 13.1 0.33519 0.00091 294.6 67 0.31887 0.00196 152.2 18.6
VA11 0.34653 0.00087 57.8 18.7 0.33189 0.0011 317.5 27.9 0.32158 0.00194 177.3 55.4
VA12 0.34418 0.00037 57.4 10 0.3323 0.00021 174.1 68.5 0.32352 0.00041 324 18.8
VA13 0.34752 0.00024 61.2 6.3 0.33523 0.00043 155.3 33.1 0.31725 0.00065 321.7 56.2
VA14 0.34419 0.00062 244.5 6.4 0.33283 0.00105 359.7 75.3 0.32298 0.00164 153 13.2
VA15 0.34809 0.00062 54.3 2.9 0.33543 0.00041 150.5 64.7 0.31648 0.00103 322.9 25.2
VA16 0.34503 0.00065 66.2 5 0.33658 0.00084 159.1 30.7 0.31839 0.00149 327.9 58.8
VA17 0.34388 0.00066 255.4 25.3 0.33873 0.00031 22 51.6 0.31739 0.00093 151.6 26.8
VA18 0.34087 0.00138 59.5 18.2 0.33491 0.00057 283.8 65.4 0.32422 0.00101 154.9 16.1
VA20 0.34795 0.00043 235.5 8.4 0.33874 0.00037 330.7 31.7 0.31332 0.00068 132.4 57
SG 1364—24/1/2003—13:26—GLIGHTFOOT—60712— MODEL 5 – br,ed
J.M. Pares, B.A. van der Pluijm / Journal of Structural Geology xx (0000) 1–10 3
ARTICLE IN PRESS

localities studied by Reks and Gray (1982). Oriented hand
samples were collected in the field at each locality,
producing 5–12 specimens per site. Because of their
fissility, hand samples were impregnated in the laboratory
with resin before drilling cores for magnetic analysis.
All AMS measurements were carried out with a
Kappabridge KLY-2.03 susceptibility bridge (Geofyzika
Brno), using the 15 directional susceptibilities scheme by
Jelinek (1978), on a frequency of 920 Hz (sensitivity of
the coil is ,5 £ 1027 SI). AMS data analysis is
performed by linear perturbation analysis (LPA, Tauxe,
1998), following the method initially developed by
Constable and Tauxe (1990) for statistical bootstrapping
of anisotropy data in order to obtain the confidence
ellipses. First, the matrix elements and residual errors for
each individual sample are calculated using 15 measure-
ments. Then, the bootstrap statistics for the matrix
elements are calculated. Rather than a one-to-one
comparison of the magnetic ellipsoid mean axes with
structural elements, it is more meaningful to use the
orientation distributions (Borradaile, 2001). Instead of
plotting the 95% confidence ellipses to visualize the
orientation distributions, which also all require unnecess-
ary parametric assumptions (Tauxe, 1998), we display the
bootstrap eigenvectors on a stereonet as a smear of
points around the eigenparameters. Confidence regions
for the bootstrapped distributions can be drawn as a
contour line enclosing 95% of the bootstrapped eigen-
vectors. Details on the statistical method can be found in
Tauxe (1998). The data for individual sites are listed in
Table 1, including the values for the principal, major and
minor eigenvectors.
Critical for AMS analysis is determination of the
magnetic carrier that is responsible for magnetic suscepti-
bility, and specifically to determine whether the AMS tensor
is due to paramagnetic phases (mostly phyllosilicates in
mudrocks) or to ferromagnetic minerals (mostly magnetite).
To determine the dominant phase for magnetic suscepti-
bility, we apply a modified approach outlined by Richter and
van der Pluijm (1994), which allows the distinguishing of
the ferromagnetic and paramagnetic susceptibility contri-
butions. A representative result is shown in Fig. 3a. The
steady increase in magnetic susceptibility from low (77 K) to
room temperature is indicative of paramagnetic dominance
of the bulk susceptibility. A set of samples has also been
Fig. 2. Outcrop morphology of pencils in the Knobs Formation, SW
Virginia. (a) Photograph approximately perpendicular to bedding showing
two sets of intersecting surfaces. (b) Outcrop showing pencil development
of moderate intensity.
Fig. 3. (a) Temperature dependence of low-field susceptibility for a
representative sample of Knobs Formation, based on the procedure of
Richter and van der Pluijm (1994). K0/K is the normalized reciprocal
magnetic susceptibility (reading temperature during warming up versus
ambient temperature, 290 K). The increase of the reciprocal susceptibility
between 90 and 290 K indicates that samples are dominated by
paramagnetic minerals. (b) Comparison of magnetic susceptibility
measured at 77 and 290 K temperature. The K77/K290 ratio is 3.7, which
indicates that phyllosilicates dominate the magnetic susceptibility tensor.
SG 1364—24/1/2003—13:26—GLIGHTFOOT—60712— MODEL 5 – br,ed
J.M. Pares, B.A. van der Pluijm / Journal of Structural Geology xx (0000) 1–104
ARTICLE IN PRESS

measured at both 290 and 77 K to determine the ratio of
bulk susceptibility at room temperature and at liquid
nitrogen temperature (K290/K77). This ratio should theoreti-
cally be around 3.7, as seen in these samples (Fig. 2b).
Representative samples have been analyzed with X-ray
diffraction and demonstrate that phyllosilicates are present
in these mudrocks, with chlorite and illite as the major
components, and some traces of kaolinite. Combined, low-
temperature susceptibility analysis (Fig. 3) and XRD
suggest that magnetic susceptibility resides dominantly in
phyllosilicates and specifically in chlorite and illite. The
pattern of AMS axes can hence be interpreted as a preferred
orientation of these iron sheet silicates.
5. Relation of magnetic fabrics to pencil structures
Fig. 4 summarizes the orientation data of some
representative sites of the Knobs Fm. in the study area.
The maximum axis of the magnetic ellipsoid is parallel to
the orientation of the pencil structures’ long axes in the
mudrocks. Specifically, pencil structures in all studied sites
determine the orientation of the maximum susceptibility
axes by a Kmax cluster (magnetic lineation) whose mean
direction coincides with the orientation of the long axes of
the pencil fragments. Magnetic lineations and pencil
structures both trend NE–SW and are horizontal to very
shallowly plunging. An additional feature of the axes
distribution is the relation of bedding to the magnetic fabric.
In all studied cases, the minimum axes of susceptibility,
Kmin, coincide with the pole to local bedding. The magnetic
ellipsoid orientation hence reflects a composite fabric where
traces of bedding are present (Kmin perpendicular to
bedding), but a tectonic imprint is also evident (Kmax
parallel to pencil long axis). Distribution of Kmin axes
perpendicular to bedding in slightly deformed rocks has
previously been observed in other weakly deformed
mudstones (e.g. Kissel et al., 1986; Sagnotti and Speranza,
1993; Sagnotti et al., 1994; Pares et al., 1999). All these
studies highlight that the first evidence for layer parallel
shortening in mudrocks is recognized in the grouping of
Kmax axes perpendicular to the tectonic shortening direction
while maintaining Kmin axes perpendicular to bedding (see
Fig. 4). Further, models by Housen et al. (1993) illustrate
that when two planar mineral fabrics contribute to the mean
AMS tensor, the intersection of these two sub-fabrics will
control the orientation of the Kmax direction in agreement
with naturally deformed rocks (e.g. Borradaile and Tarling,
1981).
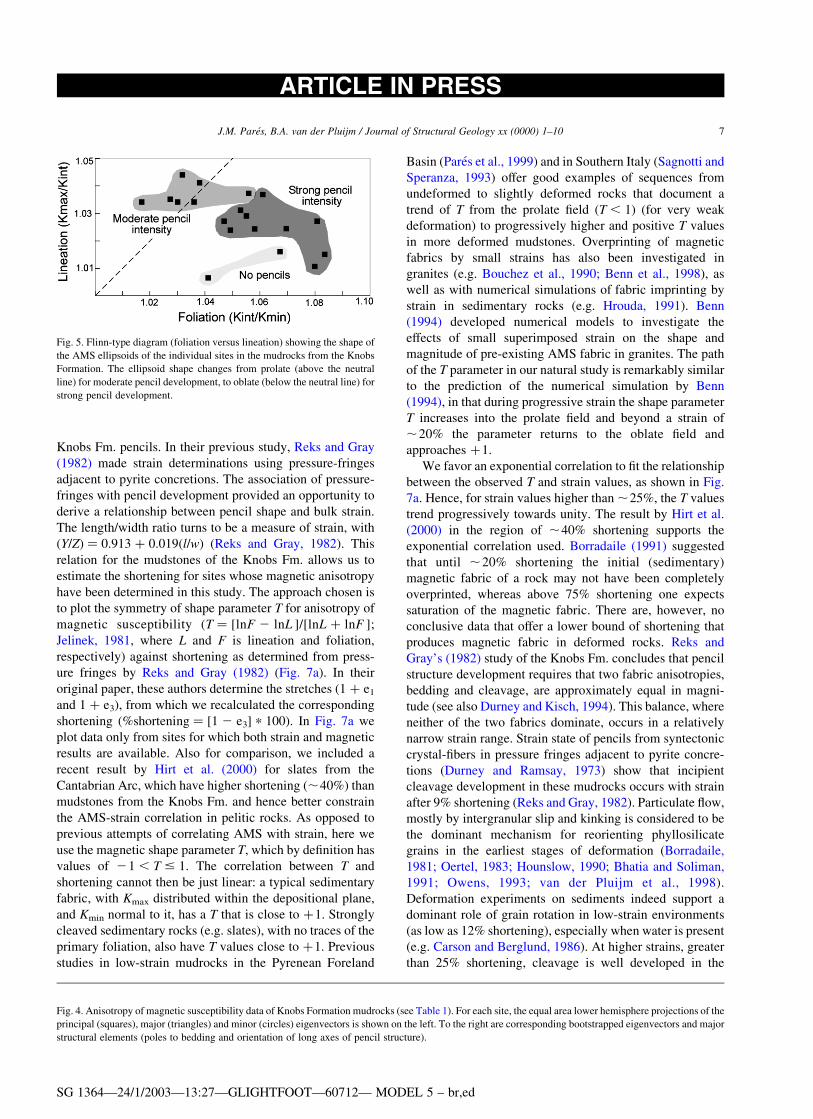
Pencil intensity in the Knobs Fm. was established on the
basis of the pencil shape factor, l/w, where l and w are the
length and width of the pencil fragment, respectively (Reks
and Gray, 1982). For convenience, we follow the same
classification scheme as those authors, who distinguish
weak (l/w , 13), moderate (13 , l/w , 19) and strong
(l/w . 19) pencil intensity in the Knobs Fm. mudrocks. We
have plotted the magnetic parameter results (lineation
L ¼ Kmax/Kint and, foliation F ¼ Kint/Kmin) on a Flinn type
diagram (Fig. 5) and grouped them following the associated
pencil intensity. The distribution of magnetic lineation and
foliation shows an excellent correlation with pencil
intensity. Generally, high values of magnetic foliation fall
in the region of strong pencil intensity, whereas sites with
low magnetic foliation and rather constant lineation lie in
the moderate pencil intensity domain. Moderate pencil
structures are generally confined to the constrictional field
of the Flinn diagram (k ^ 1). Also, we note that on average,
magnetic lineation in the strong pencil intensity domain is
slightly lower than in the moderate domain, reflecting a
stronger magnetic foliation in the latter (k , 1). Pencil
development seems therefore more efficient in changing the
oblateness rather than prolateness of the magnetic ellipsoid.
Two sites were collected in a region without pencils, which
show low values in magnetic lineation and a moderate
magnetic foliation, similar to samples from other environ-
ments with little or no tectonic strain fabrics.
A more complete documentation of changes in the
magnetic ellipsoids is given by the distribution of the
principal eigenvectors of the magnetic tensor (Fig. 6).
Histograms of bootstrapped eigenvalues provide an
approach to qualitatively compare magnetic ellipsoids, by
inspecting the grouping or dispersion of the corresponding
eigenvalues. This is achieved by comparing the confidence
intervals or bounds of the eigenvalues. Sites having a
moderate pencil intensity display a relatively distinct t1
distribution, with t2 and t3 close but not overlapping. Note
that in this situation, the corresponding Kmax directions are
well defined on a stereographic projection, but Kint and Kmin
directions are variably distributed in a girdle (Fig. 4). In
contrast, sites in the strong pencil domain have all three
eigenvalues distinct and equally well defined, more typical
for a triaxial ellipsoid. It can be seen that there is a gradation
from the most prolate to the most oblate magnetic ellipsoid
as indicated by the histograms of the principal eigenvectors
distribution. Such a distribution of magnetic data resembles
the deformation path noticed by Housen et al. (1993),
Sagnotti et al. (1994) and Pares et al. (1999) among others,
suggesting that it may be possible to compare the
magnitudes of strain and susceptibility tensor in the studied
rocks as discussed below.
6. Discussion
The potential of magnetic anisotropy as a strain gage has
received a lot of attention, and several quantitative
relationship have been reported from studies on slates
(e.g. Wood et al., 1976; Rathore, 1979, 1980; Luneburg
et al., 1999) and in oolitic limestones (e.g. Kligfield et al.,
1982). Yet, it is evident from the extensive literature that
there is a gap in the transition field from compaction to
tectonic fabric, which is examined by our results from the
SG 1364—24/1/2003—13:26—GLIGHTFOOT—60712— MODEL 5 – br,ed
J.M. Pares, B.A. van der Pluijm / Journal of Structural Geology xx (0000) 1–10 5
ARTICLE IN PRESS

SG 1364—24/1/2003—13:26—GLIGHTFOOT—60712— MODEL 5 – br,ed
J.M. Pares, B.A. van der Pluijm / Journal of Structural Geology xx (0000) 1–106
ARTICLE IN PRESS
Knobs Fm. pencils. In their previous study, Reks and Gray
(1982) made strain determinations using pressure-fringes
adjacent to pyrite concretions. The association of pressure-
fringes with pencil development provided an opportunity to
derive a relationship between pencil shape and bulk strain.
The length/width ratio turns to be a measure of strain, with
(Y/Z) ¼ 0.913 þ 0.019(l/w) (Reks and Gray, 1982). This
relation for the mudstones of the Knobs Fm. allows us to
estimate the shortening for sites whose magnetic anisotropy
have been determined in this study. The approach chosen is
to plot the symmetry of shape parameter T for anisotropy of
magnetic susceptibility (T ¼ [lnF 2 lnL ]/[lnL þ lnF ];
Jelinek, 1981, where L and F is lineation and foliation,
respectively) against shortening as determined from press-
ure fringes by Reks and Gray (1982) (Fig. 7a). In their
original paper, these authors determine the stretches (1 þ e1
and 1 þ e3), from which we recalculated the corresponding
shortening (%shortening ¼ [1 2 e3] p 100). In Fig. 7a we
plot data only from sites for which both strain and magnetic
results are available. Also for comparison, we included a
recent result by Hirt et al. (2000) for slates from the
Cantabrian Arc, which have higher shortening (,40%) than
mudstones from the Knobs Fm. and hence better constrain
the AMS-strain correlation in pelitic rocks. As opposed to
previous attempts of correlating AMS with strain, here we
use the magnetic shape parameter T, which by definition has
values of 21 , T # 1. The correlation between T and
shortening cannot then be just linear: a typical sedimentary
fabric, with Kmax distributed within the depositional plane,
and Kmin normal to it, has a T that is close to þ1. Strongly
cleaved sedimentary rocks (e.g. slates), with no traces of the
primary foliation, also have T values close to þ1. Previous
studies in low-strain mudrocks in the Pyrenean Foreland
Basin (Pares et al., 1999) and in Southern Italy (Sagnotti and
Speranza, 1993) offer good examples of sequences from
undeformed to slightly deformed rocks that document a
trend of T from the prolate field (T , 1) (for very weak
deformation) to progressively higher and positive T values
in more deformed mudstones. Overprinting of magnetic
fabrics by small strains has also been investigated in
granites (e.g. Bouchez et al., 1990; Benn et al., 1998), as
well as with numerical simulations of fabric imprinting by
strain in sedimentary rocks (e.g. Hrouda, 1991). Benn
(1994) developed numerical models to investigate the
effects of small superimposed strain on the shape and
magnitude of pre-existing AMS fabric in granites. The path
of the T parameter in our natural study is remarkably similar
to the prediction of the numerical simulation by Benn
(1994), in that during progressive strain the shape parameter
T increases into the prolate field and beyond a strain of
,20% the parameter returns to the oblate field and
approaches þ1.
We favor an exponential correlation to fit the relationship
between the observed T and strain values, as shown in Fig.
7a. Hence, for strain values higher than ,25%, the T values
trend progressively towards unity. The result by Hirt et al.
(2000) in the region of ,40% shortening supports the
exponential correlation used. Borradaile (1991) suggested
that until ,20% shortening the initial (sedimentary)
magnetic fabric of a rock may not have been completely
overprinted, whereas above 75% shortening one expects
saturation of the magnetic fabric. There are, however, no
conclusive data that offer a lower bound of shortening that
produces magnetic fabric in deformed rocks. Reks and
Gray’s (1982) study of the Knobs Fm. concludes that pencil
structure development requires that two fabric anisotropies,
bedding and cleavage, are approximately equal in magni-
tude (see also Durney and Kisch, 1994). This balance, where
neither of the two fabrics dominate, occurs in a relatively
narrow strain range. Strain state of pencils from syntectonic
crystal-fibers in pressure fringes adjacent to pyrite concre-
tions (Durney and Ramsay, 1973) show that incipient
cleavage development in these mudrocks occurs with strain
after 9% shortening (Reks and Gray, 1982). Particulate flow,
mostly by intergranular slip and kinking is considered to be
the dominant mechanism for reorienting phyllosilicate
grains in the earliest stages of deformation (Borradaile,
1981; Oertel, 1983; Hounslow, 1990; Bhatia and Soliman,
1991; Owens, 1993; van der Pluijm et al., 1998).
Deformation experiments on sediments indeed support a
dominant role of grain rotation in low-strain environments
(as low as 12% shortening), especially when water is present
(e.g. Carson and Berglund, 1986). At higher strains, greater
than 25% shortening, cleavage is well developed in the
Fig. 4. Anisotropy of magnetic susceptibility data of Knobs Formation mudrocks (see Table 1). For each site, the equal area lower hemisphere projections of the
principal (squares), major (triangles) and minor (circles) eigenvectors is shown on the left. To the right are corresponding bootstrapped eigenvectors and major
structural elements (poles to bedding and orientation of long axes of pencil structure).
Fig. 5. Flinn-type diagram (foliation versus lineation) showing the shape of
the AMS ellipsoids of the individual sites in the mudrocks from the Knobs
Formation. The ellipsoid shape changes from prolate (above the neutral
line) for moderate pencil development, to oblate (below the neutral line) for
strong pencil development.
SG 1364—24/1/2003—13:27—GLIGHTFOOT—60712— MODEL 5 – br,ed
J.M. Pares, B.A. van der Pluijm / Journal of Structural Geology xx (0000) 1–10 7
ARTICLE IN PRESS

Knobs Fm. mudrocks and overwhelms the bedding
anisotropy, preventing pencil structure development. The
window of strain values that represent a balance between
bedding and cleavage intensity corresponds to shortening
strains between 10 and 25%. From a qualitative perspective,
magnetic fabrics in pencil structures of Knobs Fm. for this
range reveal that the magnetic lineation is parallel to the
long axes of the pencil fragments. Quantitatively, the
magnetic parameter T, which defines the shape of
the magnetic susceptibility ellipsoid, is strain dependent as
defined by the relation shortening (%) ¼ 17 p exp(T) for the
window of ,10–25% shortening. The earlier mentioned
result by Hirt et al. (2000) for 40% shortening supports this
relationship. Note that the range in which T relates to
shortening strain is not sufficiently large to re-orient the
direction of the principal minimum susceptibility axes,
which remain normal to the bedding fabric (see Fig. 4).
With increasing shortening, tectonic cleavage dominates
and T approaches unity; that is, the magnetic ellipsoids
become highly oblate and parallel to the flattening plane.
Fig. 7b depicts the conceptual pattern of T with strain for a
sedimentary rock with increasing cleavage development.
The region constrained in this study is indicated as a solid
line.
7. Conclusions
We have determined the magnetic fabrics (AMS) for
mudrocks with pencil structures of variable intensity. Reks
and Gray (1982) previously showed a correlation between
pencil fabric and strain based on pressure fringes, and this
study shows that AMS is at least equally sensitive as a
recorder of strain state in the absence of other strain
markers. The magnetic shape parameter, T, rather than
magnetic intensity (such as P0), shows a consistent
progression with shortening strain. A correlation between
T and strain has been determined as: shortening
(%) ¼ 17 p exp(T) for a range of ,10–25% shortening.
This AMS-strain relationship for mudrocks cannot be a
priori extrapolated to other rock types, because a variety of
factors affects rock magnetic properties (such as mineralogy
and recrystallization). Our study shows, however, that
magnetic anisotropy is a reliable proxy of shortening in low
Fig. 6. Magnetic fabric and pencil intensity development. For each site, a histogram (left) and a Flinn-type diagram (right) are shown. Histogram includes
Cartesian coordinates S1, S2, and S3 of the bootstrapped principal eigenvectors. Notice the 95% confidence bounds drawn above the histograms. In the Flinn-
type diagrams, data from individual samples are shown as triangles, dots are average values for bootstrapped para-data sets (Tauxe, 1998).
SG 1364—24/1/2003—13:27—GLIGHTFOOT—60712— MODEL 5 – br,ed
J.M. Pares, B.A. van der Pluijm / Journal of Structural Geology xx (0000) 1–108
ARTICLE IN PRESS

strain mudrocks, where grain reorientation is the main
deformation mechanism.
Acknowledgements
This work was supported by NSF Grant EAR9814343.
The authors would like to thank L. Holladay for patiently
carrying out some of the laboratory measurements. We are
also grateful to John Solum for carrying out X-ray analysis.
Constructive reviews by K. Benn and D. Gray improved the
manuscript.
References
Aranguren, A., Cuevas, J., Tubia, J.M., 1996. Composite magnetic fabrics
from S–C mylonites. Journal of Structural Geology 18, 863–869.
Aubourg, C., Rochette, P., Vialon, P., 1991. Subtle stretching lineation
revealed by magnetic fabric of Cllovian–Oxfordian black shales
(French Alps). Tectonophysics 185, 211–223.
Averbuch, O., Mattei, M., Kissel, C., Frizon de Lamotte, D., Speranza, F.,
1995. Cinematique des deformations au sein d’un systeme chevauchant
aveugle: l’exemple de la “Montagna dei Fiori” (front des Apenins
centraux, Italie). Bulletin de la Societe Geologique de France 5,
451–461.
Benn, K., 1994. Overprinting of magnetic fabrics in granites by small
strains: numerical modeling. Tectonophysics 233, 153–162.
Benn, K., Ham, N.M., Pignotta, G.S., Bleeker, W., 1998. Emplacement and
deformation of granite magmas during transpression: magnetic fabrics
of the Sparrow pluton (Archean Slave Province, Canada). Journal of
Structural Geology 20, 1247–1259.
Bhatia, S.K., Soliman, A., 1991. The application of image analysis
techniques to microstructure studies in geotechnical engineering. In:
Bennett, R.H., Bryant, W.R., Hulbert, M.H. (Eds.), Microstructure of
Fine-grained Sediments, Springer-Verlag, New York, pp. 367–378.
Borradaile, G.J., 1981. Particulate flow of rock and the formation of
cleavage. Tectonophysics 72, 305–321.
Borradaile, G.J., 1987. Anisotropy of magnetic susceptibility: rock
composition versus strain. Tectonophysics 138, 327–329.
Borradaile, G.J., 1988. Magnetic susceptibility, petrofabrics and strain.
Tectonophysics 156, 1–20.
Borradaile, G.J., 1991. Correlation of strain with anisotropy of magnetic
susceptibility (AMS). Pure and Applied Geophysics 135, 15–29.
Borradaile, G.J., 2001. Magnetic fabrics and petrofabrics: their orientation
distributions and anisotropies. Journal of Structural Geology 23,
1581–1596.
Borradaile, G.J., Tarling, D.H., 1981. The influence of deformation
mechanisms on magnetic fabrics in weakly deformed rocks. Tectono-
physics 77, 151–168.
Borradaile, G.J., Henry, B., 1997. Tectonic applications of magnetic
susceptibility and its anisotropy. Earth Science Review 42, 49–93.
Bouchez, J.-L., Gleizes, G., Djouadi, T., Rochette, P., 1990. Microstructure
and magnetic susceptibility applied to emplacement kinematics of
granites: the example of the Foix pluton (French Pyrennes).
Tectonophysics 184, 157–171.
Carson, B., Berglund, P.L., 1986. Sediment deformation and dewatering
under horizontal compression: experimental results. In: Moore, J.C.
(Ed.), Structural Fabrics in Deep Sea Drilling Project Cores from
Forearcs. GSA Memoir 166, pp. 135–150.
Cloos, E., 1957. Lineation, a critical review and annotated bibliography.
Memoir of the Geological Society of America 18, 1–122.
Cogne, J.P., Perroud, H., 1988. Anisotropy of magnetic susceptibility as a
strain gauge in the Flamanville granite, NW France. Physics and Earth
Planetary Int. 51, 264–270.
Constable, C., Tauxe, L., 1990. The bootstrap for magnetic susceptibility
tensors. Journal of Geophysical Research 95, 8383–8395.
Coward, M.P., Whalley, J.S., 1979. Texture and fabric studies across the
Kishorn Nappe, near Kyle of Lochalsh, Western Scotland. Journal of
Structural Geology 1, 259–273.
Durney, D.W., Kisch, H., 1994. A field classification and intensity scale for
first-generation cleavages. Journal of Australian Geology and Geophy-
sics 15, 257–295.
Durney, D.W., Ramsay, J.G., 1973. Incremental strains measured by
syntectonic crystal growths. In: De Jong, K.A., Scholten, R. (Eds.),
Gravity and tectonics, Wiley-Interscience, New York, pp. 67–96.
Engelder, T., Geiser, P., 1979. The relationship between pencil cleavage
and lateral shortening within the Devonian section of the Appalachian
Plateau, New York. Geology 7, 460–464.
Goldstein, A.G., 1980. Magnetic susceptibility anisotropy of mylonites
from the Lake Char mylonite zone, southeastern New England.
Tectonophysics 66, 197–211.
Hatcher, R.D., Thomas, W.A., Viele, G.W. (Eds.), 1989. The
Appalachian–Ouachita orogen in the United States. Geological
Society of America, Geology of North America.
Hirt, A., Julivert, M., Soldevila, J., 2000. Magnetic fabric and deformation
Fig. 7. (a) Graph of shape parameter T (T ¼ [lnF 2 lnL ]/[lnL þ lnF ])
versus %shortening in pencil structures from Knobs Formation. Data points
correspond to sites where strain has been determined on the basis of pencil
intensity (Reks and Gray, 1982). Also included is the result from Hirt et al.
(2000) for slates from the Cantabrian belt. See text for discussion. (b)
Conceptual model of changes in the shape parameter with increasing strain.
Solid line represents the measured region of T and shortening.
SG 1364—24/1/2003—13:27—GLIGHTFOOT—60712— MODEL 5 – br,ed
J.M. Pares, B.A. van der Pluijm / Journal of Structural Geology xx (0000) 1–10 9
ARTICLE IN PRESS

in the Navia–Alto Sil slate belt, northwestern Spain. Tectonophysics
320, 1–16.
Hirt, A., Lowrie, W., Clendenen, W.S., Kligfield, R., 1993. Correlation of
strain and the anisotropy of magnetic susceptibility in the Onaping
Formation: evidence for a near-circular origin of the Sudbury basin.
Tectonophysics 225, 231–254.
Hounslow, M.W., 1990. Grain fabric measured using magnetic suscepti-
bility anisotropy in deformed sediments of the Barbados accretionary
prism: Leg 110. Proceedings of the Ocean Drilling Program, Scientific
Results, 1001, Ocean Drilling Program, pp. 257–275.
Housen, B.A., van der Pluijm, B.A., 1990. Chlorite control of correlations
between strain and anisotropy of magnetic susceptibility. Physics and
Earth Planetary Int. 61, 315–323.
Housen, B.A., van der Pluijm, B.A., 1991. Slaty cleavage development and
magnetic anisotropy fabrics. Journal of Geophysical Research 96,
9937–9946.
Housen, B.A., Richter, C., van der Pluijm, B.A., 1993. Composite magnetic
anisotropy fabrics: experiments, numerical models, and implications for
the quantification of rock fabrics. Tectonophysics 220, 1–12.
Housen, B.A., van der Pluijm, B.A., Essene, E.J., 1995. Plastic behaviour of
magnetite and high strains obtained from magnetic fabrics in the Parry
Sound shear zone, Ontario, Grenville Province. Journal of Structural
Geology 17, 265–278.
Hrouda, F., 1982. Magnetic anisotropy of rocks and its application in
geology and geophysics. Geophysical Surveys 5, 37–82.
Hrouda, F., 1991. Models of magnetic anisotropy variations in sedimentary
thrust sheets. Tectonophysics 185, 203–210.
Jackson, M., 1991. Anisotropy of magnetic remanence—a brief review of
mineralogical sources, physical origins and geological applications, and
comparison with susceptibility anisotropy. Pure and Applied Geophy-
sics 136, 1–28.
Jelinek, V., 1978. Statistical processing of anisotropy of magnetic
susceptibility measured on groups of specimens. Studia Geophys. Et
geol. 22, 50–62.
Jelinek, V., 1981. Characterization of the magnetic fabric of rocks.
Tectonophysics 79, 63–67.
Kissel, C., Barrier, E., Laj, C., Lee, T.Q., 1986. Magnetic fabric in
‘undeformed’ marine clays from compressional zones. Tectonics 5,
769–781.
Kligfield, R., Owens, W.H., Lowrie, W., 1981. Magnetic susceptibility
anisotropy, strain and progressive deformation in Permian sediments
from the Maritime Alps (France). Earth and Planetary Science Letters
55, 181–189.
Kligfield, R., Lowrie, W., Pfiffner, O.A., 1982. Magnetic properties of
deformed oolitic limestones from the Swiss Alps: the correlation of
magnetic anisotropy and strain. Eclogae geol. Helvetica 75, 127–157.
Kulander, B.R., Dean, S.L., 1986. Structure and tectonics of the central and
southern Appalachian Valley and Ridge and Plateau provinces, West
Virginia and Virginia. American Association of Petroleum Geologists
Bulletin 70, 1674–1684.
Luneburg, C.M., Lampert, S.A., Lebit, H.D., Hirt, A.M., Casey, M.,
Lowrie, W., 1999. Magnetic anisotropy, rock fabrics and finite strain in
deformed sediments of SW Sardinia (Italy). Tectonophysics 307,
51–74.
McCabe, C., Jackson, M., Ellwood, B.B., 1985. Magnetic anisotropy in the
Trenton Limestone: results of a new technique, anisotropy of
anhysteretic susceptibility. Geophysical Research Letters 12, 333–336.
Nickelsen, R.P., 1986. Cleavage duplexes in the Marcellus Shale of the
Appalachian foreland. Journal of Structural Geology 8, 361–371.
Oertel, G., 1983. The relationship of strain and preferred orientation of
phyllosilicate grains in rocks—a review. Tectonophysics 100, 413–447.
Owens, W.H., 1993. Magnetic fabric studies of samples from Hole 808C,
Nnakai Trough. Proceedings of the Ocean Drilling Program, Scientific
Results, 131, Ocean Drilling Program, pp. 301–310.
Pares, J.M., Dinares-Turell, J., 1993. Magnetic fabric in two sedimentary
rock types from the Southern Pyrenees. Journal of Geomagnetism and
Geoelectronics 45, 193–205.
Pares, J.M., van der Pluijm, B., 2002a. Evaluating magnetic lineations
(AMS) in deformed rocks. Tectonophysics 350, 283–298.
Pares, J.M., van der Pluijm, B., 2002b. Phyllosilicate fabric characterization
by Low-Temperature Anisotropy of Magnetic Susceptibility (LT-AMS).
Geophysical Research Letters 29(24) doi: 10.1029/2002GL015192.
Pares, J.M., van der Pluijm, B., Dinares-Turell, J., 1999. Evolution of
magnetic fabrics during incipient deformation of mudrocks (Pyrenees,
northern Spain). Tectonophysics 307, 1–14.
Ramsay, J.G., 1981. Tectonics of the Helvetic Nappes. In: McClay, K.R.,
Price, N.J. (Eds.), Thrust and Nappe Tectonics. Special Publications of
the Geological Society, London 9, pp. 293–309.
Ramsay, J.G., Huber, M.I., 1983. The Techniques of Modern Structural
Geology, Volume 1: Strain Analysis, Academic Press, London, 307pp.
Rathore, J.S., 1979. Magnetic susceptibility anisotropy in the Cambrian
Slate Belt of N. Wales and correlation with strain. Tectonophysics 53,
83–98.
Rathore, J.S., 1980. The magnetic fabrics of some slates from the
Borrowdale Volcanic Group in the English Lake District and their
correlations with strain. Tectonophysics 68, 207–220.
Rathore, J.S., Courrioux, G., Choukroune, P., 1983. Study of ductile shear
zones (Galicia, Spain) using texture goniometry and magnetic fabric
methods. Tectonophysics 98, 87–109.
Reks, I.J., 1981. Strain, mesoscopic structure and cleavage in the Pulaski
thrust sheet, southwestern Virginia. M.Sc. thesis, Virginia Polytechnic
Institute and State University.
Reks, I.J., Gray, D.R., 1982. Pencil structure and strain in weakly deformed
mudstone and siltstone. Journal of Structural Geology 4, 161–176.
Richter, C., van der Pluijm, B.A., 1994. Separation of paramagnetic and
ferrimagnetic susceptiblities using low temperature magnetic suscep-
tibilities and comparison with high field methods. Physics and Earth
Planetary Inter. 82, 113–123.
Sagnotti, L., Speranza, S., 1993. Magnetic fabrics analysis of the Plio–
Pleistocene clayey units of the Sant’Arcangelo basin, Southern Italy.
Physics and Earth Planetary Inter. 77, 165–176.
Sagnotti, L., Faccenna, C., Funiciello, R., Mattei, M., 1994. Magnetic fabric
and structural setting of Plio–Pleistocene clayey units in an extensional
regime: the Tyrrhenian margin of central Italy. Journal of Structural
Geology 16, 1243–1257.
Saint-Blanquat, M., Tikoff, B., 1997. Development of magmatic to solid-
state fabrics during syntectonic emplacement of the Mono Creek
granite, Sierra Nevada Batholoth. In: Bouchez, J.L., (Ed.), Granite:
From Segregation of Melt to Emplacement Fabrics, Kluwer Academic
Publishers, pp. 231–252.
Siddans, A.W., Henry, B., Kligfield, R., Lowrie, W., Hirt, A., Percevault,
M.N., 1984. Finite strain patterns and their significance in Permian
rocks of the Alpes Maritimes (France). Journal of Structural Geology 6,
339–368.
Singh, J., Sanderson, D.J., Tarling, D.H., 1975. The magnetic susceptibility
anisotropy of deformed rocks from north Cornwall, England.
Tectonophysics 27, 141–153.
Tarling, D.H., Hrouda, F., 1993. The Magnetic Anisotropy of Rocks,
Chapman and Hall, London, 217pp.
Tauxe, L., 1998. Paleomagnetic Principles and Practice, Kluwer Academic
Publishers, 299pp.
van der Pluijm, B.A., Ho, N.-C., Peacor, D.R., Merriman, R.J., 1998.
Contradictions of slate formation resolved? Nature 392, 348.
Wood, G.H., Bergin, M.J., 1970. Structural controls of the Anthracite
Region, Pennsylvania. In: Fisher, G.W., Pettijohn, F.J., Reed, J.C.,
Weaver, K.N. (Eds.), Studies of Appalachian Geology Central and
Southern, Interscience, New York, pp. 147–160.
Wood, D.S., Oertel, G., Singh, J., Bennett, H.F., 1976. Strain and
anisotropy in rocks. Philosophical Translations of the Royal Society
of London A283, 27–42.
SG 1364—24/1/2003—13:27—GLIGHTFOOT—60712— MODEL 5 – br,ed
J.M. Pares, B.A. van der Pluijm / Journal of Structural Geology xx (0000) 1–1010
ARTICLE IN PRESS