arkansas service - apscservices.info · the plant can be dispatched at outputs from go to 548...
TRANSCRIPT

;-:: ' , . ... I I
# r' ..... .._, , '
BEFORE THE
ARKANSAS PUBLIC SERVICE COMMISSION
M THE MATCER OF THE APPLICATION 1 OF ARKANSAS ELECTRIC COOPERATIVE ) CORPORATION FOR A CERTIFICATE OF 1 CONVENIENCE AND NECESSITY 1 FOR THE PURCHASE, OWNERSHIP, ) DOCKETNO. 05- P Y Z -U OPERATION AND MAINTENANCE OF THE 1 WRIGHTSVILLE POWER FACILITY NEAR ) WRIGHTSVILLE, ARKANSAS 1
EXHIBIT CW-1
TO
DIRECT TESTIMONY
OF
CURTIS Q. WARNER
ON BEHALF OF
ARKANSAS ELECTRIC COOPERATIVE CORPORATION
APRIL 2 / ,2005
-

Wrightsrne Power Facility
AECC Engineering Review
Review of the Wrightsville Power Facility Proposed Purchase Option
November 2004

WrightsvilIe Power Facility
Proposed Purchase Option
AECC Engineering Review
November 2004
TabIc of Contents Page
A. Summary of Review .............................................................. I
C. Plans for Deactivation and Storage ........................................ 8 D. Environmental Performance and Permits .............................. 10 E. Civil/Structuml Items ............................................................. I4 F. Fuels Issues ............................................................................ 15 G. Plant Pcrform~ce .................................................................. 16
B. Plant Design ........................................................................... 3
Appendix 1 WrightsvilIe Performance Test Report .................................. 1 X
Appendix 2 WrightsvilIe Supplemental Performance Tcst Report ........... 22
Appendix 3 Wrightsville Plant Heat Rate Curve at 95 F ........................... 25
Appendix 4 Wrightsville Sitc Survey ........................................................ 26
Appendix 5 Plant One Line Diagram ........................................................ 27
AECC - Engineering, Construction and Operations Division

A. Summarv of Review
Introducfion
The Wrightsville Power Facility is a nominal 548 MW gx-fired combined cycle power generating plant located in central Arkansas south of Little Rock in Pulaski County. The facility was co-owed by Mirant (5 1 %) nnd Kinder Morgan (49%) but the project is now in bankruptcy. It was placed in extended cold standby (ECS) during the summer of 2004. In 2003 prior to bankruptcy, discussions were in progress to seII a portion of the facility to Arkansas Electric Cooperative Corporation (AECC). Now, AECC has made an offer to purchase the entire facility.
As part of the decision making process, AECC's Engineering, Construction, and Operations Division (EC&O) was assigned to perform an engineering review to determine the adequacy of the facility. This report summarizes the findings of that review. Originally done March 28,2003, the report has been updated to include a discussion about how the plant was placed into ECS and for use with the RUS loan appIication.
Maior Findings and Conclusions
1 . Design drawings, specifications and equipment manuals were observed to be in good order. The p1mt design was based on sound enginccring practices. Industry codes and standards were adhered to in the design and procurement specifications in accordance with good utility practices. No significant design dcficiencies were evident.
2. The construction records appear to be vcry complete. Ovenll, the facility appears to be constructed wing proper construction and project management practices. During construction, mas of nonconformance and noncompliance were noted as they wcre discovered and apparentIy dealt with in a satisfactory manner.
3. Based on review of selectcd turnovcr packages, tIic owner acted properly in gatliering data, checking out all systems, and starting up the equipment. AII tests appeared to be conducted with clcar goals in mind and based upon current industry standards. There was no cause for concern based on the information reviewed in the start- up documents.
4. The performance of this fadity was vcrified throudi proper performance tests. Although full details of the test procedures werc not provided, the basis outlined in the attached reports appears to bc in line with normal utility practice for such tests. Therefore, it can be reasonably concluded that the performance tests verify that the plant operates as designed. Based on the fact ff )at the total facility output exceeded the EPC guarantee, performance is expected to be cIose to the calculatcd values.
5. The facility appears to have been operated and maintained in accordance with good utility practice since it was declared commercial. Howcver, the units had not rcccived a
f

large number of operating hours beforc the end of thc warranty period so there could be unknown issues related to construction, start-up, and design.
6. The plant was pIslced into extended cold standby (ECS) during the summer of 2OO4. AECC tw furnished with the plans for deactivation for review and they me considered adequate. EC&O personnel have visitcd the plant since its deactivation and verified the plans wcre implemented as designed. Measures taken to store and protect the equipment arc comparable to methods in use now at other facilities currently in storage and they are similar to methods previously used by AECC at three of its plants. No major concerns wcrc found.
7. The existing gas transportation contract with the National Gas Pipeline Company of America (NGPL) is adequate to provide the amount of natural gas the plant needs. It is a firm transportation contract. There is no contract for gas suppIy. Fuel inflexibiiity, avaihbility, and cost are potential risk factors for the operating feasibility of this and any other natural gas-fired plant. For that reason, AECC would consider renegotiating any fuel d a t e d contracts prior to restrtrting the plant.
8. The existing operating permits are in goad order. The permits arc flcxibIe enough to allow this plant to operate and be dispatched in G reasonable manner to meet system nceds. The air permit limits the plant to an effective 40% annual capacity factor. However, this operating constraint is not considered significant since AECC would not expect to dispatch the plant at that high of SI rate.
Summary of Findings
Nothing significant was found which would dismiss the facility fiom further consideration. The plant \vas constructed using utility grade equipment. It has been designed and operated using quality and standards acceptable to AECC.
Recomm cndations
If AECC acquires the faciiity, in order for AECC to control costs and to mitigate risk, it is recommcnded that the folIowing outstanding issues be resolvcd before the plant is restarted.
1. AECC should not acquire the existing gas transportation contract as part of purchasing the facility. AECC should negotiate a new gas transportation contract to better reflect the anticipated usage of the plant in order to I o w r the cost of transporting natural gas to the plant.
2. being used to protect the equipment during ECS are adequate for thc cxpccted duration of the deactivation period.
AECC should thoroughly review the facility and equipmcnt to assure the methods
2

B. Plant Dcsien
Gcncral
In preparation for design rcview of the Wrightsville Power Facility, a meeting was held at AECC ofices among EC&O personnel, Kinder Morgan, and Mirant on February 13,2003 to discuss facility details and AECC’s informational nccds. Following the meeting a plant walk down was conducted to observe overall plant conditions and design featurcs. Follow up site inspections and document reviews were conducted on February 24 and 25,2003. Plant design drawings, specifications, heat balance models, and performance test data and results were reviewed.
Discussion
The plant configuration is different from most combined cycle plants. It was designed for daily cycling of units and flexibility of dispatch. It has six (6) GE LM-6000 Sprint aerodcrivative class CTs which arc designed for frequent starts and can reach full load quickly. (Unlike “frame-type” CTs, there is no start-up penaIty assessed on aerodcrivative CTs for additional wear and tear during norma1 start-ups. By contmt, the start-up penalty for a frame-type rnachinc is typically estimated to be equivalent to 2040 normal hours of operation.) The plant has one (1) GE 7EA frame-type CT which still has a relatively good heat rate when the plant is cycIed down to minimum load. Each of thc seven (7) CTs has an associated Hcat Recovery Steam Generator (MRSG) which allows combincd cycle operation to improvc plant efficiency. Each HRSG can utilizc supplemental duct firing to produce additional s tem. The seven (7) HRSGs supply steam to a common manifold which supplies two (2) conventiond steam turbines. One or both of the steam turbines operate depending on plant load. In aII, the plant has nine (3) electric generating units connected to the grid.
This design arrangement is called “Orion” by the Kinder Morgan designers. This configuration of units gives the facility exceptional flexibility of dispatch while maintaining a competitive heat rate from minimum to full load. It ivas conceived to respond to an unrcgulatcd generation market where the ability to handle sudden load swings wouId have market value. The plant can be dispatched at outputs from GO to 548 megawatts and can achieve very high ramp rates. Under one envisioned dispatch scenario, the 7EA would be thc only unit on-line during off-peak (nighttime) hours to keep at least one of the steam turbines warm and the pIant ready for the next days’ load ramping. The six LM-G000s couId be brought on- and off-line in steps to match the daily load curve. Two other plants of this design have been built by Kinder Morgan and are located in Michigan and Colorado.
The main structure consists of one Iarge building divided into three main sections. The ccntnl section contains two stcam turbine generators, control room, electrical equipment rooms, chemical feed area, condensers, chillers, and n 40-ton ovcrhead crane with a 5-ton auxiliary hoist. An extension from one side of this structurc houses the deaemtor and storage tank, boiler feed pumps, and the six HRSGs for the LM-GOOOs, including their stacks, and three control modules (one between each pair of HRSGs) which house the
3

control panels for the LM-6000s, their HRSGs and CEMS equipment. Another smaller extension on the opposite side of the central structure houscs the HRSG for the 7EA and its control module and CEMS. The steam turbine generator mea is provided with a drive- through maintenance and access isle between the two steam turbines and contains an overhead crane sized for the heaviest lift. There is a catwalk above the HRSGs spanning the entire Iength of the main structure.
A prc-fabricated combination administntiodwarehousc building is provided ncar the facility entrance. Within the warehouse portion there is a mezzanine Ievel above the shop area for additional storage.
A separate pre-fabricated metal building houses the watct treatment equipment and circulating water pumps. The water treatment and main buildings are heated with gas-fired space heaters to maintain a tempemturc of at least 35 "F for freeze protection. The fire pumps are located in the main cooling tower basin sump. Adjacent to the water treatment building are the main and auxiliary cooIing towers. On the opposite sidc of the main structure is the switchyard with an access road separating it from the main section of the plant. The access road hops completely around the main p l a t structure.
The property consists of 52.695 acres and is located in southern Pulaski County, Arkansas just south of the City of Wrightsville along the west side of Arkansas Highway 365. The Iegnl description of the property Iocates it in the West 54 of the Northeast % of Section 32, Township I South, Range 1 I West. It is located approximately ten (TO) miles southwest of AECC's headquarters. The site survey is induded as Appendix 4.
Dcsign Criteria:
The design allows for pIant operation with various combinations of HRSGs and steam turbines in service. Documents indicate the facility has a nominal design life of at least 25 years per specifications. It became operational in July 2002.
Specifications cover allowances in the design for equipmcnt fouling, wear, and pump sparing. This should provide industry standard reliability. The dcaerator and drum sizing is adequate for control purposes, and equipment protection provisions such as safety relief and minimum flow recirculation are appropriate for the applications.
At peak load the GE LM-6000 Sprint combustion turbines were designed to generate: 47,843 kW each at
o 50 O F inlet air o 13" HzO exhaust prcssure o 24,877 lblhr steam injection o 2,428 lbhr Sprint water flow
At peak load the GE 7EA combustion turbine was designed to generate: . 82,750 kW at o 6OoF,G0%RH
4

o 13” I420 exhaust pressure
At peak load the HRSGs were designed to generate: High pressure (HP) main steam at the rated conditions of 960 psia and 753 O F and a maximum combined flow of 1,870,000 lblhr with supplemental firing. Approximately 150,000 lbhr of HP s t e m is used for NOx control for the LM- 6000s. Low pressure (LP) main steam at rated conditions of 86 psia and 370 O F and a maximum combined flow of 2 12,500 fblhr.
At peak Ioad the steam turbines were designed to gcneate: 105.2 M W at
o 4.99” Hg backpressure o 935,000 Ibffir HP throttle steam flow o 0 lbhr LP steam flow
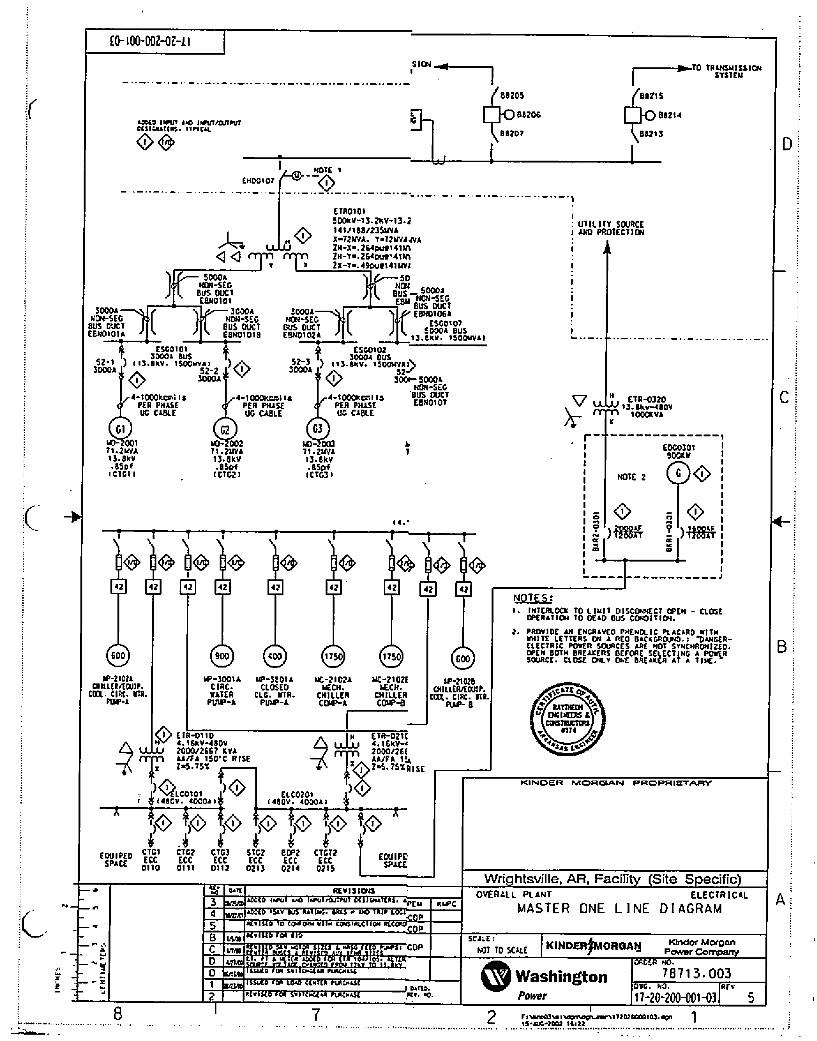
The plant One Line Diagram is included as Appendix 5.
Listing of Plant Equipment:
a
a
0
a
Six (6) single fuel, natura1 gasfired General Electric LM-6000PC SPRINT combustion turbine generators nominally rated at 47 MW each at 60’F. The air inlet systems consist of an inlet screen, a heatindcooling heat exchanger coil, followed by a prefilter and a barrier filter. Each CT has an on-line and soak-wash compressor wash system consisting of a reservoir, pumps and piping mounted on an auxiIiary skid. Weatherproof enclosures house the CTs and generators in separate compartments. Each GE generator is air cooled with brushless exciters. Teach has a nameplate ratings of 71,176 kVA, 13.8 kV, at 0.85 PF. An LM-6000 inIet air cooling system consisting of five (5) 1,920 ton mechanical chillers designed to provide 1,600 tons of chilling capacity to each LM-6000 compressor inIet. An LM-6000 inlet air heating system consisting of a steam heated gIyco1 heat exchanger, two (2) glycol circulation pumps, a glycol expansion tank, and a 20,000- galIon glycol storage tank. One ( I ) single fucl natural gas-fircd Gencml EIcctric Frame 7EA combustion turbine gcncrator equipped with dry Iow NOx combustors nominally rated at 82 MW at 60°F. The generator is a GE TEWAC with brushless excitation. It has a nameplate rating of 88 MVA, 13.8 kV, at 0.9 PF. Seven (7) Deltnk bottom-supported, natural circulation, dual pressure, heat recovery steam generators (HRSGs) with supplemental duct firing dcsigned to support steam turbine load control with sliding pressure for HIP main steam above 650 psig. Two (2) identical General Electric axial exhaust condensing s t e m turbinc generators, each rated at 105.2 MW at 4.99 ” Hg absohte. Each unit has a GE Mark V SPEEDTRONIC control system. Each generator is a GE TEWAC with brushIcss excitation and a nameplate rated of 1 18.5 MVA, 13.8 ECV, 0.9 power factor. A condensatc system consisting of two (2) Alstom single shell, axial steam entrance,
5

two pass condensers, and two (2) 50% capacity condensate pumps per condcnser. Each condenser also has a hogging ejector, twin clement-two shgc steam jet air ejector, and I and A condenser. A circulating water system consisting of a single Psychometrics eight (8) cell induced draft, counter-flow cooling tower using three (3) 33% capacity vertical circulating water pumps. Little Rock city water is used for make up under an existing contract which provides for adequate water supply. A d u d pressure feedwater system consisting of one (1) deaerator and storage tank, and three motor driven boilcr feed pumps (two with direct drivc, one with a variable frequency drive) each rated at 2620 gpm at 228 OF, 3,075 ft TDW. The low pressure feedwater is taken from an inter-stage connection on each of the pumps. Water treatment consisting of an owner contracted 450-gpm water treatment system consisting of a rcverse osmosis system and a demineralization system using Little Rock city water as the raw wtcr suppIy. US Filter had the water treatment contract prior to deactivation. Water storage and transfer equipment consisting of one (1) 300,000 galIon raw water tank, two (2) 100% capacity (1,700 gpm) raw water pumps, one (1 1 250,000 gallon demineralized water tank, and two (2) 700 gpm demineralized water pumps. An auxiliruy cooIing water system consisting of a two (2) cell induced draft, countcr-flow cooling towcr and two (2) 50% capacity pumps. The water from this system cools the five chilIers as well as the closed cooling water heat exchangers. A cIosed cooling water system consisting of two (2) 100% capacity heat exchangers, two (2) 100% capacity pumps and a head tank. A natural gas supply systcm from an on-site metering and regulation station. The system includes a fuel heater for the supply to the 7EA utiIizing LP feedwatcr to maintain SO O F gas tempemture. Pipeline delivery pressure is 71 0 psig. An eIectrica1 switchyard which includes three (3) 13.2-500 kV main step-up transformers, two (2) auxiIiary transformers and associated breakers, switches, structures, and a dead end tower interfacing with the Entergy 500 kV system. Chemical fccd systems as folIow:
o Circulating water chemica1 fecd Acid feed
8 BIeach feed Dispersant feed Corrosion inhibitor feed
Amine feed Oxygen scavenging feed
Phosphate I caustic feed
o Feedwater chemical feed
o HRSG chemical feed
Process and waste water drains system consisting of an oily water separator, collection sump and pumps, a clay-lined waste water retention pond with gravity flow weir equipped with ff ow monitoring equipment. Discharge is by open channel and buried pipeline to off site. Plant air system consisting of three (3) 50% capacity air compressors, one (1) air receiver, one (1 instrument air dryer, and one (1) instrument air receiver.

One 900 kW diesel generator with auto start (not capable of providing black start). A plant fire protection system consisting of an underground loop, one (1) 2,000 gpm diesel-driven fire pump, one 2,000 gpm motor-driven fire pump, and one 35 gpm motor-driven jockey pump. The combustion turbine gcnerator enclosures arc equipped with C02 fire suppression systems.
Codes and Standards:
The foIIowing codes and standards were observed in the procurement specifications for the facility: ANSI - American National Standards Institute ASME - American Society of Mechanical Engineers AGMA - American Gear Manufacturer's Association ASCE - American Society of Civil Engineers API - American Petroleum Institute ART - Air Conditioning and Refrigcration Institute ASTM - American Society of Testing Materials AWS - American Welding Society AWWA - American Water Works Association CTI -Cooling Tower Institute DcltaEt Standards and Procedures for the WRSGs EIA - Electronics Industries Association General Electric Standards and Procedures WE1 - Heat Exchange Institute HIS - Hydraulics Institute Standards IEEE - Institute of EIectricaI and Electronics Engineers IS0 - International Standards Organization NEBB - National Environmental Balancing Bureau for Testing, Adjusting, and Balancing of EnvironmcntaI Systems NEMA - National Electrical Manufacturer's Association NFPA - National Fire Protection Association OSHA - Occupational Safety and EIcalth Administration PFI - Pipe Fabrication Institute TEMA - Tubular Exchanger Manufacturer's Association UBC - Uniform Building Code UL - Undcnvritcr's Laboratory UPC - Uniform PIumbing Code
ConcIusion and Rccommendafions
Design drawings, specifications and equipment manuals were observed to be in good order. The plant design is based on sound cngineering practices. Industry codes and standards wcrc adhered to in the design and procurement specifications in accordance with good utiIity practices. No significant design deficiencies are evident.
7

C. Plans for Deactivation and Storage
GencmI
The owners of the Wrightsvillc Power Facility informed AECC that the facility has been deactivated and placed in storage. The storage time could cover a period of years or it couId be seasonal with the facility bcing placed back into service each year during the summer months. AECC requested copies of plans or studies made in regard to the deactivation and storage of plant equipment. AECC was provided with the “Lay-up, Preservation and Restoration Plan” dated October 20,2004 which is incorporated here by refcrence. (It WEIS included in the RUS loan application at the tab “Part 6 Item 111.”) The Iay-up procedures wed are summarized below.
Discussion
The Wrightsville owners dcvcIoped a simple and inexpensive procedure for deactivation and storage of the facility. Deactivation consisted of draining all piping and vessels, de- cncrgizing all electrical equipment and controls not required to remain in service, draining the HRSGs and circulating dry air though both the watcr- and gas-sides, and performing any additiond work necessary to protect plant equipment during long-term storage. During the storage period, a crew has been retained to watch over the facility during normal business hours and perform minor maintcnance and inspcctions. A guard provides security at thc facility during nights and weekends. At the end ofthc period, it is envisioned the plant would be re-staffed and go through a start-up period similar to the origind plant start-up.
The plans for deactivation and storage are similar to those being implemented on other non-utility generating stations around the country, The methods used arc believed to be providing an adequate Ievel of protection for the facility and the equipment. However, if AECC acquires the facility, it is recommcnded that each individual piece of equipment be looked at to ensure that it is properly protected.
AECC Operations persome1 inspected the Wrightsville Power FaciIity in September 2004 with David Whitman from Mirant. Whitman is Project Management Director for M i m t and was filling in for Mike Ammer.
Overall the facility appeared to be in good condition. Plant equipment appeared to have been prepared for deactivation, deactivated, and was being maintained in accordance with Mirant’s Lay-Up, Preservation and Restomtion Plan a copy of which is incIuded as Appendix 6.
The facility is monitored and maintained during normal business hours by a four person, non-union crew consisting of three operators and one Instrumentation and ControI (MC) Technician who is acting as site supervisor. After hours and on weekends, Mirant has
8

contracted with a local security service to station one security guard at the facility. Mowing is contracted out on an as needed basis during the growing season.
Major pIant equipment is being protected with dry air either from dehumidifiers similar to the ones AECC used during the Iay-up of three of its plants in the 1980’s or from the pIant instrument air system. Most of the plant distributed control system (DCS) remains energized and on line primarily because of the necd to kecp the plant fire protection systcm in service. DCS dams arc monitored by the operations staff during normal business hours. After hours and weekends, thc security guard monitors DCS a l m s , and he calls the I&C Technician when necessary. The facility has what appears to be an adequate rotation and exercise plan for combustion and steam turbines, motors, pumps, diesel generator and valves. Motors and major electrical equipment are being electrically (rncggnr) tested annualIy and they plan to begin annual rncggar testing of generators this fall. The facility spare parts inventory appears to be properly maintained, tools are kept locked in their storage boxes, and the shop and storage areas are neat and well maintained. The plant continuous emissions monitoring systems (CEMS) arc kept energized with sample lines heated and a small amount of instrument air bleeding through the lines. Water is continuaIIy circulated through two of the eight plant cooling tower celIs. The cooling towcr cells which are being wetted vary daily to keep the wooden fill in all the ceIIs saturated for fire protection and to protect against dry rot.
Mirant is leaving more equipment in service than AECC did when its plants werc in ECS but their approach is logical and well thought out, The equipment has been in lay-up for approximately one year. It should be able to remain in this state for several more years without significant degradation. Reactivation of the equipment should be rdatively straightfonwd and the cost should be reasonabIc. A minimum schedule of six months shouId be planned to rcactivate the plant. The most significant activity wilI bc the time needed to hire and train a crew.
Conclusions and Rccornmendations
No significant concerns were discovcrcd regarding the procedures used to protect the equipment during deactivation. If AECC acquires the WrightsvilIe facility, additional cngineering evaluations should be preformed to vcrify that the plan for deactivation and stoxagc of the equipment is acceptable for the time period needed by AECC.
9

D. Environmcntal Performance and Permits
The Wrightsville permits, documents, and data records were reviewed for the environmental performance anaIysis. It was determined that the facility had probIems with continuous emission monitoring system (CEMS) availability and some problems meeting the NOx concentration cmission Iimits with thc LM-6000s. All other environmental issues seemed to be in order.
Discussion
Emission Records: EC&O personnel rcviewed Wrightsville emission records during a facility visit in March 2003. AH emissions records seemed to be in order and we11 kept.
The facility had a problem achieving compliance with NOx concentration limits during initid start-up of the LM-6000s. Mirant pcrsonneI pointed out that they had responded to a draft consent administmtivc order (CAO) from the Arkansas Departnmcnt of Environmental Quality (ADEQ) which addressed the NOx exceedances. Mirant submittcd comments on the CAO to ADEQ that included draft language for a three- or four-hour start-up variance. ADEQ generally approved this language, and a modified air pcrmit vas issucd April 7,2004. Thc modified permit includes Impage on hourly emissions of the CTs which basically does not require the facility to notify ADEQ of emission upsets during start-up and shutdown pcriods. (AECC has similar language in its permit for the Fitzhugh CT.)
With the start-uplshutdown variance now part of the facility’s air permit, this issue is considered rcsoIved.
CEMS Availability: The facility had CEMS availability problems regarding the EPA Acid Rain Program requirements during the first two calendar quarters of commercial operation - the third and fourth quarters of 2002. Two LM-6000 units failed to meet thc required 90-day deadline to perform ccrtification testing. This resulted in over one hundred hours of data deemed “missing” for the third quarter. There was also a software problem with how data was validated. Each hour that a unit was taken off-line, that hour’s data was incorrectly logged a invalid. AImost every hour of invalid data for the fourth quarter was a result of this problem.
The problems seem to have been based on a lack of vigilance or knowledge of the requirements on behaIf of facility empIoyees. At that time, operation and maintenance of the plant (induding CEMS) w s performed under an agreement with GE. Mirant pointed out that GE did not do a good job of overseeing CEMS maintenance and operational procedures. This was addrcssed in the CAO mentioned in the previous section. From the
10

improvement in CEMS data availability during 2003, it is apparent that mom attention was paid to CEMS and recordkeeping prior to the units going into extended cold standby.
Regarding the data vdidation problcm, that problem could readily bc correctcd by the software provider, Monitor Labs, if it has not been corrected already. Monitor Labs also furnished the gas analyzers and other major hardware.
Wrightsville has one CEMS on the 7EA and three CEMS on the six LM-6000s - one CEMS for cvery two LM-6000s. Each LM-6000’s CEMS splits time between two units. This may also have contributed to their availability problems, although Kinder Morgan representatives claim they have used this set-up at off ier locations with no problems.
In order to avoid future CEMS avaihbility concerns, AECC would study adding additiona1 CEMS hardware and software to avoid splitting time between two units. (If implemented, this would cost npproximatdy $600,000 in total for thrce separate new systems.) Also, if AECC operated the faciIity, on-site plant technicians and off-site support personnel would be morc directly involved to insure proper CEMS operation and maintenance. (Note that all AECC oil and gas plants currently use Monitor Labs CEMS software and equipment - the same product used at the Wrightsville plant. As a result, AECC personnel are very famiIiar with the plant’s CEMS equipment.)
Air Permit: Wrightsville’s air permit is a relatively flexibk operating permit. Although each CT has independent hourly emission limits, the annual emission limit for the CTs is a plant-wide limit. This wouId allow the operator to choose the order in which to operate each CT. (For example, a CT with a lower cmission rate or bcttcr heat rate couId be dispatched more than a poorcr performing unit.)
Rcgarding hourly limits on the CTs, each CT has pound per hour emission limits for all primary pollutants and hourly concentration limits for NOx. Each CT has no problem complying with the pound per hour limits, but thc LM-G000s had problems meeting their concentration limits in the third and fourth caIendar quarters of2002.
The CTs are permitted to burn only pipeline quality natural gas. There is no fuel usage Iimit as a condition of the permit. However, the maximum allowable annual emission limits are based on an approximate maximum plant capacity factor of 40%. This operating constraint is not considered significant since AECC does not expect to dispatch the plant at that high of a rate.
Other air permit sources include an emergency d i e d gcncrator and the cooling towers. The gcnemtor is permitted to fire only low-sulfur dicseI fuel and is limited to 800 operating hours per 12 montlis. CompIiacc with cooling tower cmissions is shown by sampIing the total dissolved solid (TDS) content of the water in the cooling towers. The TDS content cannot exceed 4,000 parts per million.
The air permit expires on Fcbruary 27,2005. An a p p h t i o n for renewal has been
1 I

submitted as required at least six months prior to the permit expiration.
Water INPDESI Pcnnit: Wrightsville has a National PoIIutant Discharge Elimination System (NPDES) permit for its wastewater. Wastewatcr is generated from the cooling tower blowdown and low volume waste from the boiler water treatment.
The NPDES permit expires on February 28,2007. An application for renewal must be submitted at least six months prior to this date.
The NPDES permit requires both monthly and quartedy sampling of six outfalls. This is quite extensive relative to AECC's existing fossiI plants. The plant currently uses a contractor to sample the outfalls in order to generate the monthly outfall monitoring reports. If AECC were to operate the facility, EC&O recommends continuing to use a contractor to perform this duty.
Compliance Histow Status with Environmental: Reculatorv Acencies: The facility had its first ADEQ air permit inspection one month after commercial operation. The inspector granted the facility "compliance" status.
Wowcvcr, several NOx exceedmccs and CEMS availability problems were noted in the quarterly and semi-mud compIiance reports. At the time of meeting with Mirant and Kinder Morgan, ADEQ had issued a proposed CAO regarding these issues. Although we do not know the details of the CAO, we do know that the CAO addressed start- uplshutdown issues. Mimnt stated that their comments to the CAO included proposed language regarding a three- or four-hour start-uplshutdown exemption. The language has since been amended to Wrightsville's air permit to resolve the issue.
Regarding the NPDES permit, Mirant stated that only two parameters among those tested came back slightly high - one iyas pH and the other 'cvas solids. The ADEQ did not take action on these minor exccedances.
Thc start-up issue can be taken care of with the implcmentation of the start-uplshutdown variance language in the facility's air permit. The NPDES exceedance is not an issue. MarginaI exceedanccs are typically not of concern to the ADEQ Water Division unless those excccdances are repetitive.
Phase I Environmental Site Assessment: In I999 Kinder Morgan and Mirant, the current owners of the facility, hired Environmental Scientists of Maumellc, Arkansas to conduct a Phase1 Environmental Site Assessment prior to purchase of the site. At that time the property was used by the then owner as pastureland for hay and cattle and horse grazing. He stated the proper&y had never been used for any other purposes. That owner purchased the property in 1959 so the site has been used as pasture for at least forty yem. Aerial photogmphs takcn in I969 and 1396 were also examined which substantiated this statement.
12

The report also inchded copies of the FIood Insurance Rate Map for the site which showed it to be we11 above the 100-year flood plain. The site had no pools or standing surface waters which could indicate the presence of hazardous substances or petrolcum products. The site had no stained soiIs, pits, ponds, lagoons or solid waste disposal.
The report concluded there were no significant areas of concern or cnvironmental liabilities for the property itself. However, the presence of an automobile saIvage yard to the north of the property was mentioned as being an aesthetic concern. There wcre no above ground improvements to the site. The site was crossed by a 500 kV Entergy transmission line along the northern edge. An 8” ductile iron buried waterline stopped at the north end of the property which is the southern extent of the City of WrightsviIle.
ConcIusions and Recommendations
Thc cxisting pennits are in good order. The permits are flexibie enough to allow this plant to operate and bc dispatched in a reasonable manner to meet system needs.
The air permit limits the plant to su1 cffective 40% capacity factor. However, this operating constraint is not considered significant since AECC does not expect to dispatch the plant at that high of a mtc.
In ordcr to improve CEMS avniIability and lower the risk of non-compliance, AECC would study adding additional hardware and software to the existing plant so that each LM-6000 has its own stand-alone CEMS rather than the shared configurntion used now. If implemented this wouId cost approximately $600,000 and would be limited to work in the three instrumentntiodcontl modules on the LM-6000 side of the plant.
It is recommended to continue the current practice of using a contractor to perform the wastewater sampling required by the NPDES permit. If AECC acquired the facility, the responsibility for CEMS and other environmental reporting wouId be reorganized under one area for better efficiency and accountability,
There are no known areas of environmental liability for the site based on the Phase 1 Environmental Assessment which was performed in 1999.
13

E, CivillStructursll Items
General
During the construction of the Wrightsville Power Facility, the construction site was visited by AECC personnel on several occasions. These were informal visits prompted by professional curiosity but were also of interest as a comparison to the construction methods in use at AECC’s projects. The dose proximity of the facility to AECC’s headquarters required less than an hour of travel time to the construction site. AECC personnel talked with representatives of the owner, contractors, and others who were involved in the construction.
Discussion
The critical portions of the equipment at this facility are built on large reinforced concrete foundations typical of that found at similar large utility power generating installations.
From the informal visits and discussions with individuals who worked on thc project, it appears that the civil and smctura1 portions are generaIIy wcII built and adequate for this type of plant. There were some rcports of low 28-day breaks on concrete test cylinders. Additional information has been requested to document that these probkms were satisfactorily resolvcd.
AECC personnd also learned that GE Service Bulletin I SO (SB-180) was addressed prior to deactivation of the units. SB-I 80 requires the replacement of three rows of compressor blades on the LM-6000 units and has been implemented on all six of the LM units.
ConcIusions and Rccomrnendnfians
The civil and structural portions of the Wrightsvik Power Facility appear to be reasonabIy well built and adequate for this plant.

F. Fuels Issues
Gcncral
The WrightsviIIc Power Facility is connected to the Natural Gas Pipeline Company of America (‘WGPL”). A 5.5-mile 1 2-inch diameter pipeline runs north northeast fiom the plant to the connection point on NGPL’s triple pipeline set that runs across Arkansas from Texarkana through Little Rock on its eventual way to the Chicago/St.Louis area. The set contains two 30-inch diameter lines and one 36-inch diameter lines. The size of this pipeline set makes it one of the country’s major natural gas pipeline arteries. This is the same pipehe set that connects to AECC’s Fulton CT1 plant near Hope.
WPF also owns easements to construct an additional connection to a Texas Eastcrn pipeline a distance of about five more miles beyond the interconnection with NGPL. A third option would be to connect to a Ccnterpoint Energy Gas Transmission (“Centerpoint”) pipeline a distance of 14 miles. These options dlow the possibility of securing a better transportation agreement if the connection with NGPL becomes uncompetitivc.
Discussion
The existing natural gas transporkition conmct with NGPL is for firm transportation. AECC would not acquire this contract as part of purchasing the facility due to the “take or pay” provisions which cost about $2 million per year. Although the existing contract appears to be adequate for the faciIity as the facility was operated, it appears to be structured to sewe a facility with a highcr load factor than AECC would anticipate for several years. At the time the faciIity is reactivated, AECC wouId be better served to negotiate a new transportation contract based on a more likely usage pattern.
There is no contract for gas supply. The facility purchased natural gas on the spot market. At least for the first few years of plant operation after reactivation, AECC would Iikely use the same spot market strategy to purchase fuel for the plant as it does now for AECC’s four oiI-gas-fired plants.
The price of natural gas has been wry volatile for several years. Relative to other fuels, especially coal, natural gas is quite expensive and in relatively tight suppIy. For this reason, it is expected that WrightsvilIc would be used as only a peaking or intcrmediate load facility.
ConcIusions and Recommendations
The options for transporting and supplying natural gas to the Wrightsvik Power Facility appear to be reasonable and adequate for this plant.
15

G. Plant Performance
Genera1
Kinder Morgan Power Company (KMPC) conducted the performance tests for the Wrightsville Power FaciIity on June 23, and 23,2002. Testing was done to span the full m g c of plant operation and the test resuIts were reported as two separate sets of tests. The tests arc referred to as the "fired" and "unfired" tests. The reports for both tests, fired and unfmd, are attached for refercncc in the appendices.
The first set of tcst data was taken to verify that the maximum plant capacity would be equal or greater than the EPC guarantee of 537,000 kW. It was performed with all CTs at full output plus supplementd duct firing in the HRSGs to produce additional steam for the s t e m turbines.
The second test set was taken to determine the plant efficiency (heat rate) at various loads without supplemental duct firing. One of the four test points in this second set is significant because it represents the point of maximum plant eficicncy. This occurs with all CTs at full Ioad but without supplemental duct firing (at about 448 MW).
Discussion
The fired performance test for the Wrightsville Power Facility was conducted on June 22, 2002. Based on the data available in this rcport, the plant has an average corrected capacity of 548,368 k W and a heat rate of 8,684 BtulkWh at an ambient temperature of 75 OF. These results exceed the g u m t e e d performance by 2% on power output and 4.7% on efficiency. During this testing, duct burners were used to produce 70% to 93% load on the steam turbines. At this point, the output of the plant was in excess of the guaranteed requirements so no further duct firing was performed.
The test was not performed to dctcrmine the absolute plant maximum output, just to vcrify it met the EPC guarantee of at lcasst 537,000 kW. However, this test was used as the basis of the nominal plant rating of 548 MW.
SuppIementd pcrformmce testing was conducted in an unfired mode on June 23,2002. Four tcst conditions were measured - all without duct firing - as foIIows:
Test No. 1 : 7EA at minimum Ioad with one steam turbine in use. Test No. 2: 7EA at full Ioad with one s t e m turbine in use. Test No. 3: ?EA and 1 LM-6000 at full load with one stcam turbine in use. Test No. 4: 7EA and 6 LM-6000 at full Ioad with one steam turbine in use.
There were no guarantees for these operating points. The purpose of the testing was to determine the performance of thc plant at additional load points that were of interest to Minnt for dispatching purposes.

Test No. 4 is significant since it represents the point of maximum plant efficiency. In this mode, the corrected plant output was 448,437 k W with a heat rate of7,675 BtulkWh.
Other operating scenarios are possible with this plant. The information received indicates that the minimum normal operating point uses the 7EA combustion turbine and one stcam turbine, although Kinder Morgan indicated that the pIant can startup with two LM- 6000 units instcad of using the 7EA. Using the 7EA and one steam turbine, the minimum plant load is estimated to be 53.5 MW at a heat rate of IO,] 28 BtulkWh.
AECC was also supplied curves of calculated part-load performance. These curyes indicate that for a 95 O F day, load ranges from 58.5 MW to 551.9 MW with heat rates between 10,128 Btu/kWh and 8,861 BtukWh. Thc minimum part-road heat rate of 7,936 BtdkWh was shown to occur when there are five LM-6000s, the (one) 7EA, and one stcam turbine operating. At this point the power output of the plant is 382.2 MW. The maximum output points for these curves were verified through the performance tests.
Conclusions and Recornmcndations
The performance of this facility xyas verified through proper performancc tests. Although full details of the test procedures were not provided, the format outlined in the attached reports appears to be in line with normal utility practice for such tests. Therefore, it can be reasonably concluded that the performance tests verify that the plant operates as designed.
Bascd on the fact that the total facility exceeds guarantee, performance is expected to be fairly close to the caIculated values. However, if AECC acquires the facility, it is recommended that further testing be conducted to verify the performance curves after return from extended cold standby.
The performance tcst reports are included with this review as Appendices 1 and 2. An oven11 plant heat rate curve at 95 O F is included as Appendix 3. A curve of this type would be wed for dispatching.
17

Appendix 1
WrightsviHc Performance Test Report
1.0 Introduction
1.1 Summary A performance test was conducted on the Orion combined cycle power pImt located at Wrightsville, Arkansas as required by the tcms of the EPC contract. The purpose of the performance test was to demonstmtc that the power plant met the Performance Guarantees at the Contract Conditions specified in the EPC contract. Test results indicate that the performance of the plant excceded the requirements of the EPC contract.
1.2 Acceptance Criteria The specific acceptance criteria of the EPC contract are:
1) Net plant output greater than or equal to 537,000 kW whcn corrected to ambient conditions of 95 OF, 41 % relative humidity, and 14.564 psia barometric pressure,
2) Corrected plant net heat rate is Iess than or equal to 9,107 BtdkWh. 3) Hourly average LM-6000 Gas Turbine NOx emissions are less than 22
ppmvd. WourIy average Frame 7EA Gas Turbine NOx emissions are less than 9 ppmvd. Hourly avcnge Duct Burncr NOx emissions are 0.08 Ib mm Btdh (HHV).
2.0 Test Procedures
The performance test was conducted in genera1 agreement with the Performance Testing and Checkout Procedure ns revised 213 1/2002.
2.1 OpemtinE Mode The test was conducted with the plant operating with the 7EA gas turbine and all six LM- 6000 gas turbines operating nt 100% load. Duct firing was utilized to produce approximately 90 to 93% load on both stcam turbines. The steam turbines wcre not fully loaded because plant capacity was sufficient to meet the requirements of the EPC contract without additional stcam turbine output.
All plant cquipment and systems were operated and isolated in accordance with the Performance Testing and Checkout Proccdure which was established prior to the test. The plant was operated within the limitations of the air permit during the test.
Equipment was gencraIIy in new and clean condition. Steam blow screens had not been removed at the time of the test from eithcr turbine. Both steam turbines had completed at Ieast 24 hours of operation at full Ioad. An off-line gas turbine water wash was conducted prior to the test. Operating hours aAcr the water wash and total operating hours varied for each turbine and may have exceeded the GE recommended maximums in some cases.
18

No adjustments were made during the testing that would affect output or heat rate.
2.2 Test Runs The performance test ivas conducted on June 22,2002 from 19:OO to 2200 hours. Threc non-overlapping one-hour tests were performed. Plant operation was within the stability rcquiremcnts of the test procedure during the test period. However, an unexpected duct burner trip occurred during the 21:OO test run. The duct burner 'cw immediately restarted, but minor variation in performance occurred during that time period as a result of the trip.
2.3 Instrumentation Plant instrumentation was primarily used to conduct the test as outlined in the test procedure. Adjustments were made to the test plan to accommodate certain instrumentation limitations existing at the time of the test. The natural gas fI ow metcrs at the plant boundary were not available at the time of the test, Instead, fuel flow was measured manually using the totalized flow at the custody meter. Chromatograph data were not availabIe. Fuel samples were taken and sent for analysis. Communication with the plant clcctricd output meters was not available at the time of the test. Data was recorded mmually from the Entergy switchyard. Plant output data (in MWh) was aIso obtained on a hourly basis from the Enfergy dispatcher. Data from the pIant barometer was inadvertently not recorded during the test. Instead, the average value from thc barometric pressure sensors at dI scvcn gas turbines was used.
Ambient dry bulb and wet bulb temperatures were measured manually on five-minute intervds using temporary test instrumentation consisting of shielded and aspirated mercury-in-glass thermometers. Relative humidity was calculated from the wet and dry bulb temperatures. Measurements were be made at four Iocations 5 ft above grade. These locations were at the four corners of the plant near the F m c 7EA, the demineralized water tank, LM-6000 No. 1, and LM-6000 No. 2.
Raw and demineralized water tempcraturcs were measured with mercury-in-glass thermometers placed in flowing wells located on the pump suction lines. Calibration data for these thermometers as we11 as those used for wet and dry bulb tcmpentures arc included in the appendix to the original report.
19

3.0 Tcst Rcsulfs
3.1 Test Data Copies of manually acquircd data are included in the appendix to the original report, along with a summary of dectronically acquired data used for performmcc test purposes. Summaries of data acquired from the CEMS system are also included. Extensive additional diagnostic data was acquired from each gas turbine, the steam turbines, and balance of plant instrumentation. This data is available in eIectronic format.
3.2 Calculations Tcst data were averaged into one-hour blocks. Correction calculations wcre performed in general accordance with the procedure outlined in the test procedure.
The calculation procedurc was modified slightly as a result of the steam turbines not being fully loaded. The test procedure originally called for the mount of the correction to be determined by forming ratios of the output and heat rate predicted by a heat balance model at the design ambient condition and full steam turbine load to the output and heat rate predicted by the heat baIance at the test ambient condition and fulI steam turbine load. It was originally anticipated that only one heat balance model calculation would be required with the steam turbines at maximum output.
Average steam turbine load varied slightly for each of the test runs and was Icss than the maximum value for all the runs. To account for this, a heat balance model run was made at the design ambient conditions for each of the threc tests, and duct burner firing rate was adjusted to achieve the measured steam turbine output. A similar calculation was made at test ambient conditions and used to form thc required correction ratios.
The heat balance model outputs and the correction calculations are included in the appendix to the original report.
3.3 Results Avenge corrected output for the thrcc one-hour tests was 548,368 kW or 102% of the guaranteed amount. Average corrected heat rate was 8,684 Btu/kWh or 95.3% of the guaranteed value. Variation of corrected test rcsults between tests was within the conditions specified in the test procedure. A summary of individual test results is shown bcIow:
20

WrighfsvilIe Performance Test Data Summary with Duct Firing)
Test Date: Test Start Time: Test End Time:
Ambient Dry Bulb Temp (F)
Ambient Wet Bulb Temp (F) Ambient Relative Humidity (%) Barometric Pressure (psia)
Fuel Consumption (MMBtulh)
Net Output (kW) Heat Rate (BtulkWh)
Corrected Net Output (kw) Corrected Hcat Rate (BtukWh)
Deviation from Avg Corr Output (%)
Deviation from Avg Corr Heat Rate (%)
Hour I
6/22/2002 19:oo 20:oo
88.8
69.5 38.2
14.536
4,726.4
554,000 8 3 3 I .4
551,535
8,605. I
0.587 -0.905
Hour 2
6/22/2002 20:oo 21:oo
84.2
69S 48.3
14.536
4,756.9
554,000 8,586.5
549,280
8,665.6
0.166
-0.209
How3 Average
6/22/2002 21:oo 22:oo
80.8
69.5 57.3
14.544
4,78 2.7
550,000 8,695.8
544,239 548,368
8,780.3 8,683.7
-0.753
1.113
Note: The nominal plant rating of 548 MW is based on the average corrected net pIant output as measured during this test.
21

Appendix 2
Wrightsville Supplemental Performance Test Report
1.0 Introduction
1.1 Summaq Supplemental performance testing was conducted on the Orion combined cycle power plant Iocated at Wrightsville, Arkansas at the request of Mirant. The purpose of the supplemental performnncc testing was to determine the performance of the plant at four additional load points beyond the scope of the EPC contract that were of interest to Mirant for dispatching purposes.
Test No. 4 is significant since it represents the point of maximum plant efficiency. In this mode, the corrected plant output was 448,437 kW with a heat rate of 7,675 Btu/lrWh.
2.0 Test Procedures
SuppIemcntrlI performance testing tvas conducted in general agreement with the Performance Tcsting and Checkout Procedure as rcvised 113 112002, However, these were brief tests conducted for approximately one-half to one hour and without detailed recording of non-cssentiaI data.
2.1 OperotinE Mode All supplemental performance testing was conducted in unfired mode on June 23,2002. Four test conditions wcre measured - all without duct firing - as folows:.
Test No. I : 7EA at minimum load with one steam turbine in use, Tcst No. 2: 7EA at full load with one steam turbine in use. Test No. 3: 7EA and 1 LM-6000 at full Ioad with one steam turbine in use. Test No. 4: 7EA and 6 LM-6000 at full load with one stcm turbine in use.
There were no guarantees for these operating points. The purpose of the testing was to determine the performance of the plant at additional load points that were of interest to Mirant for dispatching purposes.
2.2 Test Runs The supplemental performance testing was conducted on June 23,2002 from 0O:OO to 04:OO hours.
2.3 Instrumentation Plant instrumentation was primarily used to conduct the testing as outlined in the test procedure. Adjustments were made to the test plan to accommodate certain instrumentation Iimitations misting at the time of testing. The natural gas flow meters at the pIant boundary were not available at the time of the test. Instcad, fuel flow was measured manually using the totalized flow at the custody meter. Chromatograph data
22

w r c not available. Communication with the plant clectrical output meters was not avdablc at the time of the test. Data was recorded manually from thc Entergy switchyard. Data from the plant barometer was inadvertently not recordcd during the test. Instead, die average value from the barometric pressure sensors at aIl sewn gas turbines at the condusion of the contract performance test on 6/22/2002 was used.
Ambient dry bulb and wet bulb temperatures were measured manually on five-minute intervals using temporary test instrumentation consisting of shielded and aspirated mercury-in-glass thermometers, Relative humidity was calculated from the wet and dry bulb temperatures. Measurements were be made at one location 5 ft above grade new the demineralized water tank.
Raw and demineralized water temperatures were not measured during these tests. The last available values from the contract performance tcst were wed.
3.0 Twt Rcsults
3.1 Test Data Copics of test data are incIuded in the appendix of the original report, along with n summary of the data.
3.2 Calculations Test data were averaged over the duration of the test. Correction calculations were performed in general accordance with the procedure outlined in the test procedure.
The correction procedure consisted of forming ratios of the output and heat rate predicted by a heat bdmcc model at the design ambient condition for the load configmtion of interest to the corresponding output and heat rate predicted by the heat balance at the test ambient condition. The measured output and heat rate wcrc then multiplied by these ratios to obtain an estimate of the actual output at design ambient conditions.
The heat balance model outputs and the correction calculations are included in the appendix of the original report.
3.3 Results Test No. 4 is significant since it represents the point of maximum pIant eficiency. In this mode, the corrected plant output was 448,437 kW with a heat rate of 7,675 BtulkIVh.
A summary of the test results is shown in the table beIow:
23

Wrighfsvilk Supplemental Performance Data Summary without Duct Firing)
Test Date: Test Start Time: Test End Time:
Ambient Dry Bulb Temp (F) Ambient Wet Bulb Temp (F) Ambient Relative Humidity (YO) Barometric Pressure (psia)
Fuel Consumption (MMBtu/h) Net Output (kW) Heat Rate (BtukWh)
Corrected Net Output (kW) Corrected Heat Rate (BtukWh)
TestNo. 1
612312002 03:30 04:OO
67.4 65.9 92.6
14.544
690.8 73,000 9,463
72,72 1 9,558.4
Test No. 2
U2312002 02: f 5 02:45
66.8 66.6 89.4
14.544
942.7 113,250 8,324
103,572 8,424.6
Test No. 3
61230 0 02 01:15 01:45
69.4 67.4 90.4
14.544
1391.3 165,750 8,394
159,100 8,449.5
Test No. 4
612312002 0o:oo 00:45
70.9 68.2 87.4
14.544
3471.7 455,000 7,63 0
448,437 7,674.7
24

Appendix 3
WrightsviIle Heat Rate Cuwe
25

Appendix 4 Wrig;htsvile Site Survey
I
WE2 33933
26

Appendix 5
WrightsviIle One Line Diagram
27
.f
i
44.'
I : U ~ I L I I Y SRIRCE
PRDfECIIW ! UID I
I -..-..
r - I
* I I 1 1 I I I I
I 3 I Z
.._.._.._.._.._
MlfE 2 ! I I
D