arjun makhijani, ph.d., and m.v. ramana, ph.d. december 1 ... · on the 2014 proposed clean power...
TRANSCRIPT
Comments by the Institute for Energy and Environmental Research on the 2014 Proposed Clean Power Plan of the U.S. Environmental Protection Agency
Arjun Makhijani, Ph.D., and M.V. Ramana, Ph.D.
December 1, 2014
Submitted to the United States Environmental Protection Agency
for Docket EPA-HQ-OAR-2013-0602

IEER Comments on the 2014 Proposed Clean Power Plan of the U.S. Environmental Protection Agency
2
Contents I. INTRODUCTION ................................................................................................................................. 3
II. DESCRIPTION OF IEER AND QUALIFICATIONS OF DR. MAKHIJANI AND DR. RAMANA .................... 5
A. Dr. Arjun Makhijani and IEER ............................................................................................................ 5
B. Dr. M.V. Ramana ............................................................................................................................... 6
III. IMPORTANCE OF SIGNIFICANTLY REDUCING CARBON EMISSIONS AND LONG-TERM
CONSIDERATIONS ......................................................................................................................................... 7
IV. METHODOLOGICAL ISSUES RAISED BY THE PROPOSED CLEAN POWER PLAN ........................................ 8
A. Technical problems with the derivation of the target emission rates for the states ....................... 8
B. Background on EPA’s Building Blocks ............................................................................................... 9
C. Treatment of baseline year generation, future generation, and efficiency ................................... 10
1. The EPA should use a consistent baseline year and use generation consistently for each year of
emission target calculations ............................................................................................................... 10
2. The EPA approach to renewable energy (RE) and energy efficiency (EE) in the October Notice
of Data Availability is an improvement over that published in the CPP ............................................. 12
V. EPA CAN AND MUST SET TARGETS FOR 2030 CARBON EMISSION REDUCTIONS THAT ARE MORE
STRINGENT AND LAY THE GROUNDWORK FOR SUBSEQUENT LONG-TERM CARBON REDUCTIONS. ........ 13
A. EPA’S Targets for Emission Reductions Are Too Low. ..................................................................... 13
B. EPA’s Proposed Methods for Achieving Carbon Reductions Are Not Justified and Are Not
Consistent with BSER Criteria ................................................................................................................. 14
1. EPA has not taken adequate account of the problem of natural gas venting and its effect on
carbon-equivalent emissions .............................................................................................................. 14
2. EPA has not justified reliance on nuclear power as BSER. .......................................................... 25
3. EPA has not demonstrated that its proposed methods for achieving carbon reductions will be
effective long-term. ............................................................................................................................ 41
C. As IEER Shows in the IEER Climate Protection Scenario, Carbon Reductions that are Consistent
with Climate Protection are Feasible and Cost-effective. ...................................................................... 42
1. IEER’s model is based on a consistent approach that addresses methodological issues in the
CPP 43
2. IEER’s Climate Protection Scenario would reduce carbon emissions by about 40 percent below
1990 levels .......................................................................................................................................... 47
3. IEER Climate Protection Scenario is necessary & technically feasible and cost effective .......... 51
VI. CONCLUSIONS AND RECOMMENDATIONS ..................................................................................... 54
A. Conclusions ..................................................................................................................................... 54
B. Recommendations ......................................................................................................................... 55
VII. REFERENCES .......................................................................................................................................... 57

IEER Comments on the 2014 Proposed Clean Power Plan of the U.S. Environmental Protection Agency
3
I. INTRODUCTION
The Institute for Energy and Environmental Research (IEER) submits the following comments1 on the
Clean Power Plan (CPP) that was proposed by the U.S. Environmental Protection Agency (EPA) on June
18, 2014.2 IEER welcomes the publication of the CPP as an important tool for addressing the problem of
greenhouse gas emissions. If emissions are left unchecked, they could well cause catastrophic damage
to the health and economic well-being of people in the United States and around the world. President
Obama’s Science Advisor, Dr. John Holdren, has rightly described the problem as “climate disruption”
rather than by using the more common descriptor, “climate change.”3
Regulation of the U.S. electric power sector is critical because it constitutes the largest source of
greenhouse gas (GHG) emissions – amounting to almost 40 percent of energy-related carbon dioxide-
equivalent (CO2eq) emissions in the year 2011.4 Because the life of power plants typically runs into
several decades, reducing CO2eq emissions from existing power plants is essential to the goal of
reducing power-sector CO2eq emissions. Finally, quite apart from the deleterious effects of carbon
emissions on climate, reducing power-sector emissions would substantially diminish the immense
collateral health and environmental damage caused by the production and use of fossil fuel. Limiting
GHG emissions from the power sector is also central for establishing U.S. global leadership on the issue
(where several other countries like Germany and Denmark have made greater formal commitments and
progress so far). In principle, the CPP could provide an opportunity to create a power sector, and more
broadly, an energy sector, that would put the United States on track to meet the ambitious goals for
GHG emissions by mid-century that climate protection requires.
Therefore, we strongly support the publication of the Clean Power Plan by the EPA as an essential tool
for reducing greenhouse gas emissions. However, we have some reservations and concerns about the
CPP.
1 We are submitting the comments on behalf of the authors of these comments, IEER, and Seth Shonkoff, MPH, PhD, Executive Director, PSE Healthy Energy and Elena Krieger, PhD, Director, Renewable Energy Program, PSE Healthy Energy. These comments are also being submitted by attorney Diane Curran as part of a larger set on behalf of a number of clients. We are deeply appreciative of the work of Scott Denman, Director and Philanthropic advisor Independent Council for Safe Energy Fund, who initiated this IEER effort to review the EPA’s Clean Power Plan. A number of people provide useful comments, including Elena Krieger, Sara Barczak and her colleagues at the Southern Alliance for Clean Energy, and Diane Curran. We thank them all, including the ones not named here. The authors, of course, are responsible for any errors that remain and for the contents, conclusions, and recommendations contained in these comments. Finally, we wish to thank the anonymous donor whose contribution made this intensive effort and the collaboration between the two authors of these comments possible. 2 See especially: 79 FR 34830-34958 (June 18, 2014) and EPA RIA 2014. See also EPA CPP Portal 2014, EPA's web link to the technical details of the plan. The EPA’s proposed rule is entitled “Carbon Pollution Emission Guidelines for Existing Stationary Sources: Electric Utility Generating Units: Proposed Rule.” It is informally known as the “Clean Power Plan” or CPP, for short. We will refer to it equivalently as the “Clean Power Plan”, “CPP”, or the “Proposed CO2 Rule” in these comments. 3 Malakoff 2014 4 Derived from EPA GHG Inventory 2013, Tables ES-4 and ES-7.

IEER Comments on the 2014 Proposed Clean Power Plan of the U.S. Environmental Protection Agency
4
First, the proposed CPP falls short of its goal of setting meaningful and achievable carbon emissions
targets. Far greater carbon emission reductions than those proposed in the CPP are feasible and cost-
effective. The EPA’s target for carbon emission reductions from existing stationary sources is a 30
percent reduction below 2005 levels by 2030. As discussed in more detail below, it is feasible and cost-
effective to reduce carbon emissions by about approximately 55 percent below 2005 levels by 2030.
This target is consistent with the European Union’s (EU’s) goal of reducing greenhouse gas (GHG)
emissions to 40 percent below 1990 levels by 2030, adopted in October 2014.5
Second, as discussed in more detail below, the proposed CPP has several technical and logical flaws that raise questions about the adequacy of the CPP to comply with the substantive and procedural demands of the Clean Air Act and administrative law.6 These errors and inconsistencies should be corrected in the final version. In particular, the CPP is not technology neutral and therefore contains an inappropriate bias towards natural gas. The CPP also fails to apply the criteria for identification of Best System of Emission Reduction (BSER) technology in a manner that is adequately supported or even rational in all cases. For instance, EPA has failed to adequately support its crucial assumption that increased use of natural gas will result in carbon emission reductions by examination of the full range of available data on venting and the threat of methane on a ten-to-thirty-year time frame. Similarly, EPA unjustifiably favors nuclear power – a technology that utterly fails to meet the BSER criteria – as a BSER technology.
Finally, the CPP’s bias toward centralized nuclear energy generation is problematic because it
undermines the EPA’s best hope for significant carbon emissions: the establishment of a flexible and
resilient energy system based primarily on renewables and energy efficiency. In respect to the lack of
flexibility of nuclear power reactors, IEER refers the reader to the economic analysis and
recommendations presented by Dr. Mark Cooper in his comments on the CPP.7
These comments are divided into six sections, including this Introduction:
In Section II, the comments describe IEER and the qualifications of Dr. Makhijani and Dr. Ramana to evaluate the technical issues raised by the proposed CPP.
In Section III, the comments discuss the importance of reducing carbon emissions from the U.S. energy sector. Section III will also provide a context for the carbon emission goals set by the CPP and the stronger goals advocated by IEER. Finally, Section III will set forth some long-range principles that should govern the CPP.
In Section IV, IEER explains the EPA method for setting state-by-state target rates and discusses some problems in the EPA’s approach to doing the calculations, as well as how the October 2014 Notice of Data Availability could alleviate some of the problems.
In Section V, IEER will explain why the EPA can and should set more stringent targets for carbon emissions. In this section, we will raise concerns about the inadequacy of EPA’s BSER analysis
5 European Commission 2014 6 While IEER has raised some legal questions in its Comments, it has not attempted to comprehensively address the legal deficiencies in the proposed CPP here. Instead, IEER refers the reader to Comments by Environmental Organizations on U.S. Environmental Protection Agency’s Proposed Energy Plan (Dec. 1, 2014) (Environmental Organizations’ Comments). Although IEER’s Comments may be considered independently of the Environmental Organizations’ comments, IEER also submits them in support of the Environmental Organizations’ Comments. IEER notes that the Environmental Organizations have attached and incorporated by reference IEER’s comments. 7 Comments of Dr. Mark Cooper, Senior Fellow for Economic Analysis, Institute for Energy and the Environment,
Vermont Law School (“Cooper Comments”) (Nov. 24, 2014). IEER fully endorses Dr. Cooper’s comments, which are
consistent with and complementary to IEER’s Comments.

IEER Comments on the 2014 Proposed Clean Power Plan of the U.S. Environmental Protection Agency
5
and the adverse implications of the BSER analysis for state compliance plans. Section IV also presents the results of IEER’s modeling of carbon-reduction scenarios for 48 states. This model shows that states can achieve carbon reductions significantly greater than the EPA’s proposed goals, relying primarily on renewable energy and efficiency. The description of the model and the results in Section IV should allow an independent reconstruction of the results. IEER will also publish the spreadsheet at a later date and submit it to the EPA before the end of 2014. The later publication of the spreadsheet should not affect anything in these comments, however.
In Section VI, IEER will present its conclusions and recommendations.
In Section VII, IEER presents a list of references.
II. DESCRIPTION OF IEER AND QUALIFICATIONS OF DR. MAKHIJANI AND DR. RAMANA
A. Dr. Arjun Makhijani and IEER 1. IEER is a nonprofit, tax-exempt organization that has been producing scientific and technical
analyses on energy and environmental issues, including energy-related climate issues and the environmental and security-related aspects of nuclear weapons production and nuclear power technology since 1987. Under the direction of its president, Dr. Arjun Makhijani, IEER produces technical studies on a wide range of energy and environmental issues to provide advocacy groups and policymakers with sound scientific information and analyses as applied to environmental and health protection and for the purpose of promoting the understanding and the democratization of science. Dr. Makhijani, IEER’s president, has more than four decades of experience in technical, economic, and policy analysis related to energy issues. He also has a Ph.D. (Engineering), granted by the Department of Electrical Engineering and Computer Sciences of the University of California at Berkeley, where he specialized in the application of plasma physics to controlled nuclear fusion. In addition, Dr. Makhijani has a master’s degree in electrical engineering from Washington State University and a bachelor’s degree in electrical engineering from the University of Bombay.
2. Dr. Makhijani has extensive professional experience in evaluating the relative merits of various energy sources and energy efficiency. He was the principal author of the first study ever done assessing the energy efficiency potential of the U.S. economy (1971). He is the author of Carbon-Free and Nuclear-Free: A Roadmap for U.S. Energy Policy (IEER Press and RDR Books 2007), the first assessment of the technical and economic feasibility of a fully renewable energy system in the United States.
3. Dr. Makhijani has studied energy budgets in several U.S. states. In 2010, he published a study showing how Utah could have a renewable energy economy by 2050, eUtah: A Renewable Energy Roadmap. He is also a co-author of Renewable Minnesota: A Technical and Economic Analysis of a 100% Renewable Energy-Based Electricity Sector for Minnesota (Institute for Energy and Environmental Research, Takoma Park, Maryland, 2012); and of Investment Planning in the Energy Sector (Lawrence Berkeley Laboratory, Berkeley, 1976).
4. Dr. Makhijani is author or co-author of several books and articles regarding the health and safety risks and costs of nuclear power in comparison to other energy technologies, including The Nuclear Power Deception: U.S. Nuclear Mythology from Electricity “Too Cheap to Meter” to “Inherently Safe" Reactors (Apex Press, New York, 1999, co-author, Scott Saleska); Securing the Energy Future of the United States: Oil, Nuclear and Electricity Vulnerabilities and a Post-

IEER Comments on the 2014 Proposed Clean Power Plan of the U.S. Environmental Protection Agency
6
September 11, 2001 Roadmap for Action (Institute for Energy and Environmental Research, Takoma Park, Maryland, December 2001); “Atomic Myths, Radioactive Realities: Why nuclear power is a poor way to meet energy needs,” Journal of Land, Resources, & Environmental Law, v. 24, no. 1 at 61-72 (2004) (presented at the Eighth Annual Wallace Stegner Center Symposium, entitled “Nuclear West: Legacy and Future” at the University of Utah S.J. Quinney College of Law); Assessing Nuclear Plant Capital Costs for the Two Proposed NRG Reactors at the South Texas Project Site prepared in 2008 on behalf of the SEED Coalition); Science for the Vulnerable: Setting Radiation and Multiple Exposure Environmental Health Standards to Protect Those Most at Risk (Institute for Energy and Environmental Research, Takoma Park, Maryland, 2006); Nuclear Wastelands: A Global Guide to Nuclear Weapons Production and Its Health and Environmental Effects (MIT Press, Cambridge, 1995 and 2000).
5. Dr. Makhijani is co-author and principal editor of Nuclear Wastelands, published by MIT Press (1995 and 2000); the book was nominated for a Pulitzer Prize by MIT Press. He is principal author of Nuclear Power Deception on the origins of claims of cost and safety of nuclear power especially in its first decades, and of High-Level Dollars, Low-Level Sense on radioactive waste management.
6. Electric utilities, research institutions, NGOs, U.S. government agencies, and international agencies have retained Dr. Makhijani as a consultant on energy issues, including energy efficiency, demand projections, renewable energy technologies, and investment planning. Dr. Makhijani’s clients have included the Congressional Office of Technology Assessment, Tennessee Valley Authority, the Edison Electric Institute, Lawrence Berkeley National Laboratory, the Lower Colorado River Authority, and several agencies of the United Nations. He has also served on advisory panels to U.S. regulatory agencies.
7. In 2007, Dr. Makhijani was elected a Fellow of the American Physical Society (APS), an honor granted to at most one-half of one percent of APS members. S. David Freeman, reviewing the decades of Dr. Makhijani’s work on energy has written the following as an overall assessment that is particularly germane to the present context: “My advice in these turbulent energy times is: when Arjun talks numbers, policymakers should listen. He has a stellar technical track record.”8
B. Dr. M.V. Ramana
1. M. V. Ramana is a researcher at the Nuclear Futures Laboratory and the Program on Science and Global Security at the Woodrow Wilson School of Public and International Affairs, Princeton University. He has a Ph.D. in Physics from Boston University, where he specialized in theoretical particle physics. He received his bachelor's degree from the Indian Institute of Technology, Kanpur.
2. Dr. Ramana is the author of The Power of Promise: Examining Nuclear Energy in India, a comprehensive assessment of the history, economics, safety and environmental impact of nuclear power in India. Ramana has held research positions at the University of Toronto, the Massachusetts Institute of Technology, and Centre for Interdisciplinary Studies in Environment and Development, Bangalore, and taught at Boston University, Princeton University, and Yale University.
3. Dr. Ramana is a member of the International Panel on Fissile Materials and the Science and Security Board of the Bulletin of the Atomic Scientists. He has been awarded a Guggenheim
8 Freeman 2007 (Foreword to Carbon-Free and Nuclear-Free)

IEER Comments on the 2014 Proposed Clean Power Plan of the U.S. Environmental Protection Agency
7
Fellowship and the American Physical Society's 2014 Leo Szilard Award, which recognizes "outstanding accomplishments by physicists in promoting the use of physics for the benefit of society in such areas as the environment, arms control, and science policy."
III. IMPORTANCE OF SIGNIFICANTLY REDUCING CARBON EMISSIONS AND LONG-TERM CONSIDERATIONS
The latest assessment of the Intergovernmental Panel on Climate Change, the fifth in a series, known
commonly as IPCC5, makes very clear the need for near-total elimination of GHG emissions as much
before the end of this century as possible. The IPCC’s statement about temperature rise without
mitigation of emissions presents a stark picture:
Without additional efforts to reduce GHG emissions beyond those in place today, emissions growth is expected to persist driven by growth in global population and economic activities. Baseline scenarios, those without additional mitigation, result in global mean surface temperature increases in 2100 from 3.7 °C to 4.8 °C compared to pre-industrial levels (median values; the range is 2.5 °C to 7.8 °C when including climate uncertainty…).9
Without significant mitigation, the impacts on human society and the environment could be
catastrophic.10 The IPCC5 assessment has reached the conclusion that if the temperature rise is to be
limited to 2oC with more than 50 percent probability then atmospheric concentrations of GHG need to
be limited to 450 parts per million CO2eq.11 It is important to explore the connections of this conclusion
to the EPA target for the year 2030 for existing fossil fuel generating plants.
The Final Draft of Working Group III in IPCC5 prescribes that by 2050, CO2eq emissions should be
reduced globally from 2010 levels by between 41 and 72 percent if the goal is to limit global average
temperature rise to 2oC.12 The countries belonging to the Organisation for Economic Co-operation and
Development (OECD) -- and most of all the U.S. – have consumed far more fossil fuels and contributed
far more to cumulative carbon pollution than developing countries. This history suggests a greater
responsibility on the part of the U.S. and the rest of the OECD to reduce emissions. For instance, if this
principle is given effect by allocating emissions to the world population on a per person basis, the United
States would have to reduce its greenhouse gas emissions by between 79.6 and 90.6 percent by the year
2050 relative to 2010; the percentages relative to 2005 are about the same. The average reduction
percentage would be about 85 percent. The reduction needed relative to 1990, the reference year used
by the European Union, would be 77.8 to 89.7 percent, which averages to about 83.6 percent. Even if
the allocation were not made on a per person basis, it is clear that reductions in greenhouse gas
emissions far greater than the average would be needed by 2050. Indeed, the principle of differential
9 IPCC5 WGIII SPM 2014, p. 9. Bold typeface in the original. 10 National Climate Assessment 2014 11 IPCC5 WGIII SPM 2014, p. 10 and Figure SPM.4 (p. 11) 12 IPCC5 WGIII TS 2014, Table TS-1 (p. 26). We note that the stringency of this recommendation has been weakened by the growth in GHG emissions during the four years that have elapsed since the IPCC5’s baseline year of 2010.
IEER Comments on the 2014 Proposed Clean Power Plan of the U.S. Environmental Protection Agency
8
responsibility is explicit in the United Nations Framework Convention on Climate Change (UNFCCC).13
Further, IPCC5 estimated that such a temperature limit would require between 78 percent and 118
percent reduction in greenhouse gas emissions by the end of the 21st century. The former number
means that developed countries would have to essentially eliminate fossil fuel use by the end of the
century; the latter means that the world will need to be extracting CO2 from the atmosphere by then.14
IV. METHODOLOGICAL ISSUES RAISED BY THE PROPOSED CLEAN POWER PLAN
A. Technical problems with the derivation of the target emission rates for
the states
The EPA has oriented the CPP towards limiting the rate of emissions from existing power plants – with
an overall target value for each state. This is a reasonable and technically sound concept, since it
directly targets the performance of the system and is also measurable, and therefore, verifiable.
However, there are a number of problems with the Clean Power Plan’s method of calculation of state
targets. The problems in the rule are, fortunately, remediable. The method of deriving the targets can
be made technically sound, while at the same time rendering it technology neutral, and more thorough
in terms of the emission rate targets for the states.
The rate of emissions from an electric power system is normally calculated by estimating total emissions
of a pollutant divided by the total electricity generation from all sources:
Emission rate = Total mass of pollutants emitted/Electricity generated in megawatt-hours
The setting of a future emission rate and comparing it to the rate in a past reference year is a critical
part of setting and verifying a pollution control performance standard. Emission rates may be set for a
single plant or for a collection of plants in a region. Units are usually in pounds per megawatt-hour
(lb/MWh) and often metric tons per megawatt-hour (mt/MWh).15
In the case of CO2, one may also calculate the CO2 emission rate over all fossil fuel plants in a region
(such as a state) with many fossil fuel plants; it is also possible to calculate the rate for a particular
13 For instance, Article 3 of the UNFCCC states: “The Parties should protect the climate system for the benefit of present and future generations of humankind, on the basis of equity and in accordance with their common but differentiated responsibilities and respective capabilities. Accordingly, the developed country Parties should take the lead in combating climate change and the adverse effects thereof.” (UNFCCC 1992, p. 4, italics added). See also the text of the November 2014 U.S.-China agreement on climate change (U.S.-China Joint Announcement 2014). 14 Global greenhouse gas emissions in 2010 were 49 billion metric tons (IPCC5 WGIII SPM 2014, p. 6) and U.S. emissions were 5.92 billion metric tons (EPA GHG Inventory 2013, Table 2-3 (p. 2-8)), including estimated fluxes of CO2 from land use and forestry changes. The global population is expected to grow to 9.6 billion by 2050 (U.N. News Centre 2013); the U.S. value for that year is expected to be 401 million (Pew 2012). 15 2,204.6 pounds = 1 metric ton. A metric ton is about ten percent larger than a U.S. ton, which is 2,000 pounds and is also called a “short ton.”

IEER Comments on the 2014 Proposed Clean Power Plan of the U.S. Environmental Protection Agency
9
power plant. Finally, it is possible to calculate the average emission rate for all electricity generation,
including all fossil and no-fossil generation. The usual approach is to calculate an average emission rate
over a year. For existing power plants, the EPA seeks to reduce emissions from all fossil fuel power
plants in each state taken together; this gives states more flexibility in achieving the CO2 reductions.
B. Background on EPA’s Building Blocks
It is essential to understand how the EPA went about constructing a target emission rate for each
state.16 This will also enable us to propose a consistent, and technology neutral approach to the Clean
Power Plan that meets the criteria for the best system of emission reduction. Some of the problems
noted below can be remedied by changing how renewable energy and energy efficiency are treated,
along the lines noted in the EPA’s October 2014 Notice of Data Availability (NODA).17 However, the EPA
has published these modifications for comment. We examine both the method published in the CPP
and the NODA in our comments below.
The EPA Clean Power Plan proposes a four-step (four “building blocks”) approach to deriving a target
rate of emissions for each state:
i. Improve the efficiency of coal plants by six percent. ii. Replace some coal-fired electricity generation by generation from natural gas-fired combined
cycle (NGCC) plants, mainly by increasing the capacity factor of existing plants to an average of 70 percent. This decreases direct CO2 emissions, since the combustion-related CO2 emitted by natural gas is lower than that for coal and NGCC plants are generally more efficient than coal-fired power plants. EPA calls this replacement of coal generation by natural gas generation “redispatch.” In the October 2014 NODA, the EPA also uses the term “shifting generation away from fossil units.”18
iii. Add generation as follows: from about six percent of existing nuclear power (in those states with operating reactors as of 2012); all existing renewables; new renewables; and, in three states (Georgia, South Carolina, and Tennessee), new nuclear power plants to the denominator (see the equation above) to reduce the allowed emission rate, but not to displace any fossil fuel generation.
iv. Add new efficiency savings to the denominator as the equivalent of generation, but as in the case of nuclear and renewables, not to displace any fossil fuel generation.
Before discussing these steps (or “building blocks”), it is important to understand the EPA’s use of the
term “redispatch.” Normally, the term “dispatch” is used to define the order in which particular
generating plants are lined up to feed electricity into the grid. A number of factors, such as reliability,
responsiveness of a particular type of generation to changing demand, and the marginal cost of
operating the generating plant, go into the dispatch line-up at any particular time. The dispatch line-up
16 Except Vermont and the District of Columbia. The EPA’s method of calculation is illustrated with an example in EPA Goal Computation 2014. Vermont and the District of Columbia are excluded because they "lack affected sources" (79 FR 34830 (June 18, 2014), p. 34867). Affected sources are fossil fuel power plants over a certain size and total generation 17 79 FR 64543 (Oct. 30, 2014), pp. 64552 and 64553 18 79 FR 64543 (Oct. 30, 2014) p. 64548

IEER Comments on the 2014 Proposed Clean Power Plan of the U.S. Environmental Protection Agency
10
works differently in competitive markets, where generation has been regulated and therefore owners of
generating plants are not guaranteed profits, and those where generation remains regulated with a
guaranteed rate of return (subject to prudent management). For instance, in markets where generation
has been deregulated, generation that has the lowest marginal costs is dispatched first – this usually
means dispatch of utility scale wind and solar generation first, unless there are technical reasons not to
do so.
The EPA’s use of “redispatch” is not in the sense of a lineup of particular generating stations for dispatch
of electricity into the grid at specific times; rather it is an estimate for each state of how much additional
generation can be had from existing NGCC plants to displace coal over a one-year period. Of course, an
increase in renewable energy, nuclear energy, hydropower, solar energy, and other generation can also
replace fossil energy.19 But the EPA chose not to apply the “redispatch” concept to any additional
generation from these other generation technologies. Yet, the EPA itself noted in the CPP that
“…renewable generation replaces predominantly fossil fuel-fired generation and thereby avoids the CO2
emissions from that replaced generation."20
The use of the term “redispatch” is not the most felicitous in the sense that a lower CO2 energy
generation technology can be used to displace a more CO2 intensive generation method. We will use
the term “displace” instead since there is no possible confusion with the function of Independent
System Operators (ISOs) who dispatch generation in a particular order at any given time. The term
“shifting generation away from fossil units” used in the NODA, as noted above, is equivalent.
C. Treatment of baseline year generation, future generation, and efficiency
1. The EPA should use a consistent baseline year and use generation consistently for each year of emission target calculations
One problem with the EPA method is that it has not used total electricity generation in the denominator
from a specific year to calculate the emission rate but rather a collection of numbers mixing up existing
and future power generation and efficiency. This means that the EPA calculation has no consistent
baseline year.
The EPA uses 2012 as its reference year for generation only for steps (i), (ii) and a part of step (iii) in the
above list. For the rest – new renewables, five reactors currently under construction, and efficiency –
are simply added to the partial existing generation. This means that the denominator of EPA’s rate
calculation includes:
2012 fossil fuel generation (except from small fossil fuel power plants);
Six percent of 2012 nuclear generation from existing reactors;
19 Except Vermont and the District of Columbia. The EPA’s method of calculation is illustrated with an example in EPA Goal Computation 2014. Vermont and the District of Columbia are excluded because they "lack affected sources" (79 FR 34830 (June 18, 2014), p. 34867). Affected sources are fossil fuel power plants over a certain size and total generation. 20 (79 FR 34830 (June 18, 2014), p. 34866)

IEER Comments on the 2014 Proposed Clean Power Plan of the U.S. Environmental Protection Agency
11
All generation from the five reactors under construction (two in Georgia, two in South Carolina, and one in Tennessee);
All renewable generation existing in 2012;
New renewable generation up to and including 2029, but in a manner that is not uniformly consistent with state renewable portfolio standards, and
The equivalent generation represented by new efficiency measures.
At the same time the following are entirely excluded from the calculation:
94 percent of existing nuclear generation; and
All hydropower.
Hence, the calculation of target emission rates for the year 2030 uses a mix of most 2012 generation
and future nuclear and renewable generation and future efficiency, even as it leaves out a large part
(about 20 percent) of 2012 generation. For some states, this means that much or most of the
generation is omitted. In effect, the CPP uses the baseline year of 2012 inconsistently by including and
excluding certain existing elements. Fortunately, this is a problem that can be remedied relatively
easily.
The CPP is also inconsistent in the way that additional natural gas generation is treated compared to
renewable and nuclear generation. The CPP uses increased NGCC generation to displace generation
from coal and then oil and gas boilers in calculating target emission rates. But it does not do the same
for efficiency and renewables.
At the same time, new renewable and nuclear generation are not used to decrease fossil fuel generation
in setting the EPA’s target rates; rather the generation numbers are simply used to tighten the allowable
rate – that is to reduce the allowable rate of emissions per megawatt-hour of generation compared to
the baseline year, 2012. The treatment of new nuclear and new renewables is unlike the treatment of
increased natural gas combined cycle generation, where the increase in generation is actually assumed
to reduce fossil fuel generation, with the constraint that total fossil fuel generation would remain the
same. This approach favors natural gas over other forms of generation.
The CPP also treats efficiency in its rate calculation in a problematic manner. It adds efficiency to
generation in the denominator when in physical reality efficiency reduces generation requirements and
hence also reduces emissions. In the EPA’s rate calculation, it does neither. It just lowers the allowed
rate of emissions.
Overall, the EPA’s method favors the increased use of natural gas combined cycle power plants over
renewables, which is problematic for more than one reason (as explained below).
The EPA should also adopt a consistent approach to estimating the emissions target for each
year in the final CPP, as explained in the box below.
IEER Comments on the 2014 Proposed Clean Power Plan of the U.S. Environmental Protection Agency
12
2. The EPA approach to renewable energy (RE) and energy efficiency (EE) in the October Notice of Data Availability is an improvement over that published in the CPP
The EPA addressed the inconsistent treatment of renewable energy and energy efficiency when it
published a Notice of Data Availability (NODA) in October 2014. It noted that renewable energy and
energy efficiency can be used to reduce fossil generation and hence also emissions.
The proposed state goal-setting formula assumes a constant level of generation for total existing fossil generation greater than or equal to 2012 historical levels (i.e., the amount of fossil generation in the denominator of the state goal equation is greater than or equal to 2012 levels). In the proposal, incremental RE and EE was simply added to the denominator of the state goal formula. An alternative treatment of this incremental RE and EE would be to assume that it directly replaces 2012 fossil generation levels and the corresponding emissions on a pro rata basis across generation types (i.e., fossil steam and gas turbine). Although the incremental generation levels assumed for building blocks 3 and 4 would not change under this approach, this adjustment to the goal-setting formula would yield more stringent state goals. Note that, under this alternative approach, the incremental RE would replace fossil steam and NGCC generation in proportion (i.e., pro rata) to their historical generation. …under this alternative approach, incremental RE and EE could replace historical fossil generation below 2012 levels.21
The NODA also provides a second option for using RE and EE to displace fossil fuels:
A second alternative approach would be similar to the one described above, but the adjustment would reflect incremental RE and EE first replacing fossil steam generation below 2012 levels rather than replacing all fossil generation on a pro rata basis. Subsequent to replacing fossil steam generation, if there were any remaining incremental RE or EE, it would replace gas turbine generation levels and the corresponding emissions.22
21 79 FR 64543 (Oct. 30, 2014), p. 64552, italics added 22 79 FR 64543 (Oct. 30, 2014), p. 64553 , italics in the original
Consistent calculation of emissions and emission rates
The proper way to calculate CO2 emission rates is to include all CO2 emissions from affected
generation units and divide that by all generation in a particular state in any year. Doing this
consistently for each year going forward can create a technology neutral rule that is consistently
based on a well-defined best system of emission reduction, which must include technical
feasibility, economics, and non-air quality considerations.
IEER Comments on the 2014 Proposed Clean Power Plan of the U.S. Environmental Protection Agency
13
We will recommend a variant that would use energy efficiency to displace generation on a pro
rata basis and renewable energy to displace fossil fuel generation starting with coal and then oil
and gas boilers, with any remaining RE to be used for displacing NGCC generation.
This above calculation methods published for comment in the NODA deal only with RE and EE to
displace fossil generation; they do not explicitly deal with nuclear energy. This omission of nuclear is
appropriate since the CPP has noted that “nuclear generating capacity is also relatively expensive to
build compared to other types of generating capacity, and little new nuclear capacity has been
constructed in the U.S. in recent years.”23 And as we discuss in Section V.B, nuclear should not be part of
the best system of emission reductions.
Further, so far as nuclear energy is concerned, the EPA should estimate generation in each year
based on the reactors that are expected at the time of publication of the final CPP to have
licenses the year for which the target rate is being calculated. For instance, this means a
reduction in nuclear generation by about 30 percent in the year 2030 compared to 2012. This is
in accord with the approach recommended in the boxed text in the previous section. For a
variety of reasons discussed in these comments, nuclear energy should not be part of the best
system of emission reduction.
Finally, the NODA notes that the issue of additional use of natural gas beyond that proposed in
the June 2014 CPP was raised by some stakeholders. The analysis in these comments points in
the direction that even the increases proposed in the June CPP are not based on a sound review
of the problems relating to natural gas use.
The issues of natural gas and nuclear energy are discussed in more detail below in Section V.
V. EPA CAN AND MUST SET TARGETS FOR 2030 CARBON EMISSION REDUCTIONS THAT ARE MORE STRINGENT AND LAY THE GROUNDWORK FOR SUBSEQUENT LONG-TERM CARBON REDUCTIONS.
A. EPA’S Targets for Emission Reductions Are Too Low.
Our analysis of the IPCC5 report shows that the EPA’s target of 30 percent reduction in the electricity
sector relative to 2005 by 2030 is very inadequate. In fact it amounts to only about a 7 percent
reduction in emissions relative to 1990.24 This target is insufficient and will not put the United States on
a path to reductions of about 84 percent by 2050. The problem is made more serious by the CPP's
reliance on increasing natural gas use for a significant portion of its reductions. Relying on natural gas as
a "bridge" creates the more arduous and costly problem of subsequently eliminating most of this natural
gas along with other fossil fuel infrastructure from the electricity sector by 2050. Moreover, the time
23 79 FR 34830 (June 18, 2014), p. 34870 24 The larger differential in the electricity sector percentages between 1990 and 2005 is due to the fact that electricity sector emissions grew much faster in the United States between 1990 and 2005 (about 32 percent) than overall greenhouse gas emissions (about 15 percent).

IEER Comments on the 2014 Proposed Clean Power Plan of the U.S. Environmental Protection Agency
14
frame of EPA’s CPP does not discuss issues beyond 2030 or set its target in the needed long-term
context. We do not disagree with the 2030 time-limit on the CPP. But the CPP should not undermine or
preclude the effectiveness of longer-term measures that may be required in the future.
In order to meet the challenges posed by a path that would keep the global mean temperature rise
below 2oC, the CPP should address the following long-term lessons that can easily be derived from the
IPCC5 report:
1. Short-term and medium-term reductions in CO2eq emissions must be compatible with the longer-term elimination of fossil fuels. Thus, we agree with the EPA that retrofitting carbon capture and sequestration technology on to existing power plants “would not represent the BSER [Best System of Emission Reduction]”.25
2. A corollary of lesson 1 above is that investments in fossil fuel-related technologies with long payback times, such as new natural gas production and transport infrastructure, should be discouraged. At any rate, the structure of the rule and the approaches for reducing electricity sector CO2eq emissions should not depend on such investments. For instance, increasing the production of natural gas for electricity production should not be treated as BSER. If venting rates prove to be high, such increases may not even be a compliance mechanism.
3. Fundamental changes in the structure of the energy system and, specifically, in the electricity system will be required, given that significant amounts of variable energy sources (notably wind and solar) will be required to greatly reduce and eventually eliminate fossil fuels. Such changes are required in any case to increase the resilience of the electricity system.
4. If the electricity sector is to be transformed, it must be affordable for middle-income and low-income people.26
5. Grid resiliency should be a paramount goal of any carbon reduction plan, given that the adverse impacts of climate disruption include disruptions in energy production from increased frequency and severity of droughts and storms.
6. Since the cost of CO2 reductions is far lower than the estimated health and environmental benefits as estimated in the CPP,27 a more ambitious target than that set by the EPA is, in any case, indicated.
We have taken account of these five considerations in our evaluation of the CPP and in the design of the
IEER Climate Protection Scenario.
B. EPA’s Proposed Methods for Achieving Carbon Reductions Are Not
Justified and Are Not Consistent with BSER Criteria
1. EPA has not taken adequate account of the problem of natural gas venting and its effect on carbon-equivalent emissions
25 79 FR 34830 (June 18, 2014), p. 34386 26 As discussed in more detail below, natural gas does not meet this goal because of the projected increase in the cost of natural gas that is explicitly forecast in the CPP. (79 FR 34830 (June 18, 2014) p. 34865) 27 EPA RIA 2014, Table ES-4 (p. ES-8) and Table ES-6 (p. ES-18)

IEER Comments on the 2014 Proposed Clean Power Plan of the U.S. Environmental Protection Agency
15
The EPA uses self-reported industry data on methane leaks in its analysis but ignores independent estimates of natural gas leakage and venting that are much higher. The CPP also ignored the 20-year warming potential of methane, despite the importance of considering this time frame for climate protection.
Methane is the essential constituent of natural gas; it is also a powerful greenhouse gas that is emitted at various stages of natural gas production, transportation, distribution, and use. Methane is also present in coal mines; as a result there are methane emissions that occur during coal mining. To its credit, the CPP considers emissions from the various phases of the natural gas system from production to long-distance pipelines and the compressor stations associated with them, as well as the distribution systems that deliver the natural gas to the points of electricity generation. The CPP also considers the emissions from coal mining and their reduction as a result of reduced coal use in the electricity generation sector. The CPP then estimates a net change in methane emissions as a result of the substitution of natural gas combined cycle generation (NGCC) for coal. We agree with the EPA that all these sources of methane emissions from the natural gas system need to be taken into account in estimating the impact of the Clean Power Plan. Specifically, the impact of emissions associated with the increased use of natural gas to fuel combined cycle power plants that the EPA assumed to set target rates needs to be taken into account. We also agree that it is appropriate to estimate the effect of coal mining reductions and associated reductions in methane emissions. However, the EPA has made a very partial and outdated analysis of the methane emissions problem. Specifically, it is important to note the following in regard to the EPA’s estimates and conclusions:
1. The EPA relies mainly on industry-supplied data for estimating natural-gas-related methane emissions, especially for emissions from hydraulic fracturing operations.28 EPA also used an earlier joint study it did with the Gas Research Institute that included field measurements done in 1992.29
2. In the one case where the EPA concluded that a set of industry data underestimated emissions from completed hydrofractured wells, the EPA estimated emissions using the defective industry data and made another estimate without it; but it never used its own, much higher venting estimate.30
3. The EPA oil and natural gas technical support document failed even to refer to, much less to evaluate or use, recent independent measurements, including measurements made from aircraft that indicate that leaks from production may be far higher than the values used by the EPA. For example, the EPA document did not refer to or use Howarth, Santoro, and Ingraffea 2011, which estimated that leakage and venting rates
28 EPA 2012, p. 1-2: “On the basis of the available data reported by companies carrying out hydraulic fracturing and RECs [reduced emissions completions], EPA developed an emission factor specifically for gas well completions with hydraulic fracturing, as described in the section below.” Specifically, the EPA found that the data collected during an earlier joint EPA-Gas Research Institute study on hydraulic-fracturing related emissions was not accurate enough to be used. (EPA 2012, pp. 1-1 and 1-2) 29 GRI-EPA 1996 30 EPA 2012, p. 1-7
IEER Comments on the 2014 Proposed Clean Power Plan of the U.S. Environmental Protection Agency
16
from conventional and hydrofractured natural gas production wells as well as all downstream emissions may be much higher than estimated by the EPA. Miller et al. 2013 also “conclude that methane emissions associated with both the animal husbandry and fossil fuel industries have larger greenhouse gas impacts than indicated by existing inventories.”31 There is also literature that has appeared since the publication of the CPP that provides ample evidence that fugitive methane emissions are larger than officially estimated and that the climate impact may be significant.32 The final CPP should also review this evidence.
4. The EPA used leak rates averaged over all natural gas production. However, the increase in production that will be required to supply the fuel for the increase in NGCC generation envisaged by the CPP is projected to come from tight gas and shale gas formations. There is a significant difference between the two.
5. The EPA entirely ignored the 20-year value of the global warming potential of methane. This is critical to the evaluation of threshold effects (commonly called “tipping points”) that may occur on time scales shorter than one hundred years, which is the EPA time frame for warming potentials.
6. The EPA did not consider the longer term impact of setting a course of greatly expanded natural gas use in electricity generation up to the year 2030. Specifically, the EPA did not examine whether its trajectory of increasing natural gas use is compatible with longer-term goals for much greater reduction in greenhouse gas emissions.
In this review, we focus on the issue of methane emissions from the natural gas production system and demonstrate that the EPA’s inclusion of greatly increased NGCC production may well not belong as part of the best system of emission reduction. In fact, it may not be permissible to include increased natural gas generation as part of compliance with the EPA rule because CO2eq emissions may increase rather than decrease due to the impact of methane venting. At the very least, detailed analysis beyond that provided by the EPA in its CPP must be undertaken before a significant expansion of natural gas use in the power sector can be included in the best system of emission reduction or as a compliance mechanism by the states. We reanalyzed the EPA’s Option 1 (state scenario) using other available estimates of methane emissions. A number of these are published in Howarth, Santoro, and Ingraffea 2011, which gives ranges of methane emission rates for both conventional and hydrofractured natural gas production. Evidence of methane emissions higher than official estimates is also provided in Schneising et al. 2014, Kort et al. 2014, and Pétron et al. 2014. Caulton et al. 2014, in surveying the literature, also cite strong evidence pointing to the conclusion that leakage and venting are higher nationally than official estimates:
The range of regional leak rates found here for the OSA [Original Sampling Area] (3–17%) is similar to leak rates found by recent studies across the United States in the CO Denver-Julesburg Basin and the UT Uintah Basin. Additionally, although a leakage rate was not calculated, a study over large areas of TX, OK, and KS found surprisingly high methane emissions, indicating that high fugitive emission rates are likely to be a national-scale issue, although the mechanisms of these fugitive leaks may be different at each site. Although a recent study found production sites, to which they were given
31 Miller et al. 2013, p. 20018 32 See, for instance, Pétron et al. 2014 and Schneising et al. 2014

IEER Comments on the 2014 Proposed Clean Power Plan of the U.S. Environmental Protection Agency
17
access, to be emitting less CH4 than EPA inventories suggest, these regional scale findings and a recent national study indicate that overall sites leak rates can be higher than current inventory estimates. Additionally, a recent comprehensive study of measured natural gas emission rates versus “official” inventory estimates found that the inventories consistently underestimated measured emissions and hypothesized that one explanation for this discrepancy could be a small number of high-emitting wells or components.33
A 2013 estimate of “anthropogenic methane sources in the United States” cited by Caulton et al 2014 supports these findings:
The spatial patterns of our emission fluxes and observed methane–propane correlations indicate that fossil fuel extraction and refining are major contributors (45 ± 13%) in the south-central United States. This result suggests that regional methane emissions due to fossil fuel extraction and processing could be 4.9 ± 2.6 times larger than in EDGAR [Emission Database for Global Atmospheric Research], the most comprehensive global methane inventory.34
We estimate the EPA methane venting rate, which is not directly provided in the Regulatory Impact Assessment, to be about 1.5 percent. 35 This is slightly lower than the low end of the venting estimate for conventional natural gas production of 1.7 percent in Howarth, Santoro, and Ingraffea 2011 (Table 2). Howarth, Santoro, and Ingraffea 2011 also provide an upper limit for overall emissions from conventional natural gas production of six percent. Their range for emissions for hydrofractured natural gas is 3.6 to 7.9 percent. All these estimates include leaks and venting associated with well completion, production, processing, transmission and distribution of natural gas reflecting emissions from the entire natural gas cycle.36 The EPA assumed that regulatory and voluntary measures would reduce natural gas venting per unit production. Specifically, the EPA assumes a reduction in emissions of 1 trillion grams ofCO2eq for Option 1 (State) relative to the base case. 37 Using the differences in natural gas production between these two cases, we can infer than the EPA assumes a reduction of almost 35 percent in the methane leak and venting rate compared to the year 2011.38 This implies a
33 Caulton et al. 2014, p. 4, italics added. Reference numbers in the quote have been omitted. 34 Miller et al. 2013, abstract 35 The Regulatory Impact Analysis gives a total CO2eq methane venting for the year 2011 of 172.3 trillion grams,
using a 100-year warming potential of 25 (EPA RIA 2014, Table 3A-1 (p. 3A-5)). This translates into a venting of
10.2 trillion liters of methane, which is about 360 billion cubic feet of natural gas. The EIA gives the 2011
production as 22.55 trillion cubic feet (EIA AEO 2014, Table 13), giving a natural gas venting rate of about 1.6
percent (rounded). We assume that methane is 94.9 percent of natural gas (NAESB 2004); the methane venting
rate on this basis is about 1. 36 Howarth, Santoro, and Ingraffea 2011, Table 2 37 EPA RIA 2014, Table 3A-6 (p. 3A-9) 38 Table 3A-4 in the EPA RIA 2014 gives natural gas production in 2030 for the base case as 31.9 trillion cubic feet and for Option 1 as 31.7 trillion cubic feet. The reduction in methane emissions corresponding to this difference is estimated to be 1 trillion grams of CO2eq. This can be converted to grams of methane using the EPA’s assumed global warming potential of 25. The implied overall methane emissions rate in 2030 is about 1.05 percent, compared to 1.6 percent for the year 2011; this corresponds to a reduction in methane emissions rate of about 34.7 percent. We have applied this reduction to all emissions and venting rates in order to estimate the range of

IEER Comments on the 2014 Proposed Clean Power Plan of the U.S. Environmental Protection Agency
18
venting rate reduction of about 34.7 percent relative to 2011. We have used this reduction in our calculations to estimate the CO2eq impact of the use of natural gas proposed in the CPP. It is reasonable to assume that regulatory actions being taken in various areas in relation to natural gas venting will result in a decline in venting per unit of production. While more speculative, it is also not unreasonable to assume that voluntary actions would further reduce venting, especially in the context of the opposition to hydrofractured natural gas production. However, it would be desirable to parse these elements in the rule so the role of regulations in the venting rate reduction is shown separately from the more uncertain voluntary reductions. We focus below on two major points that the EPA has ignored:
1. The EPA’s failure to consider the much higher 20-year global warming potential for methane.
2. Higher overall leak and vent estimates even when a 34.7 percent reduction in per unit venting is applied. We have reduced the range of methane emissions estimates in Howarth, Santoro, and Ingraffea 2011, Table 2, by 34.7 percent to illustrate the impact of using different leakage and venting rates.
We consider these two factors for the natural gas use implicit in Building Block 2 of the CPP’s building
blocks relating to the displacement of coal-fired generation by natural-gas-fired combined cycle plants.
(The EPA used four “building blocks” to set target emission rates for states. The first of these was an
improvement in the efficiency of coal use; the second involved the displacement of coal generation by
increasing natural gas combined cycle generation – see Section IV, Methodological issues, for a
description and critique of EPA’s building blocks.) While states are not required to follow the use of
natural gas as described in that building block, it is important to understand its implications for the net
carbon dioxide equivalent greenhouse gas emissions. This is because the Building Blocks calculations in
the CPP are presented as elements of the “best system of emission reduction” (BSER).
Let us consider the issues relating to the two points in turn to determine whether significant increases in
natural gas use belong in the BSER.
As to the first point, there is now evidence that thresholds (“tipping points”) are being reached that
could severely disrupt climate on a time scale of a few decades even if the long term CO2 emission
trajectory is kept to a 2oC average temperature rise. For instance, prior to 2007, it was estimated that a
complete melting of summer Arctic ice would not occur until the 22nd century; the worst-case estimate
was 2070. But measurements since that time show that the ice is melting faster than models indicated
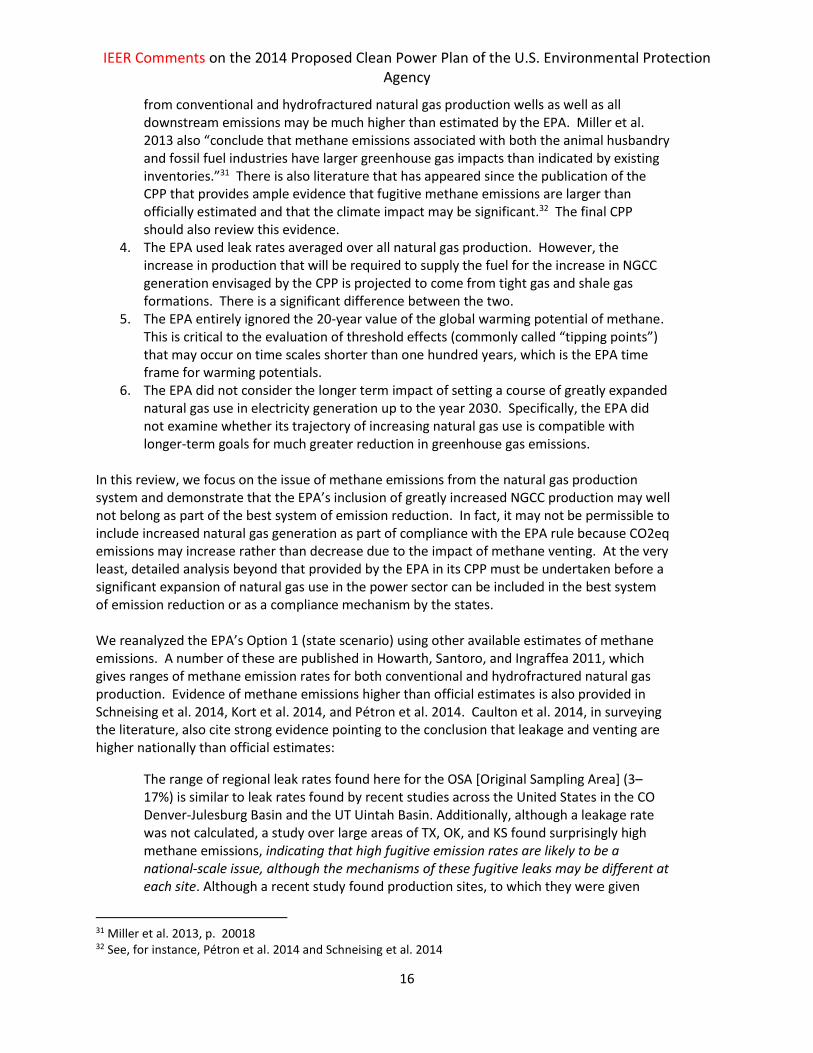
and that complete melting may occur within two decades. Figure 1 shows the data on Arctic sea ice
extent by year during 2010-2014 period; the year 1981 is provided as a reference and the 95 percent
confidence bounds are shown in a gray shade. In two of the five years in the 2010-2014 period
(inclusive) the peak of melting (i.e., the smallest ice area) was outside the 95 percent lower bound. The
other three years were barely within it.
CO2eq impacts for the year 2030 corresponding to the increase in natural gas use implicit in Building Block 2 of the CPP. For a description of the EPA building blocks to set target emission rates see Section IV, Methodological issues.
IEER Comments on the 2014 Proposed Clean Power Plan of the U.S. Environmental Protection Agency
19
Figure 1: Areal extent of Arctic sea ice in the June to October period, 2010-2014, with 1981 as the
reference year (Source: NSIDC Arctic 2014, Figure 2)
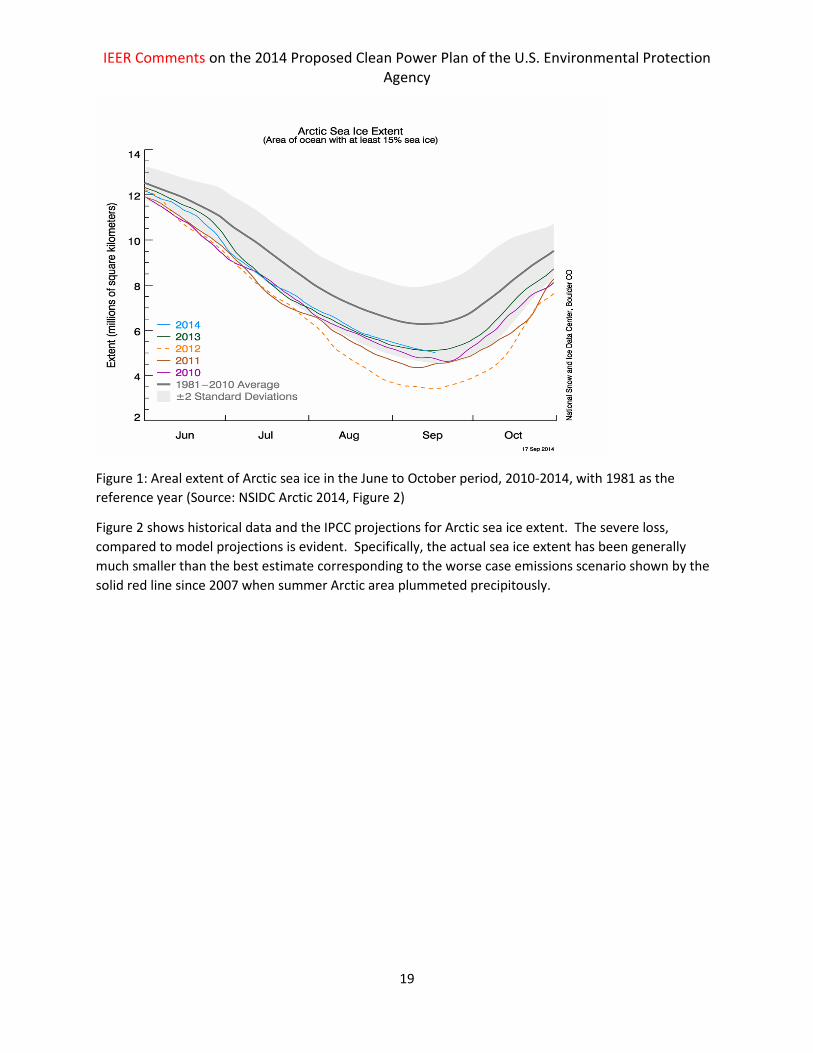
Figure 2 shows historical data and the IPCC projections for Arctic sea ice extent. The severe loss,
compared to model projections is evident. Specifically, the actual sea ice extent has been generally
much smaller than the best estimate corresponding to the worse case emissions scenario shown by the
solid red line since 2007 when summer Arctic area plummeted precipitously.
IEER Comments on the 2014 Proposed Clean Power Plan of the U.S. Environmental Protection Agency
20
Figure 2: Observed and model projections of Arctic sea ice melting under various assumptions about
future greenhouse gas emissions. Of the modeled scenarios, emissions corresponding to RCP 2.6 would
be the lowest and those corresponding to RCP 8.5 the highest. (Source: National Climate Assessment
2014, Figure 2.29 (p. 48). Adapted from Stroeve et al. 2012)
The divergence between the model estimates and the severity of the melting has been noted by the U.S.
National Climate Assessment:
The seasonal pattern of observed loss of Arctic sea ice is generally consistent with
simulations by global climate models, in which the extent of sea ice decreases more
rapidly in summer than in winter. However, the models tend to underestimate the
amount of decrease since 2007. Projections by these models indicate that the Arctic
Ocean is expected to become essentially ice-free in summer before mid-century under
scenarios that assume continued growth in global emissions, although sea ice would still
form in winter. Models that best match historical trends project a nearly sea ice-free
Arctic in summer by the 2030s, and extrapolation of the present observed trend suggests
an even earlier ice-free Arctic in summer. However, even during a long-term decrease,
occasional temporary increases in Arctic summer sea ice can be expected over
timescales of a decade or so because of natural variability.39
39 National Climate Assessment 2014, p. 46 (emphasis added)
IEER Comments on the 2014 Proposed Clean Power Plan of the U.S. Environmental Protection Agency
21
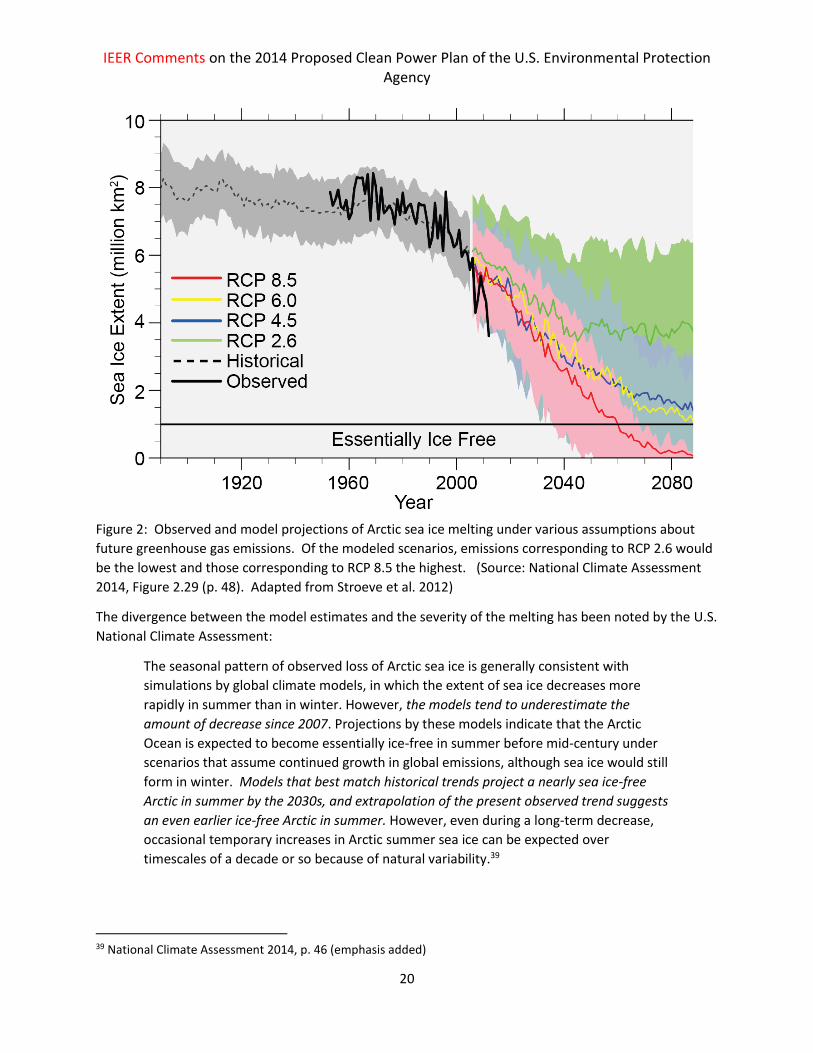
One of the references underlying the above statement in the U.S. National Climate Assessment provides
a more detailed insight into the uncertainties:
Time horizons for a nearly sea ice-free summer for these three [calculation] approaches
are roughly 2020 or earlier, 2030±10 years, and 2040 or later….It is not possible to
clearly choose one approach over the other as this depends on the relative weights
given to data versus models.40
These estimates point to the critical importance of evaluating any greenhouse gas emission reduction
plan using a 20-year global warming potential (as the best single representation) of the above estimates.
The warming of the Arctic due to much higher heat absorption by water (compared to ice) could have
significant impacts. For instance, complete melting would accelerate warming in the Arctic region.
Another possible effect could be the disruption of the world’s vast conveyor belt of ocean circulation
that includes the Gulf Stream, which keep Europe relatively warm.41 As a third example, the U.S.
National Climate Assessment, published in 2014, noted that “In Arctic Alaska, the summer sea ice that
once protected the coasts has receded, and autumn storms now cause more erosion, threatening many
communities with relocation.”42
The impacts of Arctic ice melting on the Greenland ice sheets are not well understood even though the
rate of that melting has a huge impact on estimates of future sea-level rise. Indeed, those impacts are
not even included in today’s climate models:
…the dynamics of the Greenland Ice Sheet are generally not included in present global
climate models and sea level rise projections.43
As a result, the National Climate Assessment noted the following:
There are a number of areas where improved scientific information or understanding
would enhance the capacity to estimate future climate change impacts. For example,
knowledge of the mechanisms controlling the rate of ice loss in Greenland and
Antarctica is limited, making it difficult for scientists to narrow the range of expected
future sea level rise. Improved understanding of ecological and social responses to
climate change is needed, as is understanding of how ecological and social responses
will interact.44
The EPA’s Clean Power Plan failed to take the evolution of the time frame of one of the most important
parameters in climate into account and the impacts and uncertainties associated with it: the estimate of
the time when the Arctic would be essentially ice-free. As noted, this necessarily means using a 20-year
(or even a 10-year) global warming potential for methane. We undertook an assessment using a 20-year
potential while also retaining for comparison the EPA’s approach of using a 100-year potential for
methane.
40 Overland and Wang 2013, p. 2097 41 NSDIC Global Climate 2014 42 National Climate Assessment 2014, p. 1 43 National Climate Assessment 2014, p. 48 44 National Climate Assessment 2014, p. 14
IEER Comments on the 2014 Proposed Clean Power Plan of the U.S. Environmental Protection Agency
22
At the low end of methane emissions, which is the EPA’s estimate, CO2eq emissions would indeed
decline if increased natural gas combined cycle generation were used to displace coal, according to
Building Block 2 of the CPP. But at the high end of emissions, about 5.2 percent,45 and a 20-year global
warming potential, the positive impact of the direct CO2 reductions due to the displacement of coal and
some oil and gas boiler generation by NGCC capacity would be almost totally (more than 90 percent)
negated. If one uses the geometric mean of all the Howarth, Santoro, and Ingraffea 2011 emission
estimates with the 20-year methane warming potential, the net CO2eq reductions as a result of the
increase in natural gas use and decrease in coal use are reduced by about 55 percent. If one uses the
average of the emission estimates for natural gas produced by hydraulic fracturing, about two-thirds of
the direct CO2 reductions evaporate. Besides radically reduced emission estimates, higher methane
emissions also mean that whatever CO2eq emission reduction estimates remain would be produced at
much higher cost than estimated in the CPP.
The high Howarth, Santoro, and Ingraffea 2011 estimate is at the upper end of the published venting
estimates. It has been criticized, for instance, by Newell at Raimi 2014. At the same time, there are
other indications that methane venting at various parts of the natural gas system is much higher than
the EPA estimates. We have cited several examples of independently researched estimates published
in the peer-reviewed literature that indicate much higher methane emissions than the official ones from
all or parts of the natural gas production, processing, and transportation system. They have grave
implications both for the cost of CO2eq emission reductions from Building Block 2 of the CPP but also
whether increasing natural gas use would result in significantly reduced greenhouse gas emissions from
the power sector. Specifically, the CPP estimates the cost of using NGCC to reduce CO2 emissions by
displacing coal-fired generation as $21 per metric ton. However, this cost would be between about $46
and $64 per metric ton if the venting and leakage rates are in the middle of the two ranges in Howarth,
Santoro, and Ingraffea 2011, reduced by 34.7 percent due to emission reduction measures between
now and the year 2030.
The main point here is that the EPA has not made the case that increasing natural gas use for electricity
generation to displace coal should be considered part of the best system of emission reduction because
it ignored two critical issues: (i) venting and leakage could be much higher than industry estimates and
(ii) the 10- to 30-year time scale of Arctic-related climate disruption, best represented by a 20-year
global warming potential for methane. Given that the net CO2eq emission reductions could be a
fraction of the EPA estimate or possibly close to zero, even after taking coal-related methane venting
reductions into account, it is even unclear that the increased use of NGCC generation can be used by the
states as a compliance mechanism. The EPA has a considerable burden of further analysis before it can
allow the increase of natural gas use in electricity generation as a compliance mechanism for
greenhouse gas emission reductions from the power sector.46
45 This is the result of reducing the upper limit of Howarth, Santoro, and Ingraffea 2011 venting by about 22 percent. 46 EPA RIA 2014, Table 3-11 (p. 3-27) modeling of the electricity sector indicates somewhat smaller increases in NGCC generation than used in the setting of target emission rates in Building Block 2 of the CPP. The specifics of electricity modeling and the output results for any scenario are not germane to the argument here. What is essential is that the EPA consider whether an increase in the overall use of natural gas can be part of a compliance mechanism for greenhouse gas reductions from the power sector.
IEER Comments on the 2014 Proposed Clean Power Plan of the U.S. Environmental Protection Agency
23
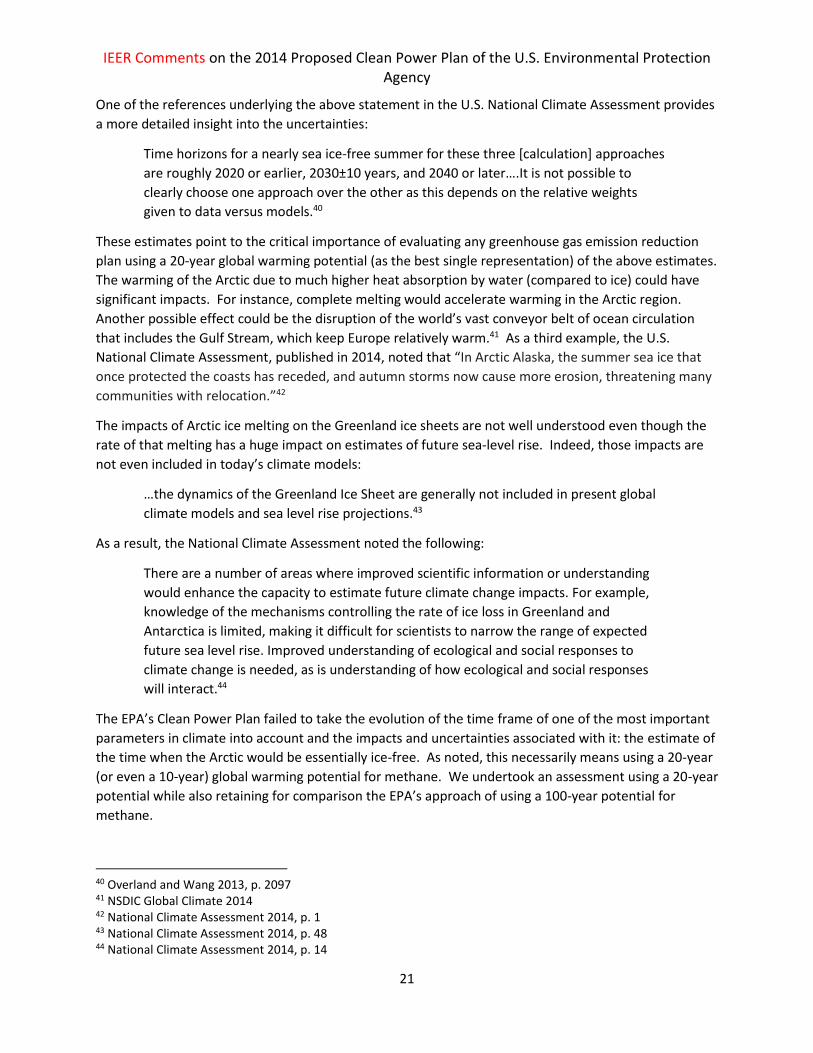
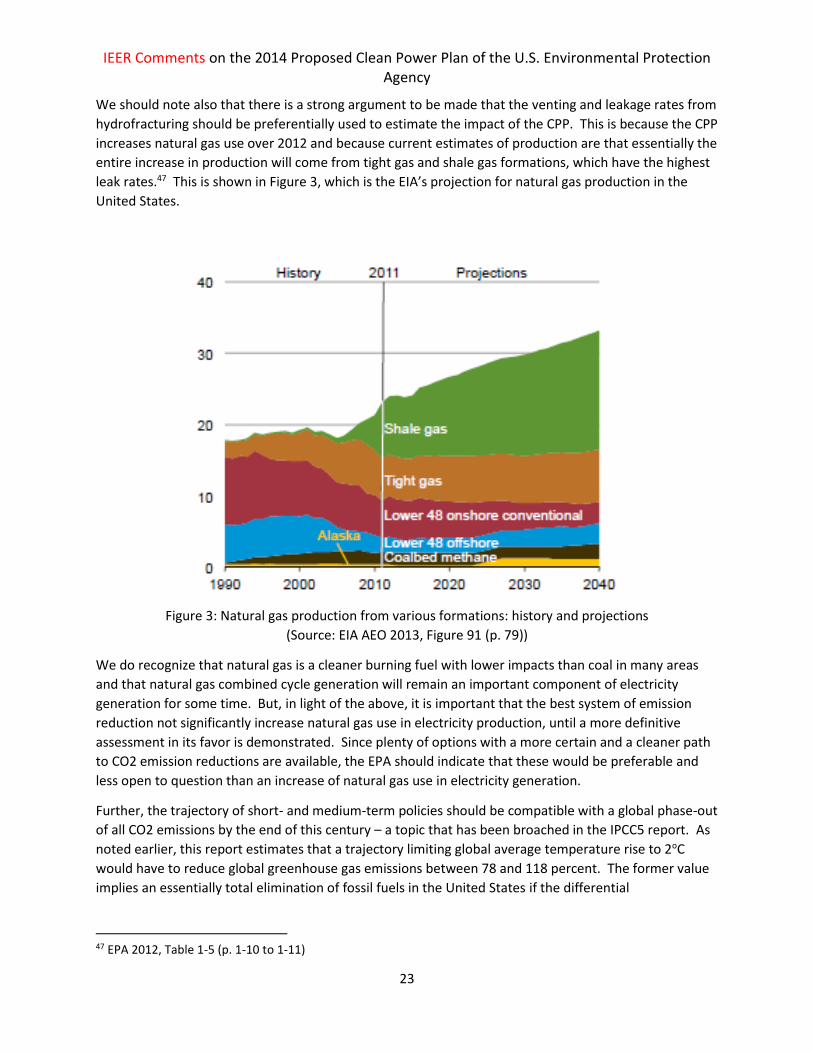
We should note also that there is a strong argument to be made that the venting and leakage rates from
hydrofracturing should be preferentially used to estimate the impact of the CPP. This is because the CPP
increases natural gas use over 2012 and because current estimates of production are that essentially the
entire increase in production will come from tight gas and shale gas formations, which have the highest
leak rates.47 This is shown in Figure 3, which is the EIA’s projection for natural gas production in the
United States.
Figure 3: Natural gas production from various formations: history and projections
(Source: EIA AEO 2013, Figure 91 (p. 79))
We do recognize that natural gas is a cleaner burning fuel with lower impacts than coal in many areas
and that natural gas combined cycle generation will remain an important component of electricity
generation for some time. But, in light of the above, it is important that the best system of emission
reduction not significantly increase natural gas use in electricity production, until a more definitive
assessment in its favor is demonstrated. Since plenty of options with a more certain and a cleaner path
to CO2 emission reductions are available, the EPA should indicate that these would be preferable and
less open to question than an increase of natural gas use in electricity generation.
Further, the trajectory of short- and medium-term policies should be compatible with a global phase-out
of all CO2 emissions by the end of this century – a topic that has been broached in the IPCC5 report. As
noted earlier, this report estimates that a trajectory limiting global average temperature rise to 2oC
would have to reduce global greenhouse gas emissions between 78 and 118 percent. The former value
implies an essentially total elimination of fossil fuels in the United States if the differential
47 EPA 2012, Table 1-5 (p. 1-10 to 1-11)

IEER Comments on the 2014 Proposed Clean Power Plan of the U.S. Environmental Protection Agency
24
responsibilities of developed countries under the UNFCCC are taken into account. The latter figure
means net CO2 removal from the atmosphere.
Specifically, the EPA’s natural gas use trajectory is even more intensive than that in the 2014 Annual
Economic Outlook (AEO) of the EIA. The latter projects that 30.6 percent of electricity generation in
2030 would use natural gas (see Table 8). The EPA’s modelling of the electricity sector for the year 2030
suggests that about 34 percent of the generation in 2030 would use natural gas as fuel.48 The EIA
reference case for natural gas in EIA AEO 2014 projects total natural gas supply for U.S. use of 29.56
trillion cubic feet in 2030.49 Using a 2.5 percent venting rate, 20-year warming potential of 86, and
assuming that 80 percent of natural gas is burned as fuel, the total emissions from the natural gas
system would be about 2.3 billion metric tons of CO2eq in the year 2030. This amounts to about 38
percent of 2010 net U.S. greenhouse gas emissions. In addition there would be emissions from coal and
petroleum use. Large investments in new natural gas production and transportation would have to be
made.
Finally, we note that prices of natural gas are projected to increase significantly, though at different
rates for different sectors under the EIA reference case.50 There are already millions of low-income
households where energy bills represent 10 percent or more of income.51 This problem would be
exacerbated by the NGCC trajectory proposed in the CPP. Specifically, the EIA’s Annual Energy Outlook
estimates that residential natural gas prices will increase by about 1.4 percent per year, from $10.69 to
$13.80 per 1,000 cubic feet (in 2012 dollars), between 2012 and 2030 in the reference case. As noted,
the CPP assumptions about natural gas are approximately compatible with the AEO reference
projection.52
Our conclusions are as follows:
The EPA has not shown that increased natural gas use by using NGCC generation to displace coal and oil and gas boilers can be part of a best system of emission reduction or even that an increase in natural gas use in the power sector can be used for compliance with the CPP. A more careful examination of leakage data using both 20-year and 100-year warming potentials is needed to make such a conclusion. Until that time, the second building block in the CPP, increased use of NGCC generation, cannot be considered part of the best system of emission reduction. In the worst case, it may not reduce CO2eq emissions at all or could even exacerbate them somewhat. In any event, a constraint on compliance plans should be that there should be no net increase in natural gas use in the power sector; changes in the use of natural gas can be allowed within that overall constraint.
48 EIA AEO 2014. The total natural gas generation in the CPP model run in the regulatory impact analysis is 1,388 million MWh (assuming for simplicity that oil and gas boilers use natural gas); the EIA value for natural gas use generation from EPA RIA 2014, Table 3-11, Option 1, State, for 2030. 49 EIA AEO 2014, Table 13 50 EIA AEO 2014, Table 13 51 DOE EERE 2012 BEDB, Table 2.9.8 52 EIA AEO 2014, Table 13 estimates the overall supply of natural gas for U.S. domestic use of 29.56 trillion cubic feet and dry gas production of 34.43 trillion cubic feet, including net exports of almost 5 trillion cubic feet. The CPP model runs of natural gas state that natural gas production would be between 31 and 32 trillion cubic feet but the amount of net exports is not specified in EPA RIA 2014, Table 3A-4 (p. 3A-7.

IEER Comments on the 2014 Proposed Clean Power Plan of the U.S. Environmental Protection Agency
25
The trajectory of increasing use of natural gas is incompatible with the far deeper reductions in CO2 emissions that will be required in the decades following 2030. The CPP has given no consideration to this issue. There is also the potential issue of the cost of stranded natural gas assets in the context of the decreases of natural gas use that are going to be necessary. This should factor into the EPA’s analysis of the potential problems associated with increasing natural gas production for use in the electricity sector (among others).
The trajectory proposed by the CPP is about the same as the natural gas reference case in EIA AEO 2014 (Table 13). The price increases estimated there would cause significant hardship to low-income households, especially those using natural gas for heating, which is the case for about half of U.S. households. The EIA estimates that residential natural gas prices will increase by almost 30 percent between 2012 and 2030. This could be devastating for low income households especially if the median household income continues the downward trend it has exhibited since about 2006.53 Of course, increased use of natural gas at higher prices than the reference year of 2012 would also put pressure on electricity prices. A Clean Power Plan that does not resort to significant increases in natural gas use and achieves CO2 reductions by low-cost methods, starting with efficiency, would have significantly less overall impact and much less impact on low-income households than the draft CPP.
2. EPA has not justified reliance on nuclear power as BSER.
As discussed below, the EPA has not justified the inclusion of existing or new nuclear generation as part
of the BSER. In making this assertion, we recognize that the states may reach the goals set by the EPA
for reduction in a variety of ways including those not considered in detail by the EPA or not considered
at all. The EPA has noted that states have wide flexibility in achieving the targets that will be finalized in
the rule. Thus, even if EPA removes nuclear power from the BSER, it is possible that the states may
include it in their implementation plans. Nevertheless, the EPA is required to satisfy the BSER criteria in
setting its targets – and it is clear that nuclear power does not meet those criteria. Equally important,
the CPP is an important guidance document for the states, providing information about economical and
technically feasible ways to reach the specified targets. That information should be accurate.
Specifically, the EPA claims that the four “building blocks” constitute the “Best System of Emission
Reduction.”54 But as we explain, in some cases, such as the inclusion of existing and under-construction
nuclear power plants in setting emission rate targets, the EPA did not evaluate the economic aspects
correctly and also did not address a number of non-air quality impacts, which the Clean Air Act requires
it to consider.55
a. Importance of a technology neutral analysis
53 U.S. Census Bureau 2014, p. 5 54 See EPA RIA 2014. Also see Section IV.B, of these comments for discussion of the building blocks. 55 Given that Option 2 of the Clean Power Plan is less stringent than Option 1 and that Option 1 is itself inadequate, we will not analyze Option 2 in these comments, except to note here and in our recommendations that it should be deleted from the plan. Within Option 1, we focus on the State variant, which produces the lowest result for emissions in 2030 (EPA RIA 2014, Table 3-5 (p. 3-20)).
IEER Comments on the 2014 Proposed Clean Power Plan of the U.S. Environmental Protection Agency
26
At the outset, it is important to point out that the EPA’s approach is not technology neutral. Rather it
sets the stage for the nuclear industry to extract concessions and subsidies from states. The EPA used a
formula for calculating allowable emission rates with existing nuclear (at 6 percent of each nuclear
power reactor) and all five reactors under construction. It thereby puts pressure on states to subsidize
the plants to keep them open and in the case of the ones under construction to complete them at
substantial risk and expense.
A technology neutral rule is important because it allows the consideration of the merits of each
technology that is used to reduce emissions based on its attributes in relation to the criteria for a
best system of emission reduction. For instance, new nuclear plants are much more expensive than
onshore wind and utility solar PV in reducing CO2 emissions. A technology-neutral rule allows the
choice of the most economical options. Within that framework, one can then stress those options
that have low non-air-quality impacts. In contrast, the CPP’s a priori decision that at-risk nuclear
plants should be kept on-line led to a mis-estimation of costs and an ignoring of a host of non-air
quality impacts.
b. Economic considerations do not support inclusion of nuclear as
BSER
i. Treatment of reactors under construction
The EPA recognizes that nuclear energy and renewable energy displace fossil fuel generation
and thereby reduce CO2 emissions:
Nuclear generating capacity facilitates CO2 emission reductions at fossil fuel-fired EGUs
[Electric Generating Units] by providing carbon-free generation that can replace
generation at those EGUs. Because of their relatively low variable operating costs,
nuclear EGUs that are available to operate typically are dispatched before fossil fuel-
fired EGUs.56
Yet, as explained in the Appendix, the arithmetic of the way the CPP emission targets are
developed does not recognize this reality. There were five nuclear power reactors under
construction at the time of the publication of the draft CPP in June 2014: two in Georgia, two in
South Carolina, and one in Tennessee. The EPA handled the reactors under construction by
adding the expected electricity generation from these reactors to fossil and renewable
generation, without assuming that nuclear would displace fossil fuel generation (see Section IV
for further discussion). This means that the CPP’s calculation method undervalues new nuclear
in terms of the extent to which emission rates would actually go down.
There are other problems with the way that the CPP includes nuclear reactors under
construction. The CPP assumes that the CO2 reductions due to the deployment of the reactors
under construction in Georgia, South Carolina, and Tennessee would have zero cost for the CO2
reductions:
The EPA believes that since the decisions to construct these units were made prior to
this proposal, it is reasonable to view the incremental cost associated with the CO2
56 79 FR 34830 (June 18, 2014), p. 34870, italics added.
IEER Comments on the 2014 Proposed Clean Power Plan of the U.S. Environmental Protection Agency
27
emission reductions available from completion of these units as zero for purposes of
setting states’ CO2 reduction goals (although EPA acknowledges that the planning for
those units likely included consideration of the possibility of future regulation of CO2
emissions from EGUs). Completion of these units therefore represents an opportunity to
reduce CO2 emissions from affected fossil fuel-fired EGUs at a very reasonable cost.57
Of course, if the EPA’s statement that the cost of CO2 reductions due to the five reactors under
construction is zero were true, that cost would be reasonable indeed. The problem is that the
statement is not correct. It is important to start by noting some facts:
The reactors themselves are very expensive. The cumulative cost of these five reactors, as currently estimated stands at about $31 billion.58
Significant expenditures remain to be incurred on these units.
Demand for electricity is growing far more slowly today than anticipated at the time the decision to build them was made.
Costs have risen and schedules for all these reactors have slipped.59
The Environmental Protection Division of the State of Georgia (Georgia EPD) has protested the EPA’s
assumption of zero cost and its inclusion of nuclear generation in the EPA’s rate calculation to tighten its
allowed rate of emissions. In fact, Georgia EPD has explicitly asked the EPA to remove “under-
construction nuclear generation from the computation of BSER [Best System of Emissions Reductions]
and state emissions goals.”60
A part of the Georgia EPD’s reasoning it that the costs are NOT zero. Rather, among other
things, Georgia ratepayers are currently paying substantial amounts to finance the construction
of Georgia Power’s portion of the two reactors, known as Vogtle 3 and Vogtle 4,61 which are
under construction:
Georgia EPD strongly disagrees with EPA’s assertion that the capital costs and
incremental costs associated with CO2 emission reductions as a result of Vogtle units 3
and 4 are zero. Georgia Power’s ratepayers began paying for this investment in nuclear
energy in 2011 with an increase in their base bill to pay for the financing of this
project….Once these plants are operational, the rate impact is projected to be 6-8% of
the base bill. The other utilities investing in Plant Vogtle are similarly passing on these
costs to their ratepayers.
57 79 FR 34830 (June 18, 2014), p. 34870, italics added. It is also pertinent to note that the decision to build Watts Bar was made in the early 1970s when reduction of CO2 emissions in the electricity sector was not a significant factor in economic or environmental decision-making. 58 TVA Watts Bar 2014, Burris 2014, and SACE 2014 59 Watts Bar: TVA Watts Bar 2008 and TVA Watts Bar 2014; VC Summer costs: Burris 2014, WNN 2013, and WNN 2014; Vogtle: SACE 2014 60 Georgia EPD 2014, p. 1 61 Two units, Vogtle 1 and 2, already operate at the site.

IEER Comments on the 2014 Proposed Clean Power Plan of the U.S. Environmental Protection Agency
28
These actual costs undermine EPA’s basic reason for including under-construction
nuclear in the baseline calculations. These units are not an inexpensive opportunity to
reduce carbon emissions from existing fossil units but are in fact quite costly. 62
The EPA itself noted that “nuclear generating capacity is also relatively expensive to build
compared to other types of generating capacity, and little new nuclear capacity has been
constructed in the U.S. in recent years.”63 The Georgia EPD has simply stated the same, relating
it explicitly to the climate context: nuclear reactors are a costly way to reduce CO2 emissions.
The Clean Power Plan explicitly acknowledges the importance of economics:
Under CAA section 111(d), state plans must establish standards of performance that
reflect the degree of emission limitation achievable through the application of the “best
system of emission reduction” that, taking into account the cost of achieving such
reduction and any non-air quality health and environmental impacts and energy
requirements, the Administrator determines has been adequately demonstrated (BSER).
Consistent with CAA section 111(d), the EPA is proposing state-specific goals that reflect
the EPA’s calculation of the emission limitation that each state can achieve through the
application of BSER.64
The under-construction nuclear reactors do not meet the cost criteria for a Best System of
Emission Reduction. First, nuclear reactors are an expensive way to reduce CO2 emissions, as
even the State of Georgia, which is encouraging nuclear development, has acknowledged. As
noted above, the EPA itself has commented that little reactor development is taking place
because of the high cost of building nuclear power plants.
Second, in order to include nuclear power in a “best system of emission reduction” the EPA
must show that the cost per metric ton of CO2 emissions reduced or avoided is comparable to
or less than other potential components of such a system or that there is a good, statutorily
authorized reason to accept higher costs. Nuclear does not meet either test.
For instance, a 2014 analysis by the Wall Street firm, Lazard, concluded that it was much
cheaper to use utility scale solar photovoltaic electricity than nuclear electricity to reduce CO2
emissions: $7 vs. $28, respectively, to displace coal generation at the lower end of the estimated
levelized costs of the two technologies. Wind energy, being cheaper than coal generation, has
negative costs of reducing CO2 emissions – that is using wind generated electricity to displace
coal results in money savings even before the costs of CO2 emission abatement are taken into
account. Energy efficiency is the cheapest way to reduce CO2 emissions.65 Even natural gas
combined cycle plants are a cheaper way to reduce CO2 emissions compared to nuclear, if one
does not take methane leaks into account or conclude, as the EPA has done, that methane leaks
would not add to the CO2eq emissions by the year 2030. We have significant reservations
about the analysis of methane leaks and do not recommend adding to NGCC generation for
62 Georgia EPD 2014, p. 5, italics added; bold in original 63 79 FR 34830 (June 18, 2014), p. 34870 64 79 FR 34830 (June 18, 2014), p. 34832, italics added. 65 Lazard 2014, p. 5 and IEER analysis of the levelized costs in Lazard 2014, p. 4. Costs for nuclear and fossil plants include sensitivity (in both directions) for fuel and other uncertain costs as estimated in Lazard 2014.

IEER Comments on the 2014 Proposed Clean Power Plan of the U.S. Environmental Protection Agency
29
displacing coal for that reason. We note it here because in the EPA’s framework NGCC is much
more cost effective than nuclear in displacing CO2 from coal-fired power plants.
Table 1: Levelized cost of various technologies and corresponding costs to reduce CO2 when
used to displace new coal generation
Low Average High
Nuclear levelized cost, $/MWh $90 $112 $134
Wind levelized cost, $/MWh $37 $59 $81
Utility solar PV levelized cost, $/MWh
$72 $79 $86
New coal-fired plant levelized cost, $/MWh
$61 $110 $158
Cost increase due to using nuclear compared to wind $/metric ton CO2
$56 $56 $56
Cost increase due to using nuclear compared to solar $/metric ton CO2
$19 $35 $51
Source: Lazard 2014 and IEER calculations based on Lazard 2014, p. 4. Emissions from a coal-
fired power plant taken as 0.939 tons/MWh, corresponding to an emissions rate of 2,070
lb/MWh after coal plant retrofits in the CPP (calculated by IEER).
New nuclear is a far more expensive way to reduce CO2 emissions than four major resources
(efficiency, onshore wind, utility solar, and NGCC plants) in the EPA’s framework and three in
ours (onshore wind, utility solar, and efficiency). The rapid decrease in cost of distributed solar
systems will also very likely further increase their competiveness in comparison to new nuclear
plants. We note here that Georgia Power recently revealed that they selected utility-scale solar
bid at a levelized price below $65 per MWh,66 far lower than the lowest estimated cost of new
nuclear in Lazard 2014 at $90 per MWh.67
Lazard estimates energy efficiency costs to be in the range of $0 to $50 per megawatt-hour
compared to a range of $90 to $134 per megawatt-hour for nuclear.68 The average nuclear cost
estimate is $112 per megawatt-hour compared to the average estimate of $25 for efficiency.
Hence, if we use the Lazard 2014 estimates, investments in efficiency would, on average, be
preferred to nuclear even if the four reactors were three-fourths complete. In this context, we
66 Georgia Power 2014, p. 19. 67 We recognize that solar electricity purchased power agreements reflect significant subsidies at the present time. Two points are worthy of note in that context. Nuclear power still receives significant subsidies in the form of limitations on liability (via the Price Anderson Act; in the case of Georgia Power and other owners of Vogtle 3 and 4, subsidies include risk-free payments for construction that ratepayers are force to advance to the company by law (called “Construction Work in Progress”) and a risk-free federal loan guarantee that carries no fee. Moreover, solar power prices are headed down, but nuclear power costs are, as has been typical in the past, plagued by delays and cost overruns. 68 Lazard 2014, p. 4

IEER Comments on the 2014 Proposed Clean Power Plan of the U.S. Environmental Protection Agency
30
note that the states of Georgia and South Carolina are far behind the rest of the country in
efficiency investments, being ranked 35th and 42nd among the states in this area by the American
Council on an Energy-Efficient Economy.69 That same group estimates the average cost of
energy efficiency measures to be $54 per megawatt-hour, including utility and participant
expenditures.70 Actually, the value of $54 per megawatt-hour is an unweighted average of the
total cost of efficiency programs. The cost, weighted by generation in each state, which is more
representative of the overall efficiency effort, is $49 per megawatt-hour.71 Either number is far
lower than the average cost of new nuclear as estimated by Lazard.72
Second, the EPA’s assumption that the costs of the reactors under construction are “sunk costs”
is factually wrong, since none of the reactors is complete and large expenditures remain to be
incurred.
Third, it is not at all clear that the reactors will be completed. Between 1972 and 1990, over 120
reactors were cancelled by utilities, and this was after $15 billion or more had been spent on
these units.73 We estimate that this figure for the cancelled units translates to about $30 billion
in 2012 dollars.74 Even in the case of reactors where construction was started, the record is
historically not much better than fifty-fifty. According to the official record, ninety-four reactors
were cancelled; there are one hundred currently in operation. Another eighteen operated but
all were shut before the expiry of a normal 40-year NRC-issued operating license.75
Vogtle 3 and 4 and the two reactors in South Carolina (V.C. Summer Units 2 and 3) are far from
complete; they are not scheduled to open (variously) until between late 2017 and early 2020,
even if one assumes there will be no further delays.76 Vogtle is the lead reactor project in the
U.S. and the reactors are at least 21-months delayed.77 In fact, the delays will be greater,
according to the November 2014 testimony before the Georgia Public Service Commission. As
of this writing in late November 2014, there is no official opening date for Vogtle 3 and 4.78 In
early August 2014, SCE&G, majority owner of the V.C. Summer reactors announced another
delay of approximately 12 months; the project is now more than 2 ½ years delayed.79
69 ACEEE State Rankings 2014 at http://database.aceee.org/state-scorecard-rank 70 ACEEE 2014, Table 6 (p. 23), in 2011 dollars, in a sample of seven states. 71 Calculated by IEER from ACEEE 2014, Table 6 and state generation data. 72 The average cost of nuclear in Lazard 2014 (p. 4) is $112 per megawatt-hour, making half that value equal to $56 per megawatt-hour. 73 Hearth, Melicher, and Gurley 1990 74 See data from the St. Louis Federal Reserve for the GDP deflator at http://research.stlouisfed.org/fred2/series/GDPDEF/. (St. Louis Federal Reserve 2014) 75 Information compiled from NRC Information Digest 2014, Appendixes A, C, and D. For reactors that operated and shut down, only the ones more than 500 megawatts thermal were included. Utilities also spent money on planning units that they never ordered. Hearth, Melicher, and Gurley 1990 noted 120 “cancelled” nuclear units. 76 For Summer: WNN 2014; for Vogtle: SACE 2014. 77 Originally Vogtle reactor Unit 3 was scheduled to come online April 1, 2016 and reactor Unit 4 one year later, on April 1, 2017. Updated estimates, as stated in expert testimony in the combined 9th/10th Vogtle Construction Monitoring (VCM) docket, are now December 31, 2017 and December 31, 2018 respectively, representing a 21-month delay. (Roetger and Jacobs 2013, p. 11; Hayet 2013, p. 6; and Roetger and Jacobs 2014a, p. 7) 78 Roetger and Jacobs 2014b, pp. 32-33 79 SRS Watch 2014
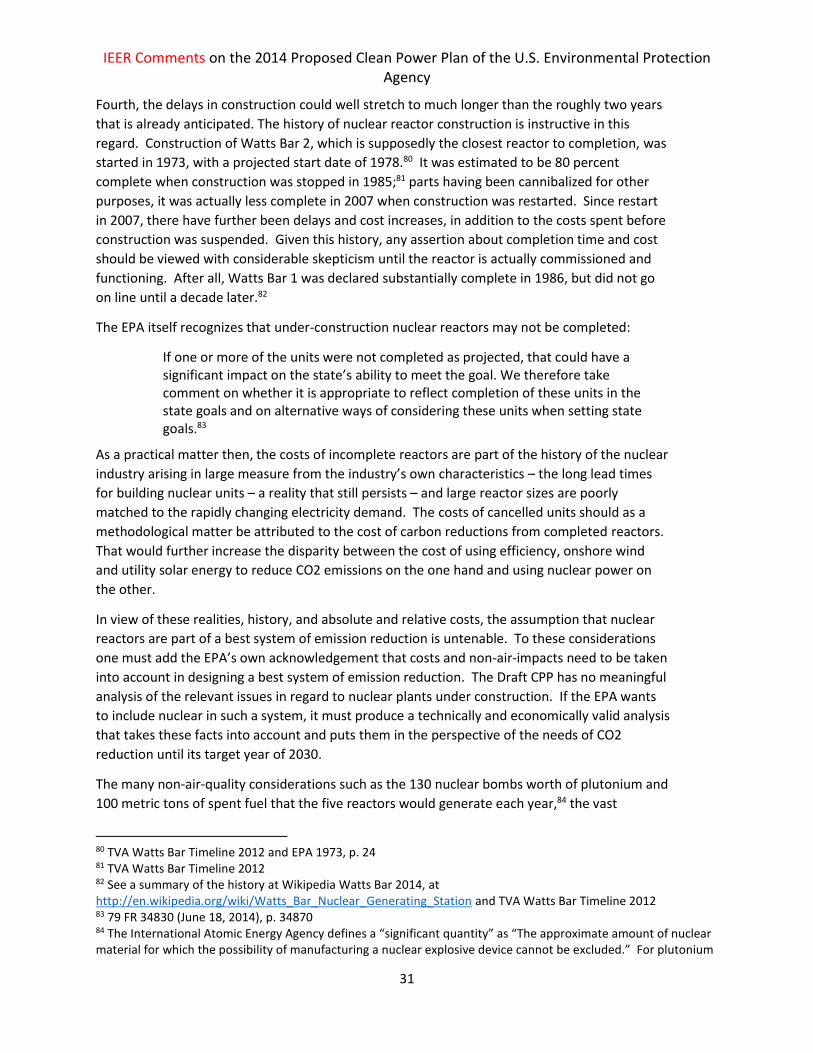
IEER Comments on the 2014 Proposed Clean Power Plan of the U.S. Environmental Protection Agency
31
Fourth, the delays in construction could well stretch to much longer than the roughly two years
that is already anticipated. The history of nuclear reactor construction is instructive in this
regard. Construction of Watts Bar 2, which is supposedly the closest reactor to completion, was
started in 1973, with a projected start date of 1978.80 It was estimated to be 80 percent
complete when construction was stopped in 1985;81 parts having been cannibalized for other
purposes, it was actually less complete in 2007 when construction was restarted. Since restart
in 2007, there have further been delays and cost increases, in addition to the costs spent before
construction was suspended. Given this history, any assertion about completion time and cost
should be viewed with considerable skepticism until the reactor is actually commissioned and
functioning. After all, Watts Bar 1 was declared substantially complete in 1986, but did not go
on line until a decade later.82
The EPA itself recognizes that under-construction nuclear reactors may not be completed:
If one or more of the units were not completed as projected, that could have a significant impact on the state’s ability to meet the goal. We therefore take comment on whether it is appropriate to reflect completion of these units in the state goals and on alternative ways of considering these units when setting state goals.83
As a practical matter then, the costs of incomplete reactors are part of the history of the nuclear
industry arising in large measure from the industry’s own characteristics – the long lead times
for building nuclear units – a reality that still persists – and large reactor sizes are poorly
matched to the rapidly changing electricity demand. The costs of cancelled units should as a
methodological matter be attributed to the cost of carbon reductions from completed reactors.
That would further increase the disparity between the cost of using efficiency, onshore wind
and utility solar energy to reduce CO2 emissions on the one hand and using nuclear power on
the other.
In view of these realities, history, and absolute and relative costs, the assumption that nuclear
reactors are part of a best system of emission reduction is untenable. To these considerations
one must add the EPA’s own acknowledgement that costs and non-air-impacts need to be taken
into account in designing a best system of emission reduction. The Draft CPP has no meaningful
analysis of the relevant issues in regard to nuclear plants under construction. If the EPA wants
to include nuclear in such a system, it must produce a technically and economically valid analysis
that takes these facts into account and puts them in the perspective of the needs of CO2
reduction until its target year of 2030.
The many non-air-quality considerations such as the 130 nuclear bombs worth of plutonium and
100 metric tons of spent fuel that the five reactors would generate each year,84 the vast
80 TVA Watts Bar Timeline 2012 and EPA 1973, p. 24 81 TVA Watts Bar Timeline 2012 82 See a summary of the history at Wikipedia Watts Bar 2014, at http://en.wikipedia.org/wiki/Watts_Bar_Nuclear_Generating_Station and TVA Watts Bar Timeline 2012 83 79 FR 34830 (June 18, 2014), p. 34870 84 The International Atomic Energy Agency defines a “significant quantity” as “The approximate amount of nuclear material for which the possibility of manufacturing a nuclear explosive device cannot be excluded.” For plutonium

IEER Comments on the 2014 Proposed Clean Power Plan of the U.S. Environmental Protection Agency
32
amounts of water they would use, and other impacts listed in Section IV.B2.c below, should be
added to the list of considerations. Further, as noted below and in Cooper Comments 2014,
nuclear reactors are very inflexible and a poor complement for variable solar and wind
generation.85 These are the two most plentiful renewable resources in the United States.
Our conclusion is that the reactors under construction, or indeed, any new nuclear reactors, do
not meet the criteria for inclusion in the best system of emission reduction. For instance, the
putative economics of small modular reactors are entirely dependent on a supply chain in which
major components would be mass manufactured. This is highly unlikely in the United States
without massive government subsidies or government orders or both.86 The EPA needs to
address such issues substantively before including nuclear reactors under construction or new
nuclear reactors in the BSER. The EPA should explicitly indicate that reactors that are not
currently certified by the Nuclear Regulatory Commission would not be considered as viable
parts of state compliance plans.
ii. Treatment of existing nuclear generation
The Clean Power Plan’s treatment of non-fossil fuel existing generation, and especially existing nuclear
generation, is not well-founded technically or economically. The CPP's inclusion and exclusion of 2012
non-fossil fuel generation sources has nothing to do with actual emission reductions, and EPA's
rationales for its treatment of these sources are weak and inconsistent. We will start by considering
existing nuclear generation and then link the problem to other existing non-fossil fuel generation:
hydropower and non-hydropower renewables.
The EPA includes about six percent of the existing nuclear generation in 2012 in each state to calculate
the 2030 target rate of CO2 emissions. Obviously, for the states that have no nuclear generation, this
value is zero. EPA's rationale is that this is a “way to increase the amount of available nuclear capacity”
because it “preserve[s] existing nuclear EGUs [electricity generating units] that might otherwise be
retired.”87
We do not agree with the EPA’s logic for the simple reason that existing units do not “increase the
amount of available nuclear capacity”; keeping them open just maintains existing generation.88 On the
other hand, if units are retired that decreases the available nuclear capacity.
the amount is about 8 kilograms. (IAEA 2001, p. 19). IAEA 2007, Table 27 (p. 74), provides the composition of spent fuel. At 50 megawatt-days thermal per kilogram of heavy metal burn up, the plutonium content is about 1.04 percent. Typical annual spent fuel discharge from a light water reactor is 20 metric tons (IPFM 2011, Table 1.1). This gives an estimate of about 100 metric tons for the spent fuel discharge from five reactors and about 1,040 kilograms of total plutonium per year. Using 8 kilograms per bomb, assuming separation, gives an annual total of about 130 bombs (rounded). 85 Cooper Comments 2014. For estimates of renewable energy potential see NREL Potentials 2012. 86 Makhijani 2013 87 79 FR 34830 (June 18, 2014), p. 34870 88 Existing units can apply to the Nuclear Regulatory Commission for an increase in capacity. This involves issues of safety and cost that the EPA has not addressed. The EPA six percent of existing nuclear deals only with existing capacity and baseline generation in the year 2012.

IEER Comments on the 2014 Proposed Clean Power Plan of the U.S. Environmental Protection Agency
33
Secondly, EPA’s rationale for choosing six percent is that this is about the amount of nuclear generation
capacity (5.7 gigawatts) that the Department of Energy's Energy Information Administration (EIA) has
estimated in its reference case in the 2014 Annual Energy Outlook (AEO) that would be retired in the
coming years. Here is the rationale as provided in the Clean Power Plan:
…[The] EIA in its most recent Annual Energy Outlook has projected an additional 5.7 GW of capacity reductions to the nuclear fleet. EIA describes the projected capacity reductions – which are not tied to the projected retirement of any specific unit – as necessary to recognize the “continued economic challenges” faced by the higher-cost nuclear units. Likewise, without making any judgment about the likelihood that any individual EGU will retire, we view this 5.7 GW, which comprises an approximately six percent share of nuclear capacity, as a reasonable proxy for the amount of nuclear capacity at risk of retirement.89
But using six percent of nuclear capacity and translating that into the same percentage in each state (“without making any judgment about the likelihood that any individual [nuclear] EGU will retire”) does not reflect what is in the EIA’s analysis. The “economic challenges” that the EIA analyzed were in the context of nuclear units that operate in deregulated markets where every generating unit that feeds into the transmission system organized by independent system operators must bid into it. If the price is too high, its bid is rejected, as is clear from the text in the EIA report cited by the EPA. It is worth quoting the EIA report at length, given the EPA’s heavy reliance on the EIA’s analysis:
The outlook for nuclear power also has been altered by the changing conditions in U.S. electricity markets. Nuclear power plants have lower fuel costs than either coal-fired or natural gas-fired plants, translating to lower variable operating costs and ensuring that they are dispatched when available. The spread between the price of electricity and the fuel cost for nuclear plants is often referred to as the quark spread. Nuclear power plant owners in wholesale markets rely on sufficient quark spreads to cover nonfuel operations, maintenance, and any new capital expenses associated with the plants to provide a return on their investment. Lower wholesale electricity prices have reduced quark spreads for all nuclear power plants, especially those with increasing operations and maintenance (O&M) costs or capital addition costs. The AEO2014 Reference case assumes an additional 6 GW of generic nuclear retirements from 2012 to 2019, beyond the six reactor retirements already announced (a total that includes the Oyster Creek plant), as higher-cost units face continued economic challenges. Those projected retirements are represented by derating of existing capacity for plants in vulnerable regions, not by retiring any specific plants. Higher natural gas prices in the Reference case after 2020 support the continued operation of the U.S. nuclear fleet and limit retirements from 2020 through 2040.90
89 79 FR 34830 (June 18, 2014), p. 34871 90 Jones and Leff 2014, italics added. While there is one sentence in this quote that refers to “all nuclear power plants” (“Lower wholesale electricity prices have reduced quark spreads for all nuclear power plants”), the context makes it clear that it applies only plants that have to bid into wholesale power markets.

IEER Comments on the 2014 Proposed Clean Power Plan of the U.S. Environmental Protection Agency
34
It is clear that the EIA had in mind only nuclear capacity that operates in merchant markets. Hence the EIA’s retirement analysis applies only to those markets and NOT to regulated markets (for instance in California, Arizona, and the Southeastern United States), where regulated utilities retain generation assets and therefore have a guaranteed income stream and rate of return on those assets (presuming prudent management). The EPA took the phrase “continued economic challenges” out of context and applied a six percent factor to every reactor with nuclear generation in 2012. This is incorrect. Including six percent of every nuclear reactor in calculating the target rate in most cases does not address the issues the EIA was raising. The reactors in states where generation is regulated do not face market risks. But including every reactor does set the stage for potential additional subsidies to nuclear plants since all those states would have to find replacement non-carbon generation if the plants retired. If the EPA wants to include existing nuclear generation in its Clean Power Plan, it must first identify the reactors at risk of retirement and estimate the cost of keeping them online in the face of deteriorating economics. The EPA should then make a judgment about the relative economic merits of including at-risk nuclear generation in the rule. Of course, this still does not overcome the problem of the many non-air quality impacts of nuclear, but it is a necessary though not sufficient first step that is needed for deciding whether existing nuclear can be a part of the BSER. Thirdly, the EPA provides no substantive discussion of how adding six percent of nuclear generation to tighten the target emissions rate for the year 2030 would work to keep nuclear capacity operating. Nuclear power plants are all-or-nothing devices – either 24/7 or 0/365.91 One cannot keep six percent of a reactor open. If a nuclear reactor is uneconomical, it would be completely shut down and there would be zero electricity generation. If such a reactor were to be subsidized and kept open, the subsidy would have to be for the whole reactor, not six percent of it. Hence, by including this six percent in its calculation of the target rate, the EPA has provided the nuclear industry in deregulated markets with a tool to extract financial concessions for 100 percent of the reactor. For instance, Exelon has already been threatening to close reactors in deregulated markets if it does not get better prices. It lobbied the Illinois legislature to pass a resolution. It has been lobbying against the Production Tax Credit for wind energy, on the ground that the resultant subsidized energy is undermining markets; however,92 it has made no suggestion that the Price-Anderson Act, which shields the nuclear industry from liability above about $13 billion per accident (or incidents like theft or sabotage),93 be repealed. Accidents can and have resulted in
91 Examples of the latter include the shutdown on the entire Japanese nuclear power system in the aftermath of the 2011 Fukushima accident, the early shutdown of eight reactors in Germany, and the unrelated shutdown of San Onofre in California due to events following the discovery of malfunctioning steam generators in 2012. Japan’s government has a policy of restarting the reactors, but, more than three years after the accident, they remain shut down. 92 Wernau 2014 and Crane 2014 93 NRC 2014
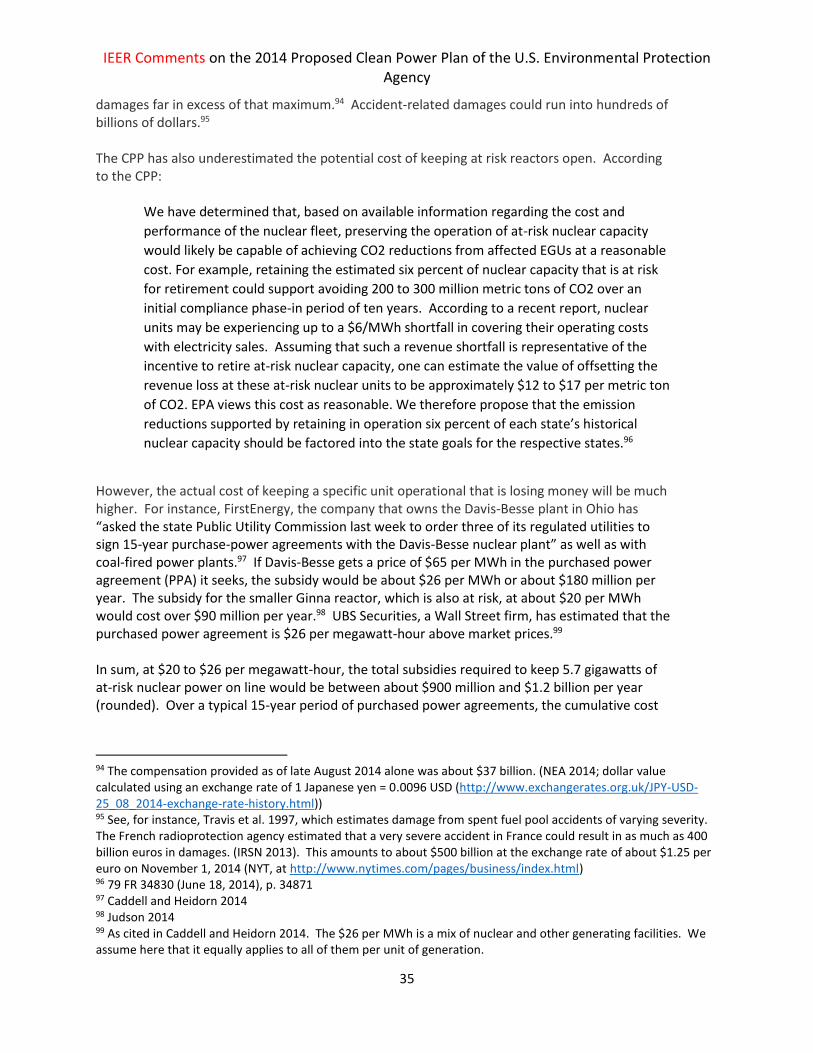
IEER Comments on the 2014 Proposed Clean Power Plan of the U.S. Environmental Protection Agency
35
damages far in excess of that maximum.94 Accident-related damages could run into hundreds of billions of dollars.95 The CPP has also underestimated the potential cost of keeping at risk reactors open. According to the CPP:
We have determined that, based on available information regarding the cost and
performance of the nuclear fleet, preserving the operation of at-risk nuclear capacity
would likely be capable of achieving CO2 reductions from affected EGUs at a reasonable
cost. For example, retaining the estimated six percent of nuclear capacity that is at risk
for retirement could support avoiding 200 to 300 million metric tons of CO2 over an
initial compliance phase-in period of ten years. According to a recent report, nuclear
units may be experiencing up to a $6/MWh shortfall in covering their operating costs
with electricity sales. Assuming that such a revenue shortfall is representative of the
incentive to retire at-risk nuclear capacity, one can estimate the value of offsetting the
revenue loss at these at-risk nuclear units to be approximately $12 to $17 per metric ton
of CO2. EPA views this cost as reasonable. We therefore propose that the emission
reductions supported by retaining in operation six percent of each state’s historical
nuclear capacity should be factored into the state goals for the respective states.96
However, the actual cost of keeping a specific unit operational that is losing money will be much higher. For instance, FirstEnergy, the company that owns the Davis-Besse plant in Ohio has “asked the state Public Utility Commission last week to order three of its regulated utilities to sign 15-year purchase-power agreements with the Davis-Besse nuclear plant” as well as with coal-fired power plants.97 If Davis-Besse gets a price of $65 per MWh in the purchased power agreement (PPA) it seeks, the subsidy would be about $26 per MWh or about $180 million per year. The subsidy for the smaller Ginna reactor, which is also at risk, at about $20 per MWh would cost over $90 million per year.98 UBS Securities, a Wall Street firm, has estimated that the purchased power agreement is $26 per megawatt-hour above market prices.99 In sum, at $20 to $26 per megawatt-hour, the total subsidies required to keep 5.7 gigawatts of at-risk nuclear power on line would be between about $900 million and $1.2 billion per year (rounded). Over a typical 15-year period of purchased power agreements, the cumulative cost
94 The compensation provided as of late August 2014 alone was about $37 billion. (NEA 2014; dollar value calculated using an exchange rate of 1 Japanese yen = 0.0096 USD (http://www.exchangerates.org.uk/JPY-USD-25_08_2014-exchange-rate-history.html)) 95 See, for instance, Travis et al. 1997, which estimates damage from spent fuel pool accidents of varying severity. The French radioprotection agency estimated that a very severe accident in France could result in as much as 400 billion euros in damages. (IRSN 2013). This amounts to about $500 billion at the exchange rate of about $1.25 per euro on November 1, 2014 (NYT, at http://www.nytimes.com/pages/business/index.html) 96 79 FR 34830 (June 18, 2014), p. 34871 97 Caddell and Heidorn 2014 98 Judson 2014 99 As cited in Caddell and Heidorn 2014. The $26 per MWh is a mix of nuclear and other generating facilities. We assume here that it equally applies to all of them per unit of generation.

IEER Comments on the 2014 Proposed Clean Power Plan of the U.S. Environmental Protection Agency
36
would be between approximately $13.5 billion and $17.5 billion, using an average capacity factor of 90 percent. Fourthly, including six percent of nuclear as well as including all new nuclear but excluding hydropower entirely is not technology neutral. The EPA gave the following rationale for excluding existing hydropower:
Hydropower generation is excluded from this existing 2012 generation for purposes of quantifying BSER-related RE generation potential because building the methodology from a baseline that includes large amounts of existing hydropower generation could distort regional targets that are later applied to states lacking that existing hydropower capacity. The exclusion of pre-existing hydropower generation from the baseline of this target-setting framework does not prevent states from considering incremental hydropower generation from existing facilities (or later-built facilities) as an option for compliance with state goals.100
Excluding hydropower also yields strange results. For instance, conventional hydropower constituted about 70 percent of Idaho’s total generation in 2012.101 Its actual CO2 emission rate in 2012, including all generation in the state, was only 94 lb/MWh.102 By excluding hydropower, the EPA came up with a target rate of 228 lb/MWh for the year 2030,103 which is 140 percent larger than Idaho's 2012 CO2 emission rate; hydro is not included in the compliance calculation. The result is quite confusing and not transparent because, in turn, the EPA does not apply the rate to all generation in 2030, but only to the restricted set that omits hydropower.104 Similarly (and for the same reasons), the EPA’s 2030 emission rate targets for Oregon and Washington State are 46 percent and 70 percent larger than their actual overall 2012 rates, respectively, but also applied to non-hydro generation in estimating future emissions.105 To calculate the reductions achieved using the EPA method, it is necessary to run a complex computer model, known as the Integrated Planning Model (IPM) to derive the carbon reductions corresponding to the EPA’s target emission rates.106 The contorted results are a reflection of an arbitrary method of setting 2030 target rates that should and can easily be rectified.
100 79 FR 34830 (June 18, 2014), p. 34867 101 EIA State Electricity Profiles 2014, Idaho Table 5 102 EIA State Electricity Profiles 2014, Idaho Table 1. CO2 emissions for 2012 were calculated by IEER from the EPA’s spreadsheet entitled “20140602tsd-state-goal-data-computation_1.xslx” in the Clean Power Plan. (See EPA CCP Tech Docs 2014) 103 79 FR 34830 (June 18, 2014), p. 34957 104 It also omits 94 percent of nuclear, but that is not relevant in the case of Idaho, which does not have a nuclear power plant. 105 EIA State Electricity Profiles 2014, Oregon Tables 1 and 5; EIA State Electricity Profiles 2014, Washington Tables 1 and 5; and 79 FR 34830 (June 18, 2014), p. 34958 106 EPA IMP 2014
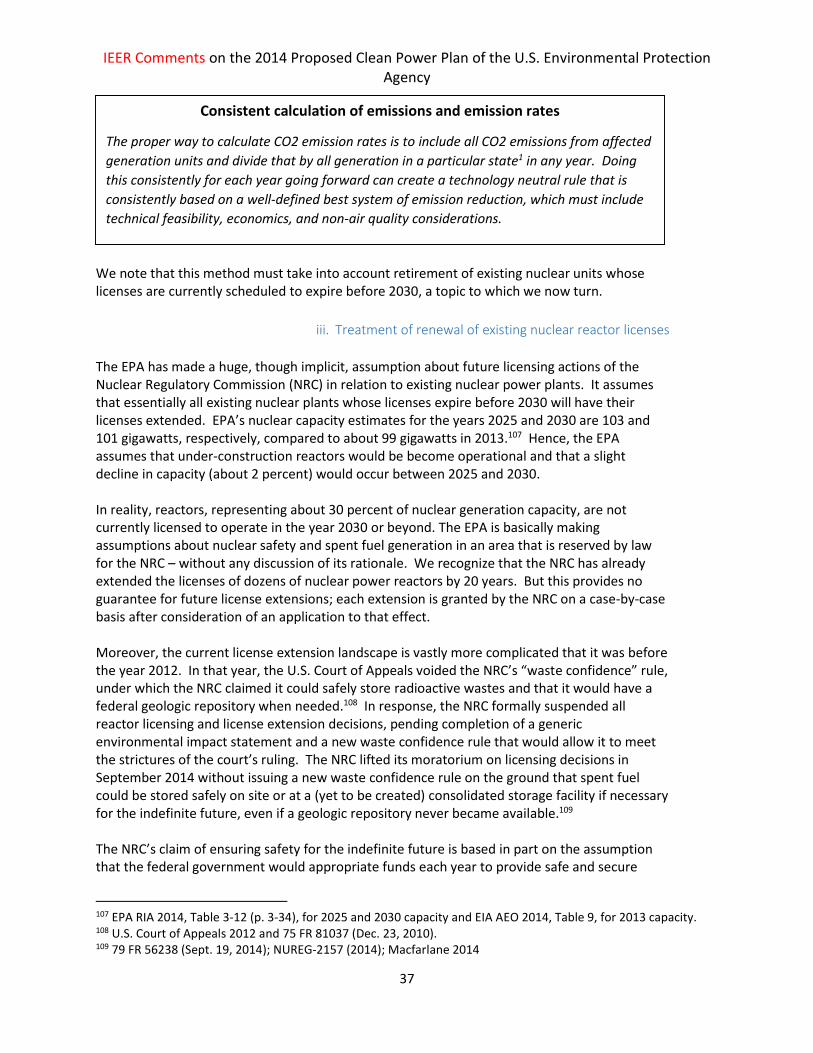
IEER Comments on the 2014 Proposed Clean Power Plan of the U.S. Environmental Protection Agency
37
We note that this method must take into account retirement of existing nuclear units whose licenses are currently scheduled to expire before 2030, a topic to which we now turn.
iii. Treatment of renewal of existing nuclear reactor licenses
The EPA has made a huge, though implicit, assumption about future licensing actions of the Nuclear Regulatory Commission (NRC) in relation to existing nuclear power plants. It assumes that essentially all existing nuclear plants whose licenses expire before 2030 will have their licenses extended. EPA’s nuclear capacity estimates for the years 2025 and 2030 are 103 and 101 gigawatts, respectively, compared to about 99 gigawatts in 2013.107 Hence, the EPA assumes that under-construction reactors would be become operational and that a slight decline in capacity (about 2 percent) would occur between 2025 and 2030. In reality, reactors, representing about 30 percent of nuclear generation capacity, are not currently licensed to operate in the year 2030 or beyond. The EPA is basically making assumptions about nuclear safety and spent fuel generation in an area that is reserved by law for the NRC – without any discussion of its rationale. We recognize that the NRC has already extended the licenses of dozens of nuclear power reactors by 20 years. But this provides no guarantee for future license extensions; each extension is granted by the NRC on a case-by-case basis after consideration of an application to that effect. Moreover, the current license extension landscape is vastly more complicated that it was before the year 2012. In that year, the U.S. Court of Appeals voided the NRC’s “waste confidence” rule, under which the NRC claimed it could safely store radioactive wastes and that it would have a federal geologic repository when needed.108 In response, the NRC formally suspended all reactor licensing and license extension decisions, pending completion of a generic environmental impact statement and a new waste confidence rule that would allow it to meet the strictures of the court’s ruling. The NRC lifted its moratorium on licensing decisions in September 2014 without issuing a new waste confidence rule on the ground that spent fuel could be stored safely on site or at a (yet to be created) consolidated storage facility if necessary for the indefinite future, even if a geologic repository never became available.109 The NRC’s claim of ensuring safety for the indefinite future is based in part on the assumption that the federal government would appropriate funds each year to provide safe and secure
107 EPA RIA 2014, Table 3-12 (p. 3-34), for 2025 and 2030 capacity and EIA AEO 2014, Table 9, for 2013 capacity. 108 U.S. Court of Appeals 2012 and 75 FR 81037 (Dec. 23, 2010). 109 79 FR 56238 (Sept. 19, 2014); NUREG-2157 (2014); Macfarlane 2014
Consistent calculation of emissions and emission rates
The proper way to calculate CO2 emission rates is to include all CO2 emissions from affected
generation units and divide that by all generation in a particular state1 in any year. Doing
this consistently for each year going forward can create a technology neutral rule that is
consistently based on a well-defined best system of emission reduction, which must include
technical feasibility, economics, and non-air quality considerations.
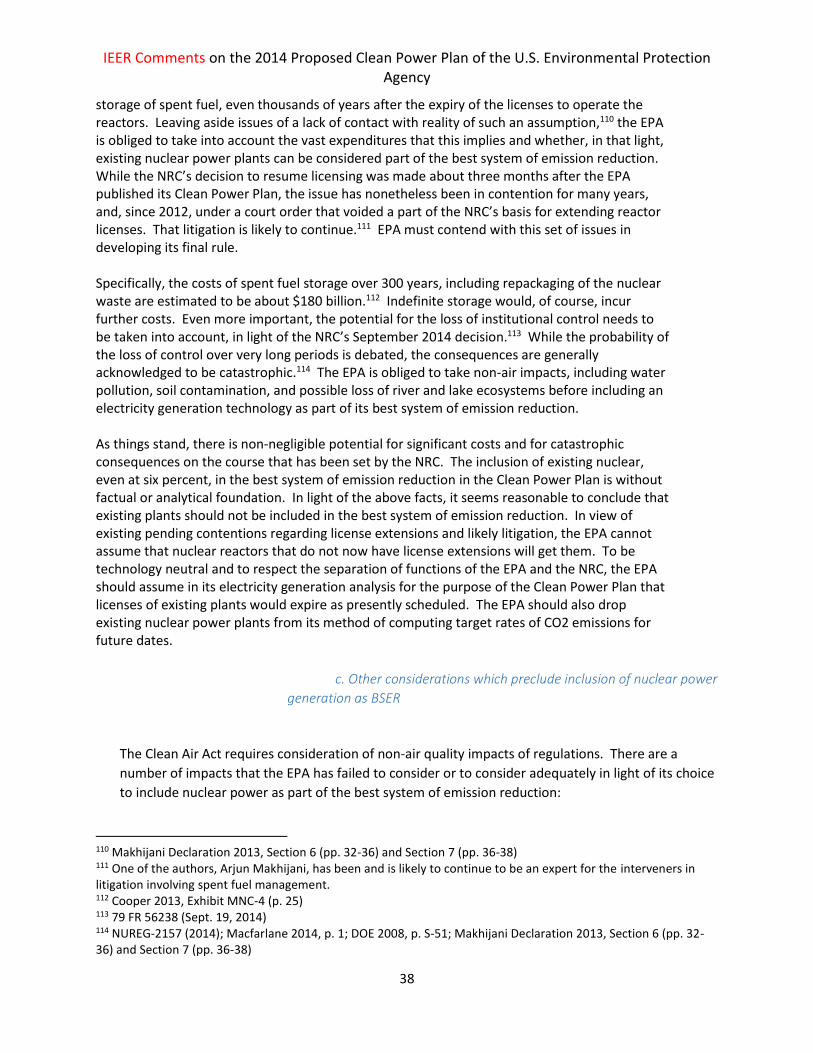
IEER Comments on the 2014 Proposed Clean Power Plan of the U.S. Environmental Protection Agency
38
storage of spent fuel, even thousands of years after the expiry of the licenses to operate the reactors. Leaving aside issues of a lack of contact with reality of such an assumption,110 the EPA is obliged to take into account the vast expenditures that this implies and whether, in that light, existing nuclear power plants can be considered part of the best system of emission reduction. While the NRC’s decision to resume licensing was made about three months after the EPA published its Clean Power Plan, the issue has nonetheless been in contention for many years, and, since 2012, under a court order that voided a part of the NRC’s basis for extending reactor licenses. That litigation is likely to continue.111 EPA must contend with this set of issues in developing its final rule. Specifically, the costs of spent fuel storage over 300 years, including repackaging of the nuclear waste are estimated to be about $180 billion.112 Indefinite storage would, of course, incur further costs. Even more important, the potential for the loss of institutional control needs to be taken into account, in light of the NRC’s September 2014 decision.113 While the probability of the loss of control over very long periods is debated, the consequences are generally acknowledged to be catastrophic.114 The EPA is obliged to take non-air impacts, including water pollution, soil contamination, and possible loss of river and lake ecosystems before including an electricity generation technology as part of its best system of emission reduction. As things stand, there is non-negligible potential for significant costs and for catastrophic consequences on the course that has been set by the NRC. The inclusion of existing nuclear, even at six percent, in the best system of emission reduction in the Clean Power Plan is without factual or analytical foundation. In light of the above facts, it seems reasonable to conclude that existing plants should not be included in the best system of emission reduction. In view of existing pending contentions regarding license extensions and likely litigation, the EPA cannot assume that nuclear reactors that do not now have license extensions will get them. To be technology neutral and to respect the separation of functions of the EPA and the NRC, the EPA should assume in its electricity generation analysis for the purpose of the Clean Power Plan that licenses of existing plants would expire as presently scheduled. The EPA should also drop existing nuclear power plants from its method of computing target rates of CO2 emissions for future dates.
c. Other considerations which preclude inclusion of nuclear power
generation as BSER
The Clean Air Act requires consideration of non-air quality impacts of regulations. There are a
number of impacts that the EPA has failed to consider or to consider adequately in light of its choice
to include nuclear power as part of the best system of emission reduction:
110 Makhijani Declaration 2013, Section 6 (pp. 32-36) and Section 7 (pp. 36-38) 111 One of the authors, Arjun Makhijani, has been and is likely to continue to be an expert for the interveners in litigation involving spent fuel management. 112 Cooper 2013, Exhibit MNC-4 (p. 25) 113 79 FR 56238 (Sept. 19, 2014) 114 NUREG-2157 (2014); Macfarlane 2014, p. 1; DOE 2008, p. S-51; Makhijani Declaration 2013, Section 6 (pp. 32-36) and Section 7 (pp. 36-38)

IEER Comments on the 2014 Proposed Clean Power Plan of the U.S. Environmental Protection Agency
39
1. Water impact of thermal generation, specifically nuclear generation: between 6.5 and 16 million gallons of water evaporated each day by each 1,000 megawatt reactor; and between 26 million and 1.1 billion gallons of water taken in (withdrawn) from water bodies.115 Consumption (due to evaporation) and intake requirements for a given plant output vary with the specific cooling system used and the weather.
2. Vulnerability of nuclear reactors during extreme weather events, including hurricanes, floods, and droughts.
3. The added cost and associated CO2 emissions of spinning reserves required by large reactors and associated CO2 emissions where those reserves are in the form of gas turbines.
4. The potential for reactors to be shut down for prolonged periods or permanently due to problems elsewhere. Nuclear reactors are the only technology where functioning machines can go and have gone from 24/7 generation to 0/365 shutdowns, at great cost. Such events also put greenhouse gas reduction plans at risk – as has already happened in Japan and continues today, given the aftermath of the Fukushima Dai-ichi nuclear accident in March 2011. The EPA should analyze the collateral impact on greenhouse gas reduction plans of severe nuclear accidents and, in that light, the relative risks of various approaches to reducing power sector emissions.
5. The high likelihood that nuclear reactors will have to be derated or even shut down due to high water temperatures and severe hot weather. Such declines in power output at times of high electricity demand result in increases in CO2 emissions that the EPA has not taken into account.
6. The inflexibility of nuclear power generation type. Reactors must operate at close to steady 100 percent output for economic and technical reasons. It takes a long time to change the power level significantly and to bring them back on line once they are down for planned or unplanned reasons. Nuclear plants are a poor match for variable power sources on the grid.
7. The poor resiliency characteristics in most respects (other than them having a long-term fuel supply on site) of nuclear reactors. They need an external grid supply to operate; they need large amounts of water; and many are in coastal areas, vulnerable to shutdowns during severe storms and, in the future, sea level rise.
8. The EPA has not considered the impacts of continued reactor operation on uranium mining and milling communities. This is especially problematic in light of the EPA’s own failure over the decades to adequately protect communities with uranium mines, and most especially Native American communities. The Clean Power Plan does not have the burden of remedying all the ills of the power system. But the EPA is obliged, as part of its evaluation of BSER, to consider the marginal damage that would be inflicted as a result of the explicit policy approach to nuclear energy, the only type of energy that has been singled out for preservation by the Clean Power Plan.
9. The impact of routine emissions of tritiated water vapor to the atmosphere which comes down as rain and can pollute private wells in the vicinity of nuclear power reactors. Neither the EPA nor the NRC require routine measurements of tritium (a radioactive form of hydrogen) in offsite private water wells that are used for drinking and irrigation; private wells are not covered by drinking water regulations.116
115 Calculated by IEER from NREL 2011, Tables 2 and 3. 116 40 CFR 141 (2013). For potential impacts of tritium see Makhijani, Smith, and Thorne 2006. See also the special issue of IEER’s newsletter, Science for Democratic Action, on human health and radiation, June 2013. (IEER 2013)
IEER Comments on the 2014 Proposed Clean Power Plan of the U.S. Environmental Protection Agency
40
10. The impact of tritium leaks which have occurred at many reactors.117 11. The impact of carbon-14 emissions, which have not even been measured historically and
which a National Research Council panel has noted is an obstacle to assessing the health impacts of nuclear power plant operations.118
12. The additional spent fuel that each reactor produces each year for which there is as yet no clear disposal plan.
13. The plutonium contained in the spent fuel that each reactor produces each year.
d. Effect of removing nuclear generation from BSER
We recognize that removing nuclear power from the calculation of target rates by itself would weaken the emission targets for the states – moderately so for states with existing nuclear power plants and much more for the three states with nuclear reactors under construction. We do not advocate a weakening of the target emission rates. Rather, as will be seen in Section V.C, we advocate using higher targets for efficiency and renewables in the best system of emission reduction in amounts that would make the target emission rates more stringent than those on the Clean Power Plan and reduce the mass of greenhouse gas emissions significantly more than about 30 percent reduction relative to 2005 estimated by the EPA for its plan. We also recognize that in deriving rates in the way that we propose (i.e., omitting reactors whose licenses are due to expire) opens up the possibility of the states with such reactors using them in their implementation plans. In that case the requirement for renewable energy and efficiency would be reduced for those states. However, the EPA should discourage such compliance plans for a number of reasons. First, and probably most important, the EPA should refuse to accept reactors whose licenses have not been extended beyond 2029 in state implementation plans. States can no more presume to second guess NRC license extension decisions than can the EPA. This should be explicit in the final rule. Second, the Clean Power Plan envisions that emission rates achieved in 2030 will endure beyond that date. States that use existing nuclear units whose licenses expire after 2030 will be faced with the possibility of sudden increases in CO2 emissions at that time. The EPA should put states on notice that states will be expected to maintain compliance immediately in the post-reactor shutdown period. For instance, the licenses of the Calvert Cliffs reactors in Maryland are due to expire in the mid-2030s. At that time, Maryland’s CO2 emission rate would rise significantly unless Maryland increases renewable energy generation and energy efficiency significantly beyond the levels used to calculate the target rate prior to that time. The EPA should provide the following guidance to states that do use such units in their implementation plans:
States will be expected to plan in advance and implement measures to maintain the target emission rates after the shutdown of nuclear power reactors. For instance, states
117 NRC Tritium 2014. For some evidence of possible deleterious health effects see IEER 2013. 118 NAS-NRC 2012

IEER Comments on the 2014 Proposed Clean Power Plan of the U.S. Environmental Protection Agency
41
could do this by implementing renewable portfolio standards and efficiency measures beyond those used to calculate the target rates.
e. Resilience and economic justice considerations
The EPA also did not consider a number of other important issues that preclude the consideration of
nuclear generation as BSER, including the following:
1. The EPA’s approach relies on the continuation of a heavily centralized electricity grid. The Clean Power Plan does mention combined heat and power as a possible element of BSER but does not specifically address this issue in the context of the need for increasing grid resilience. That need is now widely recognized in the wake of severe weather events such as such as Hurricanes Katrina and Sandy and the severe droughts in the Southeast (1998-2002, 2007-2008, 2011),119 Texas (2010 and ongoing at the time of this writing in some parts of the state),120 and California (2012 and ongoing at the time of this writing).121
2. The EPA Clean Power Plan does not consider the economic impact on low income households of the increasing use of natural gas for power generation. The Plan acknowledges that natural gas prices to the power sector will increase,122 but does not provide an analysis of the increase in household energy bills in households that use natural gas for space heating, water heating, and cooking. Further, the winter of 2013-2014 has shown that the increasing use of natural gas in the power sector combined with increasing natural gas use for space heating can lead to severe stresses on family budgets and on infrastructure. Specifically, both electricity and natural gas prices in the Northeast soared during the winter of 2013-2014. It is important to note that an approach that does not increase natural gas use for power production to decrease CO2 emissions would be compatible with energy justice goals.
3. EPA has not demonstrated that its proposed methods for achieving carbon reductions will be effective long-term.
As noted above and in more detail in Section V, the EPA target for 2030 does not put the U.S. electricity
sector on track to achieve the longer-term goals of reducing greenhouse gas emissions by 80 to 90
percent or more (in round numbers) by 2050. The EPA’s 30 percent reduction relative to 2005 amounts
to only about 7 percent relative to 1990. Moreover this does not include the potential for higher
venting of methane than that estimated by the EPA, as discussed above. The CPP contains no analysis of
how the target emission rates can be maintained in the face of the expiry of nuclear reactor licenses, or
the fact that reactors representing almost 30 percent of 2012 nuclear generation have licenses that
119 Southeast Climate Consortium 2013 120 Wikipedia Drought 2014 and U.S. Drought Monitor: Texas 2014 121 U.S. Drought Monitor: West 2014 and Los Angeles Times 2014 122 The CPP projects natural gas prices for the electricity sector in Option 1 to be between $5.86 and $5.98 per million Btu in the year 2020 and between $6.33 and $6.39 in the year 2030, in 2011 dollars. (EPA RIA 2014, Table 3-19, (p. 3-38)).The average price of natural gas delivered to the electricity sector was $4.98 per million Btu in 2011 and $3.51 in 2012 (in 2012 dollars; EIA AEO 2014, Table 13). The price rise between 2011 and 2030 is expected to be about 33 percent and between 2012 and 2030, more than 88 percent, both in constant dollars. The jump from 2011 to in 2012 is due to the steep fall in natural gas delivered prices from 2011 to 2012. (EIA AEO 2014, Table 13)

IEER Comments on the 2014 Proposed Clean Power Plan of the U.S. Environmental Protection Agency
42
expire before 2030. Thus, not only is the EPA plan too weak to meet the challenge of preventing severe
climate disruption; it is not robust enough to prevent an erosion of the CO2 reductions in case of
foreseeable events such as the shutdown of reactors due to expiry of licenses. Specifically, we recall the
points raised near the start of this section (at Section V.A):
In order to meet the challenges posed by a path that would keep the global mean temperature rise
below 2oC, the CPP should address long-term lessons that can easily be derived from the IPCC5 report.
The following is a paraphrased version of those lessons discussed at the start of this section:
1. Short-term and medium-term reductions in CO2 emissions must be compatible with the long-term elimination of fossil fuels. The EPA has omitted considering necessary changes to the electricity system that should be in place in 2030 so that (i) the emission reductions would endure (for instance, through retirement of nuclear plants) and (ii) further deep reductions can be made to protect the climate.
2. A corollary of lesson 1 above is that investments in fossil fuel-related technologies with long payback times, such as new natural gas production and transport infrastructure, should be discouraged. Specifically, we recommend that natural gas use in the electricity system should not be increased over 2012 and our analysis shows that one can reduce emissions from the electricity sector without such an increase.
3. Fundamental changes in the structure of the energy system and, specifically, in the electricity system will be required, given that significant amounts of variable energy sources (notably wind and solar) will be required to greatly reduce and eventually eliminate fossil fuels. Such changes are required in any case to increase the resilience of the electricity system.
4. If the electricity sector is to be transformed, it must be affordable for middle-income and low-income people.
5. Grid resiliency should be a paramount goal of any carbon reduction plan, given that the adverse impacts of climate disruption include disruptions in energy production from increased frequency and severity of droughts and storms. The EPA should make explicit provision of combined heat and power (CHP) in its target calculations, within the constraint of not increasing natural gas use above 2012. The CPP has not done this, though it does allow for states to use CHP in the context of their implementation plans.
C. As IEER Shows in the IEER Climate Protection Scenario, Carbon Reductions
that are Consistent with Climate Protection are Feasible and Cost-effective.
Carbon emission reductions from the electricity sector by 2030 should be based on a lower reliance on
all fossil fuels, especially in view of the uncertainties associated with natural gas venting and leakage. As
can be seen in Table 1, CO2 reductions using renewable energy are more economical than new nuclear
power plants. The costs of efficiency improvements, including participant and utility costs are far lower
than generation, transmission, and distribution costs, as also noted in the section on nuclear costs
Section V.B.2.b.i. Given the vast renewable resources available throughout the United States,123 and the
123 NREL Potentials 2012
IEER Comments on the 2014 Proposed Clean Power Plan of the U.S. Environmental Protection Agency
43
large efficiency potential, much larger reductions in carbon emissions from the electricity sector are
economically and technically feasible.124
1. IEER’s model is based on a consistent approach that addresses methodological issues in the CPP
As stated at the outset, we support the overall EPA approach of setting a target rate of CO2 emissions for each state. This performance-based approach provides the maximum flexibility to states to achieve the targets, while ensuring that the essential climate protection goal of significantly reducing greenhouse gas emissions in the electricity sector is achieved. But it is essential to remedy the technical and economic defects of the way in which the EPA has gone about setting rates for states. The major issues that we seek to remedy, while adopting as much of the EPA approach as possible, are:
1. The setting of target rates should be technology neutral, unlike the EPA’s treatment of natural gas, nuclear power, and hydropower.
2. Emissions and generation from various years should not be combined, as explained in Section VII below. Emissions should be calculated for each year according to total emissions and total generation from all affected sources and all other generation (except the small sources which are consistently omitted from both emission and generation calculations).
3. The separation between the EPA’s functions and those of the Nuclear Regulatory Commission (NRC) needs to be recognized. The EPA should not assume that reactor licenses would be extended beyond their current expiry dates. Safety and environmental considerations demand that the EPA construct its rule without presuming future NRC actions, one way or another. Options exist that better meet the BSER tests than subsidizing existing nuclear plants.
4. States should have flexibility in meeting the target emission rates, which is already the case in the Draft CPP. However, the EPA should make clear that certain approaches like increasing natural gas use may not meet the compliance test under adverse but realistic venting and warming potential assumptions. The EPA should also make clear that nuclear plants whose licenses expire before 2030 cannot be included in compliance plans.
5. The trajectory in 2030 should be compatible with long-term (2050 onward) need for the elimination of nearly all energy-related CO2 emissions.
6. The framework should be able to accommodate resilience of the electric grid and economic justice so that low- and middle-income households are not disproportionately impacted.
7. The cost criterion should be consistently and realistically applied to determine the best system of emission reduction. We have used a cost criterion of $20 per metric ton pf
124 See also Makhijani 2007, where the technical and economic feasibility of a fully renewable energy sector by about the middle of the 21st century is discussed.

IEER Comments on the 2014 Proposed Clean Power Plan of the U.S. Environmental Protection Agency
44
CO2 emission reduction or less relative to a new coal plant for inclusion in the best system of emission reduction.
8. Non-air quality impacts need to be considered. 9. Water use should be considered. Specifically, low water use should be a consideration
for inclusion in the BSER. The EPA should specify that states must meet their target emission rates even if there are increases in CO2 emissions due to nuclear power plant derating caused by lack of cooling water or by discharge temperature considerations.
10. The range of natural gas leakage estimates and global warming potential values that are relevant to climate protection need to be taken into account. Specifically higher published leakage estimates and the 20-year warming potential for methane should be used to estimate the upper limit of potential CO2eq impacts. At the very least, the EPA should use the mean of the published leakage rates and a 20-year warming potential for methane (whether from coal, oil, or natural gas fields) to estimate the overall impact of natural gas use.
11. The overall targets set by the EPA are weak given the ample opportunities for low-cost or even negative cost CO2 emission reductions and the need for stronger targets for climate protection. We demonstrate this below in Section V.C.2.
We have constructed a Climate Protection Scenario in order to illustrate that the EPA can set much tighter emission targets using only resources that have low-cost or negative cost resources (like efficiency)125for reducing CO2 emissions. We used the following principles and incorporated the following features in constructing the IEER Climate Protection Scenario:
We use the AEO 2014 projection for fossil-fuel-based electricity generation and also the overall national total for affected generation in 2030.
We examined state efficiency goals and selected a 1.5 percent rate of efficiency improvement per year, starting in 2017, and assumed a ramp up by 0.5 percent per year between 2015 and 2017. The EPA uses this same nominal rate of improvement but modifies it in ways not quite transparent to us, but with the final result that efficiency is far below its potential. Further, the scope for efficiency is greater and the cost lower in states that do not now have efficiency goals, since they have not yet systematically begun to capture the lowest cost efficiency gains. It is important that the target rate include a spur for states to implement efficiency programs to keep the cost of reducing emissions as low as possible.
For renewable energy we chose utility solar PV (urban and rural) and land-based wind since these have low CO2 costs that are much lower than new nuclear. Lazard 2014 estimates a new utility scale solar PV plant in place of a new coal-fired power plant would cost $7 per metric ton of CO2 reduction. Land-based wind costs are negative – that is, one saves money by choosing wind generation instead of coal. We assume that in the near-term distributed solar will also be part of the implementation of the plan. This is not needed for setting the renewable energy amounts for the year 2030, however. We will point out that the use of distributed solar is desirable for many reasons. The EPA should indicate the acceptance of distributed solar as part of BSER.
125 Negative CO2 reduction cost means the introduction of a CO2 reduction measure would reduce electricity cost, even apart from any carbon considerations.
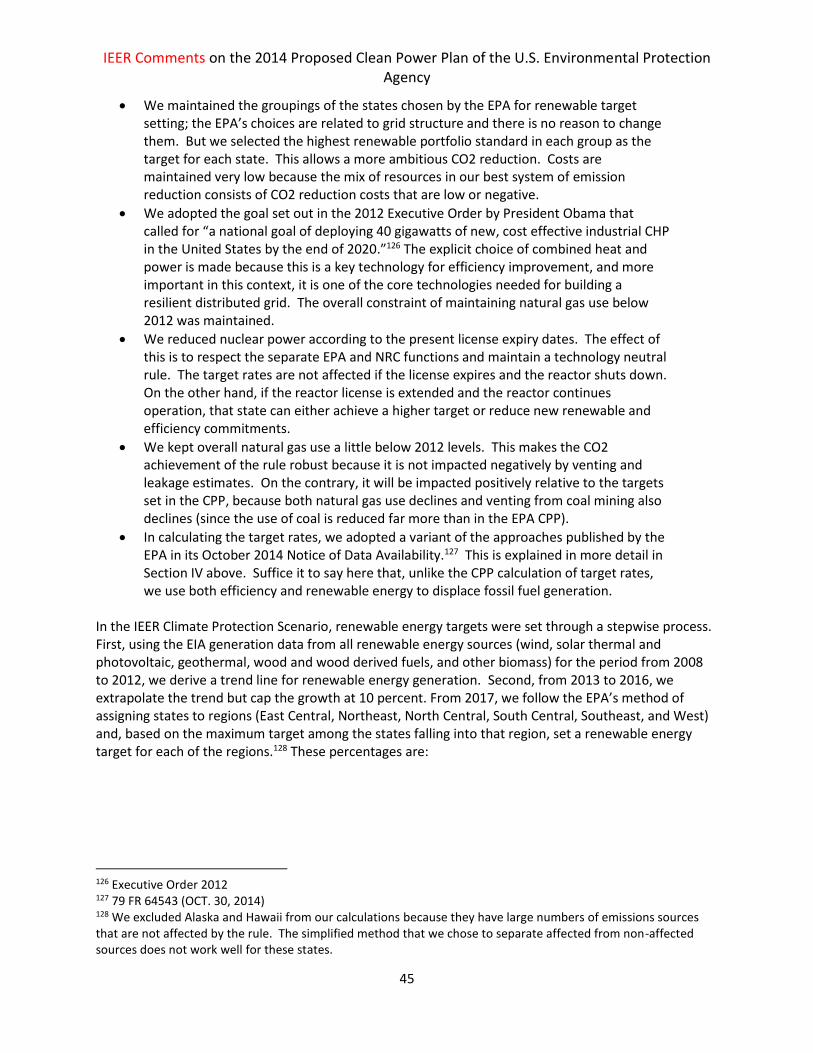
IEER Comments on the 2014 Proposed Clean Power Plan of the U.S. Environmental Protection Agency
45
We maintained the groupings of the states chosen by the EPA for renewable target setting; the EPA’s choices are related to grid structure and there is no reason to change them. But we selected the highest renewable portfolio standard in each group as the target for each state. This allows a more ambitious CO2 reduction. Costs are maintained very low because the mix of resources in our best system of emission reduction consists of CO2 reduction costs that are low or negative.
We adopted the goal set out in the 2012 Executive Order by President Obama that called for “a national goal of deploying 40 gigawatts of new, cost effective industrial CHP in the United States by the end of 2020.”126 The explicit choice of combined heat and power is made because this is a key technology for efficiency improvement, and more important in this context, it is one of the core technologies needed for building a resilient distributed grid. The overall constraint of maintaining natural gas use below 2012 was maintained.
We reduced nuclear power according to the present license expiry dates. The effect of this is to respect the separate EPA and NRC functions and maintain a technology neutral rule. The target rates are not affected if the license expires and the reactor shuts down. On the other hand, if the reactor license is extended and the reactor continues operation, that state can either achieve a higher target or reduce new renewable and efficiency commitments.
We kept overall natural gas use a little below 2012 levels. This makes the CO2 achievement of the rule robust because it is not impacted negatively by venting and leakage estimates. On the contrary, it will be impacted positively relative to the targets set in the CPP, because both natural gas use declines and venting from coal mining also declines (since the use of coal is reduced far more than in the EPA CPP).
In calculating the target rates, we adopted a variant of the approaches published by the EPA in its October 2014 Notice of Data Availability.127 This is explained in more detail in Section IV above. Suffice it to say here that, unlike the CPP calculation of target rates, we use both efficiency and renewable energy to displace fossil fuel generation.
In the IEER Climate Protection Scenario, renewable energy targets were set through a stepwise process. First, using the EIA generation data from all renewable energy sources (wind, solar thermal and photovoltaic, geothermal, wood and wood derived fuels, and other biomass) for the period from 2008 to 2012, we derive a trend line for renewable energy generation. Second, from 2013 to 2016, we extrapolate the trend but cap the growth at 10 percent. From 2017, we follow the EPA’s method of assigning states to regions (East Central, Northeast, North Central, South Central, Southeast, and West) and, based on the maximum target among the states falling into that region, set a renewable energy target for each of the regions.128 These percentages are:
126 Executive Order 2012 127 79 FR 64543 (OCT. 30, 2014) 128 We excluded Alaska and Hawaii from our calculations because they have large numbers of emissions sources that are not affected by the rule. The simplified method that we chose to separate affected from non-affected sources does not work well for these states.

IEER Comments on the 2014 Proposed Clean Power Plan of the U.S. Environmental Protection Agency
46
Region Maximum RPS target in the region
East Central 20%
Northeast (See Note 1) 40%
North Central 30%
South Central 20%
Southeast 20%
West 33%
Note 1: The Maine target includes hydropower. Most Maine hydropower plants are small (under 10 megawatts; all are under 100 megawatts). (Maine Hydropower 2010.) Third, we applied these fractions to the projected sales for 2030 after adjusting for the projected efficiency improvements to obtain a target for renewable energy generation in each state. We then calculate a growth rate for renewable energy generation by assuming that the target is met in 15 years starting from the 2012 level (available in the EIA’s 2014 Annual Energy Outlook). Fourth, starting from 2017, we assume that RE generation in each state grows at this calculated rate until the target is met, at which point it is assumed to grow linearly, i.e., at the same rate as the previous year. In other words, we assume that states will not necessarily stop installing renewables just because the target is met. We assume, however, that no state will exceed 40 percent of the post-efficiency sales in 2030; if a state were to reach that level, RE generation is capped at that point. We also verify that in no state the renewable energy generation by 2030 exceeds the National Renewable Energy Laboratory’s 2012 estimates of the technical potential 129for those sources of renewable energy that are low cost without subsidies at the time of this writing: onshore wind and utility solar. In the vast majority of cases the 2029 targets are well under 10 percent of the in-state technical potential for these sources. However, with the SunShot Initiative goal of $1.50 per watt130 for distributed solar, rooftop solar should also be included in the best system of emission reduction. Presumably states would be free to use other sources, such as offshore wind, even though their costs are high at present, to develop these industries and their infrastructure, notably in the Northeast and Mid-Atlantic regions, where offshore wind is a plentiful resource. The fractions of technical potential used in actual implementation plans will likely be lower since they will in most cases include distributed solar generation. That generation has a large number of advantages, including varying distribution losses, compatibility with microgrids and smart grids, and an increase in consumer participation in the electricity market as producers. When all reasonably foreseeable low cost resources are included, the renewable energy targets we used in our calculations are very small fractions of the available resources. Hence, our plan is compatible with an expansion of the use of renewable resources of an order of magnitude or more in most states. This potential can be tapped to replace retiring nuclear plants and also to meet further CO2 emission reduction that will be necessary beyond 2030. A corollary of our capping renewable energy at 40 percent of demand for the year 2030 is that we did not need to consider issues related to storage.131 All states, except most of Texas, Hawaii, and Alaska, are part of larger grids, so that in practice the renewable energy in any Interconnect will be much less
129 NREL Potentials 2012 130 DOE SunShot 2012, p. xix 131 MRITS 2014

IEER Comments on the 2014 Proposed Clean Power Plan of the U.S. Environmental Protection Agency
47
than 40 percent. For Texas, which is mainly in the ERCOT grid, the final renewable energy fraction is 26 percent for 2030. There is one state where our approach departs from a likely future scenario in reality. In the state of Iowa, the target that we obtain through the adopted procedure is lower than current generation from renewable sources. Rather than make a special exception for Iowa and raise the renewable energy target for that state alone that would differ from other states in the same group, we have adopted the lower RE value and calculated emissions accordingly. In reality, however, Iowa will probably to continue generating more RE than its target and export part of the electricity produced. A scenario with Iowa alone having a higher RE target (40 percent) would result in greater emission reductions within the state: from roughly 54 billion pounds (at a rate of 1,132 lb/MWh) to about 37 billion pounds, which corresponds to an emission rate of 784 lb/MWh; both target rates are calculated for the year 2030.
2. IEER’s Climate Protection Scenario would reduce carbon emissions by about 40 percent below 1990 levels
The overall results for the United States of the IEER Climate Protection Scenario and the EPA Clean
Power Plan are shown in Table 2.
Table 2: Overall results for the IEER Climate Protection Scenario and the EPA Clean Power Plan
IEER Climate
Protection Scenario EPA Clean Power
Plan (Note 1)
Direct CO2 emissions in the year 2030, million metric tons 1,110 (Note 2) 1,701
Reduction relative to 2005 54% 29%
Reduction relative to 1990 39% (Note 3) 7%
Sources: EPA RIA 2014, Table 3-5; IEER analysis; EPA GHG Inventory 2013 for 1990 and 2005 emissions. Note1: The EPA results are for “Option 1 State,” which is the lowest value of emissions in the CPP. Note 2: The IEER scenario emissions from affected sources total 1,020 million metric tons. We have added 90 million metric tons from non-affected sources to make the total value comparable to the EPA result (which is for all generation) and to calculate emission reductions relative to 2005 and 1990. Note 3: When the reduction in methane emissions due to reduced coal use is added, the reduction in CO2eq emissions of the IEER Climate Protection Scenario relative to 1990 is 40 percent or slightly more, depending on the value of global warming potential used for methane. While the EPA Clean Power Plan represents significant progress in reducing emissions relative to the peak year of 2005, it falls far short of the European Union goal of 40 percent reduction in greenhouse gas emissions relative to 1990. The EPA CPP would reduce emissions by only about 7 percent relative to 1990. The IEER Climate Protection Scenario would approximately meet the reductions set out in the European Union's plan. The IEER Climate Protection Scenario also has significant environmental benefits relating to nuclear generation. By assuming that nuclear reactors shut down when their licenses expire, nuclear generation decreases by about 29 percent in 2030 relative to 2012. This decreases spent fuel generation, water use, expenses on spent fuel management, accident risks, front end uranium processing and enrichment,

IEER Comments on the 2014 Proposed Clean Power Plan of the U.S. Environmental Protection Agency
48
as well as uranium mining and milling, and the amount of plutonium produced. In contrast, nuclear generation increases by almost 4 percent relative to 2012 in the EPA Clean Power Plan, implying increases in all these impacts. Some of the non-air quality benefits relating to nuclear generation in the IEER Climate Protection Scenario are shown in Table 3 Table 3: Nuclear generation-related benefits of the IEER Climate Protection Scenario
Reduction in nuclear generation 29%
Spent fuel generated 2012, mt 2,248
Reduction in spent fuel, mt/year 578
Approximate plutonium content of spent fuel, kilograms/mt 10
Reduction in plutonium produced, kilograms/year (unseparated) 5,780
Amount of separated reactor grade plutonium needed for a nuclear bomb, kg 8
# of potential bombs reduced, rounded/year 730
Source for 2012 spent fuel generated: NEA 2013, p. 32 We have noted that the large increase in natural gas in the EPA Clean Power Plan is not compatible with further long-term reductions in greenhouse gas emissions. Table 4 shows the amounts of fossil fuel, nuclear and renewable generation in the IEER and EPA plans. Table 4: Fossil, nuclear, and renewable generation in the IEER Climate Protection Scenario and the EPA Clean Power Plan (units of MWh in the year 2030)
IEER Climate Protection Scenario
EPA Clean Power Plan
Ratio IEER to EPA
Coal 603,326,935 1,097,840,229 55%
Oil/gas boilers 60,733,728 35,615,159 171%
NGCC 729,283,399 1,399,839,259 52%
Other 128,188,223 128,188,223 100%
CHP for resilience 239,221,669 0 N/A
Total fossil fuel generation 1,760,753,954 2,661,482,871 66%
Nuclear generation total 547,091,784 797,000,000 69%
Renewable generation, total 892,499,178 522,722,657 171%
Note 1: Natural gas combined cycle generation and total fossil fuel generation are lower in the IEER Climate Protection Scenario than in the EPA CPP, despite the fact that we have made a substantial provision for natural gas fired combined heat and power plants, anticipating the need for more distributed generation in order to accommodate the needs of a resilient grid. Despite this, natural gas use would go down slightly – by about 1 percent – in the IEER plan. The key differences are greater efficiency and renewable generation in the IEER Climate Protection Scenario. We note that both efficiency and renewable power goals are within the best practices of states. In fact, our national renewable energy target would be about 25 percent of final demand compared to the highest RPS of 40 percent currently. In this context, it is important to note that we are not suggesting that the ambitions of states and indeed of the United States as a whole be limited to a renewable energy fraction of 25 percent. Greater levels can clearly be achieved. The IEER values are designed to set economical, reasonable, and achievable targets for states, allowing for the fact that the current positions of the states are very different. Note 2: We assumed “other” generation to be the same as in the CPP.
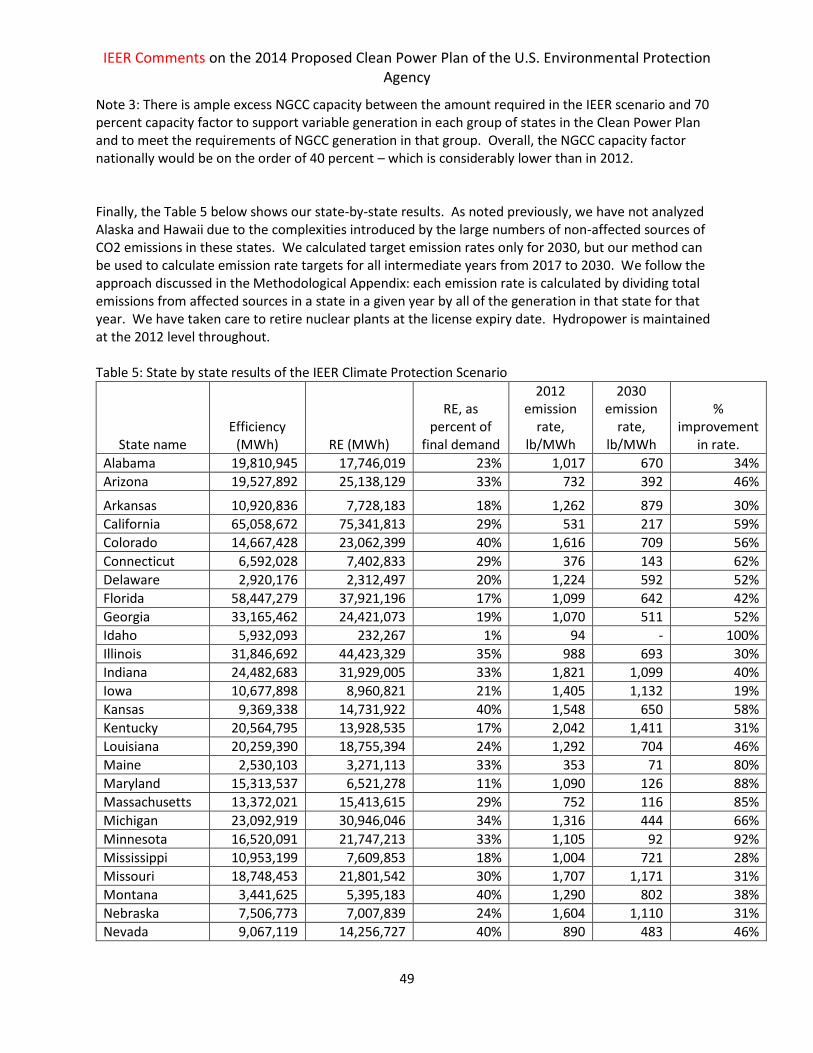
IEER Comments on the 2014 Proposed Clean Power Plan of the U.S. Environmental Protection Agency
49
Note 3: There is ample excess NGCC capacity between the amount required in the IEER scenario and 70 percent capacity factor to support variable generation in each group of states in the Clean Power Plan and to meet the requirements of NGCC generation in that group. Overall, the NGCC capacity factor nationally would be on the order of 40 percent – which is considerably lower than in 2012. Finally, the Table 5 below shows our state-by-state results. As noted previously, we have not analyzed Alaska and Hawaii due to the complexities introduced by the large numbers of non-affected sources of CO2 emissions in these states. We calculated target emission rates only for 2030, but our method can be used to calculate emission rate targets for all intermediate years from 2017 to 2030. We follow the approach discussed in the Methodological Appendix: each emission rate is calculated by dividing total emissions from affected sources in a state in a given year by all of the generation in that state for that year. We have taken care to retire nuclear plants at the license expiry date. Hydropower is maintained at the 2012 level throughout. Table 5: State by state results of the IEER Climate Protection Scenario
State name Efficiency
(MWh) RE (MWh)
RE, as percent of
final demand
2012 emission
rate, lb/MWh
2030 emission
rate, lb/MWh
% improvement
in rate.
Alabama 19,810,945 17,746,019 23% 1,017 670 34%
Arizona 19,527,892 25,138,129 33% 732 392 46%
Arkansas 10,920,836 7,728,183 18% 1,262 879 30%
California 65,058,672 75,341,813 29% 531 217 59%
Colorado 14,667,428 23,062,399 40% 1,616 709 56%
Connecticut 6,592,028 7,402,833 29% 376 143 62%
Delaware 2,920,176 2,312,497 20% 1,224 592 52%
Florida 58,447,279 37,921,196 17% 1,099 642 42%
Georgia 33,165,462 24,421,073 19% 1,070 511 52%
Idaho 5,932,093 232,267 1% 94 - 100%
Illinois 31,846,692 44,423,329 35% 988 693 30%
Indiana 24,482,683 31,929,005 33% 1,821 1,099 40%
Iowa 10,677,898 8,960,821 21% 1,405 1,132 19%
Kansas 9,369,338 14,731,922 40% 1,548 650 58%
Kentucky 20,564,795 13,928,535 17% 2,042 1,411 31%
Louisiana 20,259,390 18,755,394 24% 1,292 704 46%
Maine 2,530,103 3,271,113 33% 353 71 80%
Maryland 15,313,537 6,521,278 11% 1,090 126 88%
Massachusetts 13,372,021 15,413,615 29% 752 116 85%
Michigan 23,092,919 30,946,046 34% 1,316 444 66%
Minnesota 16,520,091 21,747,213 33% 1,105 92 92%
Mississippi 10,953,199 7,609,853 18% 1,004 721 28%
Missouri 18,748,453 21,801,542 30% 1,707 1,171 31%
Montana 3,441,625 5,395,183 40% 1,290 802 38%
Nebraska 7,506,773 7,007,839 24% 1,604 1,110 31%
Nevada 9,067,119 14,256,727 40% 890 483 46%

IEER Comments on the 2014 Proposed Clean Power Plan of the U.S. Environmental Protection Agency
50
State name Efficiency
(MWh) RE MWh
RE, as percent of
final demand
2012 emission
rate
2030 emission
rate
% improvement
in rate.
New Hampshire 2,435,888 3,830,080 40% 484 128 74%
New Jersey 17,335,329 15,028,877 22% 406 124 69%
New Mexico 5,321,938 8,087,018 39% 949 786 17%
New York 33,424,533 52,555,221 40% 518 292 44%
North Carolina 32,677,468 25,074,861 20% 1,026 382 63%
North Dakota 4,652,714 5,398,779 30% 1,854 1,511 18%
Ohio 33,628,388 26,267,154 20% 1,598 1,097 31%
Oklahoma 14,687,013 23,093,194 40% 1,370 720 47%
Oregon 11,550,292 14,123,186 31% 255 46 82%
Pennsylvania 32,390,757 28,208,994 22% 1,050 734 30%
Rhode Island 1,670,964 2,528,839 39% 905 554 39%
South Carolina 19,812,021 14,489,687 19% 757 440 42%
South Dakota 3,070,393 4,553,431 38% 553 59 89%
Tennessee 23,564,003 18,687,315 20% 1,099 521 53%
Texas 101,809,808 101,809,165 25% 1,255 717 43%
Utah 8,201,875 11,428,871 35% 1,608 1,072 33%
Virginia 27,392,112 7,441,810 7% 802 256 68%
Washington 24,020,858 7,382,616 8% 126 53 58%
West Virginia 6,722,270 6,218,995 24% 1,998 1,677 16%
Wisconsin 15,767,681 21,388,692 35% 1,372 398 71%
Wyoming 4,386,141 6,896,570 40% 2,068 1,676 19%
U.S. Totals 899,311,896 892,499,178 25% 1,109 653 41%
Notes: 1. Renewable energy percentages are based on final demand after energy savings due to
efficiency improvements are deducted from the EIA AEO 2014 reference projection. 2. The 2030 generation and demand projections for each state are made projecting
forward from the 2012 figures; we assume that both grow at the same rate as the population growth rate of each state. This gives a total very close to the AEO reference case and is compatible with a business-as-usual model.
3. Emission rates for 2012 and 2030 are calculated based on total emissions from affected sources and total generation in those years.
4. Renewable energy is used to displace existing fossil fuel generation, as suggested in the October 2014 Notice of data Availability.132 But we adopt a more targeted sequence. We start by using RE to displace coal generation, then oil and gas boilers and then natural gas combined cycle generation.
5. Final RE percentages are different than the initial values used, because the RE figure is adjusted to ensure that exactly 100 percent of the generation projections are covered.
6. We have not shown the EPA CPP target values above since they are not comparable because the EPA did not use all generation from the baseline year nor all generation from the target years (2020 to 2030).
132 79 FR 64543 (Oct. 30, 2014)
IEER Comments on the 2014 Proposed Clean Power Plan of the U.S. Environmental Protection Agency
51
3. IEER Climate Protection Scenario is necessary & technically feasible and cost effective
We have shown in Section III, that CO2 emission reductions far greater than those in the Clean Power
Plan are necessary to protect climate. Moreover, they must be accomplished in such a way as to make
further reductions possible without large stranded costs in fossil fuel infrastructure.
We have constructed the IEER Climate Protection Scenario so that it relies only on proven technologies
whose feasibility is beyond any doubt. Specifically, we rely on energy efficiency improving at a rate of
1.5 percent per year from 2017 onward and ramping up to that level between 2014 and 2016. Targets
of 1.5 percent have already been adopted in some states.
We used the same groups of states for setting renewable energy targets as specified in the CPP.
However, we chose the renewable generation fraction equal to the state with the highest renewable
portfolio standard rather than average the RPS values as the EPA did in the CPP. Our approach
represents best practice in each group. It gives an overall renewable energy target for the year 2030 for
the United States that is under 900 million MWh, including RE that already exists. The total RE
generation on a state-by-state basis generally represents a small fraction of technically feasible
generation in almost every state even if only onshore wind and utility solar, which are the most
economical resources, are taken into account. When rooftop solar is taken into account, it is well under
10 percent of the technical potential of in all but four states: three New England states (Connecticut,
Massachusetts, and Rhode Island) and West Virginia. In the New England states it is at most 27 percent
and in West Virginia it is just above 10 percent. To keep costs even lower than those found in the IEER
Climate Protection Scenario, these three states could also import renewable energy from neighboring
states like New York, where less than four percent of the onshore wind and solar potential is used in the
IEER climate protection scenario. We note that the three New England states in question as well as New
York are part of the Regional Greenhouse Gas Initiative that would enable renewable energy credit
trading and accounting.
Overall, our choices for both EE and RE reflect current best practices. Even higher targets are feasible;
we have chosen the values because they are most likely to keep costs moderate or low and also because
they do not assume that current best practices will be stretched, in which case it would be somewhat
more complex to estimate costs.
We calculated the IEER Climate Protection Scenario's cost of carbon emission reductions in order to
compare it to the cost of the base case (EIA AEO 2014), in which there would be no rule to reduce CO2
emissions and also to the cost estimated in the CPP. Our cost estimation procedure was as follows:
We used energy efficiency costs as estimated by the American Council for an Energy-Efficient Economy -- $54 per megawatt-hour. For sensitivity analysis, we used the lowest and highest estimated cost ($41 and $73 per MWh, respectively).133
We the average of solar utility and onshore wind costs as estimated in Lazard 2014. We used the same Lazard 2014 estimates for our sensitivity analysis.
133 ACEEE 2014, Table 6 (p. 23)
IEER Comments on the 2014 Proposed Clean Power Plan of the U.S. Environmental Protection Agency
52
We use the Nuclear Energy Institute Estimate of $44.17 per MWh for costs of operating existing nuclear reactors, with the range of $28.22 and $68.36 for the sensitivity analysis.134 This cost is needed for a comparison since nuclear generation estimated for the year 2030 is higher in EIA AEO 2014 and in the CPP than in the IEER Climate Protection Scenario, which assumes that reactors not currently licensed beyond 2029 will be shut down at the time of license expiry.
We took the operating maintenance and fuel costs of new coal and NGCC power plants from EIA AEO 2014 and applied them to existing plants.135 For coal plants, we assumed that 10 percent of the capital cost remained to be paid136 and for NGCC plants, we used 25 percent. For coal plants we also added $5 per MWh for environmental retrofits.137 This was estimated from a Credit Suisse report assuming that only one-third of the estimated retrofits would be required in the IEER Climate Protection Scenario, since in that case coal generation would be only about 40 percent of 2012 generation in 2030. This gives a cost of operating coal-fired power plants, including fuel costs of $45.50 per MWh and for NGCC plants $54.38 per MWh. For oil and gas boilers, we assumed gas-firing (which is more typical), a heat rate of 10,000 Btu per kWh and a natural gas cost in 2030 of $6.64 per million Btu (2012 dollars) as per EIA AEO 2014, Table 13 projection for that year.
We used new fossil fuel generation costs as presented in Lazard 2014, assuming half coal and half NGCC – at $92 per MWh.
The costs of carbon emission reductions comes to $12.65 per metric ton of CO2, counting only direct
CO2 emissions from burning fossil fuels. The total cost would be about $12.1 billion dollars.138 The
comparable values for the Option 1 (State) for the CPP is $24.24 per metric ton and a total cost of $8.8
billion. The reductions are evaluated from the baseline year of 2012.
For doing the sensitivity analysis, we varied only one parameter at a time, except for one case. Our
sensitivity analysis for low and high EE costs, low and high RE costs and low and high costs for operating
nuclear plants yield a wide range of potential costs. The lowest cost result was actually a net cost
decrease of $3.7 billion in the IEER Climate Protection Scenario relative to the reference case. This result
was for the case where renewable energy costs are at the low end ($60 per MWh for utility solar and
$37 for onshore wind). At the other end, high RE costs yield a net cost relative to the reference case of
$28 billion. This is a highly unlikely case, since the general cost and consistent trend for RE has been
downward; it was included for completeness.139
We analyzed the impact of the range of costs of nuclear generation. Higher costs mean that the net cost
of the IEER Climate Protection Scenario will be lower relative to the base case and vice versa, since the
IEER scenario has lower nuclear generation. The low nuclear cost case yield a net cost of the IEER
Climate Protection Scenario of $16 billion; the corresponding value for the high nuclear case is $8 billion.
134 NEI 2014, pdf p. 4 135 EIA AEO 2014 electricity generation webpage, at http://www.eia.gov/forecasts/aeo/electricity_generation.cfm 136 SFA Pacific 2001, p. 8. 137 Credit Suisse 2014, p. 1 138 We are showing CO2 reduction cost estimates to the nearest cent because rounding total costs and costs per metric tons can result in disparate numbers that the reader would not be able to reproduce. 139 The values in this and the next paragraph are rounded to the nearest dollar for cost per metric ton of CO2 reduction and to the nearest billion dollars for total net costs.
IEER Comments on the 2014 Proposed Clean Power Plan of the U.S. Environmental Protection Agency
53
The costs of reducing a metric ton of CO2 emissions ranges from -$4/mt CO2 – that is there is a net
lower cost of increasing RE and EE and the CO2 reduction and all other benefits are free collateral
benefits – to a high of $29/mt CO2. The cost of the EPA CPP is about $24/mt CO2.
Given that renewables are on a downward cost trend, the best estimate of net costs of 55 percent CO2
emission reductions in the power sector would likely be in the range of $5 billion to $10 billion per year
in the year 2030. However, we will use $12 billion net cost in the rest of this analysis, since that is our
central estimate.
These costs per unit of CO2 emission reduction do not take into account the issue of methane emissions.
The EPA cost of carbon reductions could increase greatly if methane venting and leaks are higher than
the EPA assumes and if a 20-year warming potential is used. They could range from $30 to $50 per
metric ton of CO2eq or even more in the worst case, if emissions are at the high end of the rates now
assumed. All calculations presume that emissions rates will be reduced by voluntary and regulatory
actions by about a third.
In the case of the IEER Climate Protection Scenario, the cost per metric ton of CO2eq reduced would be
lower than the above cited estimates since methane emissions would decline for two reasons. First,
coal-related methane emissions would decline by much more than in the EPA CPP. Coal-fired power
generation would decrease by about one-fourth in the CPP while it would decrease by almost three-
fifths in the IEER Climate Protection Scenario. Second, since the IEER Climate Protection Scenario keeps
natural gas use in the electricity sector just under the 2012 level, methane emissions in that sector
would be expected to decline by about a third due to regulatory and voluntary actions (as assumed by
IEER throughout this analysis and by the EPA).140 We estimate that even if the leak and venting rate is as
low as estimated by the EPA that the total methane emissions reductions from coal and natural gas by
2030 would be about 270 million metric tons CO2eq, using the 20-year global warming potential of 86.
The methane related CO2eq emission reduction would be about a third of that if the 100-year warming
potential is used. The cost of CO2eq reductions in the IEER Climate Protection Scenario would be in the
$9.88 to $11.56 per metric ton of CO2eq range. The lowest estimate of benefits in the year 2030
estimated by the EPA is $35 billion.141 The middle of the benefit estimates is in the $50 to $90 billion
range. Since the IEER Climate Protection Scenario reduces CO2 emissions by about 2.6 times the
reduction in the CPP (both relative to emissions from the electric power sector in 2012), we can expect
benefits to be much higher than those estimated by the EPA and multiples of the total net cost of about
$18 billion. Assuming marginal benefits above the EPA reductions at half the value of the EPA, and a
benefit value of $50 billion for the CPP, the IEER benefits would amount to $140 billion. Thus, benefits
are, in cases, multiples of the cost.
Considering the costs only, $12.1 billion in net costs, the cost per person in the year 2030 would be
about $33.20 per year or a little less than $3 per month. This includes all direct costs (electric utility
bills), and indirect costs, such as those reflected in the price of goods. Household electricity bills would
go up by about $2.50 per month assuming that the costs are spread evenly across all electricity
consumption. Of course, electricity rate structure could be used to cushion the impact on lower income
140 The reduction in the methane venting and leak rate by the year 2030 compared to 2012 was calculated by IEER from data provided by the EPA in the EPA RIA 2014. 141 EPA RIA 2014, Table ES-6

IEER Comments on the 2014 Proposed Clean Power Plan of the U.S. Environmental Protection Agency
54
households. For instance, the rates for the first block of residential and small business electricity use
could be exempt from these costs.
Another way to look at costs and benefits is to look at the IEER Climate Protection Plan relative to the
CPP. The cost increase relative to the CPP is about $3.3 billion in 2030, or $9 per person per year to
increase the target for CO2 reductions from 30 percent to 55 percent relative to 2005. The ratio is even
bigger if other reference years, such as 1990 or 2012 are used. The benefits, as estimated above, would
increase by tens of billions of dollars.
We can look at the added cost in terms of median household income. Assuming it grows at 1 percent
per year, on average, in real terms between 2013 and 2030, the increased residential electricity bill of
about $30 per year would amount to about 0.05 percent of household income. Finally, it is important to
note that the above considerations relate to cost without counting and direct monetary benefits that
people will experience. For instance, such monetary benefits would appear in the form of lower health
costs, such as lower costs of lung diseases, strokes, and heart attacks. In turn, these would be reflected
in lower household medical costs and lower insurance costs than would otherwise by the case.
VI. CONCLUSIONS AND RECOMMENDATIONS
A. Conclusions
1. Implementation of the EPA Clean Power Plan (CPP) would result in significant reductions in CO2 emissions from the electricity sector – almost 30 percent relative to 2005. However, this goal is far short of what is needed for climate protection if the 2oC limit is to be met. It is also far short of the European Union target of 40 percent reduction in greenhouse gas emissions relative to 1990. The EPA CPP would achieve only about 7 percent reduction relative to 1990.
2. If natural gas leakage rates are higher than assumed by the EPA CPP – and there are data indicating that they may well be – then the CPP would fall short of the 30 percent goal by 2030, especially if a 20-year global warming potential is used for methane.
3. The EPA’s inclusion of existing nuclear in the best system of emission reduction did not properly account for the high costs of keeping several thousand megawatts of at-risk nuclear units on line. Similarly the EPA’s inclusion of under-construction nuclear reactors at zero cost for CO2 reductions ignored the facts that (i) the five reactors in question are not yet complete – and four of them are far from complete and (ii) there is a long and costly history of abandonment of planned and under-construction nuclear plants.
4. The EPA also ignored significant non-air quality impacts of keeping at-risk reactors operating instead of replacing them with efficiency and renewables – the IEER Climate Protection Scenario shows it can be done.
5. In its nuclear generation assumptions, the EPA ignored the fact that licenses representing almost 30 percent of U.S. nuclear generation are due to expire before 2030. While these reactors may receive license extensions, they also may not; in fact their relicensing is the subject of legal contention on multiple fronts.
6. Removing existing and under construction nuclear from the emission target calculation would by itself weaken the target rates. However, we have shown that it is feasible to
IEER Comments on the 2014 Proposed Clean Power Plan of the U.S. Environmental Protection Agency
55
have far stronger targets than the EPA CPP while excluding nuclear reactors whose licenses are due to expire before 2030 and also excluding under-construction reactors.
7. Efficiency and plentiful renewable resources are available as low-cost options to reduce CO2 emissions.
8. The EPA publication of methods for displacing fossil fuel generation by efficiency and renewables is an important positive development in the CPP.
9. Increasing the target of CO2 reductions from 30 percent to 55 percent relative to 2005 can be done at minimal cost (about $3.3 billion total, or $9 per person per year in 2030), if the best system of emission reduction as discussed in these comments is used. The benefits would increase by tens of billions of dollars per year.
B. Recommendations
1. The final CPP should aim to reduce U.S. total emissions from the electricity sector by about 40 percent relative to 1990 (or 55 percent relative to 2005). This would strengthen the U.S. position in climate negotiations and put it in a better position to argue for stronger reductions from China and other countries like emitters, like India, that are not part of the Organisation for Economic Cooperation and Development (OECD), which groups developed countries. It would also align the U.S. goal with the overall European Union goal for greenhouse gas emissions, at least for the electricity sector.
2. The EPA should use the range of available data on natural gas venting; it should also use the 20-year global warming potential of methane to evaluate the impacts of the increase in natural gas use for electricity generation as proposed in setting the target emission rates in the CPP.
3. The use of natural gas in the CPP should be at most equal to the 2012 level, given the uncertainties in leakage rates and the large potential impact of methane on a 10- to 30-year time frame.
4. The EPA should remove existing and under-construction nuclear power plants from the best system of emission reduction. It should also be explicit that new nuclear reactors do not belong in the BSER.
5. Given that relicensing nuclear plants is the prerogative and responsibility of the NRC, with an eye to safety and health, the EPA should not allow the inclusion of any nuclear reactor whose license is due to expire before 2030 in state implementation plans. States can no more trump the authority of the NRC in this regard than can the EPA.
6. The EPA should provide clear guidance that it expects continued compliance with emission targets whenever any reactor with an appropriate license that is in a state compliance plan is shut for prolonged periods or permanently.
7. The EPA should calculate CO2 emission rates by including all CO2 emissions from affected generation units and divide that by all generation in a particular state142 in any year. Doing this consistently for each year going forward can create a technology neutral rule that is consistently based on a well-defined best system of emission reduction, which must include technical feasibility, economics, and non-air quality considerations.
142 The EPA excluded small power plants in its calculation; they amount to only about 2 percent of generation and have no practical effect on the rule.
IEER Comments on the 2014 Proposed Clean Power Plan of the U.S. Environmental Protection Agency
56
8. The EPA should adopt the approach of displacing fossil fuel generation by energy efficiency and renewable energy along the lines published in the October 2014 Notice of Data Availability (NODA).143 This approach is more realistic, produces stronger targets, and overcomes the methodological problems of the CPP published in June 2014. We recommend that the following specific approach be adopted: Energy efficiency should be assumed to displace fossil fuels proportionately. This reasonably approximates how a mix of efficiency measures would work. The EPA should then use renewables to displace fossil fuels in the order of their emission rates – coal, oil and gas generation, and natural gas combined cycle plants. States could file plans to use efficiency to displace fossil fuels in a manner different than in that suggested here as long as they demonstrate that the structure of their efficiency plans corresponds to the order of displacement. For instance, if efficiency plans are geared mainly to air-conditioning, it would be reasonable to assume displacement of gas turbines first and then oil and gas generation followed by NGCC generation.
9. The EPA should include combined heat and power (CHP) into its best system of emission reduction so long as total natural gas use for electricity generation (net of any thermal benefits) does not increase above the baseline level in 2012. The present CPP is too oriented to centralized generation. Although it recognizes the value of CHP, it does not do so in the context of the need for a resilient grid. Combined heat and power can be and is being combined with distributed solar to decrease CO2 emissions and increase grid resilience. Keeping natural gas use in the electricity sector below 2012 levels is important for (i) moderating prices so that low-income people and small business are not hurt by climate-related energy policy, and (ii) ensuring that methane-venting-related warming does not negate any of the gains achieved by carbon reductions in other areas.
143 79 FR 64543 (OCT. 30, 2014)
IEER Comments on the 2014 Proposed Clean Power Plan of the U.S. Environmental Protection Agency
57
VII. REFERENCES
40 CFR 141 (2013)
U.S. Environmental Protection Agency. Code of Federal Regulations. Title 40--Protection of Environment. Part 141--National Primary Drinking Water Regulations. 7-1-13 Edition. Washington, DC: Office of the Federal Register, National Archives and Records Administration; U.S. GPO, 2013. On the Web at www.gpo.gov/fdsys/pkg/CFR-2013-title40-vol24/pdf/CFR-2013-title40-vol24-part141.pdf. Viewed 18nov14.
75 FR 81037 (Dec. 23, 2010)
U.S. Nuclear Regulatory Commission. “10 CFR Part 51: [NRC–2008–0482]: Waste Confidence Decision Update,” Federal Register, v. 75, no. 246 (December 23, 2010): pp. 81037-81076. On the Web at http://www.gpo.gov/fdsys/pkg/FR-2010-12-23/pdf/2010-31637.pdf. “FR DOC # 2010-31637” “Update and final revision of Waste Confidence Decision.”
79 FR 34830 (June 18, 2014)
U.S. Environmental Protection Agency. "40 CFR Part 60: Carbon Pollution Emission Guidelines for Existing Stationary Sources: Electric Utility Generating Units; Proposed Rule," Federal Register, v. 79, no. 117 (June 18, 2014): pp. 34830-34958. On the Web at http://www.regulations.gov/#!documentDetail;D=EPA-HQ-OAR-2013-0602-0001 (html) and www.gpo.gov/fdsys/pkg/FR-2014-06-18/pdf/2014-13726.pdf. [EPA–HQ–OAR–2013–0602; FRL 9911–86–OAR] RIN 2060–AR33. Also at https://www.federalregister.gov/articles/2014/06/18/2014-13726/carbon-pollution-emission-guidelines-for-existing-stationary-sources-electric-utility-generating (html version)
79 FR 56238 (Sept. 19, 2014)
U.S. Nuclear Regulatory Commission. "10 CFR Part 51: [NRC–2012–0246]: Continued Storage of Spent Nuclear Fuel: Final Rule," Federal Register, v. 79 (Sept. 19, 2014): pp: 56238- 56263. On the Web at www.gpo.gov/fdsys/pkg/FR-2014-09-19/pdf/2014-22215.pdf. “Final Continued Storage Rule” "RIN 3150–AJ20"
79 FR 64543 (Oct. 30, 2014)
U.S. Environmental Protection Agency. "40 CFR Part 60: Carbon Pollution Emission Guidelines for Existing Stationary Sources: Electric Utility Generating Units; Notice of data availability," Federal Register, v. 79, no 210 (October 30, 2014): pp. 64543-64553. On the Web at www.gpo.gov/fdsys/pkg/FR-2014-10-30/pdf/2014-25845.pdf, from link at http://www.regulations.gov/#!documentDetail;D=EPA-HQ-OAR-2013-0602-21200. "RIN 2016-AR33" "EPA–HQ–OAR–2013–0602; FRL–9918–53–OAR."
ACEEE 2014 Maggie Molina. The Best Value for America’s Energy Dollar: A National Review of the Cost of Utility Energy Efficiency Programs. (Report Number U1402) Washington, DC: American Council for an Energy-Efficient Economy, March 2014. On the Web at http://aceee.org/research-report/u1402.
ACEEE State Rankings 2014
American Council for an Energy-Efficient Economy. State Scorecard Rank. Washington, DC: ACEEE, 2014. On the Web at http://database.aceee.org/state-scorecard-rank.
Burris 2014 Roddie Burris. "SC Supreme Court: SCE&G has right to raise rates, The State (South Carolina), October 22, 2014 On the Web at http://www.thestate.com/2014/10/22/3761335_supreme-court-rules-sceg-within.html?rh=1.
IEER Comments on the 2014 Proposed Clean Power Plan of the U.S. Environmental Protection Agency
58
Caddell and
Heidorn 2014
Ted Caddell and Rich Heidorn Jr. "FirstEnergy Wants Regulated Companies to
Subsidize Generation," RTO Insider, August 12, 2014. On the Web at
http://www.rtoinsider.com/firstenergy-subsidize-gen.
Caulton et al. 2014
Dana R. Caulton, Paul B. Shepson, Renee L. Santoro, Jed P. Sparks, Robert W. Howarth, Anthony R. Ingraffea, Maria O. L. Cambaliza, Colm Sweeney, Anna Karion, Kenneth J. Davis, Brian H. Stirm, Stephen A. Montzka, and Ben R. Miller. "Toward a better understanding and quantification of methane emissions from shale gas development," Proceedings of the National Academy of Sciences of the United States of America (PNAS) v.111, no.17 (April 29, 2014): pp. 6237-6242. On the Web at http://www.pnas.org/content/early/2014/04/10/1316546111 and www.pnas.org/lookup/suppl/doi:10.1073/pnas.1316546111/-/DCSupplemental.
Cooper 2013 Mark Cooper. Declaration of Mark Cooper. In the Matter of Proposed Rule: Waste Confidence – Continued Storage of Spent Nuclear Fuel 10 C.F.R. Part 51; Draft Waste Confidence Generic Environmental Impact Statement; U.S. Nuclear Regulatory Commission. Docket No. 2012-0246. December 16, 2013. On the Web at http://pbadupws.nrc.gov/docs/ML1401/ML14016A068.pdf. See pdf pages 323-392, of Comments by Environmental Organizations on Draft Waste Confidence Generic Environmental Impact Statement and Proposed Waste Confidence Rule and Petition to Revise and Integrate All Safety and Environmental Regulations Related to Spent Fuel Storage and Disposal (December 20, 2013)
Cooper Comments 2014
Mark Cooper. Comments Of Dr. Mark Cooper. In the Matter of Carbon Pollution Emission Guidelines for Existing Stationary Sources: Electric Utility Generating Units. Docket EPA–HQ–OAR–2013–0602; RIN 2060–AR33. Before the Environmental Protection Agency. November 24, 2014.
Crane 2014 Energy Revolution: Utilities Confront the Shifting Energy Landscape. RFF Policy Leadership Forum: A Conversation with Chris Crane, President and CEO, Exelon, May 13, 2014. Washington, DC: Resources for the Future, 2014. On the Web at http://www.rff.org/Events/Pages/Energy-Revolution-Utilities-Confront-the-Shifting-Energy-Landscape.aspx, with audio at: http://video.rff.org:8000/~rff/140513.mp3. Conversation with RFF President Phil Sharp.
Credit Suisse 2010
Dan Eggers, Kevin Cole, Yang Y. Song, and LinLin Sun. Growth From Subtraction: Impact of EPA Rules on Power Markets. New York: Credit Suisse, 23 September 2010. On the Web at http://op.bna.com/env.nsf/id/jstn-8actja/$File/suisse.pdf.
DOE 2008 U.S. Department of Energy. Office of Civilian Radioactive Waste Management. Final Supplemental Environmental Impact Statement for a Geologic Repository for the Disposal of Spent Nuclear Fuel and High-Level Radioactive Waste at Yucca Mountain, Nye County, Nevada. (DOE/EIS-0250F-S1) Washington, DC: DOE, OCRWM, June 2008. Links on the Web to all four volumes, at http://energy.gov/nepa/downloads/eis-0250-s1-final-supplemental-environmental-impact-statement, including Summary, at http://energy.gov/sites/prod/files/EIS-0250-S1-FEIS-Summary-2008.pdf.

IEER Comments on the 2014 Proposed Clean Power Plan of the U.S. Environmental Protection Agency
59
DOE EERE 2012 BEDB
D&R International, Ltd. 2011 Buildings Energy Data Book. [Washington, DC]: Buildings Technologies Program, Energy Efficiency and Renewable Energy, U.S. Department of Energy, March 2012. Links on the Web at http://buildingsdatabook.eren.doe.gov/DataBooks.aspx, with pdf at http://buildingsdatabook.eren.doe.gov/docs%5CDataBooks%5C2011_BEDB.pdf. --Table 2.9.8. FY 2009 Residential Energy Burdens, by Region (1), at http://buildingsdatabook.eren.doe.gov/TableView.aspx?table=2.9.8
DOE SunShot 2012
U.S. Department of Energy. SunShot Vision Study. (DOE/GO-102012-3037) [Golden, CO]: U.S. Department of Energy, Office of Energy Efficiency and Renewable Energy, February 2012. On the Web at http://www1.eere.energy.gov/solar/pdfs/47927.pdf, from links at http://www2.eere.energy.gov/solar/sunshot/vision_study.html. Prepared by the National Renewable Energy Laboratory.
DSIRE RPS 2013 DSIRE: Quantitative RPS Data Project Database of Energy Efficiency, Renewable Energy Solar Incentives, Rebates, Programs, Policy, at http://www.dsireusa.org/rpsdata.
-- DSIRE RPS Data Spreadsheet, at www.dsireusa.org/rpsdata/RPSspread031813.xlsx.
EIA AEO 2013 United States. Department of Energy. Energy Information Administration. Annual Energy Outlook, with Projections to 2040. (DOE/EIA-0383(2013)) Washington, DC: EIA, April 2013. On the Web at www.eia.gov/forecasts/archive/aeo13/pdf/0383(2013).pdf.
EIA AEO 2014 United States. Department of Energy. Energy Information Administration. Annual Energy Outlook, with Projections to 2040. (DOE/EIA-0383(2014)) Washington, DC: EIA, April 2014. On the Web at http://www.eia.gov/forecasts/aeo/pdf/0383(2014).pdf, with links at http://www.eia.gov/forecasts/aeo and http://www.eia.gov/forecasts/aeo/tables_ref.cfm. --Table 8. Electricity Supply, Disposition, Prices, and Emissions, at www.eia.gov/forecasts/aeo/excel/aeotab_8.xlsx. (A8) --Table 9. Electricity generating capacity at www.eia.gov/forecasts/aeo/excel/aeotab_9.xlsx. (A9) --Table 13. Natural gas supply, disposition, and prices, at http://www.eia.gov/forecasts/aeo/excel/aeotab_13.xlsx. (also called Table A13, in the full printed report) --Levelized Cost and Levelized Avoided Cost of New Generation Resources in the Annual Energy Outlook 2014 (release date: April 17, 2014), at http://www.eia.gov/forecasts/aeo/electricity_generation.cfm.

IEER Comments on the 2014 Proposed Clean Power Plan of the U.S. Environmental Protection Agency
60
EIA State Electricity Profiles 2014
United States. Department of Energy. Energy Information Administration. State Electricity Profiles. Data for 2012. Washington, DC: EIA, May 1, 2014. On the Web at http://www.eia.gov/electricity/state/. Idaho links are at http://www.eia.gov/electricity/state/idaho/. -- Idaho: Table 1. 2012 Summary Statistics (Idaho), at www.eia.gov/electricity/state/idaho/xls/sept01id.xls. -- Idaho: Table 5: Electric power industry generation by primary energy source, 1990-2012, at www.eia.gov/electricity/state/idaho/xls/sept05id.xls. Oregon links are at http://www.eia.gov/electricity/state/oregon/. -- Oregon: Table 1. 2012 Summary Statistics (Oregon), at www.eia.gov/electricity/state/idaho/xls/sept01or.xls. -- Oregon: Table 5: Electric power industry generation by primary energy source, 1990-2012, at www.eia.gov/electricity/state/oregon/xls/sept05or.xls. Washington links are at http://www.eia.gov/electricity/state/washington/. -- Washington: Table 1. 2012 Summary Statistics (Washington), at www.eia.gov/electricity/state/washington/xls/sept01wa.xls -- Washington: Table 5: Electric power industry generation by primary energy source, 1990-2012, at www.eia.gov/electricity/state/washington/xls/sept05wa.xls.
EPA 1973 United States. Environmental Protection Agency. Questions and answers about nuclear power plants. Washington, DC: EPA, 1973. On the Web at http://books.google.com/books/about/Questions_and_Answers_about_Nuclear_Powe.html?id=zdK3AAAAIAAJ.
EPA 2012 United States. Environmental Protection Agency. Oil and Natural Gas Sector: Standards of Performance for Crude Oil and Natural Gas Production, Transmission, and Distribution. [Washington, DC]: EPA, Office of Air and Radiation, Office of Air Quality Planning and Standards, April 2012. On the Web at www.epa.gov/airquality/oilandgas/pdfs/20120418tsd.pdf. With technical support provided by EC/R, Incorporated, ICF International, and RTI International. Cover subtitle: Background Supplemental Technical Support Document for the Final New Source Performance Standards.
EPA CCP Portal 2014
United States. Environmental Protection Agency. Clean Power Plan Proposed Rule. Washington, DC: EPA, accessed Oct 16, 2014. On the Web at http://www2.epa.gov/carbon-pollution-standards/clean-power-plan-proposed-rule. Portal.
EPA CCP Tech Docs 2014
United States. Environmental Protection Agency. Clean Power Plan Proposed Rule Technical Documents. Washington, DC: EPA, accessed Oct 16, 2014. On the Web at http://www2.epa.gov/carbon-pollution-standards/clean-power-plan-proposed-rule-technical-documents. Portal.
-- Data File: Goal Computation - Appendix 1 and 2, at http://www2.epa.gov/sites/production/files/2014-06/20140602tsd-state-goal-data-computation_1.xlsx.

IEER Comments on the 2014 Proposed Clean Power Plan of the U.S. Environmental Protection Agency
61
EPA GHG Inventory 2013
United States. Environmental Protection Agency. Inventory of U.S. Greenhouse Gas Emissions and Sinks: 1990 - 2011. (EPA 430-R-13-001) Washington, DC: EPA, April 12, 2013. On the Web at http://www.epa.gov/climatechange/Downloads/ghgemissions/US-GHG-Inventory-2013-Main-Text.pdf, from links at http://www.epa.gov/climatechange/ghgemissions/usinventoryreport.html.
EPA GHG Inventory 2014
United States. Environmental Protection Agency. Inventory of U.S. Greenhouse Gas Emissions and Sinks: 1990 - 2012. (EPA 430-R-14-003) Washington, DC: EPA, April 15, 2013. On the Web at http://www.epa.gov/climatechange/Downloads/ghgemissions/US-GHG-Inventory-2014-Main-Text.pdf, from links at http://www.epa.gov/climatechange/ghgemissions/usinventoryreport.html.
EPA Goal Computation 2014
United States. Environmental Protection Agency. Goal Computation Technical Support Document. Washington, DC: EPA, Office of Air and Radiation, June 2014. On the Web at http://www2.epa.gov/sites/production/files/2014-06/documents/20140602tsd-goal-computation.pdf. "Technical Support Document (TSD) for the CAA Section 111(d) Emission Guidelines for Existing Power Plants; Docket ID No. EPA-HQ-OAR-2013-0602."
EPA IPM 2014 United States. Environmental Protection Agency. EPA Power Sector Modeling. Washington, DC: EPA, Office of Air and Radiation, last updated on June 2, 2014. On the Web at http://www.epa.gov/powersectormodeling/. At head of title: "Clean Air Markets."
EPA NODA 2014
See 79 FR 64543 (Oct. 30, 2014)
EPA RIA 2014 United States. Environmental Protection Agency. Regulatory Impact Analysis for the Proposed Carbon Pollution Guidelines for Existing Power Plants and Emission Standards for Modified and Reconstructed Power Plants. (EPA -542/R-14-002) Research Triangle Park, NC: EPA, Office of Air Quality Planning and Standards, Health & Environmental Impacts Division, Air Economics Group, June 2014. On the Web at http://www.epa.gov/ttnecas1/regdata/RIAs/111dproposalRIAfinal0602.pdf or http://www2.epa.gov/sites/production/files/2014-06/documents/20140602ria-clean-power-plan.pdf, from link at http://www2.epa.gov/carbon-pollution-standards/clean-power-plan-proposed-rule.
European Commission 2014
European Commission. 2030 framework for climate and energy policies. Brussels, EC, last update November 11, 2014. On the Web at, http://ec.europa.eu/clima/policies/2030/index_en.htm.
Executive Order 2012
Barack Obama. Executive Order -- Accelerating Investment in Industrial Energy Efficiency. Washington, DC: White House, Office of the Press Secretary, August 30, 2012. On the Web at http://www.whitehouse.gov/the-press-office/2012/08/30/executive-order-accelerating-investment-industrial-energy-efficiency.
Freeman 2007 S. David. Freeman. "Foreword." In Carbon-Free and Nuclear-Free: A Roadmap for U.S. Energy Policy, by Arjun Makhijani, Takoma Park, MD, IEER Press, 2007; 3rd printing, 2010. On the Web at http://ieer.org/resource/reports/carbon-free-and-nuclear-free/.
IEER Comments on the 2014 Proposed Clean Power Plan of the U.S. Environmental Protection Agency
62
Georgia EPD 2014
Georgia. Department of Natural Resources. Environmental Protection Division. Air Protection Branch. Subject: Attention Docket ID No. EPA-HQ-OAR-2013-0602; Proposed Carbon Pollution Emission Guidelines for Existing Stationary Sources: Electric Utility Generating Units; Comment Topic: Removal of Under-Construction Nuclear from Emissions Performance Goal Computation. Atlanta: DNR, September 16, 2014. On the Web at http://www.georgiaair.org/airpermit/downloads/planningsupport/regdev/ghg/gaepd_ucnuclear_comments09162014.pdf.
Georgia Power 2014
Georgia Power Company. Georgia Power Company's Application for the Certification of the 2015 and 2016 Advanced Solar Initiative Prime Power Purchase Agreements and Request for Approval of the 2015 Advanced Solar Initiative Power Purchase Agreements. G[eorgia Public Service Commission] Docket No. 38877. Atlanta: Georgia Power, October 10, 2014. Links on the Web at http://www.psc.state.ga.us/factsv2/Document.aspx?documentNumber=155389. See file <2015-2016 ASI prime Certification Filing Final - PD (10 14).PDF> in zip folder.
GRI-EPA 1996, v. 1
Matthew R. Harrison, Theresa M. Shires, Jane K. Wessels, and R. Michael Cowgill. Methane Emissions from the Natural Gas Industry. Volume 1: Executive Summary. (GRI-94/0257; EPA-600/R-96-080a) Chicago: Gas Research Institute; Research Triangle Park, NC: U.S. Environmental Protection Agency, National Risk Management Research Laboratory, June 1996. On the Web at http://www.epa.gov/gasstar/documents/emissions_report/1_executiveummary.pdf, from link at http://www.epa.gov/gasstar/tools/related.html#one.
Hayet 2013 Direct Testimony and Exhibits of Steven D. Roetger [and] William R. Jacobs, Jr., Ph.D. Public Disclosure on Behalf of the Georgia Public Service Commission, Public Interest Advocacy Staff. Before the Georgia Public Service Commission, In the Matter of Georgia Power Company, Eighth Semi-Annual Vogtle Construction Monitoring Report: Docket No. 29849. August 8, 2013. Link on the Web at http://www.psc.state.ga.us/factsv2/Document.aspx?documentNumber=149298. Docket title: Georgia Power Company`s Vogtle Units 3 and 4 Construction Monitoring
Hearth, Melicher, and Gurley 1990
Douglas Hearth, Ronald W. Melicher, and Darryl E. J. Gurley. "Nuclear Power Plant Cancellations: Sunk Costs and Utility Stock Returns," Quarterly Journal of Business and Economics, v. 29, no. 1 (Winter 1990): pp. 102-115. On the Web at http://www.jstor.org/stable/40472985. Published by: University of Nebraska-Lincoln College of Business Administration. Also available in html version at http://us.hanamoku.com/detail/B0008MGQKS.html & at http://www.amazon.com/Nuclear-power-plant-cancellations-Quarterly/dp/B0008MGQKS%3FSubscriptionId%3D1HSVZ98ENRWZZS88XN02%26tag%3Dhanamokucom-20%26linkCode%3Dxm2%26camp%3D2025%26creative%3D165953%26creativeASIN%3DB0008MGQKS.
IEER Comments on the 2014 Proposed Clean Power Plan of the U.S. Environmental Protection Agency
63
Howarth, Santoro, and Ingraffea 2011
Robert W. Howarth, Rene Santoro, and Anthony Ingraffea. "Methane and the greenhouse-gas footprint of natural gas from shale formations," Climatic Change, v. 106 (2011): pp. 679–690. On the Web at http://link.springer.com/article/10.1007/s10584-011-0061-5. (free) Supplementary materials: http://link.springer.com/content/esm/art:10.1007/s10584-011-0061-5/file/MediaObjects/10584_2011_61_MOESM1_ESM.doc
IAEA 2001 International Atomic Energy Agency. IAEA Safeguards Glossary. 2001 Ed. (International Nuclear Verification Series No. 3; IAEA/NVS/3/CD). Vienna: IAEA, 2002. On the Web at http://www-pub.iaea.org/MTCD/publications/PDF/nvs-3-cd/PDF/NVS3_scr.pdf.
IAEA 2007 International Atomic Energy Agency. Nuclear Fuel Cycle Simulation System (VISTA). ( IAEA-TECDOC-1535) Vienna: Nuclear Fuel Cycle and Materials Section, IAEA, February 2007. On the Web at http://www- pub.iaea.org/MTCD/publications/PDF/te_1535_web.pdf.
IEER 2013 Science for Democratic Action, v. 17, no. 1 (June 2013). On the Web at http://ieer.org/wp/wp-content/uploads/2013/06/17-1.pdf, with link from http://ieer.org/article/science-for-democratic-action/volume-17-number-1. Newsletter of the Institute for Energy and Environmental Research.
IPCC5 WGIII SPM 2014
Intergovernmental Panel on Climate Change. “Summary for Policymakers.” In: Climate Change 2014: Mitigation of Climate Change. Contribution of Working Group III to the Fifth Assessment Report of the Intergovernmental Panel on Climate Change. [Cambridge; New York: Cambridge University Press], approved at the Twelfth Session of Working Group III, held in Berlin, Germany, from 7 to 11 April, 2014. On the Web at http://report.mitigation2014.org/spm/ipcc_wg3_ar5_summary-for-policymakers_approved.pdf, from link at http://mitigation2014.org/report. Main volume has not yet been issued in its final version.
IPCC5 WGIII TS 2014
Intergovernmental Panel on Climate Change. "Technical Summary.” In: Climate Change 2014: Mitigation of Climate Change. Contribution of Working Group III to the Fifth Assessment Report of the Intergovernmental Panel on Climate Change. Final Draft [Cambridge; New York: Cambridge University Press, 2014]. On the Web at http://report.mitigation2014.org/drafts/final-draft-postplenary/ipcc_wg3_ar5_final-draft_postplenary_technical-summary.pdf, from link at http://mitigation2014.org/report/final-draft/. The "the copy-edited version of the final draft Report, dated 17 December 2013…that was accepted but not approved in detail by the 12th Session of Working Group III and the 39th Session of the IPCC on 12 April 2014 in Berlin, Germany."
IPFM 2011 Harold Feiveson, Zia Mian, M.V. Ramana, and Frank von Hippel, editors. Managing Spent Fuel from Nuclear Power Reactors: Experience and Lessons from Around the World. Princeton, NJ: International Panel on Fissile Material, September 2011. On the Web at http://fissilematerials.org/library/2011/09/managing_spent_fuel_from_nucle.html.
IEER Comments on the 2014 Proposed Clean Power Plan of the U.S. Environmental Protection Agency
64
IRSN 2013 Institut de radioprotection et de sûreté nucléaire. Travaux de l’IRSN sur le coût économique des accidents nucléaires entraînant des rejets radioactifs dans l’environnement. [Fontenay-aux-Roses, France], IRSN, 19/02/2013. On the Web at http://www.irsn.fr/FR/Actualites_presse/Actualites/Pages/20130219-Travaux-recherche-IRSN-cout-economique-accidents-nucleaires.aspx#.VFlG_8mkP0X.
Jones and Leff
2014
Jeffery Jones and Michael Leff. Implications of accelerated power plant retirements.
(Issues in Focus). Washington, DC: Department of Energy, Energy Information
Administration, release date: 4/28/14. On the Web at
http://www.eia.gov/forecasts/aeo/power_plant.cfm. At head of title: Annual
Energy Outlook 2014 (DOE/EIA-0383(2014).
Judson 2014 Tim Judson. Killing the Competition: The Nuclear Power Agenda to Block Climate Action, Stop Renewable Energy, and Subsidize Old Reactors. (NIRS Report) Takoma Park, MD: Nuclear Information and Resource Service, September 2014. On the Web at www.nirs.org/neconomics/killingthecompetition914.pdf.
Kort et al. 2014 Eric A. Kort, Christian Frankenberg, Keeley R. Costigan, Rodica Lindenmaier, Manvendra K. Dubey, and Debra Wunch. “Four corners: The largest US methane anomaly viewed from space,” Geophysical Research Letters, v. 41 (published online: 9 OCT 2014) doi:10.1002/2014GL061503. On the Web at http://onlinelibrary.wiley.com/doi/10.1002/2014GL061503/abstract, http://onlinelibrary.wiley.com/doi/10.1002/2014GL061503/references.
Lazard 2014 Lazard. Lazard’s Levelized Cost of Energy Analysis - Version 8.0. [New York: Lazard Ltd. Global Power, Energy & Infrastructure Group], September 2014. On the Web at www.lazard.com/PDF/Levelized%20Cost%20of%20Energy%20-%20Version%208.0.pdf. Press release at http://www.lazard.com/media/198582/levelized-cost-of-energy-release-version-80.pdf. Slides
Los Angeles Times 2014
Kyle Kim and Thomas Suh Lauder. "Infographic: 199 drought maps reveal just how thirsty California has become," Los Angeles Times, October 23, 2014. On the Web at http://www.latimes.com/science/la-me-g-california-drought-map-htmlstory.html.
Macfarlane 2014
Allison M. Macfarlane. Chairman Macfarlane’s Comments on SECY-14-0072: “Proposed Rule: Continued Storage of Spent Nuclear Fuel.” [Washington, DC: NRC], August 7, 2014. On the Web at http://www.nrc.gov/reading-rm/doc-collections/commission/cvr/2014/2014-0072vtr-amm.pdf.
Maine Hydropower 2010
Maine. Department of Environmental Protection. Hydropower Projects in Maine. (DEPLW0363-I2010) Augusta: DEP, April 1, 2010. On the Web at http://www.maine.gov/dep/water/dams-hydro/status_hydropower.pdf.
Makhijani 2007 Arjun Makhijani. Carbon-Free and Nuclear-Free: A Roadmap for U.S. Energy Policy. Takoma Park, MD: IEER Press, 2007; 3rd printing, 2010. On the Web at http://ieer.org/resource/reports/carbon-free-and-nuclear-free/.
Makhijani 2013 Arjun Makhijani. Light Water Designs of Small Modular Reactors: Facts and Analysis. Takoma Park, MD: Institute for Energy and Environmental Research, revised September 2013; originally published August 2013. On the Web at http://ieer.org/resource/energy-issues/light-water-designs-of-small-modular-reactors-facts-and-analysis/.
IEER Comments on the 2014 Proposed Clean Power Plan of the U.S. Environmental Protection Agency
65
Makhijani Declaration 2013
Arjun Makhijani. Declaration of Dr. Arjun Makhijani Regarding the Waste Confidence Proposed Rule and Draft Generic Environmental Impact Statement. [Takoma Park, MD: Institute for Energy and Environmental Research], December 20, 2013; corrected January. 7, 2014. On the Web at http://ieer.org/wp/wp-content/uploads/2013/12/MakhijaniDeclaration-NRCWasteConfidence-Dec2013.pdf. Also on the Web at http://pbadupws.nrc.gov/docs/ML1401/ML14016A068.pdf. See pdf pages 69-138.
Makhijani, Smith, and Thorne 2006
Arjun Makhijani, Brice Smith, and Michael C. Thorne. Science for the Vulnerable: Setting Radiation and Multiple Exposure Environmental Health Standards to Protect Those Most at Risk. Takoma Park: MD: Institute for Energy and Environmental Research, October 19, 2006; reprinted with corrections, 2007-2012. Links on the Web at http://ieer.org/resource/press-releases/science-vulnerable-setting-radiation.
Malakoff 2014 David Malakoff. “Let's Call It 'Climate Disruption,' White House Science Adviser Suggests (Again),” ScienceInsider, 2 May 2014. On the Web at http://news.sciencemag.org/climate/2014/05/lets-call-it-climate-disruption-white-house-science-adviser-suggests-again
Miller et al. 2013
Scot M. Miller, Steven C. Wofsy, Anna M. Michalak, Eric A. Kort, Arlyn E. Andrews, Sebastien C. Biraud, Edward J. Dlugokencky, Janusz Eluszkiewicz, Marc L. Fischer, Greet Janssens-Maenhout, Ben R. Milleri, John B. Miller, Stephen A. Montzka, Thomas Nehrkorn, and Colm Sweeney. “Anthropogenic emissions of methane in the United States,” Proceedings of the National Academy of Sciences of the United States of America, v. 110, no. 50 (December 10, 2013): pp. 20018-20022. On the Web at http://www.pnas.org/content/110/50/20018.abstract.
MRITS 2014 GE Energy Consulting. Minnesota Renewable Energy Integration and Transmission Study: Final Report. Prepared by GE Energy Consulting, with contributions by: The Minnesota Utilities and Transmission Companies, Excel Engineering, Inc., and MISO. Prepared for The Minnesota Utilities and Transmission Companies and The Minnesota Department of Commerce. St. Paul: Minnesota Dept. of Commerce, October 31, 2014. On the Web at http://mn.gov/commerce/energy/images/FINAL-MRITS-Report14.pdf. Running title: MRITS Final Report.
NAESB 2004 North American Energy Standards Board. Natural Gas Specs Sheet. [Houston, TX: NAESB, 2004]. On the Web at https://www.naesb.org//pdf2/wgq_bps100605w2.pdf.
NAS-NRC 2012 National Research Council. Committee on the Analysis of Cancer Risks in Populations near Nuclear Facilities – Phase I. Analysis of Cancer Risks in Populations near Nuclear Facilities: Phase I. Washington, DC: National Academies Press, 2012. On the Web at http://www.nap.edu/catalog.php?record_id=13388.

IEER Comments on the 2014 Proposed Clean Power Plan of the U.S. Environmental Protection Agency
66
National Climate Assessment 2014
Jerry M. Melillo, Terese (T.C.) Richmond, and Gary W. Yohe, eds. Climate Change Impacts in the United States: U.S. National Climate Assessment. Washington, DC: U.S. Global Change Research Program, 2014. On the Web at http://nca2014.globalchange.gov/system/files_force/downloads/low/NCA3_Climate_Change_Impacts_in_the_United%20States_LowRes.pdf?download=1. This is the Third Assessment.
-- Hi Res copy of Chapter 2 is at http://nca2014.globalchange.gov/system/files_force/downloads/high/NCA3_Full_Report_02_Our_Changing_Climate_HighRes.pdf?download=1.
NEA 2013 Nuclear Energy Agency. Nuclear Energy Data 2013. (NEA No. 7162) Issy-les-Moulineaux, France: Organisation for Economic Co-operation and Development, NEA, 2013. On the Web at http://www.oecd-nea.org/ndd/bb-pub.html. Alternate title: Données sur l’énergie nucléaire 2013
NEA 2014 Nuclear Energy Agency. Fukushima Press Kit. Issy-les-Moulineaux, France: Organisation for Economic Co-operation and Development, NEA, last updated 5 September 2014. On the Web at http://www.oecd-nea.org/press/press-kits/fukushima.html.
NEI 2014 Nuclear Energy Institute. Nuclear Energy 2014: Status and Outlook: Annual Briefing for the Financial Community. Washington, DC: NEI, February 13, 2014. On the Web at http://www.nei.org/CorporateSite/media/filefolder/Policy/Wall%20Street/WallStreetBrief2014slides.pdf?ext=.pdf
Newell and Raimi 2014
Richard G. Newell and Daniel Raimi. "Implications of shale gas development for climate change," Environmental Science & Technology, v. 48 (2014): pp. 8360–8368. On the Web at http://energy.duke.edu/sites/energy.duke.edu/files/files/EST-shale-climate%2020140825-FINAL.pdf. Supporting Info available at http://pubs.acs.org/doi/abs/10.1021/es4046154, with link to http://pubs.acs.org/doi/suppl/10.1021/es4046154.
NRC 2014 United States. Nuclear Regulatory Commission. Backgrounder on Nuclear Insurance and Disaster Relief. Washington, DC: NRC Office of Public Affairs, last reviewed/updated, July 16, 2014. On the Web at http://www.nrc.gov/reading-rm/doc-collections/fact-sheets/nuclear-insurance.html.
NRC Information Digest 2014
United States. Nuclear Regulatory Commission. 2014-2015 Information Digest. (NUREG-1350, Volume 26) Washington, DC: NRC Office of Public Affairs, August 2014. On the Web at http://www.nrc.gov/reading-rm/doc-collections/nuregs/staff/sr1350, with link to www.nrc.gov/reading-rm/doc-collections/nuregs/staff/sr1350/v26/sr1350v26.pdf.
NRC Tritium 2014
United States. Nuclear Regulatory Commission. Backgrounder on Tritium, Radiation Protection Limits, and Drinking Water Standards. Washington, DC, NRC Office of Public Affairs, last reviewed/updated Monday, June 30, 2014. On the Web at http://www.nrc.gov/reading-rm/doc-collections/fact-sheets/tritium-radiation-fs.html..
IEER Comments on the 2014 Proposed Clean Power Plan of the U.S. Environmental Protection Agency
67
NREL 2011 Jordan Macknick, Robin Newmark, Garvin Heath, and K.C. Hallett. A Review of Operational Water Consumption and Withdrawal Factors for Electricity Generating Technologies. (Technical Report NREL/TP-6A20-50900) Golden, CO: National Renewable Energy Laboratory, March 2011. On the Web at http://www.nrel.gov/docs/fy11osti/50900.pdf.
NREL Potentials 2012
Anthony Lopez, Billy Roberts, Donna Heimiller, Nate Blair, and Gian Porro. U.S. Renewable Energy Technical Potentials: A GIS-Based Analysis. (Technical Report NREL/TP-6A20-51946). Golden, CO: National Renewable Energy Laboratory, July 2012. On the Web at www.nrel.gov/docs/fy12osti/51946.pdf.
NSIDC Arctic 2014
National Snow and Ice Data Center. "Arctic sea ice reaches minimum extent for 2014," Arctic Sea Ice News and Analysis, September 22, 2014. On the Web at http://nsidc.org/arcticseaicenews/2014/09/arctic-minimum-reached/. Figure 2 is at http://nsidc.org/arcticseaicenews/files/2014/09/Figure22.png.
NSIDC Global Climate 2014
National Snow and Ice Data Center. Environment: Climate. (All about sea ice) Boulder, CO: NSIDC, [2014]. On the Web at http://nsidc.org/cryosphere/seaice/environment/global_climate.html. Accessed November 27, 2014.
NUREG-2157 (2014)
United States. Nuclear Regulatory Commission. Generic Environmental Impact Statement for Continued Storage of Spent Nuclear Fuel: Final Report. (NUREG‒2157) Washington, DC: NRC, September 2014. On the Web at http://www.nrc.gov/reading-rm/doc-collections/nuregs/staff/sr2157/, with links to vol. 1, pbadupws.nrc.gov/docs/ML1419/ML14196A105.pdf, and vol. 2, pbadupws.nrc.gov/docs/ML1419/ML14196A107.pdf.
Overland and Wang 2013
James E. Overland and Muyin Wang. "When will the summer Arctic be nearly sea ice free?," Geophysical Research Letters, v. 40 (2013): pp. 2097-2101. On the Web at http://onlinelibrary.wiley.com/doi/10.1002/grl.50316/pdf.
Pétron et al. 2014
Gabrielle Pétron, Anna Karion, Colm Sweeney, Benjamin R. Miller, Stephen A. Montzka, Gregory J. Frost, Michael Trainer, Pieter Tans, Arlyn Andrews, Jonathan Kofler, Detlev Helmig, Douglas Guenther, Ed Dlugokencky, Patricia Lang, Tim Newberger, Sonja Wolter, Bradley Hall, Paul Novelli, Alan Brewer, Stephen Conley, Mike Hardesty, Robert Banta, Allen White, David Noone, Dan Wolfe and Russ Schnell. “A new look at methane and nonmethane hydrocarbon emissions from oil and natural gas operations in the Colorado Denver-Julesburg Basin,” Journal of Geophysical Research: Atmospheres, v. 119, issue 11 (16 June 2014): pp. 6836–6852. On the Web at http://onlinelibrary.wiley.com/doi/10.100/013JD017/full.
Pew 2012 D’Vera Cohn. Census Bureau Lowers U.S. Growth Forecast, Mainly Due to Reduced Immigration and Births. Washington, DC: Pew Research Center’s Social & Demographic Trends Project, December 14, 2012. On the Web at http://www.pewsocialtrends.org/2012/12/14/census-bureau-lowers-u-s-growth-forecast-mainly-due-to-reduced-immigration-and-births/#.
Register 2014 Chip Register. “Solar Continues Trumping Fossil Fuel Pricing, With More Innovations To Come,” Forbes, September 11, 2014. On the Web at http://www.forbes.com/sites/chipregister1/2014/09/11/solar-continues-trumping-fossil-fuel-pricing-with-more-innovations-to-come/?ss=energy.
IEER Comments on the 2014 Proposed Clean Power Plan of the U.S. Environmental Protection Agency
68
Roetger and Jacobs 2013
Steven D. Roetger and William R. Jacobs. Direct Testimony and Exhibits of Philip Hayet. Public Disclosure on Behalf of the Georgia Public Service Commission, Public Interest Advocacy Staff. Before the Georgia Public Service Commission, In the Matter of Georgia Power Company, Eighth Semi-Annual Vogtle Construction Monitoring Report: Docket No. 29849. August 8, 2013. Link on the Web at http://www.psc.state.ga.us/factsv2/Document.aspx?documentNumber=149298. Docket title: Georgia Power Company`s Vogtle Units 3 and 4 Construction Monitoring.
Roetger and Jacobs 2014a
Steven D. Roetger and William R. Jacobs. Direct Testimony and Exhibits of Steven D. Roetger [and] William R. Jacobs, Jr., Ph.D. Public Disclosure on Behalf of the Georgia Public Service Commission, Public Interest Advocacy Staff. Before the Georgia Public Service Commission, In the Matter of Georgia Power Company, Ninth / Tenth Semi-Annual Vogtle Construction Monitoring Report: Docket No. 29849. June 20, 2014. Link on the Web at http://www.psc.state.ga.us/factsv2/Document.aspx?documentNumber=153938. Docket title: Georgia Power Company`s Vogtle Units 3 and 4 Construction Monitoring.
Roetger and Jacobs 2014b
Steven D. Roetger and William R. Jacobs. Direct Testimony and Exhibits of Steven D. Roetger [and] William R. Jacobs, Jr., Ph.D. Public Disclosure on Behalf of the Georgia Public Service Commission, Public Interest Advocacy Staff. Before the Georgia Public Service Commission, In the Matter of Georgia Power Company, Eleventh Semi-Annual Vogtle Construction Monitoring Report: Docket No. 29849. November 21, 2014. Link on the Web at http://www.psc.state.ga.us/factsv2/Document.aspx?documentNumber=155941. Docket title: Georgia Power Company`s Vogtle Units 3 and 4 Construction Monitoring.
SACE 2014 Southern Alliance for Clean Energy. Georgia Public Service Commissioners Fail to Protect Consumers: Regulators approve spending on over budget, delayed Vogtle nuclear reactors. Knoxville, TN: SACE, August 19, 2014. On the Web at http://www.cleanenergy.org/gapsc-fail-to-protect-consumers.
Schneising et al. 2014
Oliver Schneising, John P. Burrows, Russell R. Dickerson, Michael Buchwitz, Maximilian Reuter, and Heinrich Bovensmann. “Remote sensing of fugitive methane emissions from oil and gas production in North American tight geologic formations,” Earth's Future, v. 2, issue 10 (October 2014): pp. 548-558. On the Web at http://onlinelibrary.wiley.com/doi/10.1002/2014EF000265/full. Article first published online: 6 OCT 2014.
SFA Pacific 2001
Dale R. Simbeck. CO2 Mitigation Economics for Existing Coal-Fired Power Plants. Presented at the U.S. Dept. of Energy National Energy Technology Laboratory (NETL) First National Conference on Carbon Sequestration, May 14-17, 2001, Washington, DC. Mountain View, CA: SFA Pacific, Inc., 2001. On the Web at http://www.netl.doe.gov/publications/proceedings/01/carbon_seq/7c2.pdf.
IEER Comments on the 2014 Proposed Clean Power Plan of the U.S. Environmental Protection Agency
69
Southeast Climate Consortium 2013
Southeast Climate Consortium. Climate of the Southeast United States: Variability, Change, Impacts, and Vulnerability, edited by Keith T. Ingram, Kirstin Dow, Lynne Carter, and Julie Anderson. (National Climate Assessment Regional Technical Input Report Series) Washington, DC: Island Press, 2013. On the Web at www.seclimate.org/wp-content/uploads/2014/09/Climate-of-the-Southeast-United-States.pdf.
SRS Watch 2014
Savannah River Site Watch. SCE&G Reveals Significant Delays and Cost Increases for Nuclear Reactor Construction Project; Additional Schedule Delay of 12-18 Months with Unknown Cost Increases to Rate Payers. Columbia, SC: SRS Watch, August 12, 2014. On the Web at http://www.srswatch.org/uploads/2/7/5/8/27584045/srs_watch_on_vc_summer_delays_august_12_2014.pdf. Press release.
St. Louis
Federal
Reserve 2014
Federal Reserve Bank of St. Louis. Gross Domestic Product: Implicit Price Deflator.
St. Louis, MO: Bank, updated: 2014-10-30. On the Web at
http://research.stlouisfed.org/fred2/series/GDPDEF/. Accessed on Nov. 24, 2014.
Stroeve et al. 2012
Julienne C. Stroeve Vladimir Kattsov, Andrew Barrett, Mark Serreze, Tatiana Pavlova, Marika Holland, and Walter N. Meier. "Trends in Arctic sea ice extent from CMIP5, CMIP3 and observations," Geophysical Research Letters, v. 39, published online on August 25, 2012. On the Web at http://onlinelibrary.wiley.com/enhanced/doi/10.1029/2012GL052676.
Travis et al. 1997
R.J. Travis, R.E. Davis, E.J. Grove, M.A. Azarm. A Safety and Regulatory Assessment of Generic BWR and PWR Permanently Shutdown Nuclear Power Plants. (NUREG/CR-6451; BNL-NUREG-52498) Upton, NY: Brookhaven National Laboratory, 1997. On the Web at http://www.osti.gov/bridge/product.biblio.jsp?osti_id=510336.
TVA Watts Bar 2008
Tennessee Valley Authority. Watts Bar Nuclear Plant. Knoxville, TN: TVA, [2008]. On the Web at http://web.archive.org/web/20120212011518/http://www.tva.gov/power/nuclear/wattsbar.htm. Archived. Date from Wikipedia's original endnote. Accessed October 29, 2014.
TVA Watts Bar
2014
Tennessee Valley Authority. Watts Bar Unit 2. Knoxville, TN: TVA, accessed October
29, 2014. On the Web at http://www.tva.com/power/nuclear/wattsbar_unit2.htm.
(Updated from time to time).
TVA Watts Bar Timeline 2012
Tennessee Valley Authority. Timeline of Watts Bar Nuclear Plant. Knoxville, TN: TVA, Media Relations, April 26, 2012. On the Web at http://www.tva.gov/news/releases/aprjun12/0426_board_meeting/Timeline_Watts_Bar.pdf, from link at http://www.tva.gov/news/releases/aprjun12/0426_board_meeting/Timeline_Watts_Bar.pdf.
U.N. News Centre 2013
United Nations News Centre. World population projected to reach 9.6 billion by 2050 – UN report. New York: UN, June 13, 2013. On the Web at http://www.un.org/apps/news/story.asp?NewsID=45165#.VGZXEMka6Gh.

IEER Comments on the 2014 Proposed Clean Power Plan of the U.S. Environmental Protection Agency
70
U.S. Census Bureau 2014
Carmen DeNavas-Walt and Bernadette D. Proctor. Income and Poverty in the United States: 2013. (Current Population Reports, P60-249) Washington, DC: U.S. Department of Commerce, Economics and Statistics Administration, U.S. Census Bureau, September 2014. On the Web at http://www.census.gov/content/dam/Census/library/publications/2014/demo/p60-249.pdf.
U.S. Court of Appeals 2012
United States Court of Appeals for the District of Columbia Circuit. No. 11-1045. State of New York, et al., Petitioners v. Nuclear Regulatory Commission and United States of America, Respondents; State of New Jersey, et al., Intervenors. Consolidated with 11-1051, 11-1056, 11-1057. On Petitions for Review of Orders of the Nuclear Regulatory Commission Argued March 16, 2012. Decided June 8, 2012. On the Web at http://www.cadc.uscourts.gov/internet/opinions.nsf/57ACA94A8FFAD8AF85257A1700502AA4/$file/11-1045-1377720.pdf. Heading: “USCA Case #11-1045 Document #1377720 Filed: 06/08/2012.” 681 F.3d 471
U.S. Drought Monitor: Texas 2014
Michael Brewer. U.S. Drought Monitor: Texas: October 21, 2014. Lincoln, NE: National Drought Mitigation Center, October 23, 2014. On the Web at http://droughtmonitor.unl.edu/Home/StateDroughtMonitor.aspx?TX. Accessed 10-24-14.
U.S. Drought Monitor: West 2014
Michael Brewer. U.S. Drought Monitor: West: October 21, 2014. Lincoln, NE: National Drought Mitigation Center, October 23, 2014. On the Web at http://droughtmonitor.unl.edu/Home/RegionalDroughtMonitor.aspx?west. Accessed 10-24-14.
U.S.-China Joint Announcement 2014
U.S.-China Joint Announcement on Climate Change: Beijing, China, 12 November 2014. Washington, DC: White House, Office of the Press Secretary, November 11, 2014. On the Web at http://www.whitehouse.gov/the-press-office/2014/11/11/us-china-joint-announcement-climate-change.
UNFCCC 1992 United Nations Framework Convention on Climate Change. (FCCC/INFORMAL/84; GE.05-62220 (E) 200705) New York: United Nations, 1992. On the Web at http://unfccc.int/resource/docs/convkp/conveng.pdf. Annex I updated 13 August 1998; Annex II updated 28 June 2002.
Wernau 2014 Julie Wernau. “Exelon, Politics, and Illinois’ Low-Carbon Future,” Chicago Tribune, August 15, 2014. On the Web at http://www.chicagotribune.com/business/ct-exelon-carbon-rule-strategy-0817-biz-20140815-story.html.
Wikipedia Drought 2014
"2010–13 Southern United States drought," Wikipedia, last modified on 10 October 2014. On the Web at http://en.wikipedia.org/wiki/2010%E2%80%9313_Southern_United_States_drought.
Wikipedia
Watts Bar 2014
"Watts Bar Nuclear Generating Station," Wikipedia, last modified on 28 October
2014. On the Web at
http://en.wikipedia.org/wiki/Watts_Bar_Nuclear_Generating_Station.
WNN 2013 "Construction officially starts at Summer," World Nuclear News, 12 March 2013. On the Web at http://www.world-nuclear-news.org/NN-AP1000_construction_underway_at_Summer-1203134.html.

IEER Comments on the 2014 Proposed Clean Power Plan of the U.S. Environmental Protection Agency
71
WNN 2014 "Cost of Summer AP1000s increases," World Nuclear News, 03 October 2014. On the Web at http://www.world-nuclear-news.org/NN-Cost-of-Summer-AP1000s-increases-0310144.html.