arizona’s unknown education issue · news stories, public debate and private conversations are...
TRANSCRIPT

Early LearningWorkforce Trends
ARIZONA’S UNKNOWNEDUCATION ISSUE

ARIZONA’S UNKNOWN EDUCATION ISSUE 1ESSAY: A WORLD-CLASS EDUCATION
News stories, public debate and private conversations are filled with discussions on how to achieve the best education for Arizona’s children. The topics vary – common core standards, greater school accountability, and increased per-pupil funding among them – but the focus is generally the same: K-12 schools.
While all of those issues are important, one critical component to ensuring that children can meet our expectations is rarely discussed: the teaching they receive before kindergarten. A growing body of research demonstrates that the stability of
a child’s relationships with early caregivers – as well as the quality of those interactions – is one of the greatest predictors of school readiness.
Why are early caregivers so important? Because 90 percent of a child’s brain develops by the time they are 5 years old, and the foundation for all future learning is largely built before a child enters kindergarten. A strong foundation – shaped by meaningful interactions with adults – means the child has the greatest opportunity for success. Conversely, a weak foundation means the child will struggle to keep up in grade school and beyond. Numerous studies demonstrate the importance of young children’s relationships with their teachers to their future success in school.i High quality teacher-child interactions have been found to predict academic skills, language skills and social skills among young children.ii
Meaningful interactions go way beyond the nurturing touch and soft smiles of a good babysitter; they are the result of a caregiver who is educated about the complex ways in which kids 5 and younger learn and who is skilled and experienced in applying that education.
Arizona’s education system already has acknowledged that children’s learning from birth to age 5 is critical to their success in kindergarten and beyond. This is evidenced by the development of Infant and Toddler Guidelines and Early Learning Standards that are aligned to the state’s Common Core Standards, and which provide critical guidance for early learning programs in preparing young children for success.iii
Our view of the early childhood workforce as a critical component of quality early learning, however, has not kept up with our increased expectations for young kids. The latest research shows that in Arizona, those working with kids at their most critical stage of brain development are poorly paid and struggle to attain higher education, both critical components of hiring and retaining the best teachers.
This essay explains the importance of a skilled early childhood workforce to educational success, examines the current qualifications and compensation of our state’s early childhood teachers, and suggests ways that early learning program providers and policymakers can enhance school readiness for all kids by supporting efforts to ensure that Arizona’s best educators are where they can make the biggest impact: with our youngest kids.
A WORLD-CLASS EDUCATION STARTS BEFORE KINDERGARTEN

ESSAY: A WORLD-CLASS EDUCATION
A SMART START: BIRTH-5 STUDENT/TEACHER RELATIONSHIPS & EDUCATIONAL SUCCESSResearch demonstrates that when child care and other early learning programs are of high quality and developmentally appropriate, children score higher on school readiness measures and do better in school. They also have better relationships with their peers and are more likely to graduate. But the quality of early care and education depends on the professionalism, education and skills of the teacher.iv
Research has shown that well-educated and highly skilled early childhood teachers are strongly linked with children successfully transitioning to kindergarten.v Highly qualified early childhood teachers can significantly affect a child’s cognitive outcomes, specifically early literacy and language development, letter knowledge, and writing skills.vi Furthermore, in a recent study, researchers found that children’s experiences in positive relationships with teachers may also have a positive effect on behaviors such as aggression, hyperactivity, non-compliance, depression and anxiety. Children appear capable of learning new positive behavioral strate-gies through their relationship with their teacher.vii
Competitive wages are critical to the recruitment and retention of great early childhood teachers and care providers. Combined with benefits and oppor-tunities for pay increases, competitive wages can reduce staff turnover rates. Turnover is not only a business challenge for providers; it is a learning challenge for children. Research shows that children are better prepared to learn when they have con-sistent relationships with teachers.viii Large swings in teacher turnover make it difficult for children to form the secure attachments to consistent caregivers that are so critical to their learning and develop-ment.ix Research also shows that when there is high teacher turnover, children’s social, emotional, and language development, all essential components of school readiness, are negatively impacted.x
Teacher turnover in the early care and education field remains high; averaging 30 percent or more.xi A national study found that teacher turnover is highest in child care centers with lower wages and lower levels of teacher education.xii
EARLY CHILDHOOD WORKFORCE: EDUCATORS, NOT BABYSITTERSEarly childhood educators support children in developing the skills and capacities that they need in order to succeed at each subsequent stage of their learning.
The abilities outlined below must start being developed in young children in order for them to be prepared to meet Arizona’s high educational standards once they reach kindergarten.
Language Development and Communication
• Listening and Understanding
• Communicating and Speaking
• Emergent Literacy
• Pre-reading (3-5 years old)
• Pre-writing (3-5 years old)
Cognitive Development
• Exploration and Discovery
• Memory
• Problem Solving
• Imitation and Symbolic Play
• Math, Social Studies and Science (3-5 years old)
• Fine Arts (3-5 years old)
Physical and Motor Development
• Gross and Fine Motor Skills
• Physical Health, Well-Being and Safety
Social & Emotional Development
• Trust and Emotional Security
• Self-Awareness
• Self-Control
• Relationships with Other Children
• Expression of Feelings
• Respect
Approaches to Learning
• Persistence
• Initiative and Curiosity
• Creativity and Inventiveness
• Reasoning
ARIZONA’S UNKNOWN EDUCATION ISSUE 2

ARIZONA’S UNKNOWN EDUCATION ISSUE 3ESSAY: A WORLD-CLASS EDUCATION
The early care and education workforce is among the most poorly paid professionals in the United States, with the median wages for child care workers and preschool teachers being between $7.90 and $9.53 per hour.xiii Nationally, this is nearly one half of the salary earned by a kindergarten teacher, and lower than wages for parking attendants, cooks or cashiers.xiv
This low level of compensation and recognition for the important work of these professionals contributes to the high turnover rates that have plagued this field for years. This is compounded by the problem that when teachers manage to obtain additional education and training, they often leave for the higher paying K-12 workforce, or other higher paying professions.xv In fact, one study found that in a sample of first-year early childhood education students, only 9 percent said they intended to work in early care and education settings after graduation, 43 percent preferring kindergarten for reasons of compensation and workload.xvi
ARIZONA’S TRACK RECORD: TRENDS IN THE EARLY LEARNING WORKFORCEThe 2012 Early Care and Education Workforce Survey shows that – while early childhood teachers and assis-tant teachers are earning more college degrees – Arizona continues to struggle in two of the areas impacting retention of skilled early educators: wages and benefits.
The survey – first administered in Arizona in 1997 and subsequently in 2001, 2004 and 2007 – provides a basis for better understanding evolving characteristics and conditions of Arizona’s early care and education workforce. The most recent survey, conducted in 2012, is the basis for the summary on the status of Arizona’s early childhood workforce.
Additional data and analysis are provided in the Research Report, beginning on page 7.
Educational Attainment1
The number of assistant teachers obtaining a credential or degree, including completion of a Child Develop-ment Associate2 credential, an associate’s degree, a bachelor’s degree, or a master’s degree was 21 percent in 2007 and 29 percent in 2012.
Nearly half of all teachers in 2007 (47 percent) had obtained a college degree (associate’s, bachelor’s or master’s degree); in 2012 this number had risen slightly to 50 percent, again, indicating a positive trend toward higher educational attainment for early care and education teachers.
Administrative directors were most likely to have a college degree. In 2007, 74 percent were reported to have obtained an associate’s degree or higher; in 2012, this number was relatively unchanged at 73 percent, although the number of administrators with a bachelor’s degree rose very slightly between the two time periods. This suggests that about three-quarters of Arizona early care and education administrative directors have an associate’s degree or higher, and has been a stable level of educational achievement in the field over the last eight years.
Teachers with an associate’s degree were significantly more likely to have remained with their current employer for a longer period of time.
1 It is important to note, that because of the limitations of the Early Care and Education Workforce Survey, only percentages of degree attainment can be reported. Because economic circumstances may have led to decreases in the total number of early care and education professionals between 2007 and 2012, even with an increase in the percentage of degree attainment, fewer professionals in the workforce may hold those degrees and certificates.
2 Child Development Associate (CDA) credential is awarded by the Council for Professional Recognition to those who have completed a list of requirements around a core set of competency standards, including 120 hours of training, and successfully passing a verification visit.

ARIZONA’S UNKNOWN EDUCATION ISSUE 4ESSAY: A WORLD-CLASS EDUCATION
Due to limitations of the study, it is not possible to identify the factor or factors that led to this increase in degree attainment for early childhood professionals, however, the data in this report correspond to the imple-mentation of T.E.A.C.H. Early Childhood Arizona, a higher education scholarship program for early educators sponsored by First Things First.
Of the individuals participating in the survey, 5 percent of assistant teachers, 7 percent of teachers and 6 percent of administrative directors reported receiving a scholarship. And, in the three years since the T.E.A.C.H. program began in Arizona, 55 Child Development Associate credentials and 36 associate’s degrees have been earned by T.E.A.C.H. participants.
Wages & BenefitsWhen adjusted for inflation, wages for assistant teachers, teachers, and administrative directors working in all types of licensed early care and education settings in Arizona have actually decreased over the past five years. While there were nominal hourly increases, they did not keep pace with inflation. For example, the median hourly wage for teachers in 2012 was $10.00, however, to keep up with inflation, and make the same wage as 2007 ($9.75), teacher hourly wage would have needed to be at $10.83.xvii
TABLE 1. CHANGES IN HOURLY WAGES, 2007-2012
ECE Workforce Median Hourly Wage Median Hourly Wage Needed Hourly Wage to Change When AdjustedAll Provider Types 2007 2012 Keep Pace with Inflation for Inflation, 2007-20123
Assistant Teachers $9.00 $9.66 $9.99 -$0.33
Teachers $9.75 $10.00 $10.83 -$0.83
Administrative Directors $16.82 $16.80 $18.68 -$1.88
And, while data show that wages for teachers working in Head Start and public preschool settings are slightly higher than those working in child care centers, early childhood educators on average earn considerably less than other teachers.xviii Average annual wages for Arizona’s early childhood educators are about half of the yearly earnings for kindergarten and elementary school teachers, even though their work sets the stage for later success.
In addition, further analysis shows that teachers with higher wages (both starting wages and current wages) were significantly more likely to remain with their current employer, and teachers paid the lowest starting wage were significantly less likely to remain with their current employer over time.
As with wages, most of the benefits provided to the teachers of our youngest kids also are decreasing. Reduced benefits include:• Health insurance – down 2 percent;• Paid holidays – down 3 percent;• Reduced child care fees – down 4 percent; and,• Tuition reimbursement – down 3 percent.The only benefit that appears to have increased is the availability of retirement plans, which is up by 5 percent. However, due to the limitations of the study, it is not possible to analyze the breadth or quality of any benefit.
3 Adjusted change estimates in this column were calculated by taking the difference between the hourly wage needed to keep pace with inflation (Consumer Price Index) in 2012 and the actual median hourly wage received in 2012 (e.g. teachers: $10.83-$10.00). Because the median hourly wage has not kept with pace of inflation, between 2007 and 2012, teachers are making an estimated $0.83 less per hour than they were in 2007.

ARIZONA’S UNKNOWN EDUCATION ISSUE 5ESSAY: A WORLD-CLASS EDUCATION
As expected, the benefits paid to full-time employees were much higher than benefits provided to part-time employees.
Consistent with national data, the receipt of benefits impacts retention. For example, this study showed that teachers receiving paid tuition reimbursements were significantly more likely to remain with their current employer. Also, for full-time teachers, receiving reduced child care fees was also a significant predictor of length of employment.
In addition, early care and education teachers receiving First Things First Professional REWARD$ – a stipend paid to participating early educators that rewards longevity and degree attainment – were significantly more likely to report remaining with their current employer.
RetentionFor all types of early care and education professionals, retention rates of five or more years were higher in 2012 than in 2007. Although there have been modest improvements, the fact remains that only 1 in 4 assistant teachers, less than half of teachers, and about two-thirds of assistant directors (those who work the least with young kids directly) have been in the field for 5 years or more.
Without a robust State of Arizona registry system to track early childhood professionals across all early care and education provider types, it is unclear exactly what factors contributed to the increase in retention. It is possible that as providers reduced staff in response to the economic crisis, they kept the teachers with the greatest seniority. In addition, national data reveal that far fewer people have left jobs willingly since the economic crisis began. In 2007, “voluntary quits” were 28.7 percent of total employment. By 2009, voluntary quits were down to 17.8 percent (the number then rose to 18.6 percent in 2010).xix These factors may have impacted retention in the child care industry.
As indicated in the previous sections, data from the survey support the positive impact efforts to improve wages and benefits can have on retention, including:• Teachers with an associate’s degree were significantly more likely to have remained with their center for a
longer period of time.• Those participating in REWARD$ or receiving reduced child care fees or tuition reimbursements also
reported higher retention.• Finally, teachers with higher wages (both starting wages and current wages) were significantly more likely
to remain with their current employer.
IMPLICATIONS FOR ARIZONA’S EDUCATIONAL REFORM EFFORTSHigh expectations are necessary for Arizona’s kids to be college and career ready. In order for young kids in Arizona to be ready to meet those expectations, they need early caregivers and educators who are skilled in the ways children birth to 5 years old learn.
Yet, the latest information shows that wages and benefits paid to the early childhood workforce are not commensurate with our expectations for this workforce and dis-incentivize the most skilled teachers from remaining with our youngest kids.
The survey also shows that efforts to support the early childhood workforce – such as increasing wages, benefits and degree attainment – can have a very positive impact on retention among early educators.

ARIZONA’S UNKNOWN EDUCATION ISSUE 6ESSAY: A WORLD-CLASS EDUCATION
The information contained in this report – along with information regarding best practices and innovative strategies for improving credentialing and compensation of early educators – can be used by child care providers and policymakers alike in support of developing a highly skilled workforce to support children during their most critical stage of brain development.
Specifically, the following recommendations emerge:
• State-level policy changes and programs like Professional REWARD$ that provide incentives and supports for early care and education professionals should continue to be supported and expanded as appropriate.
• A State of Arizona registry system – much like the information collected on K-12 teachers by the Arizona Department of Education – should be developed and improvements in quality and availability of data on Arizona’s early childhood teachers should be supported.
• Early childhood coursework and degrees should have clear articulation, and educational pathways should be streamlined to remove obstacles to degree attainment.
• Policies and programs such as T.E.A.C.H. that provide incentives and supports for degree attainment should continue to be supported and expanded as appropriate.
• Policy changes should be made so that child care subsidies currently provided through federal funds to help low-income children access early learning programs may only be used in quality early learning settings. The amount of the subsidy should reflect the actual cost of providing quality early learning to young kids, including the cost of hiring highly skilled educators.

ARIZONA’S UNKNOWN EDUCATION ISSUE 7CONTENTS
REPORT CONTENTS
8 INTRODUCTION & METHODOLOGY
9 WAGES & BENEFITS PAID TO EARLY CHILDHOOD PROFESSIONALS
14 RETENTION OF EARLY CHILDHOOD PROFESSIONALS
17 EDUCATION & PROFESSIONAL DEVELOPMENT OF THE EARLY CHILDHOOD WORKFORCE
21 SUMMARY OF FINDINGS & RECOMMENDATIONS
APPENDICES
24 Appendix A: Methodology
25 Appendix B: 2012 Early Care and Education Workforce Survey
26 Appendix C: Survey Responses, 2012 Early Care and Education Workforce Survey

ARIZONA’S UNKNOWN EDUCATION ISSUE 8INTRODUCTION & METHODOLOGY
INTRODUCTION & METHODOLOGY
The credentials and compensation of the early childhood workforce are key issues that must be addressed as part of Arizona’s education reform efforts. Given the critical role that skilled educators play in the preparation of children to meet our state’s vigorous K-12 standards, their skills must be supported and rewarded at the same levels as those working with older children.
The 2012 Early Care and Education Workforce Survey was launched to address three interrelated questions:
• What are current characteristics and conditions of Arizona’s early care and education workforce?
• How have these characteristics and conditions changed over time?
• What implications do these findings have for the Arizona early care and education system, and how might the presence or absence of desired change potentially affect Arizona’s children, families, and communities?
The final survey sample consisted of 2,226 licensed sites, and an additional 158 sites on tribal lands which do not require Arizona Department of Health Services licensure, for a total of 2,384 sites.
Additional information about methodology and analytic procedures are included in Appendix A.
EARLY CARE AND EDUCATION WORKFORCE SURVEY: 2012
This report is the most recent in a series of reports developed in Arizona since 1997 based on data collected through the administration of a survey of licensed early care and education centers (see Appendix A for a full description of the survey participants). The survey provides key data measures used to monitor changes over time in working conditions within the field of early care and education throughout Arizona.
What you’ll find in this report:
• Summary of key 2012 survey findings in three areas: 1) wages and benefits, 2) retention, and 3) education and professional development of early care and education professionals.
• Summary of key trends emerging that highlight changes in wages and benefits, retention, and education and professional development of early care and education professionals.
• Analysis of significant predictors contributing to teacher retention.
• A discussion of study implications and recommendations for moving forward in creating a strong early care and education system workforce within Arizona.

ARIZONA’S UNKNOWN EDUCATION ISSUE 9WAGES & BENEFITS PAID TO EARLY CHILDHOOD PROFESSIONALS
WAGES & BENEFITS PAID TO EARLY CHILDHOOD PROFESSIONALS
Fair compensation – annual wages and benefits paid to early care and education professionals, including assistant teachers, teachers, administrators and other support staff – is important to the development of a high quality early care and education system in Arizona. Compensation commensurate with education and experience plays a role in recruitment and retention, and contributes to the morale of a workforce tasked with providing the best possible care and education for young children. Nationally, early care and education teachers have rated salary, health care, and retirement benefits as incentives for remaining in the early care and education professions.xx
2012 SURVEY FINDINGS: ARIZONA WAGES
From 1997 to 2012, in data from the Early Care and Education Workforce Survey, wages for Arizona pro-fessionals in early care and education have increased. Wages for staff varied according to the level of job responsibility (e.g. assistant teacher, teacher). In 2012, the highest paid teachers earned an average of $2.00 more per hour than the highest paid assistant teachers (Figure 1). By comparison, the lowest paid teachers earned little more than the lowest paid assistant teachers.
FIGURE 1. MEDIAN LOWEST, AVERAGE, AND HIGHEST WAGES FOR EARLY CARE AND EDUCATION WORKFORCE, 2012
$0.00
$5.00
$10.00
$15.00
$20.00
AssistantTeachers
Teachers TeacherDirectors
AdministrativeDirectors
$10.00
$8.99$8.50 $12.00 $15.00
$9.66
$10.50 $12.50$13.50
$16.80
$17.78
$14.28
■ Highest Wages■ Average Wages■ Lowest Wages
$0
$10,000
$20,000
$30,000
$40,000
$50,000
AZ Early Care andEducation Teachers*
KindergartenTeachers
Elementary SchoolTeachers
Special EducationTeachers
$20,800
$41,490 $42,540$42,500

ARIZONA’S UNKNOWN EDUCATION ISSUE 10WAGES & BENEFITS PAID TO EARLY CHILDHOOD PROFESSIONALS
Trends in Hourly Wages for the Arizona Early Care and Education WorkforceIn data from the Early Care and Education Workforce Survey, the median hourly wage for assistant teachers has grown steadily over the last fifteen years, with a low of $5.75 in 1997 to a high of $9.66 in 2012 (Figure 2). However, from 2007 to 2012, median hourly wages for assistant teachers increased only 66 cents from $9.00 to $9.66. As seen in Figure 3, teacher wages across all provider settings are only slightly higher in 2012 than they were in 2007, with the 2012 median hourly wage for early care and education teachers at $10.00, only .25 cents higher than the 2007 median. The median hourly wage for administrative directors in 2012 is $16.80, essentially the same as the 2007 median hourly wage of $16.82. Overall, 2012 wages for assistant teachers, teachers, and administrative directors working in all types of licensed early care and education settings remain about the same as 2007 wages. When adjusted for inflation, these small increases in wages failed to keep up with cost of living changes. For example, the median hourly wage for teachers in 2012 was $10.00, however, to keep up with inflation, and make the same wage as 2007 ($9.75), teacher hourly wage would have needed to be at $10.83.xxi
Nonprofit centers, including public schools and Head Start, consistently paid higher wages to administrative directors from 1997-2012 than for profit centers. In 2001 ($23.85) and 2004 ($25.00), public school admin-istrative director’s hourly wages peaked at the highest levels and decreased over the past 8 years to $22.00 in 2012. For profit centers with less than 4 sites consistently paid the lowest hourly wages to their administrative directors (Figure 4).
Across all early care and education professional workforce categories, there was approximately a one to two dollar increase in hourly wages between 1997-2001, 2001-2004, and 2004-2007, with a leveling off in hourly increases to a dollar or less between 2007-2012. The U.S. national economic downturn over the last four years is predicted to be a contributing factor to these lower hourly wage increases.
FIGURE 2. MEDIAN HOURLY WAGES FOR ASSISTANT TEACHERS BY CENTER TYPE FOR 1997-2012
$4.00
$6.00
$8.00
$10.00
$12.00
■ For Profit <4 Sites ■ For Profit 4+ Sites ■ Head Start ■ Public Schools ■ Other Nonprofit ■ All Types
$5.00
$10.00
$15.00
$20.00
■ For Profit <4 Sites ■ For Profit 4+ Sites ■ Head Start ■ Public Schools ■ Other Nonprofit ■ All Types
1997 2001 2004 2007 2012
1997 2001 2004 2007 2012
$10.00
$15.00
$20.00
$25.00
■ For Profit <4 Sites ■ For Profit 4+ Sites ■ Head Start ■ Public Schools ■ Other Nonprofit ■ All Types
1997 2001 2004 2007 2012

ARIZONA’S UNKNOWN EDUCATION ISSUE 11WAGES & BENEFITS PAID TO EARLY CHILDHOOD PROFESSIONALS
FIGURE 3. MEDIAN AVERAGE WAGES FOR TEACHERS BY CENTER TYPE FOR 1997-2012
FIGURE 4. MEDIAN WAGES FOR ADMINISTRATIVE DIRECTORS BY CENTER TYPE FOR 1997-2012
Comparison of Annual Wages Paid to Education ProfessionalsHistorically, wages for early care and education teachers have been considerably lower than wages for kinder-garten, elementary, and special education teachers. As depicted in Figure 5, data collected by the current 2012 Early Care and Education Workforce Survey indicated the annual salary of Arizona’s early care and education teachers to be considerably lower than that received by public school teachers.xxii Average annual wages for Arizona’s early educators are about half of the yearly earnings for kindergarten and elementary school teachers (Figure 5). This yearly salary translates to $10.00 per hour for a 40 hour work week. Wages for early care and education teachers are very similar to those of the average high school graduate ($9.45).xxiii Low wages may prove to be a disincentive for early care and education professionals, especially for those obtaining a bachelor’s degree and/or engaging in ongoing professional development training. Many early education teachers may seek employment opportunities in educational settings providing higher wages, and a more comprehensive set of benefits. In short, competitive wages for teachers are critical to the education of our youngest children.
$4.00
$6.00
$8.00
$10.00
$12.00
■ For Profit <4 Sites ■ For Profit 4+ Sites ■ Head Start ■ Public Schools ■ Other Nonprofit ■ All Types
$5.00
$10.00
$15.00
$20.00
■ For Profit <4 Sites ■ For Profit 4+ Sites ■ Head Start ■ Public Schools ■ Other Nonprofit ■ All Types
1997 2001 2004 2007 2012
1997 2001 2004 2007 2012
$10.00
$15.00
$20.00
$25.00
■ For Profit <4 Sites ■ For Profit 4+ Sites ■ Head Start ■ Public Schools ■ Other Nonprofit ■ All Types
1997 2001 2004 2007 2012

ARIZONA’S UNKNOWN EDUCATION ISSUE 12WAGES & BENEFITS PAID TO EARLY CHILDHOOD PROFESSIONALS
FIGURE 5. AVERAGE ANNUAL WAGES FOR ARIZONA TEACHERSxxiv
* This column represents annual salary findings from the current (2012) Early Care and Education Workforce Survey. All other columns are annual salaries reported from the Bureau of Labor Statistics.
Relationship Between Retention and WagesGiven the established importance of teacher stability to child outcomes, further analysis was completed to determine if there were any key predictors of teacher retention.xxv Regression analysis indicated that wages, education level and benefits were all significant predictors of teacher retention, both full-time teacher retention and part-time teacher retention. Specifically, teachers with higher wages (both starting wages and current wages) are significantly more likely to remain at their current employer. Also noteworthy, teachers paid the lowest starting wage were significantly less likely to remain with their current employer over time.
2012 SURVEY FINDINGS: BENEFITS FOR EARLY CARE AND EDUCATION PROFESSIONALSOverall, early care and education centers surveyed offered a range of benefits to their full-time employees.• Child Care. Most centers (74 percent) offered reduced fees or free child care for staff.• Health Insurance. Most public schools (74 percent) and half of Head Start programs (49 percent) offered
health insurance to employees but not their dependents.• Paid Time Off. 84 percent of centers offered paid holidays.• Professional Development. More than half of early care and education centers (53 percent) reimbursed
employees for college tuition.• Professional Development. 81 percent of centers paid for workshop registration fees and 78 percent paid
for staff development days.• Retirement Plan. Two-thirds (62 percent) of early child care and education programs offered employee
retirement plans.
Overall, employees working in Head Start, public school settings, and large, multi-site for profit provider settings are more likely to report receiving more benefits than those working in single-site, for profit and nonprofit settings. Also, benefits provided to part-time employees were much lower in all areas than benefits provided to full-time employees. Additionally, there were some general trends in benefits from 2007 to 2012. Benefits for full-time employees were slightly less in 2012 than 2007 with 2 to 4 percent fewer employees reporting that they were provided benefits in areas of health insurance, paid holidays, reduced child care fees and tuition reimbursement, and an increase of 5 percent in employees reporting contributions to an employee retirement plan (Table 2).
$0.00
$5.00
$10.00
$15.00
$20.00
AssistantTeachers
Teachers TeacherDirectors
AdministrativeDirectors
$10.00
$8.99$8.50 $12.00 $15.00
$9.66
$10.50 $12.50$13.50
$16.80
$17.78
$14.28
■ Highest Wages■ Average Wages■ Lowest Wages
$0
$10,000
$20,000
$30,000
$40,000
$50,000
AZ Early Care andEducation Teachers*
KindergartenTeachers
Elementary SchoolTeachers
Special EducationTeachers
$20,800
$41,490 $42,540$42,500

ARIZONA’S UNKNOWN EDUCATION ISSUE 13WAGES & BENEFITS PAID TO EARLY CHILDHOOD PROFESSIONALS
TABLE 2. PERCENTAGE OF FULL-TIME EMPLOYEES WITHOUT BENEFITS, 2007 AND 2012
Type of Benefit Lacking 2007 2012 % Change
Health Insurance No insurance offered: 24% No insurance offered: 26% -2%
Retirement Plan No retirement plan: 43% No retirement plan: 38% +5%
Paid Holidays No paid holidays: 13% No paid holidays: 16% -3%
Reduced Child Care Fees No reduced fees: 22% No reduced fees: 26% -4%
Tuition Reimbursement (for post-secondary education) No tuition reimbursements: 44% No tuition reimbursements: 47% -3%
Relationship Between Retention and BenefitsRegression analysis indicated that wages, education level and benefits were all significant predictors of teacher retention, for both full-time and part-time teachers. Specifically, teachers receiving paid tuition reimbursements were significantly more likely to have remained with their current employer. Also, for full-time teachers, receiving reduced child care fees was also a significant predictor of length of employ-ment at their current center.
IMPLICATIONS FOR ARIZONA’S EARLY CARE AND EDUCATION WORKFORCE
• Attracting quality staff requires an investment. Early care and education teacher wages continue to be low especially in comparison with other teaching professionals, and early childhood teacher wages are similar to those for high school graduates with no post-secondary degree attainment.xxvi Providing adequate wages and competitive benefits for Arizona’s early care and education professionals is impera-tive to building and maintaining a high-quality early learning workforce and to providing the best early education for children.

ARIZONA’S UNKNOWN EDUCATION ISSUE 14RETENTION OF EARLY CHILDHOOD PROFESSIONALS
RETENTION OF EARLY CHILDHOOD PROFESSIONALS
Teacher retention is fundamental to the development of long-lasting, positive relationships; teacher retention strengthens both teacher-child relationships as well as teacher-family relationships. High staff turnover can hinder the development of healthy, secure attachment between children and teachers.xxvii Quality teacher-child relationships that grow over time, on the other hand, lead to developmental and educational benefits.xxviii
2012 SURVEY FINDINGS: RETENTION
Retention of Assistant TeachersIn data from the 2012 Early Care and Education Workforce Survey, retention rates varied by type of center and type of professional. As depicted in Figure 6, more than half (61 percent) of assistant teachers had been with their current employer three years or more. Comparing center types, Head Start had the strongest retention rate, with a majority (86 percent) of teacher assistants being at the center three years or more.
FIGURE 6. AVERAGE LENGTH OF EMPLOYMENT FOR ASSISTANT TEACHERS BY PROGRAM TYPE
Retention of TeachersEarly care and education teachers generally had greater employment stability than assistant teachers. Almost half (45 percent) of all teachers were employed at their current employer for five years or more and another one-fourth (26 percent) sustained employment for three or four years; this is a total of almost three-quarters (71 percent) retained at their current employer for three years or more. Head Start also had the highest teacher retention rate, with 71 percent of teachers employed five years or more (Figure 7).
■ For Profit <4 Sites ■ For Profit 4+ Sites ■ Head Start ■ Public Schools ■ Other Nonprofit ■ All Types
≤6 Months 7-11 Months 1 Year 2 Years 3 Years0%
5%
10%
15%
20%
25%
30%
35%
40%
4 Years ≥5 Years
■ For Profit <4 Sites ■ For Profit 4+ Sites ■ Head Start ■ Public Schools ■ Other Nonprofit ■ All Types
≤6 Months 7-11 Months 1 Year 2 Years 3 Years0%
10%
20%
30%
40%
50%
60%
70%
80%
4 Years ≥5 Years
■ For Profit <4 Sites ■ For Profit 4+ Sites ■ Head Start ■ Public Schools ■ Other Nonprofit ■ All Types
≤6 Months 7-11 Months 1 Year 2 Years 3 Years0%
20%
40%
60%
80%
100%
4 Years ≥5 Years

ARIZONA’S UNKNOWN EDUCATION ISSUE 15RETENTION OF EARLY CHILDHOOD PROFESSIONALS
FIGURE 7. AVERAGE LENGTH OF EMPLOYMENT FOR TEACHERS BY CENTER TYPE
Retention of Administrative DirectorsAs depicted in Figure 8, administrative directors had the strongest retention at their current employer across all types of care settings. Two-thirds of administrative directors (66 percent) were reported with an average length of employment of five or more years.
Across all setting types, administrative directors were more than twice as likely to have sustained employ-ment for five or more years as assistant teachers (see Table 3). Across all professional categories, Head Start employees were more likely to have been with their current employer for five or more years. Head Start administrative directors were most likely to have sustained employment for five or more years (89 percent), and administrative directors of for profit provider centers with four or more sites were least likely to have sustained employment for five or more years (56 percent).
FIGURE 8. AVERAGE LENGTH OF EMPLOYMENT FOR ADMINISTRATIVE DIRECTORS BY CENTER TYPE
■ For Profit <4 Sites ■ For Profit 4+ Sites ■ Head Start ■ Public Schools ■ Other Nonprofit ■ All Types
≤6 Months 7-11 Months 1 Year 2 Years 3 Years0%
5%
10%
15%
20%
25%
30%
35%
40%
4 Years ≥5 Years
■ For Profit <4 Sites ■ For Profit 4+ Sites ■ Head Start ■ Public Schools ■ Other Nonprofit ■ All Types
≤6 Months 7-11 Months 1 Year 2 Years 3 Years0%
10%
20%
30%
40%
50%
60%
70%
80%
4 Years ≥5 Years
■ For Profit <4 Sites ■ For Profit 4+ Sites ■ Head Start ■ Public Schools ■ Other Nonprofit ■ All Types
≤6 Months 7-11 Months 1 Year 2 Years 3 Years0%
20%
40%
60%
80%
100%
4 Years ≥5 Years
■ For Profit <4 Sites ■ For Profit 4+ Sites ■ Head Start ■ Public Schools ■ Other Nonprofit ■ All Types
≤6 Months 7-11 Months 1 Year 2 Years 3 Years0%
5%
10%
15%
20%
25%
30%
35%
40%
4 Years ≥5 Years
■ For Profit <4 Sites ■ For Profit 4+ Sites ■ Head Start ■ Public Schools ■ Other Nonprofit ■ All Types
≤6 Months 7-11 Months 1 Year 2 Years 3 Years0%
10%
20%
30%
40%
50%
60%
70%
80%
4 Years ≥5 Years
■ For Profit <4 Sites ■ For Profit 4+ Sites ■ Head Start ■ Public Schools ■ Other Nonprofit ■ All Types
≤6 Months 7-11 Months 1 Year 2 Years 3 Years0%
20%
40%
60%
80%
100%
4 Years ≥5 Years

ARIZONA’S UNKNOWN EDUCATION ISSUE 16RETENTION OF EARLY CHILDHOOD PROFESSIONALS
TABLE 3: EARLY CARE AND EDUCATION PROFESSIONALS EMPLOYED FIVE YEARS OR MORE WITHIN A SINGLE PROVIDER SETTING For Profit Centers For Profit Centers
< 4 Sites 4+ Sites Head Start Public Schools All Types
Assistant Teachers 21% 24% 28% 24% 27%
Teachers 33% 37% 71 % 56% 45%
Administrative Directors 60 % 56 % 89 % 74 % 66 %
Retention rates of early care and education professionals were relatively stable between 1997-2007, with slight increases in retention of all employee types. Comparing five-year retention rates between 2007-2012, rates of retention in 2012 were between 5 and 12 percentage points higher than in 2007 across employee types; earlier periods saw increases of only 2-3 percentage points across all employee types. These increases may be due more to employees seeking to retain positions in a severely recessed economy, rather than changes in work conditions or compensation packages that might potentially encourage retention.
For example, the number of early care and education providers in Arizona has fluctuated over the past four years. Between 2009 and 2011 there were decreases in the overall number of early care and education providers across all provider types, as well as a decreased overall licensed capacity of providers to provide care to Arizona’s young children.xxix This pattern likely reflects the impact of the economic downturn on the early care and education industry in Arizona, when from 2009-2011, approximately 250 early care and education programs closed their doors. Other influencing factors may have been state policy changes, such as budget cuts to Arizona Department of Economic Security child care assistance along with a substantive increase in licensing fees.
Changes in the early care and education industry impact its teachers. While survey results indicate teacher retention is stronger in 2012 than previous years, this may reflect a preference of early care and education providers to retain teachers with seniority when cuts are necessary or the potential for teachers with less seniority to be more likely to leave the industry overall.
Relationship Between Retention and Wages, Benefits and EducationTeacher retention was found to be significantly related to degree attainment, benefits and wages. In this survey, teachers with an associate’s degree were significantly more likely to have remained with their current employer for a longer period of time. Those participating in REWARD$ or receiving reduced child care fees or tuition reimbursements also reported stronger retention. Finally, teachers with higher wages (both starting wages and current wages) were significantly more likely to remain with their current employer for longer. Teachers paid the lowest starting wage were significantly less likely to remain with their current employer over time.
IMPLICATIONS FOR ARIZONA’S EARLY CARE AND EDUCATION WORKFORCEAlthough the 2012 survey indicates that almost three-quarters (71 percent) of teachers were retained for three years or more in their current position, this still means that about one-quarter are no longer at their current employer or in the early childhood workforce. This retention rate is also still much lower than the 85 percent retention rate for teachers working in the public K-12 system found by the National Center for Education Statistics.xxx Employee retention is a priority for early care and education programs and the early childhood system, in that it can promote a more experienced work force. Furthermore, the quality of the teacher-child relationship ― and therefore the quality of education ― depends upon consistency of care by knowledgeable professionals.xxxi The 2012 survey data indicate that Head Start teachers are much more likely to be retained for five years or more as compared to teachers serving in other types of early care and educa-tion. Head Start teachers are also compensated at a higher rate and degree requirements to hold that position are higher. Policies and programs that provide these same high standards and commensurate compensation should be available for all teachers and early care and education professionals.

ARIZONA’S UNKNOWN EDUCATION ISSUE 17EDUCATION & PROFESSIONAL DEVELOPMENT
EDUCATION & PROFESSIONAL DEVELOPMENT OF THE
EARLY CHILDHOOD WORKFORCE
High quality education for the professionals serving young children is central to ensuring the kindergarten readiness of children. Increasing overall numbers of providers/educators who have attained a Child Development Associates credential4, an associate’s degree, or a bachelor’s degree suggests development within the field and strengthening of the profession. Incentives and supports for ongoing professional development can also pave the way for a more highly educated and competent workforce. Post-secondary and professional development educational opportunities may increase teacher/provider motivation to stay in the early childhood field.
2012 SURVEY FINDINGS: EDUCATION AND PROFESSIONAL DEVELOPMENT REQUIREMENTSFindings from the 2012 Early Care and Education Workforce Survey suggest that minimum education require-ments of the early care and education workforce vary according to the type of center (see Table 4). For example, minimum education requirements for teachers were very high for Head Start: 96 percent of Head Start programs required teachers to have at least some college. However, other centers had much lower minimum education requirements; nearly 66 percent of centers required teachers to only have attained the minimum of a high school graduation degree or a GED.
TABLE 4. MINIMUM LEVEL OF EDUCATION REQUIRED FOR TEACHERS BY CENTER TYPE For Profit For Profit Other
< 4 Sites 4+ Sites Head Start Public Schools Nonprofit
None or HS/GED 76% 87% 4% 45% 61%
Some College 16% 11% 80% 15% 25%
College Degree 7% 2% 16% 39% 14%
The level of educational attainment for early care and education teachers varied widely as well (see Table 5). For example, most teachers in Head Start (83 percent) and public school (78 percent) centers had earned an associate’s degree or higher. Public school early care and education teachers had the highest level of educa-tional attainment, and were three times more likely to have a master’s degree (21 percent) than other types of centers. Across all types of settings, almost half (41 percent) of early child care and education teachers had not earned a college degree.
TABLE 5. EDUCATION LEVEL OF TEACHERS BY CENTER TYPE For Profit For Profit Other < 4 Sites 4+ Sites Head Start Public Schools Nonprofit All Types
Master’s Degree 6% 4% 6% 21% 9% 9%
Bachelor’s Degree 18% 18% 31% 45% 33% 26%
Associate’s Degree 16% 12% 46% 12% 16% 15%
CDA 9% 9% 16% 4% 11% 9%
No Degree or CDA 51% 57% 1% 18% 32% 41%
4 Child Development Associate (CDA) credential is awarded by the Council for Professional Recognition to those who have completed a list of requirements around a core set of competency standards, including 120 hours of training, and successfully passing a verification visit.

ARIZONA’S UNKNOWN EDUCATION ISSUE 18EDUCATION & PROFESSIONAL DEVELOPMENT
Relationship Between Retention and EducationRegression analysis indicated that wages, education level and benefits were all significant predictors of teacher retention, for both full-time and part-time teachers. Specifically, teachers with an A.A. degree were significantly more likely to have remained at their center for a longer period of time.
2012 SURVEY FINDINGS: SCHOLARSHIPS FOR EARLY CHILDHOOD AND EDUCATION PROFESSIONALST.E.A.C.H. (Teacher Education and Compensation Helps) Early Childhood® Arizona is a scholarship program funded by First Things First that provides financial and other supports for early care and education assistant teachers, teachers, and admin-istrators who are employed by licensed or regulated private, public, and Tribal programs. Participants are able to work toward the completion of college coursework while earning a degree or certificate in early childhood education or a related field. In addition to assistance with tuition and books, T.E.A.C.H. provides a stipend to defray child care and travel costs as well as a bonus upon completion of coursework. T.E.A.C.H. also pays the cost of earning a Child Development Associate national credential. The early care and education program which employs the scholar must also provide support (e.g. flexible work schedules, child care). In exchange, the T.E.A.C.H. scholar agrees to continue working at that program for a specified time period.
T.E.A.C.H. scholarships were evenly distributed among assistant teachers, teachers, and adminis-trative directors, with 5 percent, 7 percent, and 6 percent, respectively, reporting receiving a schol-arship (see Table 6). Public school settings were least likely to have T.E.A.C.H. scholars (4 percent of teachers), and Head Start centers were most likely (11 percent of teachers).
ARIZONA EARLY CARE AND EDUCATION PROFESSIONAL REQUIREMENTS
In Arizona, basic requirements mandated by licensing for early care and education teachers include having a high school or high school equivalency diploma and six months of child care experience (Arizona Administrative Code § R9-5-401). Assistant teachers must be (a) attending high school, (b) have a high school diploma or equivalent, or (c) have experience as a teacher or volunteer at a child care facility for at least 12 months.
Specific early care and education programs also have staff qualification standards. Accredited early care and education programs must adhere to the more rigorous staff qualifica-tion standards of the accrediting organization. For example, the National Association for the Education of Young Children (NAEYC, 2011) established a high school diploma minimum requirement for early care and education assistant teachers. Furthermore, the NAEYC teacher minimum degree require-ment is a Child Development Associate (CDA). NAEYC admin-istrative director minimum education requirements include either a bachelor’s degree in Early Childhood Education or a CDA plus 3 years of experience (NAEYC, 2011). Assistant teachers who work in Title I schools are required to have an associate’s degree, and as of July 1, 2012, all preschool teachers working in Arizona Department of Education (ADE) preschool programs must hold an early childhood certification or endorsement, which requires a bachelor’s degree (Title 15, A.R.S. R7-2-608 and R7-2-615).
In addition, early care and education teachers working in center-based Head Start programs must have, at minimum, an associate’s degree in Early Childhood Education (ECE); OR baccalaureate or advanced degree in Early Childhood Education (ECE); OR associate, baccalaureate or advanced degree in a field related to early childhood education and coursework equivalent to a major relating to early childhood education, with experience teaching preschool-age children. Additionally current teachers must have a minimum of 15 hours of classroom focused training annually (per program year; Head Start Act, 2007).
Teacher requirements for Quality First centers at the three to five star ratings require classroom teachers to have 12 college credit hours in early childhood or related fields, OR certificate of completion in ECE or child development from a community college, OR CDA, AND 1 year of teaching in or administration of an early care and education program.

ARIZONA’S UNKNOWN EDUCATION ISSUE 19EDUCATION & PROFESSIONAL DEVELOPMENT
TABLE 6. T.E.A.C.H. SCHOLARSHIPS BY CENTER TYPE
For Profit For Profit Public Other < 4 Sites 4+ Sites Head Start Schools Nonprofit All Types
Assistant Teachers 3% 13% 10% 4% 3% 5%
Teachers 7% 7% 11% 4% 7% 7%
Administrative Directors 7% 9% 4% 3% 4% 6%
2012 SURVEY FINDINGS: RECOGNITION OF PROFESSIONAL EXCELLENCEThe First Things First Professional REWARD$ program recognizes exceptional contributions and excellence among early care and education staff. This may include such things as employment longevity, the adoption of innovative teaching practices, or mastery of skills, competencies and knowledge relevant to working in the field of early care and education. Through the recognition of educational achievements and continuity of care and education within a provider setting, REWARD$ aims to increase the skills and retention of the early care and education workforce.
Findings from the 2012 Survey indicate that center representatives across 13 First Things First regions reported that staff members received REWARD$ incentives. As indicated in Table 7, Administrative Directors were most likely to be a REWARD$ recipient (16 percent), and assistant teachers were least likely (9 percent). A substantial minority of professionals reported receiving a REWARD$ stipend; 16 percent of administrative directors, 15 percent of teachers, and 9 percent of assistant teachers benefitted.
For profit centers with fewer than four sites reported the highest number of overall staff recipients (18 percent of teachers), while public school programs reported having the fewest number of REWARD$ recipients (10 percent of teachers).
TABLE 7. REWARD$ RECIPIENTS BY CENTER TYPE
For Profit For Profit Public OtherFTF REWARD$ < 4 sites 4+ sites Head Start Schools Nonprofit All Types
Assistant Teachers 13% 8% 4% 5% 8% 9%
Teachers 18% 14% 11% 10% 15% 15%
Administrative Directors 23% 20% 4% 1% 12% 16%
Relationship Between Retention and Professional REWARD$ ParticipationRegression analysis indicated that wages, education level and benefits were all significant predictors of teacher retention, for both full-time and part-time teachers. Specifically, teachers receiving REWARD$ were signifi-cantly more likely to report remaining with their current employer.
2012 SURVEY FINDINGS: QUALITY FIRST PARTICIPATIONQuality First is funded by First Things First and designed to support quality improvements in early care and education licensed settings. The program consists of multiple components, including an initial assessment of strengths and needed improvements, and the development of a specific plan for quality improvement. With the understanding that improvements may require funding, as well as staff coaching and mentoring, various supports are available, including a comprehensive coaching process, and various financial supports in the form of enrollment incentives, program improvement grants, and quality improvement awards.

ARIZONA’S UNKNOWN EDUCATION ISSUE 20EDUCATION & PROFESSIONAL DEVELOPMENT
Findings from the 2012 Survey indicate that about half (52 percent) of all centers surveyed reported partici-pating in Quality First (see Table 8 below). Nearly three out of four (73 percent) for profit centers with four or more sites and 59 percent of Head Start centers reported participating in Quality First. Fewer public schools (35 percent) reported participating in Quality First than any other type of center.
TABLE 8. QUALITY FIRST PARTICIPANTS BY CENTER TYPE Participation* For Profit For Profit Other Public in Quality First 4+ sites Head Start < 4 sites Nonprofit Schools All Types
Reported Participation 73% 59% 56% 41% 35% 52%
* Participation in Quality First was reported by the survey respondent. Centers may have been on the Quality First waiting list, receiving Quality First Scholarships, participating in the early stages of assessment, or an ongoing participant.
IMPLICATIONS FOR ARIZONA’S EARLY CARE AND EDUCATION WORKFORCE
Improving the educational level of the early care and education workforce has the potential to positively impact the quality of early care and education for Arizona’s children. Providing scholarships and other edu-cational supports to assist working early childhood professionals to actively engage in advanced educational and professional development pursuits can lead to a more competent early childhood workforce, and also strengthen the system of early child care and education services throughout the state of Arizona. Additionally, taking steps to expand access to higher education for early childhood professionals, and ensuring that course-work articulates across the various institutions of higher education, will make it easier for professionals to complete degrees.
Participation in Professional REWARD$, T.E.A.C.H., and Quality First is widespread in the early care and education community. There is some variation in the type of centers and type of teachers that participate; however, in this survey of all licensed centers, participation in these important programs, which aim to improve quality of early education and strengthen early care and education teachers, is strong.

ARIZONA’S UNKNOWN EDUCATION ISSUE 21SUMMARY OF FINDINGS & RECOMMENDATIONS
SUMMARY OF FINDINGS & RECOMMENDATIONS
Clearly, Arizona has made progress over the last four years when it comes to early childhood system building, although there is still much to be accomplished. Strengthening the early care and education workforce is one part of closing early education and opportunity gaps that prevent all children in Arizona from receiving important learning experiences in the first years of life.
As Arizona continues to innovate with teacher support programs such as T.E.A.C.H. and REWARD$, and refines and develops Quality First – Arizona’s quality improvement and rating system – we may very well continue to see further advances of the positive trend in early care and education teacher and director retention. These programs, coupled with renewed investments in developing the early care and education workforce, can move Arizona closer to achieving school readiness for all children.
Data from the 2012 Early Care and Education Workforce Survey suggest that Arizona’s early childhood work-force should continue to be supported to ensure high-quality, well-prepared, fairly compensated professionals. Recommended approaches include:
• State-level policy changes and programs like Professional REWARD$ that provide incentives and supports for early care and education professionals should continue to be supported and expanded as appropriate.
• A State of Arizona registry system – much like the information collected on K-12 teachers by the Arizona Department of Education – should be developed and improvements in quality and availability of data on Arizona’s early childhood teachers should be supported.
• Early childhood coursework and degrees should have clear articulation, and educational pathways should be streamlined to remove obstacles to degree attainment.
• Policies and programs such as T.E.A.C.H. that provide incentives and supports for degree attainment should continue to be supported and expanded as appropriate.
• Policy changes should be made so that child care subsidies currently provided through federal funds to help low-income children access early learning programs may only be used in quality early learning settings. The amount of the subsidy should reflect the actual cost of providing quality early learning to young kids, including the cost of hiring highly skilled educators.

ARIZONA’S UNKNOWN EDUCATION ISSUE 22ENDNOTES
i Pianta, R.C, Nimetz, S.L. & Bennett, E. (1997). Mother-Child, Teacher-Child Relationships, and School Outcomes in Preschool and Kindergarten. Early Childhood Research Quarterly, 12, 263-280.
Birch & Ladd (1997). The teacher-child relationship and children’s early school adjustment. Journal of School Psychology, ISSN 0022-4405, 1997, Volume 35, Issue 1, pp. 61-79.
Howes, C., Burchinal, M., Pianta, R., Bryant, D., Early, D., Clifford, R., et al. (2008). Ready to learn? Children’s pre-academic achievement in pre-kindergarten programs. Early Childhood Research Quarterly, 23, 27-50.
ii Pianta, R.C. & Stuhlman, M.G. (2004). Teacher-Child Relationships and Children’s Success in the First Years of School. School Psychology Review, 33 (3), 444-458.
Mashburn et al. (2008). Measures of Classroom Quality in Prekin-dergarten and Children’s Development of Academic, Language, and Social Skills. Child Development, 28 (3), 732-749.
Fuligni et al. (2009). Diverse Pathways in Early Childhood Professional Development: An Exploration of Early Educators in Public Preschools, Private Preschools, and Family Child Care Homes. Early Education and Development, Vol. 20 (3), pp. 507-526.
iii State of Arizona, (2012). Arizona’s Infant and Toddler Developmental Guidelines. Retrieved from http://www.azftf.gov/WhoWeAre/Board/Documents/az_infant_toddler_guidelines.pdf.
Arizona Department of Education, (2005). Early Learning Standards. Retrieved from http://www.azed.gov/wp-content/uploads/PDF/EarlyLearningStandards.pdf.
iv See Association of Child Care Resource and Referral Agencies. (2008). Parents and the High Price of Care: 2008 Update. Retrieved from http://naccrra.org/.
Fuligni et al. (2009). Diverse Pathways in Early Childhood Professional Development: An Exploration of Early Educators in Public Preschools, Private Preschools, and Family Child Care Homes. Early Education and Development, Vol. 20 (3), pp. 507-526.
v Tout, K., Zaslow, M., Berry D. (2006). Quality and qualifications: Links between professional development and quality in early care and education settings. In: Zaslow M., Martinez-Beck I, editors. Critical issues in early childhood professional development. Baltimore: Brookes Publishing; 2006.
vi Powell et al. (2010). Effects of an Early Literacy Professional Development Intervention on Head Start Teachers and Children. Journal of Educational Psychology, Vol. 102, (2), pp. 299-312.
vii O’ Connor, Collins & Supplee (2012). Behavior problems in late childhood: The roles of early maternal attachment and teacher-child relationship trajectories. Attachment & Human Development, ISSN 1461-6734, 2012, Volume 14, (3), p. 265.
viii Mims, S., Scott-Little, C., Lower J.K., Cassidy, D.J., & Hestenes, L.L. (2008). Education Level and Stability As It Relates to Early Childhood Classroom Quality: A Survey of Early Childhood Program Directors and Teachers, Vol. 23 (2), 227.
ix Raikes, H. (1993). Relationship duration in infant care: Time with a high-ability teacher and infant-teacher attachment. Early Childhood Research Quarterly, 8 (3), 309-325.
x Korjenevitch, M., & Dunifon, R. (2010). Child care center quality and child development. Ithaca, New York: Cornell University.
xi National Association for the Education of Young Children (NAEYC) (2004). NAEYC Advocacy Toolkit. Retrieved from www.naeyc.org/files/naeyc/file/policy/toolkit.pdf.
xii Whitebook and Sakai (2003). Turnover Begets Turnover: An Examination of Job and Occupational Instability Among Child Care Center Staff. Early Childhood Research Quarterly, Vol. 18, pp. 273-293.
xiii U.S. Department of Labor, Bureau of Labor Statistics. (2011). May 2011 national occupation employment and wage estimates. Washington, DC: Author.
xiv Bureau of Labor Statistics, U.S. Department of Labor. (2012). Occupational Outlook Handbook, 2012-2013 Edition, Preschool Teachers. Retrieved on July 3, 2012 from http://www.bls.gov/ooh/education-training-and-library/preschool-teachers.htm.
Porter, N. (2012). Higher turnover among Early Childhood Educators in the United States. Child Research Net. Retrieved from http://www.childresearch.net/projects/ecec/2012_04.html.
xv Barnett, W. S. (2003). Low wages = low quality. Solving the real preschool teacher crisis. Preschool Policy Matters, Policy Brief, Issue 3. New Brunswick, NJ: National Institute for Early Education Research, Rutgers University.
xvi Harding, J. (1991). A study of career intentions: 1990 intake diploma of teaching (early childhood) students. ERIC ED 343682.
xvii Bureau of Labor Statistics, inflation calculator. At http://www.bls.gov/data/inflation_calculator.htm.
xviii Bureau of Labor Statistics, U.S. Department of Labor. (2012). Occupational Outlook Handbook, 2012-2013 Edition, Preschool Teachers. Retrieved on July 3, 2012 from http://www.bls.gov/ooh/education-training-and-library/preschool-teachers.htm.
xix Hill, T. (2011). The Economic Recession: Impact on Employment Trends and Retirement Patterns. US-Insider. Retrieved from http://www.towerswatson.com/united-states/newsletters/insider/5086.
xx Holochwost, S. J., DeMott, K., Buell, M., Yannetta, K., & Amsden, D. (2009). Retention of staff in early childhood education workforce. Child Youth Care Forum, 38, 227-237. doi:10.1007/s10566-009-9078-6.
xxi Bureau of Labor Statistics, inflation calculator. At http://www.bls.gov/data/inflation_calculator.htm.
xxii Bureau of Labor Statistics, U.S. Department of Labor. (2012). Occupational Outlook Handbook, 2012-2013 Edition, Preschool Teachers. Retrieved on July 3, 2012 from http://www.bls.gov/ooh/education-training-and-library/preschool-teachers.htm.
xxiii Economic Policy Institute (2012). The Class of 2012: Labor market for young graduates remains grim.
Retrieved November 29, 2012 from http://www.epi.org/publication/bp340-labor-market-young-graduates.
xxiv Bureau of Labor Statistics, U.S. Department of Labor. (2012). Occupational Outlook Handbook, 2012-2013 Edition, Preschool Teachers. Retrieved on July 3, 2012 from http://www.bls.gov/ooh/education-training-and-library/preschool-teachers.htm.
xxv Mims, S., Scott-Little, C., Lower J.K., Cassidy, D.J., & Hestenes, L.L. (2008). Education Level and Stability As It Relates to Early Childhood Classroom Quality: A Survey of Early Childhood Program Directors and Teachers, Vol. 23 (2), 227.
Pianta, R.C., Nimetz, S.L. & Bennett, E. (1997). Mother-Child, Teacher-Child Relationships, and School Outcomes in Preschool and Kindergarten. Early Childhood Research Quarterly, 12, 263-280.
Birch & Ladd (1997). The teacher-child relationship and children’s early school adjustment. Journal of School Psychology, ISSN 0022-4405, 1997, Volume 35, Issue 1, pp. 61-79.
Howes, C., Burchinal, M., Pianta, R., Bryant, D., Early, D., Clifford, R., et al. (2008). Ready to learn? Children’s pre-academic achievement in pre-kindergarten programs. Early Childhood Research Quarterly, 23, 27-50.
xxv Pianta, R.C. & Stuhlman, M.G. (2004). Teacher-Child Relationships and Children’s Success in the First Years of School. School Psychology Review, 33 (3), 444-458.
Mashburn et al. (2008). Measures of Classroom Quality in Prekin-dergarten and Children’s Development of Academic, Language, and Social Skills. Child Development, 28 (3), 732-749
Fuligni et al. (2009). Diverse Pathways in Early Childhood Professional Development: An Exploration of Early Educators in Public Preschools, Private Preschools, and Family Child Care Homes. Early Education and Development, Vol. 20 (3), pp. 507-526.
ENDNOTES

ARIZONA’S UNKNOWN EDUCATION ISSUE 23ENDNOTES
xxvi Economic Policy Institute (2012). The Class of 2012: Labor market for young graduates remains grim.
Retrieved November 29, 2012 from http://www.epi.org/publication/bp340-labor-market-young-graduates/.
Bureau of Labor Statistics, U.S. Department of Labor. (2012). Occupational Outlook Handbook, 2012-2013 Edition, Preschool Teachers. Retrieved on July 3, 2012 from http://www.bls.gov/ooh/education-training-and-library/preschool-teachers.htm.
xxvii Ceglowski, D. and Davis, E. (April 2004). Assessing Structural Indicators of Child Care Quality at the Local Level: Lessons from Four Minnesota Counties. Child & Youth Care Forum. Vol. 33 Issue 2, p71, 23p.
Howes, C., Burchinal, M., Pianta, R., Bryant, D., Early, D., Clifford, R., et al. (2008). Ready to learn? Children’s pre-academic achievement in pre-kindergarten programs. Early Childhood Research Quarterly, 23, 27-50.
Pianta, R.C. & Stuhlman, M.G. (2004). Teacher-Child Relationships and Children’s Success in the First Years of School. School Psychology Review, 33 (3), 444-458.
Mashburn et al. (2008). Measures of Classroom Quality in Prekin-dergarten and Children’s Development of Academic, Language, and Social Skills. Child Development, 28 (3), 732-749.
xxviii Bridges, M., Fuller, B., Huang, D. S., Hamre, B. K. (2011) Strengthening the early childhood workforce: How wage incentives may boost training and job stability. Early Education and Development, 22(6), 1009-1029.
Raikes H. (1993). Relationship duration in infant care: Time with a high-ability teacher and infant-teacher attachment. Early Childhood Research Quarterly, 8 (3), 309-325.
xxix Arizona Child Care Association, (2012). Child Care Closures. Unpublished data received December 12, 2012.
Arizona Department of Economic Security (2010). Arizona CAA Market Rate Survey. Retrieved from https://www.azdes.gov/appreports.aspx?Category=136.
xxx National Center for Education Statistics. (2010). The Condition of Education. Retrieved from http://nces.ed.gov/programs/coe/indicator_tat.asp.
xxxi Raikes H. (1993). Relationship duration in infant care: Time with a high-ability teacher and infant-teacher attachment. Early Childhood Research Quarterly, 8 (3), 309-325.
Birch & Ladd (1997). The teacher-child relationship and children’s early school adjustment. Journal of School Psychology, ISSN 0022-4405, 1997, Volume 35, Issue 1, pp. 61-79.
O’ Connor, Collins & Supplee (2012). Behavior problems in late childhood: The roles of early maternal attachment and teacher-child relationship trajectories. Attachment & human development, ISSN 1461-6734, 2012, Volume 14, Issue 3, p. 265.
Miller, K. (2001). Ages and Stages: Developmental Descriptions and Activities, Birth Through Eight Years. Gryphon House.

APPENDIX A: METHODOLOGY ARIZONA’S UNKNOWN EDUCATION ISSUE 24
APPENDIX A: METHODOLOGY
The objective of this study was to gather information on the wages paid to, benefits offered to, educational attainment and participation in First Things First of child care providers in the state of Arizona. The goal was to collect these data from all centers licensed by the Arizona State Department of Health Services. The number of licensed sites as of December 14, 2011 was 2,206. When this survey was first conducted in 1997 it became very obvious that collecting information for each individual ‘licensed site’ was not meaningful for Head Start programs nor for programs based at public schools. For these types of providers, licensed sites were individual classrooms administered by a regional office. Data were collected for these programs from the administrative offices rather than the service site and each completed interview contained information for multiple sites or classrooms.
Of the original 2,206 sites 58 were no longer providing care or had no paid employees. Seventy-eight addi-tional sites were identified during the interview process. These sites were on tribal lands or were programs sharing a state licenses. For the resulting 2,226 sites, 1,427 center or program administrators were identified and 1,365 individual interviews completed for a participation rate of 96%. The 1,365 interviews provided data for 2,384 sites. This number is greater than the number of licensed sites because sites on tribal lands do not require an ADHS License.
Of the respondents, 33.3% were from for profit employers with fewer than four sites; 7.8% were from Arizona-based, for profit employers with four or more sites; 10.8% were from for profit national employers with four or more sites; 2.21% were from Head Start programs; 15.9% were from public/charter school programs; 19.7% were from religious nonprofit organizations; 1.4% were from YMCA organizations; and 9.1% were from other nonprofit sites.
The Maricopa County Office of Research and Reporting collected the data. Interviews were conducted by phone between January 5, 2012 and March 23, 2012 using staff who were both experienced and well trained in these types of interviews. An explanatory letter and a copy of the questionnaire were emailed or faxed to center or program administrators only when requested by the administrator.
For purposes of the study the following definitions were provided to the respondents: teachers – persons in charge of a group or classroom of children, often with staff supervisory responsibilities; assistant teachers – persons working under the supervision of a teacher; teacher directors – persons with both teaching and administrative duties; administrative directors – persons with primarily administrative duties; full time – 30 hours a week or more; and part time – fewer than 30 hours per week. The unit of analysis for all of the data reported is the specific type of employee and the data have been weighted accordingly. For example, data on the median salary for teachers were collected from 1,268 child care providers employing 10,245 teachers. The numbers of each type of employee reported by each provider were used as weighting factors in order to be able to talk about each type of employee rather than ‘sites’. This weighting is imperative given the great diversity in numbers of paid staff.

APPENDIX B: SURVEY ARIZONA’S UNKNOWN EDUCATION ISSUE 25
APPENDIX B: 2012 EARLY CARE AND EDUCATION WORKFORCE SURVEY Prepared and Conducted by the Maricopa County Office of Research & Reporting
Child care centers/programs rely on the skills and services of many employees, i.e. cooks, bus drivers, secretaries, and professional staff without teaching responsibilities. In this survey, however, you will be asked only about teaching staff and administrative director(s) with executive-level responsibilities for your center/program.
Please use the following titles to describe your staff for the purposes of this survey:ASSISTANT TEACHERS – persons working under the supervision of a teacherTEACHERS – persons in charge of a group or classroom of children, often with staff supervisory responsibilitiesTEACHER-DIRECTORS – persons with both teaching and administrative dutiesADMINISTRATIVE DIRECTORS – persons with primarily administrative duties
1. Using these definitions;
A. How many ASSISTANT TEACHERS are currently on your payroll? B. How many TEACHERS? C. How many TEACHER DIRECTORS? D. How many ADMINISTRATIVE DIRECTORS (including you)?
So you have a total of ( ____ ) employees on your payroll?
2. How many of the ( ) work only part time, that is fewer than 30 hours a week?
3. So you have (q1 – q2 =___) ( ) who work full time?
4. What is the minimum level of education required to be a ( ) at your center?
5a. How many of the ( ) have a master’s degree or higher from a college or university?
5b. How many other ( ) have a bachelor’s degree?
6a. And how many other ( ) have an associate’s degree?
6b. So you have (q1 – q5a – 5b – q6a = _____) ( ) who have less education than a college degree.
7. And how many of these ( ) ( ) who do not have a college degree have a Childhood Development Associate credential (C.D.A)?
7a. How many of the ( ) have received, or are receiving, a T.E.A.C.H. Scholarship? (Teacher Education and Compensation Helps)
7b. How many of the ( ) have participated in or are currently participating in the First Things First REWARD$?
8. What is the average length of employment for ( ) at your center/program?
Would you say most ( ) work there 6 months or less, from 7 to 11 months, about 1 year, about 2 years, about 3 years, about 4 years, or 5 years or more?
9. What is the lowest starting salary for ( ) per hour?
10. What hourly wage does your highest paid ( ) earn?
11. What would you say the average hourly wage is for ( )?
ASSISTANT TEACHERS
NUMBER ON PAYROLL
___________
NO. PART TIME
___________
NO. FULL TIME
___________
NONE HS / GED
SOME COLLEGE / A.A. COLLEGE GRAD
NO. W/ MASTER’S ___________
NO. W/ BACHELOR’S ___________
NO. W/ ASSOCIATE’S ___________
NO. W/ NO DEGREE ___________
NO. W/ CDA ___________
NO. PARTICIPATING ___________
NO. RECEIVING ___________
6 MOS. OR LESS 7-11 MOS. ONE YEAR
TWO YEARS THREE YEARS FOUR YEARS
FIVE PLUS YEARS
$ ________ Per Hour
$ ________ Per Hour
$ ________ Per Hour
TEACHERS
NUMBER ON PAYROLL
___________
NO. PART TIME
___________
NO. FULL TIME
___________
NONE HS / GED
SOME COLLEGE / A.A. COLLEGE GRAD
NO. W/ MASTER’S___________
NO. W/ BACHELOR’S ___________
NO. W/ ASSOCIATE’S ___________
NO. W/ NO DEGREE ___________
NO. W/ CDA ___________
NO. PARTICIPATING ___________
NO. RECEIVING ___________
6 MOS. OR LESS 7-11 MOS. ONE YEAR
TWO YEARS THREE YEARS FOUR YEARS
FIVE PLUS YEARS
$ ________ Per Hour
$ ________ Per Hour
$ ________ Per Hour
TEACHER DIRECTORS
NUMBER ON PAYROLL
___________
NO. PART TIME
___________
NO. FULL TIME
___________
NONE HS / GED
SOME COLLEGE / A.A. COLLEGE GRAD
NO. W/ MASTER’S ___________
NO. W/ BACHELOR’S ___________
NO. W/ ASSOCIATE’S ___________
NO. W/ NO DEGREE ___________
NO. W/ CDA ___________
NO. PARTICIPATING ___________
NO. RECEIVING ___________
6 MOS. OR LESS 7-11 MOS. ONE YEAR
TWO YEARS THREE YEARS FOUR YEARS
FIVE PLUS YEARS
$ ________ Per Hour
$ ________ Per Hour
$ ________ Per Hour
ADMINISTRATIVE DIRECTORS
NUMBER ON PAYROLL
___________
NO. PART TIME
___________
NO. FULL TIME
___________
NONE HS / GED
SOME COLLEGE / A.A. COLLEGE GRAD
NO. W/ MASTER’S ___________
NO. W/ BACHELOR’S ___________
NO. W/ ASSOCIATE’S ___________
NO. W/ NO DEGREE ___________
NO. W/ CDA ___________
NO. PARTICIPATING ___________
NO. RECEIVING ___________
6 MOS. OR LESS 7-11 MOS. ONE YEAR
TWO YEARS THREE YEARS FOUR YEARS
FIVE PLUS YEARS
$ ________ Per Hour
$ ________ Per Hour
$ ________ Per Hour

APPENDIX B: SURVEY ARIZONA’S UNKNOWN EDUCATION ISSUE 26
12. INTERVIEWER: ENTER NUMBERS OF PART-TIME AND FULL-TIME EMPLOYEES (QUESTIONS 2 & 3)
The next questions are about benefits that some child care centers/programs offer their employees.
13. Do you have reduced child care fees for your (PART-TIME / FULL-TIME) employees?
14. Unpaid, job-protected maternity and/or paternity leave?
15. Paid maternity and/or paternity leave?
16. Retirement or pension plan?
17a. Do you pay registration fees for staff to attend workshops, conferences, etc.?
17b. Do you have paid staff development days?
18. What about tuition reimbursement for education?
19. Do you offer Paid Time Off (PTO) or paid personal days that can be used as sick days and/or vacation time?
20a. Paid vacations (not included in PTO)?
20b. Paid sick leave (not included in PTO)?
21. Paid holidays?
22. Do you offer your (PART-TIME / FULL-TIME) employees Health Insurance benefits of any kind? (What kind of benefits?)
23. What about Dental Insurance? (What kind of benefits?)
24. What about Life Insurance? (What kind of benefits?)
PART-TIME TEACHING / ADMINISTRATIVE STAFF
NUMBER OF ___________
NO YES
NO YES
NO YES
NO YES
NO YES
NO YES
NO YES
NO YES
NO YES
NO YES
NO YES
NO HEALTH INSURANCE
FULL OR PART PAID FOR EMPLOYEES & DEPENDENTS
FULL OR PART PAID FOR EMPLOYEES, NOT DEPENDENTS
AVAILABLE, UNPAID
NO DENTAL INSURANCE
FULL OR PART PAID FOR EMPLOYEES & DEPENDENTS
FULL OR PART PAID FOR EMPLOYEES, NOT DEPENDENTS
AVAILABLE, UNPAID
NO LIFE INSURANCE
FULL OR PART PAID FOR EMPLOYEES & DEPENDENTS
FULL OR PART PAID FOR EMPLOYEES, NOT DEPENDENTS
AVAILABLE, UNPAID
FULL-TIME TEACHING / ADMINISTRATIVE STAFF
NUMBER OF ___________
NO YES
NO YES
NO YES
NO YES
NO YES
NO YES
NO YES
NO YES
NO YES
NO YES
NO YES
NO HEALTH INSURANCE
FULL OR PART PAID FOR EMPLOYEES & DEPENDENTS
FULL OR PART PAID FOR EMPLOYEES, NOT DEPENDENTS
AVAILABLE, UNPAID
NO DENTAL INSURANCE
FULL OR PART PAID FOR EMPLOYEES & DEPENDENTS
FULL OR PART PAID FOR EMPLOYEES, NOT DEPENDENTS
AVAILABLE, UNPAID
NO LIFE INSURANCE
FULL OR PART PAID FOR EMPLOYEES & DEPENDENTS
FULL OR PART PAID FOR EMPLOYEES, NOT DEPENDENTS
AVAILABLE, UNPAID
25. We have just a few questions about your center/program to allow us to compare data with other centers with similar characteristics. Is the center/program run by a nonprofit organization such as a church or public school?
[ 0 ] NO, FOR PROFIT [ 1 ] YES, NONPROFIT / PUBLIC SCHOOL (skip to q 28)
26. Is the center part of a corporation, organization or business with 4 or more centers?
[ 0 ] NO (skip to q 29) [ 1 ] YES
27. Does the corporation, organization or business have centers in states other than Arizona?
[ 0 ] NO (skip to q 29) [ 1 ] YES (skip to q 29)

APPENDIX B: SURVEY ARIZONA’S UNKNOWN EDUCATION ISSUE 27
28. Is the center/program funded by Head Start, the public school system, a charter school, a religious or faith based organization, a corporate or business employer, a university or college, state or local government, a community based organization or is it a par-ent cooperative?
[ 01 ] HEAD START [ 02 ] PUBLIC/CHARTER SCHOOL INCLUDING TITLE ONE
[ 03 ] RELIGIOUS OR FAITH BASED ORGANIZATION [ 04 ] CORPORATE OR BUSINESS EMPLOYER
[ 05 ] UNIVERSITY OR COLLEGE [ 06 ] STATE OR LOCAL GOVERNMENT AGENCY
[ 07 ] YMCA [ 08 ] OTHER COMMUNITY BASED ORGANIZATION
[ 09 ] COOPERATIVE [ 96 ] OTHER RESPONSE _______________________________________
29. And does your center/program provide care ONLY for school aged children, ONLY for children too young to attend school, or do you provide care for both age groups.
[ 1 ] ONLY SCHOOL AGED CHILDREN [ 2 ] NO SCHOOL AGED CHILDREN / ONLY YOUNGER CHILDREN
[ 3 ] SCHOOL AGED AND YOUNGER [ 6 ] OTHER RESPONSE ________________________________________
30. When you hire new staff, how often do you verify diplomas, degrees or other coursework by reviewing the applicants’ tran-scripts? Would you say always, most of the time, some of the time or hardly ever?
[ 1 ] ALWAYS [ 2 ] MOST OF THE TIME [ 3 ] SOME OF THE TIME [ 4 ] HARDLY EVER
[ 6 ] OTHER RESPONSE _________________________________________________________________________________________
31. And how often do you track the ongoing professional development of your employees? Would you say always, most of the time, some of the time or hardly ever?
[ 1 ] ALWAYS [ 2 ] MOST OF THE TIME [ 3 ] SOME OF THE TIME [ 4 ] HARDLY EVER
[ 6 ] OTHER RESPONSE _________________________________________________________________________________________
32. Does your center/program participate in Quality First?
[ 0 ] NO [ 1 ] YES
33. What is the zip code of child care facility (or geographic area covered by your office)?
ZIP CODE ______________________________________ GEOGRAPHIC AREA COVERED __________________________________
Thank you very much for your time and cooperation with this study. Do you have any questions or any comments you would like to make about the study?
_________________________________________________________________________________________________________________
_________________________________________________________________________________________________________________
_________________________________________________________________________________________________________________
If you have any questions about this study you can call Kristin Kaylor Richardson at the Arizona Early Childhood Development and Health Board (First Things First) at (602) 771-5008.
To reach the Maricopa County Office of Research & Reporting please call (602) 506-1600 or toll free 1(877) 499-6100.
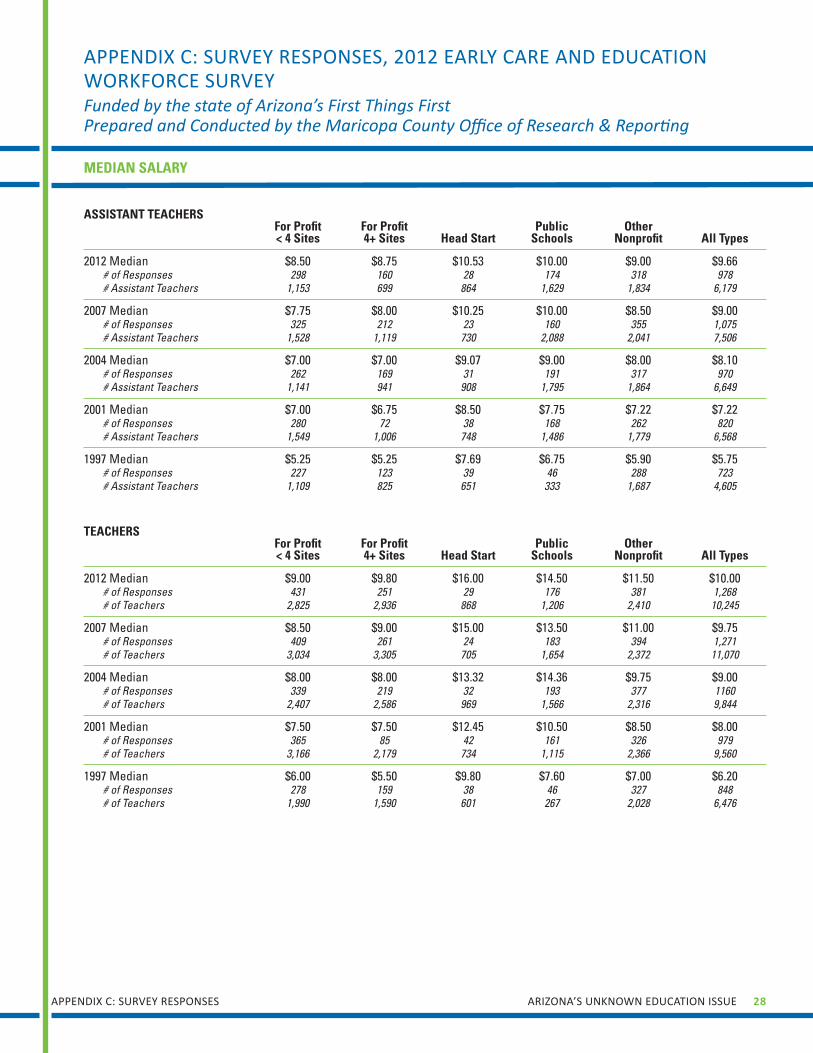
APPENDIX C: SURVEY RESPONSES ARIZONA’S UNKNOWN EDUCATION ISSUE 28
APPENDIX C: SURVEY RESPONSES, 2012 EARLY CARE AND EDUCATION WORKFORCE SURVEY Funded by the state of Arizona’s First Things First Prepared and Conducted by the Maricopa County Office of Research & Reporting
MEDIAN SALARY
ASSISTANT TEACHERS For Profit For Profit Public Other
< 4 Sites 4+ Sites Head Start Schools Nonprofit All Types
2012 Median $8.50 $8.75 $10.53 $10.00 $9.00 $9.66# of Responses 298 160 28 174 318 978# Assistant Teachers 1,153 699 864 1,629 1,834 6,179
2007 Median $7.75 $8.00 $10.25 $10.00 $8.50 $9.00# of Responses 325 212 23 160 355 1,075# Assistant Teachers 1,528 1,119 730 2,088 2,041 7,506
2004 Median $7.00 $7.00 $9.07 $9.00 $8.00 $8.10 # of Responses 262 169 31 191 317 970# Assistant Teachers 1,141 941 908 1,795 1,864 6,649
2001 Median $7.00 $6.75 $8.50 $7.75 $7.22 $7.22 # of Responses 280 72 38 168 262 820# Assistant Teachers 1,549 1,006 748 1,486 1,779 6,568
1997 Median $5.25 $5.25 $7.69 $6.75 $5.90 $5.75# of Responses 227 123 39 46 288 723# Assistant Teachers 1,109 825 651 333 1,687 4,605
TEACHERS For Profit For Profit Public Other
< 4 Sites 4+ Sites Head Start Schools Nonprofit All Types
2012 Median $9.00 $9.80 $16.00 $14.50 $11.50 $10.00# of Responses 431 251 29 176 381 1,268# of Teachers 2,825 2,936 868 1,206 2,410 10,245
2007 Median $8.50 $9.00 $15.00 $13.50 $11.00 $9.75# of Responses 409 261 24 183 394 1,271# of Teachers 3,034 3,305 705 1,654 2,372 11,070
2004 Median $8.00 $8.00 $13.32 $14.36 $9.75 $9.00 # of Responses 339 219 32 193 377 1160# of Teachers 2,407 2,586 969 1,566 2,316 9,844
2001 Median $7.50 $7.50 $12.45 $10.50 $8.50 $8.00 # of Responses 365 85 42 161 326 979# of Teachers 3,166 2,179 734 1,115 2,366 9,560
1997 Median $6.00 $5.50 $9.80 $7.60 $7.00 $6.20# of Responses 278 159 38 46 327 848# of Teachers 1,990 1,590 601 267 2,028 6,476

APPENDIX C: SURVEY RESPONSES ARIZONA’S UNKNOWN EDUCATION ISSUE 29
MEDIAN SALARY (CONTINUED)
TEACHER DIRECTORS For Profit For Profit Public Other
< 4 Sites 4+ Sites Head Start Schools Nonprofit All Types
2012 Median $11.00 $12.00 $20.00 $14.00 $14.00 $13.50# of Responses 302 136 15 101 236 790# Teacher Directors 428 192 119 337 428 1,504
2007 Median $11.56 $11.50 $15.00 $14.31 $14.50 $13.50# of Responses 245 137 11 87 227 707# Teacher Directors 321 189 70 284 307 1,171
2004 Median $10.00 $10.20 $13.00 $11.25 $11.00 $10.92 # of Responses 181 125 13 88 192 599# Teacher Directors 245 212 68 238 262 1,025
2001 Median $9.00 $9.09 $14.00 $13.58 $10.00 $10.19 # of Responses 221 50 18 114 182 585# Teacher Directors 347 133 137 296 364 1,277
1997 Median $7.75 $6.75 $10.50 $10.83 $8.50 $8.00# of Responses 171 75 3 43 196 488# Teacher Directors 246 105 3 100 256 710
ADMINISTRATIVE DIRECTORS For Profit For Profit Public Other
< 4 Sites 4+ Sites Head Start Schools Nonprofit All Types
2012 Median $14.00 $16.00 $21.16 $22.00 $17.00 $16.80# of Responses 286 218 25 92 253 874# Administrative Directors 371 317 119 143 337 1,287
2007 Median $14.50 $14.00 $20.00 $21.47 $16.75 $16.82# of Responses 225 198 24 121 246 814# Administrative Directors 305 321 168 188 311 1,293
2004 Median $13.00 $14.30 $18.00 $25.00 $14.50 $15.00 # of Responses 200 175 29 147 276 827# Administrative Directors 262 215 127 197 334 1,135
2001 Median $12.00 $13.05 $16.68 $23.85 $12.93 $13.84 # of Responses 236 64 29 137 221 687# Administrative Directors 352 186 96 198 329 1,161
1997 Median $10.00 $10.75 $14.09 $15.00 $12.00 $11.45# of Responses 168 125 36 23 238 590# Administrative Directors 223 185 106 32 289 835
LOWEST STARTING SALARY
ASSISTANT TEACHERS For Profit For Profit Public Other
< 4 Sites 4+ Sites Head Start Schools Nonprofit All Types
2012 Median $7.98 $8.00 $9.71 $8.77 $8.25 $8.50# of Responses 298 160 28 174 318 978# Assistant Teachers 1,153 699 864 1,629 1,834 6,179
2007 Median $7.00 $7.25 $9.22 $8.75 $7.50 $8.00# of Responses 328 212 24 162 359 1,085# Assistant Teachers 1,548 1,119 743 2,109 2,063 7,582
2004 Median $6.50 $6.50 $8.16 $8.00 $7.00 $7.25 # of Responses 263 168 31 193 315 970# Assistant Teachers 1,145 938 908 1,835 1,859 6,685
2001 Median $6.00 $6.00 $8.21 $7.12 $6.50 $6.50 # of Responses 285 72 38 175 263 833# Assistant Teachers 1,611 1,006 748 1,552 1,786 6,703
1997 Median $5.00 $4.75 $6.76 $6.43 $5.25 $5.25# of Responses 237 128 40 47 299 751# Assistant Teachers 1,147 858 663 351 1,744 4,763

APPENDIX C: SURVEY RESPONSES ARIZONA’S UNKNOWN EDUCATION ISSUE 30
LOWEST STARTING SALARY (CONTINUED)
TEACHERS For Profit For Profit Public Other
< 4 Sites 4+ Sites Head Start Schools Nonprofit All Types
2012 Median $8.00 $8.00 $14.83 $13.46 $9.89 $8.99# of Responses 430 251 29 176 380 1,266# of Teachers 2,822 2,936 868 1,206 2,387 10,219
2007 Median $7.50 $8.00 $11.75 $11.71 $9.50 $8.25# of Responses 412 262 25 187 399 1,285# of Teachers 3,063 3,313 711 1,725 2,436 11,248
2004 Median $6.50 $7.00 $11.32 $12.42 $8.00 $7.50 # of Responses 339 218 32 197 374 1160# of Teachers 2,418 2,579 969 1,667 2,309 9,942
2001 Median $6.50 $6.25 $10.02 $10.00 $7.00 $7.00 # of Responses 368 86 42 172 327 995# of Teachers 3,330 2,201 734 1,223 2,376 9,864
1997 Median $5.00 $5.00 $8.90 $6.91 $6.25 $5.50# of Responses 295 166 39 52 343 895# of Teachers 2,099 1,716 646 288 2,129 6,878
TEACHER DIRECTORS For Profit For Profit Public Other
< 4 Sites 4+ Sites Head Start Schools Nonprofit All Types
2012 Median $10.00 $11.00 $16.25 $13.80 $12.13 $12.00# of Responses 301 136 15 101 236 789# Teacher Directors 427 192 119 337 428 1,503
2007 Median $10.00 $10.00 $16.38 $13.00 $12.19 $11.90# of Responses 242 136 11 86 219 694# Teacher Directors 318 189 70 293 298 1,168
2004 Median $9.00 $9.00 $12.00 $10.60 $10.00 $9.79 # of Responses 179 123 13 82 185 582# Teacher Directors 243 210 68 231 254 1,006
2001 Median $8.00 $8.11 $12.45 $12.00 $8.50 $9.05 # of Responses 224 52 18 121 179 594# Teacher Directors 368 137 137 303 362 1,307
1997 Median $6.75 $6.25 $7.27 $9.01 $7.50 $7.00# of Responses 159 77 4 41 177 458# Teacher Directors 231 113 4 99 235 682
ADMINISTRATIVE DIRECTORS For Profit For Profit Public Other
< 4 Sites 4+ Sites Head Start Schools Nonprofit All Types
2012 Median $12.00 $14.40 $15.32 $19.00 $15.86 $15.00 # of Responses 286 218 24 92 253 873 # Administrative Directors 371 317 118 143 337 1,286
2007 Median $12.00 $12.00 $15.92 $18.00 $14.40 $13.69 # of Responses 215 195 24 113 233 780 # Administrative Directors 293 322 168 179 297 1,259
2004 Median $11.50 $12.00 $15.00 $21.48 $12.50 $13.75 # of Responses 192 168 29 126 262 777 # Administrative Directors 252 208 127 174 320 1,081
2001 Median $10.00 $11.49 $14.41 $17.88 $10.54 $11.50 # of Responses 250 67 29 142 221 709 # Administrative Directors 372 190 98 204 328 1,192
1997 Median $8.00 $8.85 $11.42 $11.00 $10.41 $9.31 # of Responses 158 115 33 23 202 531 # Administrative Directors 213 171 103 32 257 776

APPENDIX C: SURVEY RESPONSES ARIZONA’S UNKNOWN EDUCATION ISSUE 31
HIGHEST SALARY
ASSISTANT TEACHERS For Profit For Profit Public Other
< 4 Sites 4+ Sites Head Start Schools Nonprofit All Types
2012 Median $9.00 $9.50 $13.35 $11.77 $10.00 $10.50# of Responses 298 160 28 174 318 978# Assistant Teachers 1,153 699 864 1,629 1,834 6,179
2007 Median $8.25 $8.50 $12.77 $12.00 $9.50 $10.00# of Responses 328 212 23 162 359 1,084# Assistant Teachers 1,548 1,119 730 2,109 2,063 7,569
2004 Median $8.00 $7.75 $10.95 $10.00 $9.00 $9.00 # of Responses 262 169 31 193 316 971# Assistant Teachers 1,142 941 908 1,835 1,860 6,686
2001 Median $7.00 $7.50 $9.87 $8.76 $8.00 $8.00 # of Responses 282 72 38 172 263 827# Assistant Teachers 1595 1,006 748 1,514 1,781 6,644
1997 Median $5.50 $5.30 $8.94 $7.50 $6.47 $6.20# of Responses 236 126 39 46 297 744# Assistant Teachers 1,144 850 651 341 1,721 4,707
TEACHERS For Profit For Profit Public Other
< 4 Sites 4+ Sites Head Start Schools Nonprofit All Types
2012 Median $10.75 $11.50 $21.12 $16.80 $13.50 $12.50# of Responses 431 250 29 176 381 1,267# of Teachers 2,825 2,921 868 1,206 2,410 10,230
2007 Median $10.00 $11.00 $18.33 $17.00 $13.39 $12.00# of Responses 412 261 25 191 397 1,286# of Teachers 3,060 3,305 711 1,730 2,407 11,213
2004 Median $9.50 $9.75 $15.44 $16.76 $11.50 $11.00 # of Responses 340 218 32 198 376 1164# of Teachers 2,427 2,574 969 1,669 2,312 9,951
2001 Median $8.75 $9.35 $15.00 $14.00 $10.00 $9.78 # of Responses 364 84 42 170 327 987# of Teachers 3,284 2,168 734 1,208 2,382 9,776
1997 Median $7.00 $6.75 $12.29 $8.34 $8.30 $7.25# of Responses 296 165 40 51 340 892# of Teachers 2,098 1,703 654 281 2,092 6,828
TEACHER DIRECTORS For Profit For Profit Public Other
< 4 Sites 4+ Sites Head Start Schools Nonprofit All Types
2012 Median $11.52 $13.00 $23.75 $15.38 $15.00 $14.28 # of Responses 302 136 15 101 236 790 # Teacher Directors 428 192 119 337 428 1,504
2007 Median $13.00 $12.60 $18.25 $15.76 $15.00 $14.50 # of Responses 246 138 11 88 227 710 # Teacher Directors 322 191 70 295 307 1,185
2004 Median $11.00 $11.00 $14.00 $13.32 $12.00 $12.00 # of Responses 181 125 13 87 192 598 # Teacher Directors 245 212 68 223 262 1,010
2001 Median $10.00 $10.00 $14.62 $15.00 $10.98 $11.32 # of Responses 220 50 17 120 183 590 # Teacher Directors 363 133 136 302 366 1,300
1997 Median $8.00 $7.15 $9.04 $10.75 $9.00 $8.75 # of Responses 173 79 4 44 199 499 # Teacher Directors 248 116 4 102 262 732

APPENDIX C: SURVEY RESPONSES ARIZONA’S UNKNOWN EDUCATION ISSUE 32
HIGHEST SALARY (CONTINUED)
ADMINISTRATIVE DIRECTORS For Profit For Profit Public Other
< 4 Sites 4+ Sites Head Start Schools Nonprofit All Types
2012 Median $15.00 $17.30 $24.35 $24.00 $18.70 $17.78# of Responses 286 218 25 92 253 874# Administrative Directors 371 317 119 143 337 1,287
2007 Median $15.00 $16.00 $23.44 $28.93 $17.30 $18.00# of Responses 225 200 24 121 246 816# Administrative Directors 305 325 168 188 311 1,297
2004 Median $14.18 $14.36 $25.38 $25.56 $15.00 $16.02 # of Responses 200 175 29 146 276 826# Administrative Directors 262 215 127 196 334 1,134
2001 Median $12.60 $15.45 $18.63 $25.70 $16.88 $15.45 # of Responses 236 65 29 140 226 696# Administrative Directors 353 187 96 200 334 1,170
1997 Median $10.00 $11.69 $14.50 $14.23 $13.00 $12.50# of Responses 172 128 37 23 246 606# Administrative Directors 227 188 107 32 305 859
AVERAGE LENGTH OF EMPLOYMENT
ASSISTANT TEACHERS For Profit For Profit Public Other
< 4 Sites 4+ Sites Head Start Schools Nonprofit All Types
6 Months or Less 7% 8% 2% 3% 4%
7-11 Months 8% 7% 1% 2% 3%
One Year 31% 22% 12% 10% 12% 16%
Two Years 19% 14% 2% 18% 18% 15%
Three Years 9% 16% 28% 38% 24% 24%
Four Years 6% 9% 30% 7% 7% 10%
Five Years or More 21% 24% 28% 24% 34% 27%
Don’t Know/Refused 0% 0% 0% 0% 0%
# of Responses 299 161 28 175 319 982 # Assistant Teachers 1,156 701 864 1,631 1,835 6,187
TEACHERS For Profit For Profit Public Other
< 4 Sites 4+ Sites Head Start Schools Nonprofit All Types
6 Months or Less 3% 2% 2% 2% 2%
7-11 Months 4% 1% 2% 2% 2%
One Year 13% 9% 11% 13% 5% 10%
Two Years 20% 18% 2% 8% 13% 15%
Three Years 17% 23% 14% 13% 15% 18%
Four Years 9% 10% 1% 6% 7% 8%
Five Years or More 33% 37% 71% 56% 55% 45%
Don’t Know/Refused 0% 1% 0% 1%
# of Responses 431 252 29 176 382 1,270 # Teachers 2,825 2,949 868 1,206 2,412 10,260

APPENDIX C: SURVEY RESPONSES ARIZONA’S UNKNOWN EDUCATION ISSUE 33
AVERAGE LENGTH OF EMPLOYMENT (CONTINUED)
TEACHER DIRECTORS For Profit For Profit Public Other
< 4 Sites 4+ Sites Head Start Schools Nonprofit All Types
6 Months or Less 4% 6% 3% 2% 4% 4%
7-11 Months 5% 1% 1% 1% 2%
One Year 8% 10% 19% 5% 3% 7%
Two Years 9% 7% 17% 4% 10% 8%
Three Years 11% 13% 29% 10% 17% 14%
Four Years 10% 12% 29% 15% 15%
Five Years or More 52% 49% 31% 48% 50% 49%
Don’t Know/Refused 1% 1% 1% 0% 1%
# of Responses 315 137 15 103 241 811 # Teacher Directors 443 193 119 339 434 1,528
ADMINISTRATIVE DIRECTORS For Profit For Profit Public Other
< 4 Sites 4+ Sites Head Start Schools Nonprofit All Types
6 Months or Less 4% 3% 1% 1% 3% 3%
7-11 Months 3% 3% 1% 1% 2% 2%
One Year 8% 6% 5% 4% 4% 6%
Two Years 7% 8% 3% 8% 7% 7%
Three Years 10% 11% 7% 6% 8%
Four Years 7% 10% 2% 5% 6% 7%
Five Years or More 60% 56% 89% 74% 71% 66%
Don’t Know/Refused 2% 2% 1% 2% 2%
# of Responses 319 225 25 102 262 933 # Administrative Directors 410 326 119 155 346 1,356
MINIMUM LEVEL OF EDUCATION REQUIRED
ASSISTANT TEACHERS For Profit For Profit Public Other
< 4 Sites 4+ Sites Head Start Schools Nonprofit All Types
No Educational Requirement 10% 3% 5% 6% 4% 6%
High School or GED 75% 87% 63% 65% 80% 74%
Some College 12% 8% 33% 26% 13% 18%
College Graduate 2% 2% 1% 2% 1%
Don’t Know / Refused 1% 3% 0% 1%
# of Responses 299 161 28 175 319 982 # Assistant Teachers 1,156 701 864 1,631 1,835 6,187

APPENDIX C: SURVEY RESPONSES ARIZONA’S UNKNOWN EDUCATION ISSUE 34
MINIMUM LEVEL OF EDUCATION REQUIRED (CONTINUED)
TEACHERS For Profit For Profit Public Other
< 4 Sites 4+ Sites Head Start Schools Nonprofit All Types
No Educational Requirement 0% 0% 2% 1%
High School or GED 76% 87% 4% 45% 59% 66%
Some College 16% 11% 80% 15% 25% 22%
College Graduate 7% 2% 16% 39% 14% 12%
Don’t Know / Refused 0% 0% 0%
# of Responses 431 252 29 176 382 1,270 # Teachers 2,825 2,949 868 1,206 2,412 10,260
TEACHER DIRECTORS For Profit For Profit Public Other
< 4 Sites 4+ Sites Head Start Schools Nonprofit All Types
No Educational Requirement 1% 2% 8% 1% 1% 2%
High School or GED 44% 61% 52% 37% 42%
Some College 37% 26% 71% 33% 41% 39%
College Graduate 18% 11% 20% 14% 20% 17%
Don’t Know / Refused 0% 1% 0%
# of Responses 315 137 15 103 241 811 # Teacher Directors 443 193 119 339 434 1,528
ADMINISTRATIVE DIRECTORS For Profit For Profit Public Other
< 4 Sites 4+ Sites Head Start Schools Nonprofit All Types
No Educational Requirement 1% 3% 3% 1%
High School or GED 33% 49% 1% 18% 27% 31%
Some College 34% 27% 55% 24% 19% 29%
College Graduate 32% 24% 45% 54% 50% 38%
Don’t Know / Refused 1% 1% 1% 1%
# of Responses 319 225 25 102 262 933 # Administrative Directors 410 326 119 155 346 1,356
LEVEL OF EDUCATION ATTAINED
ASSISTANT TEACHERS For Profit For Profit Public Other
< 4 Sites 4+ Sites Head Start Schools Nonprofit All Types
Master’s Degree 2% 1% 1% 0% 2% 2%
Bachelor’s Degree 10% 7% 5% 12% 17% 12%
Associate’s Degree 9% 7% 17% 19% 10% 9%
CDA 5% 4% 34% 7% 5% 6%
No Degree / No CDA 74% 81% 43% 62% 65% 69%
T.E.A.C.H. Scholarships 3% 13% 10% 4% 3% 5%
FTF REWARD$ 13% 8% 4% 5% 8% 9%

APPENDIX C: SURVEY RESPONSES ARIZONA’S UNKNOWN EDUCATION ISSUE 35
LEVEL OF EDUCATION ATTAINED (CONTINUED)
TEACHERS For Profit For Profit Public Other
< 4 Sites 4+ Sites Head Start Schools Nonprofit All Types
Master’s Degree 6% 4% 6% 21% 9% 9%
Bachelor’s Degree 18% 18% 31% 45% 33% 26%
Associate’s Degree 16% 12% 46% 12% 16% 15%
CDA 9% 9% 16% 4% 11% 9%
No Degree / No CDA 51% 57% 1% 18% 32% 41%
T.E.A.C.H. Scholarships 7% 7% 11% 4% 7% 7%
FTF REWARD$ 18% 14% 11% 10% 15% 15%
TEACHER DIRECTORS For Profit For Profit Public Other
< 4 Sites 4+ Sites Head Start Schools Nonprofit All Types
Master’s Degree 14% 5% 29% 28% 17% 16%
Bachelor’s Degree 20% 26% 27% 34% 34% 27%
Associate’s Degree 21% 11% 29% 13% 18% 17%
CDA 9% 12% 15% 7% 6% 8%
No Degree / No CDA 37% 47% 0% 18% 24% 32%
T.E.A.C.H. Scholarships 11% 8% 0% 3% 5% 8%
FTF REWARD$ 19% 14% 7% 9% 11% 14%
ADMINISTRATIVE DIRECTORS For Profit For Profit Public Other
< 4 Sites 4+ Sites Head Start Schools Nonprofit All Types
Master’s Degree 20% 10% 43% 45% 29% 23%
Bachelor’s Degree 32% 34% 37% 33% 35% 33%
Associate’s Degree 20% 15% 18% 10% 17% 17%
CDA 7% 8% 2% 0% 6% 6%
No Degree / No CDA 21% 32% 0% 12% 14% 20%
T.E.A.C.H. Scholarships 7% 9% 4% 3% 4% 6%
FTF REWARD$ 23% 20% 4% 1% 12% 16%
BENEFITS AVAILABLE TO FULL-TIME EMPLOYEES
REDUCED CHILD CARE FEES For Profit For Profit Public Other
< 4 Sites 4+ Sites Head Start Schools Nonprofit All Types
No 7% 5% 96% 29% 21% 26%
Yes 93% 95% 4% 71% 79% 74%
# of Responses 427 250 29 200 353 1,259 # Full Time Employees 3,329 3,358 1,898 2,119 2,609 13,313

APPENDIX C: SURVEY RESPONSES ARIZONA’S UNKNOWN EDUCATION ISSUE 36
BENEFITS AVAILABLE TO FULL-TIME EMPLOYEES (CONTINUED)
UNPAID MATERNITY LEAVE For Profit For Profit Public Other
< 4 Sites 4+ Sites Head Start Schools Nonprofit All Types
No 36% 14% 19% 7% 19% 20%
Yes 64% 86% 81% 93% 81% 80%
PAID MATERNITY LEAVE
No 89% 77% 41% 75% 69% 73%
Yes 11% 23% 59% 25% 31% 27%
RETIREMENT PLAN
No 83% 32% 1% 13% 37% 38%
Yes 17% 68% 99% 87% 63% 62%
PAY REGISTRATION FOR WORKSHOPS
No 25% 37% 4% 4% 10% 19%
Yes 75% 63% 96% 96% 90% 81%
PAID STAFF DEVELOPMENT DAYS
No 45% 23% 2% 6% 20% 22%
Yes 55% 77% 98% 94% 80% 78%
TUITION REIMBURSEMENT
No 69% 28% 7% 60% 59% 47%
Yes 31% 72% 93% 40% 41% 53%
PAID VACATION
No 31% 3% 13% 4% 6% 12%
Yes 15% 5% 21% 5% 9%
Personal Time Off 55% 91% 67% 96% 31% 31%
# of Responses 427 250 29 200 353 1,259 # Full Time Employees 3,329 3,358 1,898 2,119 2,609 13,313
PAID SICK LEAVE
No 41% 5% 1% 2% 7% 14%
Yes 4% 4% 33% 1% 3% 7%
Personal Time Off 55% 91% 67% 96% 89% 79%
PAID HOLIDAYS
No 44% 7% 2% 9% 9% 16%
Yes 56% 93% 98% 91% 91% 84%

APPENDIX C: SURVEY RESPONSES ARIZONA’S UNKNOWN EDUCATION ISSUE 37
BENEFITS AVAILABLE TO FULL-TIME EMPLOYEES (CONTINUED)
HEALTH INSURANCE For Profit For Profit Public Other
< 4 Sites 4+ Sites Head Start Schools Nonprofit All Types
No Insurance 68% 15% 1% 6% 20% 26%
Full or Part Paid for Emp & Dep 12% 57% 50% 15% 40% 35%
Full or Part Paid for Emp Only 13% 14% 49% 74% 34% 32%
Available Unpaid 7% 13% 5% 6% 7%
DENTAL INSURANCE
No Insurance 73% 19% 2% 8% 26% 30%
Full or Part Paid for Emp & Dep 12% 54% 47% 15% 39% 34%
Full or Part Paid for Emp Only 7% 13% 39% 62% 21% 25%
Available Unpaid 7% 14% 12% 15% 14% 12%
LIFE INSURANCE
No Insurance 83% 22% 2% 10% 32% 35%
Full or Part Paid for Emp & Dep 6% 46% 41% 11% 27% 26%
Full or Part Paid for Emp Only 4% 15% 40% 67% 26% 26%
Available Unpaid 7% 17% 18% 12% 14% 13%
BENEFITS AVAILABLE TO PART-TIME EMPLOYEES
REDUCED CHILD CARE FEES
No 14% 20% 53% 29% 24% 22%
Yes 86% 80% 47% 71% 76% 78%
# of Responses 349 199 6 125 334 1,013 # Full Time Employees 1,495 806 72 1,195 2,407 5,975
UNPAID MATERNITY LEAVE
No 44% 30% 29% 14% 40% 34%
Yes 56% 70% 71% 86% 60% 66%
PAID MATERNITY LEAVE
No 90% 84% 96% 92% 89% 89%
Yes 10% 16% 4% 8% 11% 11%
RETIREMENT PLAN
No 90% 64% 36% 37% 56% 62%
Yes 10% 36% 64% 63% 44% 38%
PAY REGISTRATION FOR WORKSHOPS
No 25% 47% 8% 8% 11% 19%
Yes 75% 53% 92% 92% 89% 81%

APPENDIX C: SURVEY RESPONSES ARIZONA’S UNKNOWN EDUCATION ISSUE 38
BENEFITS AVAILABLE TO PART-TIME EMPLOYEES (CONTINUED)
PAID STAFF DEVELOPMENT DAYS For Profit For Profit Public Other
< 4 Sites 4+ Sites Head Start Schools Nonprofit All Types
No 39% 27% 10% 20% 23%
Yes 61% 73% 100% 90% 80% 77%
TUITION REIMBURSEMENT
No 75% 53% 36% 71% 72% 70%
Yes 25% 47% 64% 29% 28% 30%
PAID VACATION
No 55% 56% 46% 39% 47% 49%
Yes 4% 4% 2% 3% 3%
Personal Time Off 41% 40% 54% 59% 49% 48%
# of Responses 349 199 6 125 334 1,013 # Full Time Employees 1,495 806 72 1,195 2,407 5,975
PAID SICK LEAVE
No 58% 52% 46% 39% 48% 49%
Yes 2% 7% 2% 2% 3%
Personal Time Off 41% 40% 54% 59% 49% 48%
PAID HOLIDAYS
No 63% 58% 17% 58% 49% 55%
Yes 37% 42% 83% 42% 51% 45%
HEALTH INSURANCE
No Insurance 87% 55% 96% 79% 83% 80%
Full or Part Paid for Emp & Dep 4% 33% 4% 2% 5% 8%
Full or Part Paid for Emp Only 3% 5% 8% 5% 5%
Available Unpaid 6% 7% 11% 6% 7%
DENTAL INSURANCE
No Insurance 89% 58% 100% 79% 83% 81%
Full or Part Paid for Emp & Dep 4% 31% 2% 4% 7%
Full or Part Paid for Emp Only 2% 4% 8% 5% 4%
Available Unpaid 5% 7% 12% 8% 8%
LIFE INSURANCE
No Insurance 94% 59% 100% 82% 83% 82%
Full or Part Paid for Emp & Dep 2% 29% 1% 4% 6%
Full or Part Paid for Emp Only 0% 3% 7% 7% 5%
Available Unpaid 4% 9% 10% 6% 7%

APPENDIX C: SURVEY RESPONSES ARIZONA’S UNKNOWN EDUCATION ISSUE 39
OTHER INFORMATION
GEOGRAPHICAL DISTRIBUTION For Profit For Profit Public Other
< 4 Sites 4+ Sites Head Start Schools Nonprofit All Types
Central Valley 23% 21% 48% 16% 25% 23%
East Valley 28% 36% 3% 15% 23% 26%
West Valley 10% 19% 3% 13% 11% 12%
Pima County 16% 13% 7% 15% 20% 16%
Balance of State 23% 10% 38% 41% 21% 23%
# of Responses 454 253 29 217 412 1,365
AGE DISTRIBUTION OF CHILDREN
Only School Aged 3% 2% 17% 12% 8%
Only Younger than School Aged 19% 8% 93% 56% 41% 31%
School Aged and Younger 78% 90% 7% 27% 47% 61%
# of Responses 454 253 29 217 412 1,365
VERIFICATION OF QUALIFICATIONS BY REVIEWING TRANSCRIPTS
Always 91% 97% 93% 95% 91% 93%
Most of the Time 5% 2% 3% 2% 6% 4%
Some of the Time 2% 0% 3% 1% 2% 2%
Hardly Ever 2% 0% 0% 1%
Other Response 0% 1% 0% 0%
Don’t Know / Refused 0% 0% 0%
# of Responses 454 253 29 217 412 1,365
TRACK PROFESSIONAL DEVELOPMENT
Always 85% 89% 97% 84% 89% 87%
Most of the Time 10% 7% 3% 9% 8% 9%
Some of the Time 4% 3% 4% 1% 3%
Hardly Ever 1% 2% 0% 0% 1%
Other Response 0% 2% 0% 1%
Don’t Know / Refused 0% 0% 0%
# of Responses 454 253 29 217 412 1,365
PARTICIPATION IN QUALITY FIRST
No 44% 27% 38% 65% 58% 48%
Yes 56% 73% 59% 35% 41% 52%
Don’t Know / Refused 3% 0% 0%
# of Responses 454 253 29 217 412 1,365

ACKNOWLEDGEMENTS
ACKNOWLEDGEMENTS
First Things First (FTF) would like to acknowledge the contributions of the following organizations and individuals, without whom this publication would not have been possible. • Arizona’s Unknown Education Issue was assembled and produced under the general direction of Dr. Amy Kemp,
Senior Director for Research and Evaluation at First Things First. • The 2012 survey, preliminary data analysis and writing used as the basis for this report were completed by
Maricopa County Research and Reporting and the Southwest Interdisciplinary Research Center at Arizona State University. Additional research and data analysis for the report were provided by FTF staff including Chief Program Officer Karen Woodhouse, Kristin Kaylor Richardson and Dr. Lisa Colling.
• We offer special thanks to the individuals whose writing talents translated the numbers to reveal what data about the early childhood workforce mean for young children and their learning. They include Dr. Kemp, Dr. Colling, Ms. Richardson and Liz Barker Alvarez of FTF.
• We gratefully acknowledge the talents of Karen Heard of Chalk Design for the final layout and design of this publication.
© 2013 Arizona Early Childhood Development and Health Board (First Things First)
4000 North Central Avenue, Suite 800 Phoenix, AZ 85012 www.azftf.gov
Permission to copy, disseminate or otherwise use the information in this publication is granted, as long as appropriate acknowledgement is given. Suggested Citation:Arizona Early Childhood Development and Health Board (First Things First). (2013). Arizona’s Unknown Education Issue: Early Learning Workforce Trends. Phoenix, AZ: First Things First.
ARIZONA’S UNKNOWN EDUCATION ISSUE 40

VISION
ALL ARIZONA’S CHILDREN ARE READY TO SUCCEED IN SCHOOL AND IN LIFE.
MISSION
FIRST THINGS FIRST IS ONE OF THE CRITICAL PARTNERS IN CREATING A FAMILY-CENTERED,
COMPREHENSIVE, COLLABORATIVE AND HIGH-QUALITY EARLY CHILDHOOD SYSTEM THAT SUPPORTS THE
DEVELOPMENT, HEALTH AND EARLY EDUCATION OF ALL ARIZONA’S CHILDREN BIRTH THROUGH AGE 5.
4000 N CENTRAL AVE, STE 800, PHOENIX, AZ 85012
WWW.AZFTF.GOV