ariel cohen / global oil & gas
DESCRIPTION
The global energy landscape is evolving at a rapid pace, reshaping long-held expectations for our energy future. The presentation will offer a global energy outlook with the emphasis on Russian oil and gas production. Dr. Cohen will provide insight into recent events in the oil and gas industries around the world. Special focus will be given to Russian near-term and long-term energy outlook, especially in the context of recent events including the increasing Sino-Russian energy cooperation, European and American sanctions, and dropping oil prices.TRANSCRIPT
Global Oil & Gas: An Overview Moscow, Russian Federation November 26, 2014
Ariel Cohen, LLB, PhD Director, Center for Energy, Natural Resources and Geopolitics (CENRG) Principal, International Market Analysis, Ltd.
© Ariel Cohen 2014. All rights reserved
Recent Events
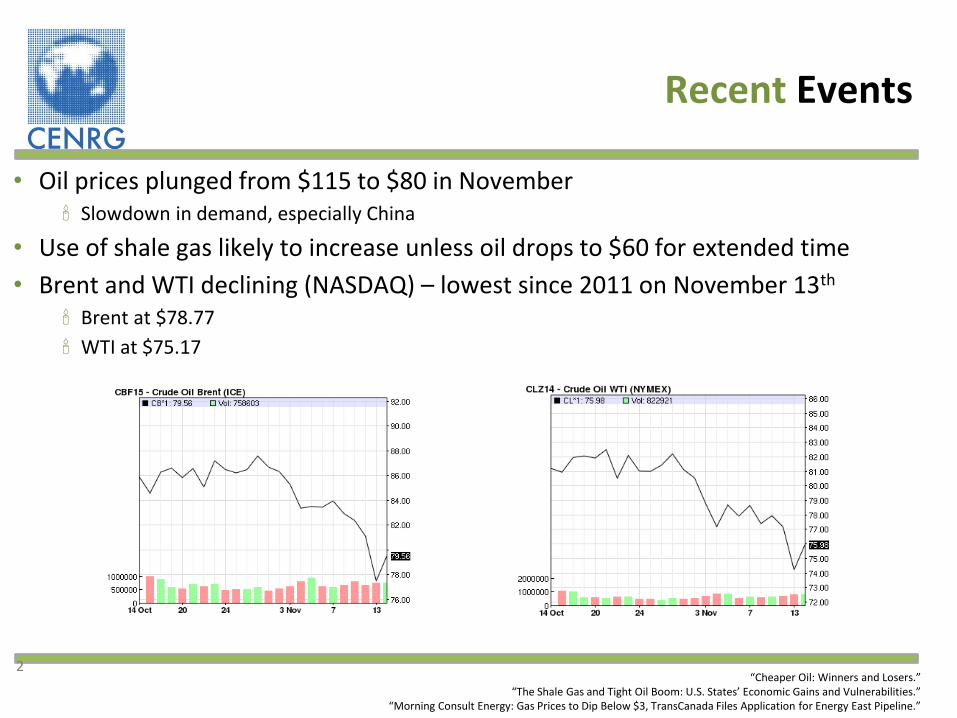
• Oil prices plunged from $115 to $80 in November Slowdown in demand, especially China
• Use of shale gas likely to increase unless oil drops to $60 for extended time
• Brent and WTI declining (NASDAQ) – lowest since 2011 on November 13th Brent at $78.77
WTI at $75.17
“Cheaper Oil: Winners and Losers.” “The Shale Gas and Tight Oil Boom: U.S. States’ Economic Gains and Vulnerabilities.”
“Morning Consult Energy: Gas Prices to Dip Below $3, TransCanada Files Application for Energy East Pipeline.”
2
“IEA’s Medium-Term Oil Market Report”
“NGVs Past & Prologue Lessons Learned to Create Deployment Strategies for Commercializing NGVs”
Global EV Outlook: Understanding the Electric Vehicle Landscape to 2020
Oil: General Outlook
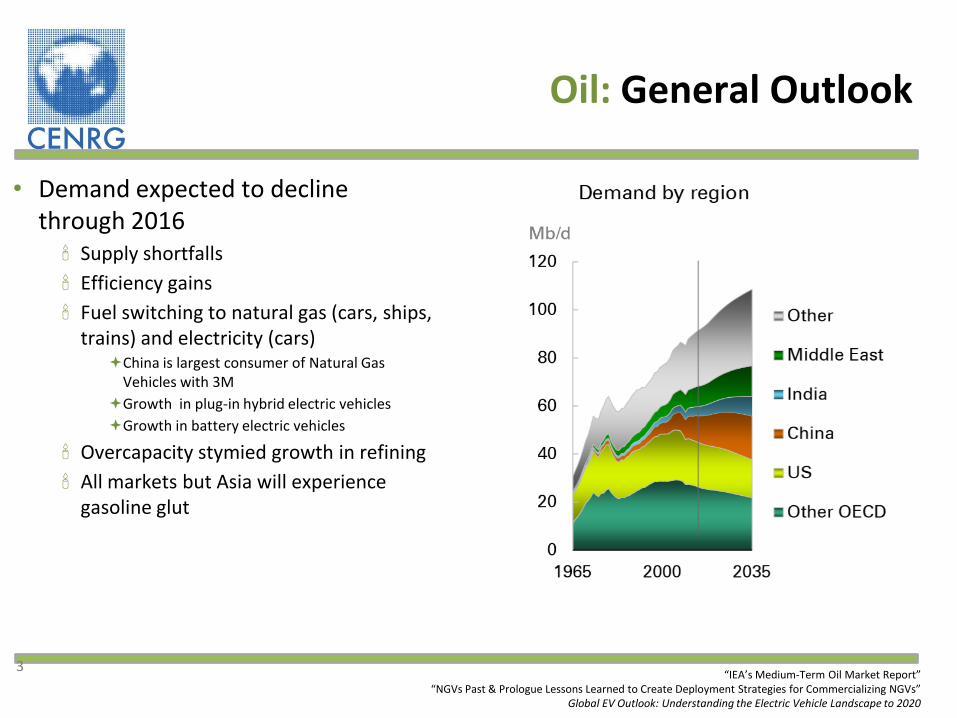
• Demand expected to decline through 2016 Supply shortfalls
Efficiency gains
Fuel switching to natural gas (cars, ships, trains) and electricity (cars) China is largest consumer of Natural Gas
Vehicles with 3M
Growth in plug-in hybrid electric vehicles
Growth in battery electric vehicles
Overcapacity stymied growth in refining
All markets but Asia will experience gasoline glut
3
Gas: General Outlook
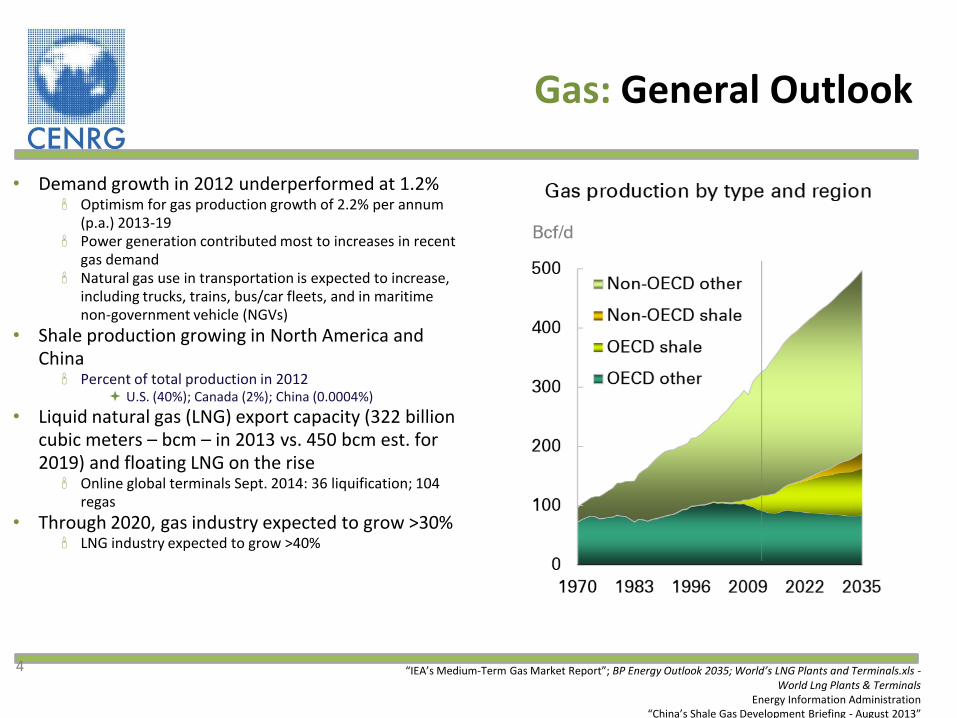
• Demand growth in 2012 underperformed at 1.2% Optimism for gas production growth of 2.2% per annum
(p.a.) 2013-19 Power generation contributed most to increases in recent
gas demand Natural gas use in transportation is expected to increase,
including trucks, trains, bus/car fleets, and in maritime non-government vehicle (NGVs)
• Shale production growing in North America and China Percent of total production in 2012
U.S. (40%); Canada (2%); China (0.0004%)
• Liquid natural gas (LNG) export capacity (322 billion cubic meters – bcm – in 2013 vs. 450 bcm est. for 2019) and floating LNG on the rise Online global terminals Sept. 2014: 36 liquification; 104
regas
• Through 2020, gas industry expected to grow >30% LNG industry expected to grow >40%
4 “IEA’s Medium-Term Gas Market Report”; BP Energy Outlook 2035; World’s LNG Plants and Terminals.xls - World Lng Plants & Terminals
Energy Information Administration
“China’s Shale Gas Development Briefing - August 2013”
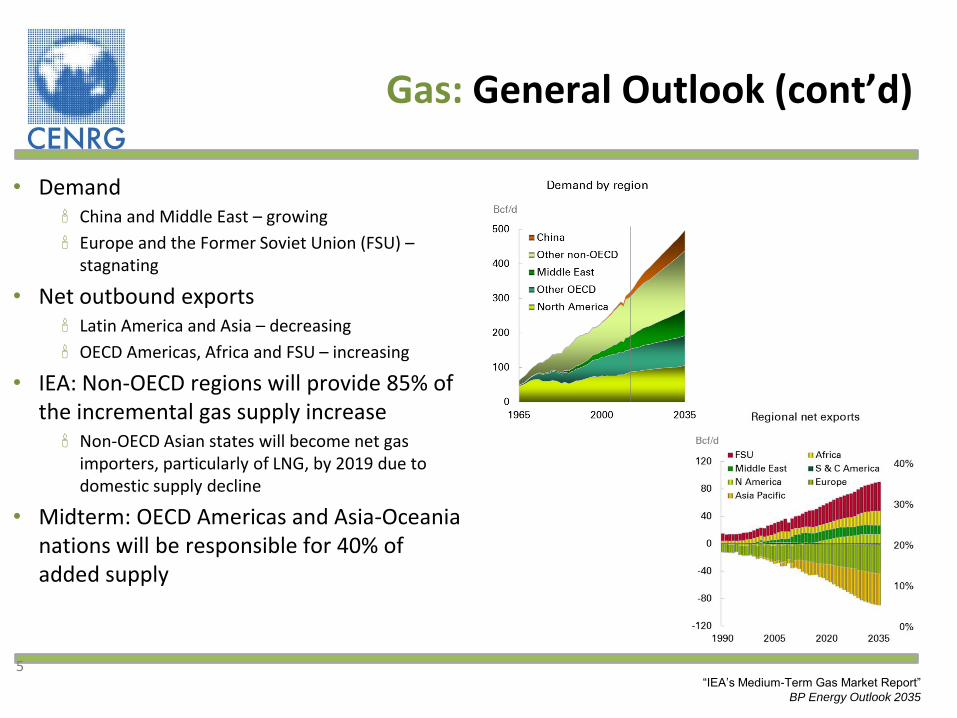
Gas: General Outlook (cont’d)
• Demand China and Middle East – growing
Europe and the Former Soviet Union (FSU) – stagnating
• Net outbound exports Latin America and Asia – decreasing
OECD Americas, Africa and FSU – increasing
• IEA: Non-OECD regions will provide 85% of the incremental gas supply increase Non-OECD Asian states will become net gas
importers, particularly of LNG, by 2019 due to domestic supply decline
• Midterm: OECD Americas and Asia-Oceania nations will be responsible for 40% of added supply
5 “IEA’s Medium-Term Gas Market Report”
BP Energy Outlook 2035
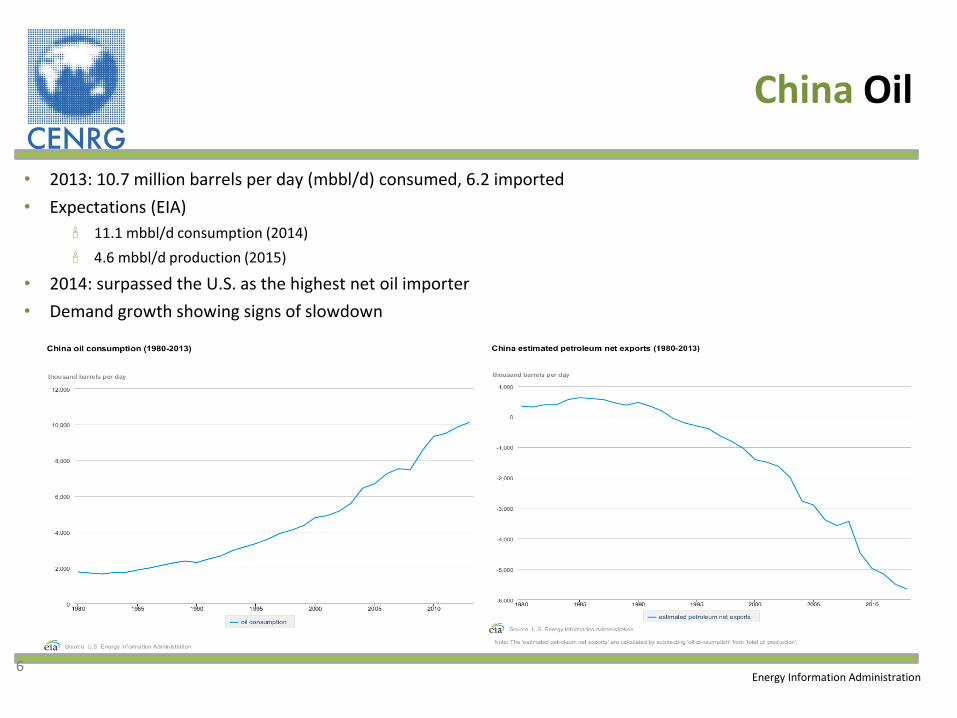
China Oil
• 2013: 10.7 million barrels per day (mbbl/d) consumed, 6.2 imported
• Expectations (EIA)
11.1 mbbl/d consumption (2014)
4.6 mbbl/d production (2015)
• 2014: surpassed the U.S. as the highest net oil importer
• Demand growth showing signs of slowdown
Energy Information Administration 6
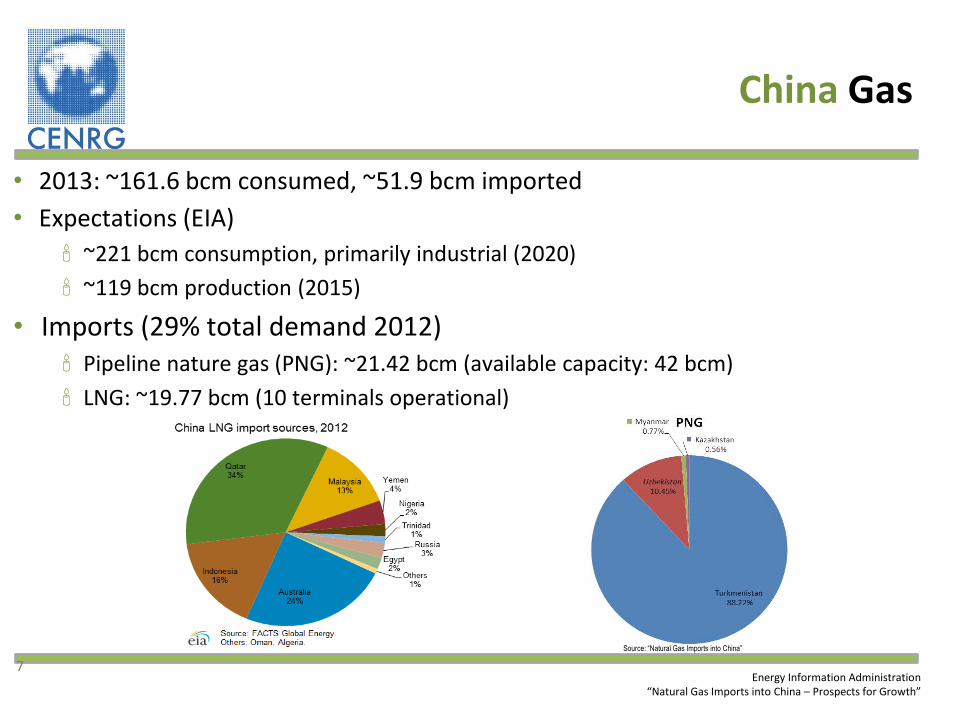
China Gas
• 2013: ~161.6 bcm consumed, ~51.9 bcm imported
• Expectations (EIA)
~221 bcm consumption, primarily industrial (2020)
~119 bcm production (2015)
• Imports (29% total demand 2012) Pipeline nature gas (PNG): ~21.42 bcm (available capacity: 42 bcm)
LNG: ~19.77 bcm (10 terminals operational)
Energy Information Administration
“Natural Gas Imports into China – Prospects for Growth”
7
Source: “Natural Gas Imports into China”
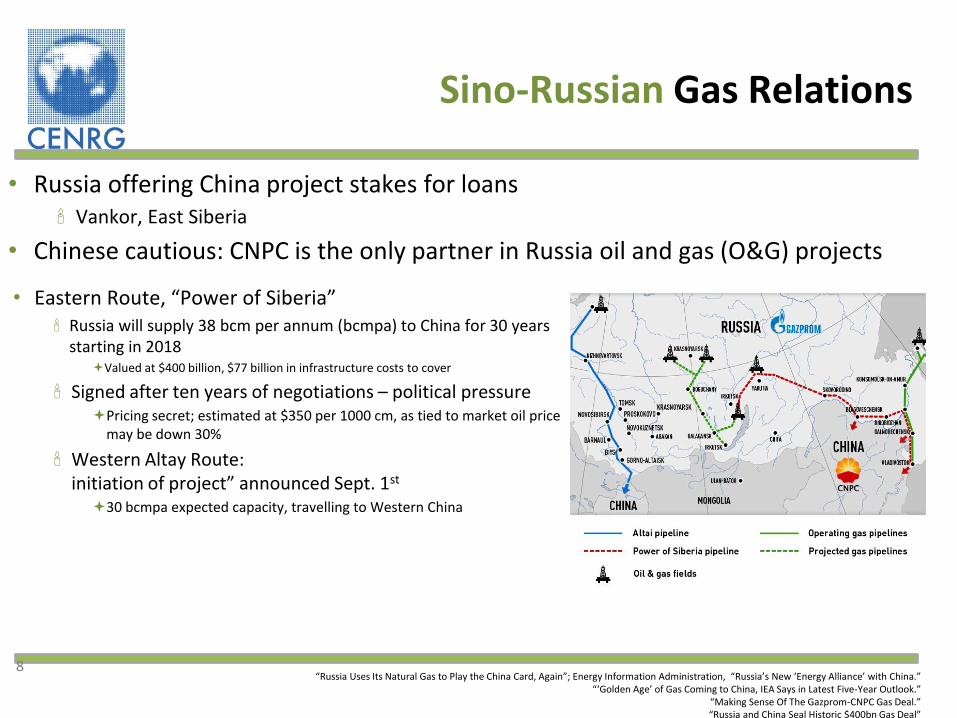
Sino-Russian Gas Relations
• Eastern Route, “Power of Siberia” Russia will supply 38 bcm per annum (bcmpa) to China for 30 years
starting in 2018 Valued at $400 billion, $77 billion in infrastructure costs to cover
Signed after ten years of negotiations – political pressure Pricing secret; estimated at $350 per 1000 cm, as tied to market oil price
may be down 30%
Western Altay Route: initiation of project” announced Sept. 1st 30 bcmpa expected capacity, travelling to Western China
8
• Russia offering China project stakes for loans Vankor, East Siberia
• Chinese cautious: CNPC is the only partner in Russia oil and gas (O&G) projects
“Russia Uses Its Natural Gas to Play the China Card, Again”; Energy Information Administration, “Russia’s New ‘Energy Alliance’ with China.”
“‘Golden Age’ of Gas Coming to China, IEA Says in Latest Five-Year Outlook.”
“Making Sense Of The Gazprom-CNPC Gas Deal.” “Russia and China Seal Historic $400bn Gas Deal”
Japan
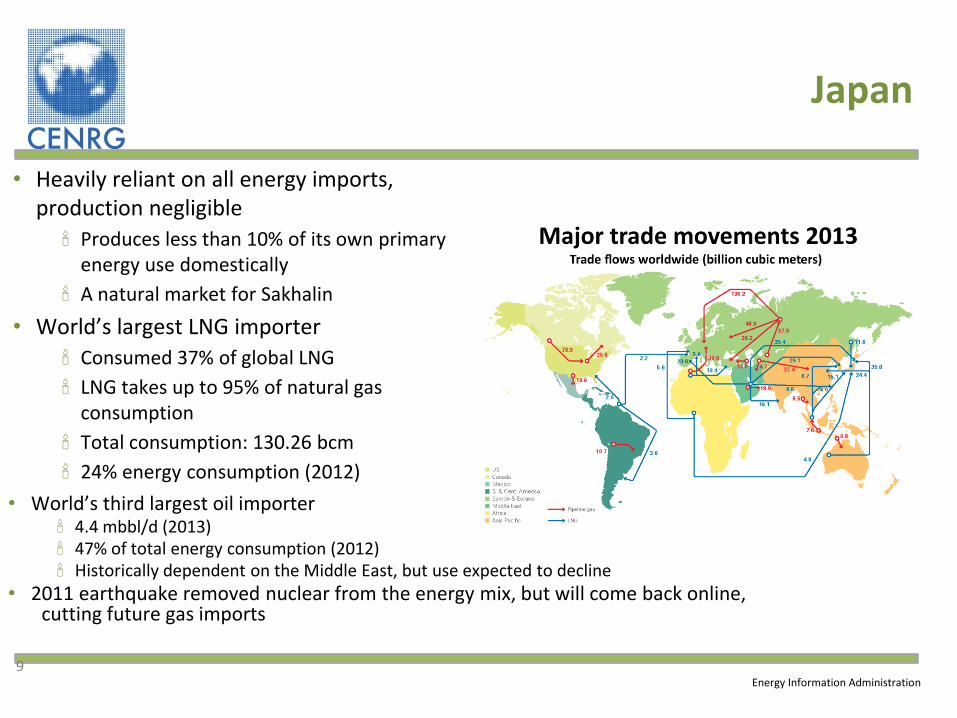
• Heavily reliant on all energy imports, production negligible
Produces less than 10% of its own primary energy use domestically
A natural market for Sakhalin
• World’s largest LNG importer
Consumed 37% of global LNG
LNG takes up to 95% of natural gas consumption
Total consumption: 130.26 bcm
24% energy consumption (2012)
9
• World’s third largest oil importer 4.4 mbbl/d (2013) 47% of total energy consumption (2012) Historically dependent on the Middle East, but use expected to decline
• 2011 earthquake removed nuclear from the energy mix, but will come back online, cutting future gas imports
Energy Information Administration
“Is There a Price War Going on Within OPEC?” ; “Oil Slump Continues as Saudi Arabia Targets U.S.”
“Oil at $80 a Barrel Muffles Forecasts for U.S. Shale Boom”
“Saudi, Kuwait Seen Curbing Oil Output at ’Opportune Time”
Energy Information Administration
Middle East Oil
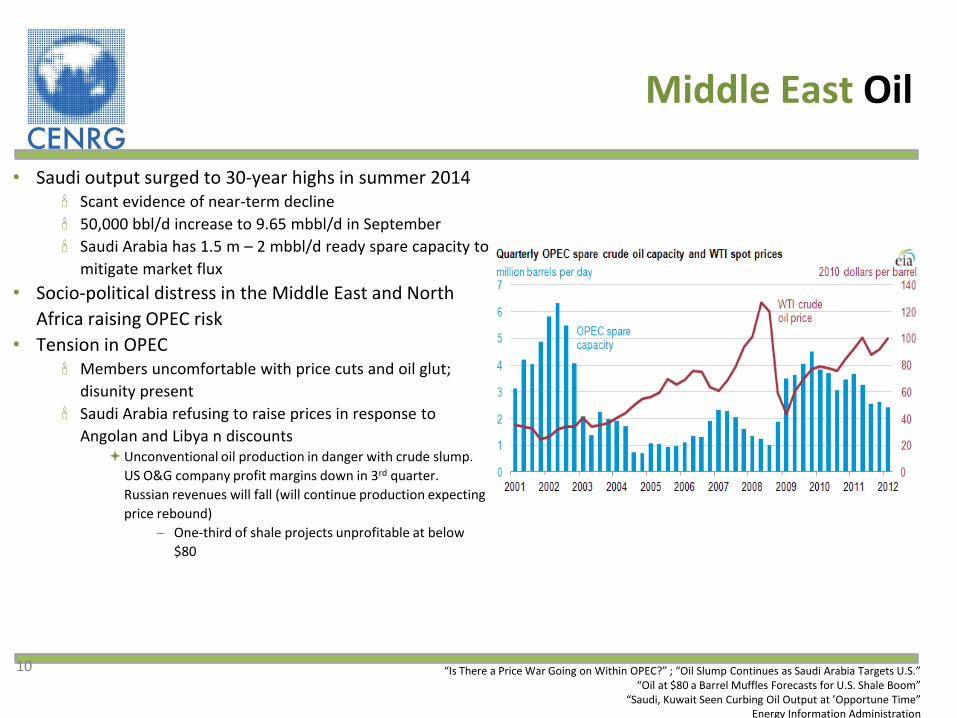
• Saudi output surged to 30-year highs in summer 2014 Scant evidence of near-term decline
50,000 bbl/d increase to 9.65 mbbl/d in September
Saudi Arabia has 1.5 m – 2 mbbl/d ready spare capacity to
mitigate market flux
• Socio-political distress in the Middle East and North
Africa raising OPEC risk
• Tension in OPEC Members uncomfortable with price cuts and oil glut;
disunity present
Saudi Arabia refusing to raise prices in response to
Angolan and Libya n discounts Unconventional oil production in danger with crude slump.
US O&G company profit margins down in 3rd quarter.
Russian revenues will fall (will continue production expecting
price rebound)
– One-third of shale projects unprofitable at below
$80
10
Middle East Oil (cont’d)
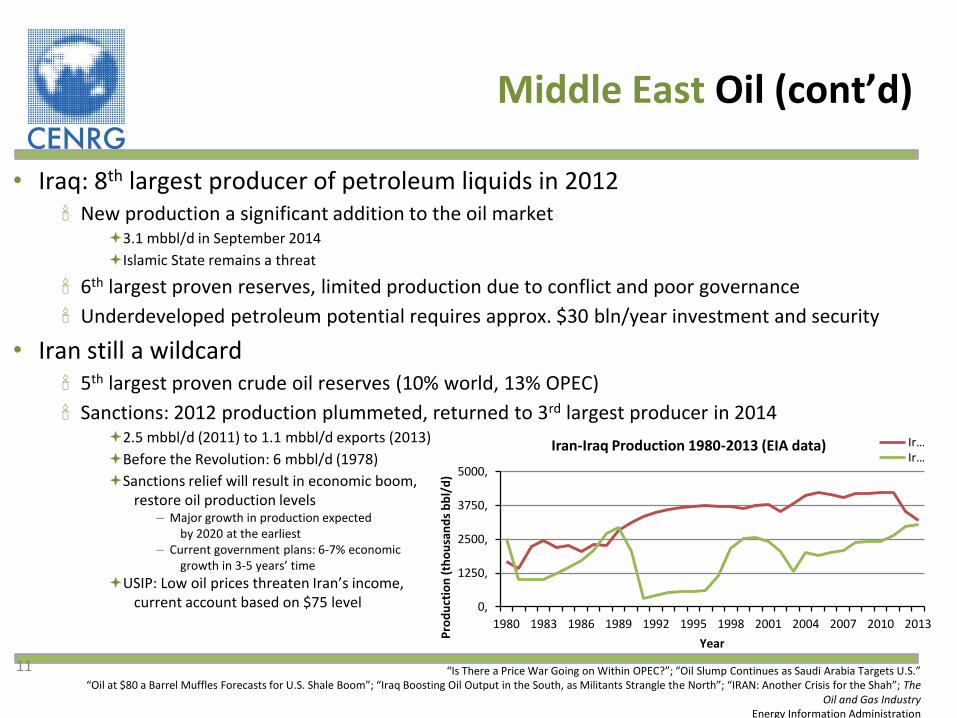
• Iraq: 8th largest producer of petroleum liquids in 2012 New production a significant addition to the oil market
3.1 mbbl/d in September 2014
Islamic State remains a threat
6th largest proven reserves, limited production due to conflict and poor governance
Underdeveloped petroleum potential requires approx. $30 bln/year investment and security
• Iran still a wildcard 5th largest proven crude oil reserves (10% world, 13% OPEC)
Sanctions: 2012 production plummeted, returned to 3rd largest producer in 2014 2.5 mbbl/d (2011) to 1.1 mbbl/d exports (2013)
Before the Revolution: 6 mbbl/d (1978)
Sanctions relief will result in economic boom, restore oil production levels
– Major growth in production expected by 2020 at the earliest – Current government plans: 6-7% economic growth in 3-5 years’ time
USIP: Low oil prices threaten Iran’s income, current account based on $75 level
11
0,
1250,
2500,
3750,
5000,
1980 1983 1986 1989 1992 1995 1998 2001 2004 2007 2010 2013
Pro
du
ctio
n (
tho
usa
nd
s b
bl/
d)
Year
Iran-Iraq Production 1980-2013 (EIA data) Ir… Ir…
“Is There a Price War Going on Within OPEC?”; “Oil Slump Continues as Saudi Arabia Targets U.S.”
“Oil at $80 a Barrel Muffles Forecasts for U.S. Shale Boom”; “Iraq Boosting Oil Output in the South, as Militants Strangle the North”; “IRAN: Another Crisis for the Shah”; The Oil and Gas Industry
Energy Information Administration
Middle East Gas
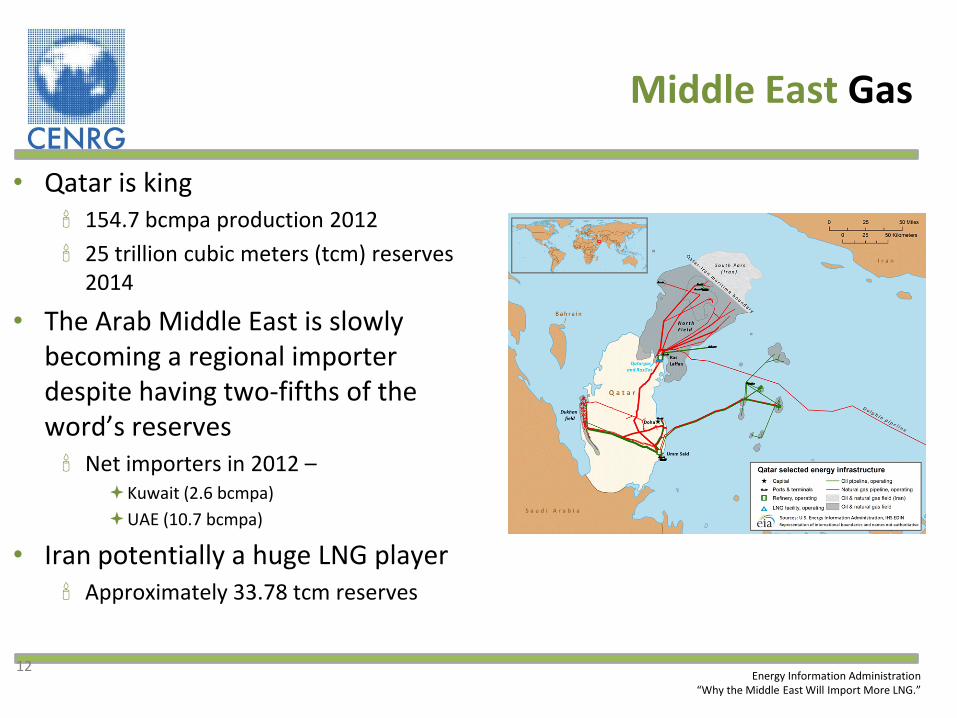
• Qatar is king 154.7 bcmpa production 2012
25 trillion cubic meters (tcm) reserves 2014
• The Arab Middle East is slowly becoming a regional importer despite having two-fifths of the word’s reserves Net importers in 2012 –
Kuwait (2.6 bcmpa)
UAE (10.7 bcmpa)
• Iran potentially a huge LNG player Approximately 33.78 tcm reserves
12 Energy Information Administration
“Why the Middle East Will Import More LNG.”
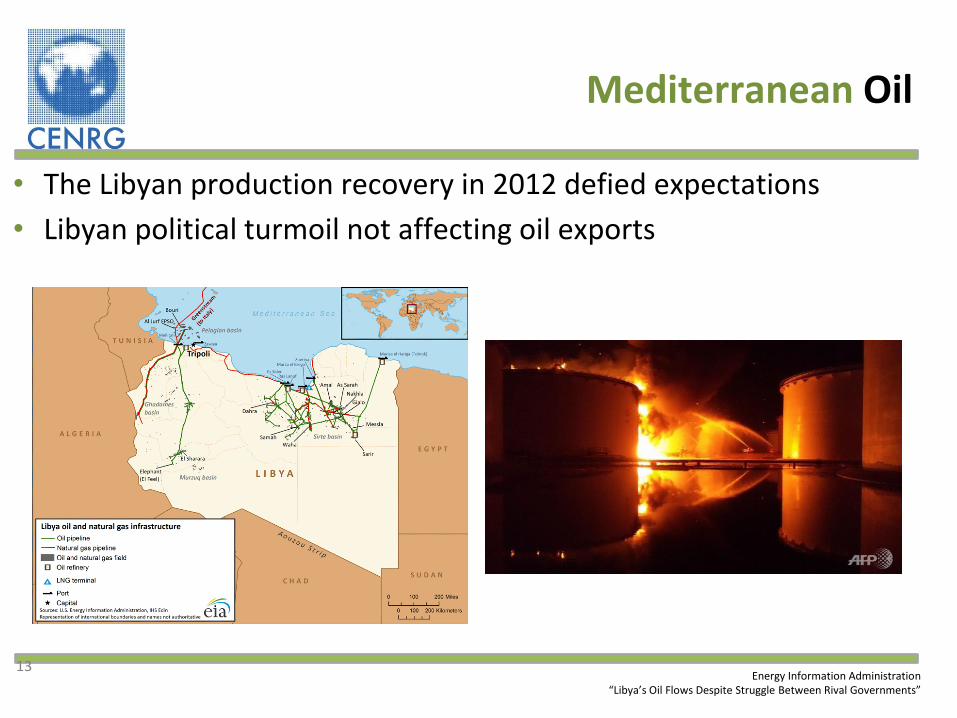
Mediterranean Oil
• The Libyan production recovery in 2012 defied expectations
• Libyan political turmoil not affecting oil exports
13 Energy Information Administration
“Libya’s Oil Flows Despite Struggle Between Rival Governments”
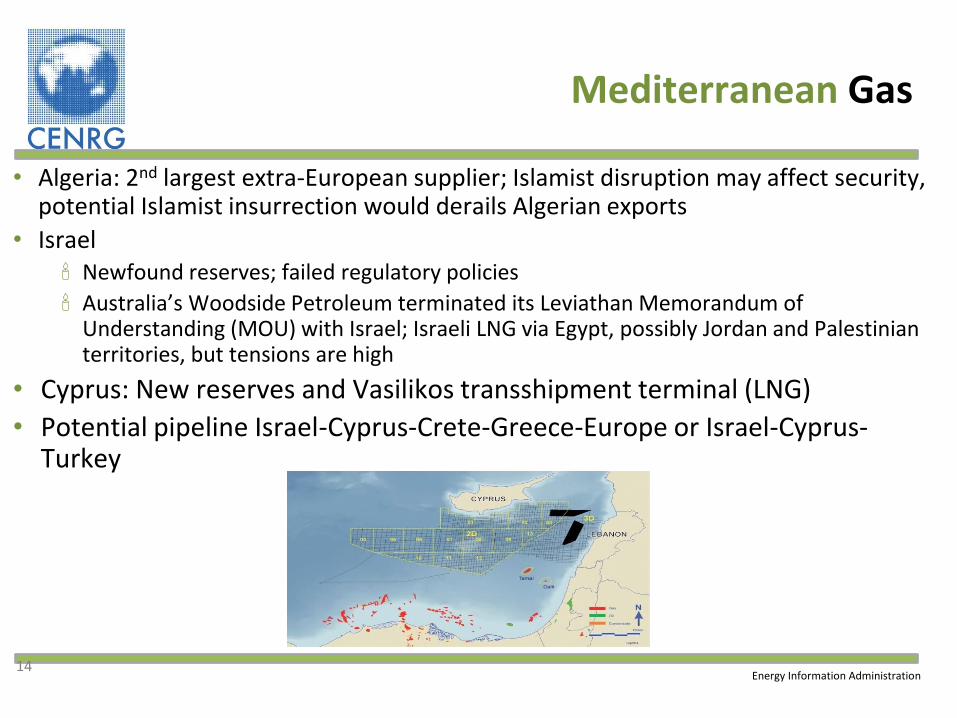
Mediterranean Gas
• Algeria: 2nd largest extra-European supplier; Islamist disruption may affect security, potential Islamist insurrection would derails Algerian exports
• Israel Newfound reserves; failed regulatory policies
Australia’s Woodside Petroleum terminated its Leviathan Memorandum of Understanding (MOU) with Israel; Israeli LNG via Egypt, possibly Jordan and Palestinian territories, but tensions are high
• Cyprus: New reserves and Vasilikos transshipment terminal (LNG)
• Potential pipeline Israel-Cyprus-Crete-Greece-Europe or Israel-Cyprus-Turkey
14 Energy Information Administration
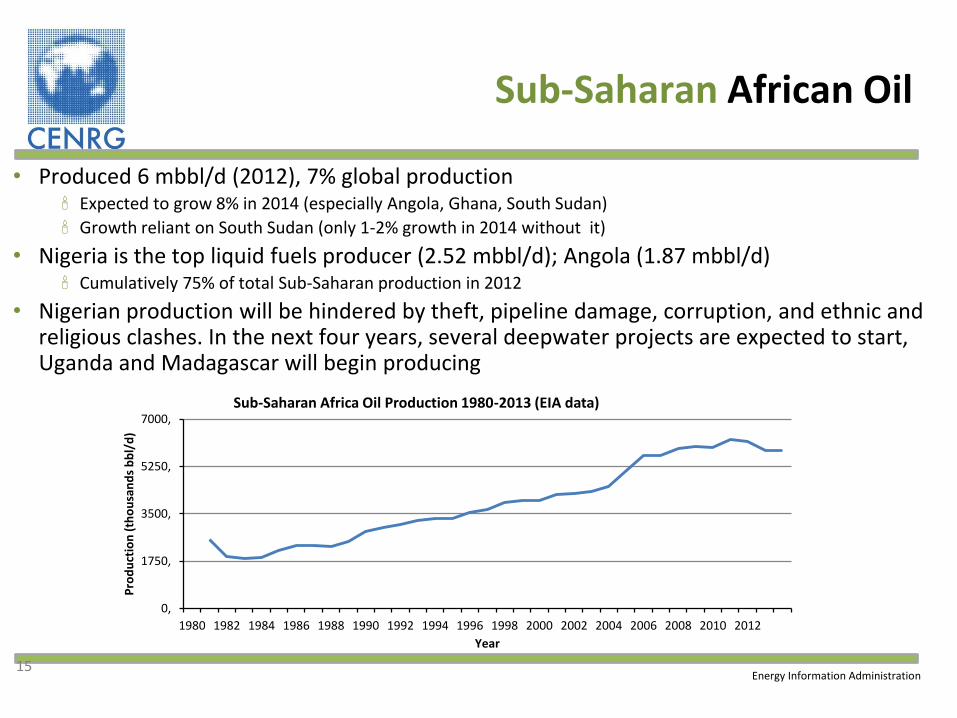
Sub-Saharan African Oil
• Produced 6 mbbl/d (2012), 7% global production Expected to grow 8% in 2014 (especially Angola, Ghana, South Sudan)
Growth reliant on South Sudan (only 1-2% growth in 2014 without it)
• Nigeria is the top liquid fuels producer (2.52 mbbl/d); Angola (1.87 mbbl/d) Cumulatively 75% of total Sub-Saharan production in 2012
• Nigerian production will be hindered by theft, pipeline damage, corruption, and ethnic and religious clashes. In the next four years, several deepwater projects are expected to start, Uganda and Madagascar will begin producing
15 Energy Information Administration
0,
1750,
3500,
5250,
7000,
1980 1982 1984 1986 1988 1990 1992 1994 1996 1998 2000 2002 2004 2006 2008 2010 2012
Pro
du
ctio
n (
tho
usa
nd
s b
bl/
d)
Year
Sub-Saharan Africa Oil Production 1980-2013 (EIA data)
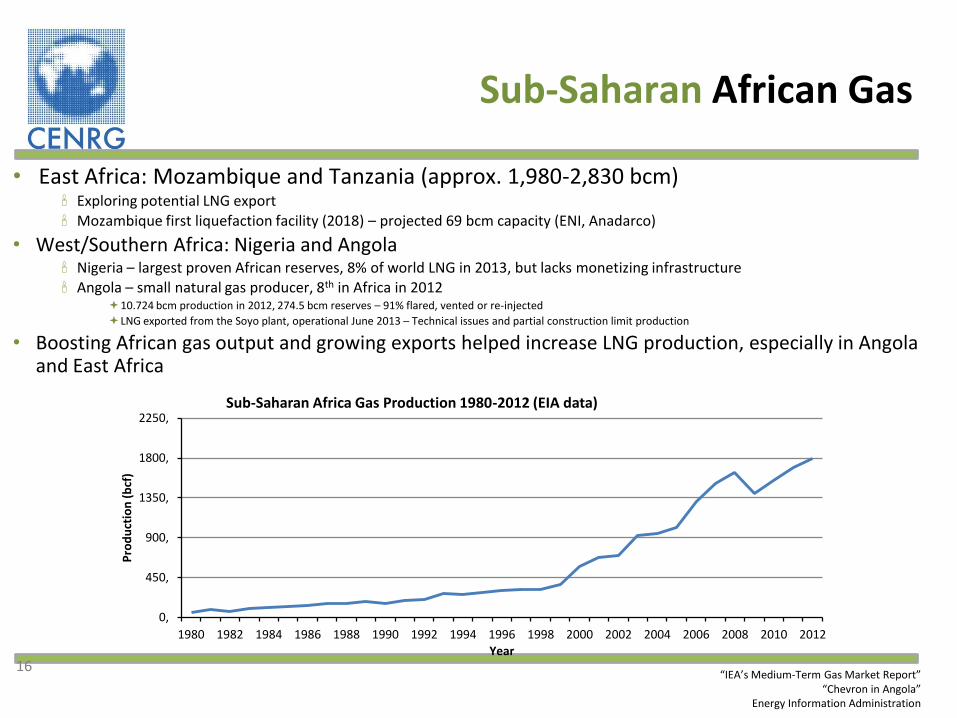
Sub-Saharan African Gas
• East Africa: Mozambique and Tanzania (approx. 1,980-2,830 bcm) Exploring potential LNG export Mozambique first liquefaction facility (2018) – projected 69 bcm capacity (ENI, Anadarco)
• West/Southern Africa: Nigeria and Angola Nigeria – largest proven African reserves, 8% of world LNG in 2013, but lacks monetizing infrastructure Angola – small natural gas producer, 8th in Africa in 2012
10.724 bcm production in 2012, 274.5 bcm reserves – 91% flared, vented or re-injected
LNG exported from the Soyo plant, operational June 2013 – Technical issues and partial construction limit production
• Boosting African gas output and growing exports helped increase LNG production, especially in Angola and East Africa
16
0,
450,
900,
1350,
1800,
2250,
1980 1982 1984 1986 1988 1990 1992 1994 1996 1998 2000 2002 2004 2006 2008 2010 2012
Pro
du
ctio
n (
bcf
)
Year
Sub-Saharan Africa Gas Production 1980-2012 (EIA data)
“IEA’s Medium-Term Gas Market Report” “Chevron in Angola”
Energy Information Administration
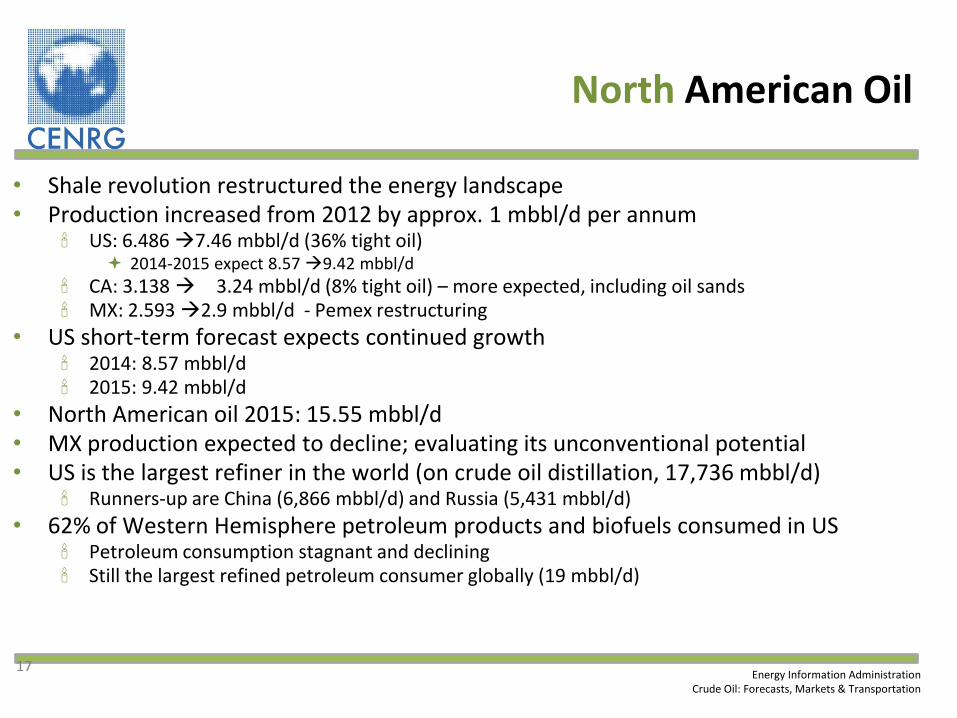
North American Oil
• Shale revolution restructured the energy landscape • Production increased from 2012 by approx. 1 mbbl/d per annum
US: 6.486 7.46 mbbl/d (36% tight oil) 2014-2015 expect 8.57 9.42 mbbl/d
CA: 3.138 3.24 mbbl/d (8% tight oil) – more expected, including oil sands MX: 2.593 2.9 mbbl/d - Pemex restructuring
• US short-term forecast expects continued growth 2014: 8.57 mbbl/d 2015: 9.42 mbbl/d
• North American oil 2015: 15.55 mbbl/d • MX production expected to decline; evaluating its unconventional potential • US is the largest refiner in the world (on crude oil distillation, 17,736 mbbl/d)
Runners-up are China (6,866 mbbl/d) and Russia (5,431 mbbl/d)
• 62% of Western Hemisphere petroleum products and biofuels consumed in US Petroleum consumption stagnant and declining Still the largest refined petroleum consumer globally (19 mbbl/d)
17 Energy Information Administration
Crude Oil: Forecasts, Markets & Transportation
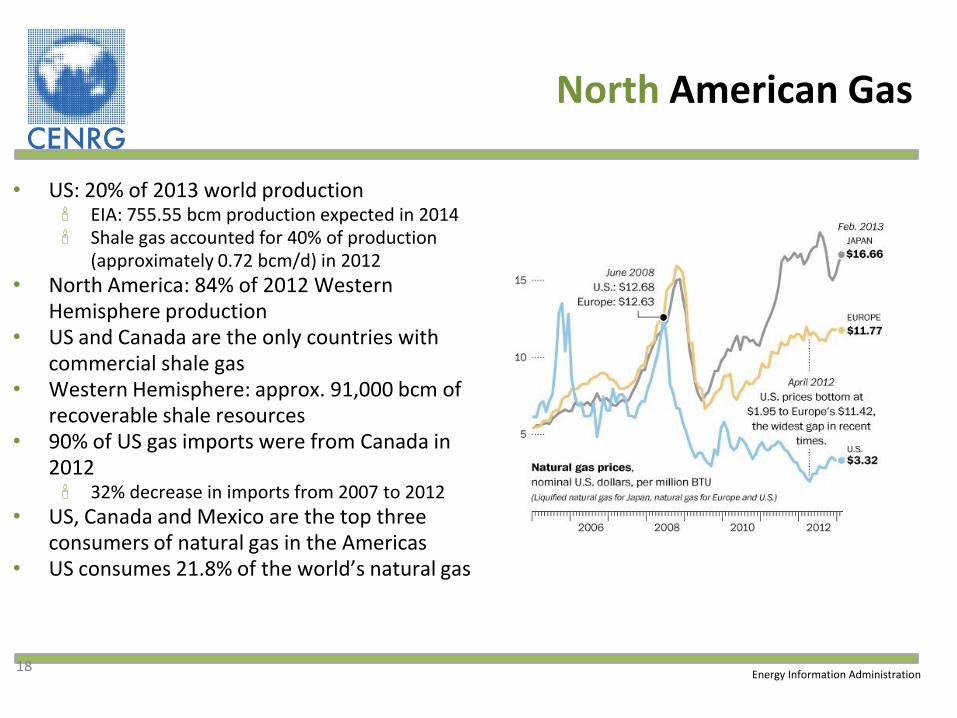
North American Gas
• US: 20% of 2013 world production EIA: 755.55 bcm production expected in 2014 Shale gas accounted for 40% of production
(approximately 0.72 bcm/d) in 2012
• North America: 84% of 2012 Western Hemisphere production
• US and Canada are the only countries with commercial shale gas
• Western Hemisphere: approx. 91,000 bcm of recoverable shale resources
• 90% of US gas imports were from Canada in 2012 32% decrease in imports from 2007 to 2012
• US, Canada and Mexico are the top three consumers of natural gas in the Americas
• US consumes 21.8% of the world’s natural gas
18 Energy Information Administration
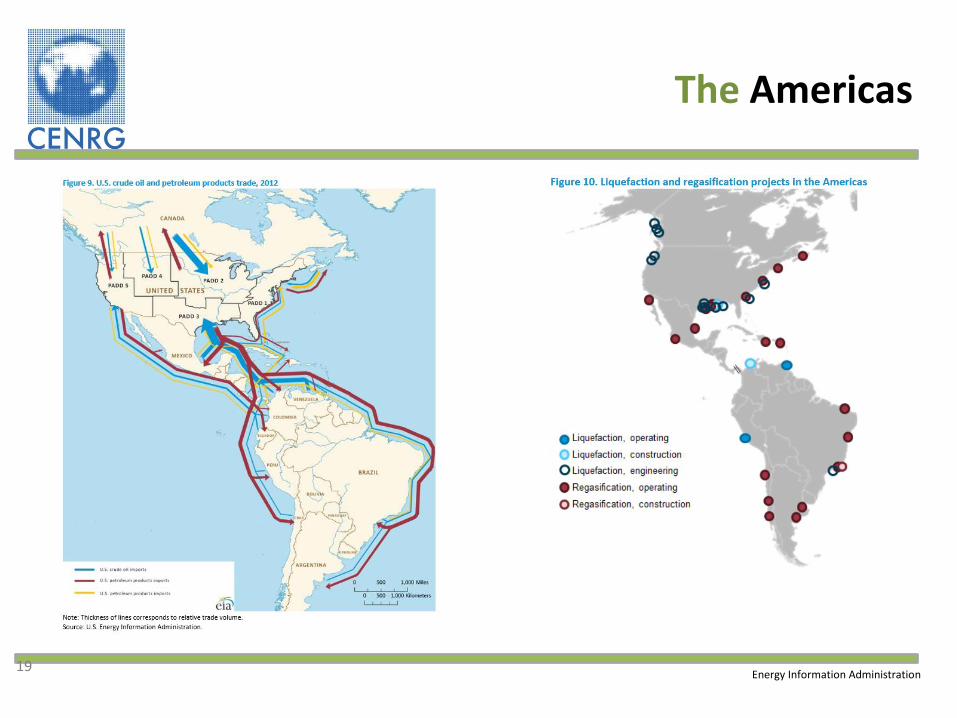
The Americas
19 Energy Information Administration
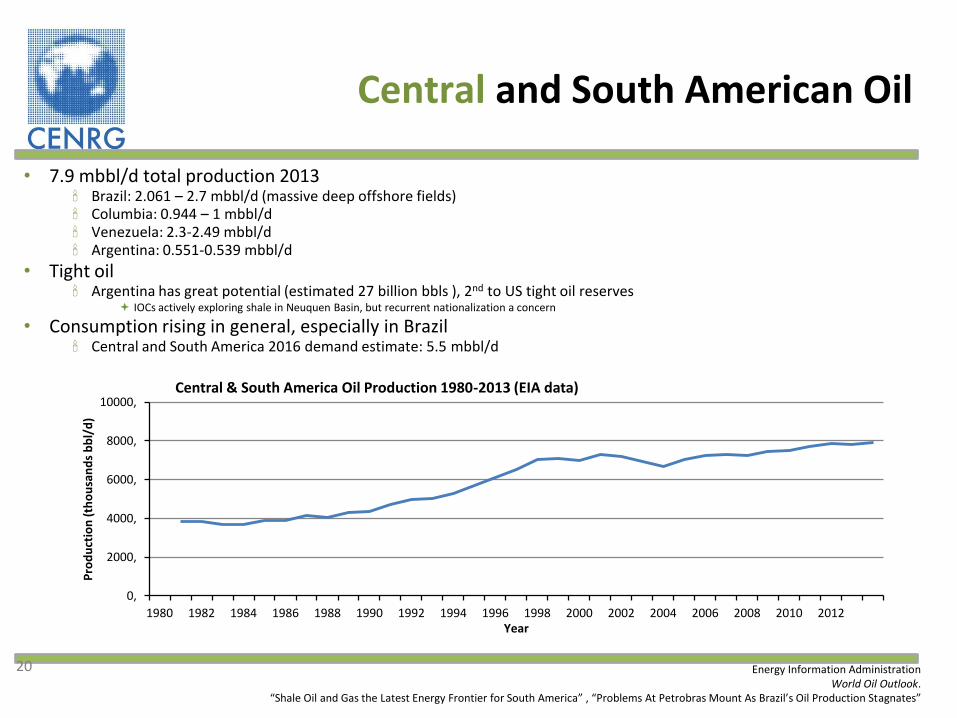
Central and South American Oil
• 7.9 mbbl/d total production 2013 Brazil: 2.061 – 2.7 mbbl/d (massive deep offshore fields) Columbia: 0.944 – 1 mbbl/d Venezuela: 2.3-2.49 mbbl/d Argentina: 0.551-0.539 mbbl/d
• Tight oil Argentina has great potential (estimated 27 billion bbls ), 2nd to US tight oil reserves
IOCs actively exploring shale in Neuquen Basin, but recurrent nationalization a concern
• Consumption rising in general, especially in Brazil Central and South America 2016 demand estimate: 5.5 mbbl/d
20 Energy Information Administration
World Oil Outlook. “Shale Oil and Gas the Latest Energy Frontier for South America” , “Problems At Petrobras Mount As Brazil’s Oil Production Stagnates”
0,
2000,
4000,
6000,
8000,
10000,
1980 1982 1984 1986 1988 1990 1992 1994 1996 1998 2000 2002 2004 2006 2008 2010 2012
Pro
du
ctio
n (
tho
usa
nd
s b
bl/
d)
Year
Central & South America Oil Production 1980-2013 (EIA data)
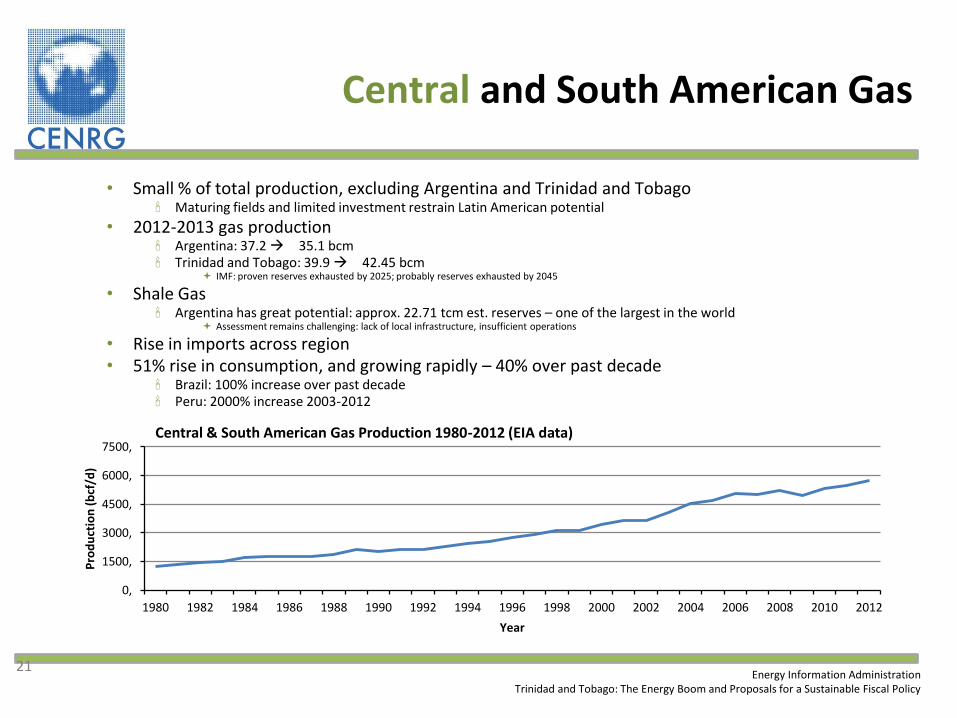
Central and South American Gas
• Small % of total production, excluding Argentina and Trinidad and Tobago Maturing fields and limited investment restrain Latin American potential
• 2012-2013 gas production Argentina: 37.2 35.1 bcm Trinidad and Tobago: 39.9 42.45 bcm
IMF: proven reserves exhausted by 2025; probably reserves exhausted by 2045
• Shale Gas Argentina has great potential: approx. 22.71 tcm est. reserves – one of the largest in the world
Assessment remains challenging: lack of local infrastructure, insufficient operations
• Rise in imports across region • 51% rise in consumption, and growing rapidly – 40% over past decade
Brazil: 100% increase over past decade Peru: 2000% increase 2003-2012
21 Energy Information Administration
Trinidad and Tobago: The Energy Boom and Proposals for a Sustainable Fiscal Policy
0,
1500,
3000,
4500,
6000,
7500,
1980 1982 1984 1986 1988 1990 1992 1994 1996 1998 2000 2002 2004 2006 2008 2010 2012
Pro
du
ctio
n (
bcf
/d)
Year
Central & South American Gas Production 1980-2012 (EIA data)
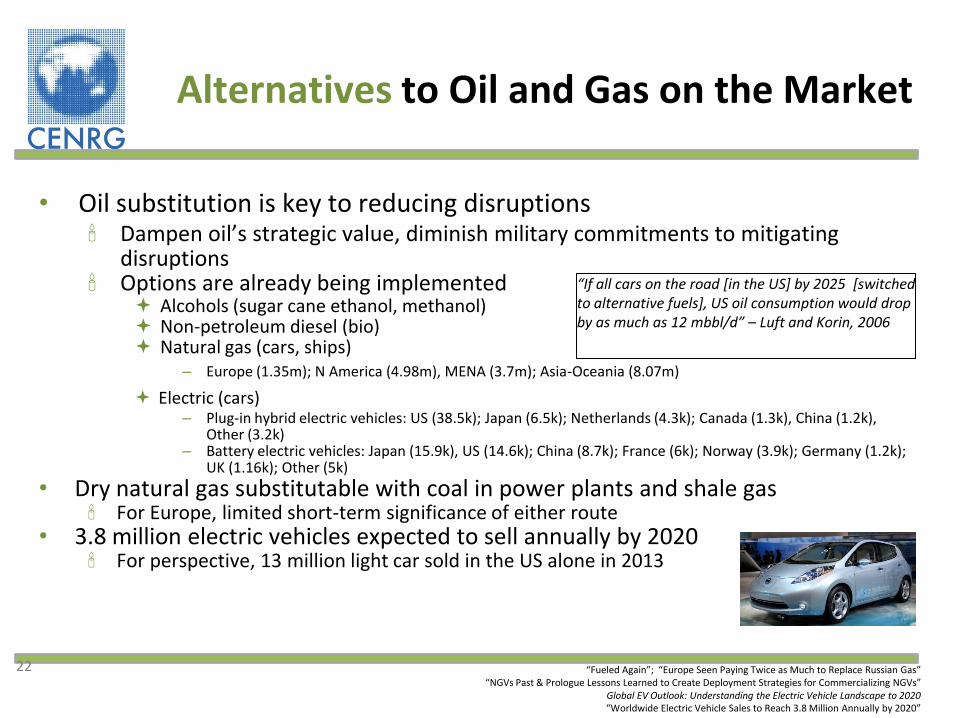
Alternatives to Oil and Gas on the Market
• Oil substitution is key to reducing disruptions Dampen oil’s strategic value, diminish military commitments to mitigating
disruptions Options are already being implemented
Alcohols (sugar cane ethanol, methanol) Non-petroleum diesel (bio) Natural gas (cars, ships)
– Europe (1.35m); N America (4.98m), MENA (3.7m); Asia-Oceania (8.07m)
Electric (cars) – Plug-in hybrid electric vehicles: US (38.5k); Japan (6.5k); Netherlands (4.3k); Canada (1.3k), China (1.2k),
Other (3.2k) – Battery electric vehicles: Japan (15.9k), US (14.6k); China (8.7k); France (6k); Norway (3.9k); Germany (1.2k);
UK (1.16k); Other (5k)
• Dry natural gas substitutable with coal in power plants and shale gas For Europe, limited short-term significance of either route
• 3.8 million electric vehicles expected to sell annually by 2020 For perspective, 13 million light car sold in the US alone in 2013
22 “Fueled Again”; “Europe Seen Paying Twice as Much to Replace Russian Gas” “NGVs Past & Prologue Lessons Learned to Create Deployment Strategies for Commercializing NGVs”
Global EV Outlook: Understanding the Electric Vehicle Landscape to 2020
“Worldwide Electric Vehicle Sales to Reach 3.8 Million Annually by 2020”
“If all cars on the road [in the US] by 2025 [switched to alternative fuels], US oil consumption would drop by as much as 12 mbbl/d” – Luft and Korin, 2006
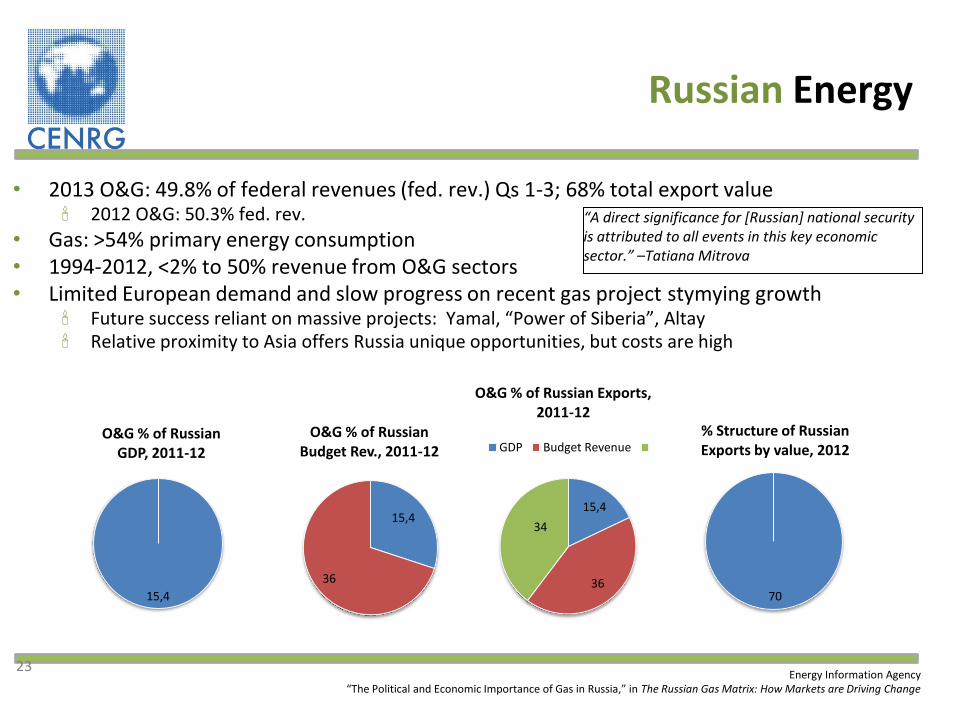
15,4
36
34
O&G % of Russian Exports, 2011-12
GDP Budget Revenue
70
% Structure of Russian Exports by value, 2012
Russian Energy
23 Energy Information Agency
“The Political and Economic Importance of Gas in Russia,” in The Russian Gas Matrix: How Markets are Driving Change
“A direct significance for [Russian] national security is attributed to all events in this key economic sector.” –Tatiana Mitrova
• 2013 O&G: 49.8% of federal revenues (fed. rev.) Qs 1-3; 68% total export value 2012 O&G: 50.3% fed. rev.
• Gas: >54% primary energy consumption • 1994-2012, <2% to 50% revenue from O&G sectors • Limited European demand and slow progress on recent gas project stymying growth
Future success reliant on massive projects: Yamal, “Power of Siberia”, Altay Relative proximity to Asia offers Russia unique opportunities, but costs are high
15,4
O&G % of Russian GDP, 2011-12
15,4
36
O&G % of Russian Budget Rev., 2011-12
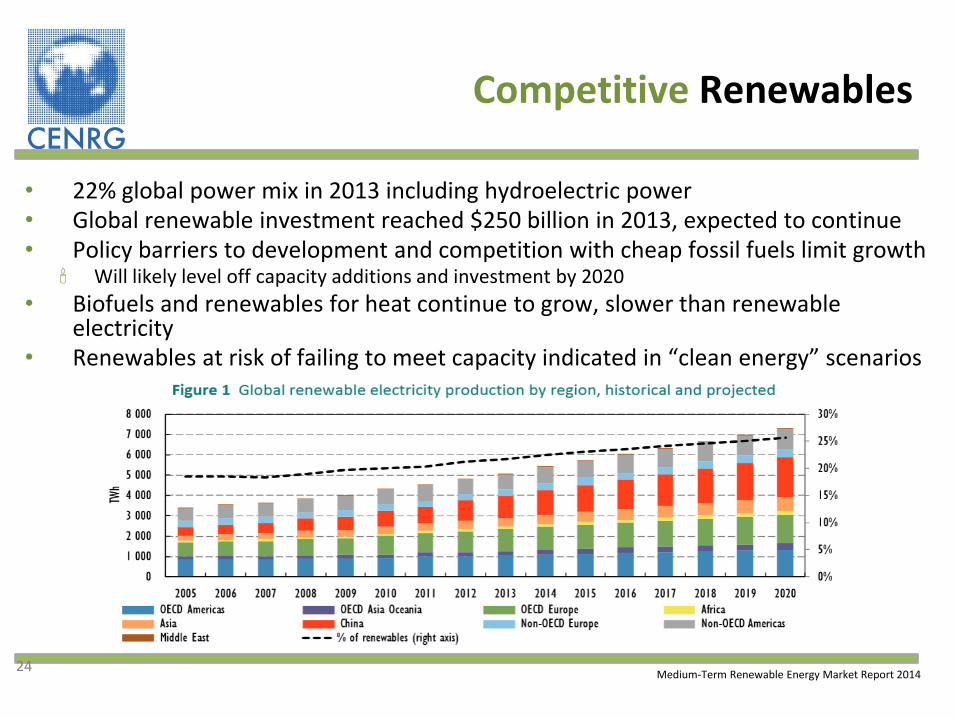
Competitive Renewables
• 22% global power mix in 2013 including hydroelectric power • Global renewable investment reached $250 billion in 2013, expected to continue • Policy barriers to development and competition with cheap fossil fuels limit growth Will likely level off capacity additions and investment by 2020
• Biofuels and renewables for heat continue to grow, slower than renewable electricity
• Renewables at risk of failing to meet capacity indicated in “clean energy” scenarios
24 Medium-Term Renewable Energy Market Report 2014
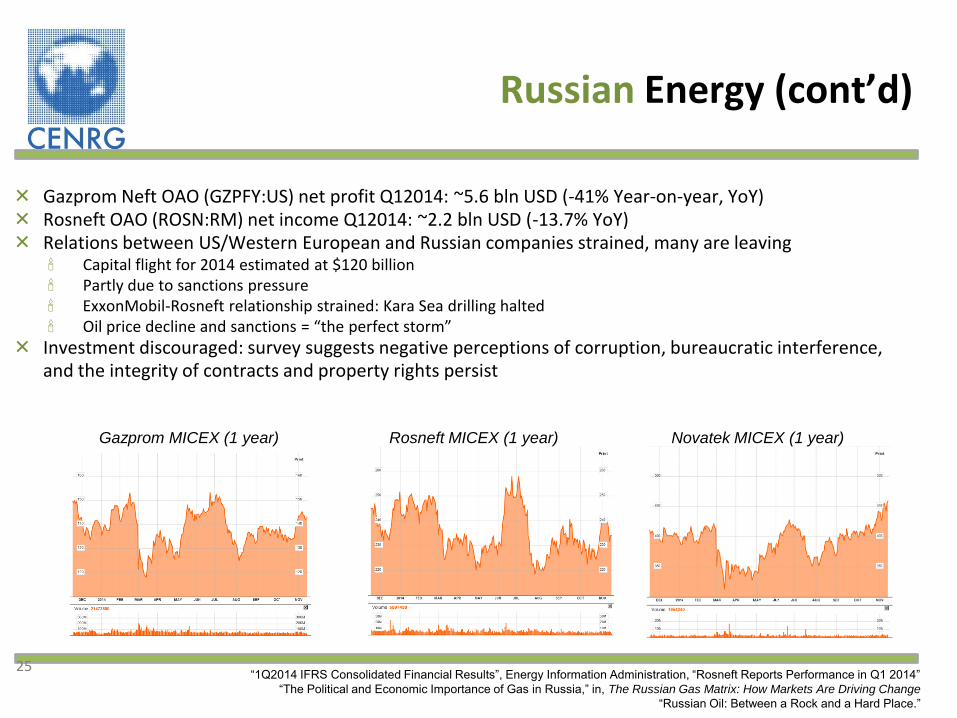
Gazprom Neft OAO (GZPFY:US) net profit Q12014: ~5.6 bln USD (-41% Year-on-year, YoY) Rosneft OAO (ROSN:RM) net income Q12014: ~2.2 bln USD (-13.7% YoY) Relations between US/Western European and Russian companies strained, many are leaving Capital flight for 2014 estimated at $120 billion Partly due to sanctions pressure ExxonMobil-Rosneft relationship strained: Kara Sea drilling halted Oil price decline and sanctions = “the perfect storm”
Investment discouraged: survey suggests negative perceptions of corruption, bureaucratic interference, and the integrity of contracts and property rights persist
Russian Energy (cont’d)
25
Gazprom MICEX (1 year) Rosneft MICEX (1 year) Novatek MICEX (1 year)
“1Q2014 IFRS Consolidated Financial Results”, Energy Information Administration, “Rosneft Reports Performance in Q1 2014”
“The Political and Economic Importance of Gas in Russia,” in, The Russian Gas Matrix: How Markets Are Driving Change
“Russian Oil: Between a Rock and a Hard Place.”
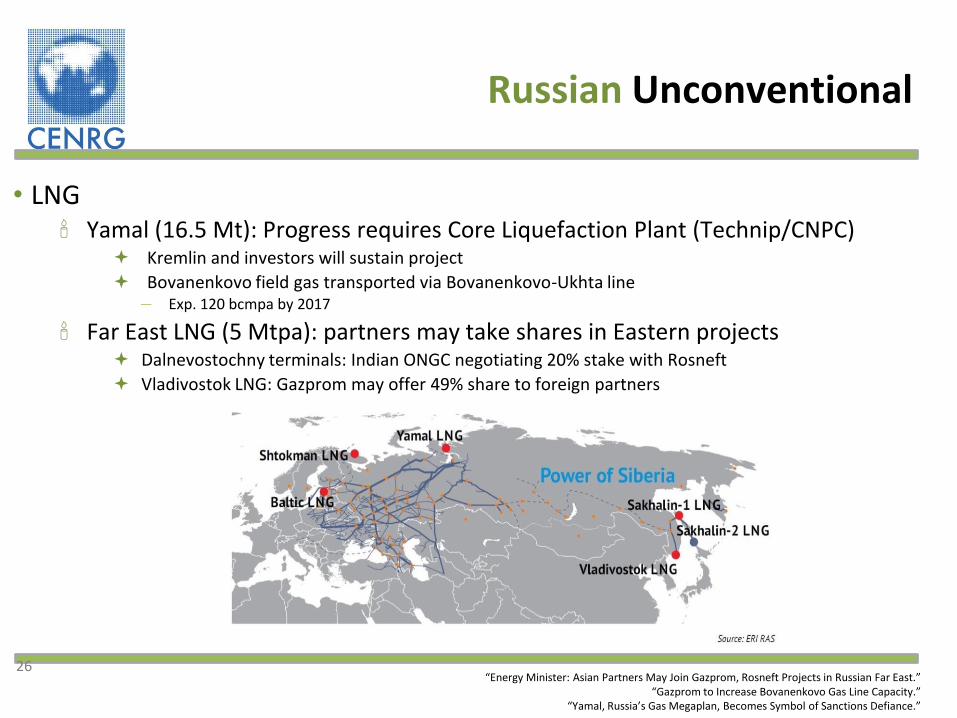
• LNG Yamal (16.5 Mt): Progress requires Core Liquefaction Plant (Technip/CNPC)
Kremlin and investors will sustain project
Bovanenkovo field gas transported via Bovanenkovo-Ukhta line ― Exp. 120 bcmpa by 2017
Far East LNG (5 Mtpa): partners may take shares in Eastern projects Dalnevostochny terminals: Indian ONGC negotiating 20% stake with Rosneft
Vladivostok LNG: Gazprom may offer 49% share to foreign partners
Russian Unconventional
26 “Energy Minister: Asian Partners May Join Gazprom, Rosneft Projects in Russian Far East.”
“Gazprom to Increase Bovanenkovo Gas Line Capacity.”
“Yamal, Russia’s Gas Megaplan, Becomes Symbol of Sanctions Defiance.”
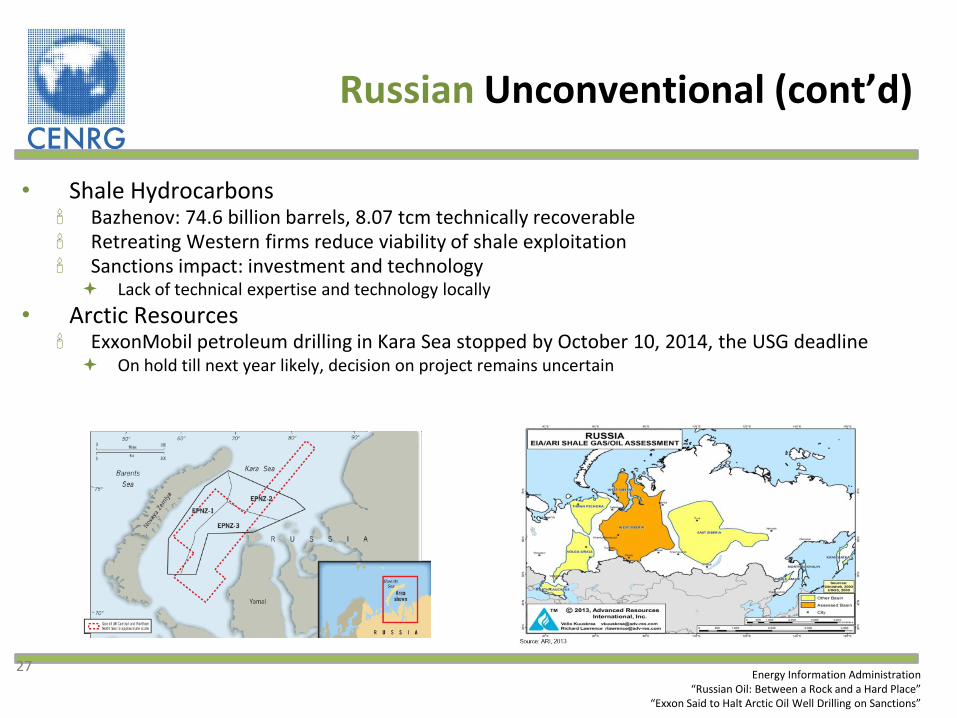
• Shale Hydrocarbons Bazhenov: 74.6 billion barrels, 8.07 tcm technically recoverable Retreating Western firms reduce viability of shale exploitation Sanctions impact: investment and technology Lack of technical expertise and technology locally
• Arctic Resources ExxonMobil petroleum drilling in Kara Sea stopped by October 10, 2014, the USG deadline On hold till next year likely, decision on project remains uncertain
Russian Unconventional (cont’d)
27 Energy Information Administration
“Russian Oil: Between a Rock and a Hard Place”
“Exxon Said to Halt Arctic Oil Well Drilling on Sanctions”
Economic Outlook for Russia
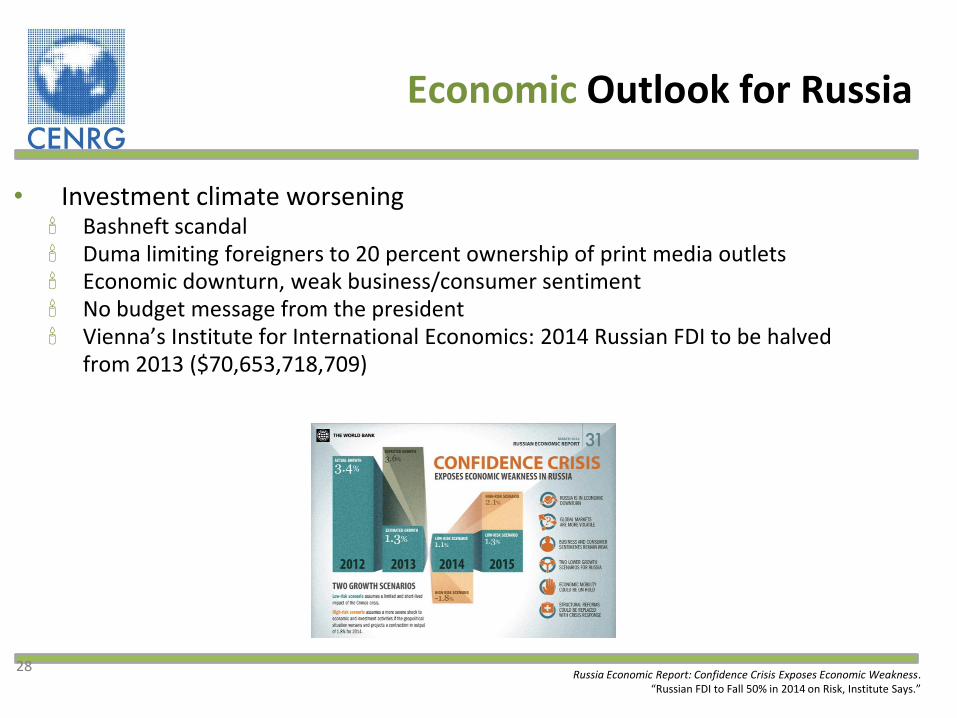
• Investment climate worsening Bashneft scandal Duma limiting foreigners to 20 percent ownership of print media outlets Economic downturn, weak business/consumer sentiment No budget message from the president Vienna’s Institute for International Economics: 2014 Russian FDI to be halved
from 2013 ($70,653,718,709)
28 Russia Economic Report: Confidence Crisis Exposes Economic Weakness.
“Russian FDI to Fall 50% in 2014 on Risk, Institute Says.”
Economic Outlook for Russia (cont’d)
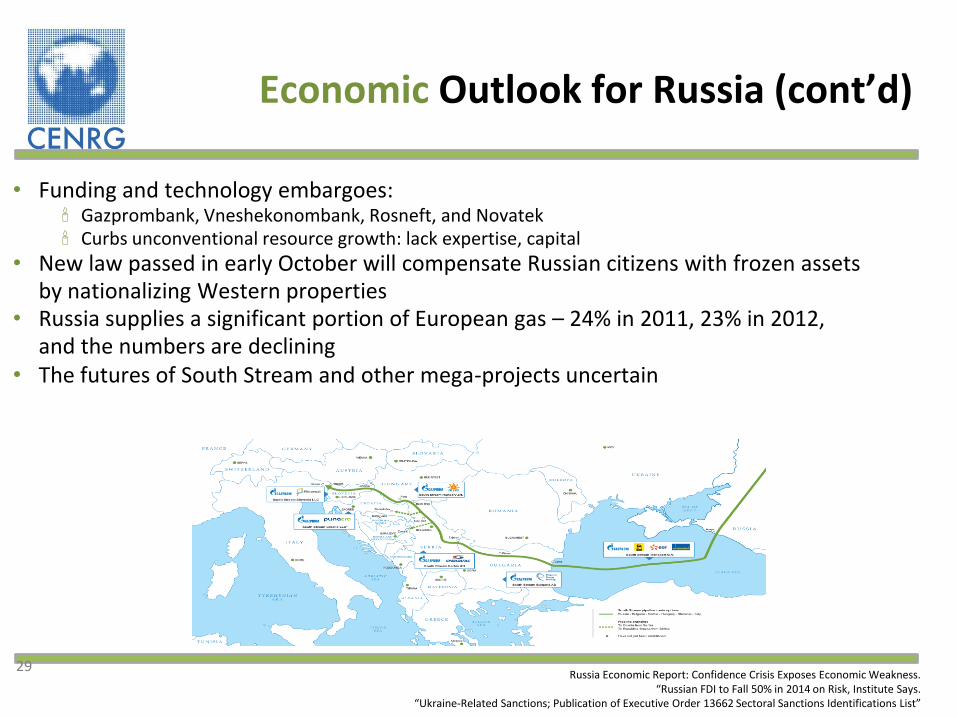
• Funding and technology embargoes: Gazprombank, Vneshekonombank, Rosneft, and Novatek Curbs unconventional resource growth: lack expertise, capital
• New law passed in early October will compensate Russian citizens with frozen assets by nationalizing Western properties
• Russia supplies a significant portion of European gas – 24% in 2011, 23% in 2012, and the numbers are declining
• The futures of South Stream and other mega-projects uncertain
29 Russia Economic Report: Confidence Crisis Exposes Economic Weakness.
“Russian FDI to Fall 50% in 2014 on Risk, Institute Says. “Ukraine-Related Sanctions; Publication of Executive Order 13662 Sectoral Sanctions Identifications List”
European Energy Outlook
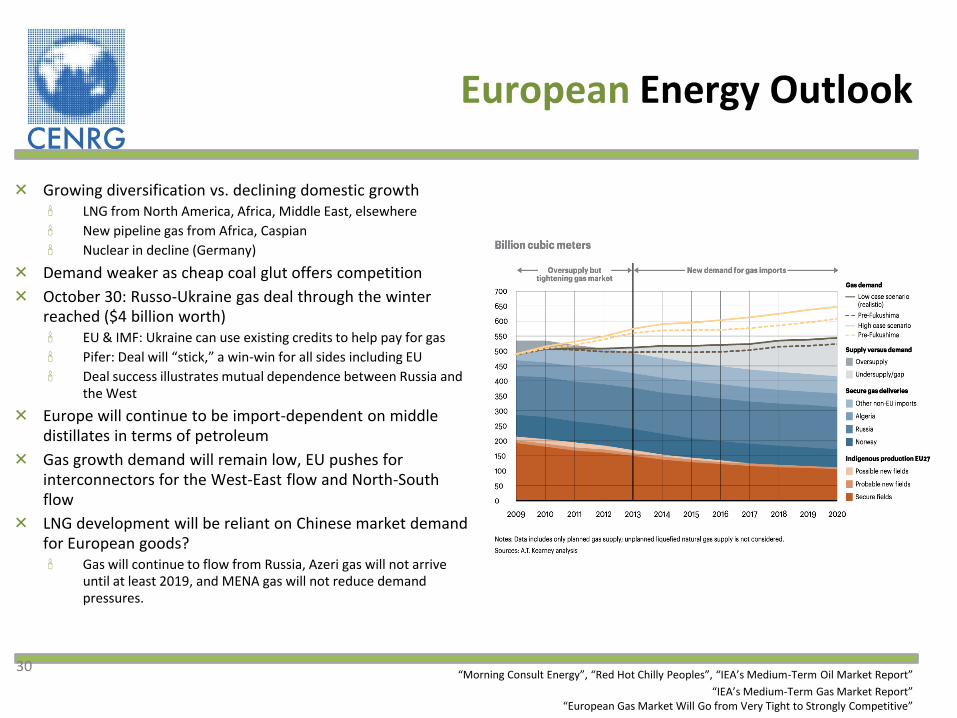
Growing diversification vs. declining domestic growth LNG from North America, Africa, Middle East, elsewhere
New pipeline gas from Africa, Caspian
Nuclear in decline (Germany)
Demand weaker as cheap coal glut offers competition
October 30: Russo-Ukraine gas deal through the winter reached ($4 billion worth) EU & IMF: Ukraine can use existing credits to help pay for gas
Pifer: Deal will “stick,” a win-win for all sides including EU
Deal success illustrates mutual dependence between Russia and the West
Europe will continue to be import-dependent on middle distillates in terms of petroleum
Gas growth demand will remain low, EU pushes for interconnectors for the West-East flow and North-South flow
LNG development will be reliant on Chinese market demand for European goods? Gas will continue to flow from Russia, Azeri gas will not arrive
until at least 2019, and MENA gas will not reduce demand pressures.
30 “Morning Consult Energy”, “Red Hot Chilly Peoples”, “IEA’s Medium-Term Oil Market Report”
“IEA’s Medium-Term Gas Market Report”
“European Gas Market Will Go from Very Tight to Strongly Competitive”
European Shale
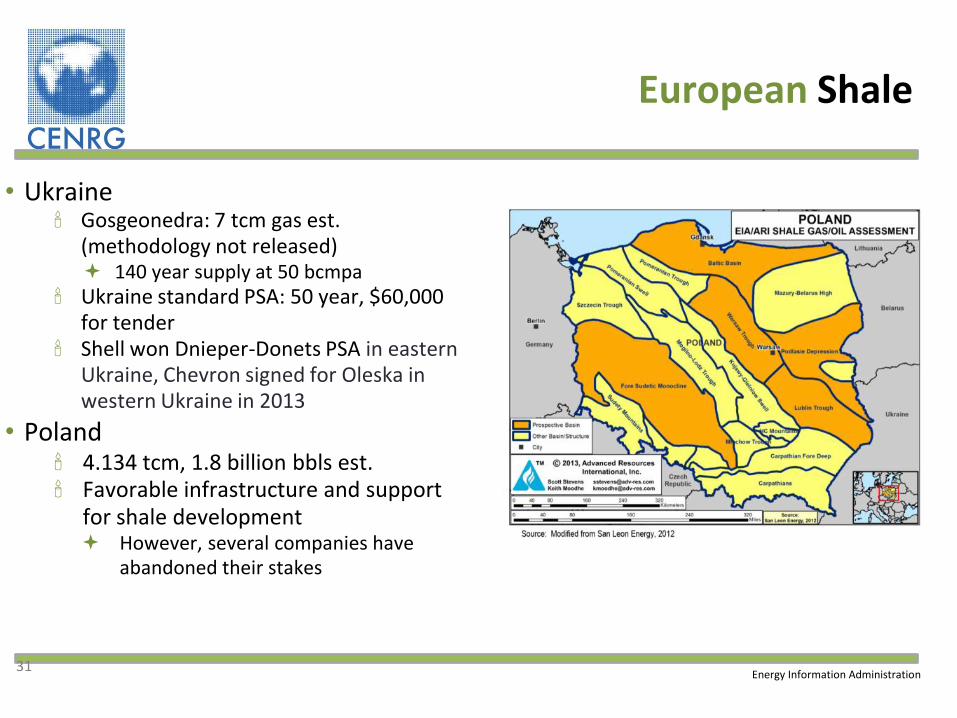
• Ukraine Gosgeonedra: 7 tcm gas est.
(methodology not released) 140 year supply at 50 bcmpa
Ukraine standard PSA: 50 year, $60,000 for tender
Shell won Dnieper-Donets PSA in eastern Ukraine, Chevron signed for Oleska in western Ukraine in 2013
• Poland 4.134 tcm, 1.8 billion bbls est. Favorable infrastructure and support
for shale development However, several companies have
abandoned their stakes
31 Energy Information Administration
European Shale (cont’d)
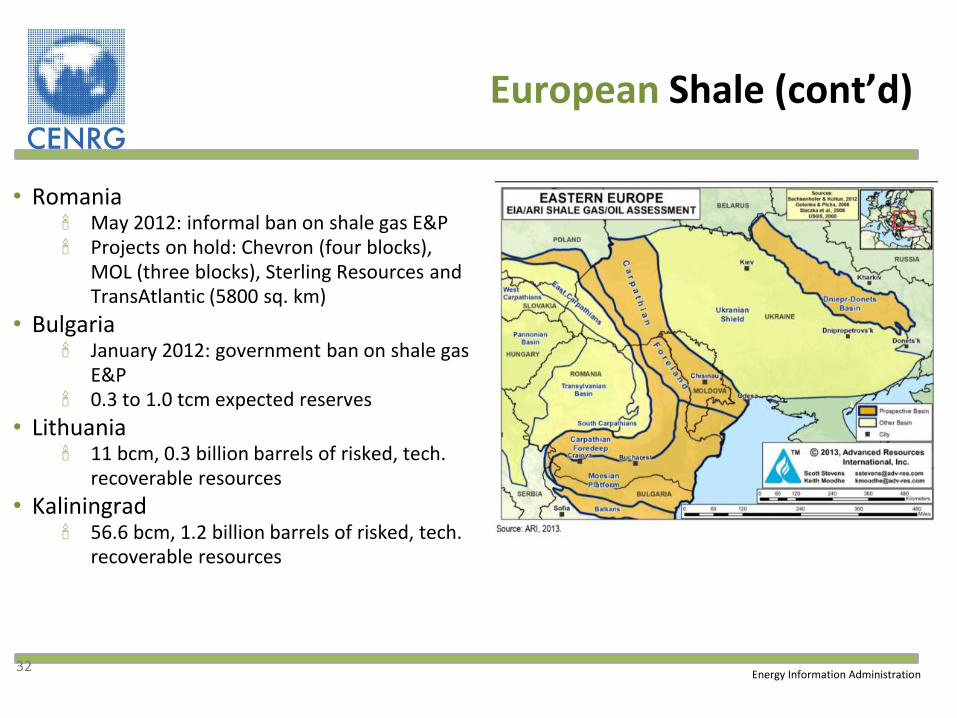
• Romania May 2012: informal ban on shale gas E&P Projects on hold: Chevron (four blocks),
MOL (three blocks), Sterling Resources and TransAtlantic (5800 sq. km)
• Bulgaria January 2012: government ban on shale gas
E&P 0.3 to 1.0 tcm expected reserves
• Lithuania 11 bcm, 0.3 billion barrels of risked, tech.
recoverable resources
• Kaliningrad 56.6 bcm, 1.2 billion barrels of risked, tech.
recoverable resources
Energy Information Administration 32
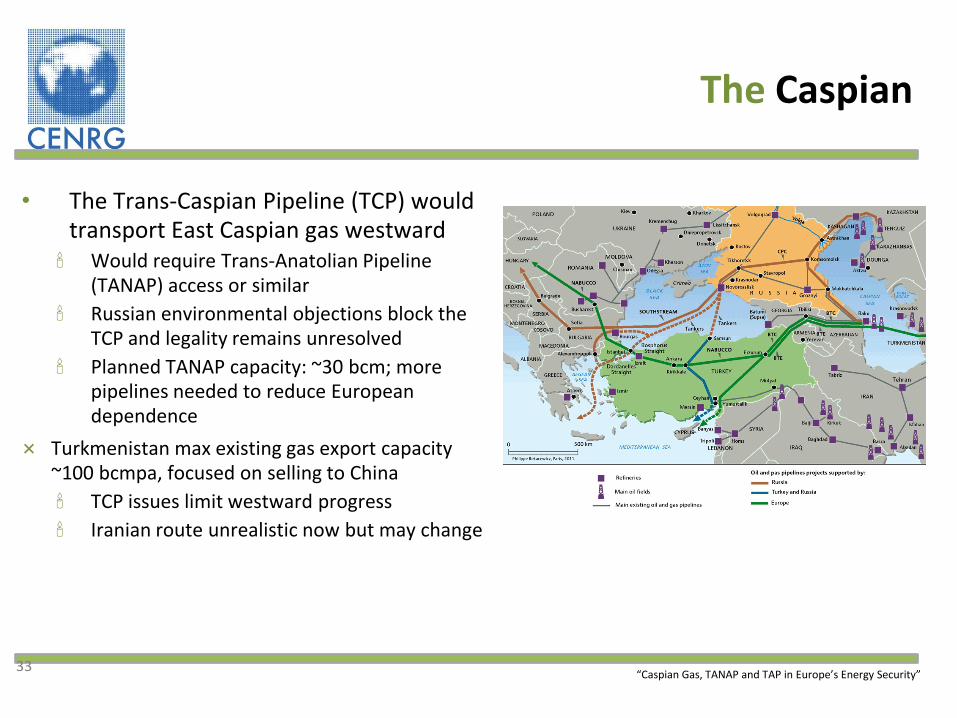
The Caspian
• The Trans-Caspian Pipeline (TCP) would transport East Caspian gas westward Would require Trans-Anatolian Pipeline
(TANAP) access or similar
Russian environmental objections block the TCP and legality remains unresolved
Planned TANAP capacity: ~30 bcm; more pipelines needed to reduce European dependence
Turkmenistan max existing gas export capacity ~100 bcmpa, focused on selling to China
TCP issues limit westward progress
Iranian route unrealistic now but may change
“Caspian Gas, TANAP and TAP in Europe’s Energy Security” 33
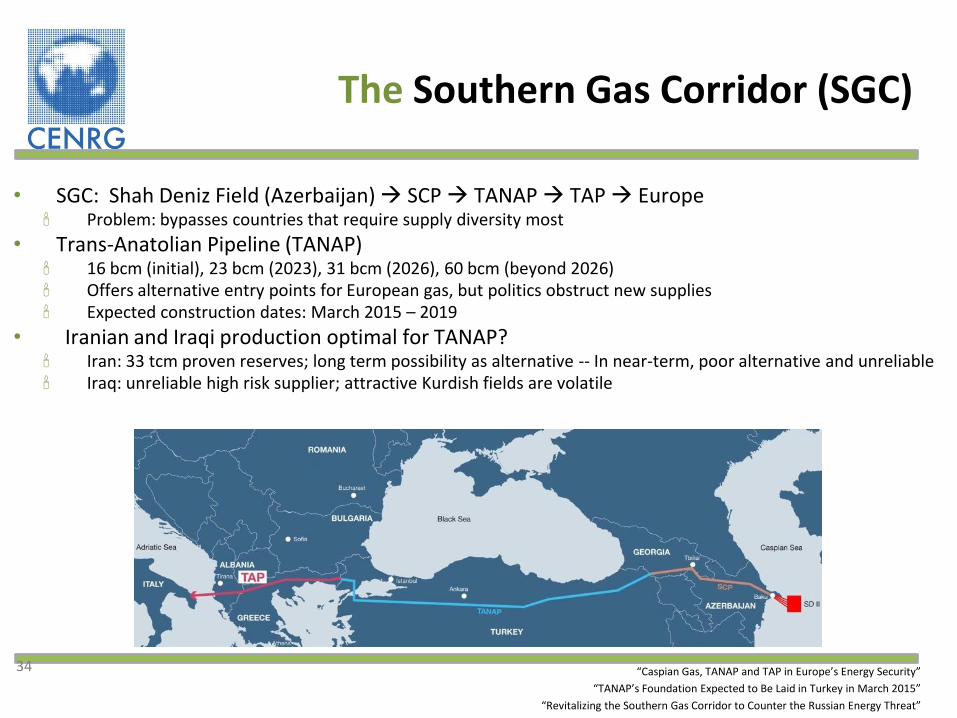
The Southern Gas Corridor (SGC)
• SGC: Shah Deniz Field (Azerbaijan) SCP TANAP TAP Europe Problem: bypasses countries that require supply diversity most
• Trans-Anatolian Pipeline (TANAP) 16 bcm (initial), 23 bcm (2023), 31 bcm (2026), 60 bcm (beyond 2026) Offers alternative entry points for European gas, but politics obstruct new supplies Expected construction dates: March 2015 – 2019
• Iranian and Iraqi production optimal for TANAP? Iran: 33 tcm proven reserves; long term possibility as alternative -- In near-term, poor alternative and unreliable Iraq: unreliable high risk supplier; attractive Kurdish fields are volatile
34 “Caspian Gas, TANAP and TAP in Europe’s Energy Security”
“TANAP’s Foundation Expected to Be Laid in Turkey in March 2015”
“Revitalizing the Southern Gas Corridor to Counter the Russian Energy Threat”
Russian and European Outlook
• Russia exceptionally reliant on its hydrocarbons Unconventional oil and gas growth curbed, investment climate poor
• Europe: growing diversification of supply vs. declining production • China projects don’t relieve pressure on Russia’s reliance on Europe For 10-15 years, 30-yr capital expenditure is north of $150 billion; China commited to
$400 billion over 30 years.
• Alternatives for Europe Domestic unconventional E&P: Poland and Ukraine struggling but have great potential;
Romania and Bulgaria reverse the shale E&P ban Caspian/Anatolian transportation networks: long-term growth potential Middle Eastern, specifically Qatari, gas will continue to supply Europe New Cyprus & Israel East Med developments ideal vs. potential Algerian risk Africa: Developing local industry offers promising future supply US LNG: a significant alternative (need 100 bcmpa cap. by 2025)
35
Global Outlook: Conclusions
• 95% future energy growth non-OECD 2.3% p.a. non-OECD, 0.2% p.a. OECD 2012-35
• Primary energy demand 1.5% demand increase p.a. 2005-15 1.7% demand increase p.a. 2015-25
• Chinese demand will level out over the next couple decades • Industry will dominate consumption growth • Energy sector growth until 2035 Natural gas: fastest growth among fossil fuel (1.9 % p.a.) Oil: slowest growth among fossil fuels (0.8% p.a.) Renewables: growing faster than any other (6.4% p.a.)
• Energy intensity declining • Fuel mix shifting away from fossil fuels • The security and sustainability of energy supply continues to pose significant
challenges.
36
Questions? Вопросы? Thank you! Спасибо за внимание!
Please contact us at: [email protected] [email protected]
© Ariel Cohen 2014. All rights reserved