arex2000 physical address - census.gov 2000 experiment april 17, 2003 administrative records...
TRANSCRIPT

Census 2000 Experiment April 17, 2003
Administrative Records Experiment in 2000 (AREX 2000) Request for Physical Address Evaluation
FINAL REPORT
This research paper reports the results of research and analysis undertaken by the U.S. Census Bureau. It is part of a broad program, the Census 2000 Testing, Experimentation, and Evaluation (TXE) Program, designed to assess Census 2000 and to inform 2010 Census planning. Findings from the Census 2000 TXE Program reports are integrated into topic reports that provide context and background for broader interpretation of results.
Michael A. Berning
Planning, Research, and Evaluation Division

Intentionally Blank

ACKNOWLEDGMENTS
The Administrative Records Experiment 2000 was conducted by the staff of Administrative Records Research at the U.S. Census Bureau, led by Charlene Leggieri. Questions and comments regarding this document can be directed to Michael A. Berning at 301-457-3067.
Administrative Records Research Staff Members and Key Contributors to AREX 2000:
Bashir Ahmed Mikhail Batkhan Mark Bauder
Mike Berning Harold Bobbitt Barry Bye
Benita Dawson Joseph Conklin Kathy Conklin
Gary Chappell Ralph Cook Ann Daniele
Matt Falkenstein Eleni Franklin James Farber
Mark Gorsak Harley Heimovitz Fred Holloman
David Hilnbrand Dave Hubble Robert Jeffrey
Dean Judson Norman Kaplan Vickie Kee
Francina Kerr Jeong Kim Myoung Ouk Kim
Charlene Leggieri John Long John Lukasiewicz
Mark Moran Daniella Mungo Esther Miller
Tamany Mulder Nancy Osbourn Arona Pistiner
Ron Prevost Dean Resnick Pamela Ricks
Paul Riley Douglas Sater Doug Scheffler
Kevin A. Shaw Kevin M. Shaw Larry Sink
Diane Simmons Amy Symens-Smith Cotty Smith
Herbert Thompson Deborah Wagner Phyllis Walton
Signe Wetrogan David Word Mary Untch and
Members of the AREX 2000 Implementation Group

Intentionally Blank
CONTENTS
EXECUTIVE SUMMARY ……………………………………………………………..iv
1. BACKGROUND.........................................................................................................1 1.1 Introduction ...........................................................................................................1 1.2 Administrative Record Census—Definition and Requirements............................2 1.3 AREX Objectives ..................................................................................................2 1.4 AREX Top-down and Bottom-up Methods...........................................................3 1.5 Experimental Sites.................................................................................................5 1.6 AREX Source Files ...............................................................................................5 1.7 AREX Evaluations ................................................................................................6 1.8 The RFPA – Operational Background ..................................................................7
2. METHODOLOGY....................................................................................................11 2.1 Evaluation Methodology .....................................................................................11 2.2 Applying Quality Assurance Procedures.............................................................13
3. LIMITS......................................................................................................................13
4. RESULTS..................................................................................................................144.1 What was the Response Rate? .............................................................................14 4.2. What Does the Response Rate Tell Us? .............................................................15 4.4 Who are the Post Office Box Holders?................................................................25
5. RECOMMENDATIONS ..........................................................................................26 5.1 Conclusions .........................................................................................................26 5.2 What Can We Do Differently? ............................................................................28 5.3 Areas for Further Study .......................................................................................28
REFERENCES...............................................................................................................30 Attachment 1. Reprint of “DocuPrint Delivers”........................................................32 Attachment 2. Request for Physical Address Letter (Form S-950 (L)).....................34 Attachment 3. Telephone Insert Card (Form S-949).................................................36
i

LIST OF TABLES
Table 1. Key Demographic Characteristics of the AREX 2000 Sites ........................................... 5
Table 2. Timeline of Significant Activities for the RFPA Operation .......................................... 10
Table 3. Methodology for Evaluating the Return Status of the Forms........................................ 11
Table 4. Methodology for Evaluating the Significance of the Letter Content............................. 12
Table 5. Methodology for Evaluating Lessons Learned and Key Judgments ............................. 13
Table 6. Return Disposition of Forms S-950(L).......................................................................... 14
Table 7. Relationships Estimated to Affect Response Rates ....................................................... 16
Table 8. Forms Returned with Useful Information Based on Mailout ZIP Code........................ 16
Table 9. Tally of Returned Forms Over Time ............................................................................. 18
Table 10. Request for Physical Address Form Telephone Hotline Tally Sheet .......................... 20
Table 11. UAA Profile of ZIP Codes Selected for Analysis ....................................................... 21
Table 12. Geocoding Rate of Returned Forms ............................................................................ 23
Table 13. Analysis of Geocoded Addresses ................................................................................ 24
Table 14. Geocoded Addresses and Forms Returned With Useable Information ....................... 24
Table 15. Characteristics of P.O. Box Holders............................................................................ 25
Table 16. Rate of Forms Returned with Useable Information..................................................... 26
LIST OF FIGURES
Figure 1. Summary Diagram of AREX 2000 Design .................................................................... 4
Figure 2. Request for Physical Address Operation...................................................................... 10
Figure 3. Decrease in “Forms Not Returned” Category .............................................................. 18
Figure 4. UAA Rate for ZIP Codes on County Borders .............................................................. 23
ii

Intentionally Blank
iii

EXECUTIVE SUMMARY
The Administrative Records Experiment 2000, Request for Physical Address Operation collected physical addresses (geocodable house number, street name, city and state) for individuals whose address was listed as a Post Office Box or other noncity-style address within six administrative records source files. Major components of the operation were to:
• Create an address file from administrative records where the mailing address was a Post Office Box or other noncity-style address.
• Design a form and mail it to the addresses, requesting a physical address.
• Clerically geocode the physical addresses to state, county and block.
• Key addresses and geocode information to a file for further analysis.
The mailing to test site counties of Baltimore City and County in Maryland and Douglas, El Paso and Jefferson Counties in Colorado was to 58,151 Post Office Box and other noncity-style addresses associated with 138,653 individuals in the administrative records. Of the 138,653 individuals, 27,738 had no other type of address listed in administrative record source files.
At the conclusion of the operation, 9,431 physical addresses were geocoded of which 8,107 were geocoded to a test site county. While the initial plan for the operation called for incorporating the geocoded addresses into the Administrative Record Experiment 2000 address and population tally files, the low return rate combined with resource limitations led to a decision to not update the files with the information. Instead, the results are contained in this separate evaluation report.
Based on a review of the return status of the forms and the information provided by respondents, the following conclusions were derived:
• The Request for Physical Address Operation achieved its goal. The goal of the Request for Physical Address operation was to obtain a physical address (potentially geocodable house number and street name) by mailing a form to holders of the P.O. Boxes and other noncity-style addresses asking them to annotate their physical address on a form. Where respondents returned physical address information, addresses were able to be geocoded to the state; county and block level and addresses were defined as being in, or out of the test site.
• The timing of the mailing contributed to a low return rate. Over 60 percent of the forms mailed were presumably delivered (not returned as undeliverable) and were not returned. Reasons for the low response rate could be many and the operation collected no hard data from which to accurately assess the reason. Analysis of returned forms, however, suggest that among other potential issues, the timing of the mailing with the Census 2000 form mailing, might have confused respondents and caused them to not return the forms.
• Unintended recipients affected the results. An underlying phenomenon regarding the mailing is that we can’t be sure the person who received the mailing and responded is the person that was linked to that box in the administrative records source files. This can be attributed to the time elapsed between the date of the administrative record source file data
iv

and the mailing of the Request for Physical Address materials and the typically high turnover rental rate of Post Office Boxes.
• The design of the form impacted the results. Although the form generally suited the purpose of the Request for Physical Address operation, comments returned on the form suggest some areas of the form could have been expanded or reviewed to improve the quality of information that was returned.
Based on an analysis of the results of the Request for Physical Address Operation we recommend the following actions:
• Assess the impact of form design and timing of the mailing in a re-mailing to the original addressees. After incorporating improvements to the form, pretest the revised form and then conduct a mailing to the same addresses. This will help determine the impact of the form design and timing of the mailing on the response rate and also provide additional information on the boxholders geocodable address and potentially provide addition information on the boxholders physical address.
• Assess the impact of the form design and timing of the mailing by using another universe of administrative record addresses. To test the effect of the timing of the mailout and the impact of the age of the administrative record addresses used for the operation, one method is to identify a more timely source of P.O. Boxes as the basis for another operation. A potential source of addresses for this project is the Social Security Administrations Master Beneficiary file.
• Assess the need for this type of operation. The analysis will aid in determining if collecting physical addresses on individuals who have no other address type in administrative record source files, merit the cost of time and resources to launch a separate operation to gather these addresses. In this experiment, there were 2,345,487 persons at addresses geocoded to the block level. The results of this experiment did not include 27,738 because their only address was a Post Office Box or other noncity-style address (these types of addresses cannot be geocoded so persons at the addresses cannot be tabulated). Therefore, adding geocodable physical addresses for individuals with no other type of address in the source files would have potentially increased the population total by about one percent. However, even if the size of the population for which the request for physical address is required is as small as one percent, the uneven distribution of this population among and within states, could suggest that enumeration of the population could be important for apportionment and redistricting in some areas.
v

Intentionally Blank
vi

1. BACKGROUND
1.1 Introduction The Administrative Records Experiment 2000 (AREX 2000) was an experiment in two areas of the country designed to gain information regarding the feasibility of conducting an administrative records census (ARC), or the use of administrative records in support of conventional decennial census processes. The first experiment of its kind, AREX 2000 was part of the Census 2000 Testing Experimentation and Evaluation Program. The focus of this program was to measure the effectiveness of new techniques, methodologies, and technologies for decennial census enumeration. The results of the testing lead to formulating recommendations for subsequent testing and ultimately to the design of the next decennial census.
Interest in taking a decennial census by administrative records dates back at least as far as a proposal by Alvey and Scheuren (1982) wherein records from the Internal Revenue Service (IRS) along with those of several other agencies might form the core of an administrative record census. Knott (1991) identified two basic ARC models: (1) the Top-down model that assembles administrative records from a number of sources, unduplicates them, assigns geographic codes and counts the results; and (2) the Bottom-up model that matches administrative records to a master address file, fills the addresses with individuals, resolves gaps and inconsistencies address by address, and counts the results. There have been a number of other calls for ARC research — see for example Myrskyla 1991; Myrskyla, Taeuber and Knott 1996; Czajka, Moreno and Shirm 1997; Bye 1997. All of the proposals fit either the Top-down or Bottom-up model described here.
Knott also suggested a composite Top-down/Bottom-up model, which would unduplicate administrative records using the Social Security Number (SSN) then match the address file and proceed as in the Bottom-up approach. In overall concept, AREX 2000 most closely resembles this composite approach.
More recently, direct use of administrative records in support of decennial applications was cited in several proposals during the Census 2000 debates on sampling for Nonresponse Followup (NRFU). The proposals ranged from direct substitution of administrative data for non-responding households (Zanutto, 1996; Zanutto and Zaslavsky, 1996; 1997; 2001), to augmenting the Master Address File development process with U.S. Postal Service address lists (Edmonston and Schultze, 1995:103). AREX 2000 provided the opportunity to explore the possibility of NRFU support.
The Administrative Records Research (ARR) staff of the Planning, Research, and Evaluation Division (PRED) performed the majority of coordination, design, file handling, and certain field operations of the experiment. They were supported by various other divisions within the Census Bureau, including Field Division, Decennial Systems and Contracts Management Office, Population Division, and Geography Division.
Throughout this report, rather than identifying individual workgroups or teams, we shall refer to the operational decisions made in support of AREX to be those of ARR; that is, we shall say that “ARR decided to…” whenever a key operational decision is described, even though, of course, ARR staff were not the only decision makers.
1

1.2 Administrative Record Census—Definition and Requirements In the AREX, an administrative record census was defined as a process that relies primarily, but not necessarily exclusively, on administrative records to produce the population content of the decennial census short form with a strong focus on apportionment and redistricting requirements. Title 13, United States Code, directs the Census Bureau to provide state population counts to the President for the apportionment of Congressional seats within nine months of Census Day. In addition to total population counts by state, the decennial census must provide counts of the voting age population (18 and over) by race and Hispanic origin for small geographic areas, currently in the form of Census blocks, as prescribed by PL 94-171 (1975) and the Voting Rights Act (1964). These data are used to construct and evaluate state and local legislative districts.
Demographically, the AREX provided date of birth, race, Hispanic origin, and sex, although the latter is not required for apportionment or redistricting purposes. Geographically, the AREX operated at the level of basic street address and corresponding Census block code. Unit numbers for multi-unit dwellings were used in certain address matching operations and one of the evaluations; but generally, household and family composition were not captured. In addition, the design did not provide for the collection of sample long form population or housing data, needs that will presumably be met in the future by the American Community Survey program. The design did assume the existence of a Master Address File and geographic coding capability similar to that available for the Census 2000.
1.3 AREX Objectives The principal objectives of AREX 2000 were twofold. The first objective was to develop and compare two methods for conducting an administrative records census, one that used only administrative records and a second that added some conventional support to the process in order to complete the enumeration. The evaluation of the results also included a comparison to Census 2000 results in the experimental sites.
The second objective was to test the potential use of administrative records data for some part of the Nonresponse Followup universe, or for the unclassified universe. Addresses that fall into the unclassified status have very limited information on them—so limited, in fact, that the address occupancy status must be imputed, and, conditional on being imputed “occupied”, the entire household, including characteristics, must be imputed. In order to effectively use administrative records databases for substitution purposes, one must determine which kinds of administrative record households are most likely to yield similar demographic distributions to their corresponding census households.
Other more general objectives of the AREX included the collection of relevant information, available only in 2000, to support ongoing research and planning for administrative records use in the 2010 Census, and the comparison of an administrative records census to other potential 2010 methodologies. These evaluations and other data will provide assistance in planning major components of future decennial censuses, particularly those that have administrative records as their primary source of data.
2

1.4 AREX Top-down and Bottom-up Methods
1.4.1 Top-down The AREX 2000 enumeration was accomplished by a two-phase process. The first phase involved the assembly and computer geocoding of records from a number of national administrative record systems, and unduplication of individuals within the combined systems. This was followed by two attempts to obtain and code physical addresses (clerical geocoding and request for physical address) for those that would not geocode by computer. Finally, there is a selection of “best” demographic characteristics for each individual and “best” street address within the experimental sites. Much of the computer processing for this phase was performed as part of Statistical Administrative Records System (StARS) 1999 processing (Judson, 1999; Farber and Leggieri, 2002). As such, StARS 1999 was an integral part of the AREX 2000 design.
One can think about the results of the Top-down process in two ways. First, counting the population at this point provides, in effect, an administrative-records-only census. That is, the enumeration includes only those individuals found in the administrative records, and there is no other support for the census outside of activities related to geocoding. AREX 2000 provides population counts from the Top-down phase so that the efficacy of an administrative-records-only census can be assessed.
However, without a national population register as its base, one might expect an enumeration that used only administrative records to be substantially incomplete. Therefore, a second way to think about the Top-down process is as a substitute for an initial mail-out in the context of a more conventional census that would include additional support for the enumeration.
1.4.2 Bottom-up The fundamental difference between the Bottom-up method and the Top-down method is the Bottom-up method matches administrative records addresses to a separately developed “frame” of addresses, and based on this match, performs additional operations. In this experiment, an extract of the Census Bureau’s Master Address File (MAF) served as the frame.1
The second phase of the AREX 2000 design was an attempt to complete the administrative-records-only enumeration by the correction of errors in administrative records addresses through address verification (a coverage improvement analogue) and by adding persons missed in the administrative records (a NRFU analogue). This phase began by matching the addresses found in the Top-down process to the MAF in order to assess their validity and to identify those MAF addresses for which no administrative records were found. A field address review (FAV) was used to verify non-matched administrative records addresses, and invalid administrative records addresses were excluded from the Bottom-up selection of best address. Non-matched MAF addresses were canvassed in order to enumerate persons at addresses not found in the administrative records systems. In the AREX, such a canvassing was simulated by adding those persons found in the Census 2000 at the unmatched addresses to the adjusted administrative-records-only counts, thus completing the enumeration. Accomplishing the AREX as part of the
1 In this report, we use the term “MAF” generically. Our operations were based on extracts from the Decennial Master Address File (DMAF).
3
Census 2000 obviated the need to mount a separate field operation to canvass unmatched MAF addresses.
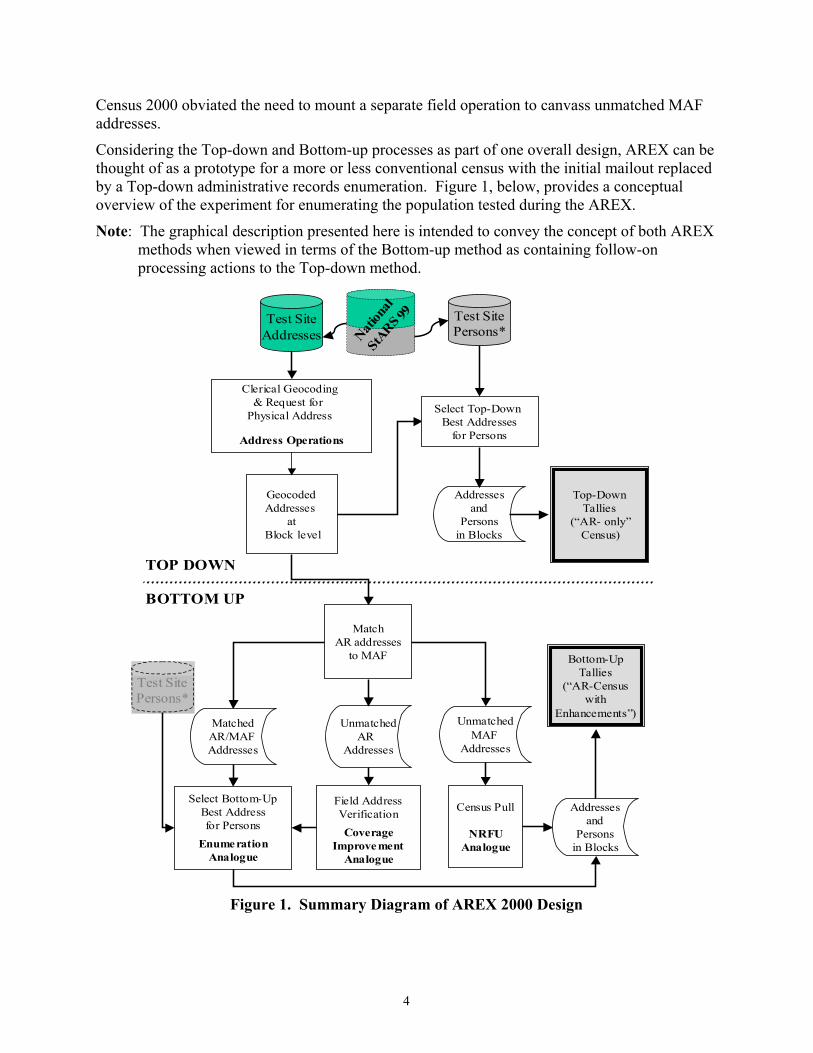
Considering the Top-down and Bottom-up processes as part of one overall design, AREX can be thought of as a prototype for a more or less conventional census with the initial mailout replaced by a Top-down administrative records enumeration. Figure 1, below, provides a conceptual overview of the experiment for enumerating the population tested during the AREX.
Note: The graphical description presented here is intended to convey the concept of both AREX methods when viewed in terms of the Bottom-up method as containing follow-on processing actions to the Top-down method.
Clerical Geocoding & Request for
Physical Address
Address Operations
Geocoded Addresses
at Block level
Addresses and
Persons in Blocks
Select Top-Down Best Addresses
for Persons
Match AR addresses
to MAF
Matched AR/MAF Addresses
Unmatched AR
Addresses
Unmatched MAF
Addresses
Top-Down Tallies
(“AR- only” Census)
Bottom-Up Tallies
(“AR-Census with
Enhancements”)
Field Address Verification Coverage
Improve ment Analogue
Census Pull
NRFU Analogue
Select Bottom-Up Best Address for Persons
Enume ration Analogue
Test Site Addresses
Test Site Persons*
BOTTOM UP
TOP DOWN
Nation
al St
ARS 99
Nation
al St
ARS 99
Addresses and
Persons in Blocks
Test Site Persons*
Figure 1. Summary Diagram of AREX 2000 Design
4

1.5 Experimental Sites The experiment was set up to include geographic areas that include both difficult and easy to enumerate populations. Two sites were selected believed to have approximately one million housing units and a population of approximately two million persons. One site included Baltimore City and Baltimore County, Maryland. The other site included Douglas, El Paso, and Jefferson Counties, Colorado. The sites provided a mix of characteristics needed to assess the difficulties that might arise in conducting an administrative records census. Approximately one half of the test housing units was selected based on criteria assumed to be easy-to-capture in an administrative records census (for example, areas having a preponderance of city style addresses, single family housing units, older and less mobile populations), and the other half was selected based on criteria assumed to be hard to capture (the converse). Demographic characteristics of the sites are given in the following table.
Table 1. Key Demographic Characteristics of the AREX 2000 Sites
Total Population1
Baltimore County, MD
Baltimore City, MD
Douglas County, CO
El Paso County, CO
Jefferson County, CO United States
754,292 651,154 175,766 516,929 527,056 281,421,906 White1 74.4% 31.6%
20.1% 64.3% 0.3% 0.3% 3.2% 1.5% 0.6% 0.7% 1.4% 1.5% 1.8% 1.7%
92.8% 81.2% 90.6% 1.0% 6.5% 0.9% 0.4% 0.9% 0.8% 2.6% 2.7% 2.4% 1.4% 4.7% 3.2% 1.9% 3.9% 2.2% 5.1% 11.3% 10.0%
75.1% 12.3% 0.9% 3.7% 5.5% 2.4% 12.5%
Black1
American Indian, Eskimo or Aleut1
Asian or Pacific Islander1
Other Race1
Multi-Race1
Hispanic1
Median Age1 37.7 yrs 35.0 yrs 33.7 yrs 33.0 yrs 36.8 yrs 35.3 yrs Crude Birth Rate2 12.6 14.9
9.9 13.1 9.0% -11.5%
19.0 15.7 12.5 2.7 5.5 6.0 191.0% 30.2% 20.2%
14.93
8.63
13.2% Crude Death Rate2
1990-2000 Change4
Note: all values include household and group quarters residents 1. 2000 Census results2 1998 rates per 1000; from MD Dept. of Health and Mental Hygiene and CO Dept. of Public Health and Environment 3 1998 rates per 1000; from www.fedstats.gov 4 1990 and 2000 Census results
1.6 AREX Source Files The administrative records for AREX were drawn from the StARS 1999 database. There were six national-level source files selected for inclusion in StARS. The files were chosen to provide the broadest coverage possible of the U.S. population. The national level files were selected to compensate for the weaknesses or lack of coverage of a given segment of the population inherent in any one source file. At a minimum, the files had to have for each record, a name, Social Security Number (SSN), and street address.
1.6.1 Timing An important limitation for the AREX was the gap between the reference period for data contained in each source file and the point-in-time reference of April 1, 2000 for the Census. The time lag had an impact on both population coverage--births, deaths, immigration and emigration--and geographic location--housing extant, and geographic mobility. As an example,
5

both IRS files included data for tax year 1998 with an expected current address as of tax filing time close to April 15, 1999. Note, however, that the IRS 1040 file only provided persons in the tax unit as of December 31, 1998.
1.6.2 State, Local and Commercial Files
ARR staff decided not to use state and local files2 and commercially available databases3 in the AREX 2000 experiment. Statistical evidence is limited, but various reports from ARR staff indicated that state and local files come in an extremely diverse variety of forms, with equally diverse record layouts and content (for historical information, see Sweet, 1997; Buser, Huang, Kim, and Marquis, 1998; and other papers in the Administrative Records Memorandum Series). Furthermore, ARR staff reported that it was quite time-consuming and intricate to develop the interagency contractual arrangements necessary to use state and local files. Public opinion results such as Singer and Miller (1992), Aguirre International (1995), and Gellman (1997), ARR staff judged that public sensitivity to the idea of linking commercial databases with government databases (other than for address processing) would be too great, and that such a linkage would be unwise.
In addition to acquisition and processing difficulties, consideration of the use of state and local files raises an equity issue in a decennial census context. Since it is not possible to obtain an exact count of the population in its entirety, public perception of fair treatment in the decennial census process is important. This means that the accuracy of the counts must be seen as uniform between and within states. The use of data from just certain states or localities would compromise notions that decennial census methods must treat all parts of the country equitably.
The American Business Index (or ABI) file was used to identify addresses that were commercial rather than residential, and a Group One product, Code One, used to standardize addresses.
1.6.3 Census Numident An additional, and critical, file used in creation of the StARS database was the Census Numident file. For the AREX, it was the source of most of the demographic characteristics and some of the death data.
1.7 AREX Evaluations Currently, four evaluations are being completed.
The Process Evaluation documents and analyzes selected components or processes of the Top-down and Bottom-up methods in order to identify errors or deficiencies. It is designed to catalog the various processes by which raw administrative data became final AREX counts and attempts to identify the relative contributions of these various processes.
The Outcomes Evaluation is a comparison of Top-down and Bottom-up AREX counts by county, tract, and block level counts of the total population by race, Hispanic origin, age groups and gender, with comparable decennial census counts. This evaluation is outcome rather than process oriented.
2 Such as state and local tax returns, drivers license files, local utilities, assessor’s records, and the like. 3 Such as commercially available mailing lists, credit card databases, and the like
6

The Household Evaluation assesses outcomes of the Bottom-up method, the potential for nonresponse substitution and unclassified imputations, and predictive capability. Nonresponse Followup substitution assesses the feasibility of using administrative records, in lieu of a field interview, to obtain data on non-responding census addresses via the Bottom-up method.
The Request for Physical Address (RFPA) Evaluation assesses the impact of noncity-style addresses. These addresses present a significant hurdle to the use of an administrative records census on either a supplemental or substitution basis is the determination of residential addresses and their associated geographic block level allocation for individuals whose administrative record address is a P.O. Box or Rural Route. AREX 2000 tested a possible solution in the form of the Request for Physical Address operation. Several thousand letters were mailed to P.O. Box and Rural Route addresses requesting the receiver to reply with their residential address for purposes of block level geocoding. This report documents in detail the planning and implementation of the operation. It also analyzes the results of the operation and assesses its potential future use as part of an ARC.
1.8 The RFPA – Operational Background
1.8.1 Why Do an RFPA Operation?
In a Census operation, P.O. Box and Rural Route (noncity-style) addresses pose a challenge when matching and geocoding addresses. The same challenges exist with the ever-increasing number of commercial post office box-type addresses. With these addresses, the Census Bureau cannot determine the precise housing unit location from the box number/rural route address alone, nor can it geocode the addresses. To rectify this issue in AREX 2000, an attempt was made to obtain a physical address (house number and street name) by mailing a form to holders of the P.O. Box and noncity-style addresses and asking recipients to annotate their address on the form. Where respondents returned physical address information, attempts were made to determine if the addresses were within the test site and then to geocode them to the state, county and block level.
1.8.2 How Were the Address Types Handled in Previous Census Operations?
The AREX 2000 RFPA operation was not the first attempt at gathering geocodable addresses from noncity-style address holders. In the 1990 Census, P.O. Boxes were included as part of the larger 1990 Casing Check operation – a pre-census activity to update the census address file before delivering the census questionnaires.
Casing is the sorting process the United States Postal Service (USPS) mail carriers use to put mail in the proper sequence for delivery. In the casing operation, the Census Bureau gave the USPS an address card (buff colored card), for each of the addresses in the mailing file. The mail carriers cased the buff cards to identify the deliverable, duplicate and undeliverable addresses as well as to identify residential addresses missing from the census mailing file. The USPS carriers then completed a Report of Missing Addresses (blue card) for each residential address missing a buff card. All blue card addresses were checked in the district offices or in the field to determine if the addresses were missing from the census address file and were valid residential units. The district offices then labeled and mailed census questionnaires to the missing addresses if they
7

were processed early; addresses not sent a census questionnaire were enumerated during a nonresponse follow-up operation.
The 1990 'Blue Card' casing check operation was not used in the Census 2000, nor was there any special operation implemented to affix physical addresses to P.O. Box addresses. These types of addresses were included in standard census follow-up operations where necessary.
1.8.3 What Alternatives Were Considered to Determine the Physical Address for AREX?
For AREX 2000, several alternatives were considered to determine the physical addresses for holders of P.O. Box and other noncity-style addresses. These alternatives included:
1. Mailing out a short census form. 2. Creating a model to allocate the addresses to blocks. 3. Requesting records from the U.S. Postal Service (USPS) that could potentially link
P.O. Boxes to a physical address. 4. Mailing the addressees a letter requesting the physical address.
• Mailing the Short Census Form to the Addresses In this approach, the census short form used in the Decennial census is sent to holders of the P.O. Box and other non-city style addresses. The benefit of this approach is that no additional form design is required. The problems with this approach are that there was no opportunity to tailor requests for information specifically addressing the physical address issue and no provision for geocoding the addresses. The form would have to include a place for the respondent to include a social security number or other identifier so that the response could be linked back to the administrative record. Problematic is that, because it was a census year, these addresses already had a census form mailed to them and a duplicate form may confuse respondents and affect return rates. In a true administrative records census, however, there would not be multiple forms mailed.
• Modeling the Results Another approach considered was to use existing information regarding these types of addresses to build a model to allocate these addresses to blocks. While this approach precluded the need to gather additional information, it was problematic in that there is not a lot of empirical data from which to build a model so the value of the allocation algorithm may be questionable.
• Requesting Linkage Data from the USPS Also considered as an approach to the RFPA issue was researching possible links in the USPS record system and physical addresses of the box holders. Preliminary inquiries with USPS indicated no such record system exists and any local Post Office records that may support this effort were not accessible by the Census Bureau.
• Sending an RFPA Form The approach that the Planning, Research and Evaluation Division (PRED) selected to determine physical addresses is sending specific RFPA forms to the holders of these address types. This
8
approach afforded the respondent an opportunity to provide only that information necessary from which to geocode their actual physical address.
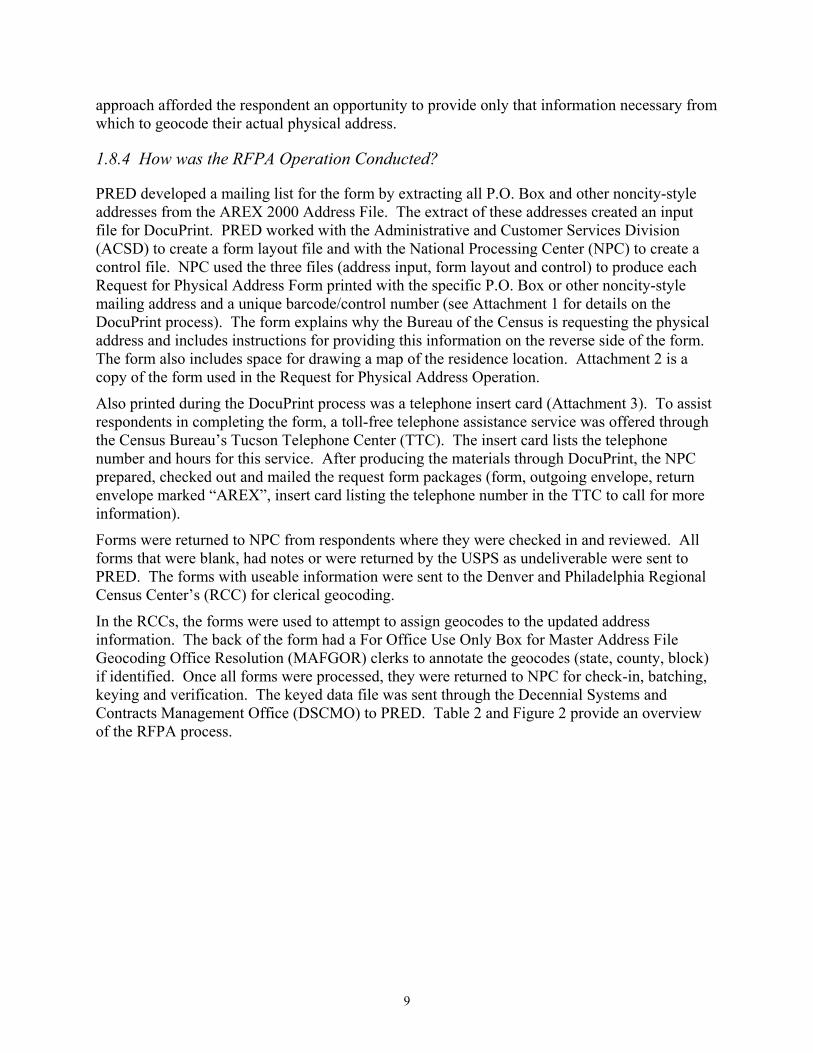
1.8.4 How was the RFPA Operation Conducted?
PRED developed a mailing list for the form by extracting all P.O. Box and other noncity-style addresses from the AREX 2000 Address File. The extract of these addresses created an input file for DocuPrint. PRED worked with the Administrative and Customer Services Division (ACSD) to create a form layout file and with the National Processing Center (NPC) to create a control file. NPC used the three files (address input, form layout and control) to produce each Request for Physical Address Form printed with the specific P.O. Box or other noncity-style mailing address and a unique barcode/control number (see Attachment 1 for details on the DocuPrint process). The form explains why the Bureau of the Census is requesting the physical address and includes instructions for providing this information on the reverse side of the form. The form also includes space for drawing a map of the residence location. Attachment 2 is a copy of the form used in the Request for Physical Address Operation.
Also printed during the DocuPrint process was a telephone insert card (Attachment 3). To assist respondents in completing the form, a toll-free telephone assistance service was offered through the Census Bureau’s Tucson Telephone Center (TTC). The insert card lists the telephone number and hours for this service. After producing the materials through DocuPrint, the NPC prepared, checked out and mailed the request form packages (form, outgoing envelope, return envelope marked “AREX”, insert card listing the telephone number in the TTC to call for more information).
Forms were returned to NPC from respondents where they were checked in and reviewed. All forms that were blank, had notes or were returned by the USPS as undeliverable were sent to PRED. The forms with useable information were sent to the Denver and Philadelphia Regional Census Center’s (RCC) for clerical geocoding.
In the RCCs, the forms were used to attempt to assign geocodes to the updated address information. The back of the form had a For Office Use Only Box for Master Address File Geocoding Office Resolution (MAFGOR) clerks to annotate the geocodes (state, county, block) if identified. Once all forms were processed, they were returned to NPC for check-in, batching, keying and verification. The keyed data file was sent through the Decennial Systems and Contracts Management Office (DSCMO) to PRED. Table 2 and Figure 2 provide an overview of the RFPA process.
9

Table 2. Timeline of Significant Activities for the RFPA Operation
Activity Date of Activity Request for Physical Address forms mailed from NPC to May 5, 2000 respondents Tucson Telephone Center 1-800 line activated to respond to May 8 - June 16, questions regarding the mailing 2000 Cutoff for returned forms to be mailed to the RCCs for clerical July 13, 2000 geocoding Check-in forms returned from the RCC to NPCs for keying October 6, 2000 NPC completes keying and returns the files to DSCMO for final November 2, 2000 formatting DSCMO completes processing of the keyed files and sends them to November 13, 2000 PRED
Select outgoing and return envelopes
(PRED/ACSD) 1.30
Design physical address
request letter (PRED/ACSD) 1.25
Addresses
Addresses from AREX 2000
Address File 1.40
DocuPrint & QA request letters to P.O. Box and rural-style addresses
1.45(NPC)
Assemble & QA mailing packages (letters, insert cards, and return envelopes
are placed in outgoing envelopes) 1.55(NPC)
Check-out & mail packages 1.60(NPC)
Respondents complete & return letters
1.65(NPC)
Check-in returned letters and remove letters meeting
certain criteria (i.e., blank) 1.70(NPC)
Photocopy letters 1.80(NPC)
Sort letters by RCC (Denver,Phila)
1.75(NPC)
Retain copies 1.85(NPC)
Send letters to RCC’s
1.90(GEO)
Use MAFGOR to clerically geocode addresses and annotate
results on letters 1.95(RCC’s)
Send all letters to NPC
1.100(RCC’s)
Check-in returned letters and batch
1.105(NPC)
Perform clerical prekeyediting
1.110(NPC)
Send Keyed Data File to DSCMO
1.125(NPC)
Send Keyed Data File to PRED
1.130(GEO)
Key & verify returned letters
1.115(NPC)
Keyed Data File
1.120
Design insert card
(PRED/ACSD) 1.05
Form
Card Layout File from ACSD
1.10
DocuPrint & QA insert cards
1.15(NPC)
Request Letters
1.50
Insert Cards
1.20
Request for Physical Address
Keyed File 1.140
Form
Form Layout File from ACSD
1.35
Figure 2. Request for Physical Address Operation
10

2. METHODOLOGY
2.1 Evaluation Methodology
The evaluation addresses the following general themes: • The significance of the results of the RFPA. • Lessons learned and key judgments about the operation.
Specific issues addressed within the evaluation include: • Analysis of the return status of the forms. • Analysis of the significance of the contents of the returned forms. • Analysis of lessons learned from the operation.
Tables 3, 4 and 5 detail the source of information and measurements used to address specific issues within the general themes.
Table 3. Methodology for Evaluating the Return Status of the Forms
Issue Source of Information Measurement What is the tally, by return Keyed data file and the A tally of forms for each of disposition category, for each of the Decennial Systems and the disposition categories 58,121 RFPA forms mailed to Contract Management Office that reflects the number of respondents? (DSCMO) check in reports. forms and percent of the
whole for each category. Were there patterns by ZIP Code or Keyed data file, DSCMO A qualitative analysis of significance to the forms returned as check in reports, Post Office situations surrounding the UAA? If so, was there any Post staff. undeliverable as addressed Office procedures or operations that (UAA) forms from two ZIP might explain the difference? Codes from each of the five
AREX test site counties. Of the two ZIP Codes per county, one will have a UAA rate higher than average for the state and one will have a UAA rate lower than average for the state.
Was there any significance to the Keyed data file, DSCMO Three point-in-time tallies time elapsed for forms to be returned check in reports, Post Office showing the return or to mailing the forms at the same Staff, and a review of the disposition for the forms. time as the census forms? returned forms. Qualitative analysis of
explanations concerning time elapsed for return of the forms.
11
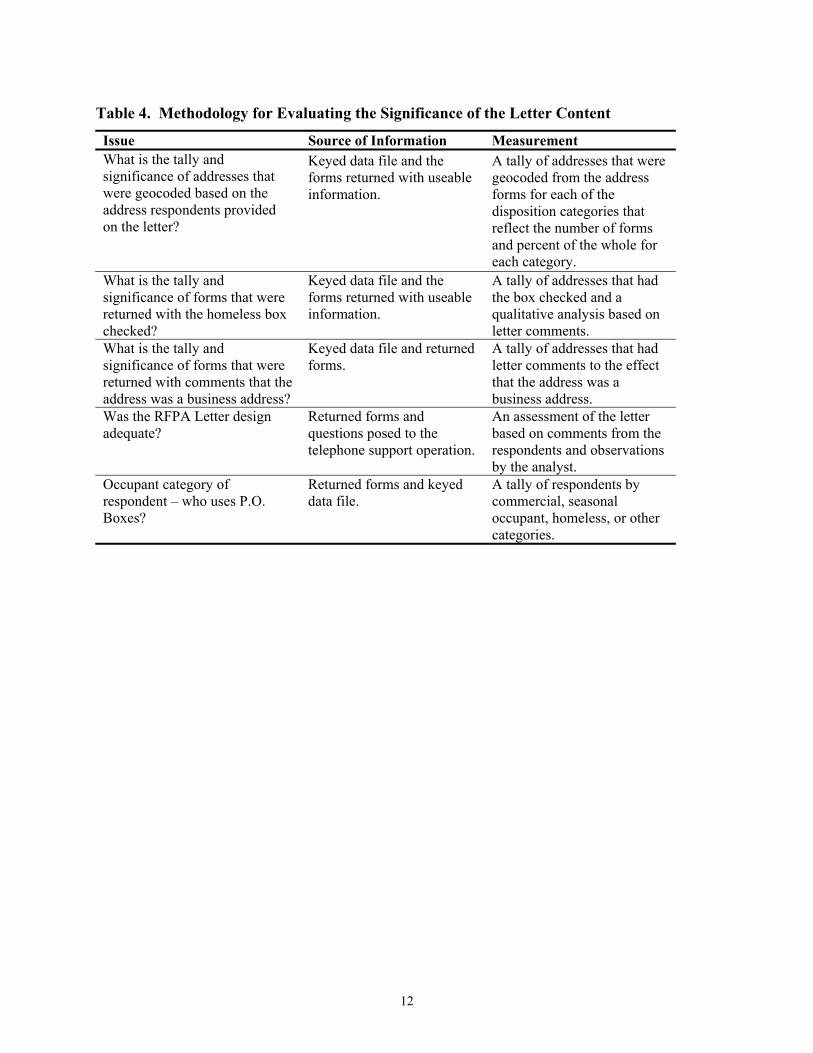
Table 4. Methodology for Evaluating the Significance of the Letter Content
Issue Source of Information Measurement What is the tally and Keyed data file and the A tally of addresses that were significance of addresses that forms returned with useable geocoded from the address were geocoded based on the information. forms for each of the address respondents provided disposition categories thaton the letter? reflect the number of forms
and percent of the whole for each category.
What is the tally and Keyed data file and the A tally of addresses that had significance of forms that were forms returned with useable the box checked and a returned with the homeless box information. qualitative analysis based on checked? letter comments. What is the tally and Keyed data file and returned A tally of addresses that had significance of forms that were forms. letter comments to the effect returned with comments that the that the address was a address was a business address? business address. Was the RFPA Letter design Returned forms and An assessment of the letter adequate? questions posed to the based on comments from the
telephone support operation. respondents and observations by the analyst.
Occupant category of Returned forms and keyed A tally of respondents by respondent – who uses P.O. data file. commercial, seasonal Boxes? occupant, homeless, or other
categories.
12

Table 5. Methodology for Evaluating Lessons Learned and Key Judgments
Issue Source of Information Measurement Did the RFPA operation achieve Qualitative reports and Based on the return status of the intended goal? quantitative analysis based on the forms and an analysis of
the evaluation of the return letter contents, provide a status and content of the qualitative analysis of the RFPA Forms. effectiveness of the RFPA
operation. Would we change anything if we Qualitative reports and Based on results and outcome conducted this operation again? quantitative analysis based on of the RFPA operation, a
the evaluation of the return qualitative analysis of project status and content of the in its entirety. RFPA Forms.
Is there potential for further Qualitative reports and Based on results and outcome research on P.O. Boxes and quantitative analysis based on of the RFPA operation, a possibly improving coverage in a the evaluation of the return qualitative analysis of the census by contacting P.O. Box status and content of the potential for future holders. RFPA Forms. application of this process.
2.2 Applying Quality Assurance Procedures We applied quality assurance procedures throughout the creation of this report. They encompassed how we determined evaluation methods, created specifications for project procedures and software, designed and reviewed computer systems, developed clerical and computer procedures, analyzed data and prepared this report. For a description of these procedures, reference “Census 2000 Evaluation Program Quality Assurance Process.”
3. LIMITS
The intent of the AREX 2000 RFPA was to use the respondent-provided information to update the AREX Address File (AAF) so that allocation to a census block (geocoding) was possible. A low response rate and review of the returned forms, however, showed that the amount of useable information within the forms did not merit the programming time and scheduling impact on other processing operations, to update the AAF with the RFPA information. As such, the information was not used to update the AAF and not included in the AREX results. This separate evaluation of the RFPA process was designed to evaluate the overall operation and assess the data that were obtained.
13
4. RESULTS
The results of the RFPA operation are described in the following descriptions of the response rate of the mailing; the usefulness of the respondent provided information and an overview profile of the boxholders who responded.
4.1 What was the Response Rate?
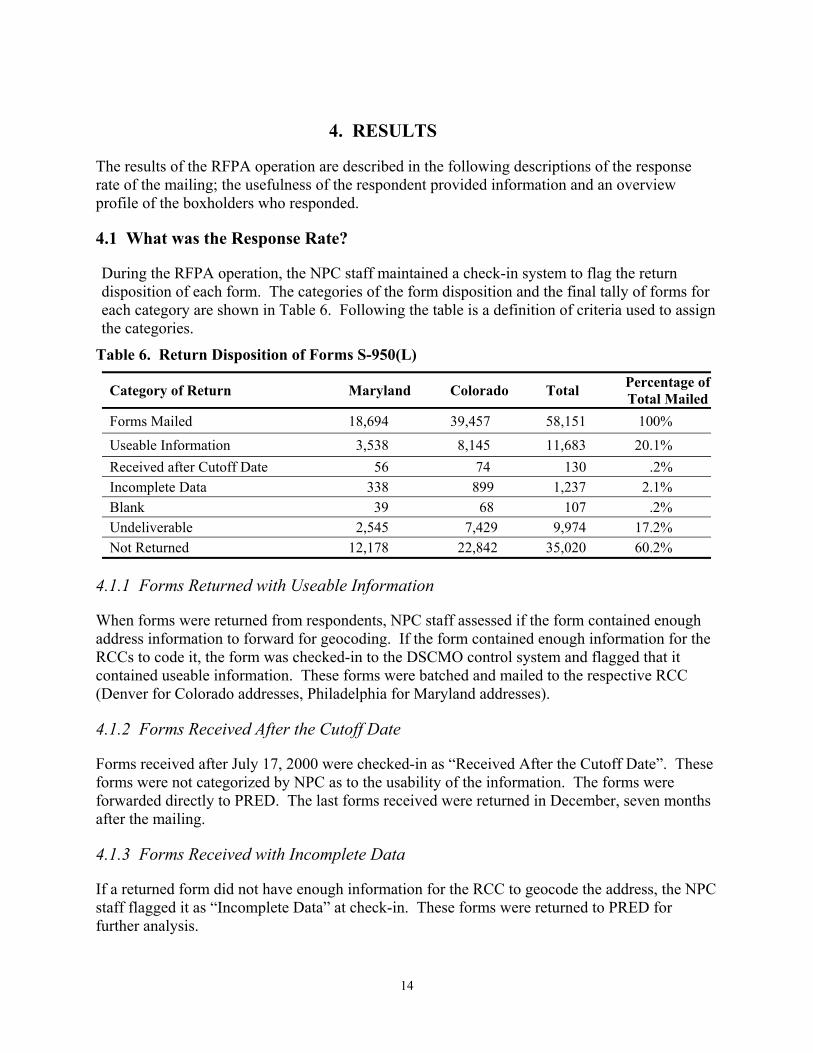
During the RFPA operation, the NPC staff maintained a check-in system to flag the return disposition of each form. The categories of the form disposition and the final tally of forms for each category are shown in Table 6. Following the table is a definition of criteria used to assign the categories.
Table 6. Return Disposition of Forms S-950(L)
Category of Return Maryland Colorado Total Percentage of Total Mailed
Forms Mailed 18,694 39,457 58,151 100% Useable Information 3,538 8,145 11,683 20.1% Received after Cutoff Date 56 74 130 .2% Incomplete Data 338 899 1,237 2.1% Blank 39 68 107 .2% Undeliverable 2,545 7,429 9,974 17.2% Not Returned 12,178 22,842 35,020 60.2%
4.1.1 Forms Returned with Useable Information
When forms were returned from respondents, NPC staff assessed if the form contained enough address information to forward for geocoding. If the form contained enough information for the RCCs to code it, the form was checked-in to the DSCMO control system and flagged that it contained useable information. These forms were batched and mailed to the respective RCC (Denver for Colorado addresses, Philadelphia for Maryland addresses).
4.1.2 Forms Received After the Cutoff Date
Forms received after July 17, 2000 were checked-in as “Received After the Cutoff Date”. These forms were not categorized by NPC as to the usability of the information. The forms were forwarded directly to PRED. The last forms received were returned in December, seven months after the mailing.
4.1.3 Forms Received with Incomplete Data
If a returned form did not have enough information for the RCC to geocode the address, the NPC staff flagged it as “Incomplete Data” at check-in. These forms were returned to PRED for further analysis.
14
4.1.4 Blank Forms
Some respondents returned blank forms. NPC staff flagged these as “Blank”.
4.1.5 Undeliverable
When forms were returned by the Post Office as undeliverable, they were flagged as “Undeliverable” in the NPC check-in system.
4.1.6 Not Returned
Forms not checked into any other category were considered not returned and flagged as such in the NPC control system.
4.2. What Does the Response Rate Tell Us?
The return rate of the forms did not meet expectations. Based on previous Bureau of the Census mailings, PRED staff had estimated a 50 percent return rate on the forms. The actual return rate, discounting the UAA category, was 23 percent.
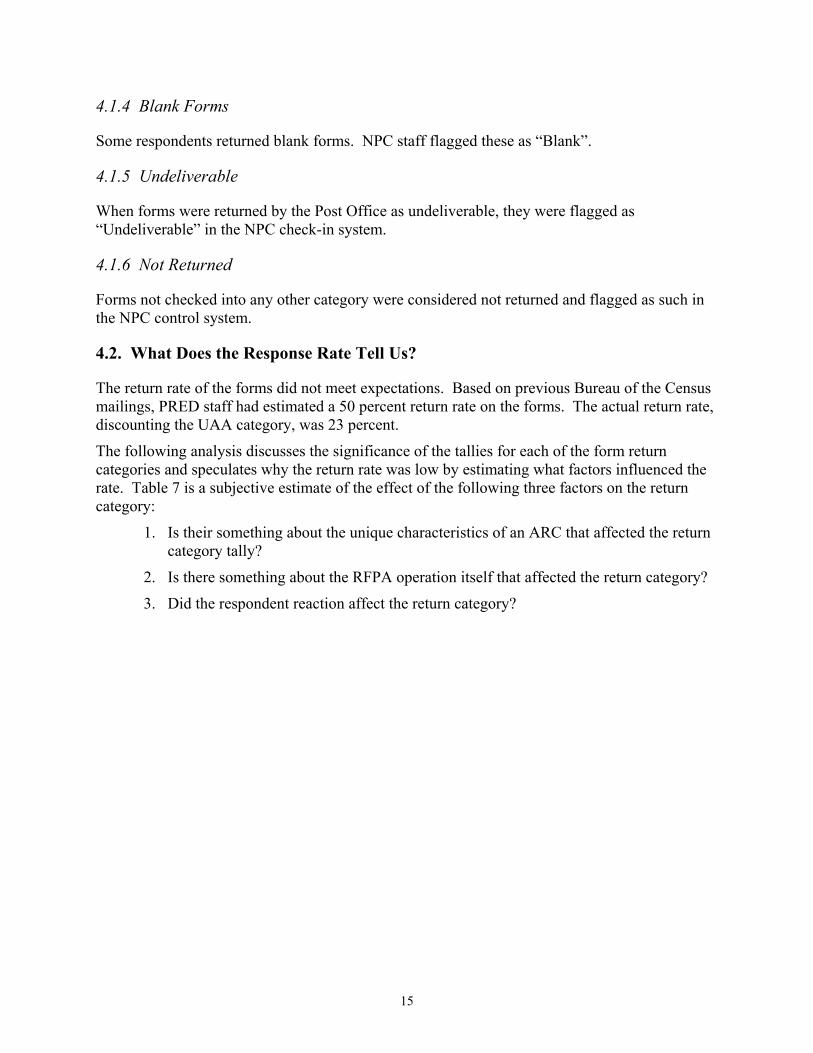
The following analysis discusses the significance of the tallies for each of the form return categories and speculates why the return rate was low by estimating what factors influenced the rate. Table 7 is a subjective estimate of the effect of the following three factors on the return category:
1. Is their something about the unique characteristics of an ARC that affected the return category tally?
2. Is there something about the RFPA operation itself that affected the return category?
3. Did the respondent reaction affect the return category?
15
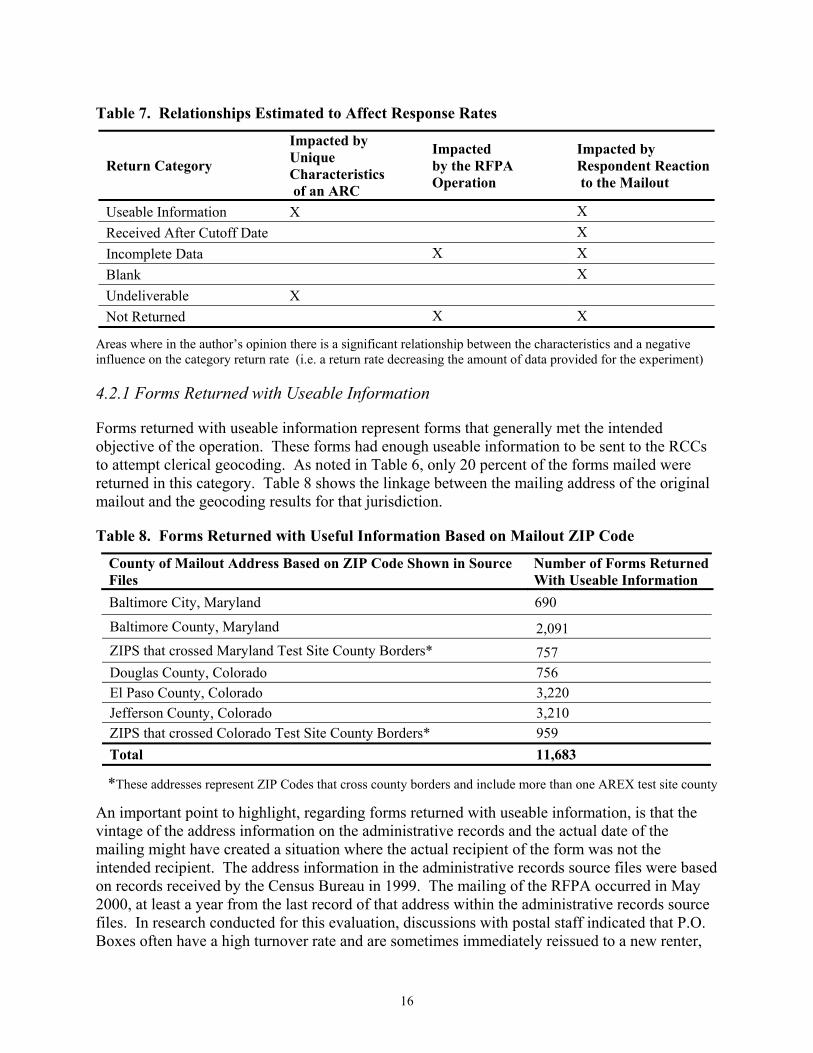
Table 7. Relationships Estimated to Affect Response Rates
Impacted by Impacted Impacted by Return Category Unique
Characteristics by the RFPA
of an ARC Operation Respondent Reaction to the Mailout
Useable Information X X Received After Cutoff Date X Incomplete Data X X Blank X Undeliverable X Not Returned X X
Areas where in the author’s opinion there is a significant relationship between the characteristics and a negative influence on the category return rate (i.e. a return rate decreasing the amount of data provided for the experiment)
4.2.1 Forms Returned with Useable Information
Forms returned with useable information represent forms that generally met the intended objective of the operation. These forms had enough useable information to be sent to the RCCs to attempt clerical geocoding. As noted in Table 6, only 20 percent of the forms mailed were returned in this category. Table 8 shows the linkage between the mailing address of the original mailout and the geocoding results for that jurisdiction.
Table 8. Forms Returned with Useful Information Based on Mailout ZIP Code
County of Mailout Address Based on ZIP Code Shown in Source Number of Forms Returned Files With Useable Information Baltimore City, Maryland 690
Baltimore County, Maryland 2,091 ZIPS that crossed Maryland Test Site County Borders* 757 Douglas County, Colorado 756 El Paso County, Colorado 3,220 Jefferson County, Colorado 3,210 ZIPS that crossed Colorado Test Site County Borders* 959 Total 11,683
*These addresses represent ZIP Codes that cross county borders and include more than one AREX test site county
An important point to highlight, regarding forms returned with useable information, is that the vintage of the address information on the administrative records and the actual date of the mailing might have created a situation where the actual recipient of the form was not the intended recipient. The address information in the administrative records source files were based on records received by the Census Bureau in 1999. The mailing of the RFPA occurred in May 2000, at least a year from the last record of that address within the administrative records source files. In research conducted for this evaluation, discussions with postal staff indicated that P.O. Boxes often have a high turnover rate and are sometimes immediately reissued to a new renter,
16
when the previous renter closes the box. Therefore, a situation might arise where the intended recipient of the mailing based on the 1999 or earlier address information, may not be the same renter of that P.O. Box in the year 2000.
This unintended recipient factor (URF) can negatively affect the accuracy of an administrative record census by potentially undercounting or double counting individuals at addresses in the final consolidation and tally. Asking for unique person characteristic information (such as a Social Security Number) in the mailout can mitigate the impact of the URF. Then, as part of the processing of respondent information, a match process can be invoked to resolve a situation where the intended recipient was different from the respondent. While name data can be the basis of the confirmation key, Social Security Numbers would improve the accuracy of this linkage process.
Another method of mitigating the effects of the URF is to include on the form a place where the person can indicate how long he/she has held the Post Office Box. If the answer is a date within the range of the administrative records source date, then the respondent could be considered the intended recipient.
An additional factor that might have negatively influenced the return rate is the respondent reaction to the mailing. In all probability, many respondents received the form and chose not to reply.
4.2.2 Forms Received After the Cutoff Date
For forms received after the cutoff date, NPC made no further assessment on the value of the information within the forms. The reasons for forms received late can be many but based on a review of forms, it is assessed that respondents infrequently checking for mail in the P.O. Box, misunderstanding the instructions on the form, or simply forgetting to return the form in the time specified are the primary contributing factors.
Although the number of forms in this category is relatively low, the time elapsed between the cutoff date and when the last forms were received at NPC is noteworthy. Respondents were asked to reply within five days of receiving the form (mailed on May 15, 2000) and the cutoff date for NPC to send the forms to the RCCs was ultimately set at July 17, 2000. A full two months from the mail-out seemed like a reasonable amount of time to allow respondents to pick up their mail, complete the form, and return the form to NPC. The last forms recorded as received in NPC were in December 2000, seven months from the mailout. Table 9 and Figure 3 show three, point-in-time accounts of the form receipt status.
17
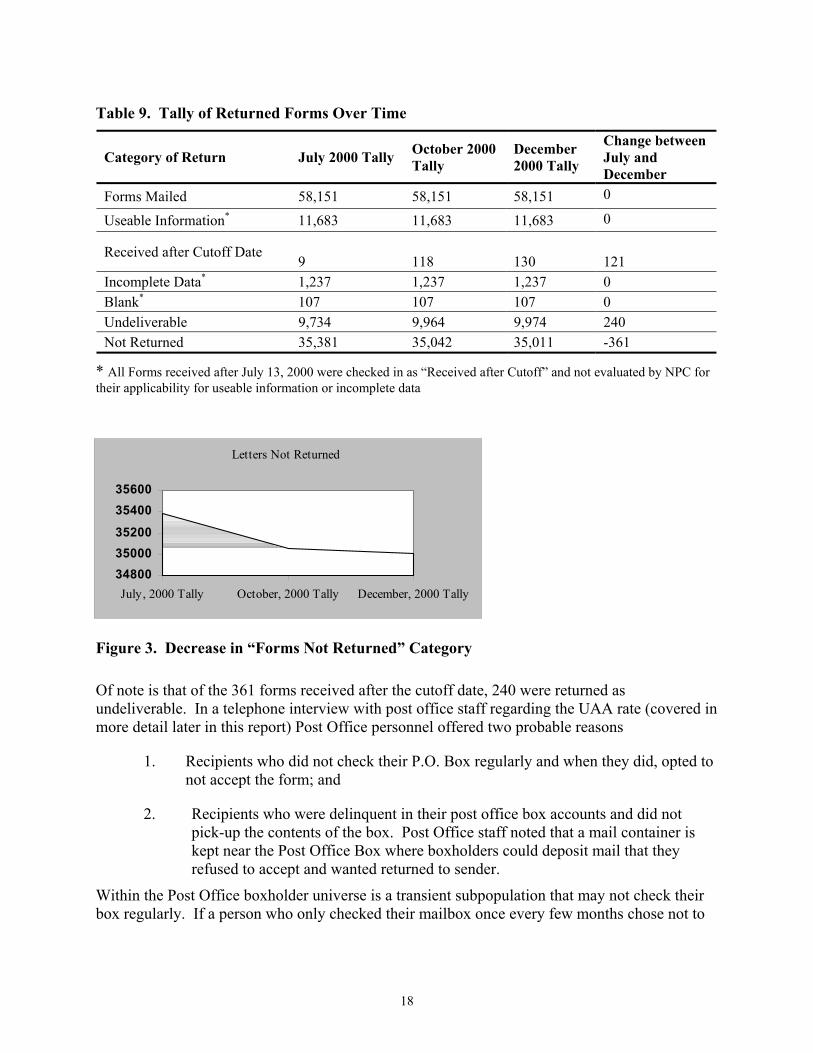
Table 9. Tally of Returned Forms Over Time
Category of Return July 2000 Tally October 2000 Tally
December 2000 Tally
Change between July and December
Forms Mailed 58,151 58,151 58,151 0
Useable Information* 11,683 11,683 11,683 0
Received after Cutoff Date 9 118 130 121
Incomplete Data* 1,237 1,237 1,237 0 Blank* 107 107 107 0 Undeliverable 9,734 9,964 9,974 240 Not Returned 35,381 35,042 35,011 -361
* All Forms received after July 13, 2000 were checked in as “Received after Cutoff” and not evaluated by NPC for their applicability for useable information or incomplete data
Letters Not Returned
34800 35000 35200 35400 35600
July , 2000 Tally October, 2000 Tally December, 2000 Tally
Figure 3. Decrease in “Forms Not Returned” Category
Of note is that of the 361 forms received after the cutoff date, 240 were returned as undeliverable. In a telephone interview with post office staff regarding the UAA rate (covered in more detail later in this report) Post Office personnel offered two probable reasons
1. Recipients who did not check their P.O. Box regularly and when they did, opted to not accept the form; and
2. Recipients who were delinquent in their post office box accounts and did not pick-up the contents of the box. Post Office staff noted that a mail container is kept near the Post Office Box where boxholders could deposit mail that they refused to accept and wanted returned to sender.
Within the Post Office boxholder universe is a transient subpopulation that may not check their box regularly. If a person who only checked their mailbox once every few months chose not to
18

accept the RFPA form, this will cause the form to be returned to the sender several months after the mailing.
Another situation that will cause a form to be returned undeliverable several months after mailing is one in which the post office boxholder is delinquent paying box rental fees. According to Post Office staff, when a box rental fee is late, due process dictates that several notices are given and a specified period of time elapse before contents can be seized and the box closed. In the meantime, mail continues to be delivered to the box. Once the box is closed and the contents are seized, the mail is returned to sender. Thus, another scenario is created where mail could be returned to sender several months after the mailing.
The reason for the forms returned late probably had little to do with the uniqueness of administrative records addresses or in how the RFPA was conducted. The primary cause of the late returns is likely the respondents themselves. Respondent comments on the forms suggest the form was “buried on my desk” or apologies were offered for returning the form late.
4.2.3 Forms Returned with Incomplete Data
Based on a review of forms returned with incomplete data, the primary reasons for forms returned incomplete appear to be:
• shortcomings in the form design;
• respondent misunderstanding the intent of the RFPA form; and
• respondent unwillingness to participate in the operation.
• Shortcomings in the form design: Of the 1,237 forms checked in as incomplete, almost half (596) were returned with a note stating the address was used for business only. Because of this comment, the forms were classified as incomplete. Future form design should include a check box for businesses.
• Respondent misunderstanding of the intent of the RFPA form: If instructions on the form were not clear, a respondent might not complete enough information on the form to geocode their physical address. There are indications that the intent of the form was not understood by the respondents. Some Air Force Academy cadets filled out the name portion of the form and then checked the no home address box on the form. While technically the cadets may not have a home address at the time, this was not the intent of what the no home address box was trying to capture. Also suggesting respondent confusion on the intent of the mailing, 181 respondents commented that they had already responded to the census and vented frustration with having to complete yet another form. This effect can partially be attributed to the timing of the mailing. Many respondents appeared frustrated that they had filled out a Census 2000 form, been visited by an enumerator and now received this form from the Census Bureau. A wider gap in time between Census 2000 and the mailing of the RFPA form might have eliminated some of this confusion and frustration experienced by the respondents and improved the response rate of the forms. Also indicating some confusion on the part of the respondents, regarding the intent of the RFPA form, is the tally of calls to the Tucson Telephone Support Center. During the RFPA operation, 338 calls came into the RFPA toll free number listed in the RFPA mailing. Telephone support staff was provided a background paper addressing the category of questions. A tally
19
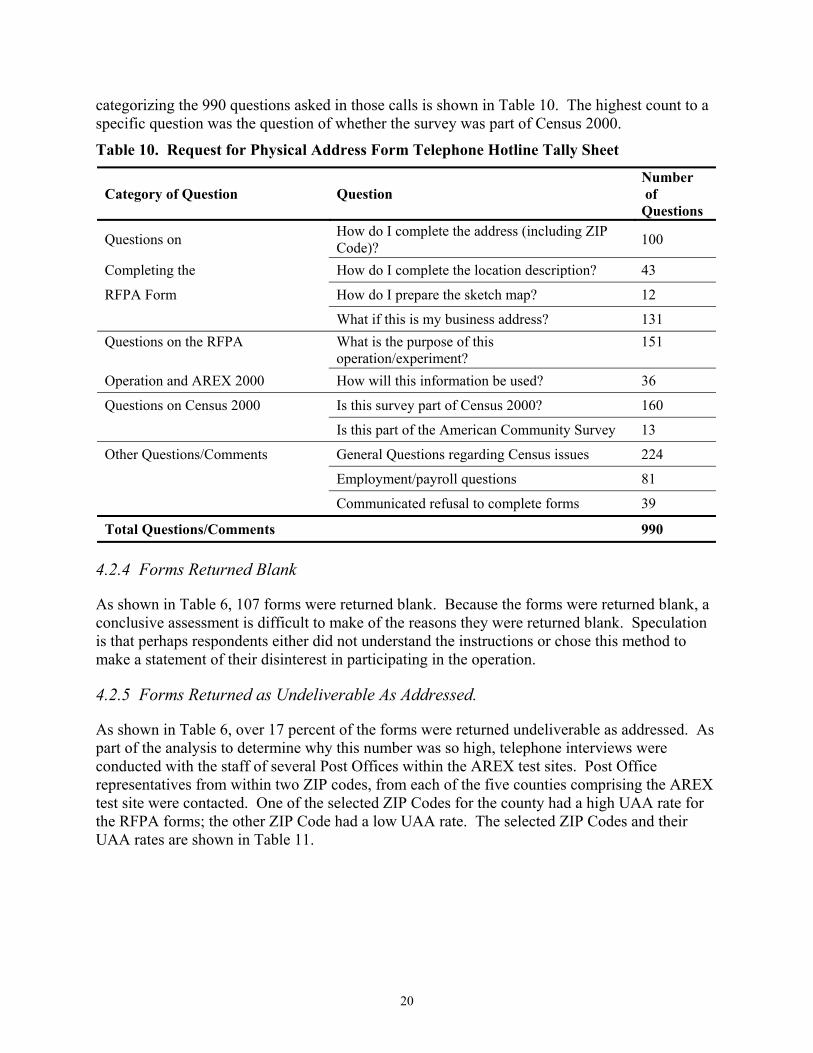
categorizing the 990 questions asked in those calls is shown in Table 10. The highest count to a specific question was the question of whether the survey was part of Census 2000.
Table 10. Request for Physical Address Form Telephone Hotline Tally Sheet
Number Category of Question Question of
Questions
Questions on How do I complete the address (including ZIP Code)? 100
Completing the How do I complete the location description? 43
RFPA Form How do I prepare the sketch map? 12
What if this is my business address? 131 Questions on the RFPA What is the purpose of this 151
operation/experiment? Operation and AREX 2000 How will this information be used? 36
Questions on Census 2000 Is this survey part of Census 2000? 160
Is this part of the American Community Survey 13
Other Questions/Comments General Questions regarding Census issues 224
Employment/payroll questions 81
Communicated refusal to complete forms 39
Total Questions/Comments 990
4.2.4 Forms Returned Blank
As shown in Table 6, 107 forms were returned blank. Because the forms were returned blank, a conclusive assessment is difficult to make of the reasons they were returned blank. Speculation is that perhaps respondents either did not understand the instructions or chose this method to make a statement of their disinterest in participating in the operation.
4.2.5 Forms Returned as Undeliverable As Addressed.
As shown in Table 6, over 17 percent of the forms were returned undeliverable as addressed. As part of the analysis to determine why this number was so high, telephone interviews were conducted with the staff of several Post Offices within the AREX test sites. Post Office representatives from within two ZIP codes, from each of the five counties comprising the AREX test site were contacted. One of the selected ZIP Codes for the county had a high UAA rate for the RFPA forms; the other ZIP Code had a low UAA rate. The selected ZIP Codes and their UAA rates are shown in Table 11.
20

Table 11. UAA Profile of ZIP Codes Selected for Analysis
County Zip # of Forms # of Forms
Mailed Returned UAA
% UAA Rate
Baltimore City (Maryland) 21202 14 10 71% Baltimore City (Maryland) 21205 143 10 7% Baltimore County (Maryland) 21204 70 45 64% Baltimore County (Maryland 21023 126 2 2% Jefferson County (Colorado) 80439 20 16 80% Jefferson County (Colorado) 80001 994 144 14% Douglas County (Colorado) 80126 28 25 89% Douglas County (Colorado 80131 139 17 12% El Paso County (Colorado) 80913 1,455 996 68% El Paso County (Colorado) 80132 1,091 142 13%
Staff was contacted from each of the Post Offices from the selected ZIP codes and asked a set of questions. The intent of the questions was to determine if there was significant Post Office procedural issues that might explain the deviation between high UAA rates and low UAA rates. The following questions were asked:
1. Does a P.O. Box address need a name to make it deliverable?
2. Under what situation is a form addressed to a resident at a P.O. Box returned as UAA?
3. Once a patron closes a P.O. Box, is there a standard period of time where mail is forwarded to a new address (if any) specified by the patron? If so, for how long?
4. Once a patron closes a P.O. Box, is there a policy that specifies a period of time the Box remains vacant before it is rented to the next person? If the box is rented immediately, is there an explanation for why a form addressed to the “resident” of the P.O. Box is returned as undeliverable (as opposed to being delivered to the new boxholder)?
• What Was Learned From the Telephone Interview? The significant results of each of the four questions follow. Detailed discussion of the findings follows the list.
• With the exception of one of the Post Offices contacted, all will deliver a first class form not having a name associated with the address.
• Post Offices make it convenient for boxholders to not accept mail and return it to sender.
• Patrons can specify that mail be forwarded for up to one year after closing the box.
• There is no standard period among post offices for how long a box remains unrented after it is closed out. While most Post Offices said they like the box to remain empty for a period between renters, it is often based on customer demand for the boxes.
21
• Question 1 - Is mail delivered when there is no name?
Staff from nine out of the ten Post Offices contacted said that mail would be delivered to a box addressed “To Resident at” (used in the name field of the RFPA mailing). One Baltimore Post Office staff person said a first class form without a name could not be guaranteed delivery. She said a third class form without a name would be more assured of delivery. Her logic was that Post Office staff is sensitive to the fact that commercial operations pay third class rates specifically to deliver flyers/advertisements where there is not a name on the item. As such, they will ensure this mail is delivered. She said that she could not guarantee box clerks had the same sensitivity while delivering first class mail.
• Question 2 -What conditions would cause a form to be returned as undeliverable? All Post Office staff said that a closed box would be the primary cause of a form being returned as undeliverable. Of interest is that at least two of the Post Offices contacted said they have a mail bin convenient to the boxes so that boxholders can deposit mail they chose not to accept. This mail would be returned to sender as undeliverable.
• Question 3 - Is there a standard period of time when mail is forwarded? All Post Office staff said that this decision is entirely up to the boxholder. After closing the box, a boxholder can specify that mail either not be forwarded or forwarded for any time up to one year.
• Question 4 - Are boxes left vacant between renters? There is no standard policy about how long to leave a box vacant before renting it to a new client and it is often based on the customer demand for the boxes. Of interest is that the majority of Post Offices at ZIP Codes showing a high UAA rate, had policies whereby a box is left vacant for a period of time (range from 15 days to 3 months) between renters. This policy explains a high UAA rate in that the form would be addressed to a closed box and thus returned. If a box was rented immediately, the RFPA mailing (addressed “To Resident at”) was delivered to the new boxholder.
• General Observation from Discussions with Post Office Staff. An observation based on discussions with Post Office staff is that if there are any inconsistencies with the address, the ultimate delivery of the form is left up to the judgment/discretion of the person delivering the mail. Supporting this observation is the fact that ZIP Codes 21202 and 21204 have no Post Office Boxes assigned. As can be seen from Table 11, however, apparently 29 percent of the forms addressed to 21202 and 36 percent of those addressed to 21204 were in fact delivered. Post Office staff explained that there is another ZIP Code processed by their post office that does have P.O. Boxes and the box clerk probably surmised that was the intended destination of the mail.
4.2.6 Does Relative Geographic Location within the Test Site Have an Impact on the UAA Rate?
Another tact to assess influential factors was whether ZIP Codes that bordered neighboring counties had any significant change in their UAA rates. The data in Figure 4 show a comparison
22

of the overall UAA rate of all both test sites and the UAA rates for ZIP Codes on the periphery of test site counties. As seen from the data, the periphery UAA rates were actually lower than the overall UAA rate.
UAA Rate for Bordering ZIP Codes
0 5
10 15 20
All test site ZIPs ZIPs bordering another AREX
County
ZIPs bordering non-AREX
County
Perc
enta
ge o
f UA
A
Colorado Maryland
Figure 4. UAA Rate for ZIP Codes on County Borders
4.3 Did Respondents Provide Useful Information? Forms returned with useable information were forwarded to Regional Census Centers (RCC) for clerical geocoding. Maryland forms were forwarded to the Philadelphia RCC and Colorado forms to the Denver RCC. Using the information provided by respondents, the RCC staff attempted to clerically geocode the addresses to the State, County and Block level. Tables 12, 13 and 14 show results of this geocoding operation.
Table 12. Geocoding Rate of Returned Forms
Forms Percentage of Percentage of P.O. Box Address Number of Forms Returned Geocoded Forms with Forms Mailed AREX Test Site Forms with Useable to a Useable to the Test Site State of: Mailed Information Physical Information State that
Address that Geocoded Geocoded Maryland 18,694 3,538 2,377 67.2% 12.7% Colorado 39,457 8,145 7,047 86.6% 17.9%
23

Table 13. Analysis of Geocoded Addresses
P.O. Box Forms Forms Percentage of Forms Address Forms Sent For Geocoded to Geocoded to Sent for GeocodingPhysicalAREX Test Site Geocoding Address in Test Address Not that Geocoded to Test State of: Site in Test Site Site
Maryland 3,538 1,939 438 54.8% Colorado 8,145 6,168 879 75.8%
Table 14. Geocoded Addresses and Forms Returned With Useable Information
Number of Addresses Based on mailout ZIP Code, AREX Test Site Geocoded Number of Forms Returned
With Useable Information Baltimore City Maryland 774 690 Baltimore County Maryland 1,165 2,091 Forms mailed to addresses that were either Baltimore County N/A 757 or City based on ZIP Code Douglas County Colorado 685 757 El Paso County Colorado 3,099 3,220 Jefferson County Colorado 2,384 3,210 Forms mailed to addresses that were more than one Colorado Test Site County Based on ZIP N/A 959
Code Total 8,107 11,683
24

4.4 Who are the Post Office Box Holders?
The 58,151 unduplicated physical addresses in the AREX test site that comprised the RFPA mailing, were associated with 138,653 different individuals in administrative record source files. Of those individuals, 110,915 had addresses other than a Post Office Box address shown in source files. Of those associated with the mailout, 27,738 individuals (20 percent of those with associated with the mailout) had only a Post Office Box address in the source files.
Other characteristics from the returned forms are shown in Table 15.
Table 15. Characteristics of P.O. Box Holders
Number of Returned Number of Forms Number of Forms Returned
Forms Evaluated* Returned with “No Home with Comments that the P.O Address” Box Checked Box was Used for a Business
13,050 527 674
*Forms evaluated include those in the return categories of useable information; received after the cutoff and incomplete data return categories.
A review of the returned forms showed the “No Home Address” box was often checked for reasons other than what was intended. The intent of the box was to identify homeless individuals, or people who lived in other than a permanent place of residence (recreational vehicles, boats, etc). Many of the forms with this box checked were from people living on military installations or people who apparently just misunderstood the question.
25

5. RECOMMENDATIONS This section of the report will discuss lessons learned from the operation and provide recommendations regarding future initiatives to secure physical addresses for Post Office Boxholders. The discussion will include an opinion on whether the RFPA operation met the intended goal and what should change if we conducted this operation again. Also addressed will be suggestions for further analysis on the RFPA issue.
5.1 Conclusions
Listed below are conclusions from the analysis of the RFPA operation. Recommended solutions to problem areas are discussed later in this report.
5.1.1 The Request for Physical Address Operation Achieved its Goal
The goal of the RFPA operation was to obtain a physical address (potentially geocodable house number and street name) by mailing a form to holders of the P.O. Boxes and other noncity-style addresses and ask them to annotate their physical address on a form. Where respondents returned physical address information, an attempt was made to geocode them to the state; county and block level and determine if the addresses were within the test site.
The assessment of program success is described below, formatted in the two basic components of the goal statement:
1. Were we able to get a physical address from the respondents via the mailing? 2. When we got a physical address, were we able to determine if the address was in the test
site and geocode it to the state, county and block?
Getting a physical address. The operation proved that we could get a physical address for a holder of a P.O. Box/non-city style address if the form was returned. Table 16 depicts the relative success in this area.
Table 16. Rate of Forms Returned with Useable Information
Percentage of Percentage of P.O. Box Number of Number of Forms forms mailed that Forms With Address State Forms Returned with were returned Useable of Origin Mailed Useable Information with useable Information that
information Geocoded
Maryland 18,694 3,538 18.9% 67.2%
Colorado 39,457 8,145 21.7% 86.6%
• Determining if addresses are within the test site. This component of the operational goal was generally achieved. As shown in Tables 12 and 13, the forms returned with useable information, 81 percent were clerically geocoded by the RCC. Of those geocoded, the RCCs found 86 percent of those addresses to be within the AREX test sites.
26

5.1.2 The Timing of the Mailing Affected the Return Rate
One of the more revealing aspects of this operation was the low return rate of forms. Over 60 percent of the forms mailed were presumably delivered (not returned as undeliverable) and were not returned. Reasons for the low response rate could be many and the operation collected no hard data from which to accurately assess the reason. Analysis of returned forms, however, suggest there was some degree of confusion among recipients regarding the relationship between the RFPA operation and Census 2000. One could speculate that this confusion could have caused some respondents to not return their forms.
In reviewing the returned forms, there were a number of comments from respondents who were concerned that they were required to submit this additional census form. In forms that actually geocoded to the test site counties there were at least 532 respondents who expressed, concern or frustration with having to fill out yet another census form. As pointed out in the earlier section for the forms returned incomplete, 181 respondents expressed the same sentiments regarding this form and its relationship to Census 2000 and 160 people called the TTC hotline questioning if the survey was part of Census 2000. Although these numbers are not large, they are significant enough to suggest that there was misunderstanding on the respondents’ part that whether they should reply to both the Census 2000 form and the RFPA request. If that is true, then it is reasonable to believe that many of the forms that were received but not returned by respondents were due to the respondents’ believe they had already provided the information or their frustration in responding to census form requests.
If this factor did negatively affect the form return rate, in a full scale ARC, the impact will be mitigated. With fewer census forms in the mail, there might be a better chance that respondents would reply to forms they did receive. In a less than full scale ARC such as coverage improvement, there would be no mitigation of this effect. Forms would be mailed to respondents who might have opted not to reply to previous solicitations and therefore would not complete and return an RFPA form.
5.13 Unintended Recipients Affected the Results
An underlying phenomenon regarding the Post Office Boxes mailing and response is that we can’t be sure the person who received the mailing and responded is actually the person that was linked to that box in the administrative records source files. This can be attributed to:
1. The time elapsed between the date of the administrative record source file data and the mailing of the RFPA materials.
2. The potential high turnover rental rate of Post Office Boxes.
As stated in Section 4 of this evaluation the URF could have affected all categories of the return disposition of the form – forms returned and not returned. Because of this situation, any linkage between the person, the P.O. Box and the physical address might not be pure.
5.1.4 The Design of the Form Impacted the Results
Although the form generally suited the purpose of the RFPA, comments returned on the form suggest some areas of the form could have been expanded or revised to improve the quality of information that was returned. Suggested improvements are covered later in this paper.
27
5.2 What Can We Do Differently?
As shown in Table 7, the respondent reaction to the RFPA operation is estimated to have had a major influence on the low return rate. Two primary adjustments to the operation might have reduced this influence and improved the response rate are a redesign of the form and an adjustment to the mailing date of the forms.
5.2.1 Expand the Range of Questions
A review of the returned forms suggests that a broader range of questions on the form would have improved the quality of the responses. The recommended improvements are listed below
1. A checkbox needs to be included to allow the respondent to indicate the P.O. Box was used for a business only. Although some respondents chose to provide this information in the comment section, we cannot be certain that physical addresses provided by respondents with no comment that it was for a business were actually not for a business.
2. Information on the form needed to be more specific about separating the RFPA from Census 2000. As noted in Section 4, there was confusion among respondents regarding the RFPA relationship to Census 2000.
3. Add a question to allow the respondent to show how long they have had the P.O. Box. This will address the unintended recipient factor discussed in Section 5.
4. The “How would you describe the location where you live” was sometimes misinterpreted so that respondents provided information such as drug-infested, rural, etc. Perhaps something like “How would you give someone directions to your address” might work better.
5.2.2 Consider the Timing of the Mailing
The timing of the mailing at the same time mailings were being made for Census 2000, confused respondents. One alternative might have been to do the RFPA mailing a month before the Census 2000 mailings. Another alternative would have been to keep the mailing on the same schedule but provide more detailed instructions separating the RFPA from Census 2000 as noted in Section 5.
5.3 Areas for Further Study
5.3.1 Assess the impact of the Form Design and Timing of the Mailing on the Response Rate in a Re-mailing to the Original Addresses
After incorporating the recommended improvements noted above to the form, pretest the revised form and then mail it to the same addresses and conduct an operation to clerically geocoded the addresses. This will assist to determine the impact of the form design and timing of the mailing on the response rate while also providing more information from which to define the profile of holders of these types of addresses.
28

With the additional information gathered by the revised form, a comparison can be made of information returned by the respondents to information already contained on AREX files to assess further the impact of not conducting an RFPA operation.
5.3.2 Assess the Impact of the Form Design and Timing of the Mailing on the Response Rate by using another Universe of Administrative Record Addresses
To test the effect of the timing of the mail out and the impact of the age of the administrative record addresses used for the RFPA operation, one method is to identify a more timely set of P.O. Boxes and other types of non-city style addresses as the basis for another RFPA operation. A potential source of current administrative record addresses for this project is the Social Security Administrations Master Beneficiary File. One reason for focusing on these files is that once the extract specifications are written and tested, current extracts could be requested on a monthly basis.
5.3.3 Assess the Need for this Type of Operation
In administrative record source files, 27,738 people had no other type of address listed than the P.O. Box or other noncity style address. AREX 2000 showed the population geocoded to the block level was 2,345,487. Getting a geocodable address for the 27,738 people potentially will increase the test site population tally by one percent. Future experiments of this type should include consideration of whether the cost of resources to conduct the operation merit the value of a potential one percent increase in accuracy. Another option might be to evaluate if there are other ongoing census operations regarding these types of addresses where this function could be added.
29
REFERENCES Aguirre International (1995). Public Concerns About the Use of Administrative Records. Unpublished document available from the U.S. Bureau of the Census, July 12, 1995.
Alvey, Wendy and Scheuren, Fritz (1982). Background for an Administrative Record Census. Proceedings of the Social Statistics Section, Washington DC: American Statistical Association, 1982.
Buser, Pascal, Huang, Elizabeth, Kim, Jay K., and Marquis, Kent (1998). 1996 Community Census Administrative Records File Evaluation. Administrative Records Memorandum Series # 17. Washington, DC: U.S. Bureau of the Census.
Bye, Barry (1997). Administrative Record Census for 2010 Design Proposal. Washington, DC: United States Department of Commerce.
Czajka, John L., Moreno, Lorenzo, Schirm, Allen L. (1997). On the Feasibility of Using Internal Revenue Service Records to Count the U.S. Population. Washington, DC: Internal Revenue Service.
Edmonston, Barry and Schultze, Charles (1995) Modernizing the U.S. Census, National Academy Press, Washington DC.
Gellman, Robert (1997). Report on the Census Bureau Privacy Panel Discussion. Unpublished document available from the U.S. Census Bureau, June 20, 1997.
Knott, Joseph J. (1991). Administrative Records. Memorandum for Distribution List, Bureau of the Census, Washington DC, U.S. Bureau of the Census, November 12, 1991.
Myrskyla, Pekka (1991). Census by questionnaire--Census by registers and administrative records: The experience of Finland. Journal of Official Statistics, 7:457-474.
Myrskyla, Pekka, Taeuber, Cynthia, and Knott, Joseph (1996). Uses of administrative records for statistical purposes: Finland and the United States. Unpublished document available from the U.S. Census Bureau.
Pistiner, Arona, and Shaw, Kevin A. (2000). Program Master Plan for the Census 2000 Administrative Records Experiment (AREX 2000). Administrative Records Research Memorandum Series #49. U.S. Census Bureau.
Singer, Eleanor, and Miller, Esther (1992). Reactions to the use of Administrative Records: Results of Focus Group Discussions. Census Bureau report, Center for Survey Methods Research, August 24, 1992.
30

Zanutto, E. (1996). Estimating a population roster from an incomplete census using mailback questionnaires, administrative records, and sampled nonresponse followup. Presentation to the U.S. Bureau of the Census, 8/26/96.
Zanutto, Elaine, and Zaslavsky, Alan M. (1996). Modeling census mailback questionnaires, administrative records, and sampled nonresponse followup, to impute census nonrespondents. In Proceedings, Section on Survey Research Methods. Alexandria, VA: American Statistical Association.
Zanutto, Elaine, and Zaslavsky, Alan M. (1997). Estimating a population roster from an incomplete census using mailback questionnaires, administrative records, and sampled nonresponse followup. In Proceedings of the U.S. Bureau of the Census Annual Research Conference. Washington, DC: U.S. Census Bureau.
Zanutto, Elaine, and Zaslavsky, Alan M. (2001). Using administrative records to impute for nonresponse. To appear in R. Groves, R.J.A. Little, and J.Eltinge (Eds), Survey Nonresponse. New York: John Wiley.
The following document list is a compilation of Planning, Research and Development technical specifications that define the processes associated with the Request For Physical Address operation.
1. (2000) Specification for Printing and Mailing RFPA Letters (ARXR0001-02)
2. (2000) Specification for Creating the Address File for Input to DocuPrint (ARXR0002-01)
3. (2000) Specification for Check-In and Check-Out of the RFPA Letter (ARXR0003-03)
4. (2000) Specification for Keying Data from RFPA Letters (ARXR0004-02)
5. (2000) Receiving the RFPA Keyed Letter Data Files (ARXR0005-01)
31
Attachment 1. Reprint of “DocuPrint Delivers”
DocuPrint Delivers (Reprinted from the July 2, 1998, Census CounterParts) In 1992, the printing costs for the economic census were nearly $400,000. In 1997, this cost dropped to $100.000 and, for the first time all respondent packages were mailed out on time. The reason: a high-speed color printer called DocuPrint.
“DocuPrint offers real advantages for applications with multiple-form types or many small mailings, complicated assembly or variable data imprinting” said B.J.Fitzpatrick (EPCD), instrumental in coordinating the printing and forms mailout for the economic census. “If such applications are designed to use the features of DocuPrint, tailored packages (except for envelopes) can be entirely printed for each recipient in a single operation.”
DocuPrint was brought to the Census Bureau as part of the Computer Assisted Survey Research Office pilot project called Standardized Technology Assisted Mail Processing and is now being used by a number of divisions around the Census Bureau. Questionnaires, forms, letters and address books are just a few of the jobs performed by DocuPrint.
Print on demand lowers survey costs because there is not guessing as to the number of individual forms needed, no waste due to overprinting, no emergency reprinting costs if more forms are needed and no warehouse storage costs. If additional forms are needed, they can be printed in days, rather than weeks.
Another advantage to this new technology is that corrections to forms or documents (e.g., changes in NAICS codes on economic forms or new signatures due to staff changes) can be made immediately and stored on printer, eliminating the need to wait for new forms to arrive before printing can be resumed.
While the greatest savings in time and money are most evident with surveys, the benefits are not limited to large jobs. Divisions have used the printer for brochures, internal-use manuals, serialized official parking hang-tags, conference materials, reprints of forms and information cards placed on the tables in the cafeteria.
Files are submitted in Postscript or ASCII depending on the complexity of the job. Don’t be put off by Postscript programming. DPD offers programming services for those divisions who prefer not to prepare their own print files, and for the smaller jobs printed in Suitland, the DocuPrint staff can assist you in setting up and appropriate data file format. About 40 programmers have attended the free 10- hour class on DocuPrint programming offered by the Census Bureau by Elisabeth Busse, the Xerox consultant.
There is one printer at the Census Bureau and three in Jeffersonville. The size and complexity of the job determines where the printing is done, but most jobs are printed in DPD to take advantage of the automated folding and finishing equipment there, as well as DPD’s capability of processing and shipping large quantities of materials and maximizing postal savings. The printers are linked so a job being run in Jeffersonville may be reviewed in Suitland before the production run starts. Documents are stored in the printer and changes are easily made and viewed regardless of where they are being printed. More than 5000 forms are
32

currently stored on these printers, with plenty of room for new ones.
For application planning or to discuss the many printing capabilities and services available in DPD, call Don Overton (812-028-2080). For more information about DocuPrint, a demonstration or for on-site consulting, call Pam Lovell (301-457-3165) or Tracy Leonardis (301-457-3164) of the TMO staff., Elisabeth Busse(301-457-4783), Xerox consultant, or stop by room 2166-4.
DocuPrint’s vital statistics:
• Completed packages (letters, forms, instructions, brochures) may be printed
eliminating the need for manual assemble. r-and legal-size can be mixed in one job.
• Cost to print is 3 ½ cents per page. • Images both black and a highlight
color in one pass (up to 92 pages per minute).
• Prints in 10 highlight colors in addition to printing on colored paper. A variety of paper stock is also available.
• Staples up to 50 sheets per document.
Lette
33

Attachment 2. Request for Physical Address Letter (Form S-950 (L))
)
34
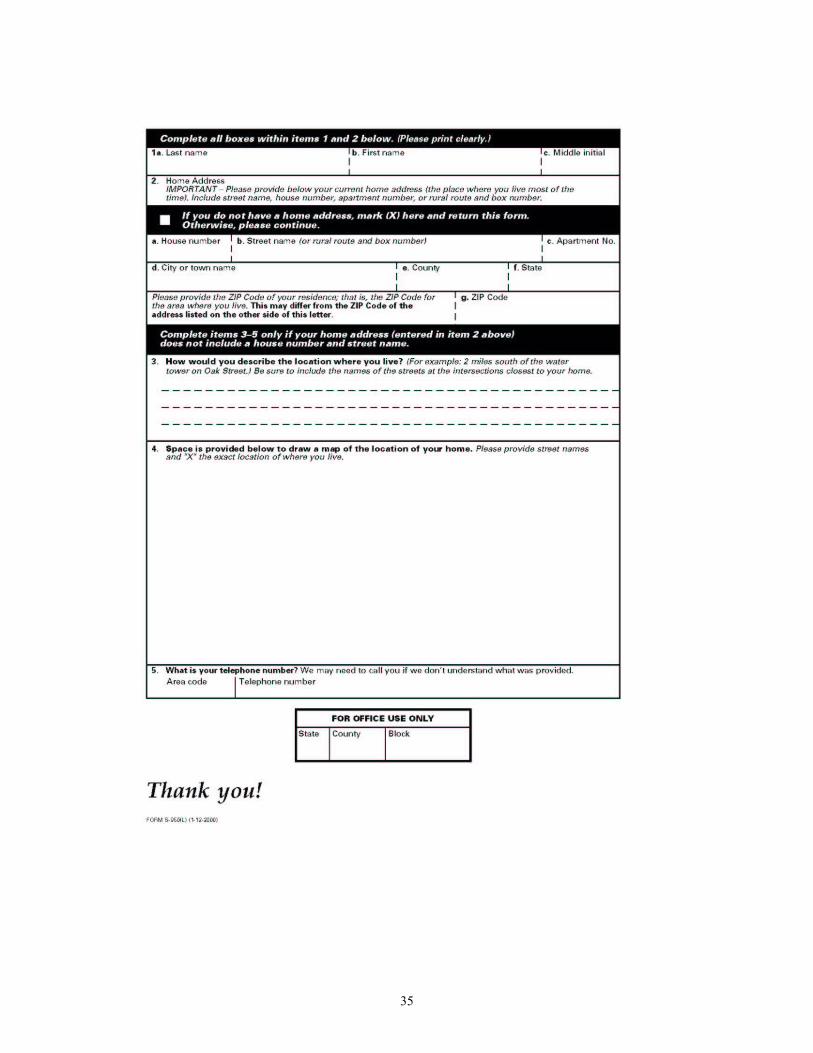
35

Attachment 3. Telephone Insert Card (Form S-949)
36