arep gaw aq forecasting. arep gaw section 4 – what are we forecasting? 2 what are we forecasting...
TRANSCRIPT

AREPGAW
AQ Forecasting
AREPGAW
Section 4 – What Are We Forecasting?
2
What Are We Forecasting – Averaging Time (3 of 3)
PM10 Daily Maximum Values, 2001Santiago, Chile (MACAM stations)
0
50
100
150
200
250
300
1-J
an
-01
1-F
eb
-01
1-M
ar-
01
1-A
pr-
01
1-M
ay-
01
1-J
un
-01
1-J
ul-
01
1-A
ug
-01
1-S
ep
-01
1-O
ct-0
1
1-N
ov-
01
1-D
ec-
01
Date
PM
10 (
ug
/Nm
3)
Air Quality Standard
Level 1 Alert
Level 2 Pre-Emergency
Ulriksen and Merino (2003)
AREPGAW
Section 4 – What Are We Forecasting?
3
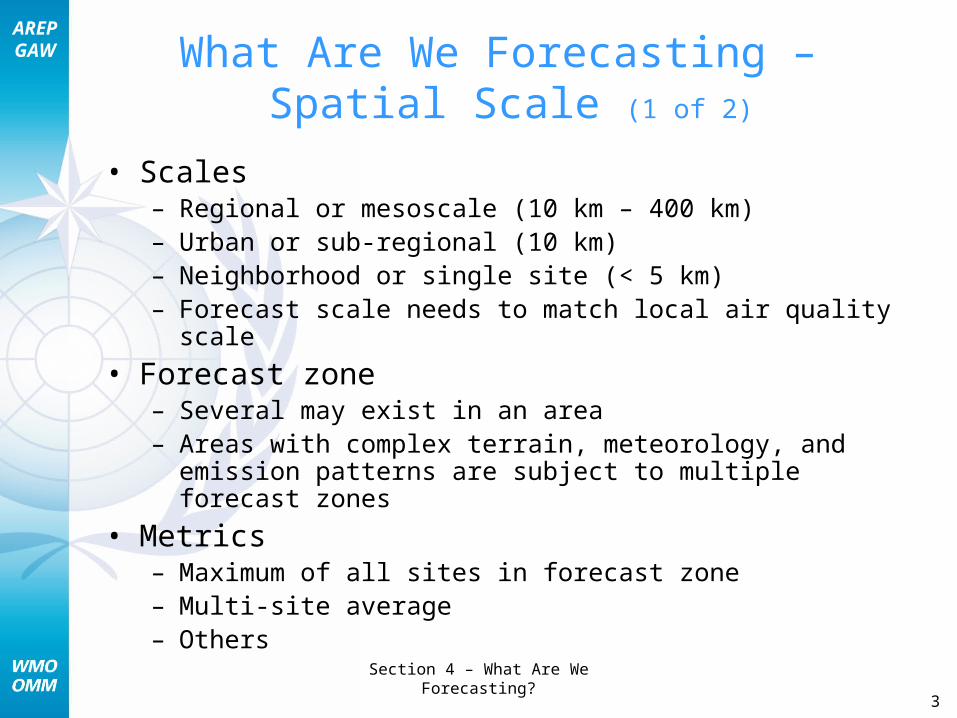
What Are We Forecasting – Spatial Scale (1 of 2)
• Scales– Regional or mesoscale (10 km – 400 km)– Urban or sub-regional (10 km)– Neighborhood or single site (< 5 km)– Forecast scale needs to match local air quality scale
• Forecast zone– Several may exist in an area– Areas with complex terrain, meteorology, and emission
patterns are subject to multiple forecast zones
• Metrics– Maximum of all sites in forecast zone– Multi-site average– Others
AREPGAW
Section 4 – What Are We Forecasting?
4
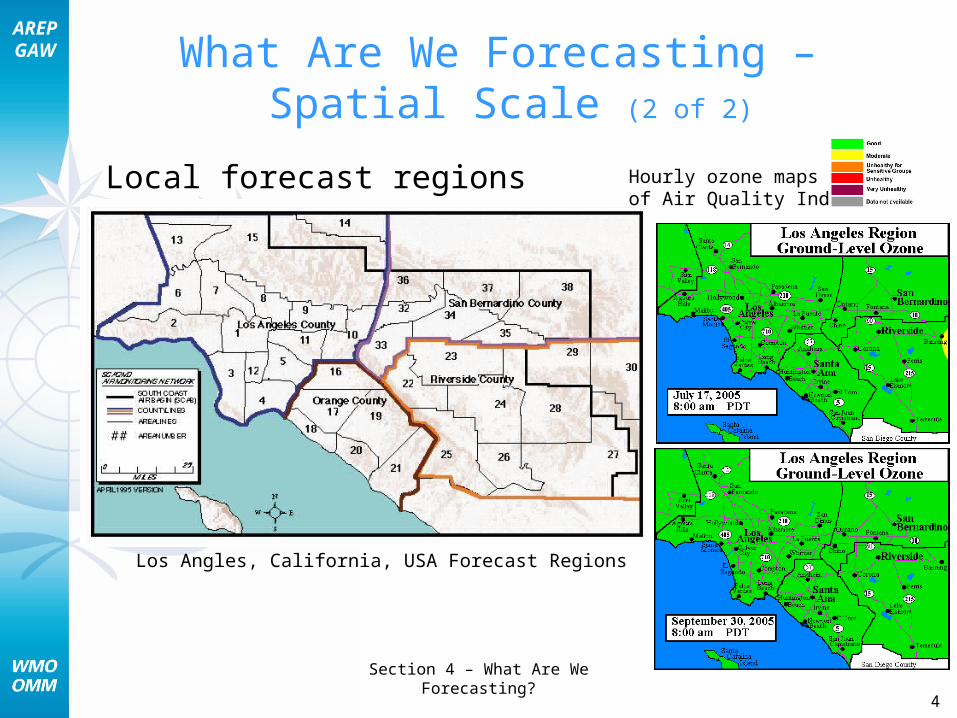
What Are We Forecasting – Spatial Scale (2 of 2)
Local forecast regions
Los Angles, California, USA Forecast Regions
Hourly ozone mapsof Air Quality Index
AREPGAW
Section 4 – What Are We Forecasting?
5
Summary
• Pollutants of concern– Major (ozone, particulate matter, carbon monoxide,
sulfur dioxide, and nitrogen dioxide)– Toxics
• Toxics are difficult to forecast because of uncertainties in emissions and their chemical change in the atmosphere
• What are we forecasting?– Units of measure– Averaging time– Spatial scale
AREPGAW
Section 4 – What Are We Forecasting?
6
Protect Public Health● Forecast allows the public to plan
– Activities to avoid exposure to unhealthy air
– Outdoor activities
– Health and medical care
● Forecasts are used by
– Air quality agencies (communications office)
– Media (television, newspaper, radio, and web)
– Public (general and sensitive individuals)
– Schools (scheduling outdoor activities)
● Critical forecast issues
– Timeliness (when do users need it)
– Localized forecasts
– Multi-day (one-to-five day) forecasts are useful
– Easy-to-understand format
AREPGAW
Section 4 – What Are We Forecasting?
7
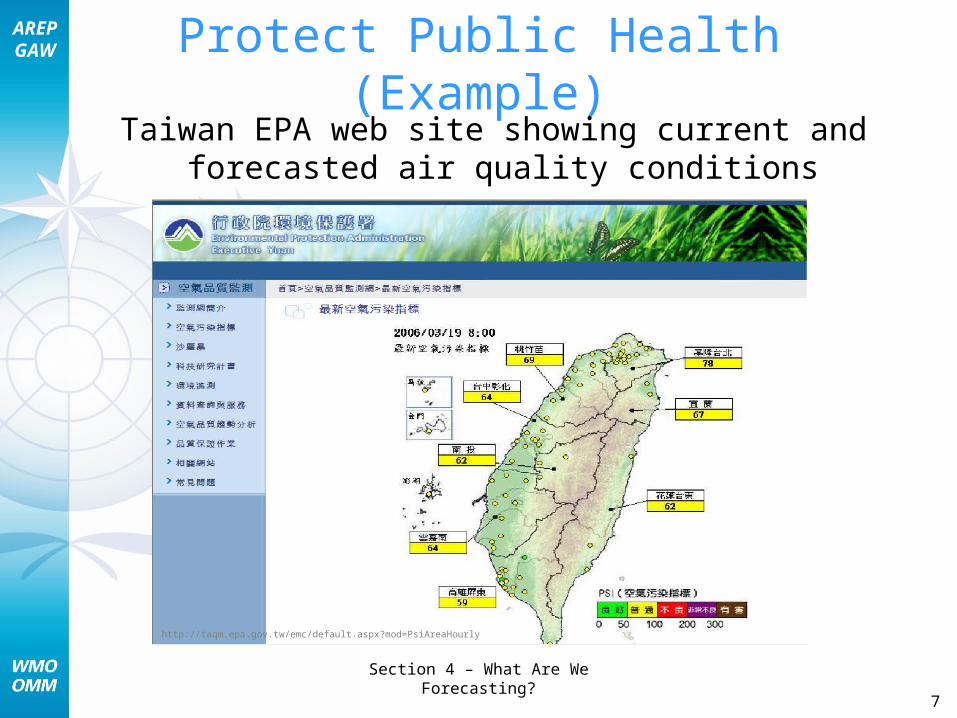
Protect Public Health (Example)Taiwan EPA web site showing current and
forecasted air quality conditions
http://taqm.epa.gov.tw/emc/default.aspx?mod=PsiAreaHourly
AREPGAW
Section 4 – What Are We Forecasting?
8
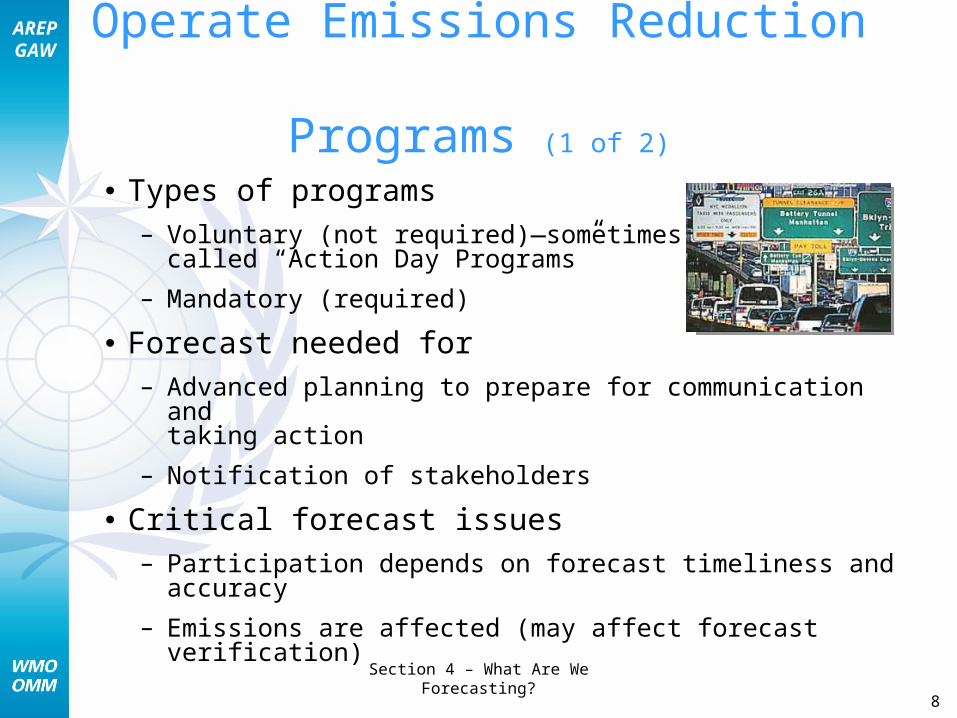
Operate Emissions Reduction Programs (1 of 2)
● Types of programs– Voluntary (not required)—sometimes
called “Action Day Programs”
– Mandatory (required)
● Forecast needed for – Advanced planning to prepare for communication and
taking action
– Notification of stakeholders
● Critical forecast issues – Participation depends on forecast timeliness and accuracy
– Emissions are affected (may affect forecast verification)
AREPGAW
Section 4 – What Are We Forecasting?
9
Operate Emissions Reduction Programs (2 of 2)
● Voluntary emissions reduction program
– Spare The Air (STA) Program (Action Day) in Sacramento, California, USA
– Objective – Seeks public involvement to voluntarily reduce emissions on forecasted Spare The Air Days
● How are forecasts used
– Spare The Air Day is triggered by a one-day forecast
– On Spare The Air Days
• Notify the public by television, public service announcements, radio, newspaper, fax, and web
• Ask the public to reduce emission-producing activities
– Reduce driving by carpooling (several people in one vehicle) and taking public transit
– Reduce use of paints, solvents, etc.
Source: www.sparetheair.com
AREPGAW
Section 4 – What Are We Forecasting?
10
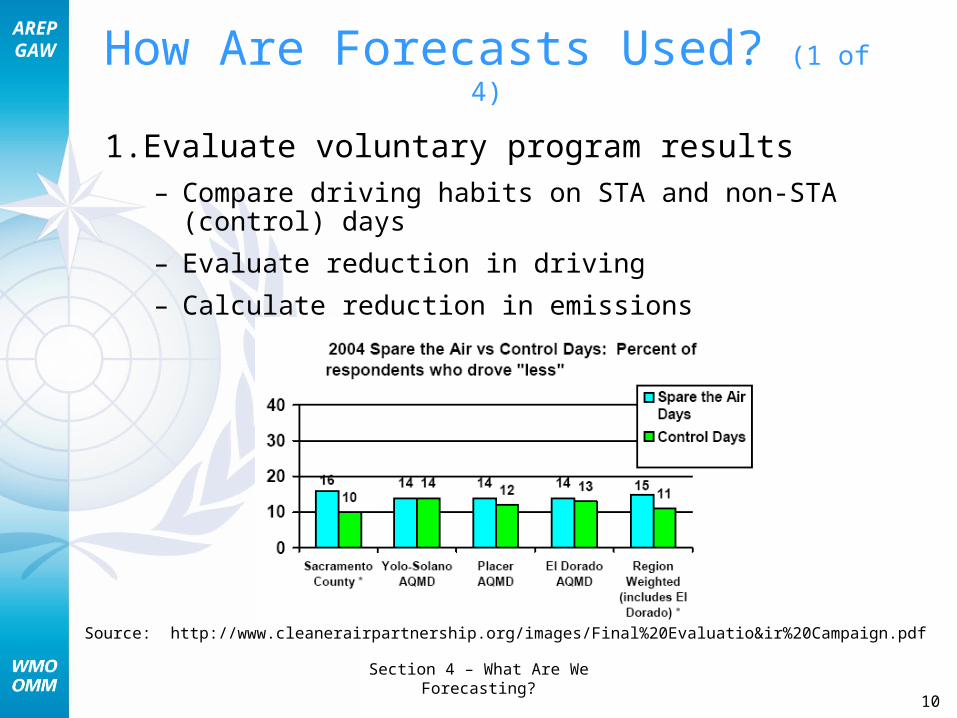
How Are Forecasts Used? (1 of 4)
1. Evaluate voluntary program results– Compare driving habits on STA and non-STA (control) days
– Evaluate reduction in driving
– Calculate reduction in emissions
Source: http://www.cleanerairpartnership.org/images/Final%20Evaluatio&ir%20Campaign.pdf
AREPGAW
Section 4 – What Are We Forecasting?
11
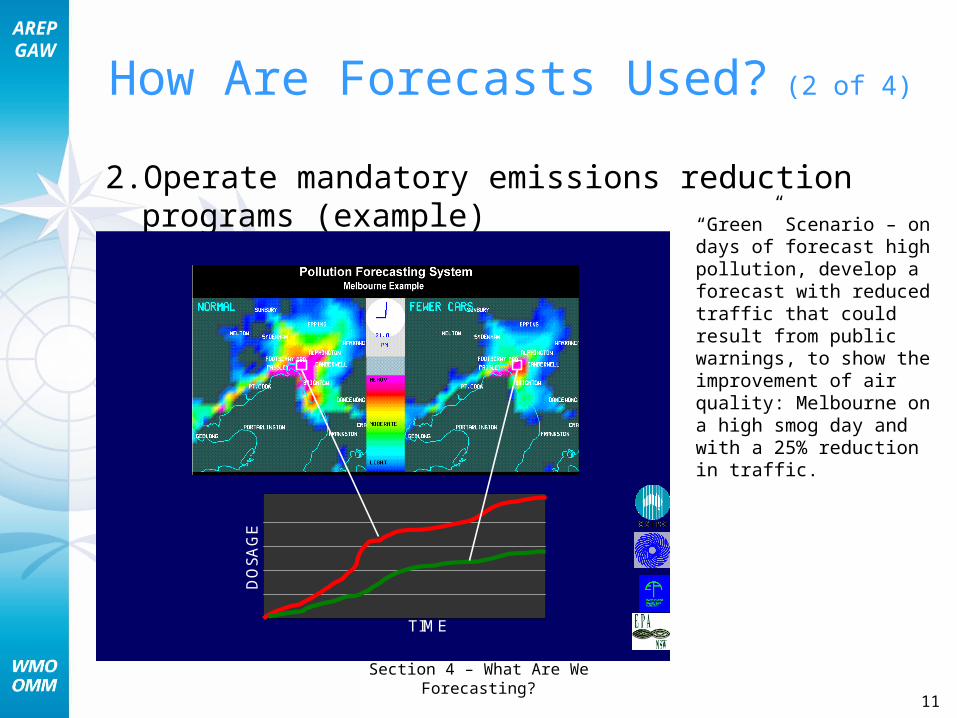
How Are Forecasts Used? (2 of 4)
2. Operate mandatory emissions reduction programs (example)
THE AUSTRALIAN AIR QUALITY THE AUSTRALIAN AIR QUALITY FORECASTING SYSTEMFORECASTING SYSTEM
DO
SA
GE
TIME
“Green” Scenario – on days of forecast high pollution, develop a forecast with reduced traffic that could result from public warnings, to show the improvement of air quality: Melbourne on a high smog day and with a 25% reduction in traffic.

AREPGAW
Section 4 – What Are We Forecasting?
12
How Are Forecasts Used? (3 of 4)
3. Conduct special sampling
– Several types of programs
• Localized special monitoring
• Regional monitoring
• Field studies
– Forecast are needed for
• Advanced planning to prepare monitoring or equipment (aircraft, samplers, other sensors)
• Sampled pre-episode conditions (day before high air quality concentrations)
– Critical forecast issues
• Obtaining detailed forecast
• Allowing sufficient time to prepare monitoring equipment and personnel
AREPGAW
Section 4 – What Are We Forecasting?
13
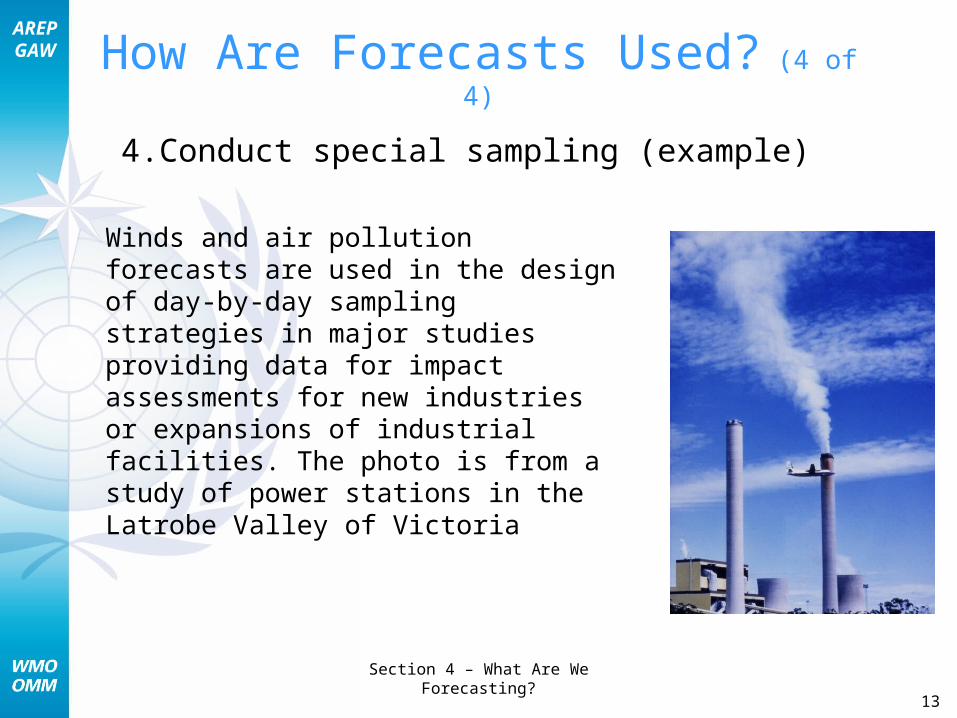
How Are Forecasts Used? (4 of 4)
4. Conduct special sampling (example)
Winds and air pollution forecasts are used in the design of day-by-day sampling strategies in major studies providing data for impact assessments for new industries or expansions of industrial facilities. The photo is from a study of power stations in the Latrobe Valley of Victoria
AREPGAW
Section 4 – What Are We Forecasting?
14
Summary
• Forecasts allow for planning (activities, exposure avoidance, health care) and action
• Forecasts are used by air quality agencies, media, public, industries, and schools
• Critical forecast issues include
– Timeliness
– Localized forecasts
– Multi-day
– Easy-to-understand format (Air Index)
AREPGAW
Section 4 – What Are We Forecasting?
15
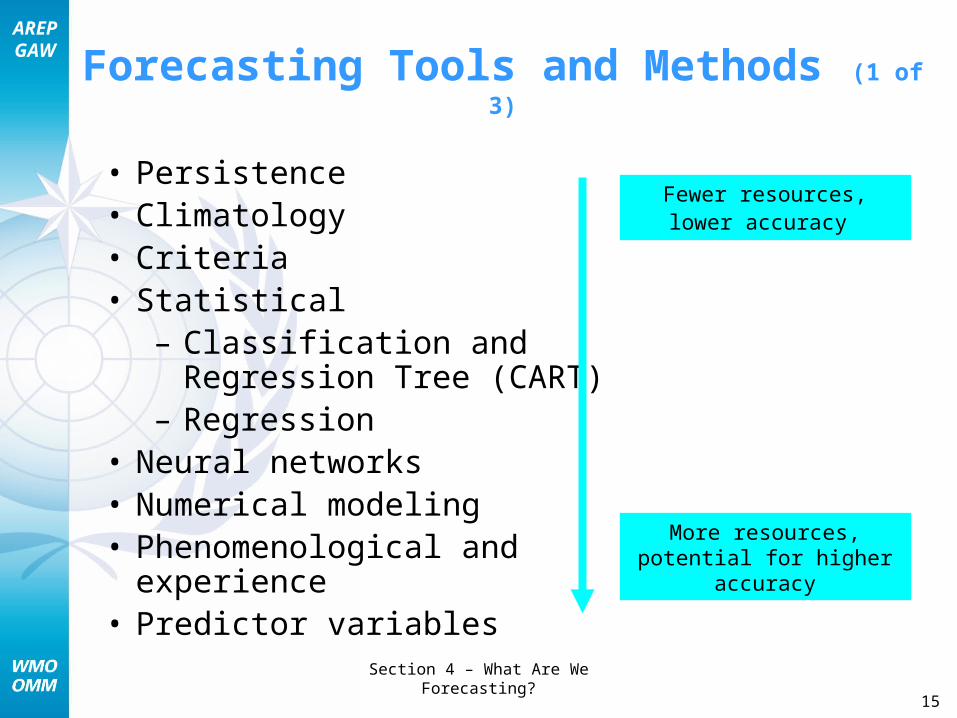
Forecasting Tools and Methods (1 of 3)
• Persistence• Climatology• Criteria• Statistical
– Classification and Regression Tree (CART)
– Regression• Neural networks• Numerical modeling• Phenomenological and
experience• Predictor variables
Fewer resources, lower accuracy
More resources, potential for higher accuracy
AREPGAW
Section 4 – What Are We Forecasting?
16
Tool development is a function of– Amount and quality of data (air quality and
meteorological)– Resources for development
• Human• Software• Computing
– Resources for operations • Human• Software• Computing
Forecasting Tools and Methods (2 of 3)
AREPGAW
Section 4 – What Are We Forecasting?
17
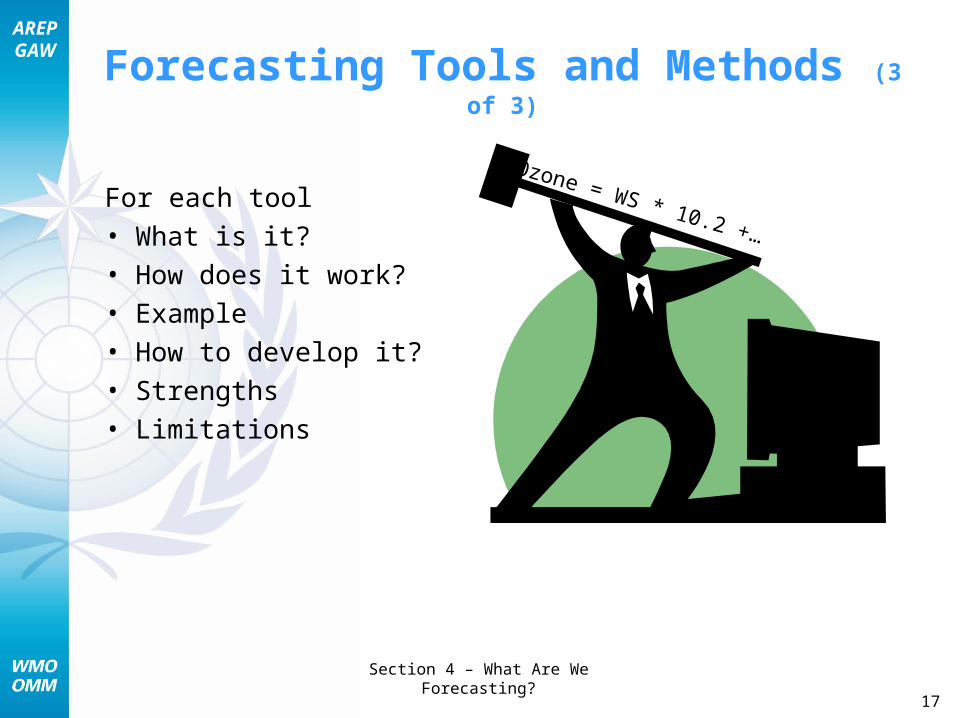
Forecasting Tools and Methods (3 of 3)
For each tool• What is it?• How does it work?• Example• How to develop it?• Strengths• Limitations
Ozone = WS * 10.2 +…
AREPGAW
Section 4 – What Are We Forecasting?
18
Criteria• Uses threshold values (criteria) of
meteorological or air quality variables to forecast pollutant concentrations– For example, if temperature > 27°C and
wind < 2 m/s then ozone will be in the Unhealthy AQI category
• Sometimes called “rules of thumb” • Commonly used in many forecasting programs
as a primary forecasting method or combined with other methods
• Best suited to help forecast high pollution or low pollution events, or pollution in a particular air quality index category range rather than an exact concentration
AREPGAW
Section 4 – What Are We Forecasting?
19
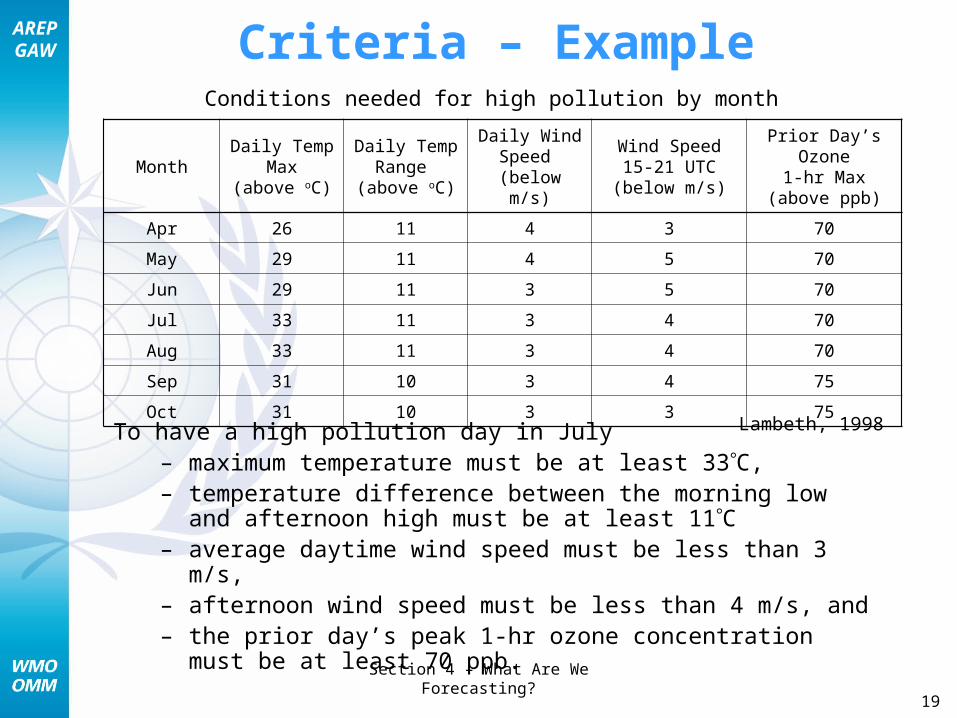
Criteria – Example
To have a high pollution day in July– maximum temperature must be at least 33C, – temperature difference between the morning low and
afternoon high must be at least 11C– average daytime wind speed must be less than 3 m/s, – afternoon wind speed must be less than 4 m/s, and– the prior day’s peak 1-hr ozone concentration must be
at least 70 ppb.
MonthDaily Temp
Max(above oC)
Daily TempRange
(above oC)
Daily WindSpeed
(below m/s)
Wind Speed15-21 UTC(below m/s)
Prior Day’s Ozone1-hr Max
(above ppb)
Apr 26 11 4 3 70
May 29 11 4 5 70
Jun 29 11 3 5 70
Jul 33 11 3 4 70
Aug 33 11 3 4 70
Sep 31 10 3 4 75
Oct 31 10 3 3 75
Lambeth, 1998
Conditions needed for high pollution by month
AREPGAW
Section 4 – What Are We Forecasting?
20
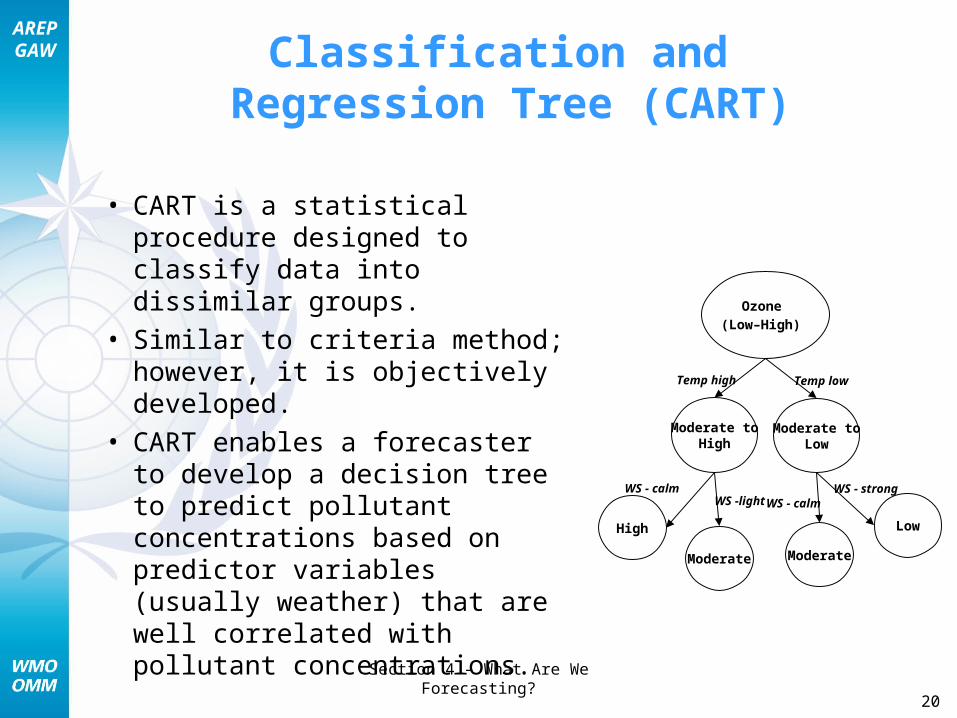
Classification and Regression Tree (CART)
• CART is a statistical procedure designed to classify data into dissimilar groups.
• Similar to criteria method; however, it is objectively developed.
• CART enables a forecaster to develop a decision tree to predict pollutant concentrations based on predictor variables (usually weather) that are well correlated with pollutant concentrations.
Ozone
(Low–High)
Moderate toHigh
Moderate toLow
Temp lowTemp high
WS - strong
Moderate Moderate
High Low
WS - calmWS - calm
WS -light
AREPGAW
Section 4 – What Are We Forecasting?
21
CART – How It Works (1 of 2)
The statistical software determines the predictor variables and the threshold cutoff values by
– Reading a large data set with many possible predictor variables
– Identifying the variables with the highest correlation with the pollutant
– Continuing the process of splitting the data set and growing the tree until the data in each group are sufficiently uniform
AREPGAW
Section 4 – What Are We Forecasting?
22
Summary
• Wide range of forecast tools• Each type has advantages and
disadvantages• More tools result in better forecasts• Consensus forecasting can produce
better results
AREPGAW
Section 13Developing a
Forecasting Program
Understanding Users’ NeedsUnderstanding the Processes that Control Air Quality
Choosing Forecasting ToolsData Types, Sources, and Issues
Forecasting ProtocolForecast Verification
AREPGAW
Section 4 – What Are We Forecasting?
24
Understanding Users’ Needs
• Success depends on forecast– Accuracy– Meeting the users’ needs
• Three main uses (Section 5)– Protect public health– Operate emissions reduction programs– Conduct special monitoring
• Consider these issues– Size of forecast domain– Population affected– Pollutants to forecast– Industries to be controlled– Smog transport
• Process– Gather stakeholders– List of questions (next three slides)
AREPGAW
Section 4 – What Are We Forecasting?
25
Who will use the forecast?• For how many months are forecasts needed?
– Certain season (summer and fall)• What periods should a forecast cover?
– Current and next day– 1-5 days
• Are multi-day forecasts needed for weekend/holiday periods?
Understanding Users’ Needs – Forecast Specification Questions (1 of 3)
AREPGAW
Section 4 – What Are We Forecasting?
26
Understanding Users’ Needs – Forecast Specification Questions (2 of 3)
• What are the accuracy requirements?– Define target first– Make sure it is reasonable
• What area do the air quality forecasts cover?– Regional maximum– Sub-regions or monitoring sites
• Are written forecast discussions of predicted weather and air quality conditions needed?

AREPGAW
Section 4 – What Are We Forecasting?
27
Understanding Users’ Needs – Forecast Specification Questions (3 of 3)
• How should forecasts be disseminated? – E-mail, fax, phone– Web site
• When should forecasts be issued to meet deadlines?
• Should forecasts be re-issued? If so, under what conditions?
• Should forecasts be made for specific concentrations or concentration ranges (e.g., AQI or API categories)?
• How should missed forecasts be handled?
AREPGAW
Section 4 – What Are We Forecasting?
28
Choosing Forecasting Tools (1 of 3)
• General guidelines– Start with simple tools and add complex tools later– Consensus approach to forecasting works best– Establish a reliable product (not necessarily the most
accurate)– Persistence, time series, and climatology tools will
never identify a significant change in air quality– Regression, CART, and neural networks require time
to develop and validate, but are usually more accurate than persistence
– Photochemical modeling can be more accurate, but requires significant resources
• Resource considerations– Development costs vs. operational costs– Time needed to forecast
AREPGAW
Section 4 – What Are We Forecasting?
29
Choosing Forecasting Tools (2 of 3)
• Severity of problem– Seasons, number of pollutants to forecast– Limited problem – use simple methods– Severe problem – use many forecasting methods
• Consensus forecasting works best– More tools provide a better forecast– Cumulative knowledge of all forecasting tools is
greater than using a single tool– As the pollution problem becomes more
complex, no single forecasting tool can reliably predict all relevant factors
AREPGAW
Section 4 – What Are We Forecasting?
30
Choosing Forecasting Tools (3 of 3)
• Experience– Some forecasting tools require extensive
experience– Working with a local university/firms to
develop tools can be beneficial – No tool can replace forecaster experience
AREPGAW
Section 4 – What Are We Forecasting?
31
Forecast Verification Overview
• Comparing forecasts to actual observations to quantify success of forecasting program
• Topics
– Why verify air quality forecasts?– Schedule– Types of verification: categorical and discrete– Contingency table and examples– Performance targets– Forecast retrospective
AREPGAW
Section 4 – What Are We Forecasting?
32
Forecast Verification
• Why verify air quality forecasts?– Quantify the performance of forecasters
and/or the forecast program– Identify trends in forecast performance over
time– Quantify improvements from new (or
changes in) forecasting methods/tools– Compare verification statistics to those from
other agencies that forecast air pollution– Demonstrate the performance of forecasts to
program participants, stakeholders, and the media
AREPGAW
Section 4 – What Are We Forecasting?
33
Forecast Verification Schedule (1 of 4)
• Daily verification – Can identify systematic problems– Can identify mistaken analysis of events– Can identify problems with data– Provides opportunity for mid-season procedure
corrections
• Seasonal verification– Identifies if model/methodology is appropriate– Benchmarks performance of models and
forecasters
AREPGAW
Section 4 – What Are We Forecasting?
34
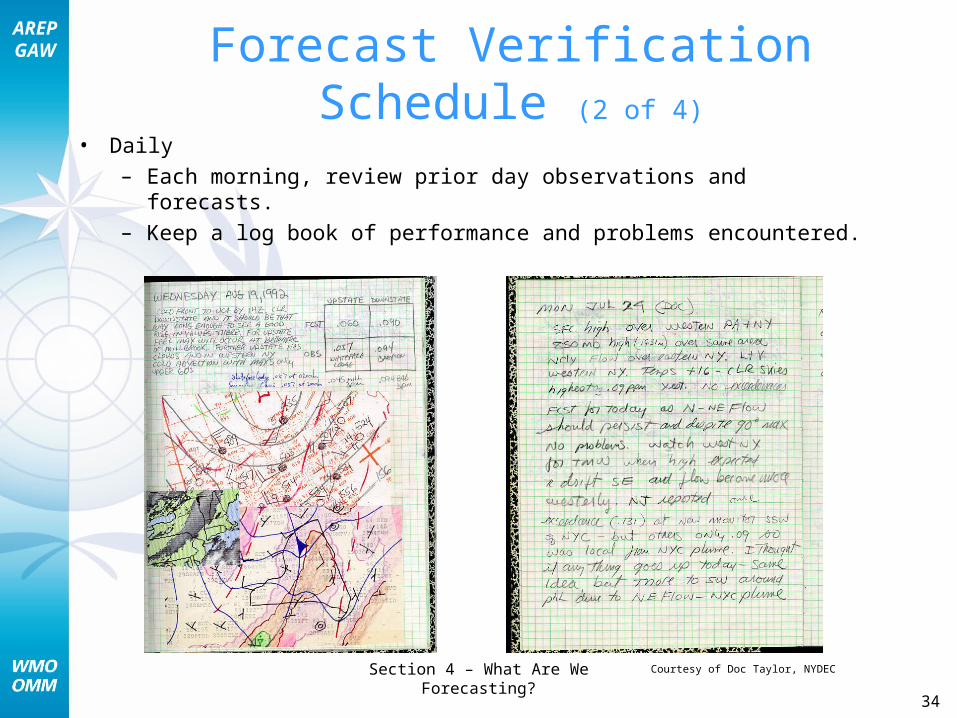
Forecast Verification Schedule (2 of 4)
• Daily – Each morning, review prior day observations and forecasts.– Keep a log book of performance and problems
encountered.
Courtesy of Doc Taylor, NYDEC
AREPGAW
Section 4 – What Are We Forecasting?
35
Summary (1 of 2)
• Understanding users’ needs
– Size of forecast domain– Population affected– Pollutants to forecast– Industries to be controlled– Smog transport
• Understanding the processes that control air quality
– Literature reviews– Data analysis
• Choosing forecasting tools
– Start with simple methods– Use more than one method– Forecaster experience is critical

AREPGAW
Section 4 – What Are We Forecasting?
36
Summary (2 of 2)
• Data types, sources, and issues
– Standardize units– Continuously evaluate data quality
• Forecasting protocol
– Written procedures for forecasting– Saves time and improves quality of forecast
• Forecast verification
– Evaluate daily, monthly, seasonally– Categorical and discrete statistics– Set realistic goals– Some misses will occur