are preterm births on the decline in the united states ... data brief no. 39 may 2010 2 • the u.s....
TRANSCRIPT

NCHS Data Brief ■ No. 39 ■ May 2010
Are Preterm Births on the Decline in the United States? Recent Data From the National Vital Statistics System
Joyce a. martin, m.p.h.; michelle J.K. osterman, m.h.s.; and paul d. sutton, ph.d.
Key findings• Following a long period of fairly steady increase, the U.S. preterm birth rate declined for the second straight year in 2008 to 12.3 percent, from 12.8 percent in 2006.
• Thismarksthefirst2-yeardecline in the preterm birth rate in nearly three decades.
• Preterm birth rates declined from 2006 to 2008 for mothers of all age groups under age 40, for the three largest race and Hispanic origin groups and for most U.S. states.
• The percentage of preterm births was down for all types of deliveries from 2006 to 2008, for cesareans and for induced and noninduced vaginal deliveries.
u.s. depa
The U.S. preterm birth rate (less than 37 weeks of gestation) rose by more thanone-thirdfromtheearly1980sthrough2006(1).Thisrisehasbeenacauseofgreatconcern(2,3).Preterminfantsareatincreasedriskoflife-longdisability and early death compared with infants born later in pregnancy (2,4).
Many reasons, such as changes in maternal demographics and increases in multiple births, have been suggested for the growth in preterm births (5). Another factor cited is the heightened use of obstetric interventions such as induction of labor and cesarean delivery earlier in pregnancy (5,6,7). Although it is not possible to know whether an infant would be born preterm if labor was not induced or delivered by cesarean, studies suggest that increased use of these procedures before 37 completed weeks of gestation mayhaveinfluencedtheupswinginpretermbirthrates(6,7).
Preliminary2007and2008birthcertificatedatarevealashiftinthelongupwardtrendinpretermbirths(8,9).Thisreportdescribesthischange.
Keywords: preterm, late preterm, state-specific preterm birth rates
The U.S. preterm rate declines for the second straight year―the first 2-year decline in nearly three decades.
rtment of health and human servicescenters for disease control and prevention
national center for health statistics
NCHS Data Brief ■ No. 39 ■ May 2010
• The U.S. preterm birth rate declined for the second straight year in 2008, to 12.3 percent of all births, down 3 percent from 2007 (12.7 percent) and 4 percent from 2006 (12.8) (Figure 1).
• Thepretermratehadbeengenerallyclimbingsince1981,rising13percentfrom1981(theearliestyearforwhichcomparabledataareavailable)to1990andmorethan20percentforthemorerecentperiod,1990to2006(1).
• The percentage of infants born late preterm (34 to 36 weeks of gestation) declined 3 percent, from9.1percentin2006to8.8percentin2008;thelatepretermbirthratehadrisen25percentbetween1990(7.3percent)and2006.Althoughatlessriskthaninfantsbornbefore34weeks,latepreterminfantsaremorelikelytoexperiencelong-termneurodevelopmentalproblemsandtodiewithinthefirstyearoflifethaninfantsbornatterm(2,4).
• The percentage of newborns delivered early preterm (less than 34 weeks of gestation) was also down in 2008, to 3.6 percent, compared with 3.7 percent in 2006. This level had risen from3.3percentin1990.Infantsdeliveredearlypretermaremuchmorelikelytosufferlong-termdisabilityandearlydeaththanthosebornafter34weeks(2,4).
Preterm births are down for women of all age groups under age 40.
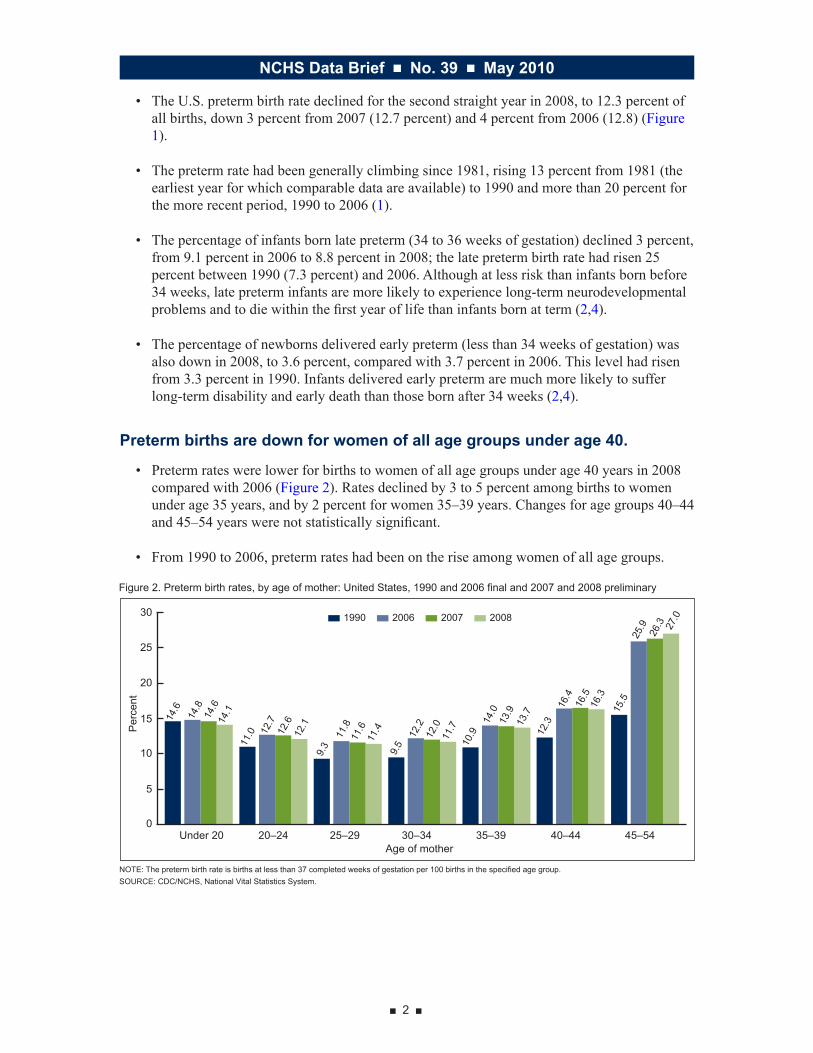
• Preterm rates were lower for births to women of all age groups under age 40 years in 2008 compared with 2006 (Figure 2). Rates declined by 3 to 5 percent among births to women underage35years,andby2percentforwomen35–39years.Changesforagegroups40–44and45–54yearswerenotstatisticallysignificant.
• From1990to2006,pretermrateshadbeenontheriseamongwomenofallagegroups.
■ 2 ■
NCHS Data Brief ■ No. 39 ■ May 2010
From 2006 to 2008, preterm birth rates dropped 5 percent among non-Hispanic white and non-Hispanic black infants.
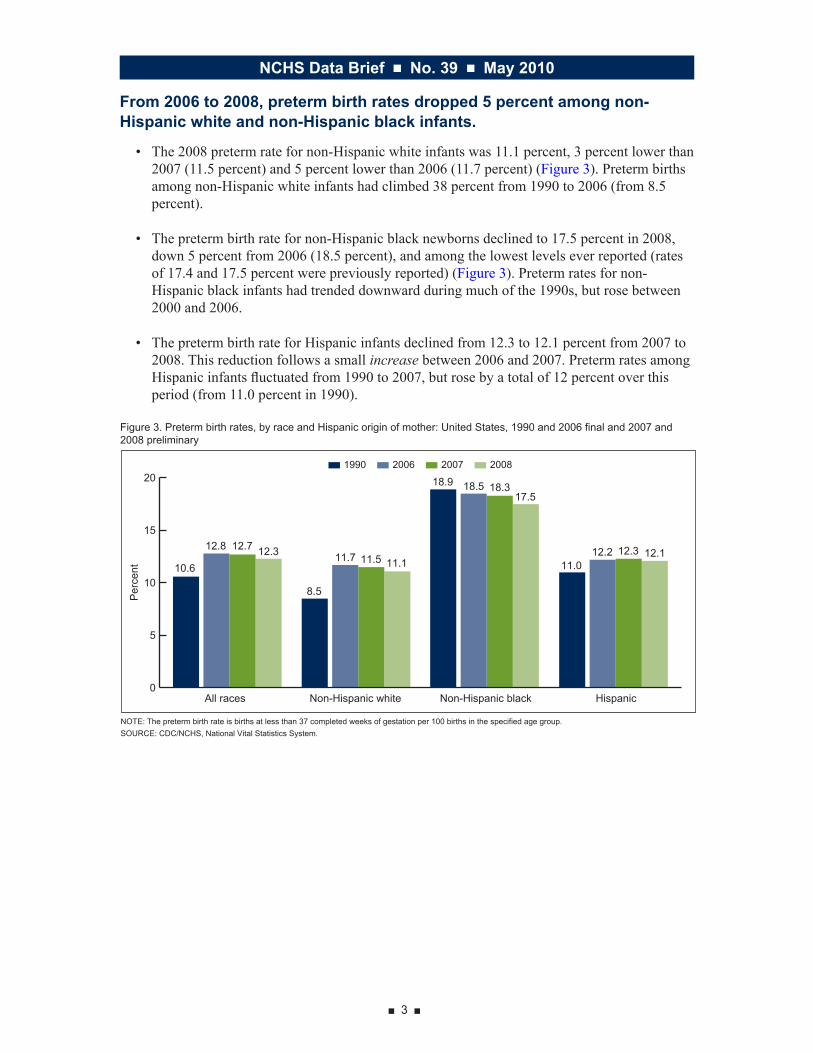
• The2008pretermratefornon-Hispanicwhiteinfantswas11.1percent,3percentlowerthan2007 (11.5 percent) and 5 percent lower than 2006 (11.7 percent) (Figure 3). Preterm births amongnon-Hispanicwhiteinfantshadclimbed38percentfrom1990to2006(from8.5percent).
• Thepretermbirthratefornon-Hispanicblacknewbornsdeclinedto17.5percentin2008,down 5 percent from 2006 (18.5 percent), and among the lowest levels ever reported (rates of17.4and17.5percentwerepreviouslyreported)(Figure3).Pretermratesfornon-Hispanicblackinfantshadtrendeddownwardduringmuchofthe1990s,butrosebetween2000 and 2006.
• The preterm birth rate for Hispanic infants declined from 12.3 to 12.1 percent from 2007 to 2008. This reduction follows a small increase between 2006 and 2007. Preterm rates among Hispanicinfantsfluctuatedfrom1990to2007,butrosebyatotalof12percentoverthisperiod(from11.0percentin1990).
■ 3 ■

NCHS Data Brief ■ No. 39 ■ May 2010
Preterm birth rates decline in most U.S. states.
• Since2006whenthenationalratepeaked,pretermbirthrateshavedeclinedsignificantlyin35 states (Figure 4). Only one state, Hawaii, reported an increase in preterm births.
• Beforetherecentdownwardtrend,rateshadincreasedsignificantlyinall50statesfrom1990to2006.TheonlyexceptiontothistrendwastheDistrictofColumbia,forwhichtheratedeclined.(Preliminary2008pretermandlatepretermstate-specificbirthratesareavailable at: http://www.cdc.gov/nchs/data/nvsr/nvsr58/nvsr58_16_tables.pdf#d.)
■ 4 ■

NCHS Data Brief ■ No. 39 ■ May 2010
Preterm births are less likely among all types of deliveries.
• Preliminary 2008 data reveal that the percentage of all cesarean births that were preterm declined 4 percent from 2006 to 2008, from 17.8 to 17.1 percent.
• The percentage of induced vaginal births born preterm also decreased over this period, from 7.7 to 7.2 percent, as did the percentage of noninduced vaginal births, down from 11.6 to 11.1 percent (Figure 5).
■ 5 ■

NCHS Data Brief ■ No. 39 ■ May 2010
Summary
Following a long period of fairly steady increase, the U.S. preterm birth rate declined in 2007 (from12.8to12.7percent),andthenagainin2008(to12.3percent),markingthefirst2-yeardownturninthisrateinnearlythreedecades.Declinesinpretermbirthratesfrom2006to2008were observed for mothers of all age groups under age 40, for the three largest race and Hispanic origin groups, for the majority of all states, and for all types of deliveries.
The reduction in the overall preterm birth rate is not explained by changes in the proportions of multiple births (multiples are at much greater risk than singletons of preterm delivery). Preterm rates among singleton births declined by a similar amount as for all births over this period (from 11.1 to 10.6 percent.)
Previous research has suggested that increases in preterm induction of labor and cesarean deliverycontributedtotheriseintheoverallpretermbirthrate(6,7).Decreasesintheuseoftheseproceduresbefore37weekscouldalsopotentiallyreducethisrate.Thisreportfindsthatthe decline in the overall preterm rate from 2006 to 2008 was related to declines in all types of delivery, that is, in preterm cesarean and induced and noninduced vaginal births.
Althoughlowerin2008,theU.S.pretermbirthrateremainshigherthaninanyyearfrom1981to 2002, with large differences still evident by race and Hispanic origin. Further research is necessary to explain the factors behind the current downturn and to develop approaches to help ensure its continued decline.
Definitions
Preterm birth rate: The number of births delivered at less than 37 completed weeks of gestation per 100 total births.
Late preterm birth rate: The number of births delivered at 34–36 completed weeks of gestation per 100 total births.
Early preterm birth rate: The number of births delivered at less than 34 completed weeks of gestation per 100 total births.
Multiple births: Births in twin and triplet and higher order multiple deliveries.
Cesarean: Extraction of the infant, placenta, and membranes through an incision in the maternal abdominal and uterine walls.
Vaginal:Deliveryofthefetusthroughthevagina.
Inductionoflabor:Initiationofuterinecontractionsbymedicalorsurgicalmeansforthepurposeof delivery before the spontaneous onset of labor (i.e., before labor has begun).
■ 6 ■
NCHS Data Brief ■ No. 39 ■ May 2010
Data sources and methods
ThisreportcontainsdatafromtheNatalityDataFilefromtheNationalVitalStatisticsSystem.ThevitalstatisticsnatalityfileincludesinformationforallbirthsoccurringintheUnitedStates.
Thenatalityfilesincludeinformationonawiderangeofmaternalandinfantdemographicandhealth characteristics for babies born in the United States. Final data may also be accessed from the interactive data access tool, VitalStats.
Theprimarymeasureusedtodeterminegestationalageistheintervalbetweenthefirstdayofthe mother’s last normal menstrual period (LMP) and the date of birth. The clinical or obstetric estimate of gestation is substituted where the LMP is missing or inconsistent with birthweight (1).
About the authors
JoyceA.Martin,MichelleJ.K.Osterman,andPaulD.SuttonarewiththeCentersforDiseaseControlandPrevention’sNationalCenterforHealthStatistics,DivisionofVitalStatistics,Reproductive Statistics Branch. Brady Hamilton, Sharon Kirmeyer, and T.J. Mathews, also with the Reproductive Statistics Branch, provided helpful comments on this report.
References
1. MartinJA,HamiltonBE,SuttonPD,etal.Births:Finaldatafor2006.Nationalvitalstatisticsreports;vol57,no7.Hyattsville,MD:NationalCenterforHealthStatistics.2008.
2. BehrmanRE,ButlerAS,ed.Pretermbirth:causes,consequences,andprevention.Committeeon understanding premature birth and assuring healthy outcomes, Board on Health Sciences Policy.InstituteofMedicine.Nat’lAcademiesPress.2005.
3. MarchofDimes.PrematurityCampaign2008ProgressReport.2009.Availablefrom:http://www.marchofdimes.com/files/PrematurityCampaign2008AccompHR_sm.pdf.
4. MathewsTJ,MacDormanMF.Infantmortalitystatisticsfromthe2006periodlinkedbirth/infantdeathdataset.Nationalvitalstatisticsreports;vol58,no17.Hyattsville,MD:NationalCenterforHealthStatistics.2010.
5. Engle WA, Kominiarek, MA. Late preterm infants, early term infants and timing of elective deliveries.Clinicsinperinatol35(2):325–41.2008.
6. Fuchs K, Wapner R. Elective cesarean section and induction and their impact on late preterm births.Clinicsinperinatol33(4):793–800.2006.
7. BettegowdaVR,DiasT,DavidoffMJ,etal.TherelationshipbetweencesareandeliveryandgestationalageamongU.S.singletonbirths.Clinicsinperinatol35(2):309–23.2008.
8. Hamilton BE, Martin JA, Ventura SJ. Births: Preliminary data for 2007. National vital statisticsreports;vol57no12.Hyattsville,MD:NationalCenterforHealthStatistics.Onlineonlyrelease.March18,2009.
9. Hamilton BE, Martin JA, Ventura SJ. Births: Preliminary data for 2008. National vital statisticsreports;vol58no16.Hyattsville,MD:NationalCenterforHealthStatistics.Onlineonly release. April 6, 2010.
■ 7 ■
NCHS Data Brief ■ No. 39 ■ May 2010
Suggested citation
MartinJA,OstermanMJK,SuttonPD.Arepreterm births on the decline in the United States? Recent data from the National Vital StatisticsSystem.NCHSdatabrief,no39.Hyattsville,MD:NationalCenterforHealthStatistics. 2010.
Copyright information
All material appearing in this report is in the public domain and may be reproduced orcopiedwithoutpermission;citationastosource, however, is appreciated.
National Center for Health Statistics
EdwardJ.Sondik,Ph.D.,Director JenniferH.Madans,Ph.D.,Associate Director for Science
Division of Vital Statistics CharlesJ.Rothwell,M.S.,Director
U.S.DEPARTMENTOF HEAlTH&HUMANSERVICES
CentersforDiseaseControlandPrevention NationalCenterforHealthStatistics 3311 Toledo Road Hyattsville,MD20782
OFFICIAlBUSINESS PENAlTyFORPRIVATEUSE,$300
To receive this publication regularly, contact the NationalCenterforHealthStatisticsby calling 1–800–232–4636 E-mail: [email protected] Internet: http://www.cdc.gov/nchs
first class mail postage & fees paid
cdc/nchs Permit No. G-284
ISSN 1941–4927 (Print ed.) ISSN 1941–4935 (Online ed.) CS212603 T36574 (05/2010) DHHSPublicationNo.(PHS)2010–1209