are patent fees effective at weeding out low quality...
TRANSCRIPT

Context Research question Empirical approach Data Results Conclusion
Are patent fees effective at weeding outlow quality patents?
Gaetan de RassenfosseUniversity of Melbourne
The Output of R&D activities: Harnessing the Power of Patents DataJRC-IPTS, Seville. 24–25 May 2012
1/24

Context Research question Empirical approach Data Results Conclusion
Decline in patent quality
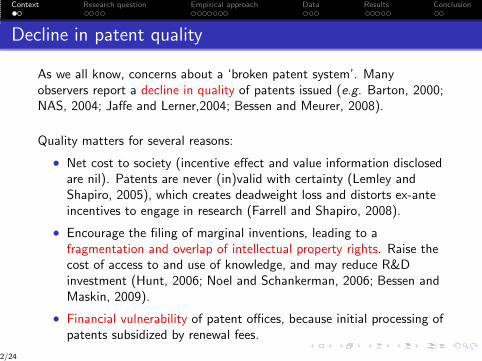
As we all know, concerns about a ‘broken patent system’. Manyobservers report a decline in quality of patents issued (e.g. Barton, 2000;NAS, 2004; Jaffe and Lerner,2004; Bessen and Meurer, 2008).
Quality matters for several reasons:
• Net cost to society (incentive effect and value information disclosedare nil). Patents are never (in)valid with certainty (Lemley andShapiro, 2005), which creates deadweight loss and distorts ex-anteincentives to engage in research (Farrell and Shapiro, 2008).
• Encourage the filing of marginal inventions, leading to afragmentation and overlap of intellectual property rights. Raise thecost of access to and use of knowledge, and may reduce R&Dinvestment (Hunt, 2006; Noel and Schankerman, 2006; Bessen andMaskin, 2009).
• Financial vulnerability of patent offices, because initial processing ofpatents subsidized by renewal fees.
2/24
Context Research question Empirical approach Data Results Conclusion
Decline in patent quality
As we all know, concerns about a ‘broken patent system’. Manyobservers report a decline in quality of patents issued (e.g. Barton, 2000;NAS, 2004; Jaffe and Lerner,2004; Bessen and Meurer, 2008).
Quality matters for several reasons:
• Net cost to society (incentive effect and value information disclosedare nil). Patents are never (in)valid with certainty (Lemley andShapiro, 2005), which creates deadweight loss and distorts ex-anteincentives to engage in research (Farrell and Shapiro, 2008).
• Encourage the filing of marginal inventions, leading to afragmentation and overlap of intellectual property rights. Raise thecost of access to and use of knowledge, and may reduce R&Dinvestment (Hunt, 2006; Noel and Schankerman, 2006; Bessen andMaskin, 2009).
• Financial vulnerability of patent offices, because initial processing ofpatents subsidized by renewal fees.
2/24

Context Research question Empirical approach Data Results Conclusion
Three definitions of quality
Concept difficult to pin down. Three broad definitions:
• Quality of the underlying invention, as measured by technologicalmerit and economic potential (Lanjouw and Schankerman, 2004).Somehow echoes the patentability criteria.
• Quality of the underlying patent right. A low-quality patent wouldnot have been granted if the legal requirements of novelty,non-obviousness and usefulness had been properly evaluated(Merges, 1999). Also ‘weak’ patents (Farrell and Shapiro, 2008).
• Quality of the drafting style (excessive and broad claims, impreciselanguage, etc.).
Optimal quality threshold vs. actual quality threshold. Current concernsrelated to both concepts: the inventive step is believed to be too low(Barton, 2000) and the examination process is imperfect, leading topatents being mistakenly granted (Merges, 1999; Palangkaraya et al.,2011).
3/24

Context Research question Empirical approach Data Results Conclusion
1 Context
2 Research question
3 Empirical approach
4 Data
5 Results
6 Conclusion
4/24

Context Research question Empirical approach Data Results Conclusion
Can filing fees be used to filter out low quality patents?
Clearly, patent fees have no direct effect on the quality of the underlyingpatent right. They would rather affect the incentives to protect a lowquality invention with a patent. I adopt the ‘economic’ definition ofquality.
This paper asks
Can patent application fees be used to reduce the filing of patentdocuments describing inventions of low technological and economicsignificance?
4/24

Context Research question Empirical approach Data Results Conclusion
Can filing fees be used to filter out low quality patents?
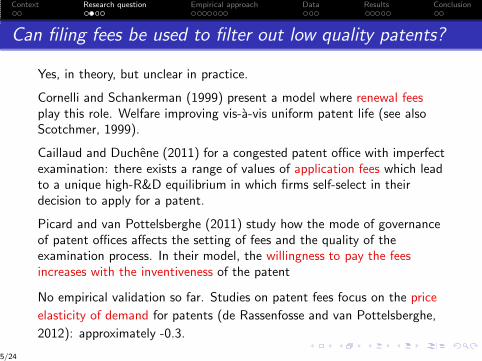
Yes, in theory, but unclear in practice.
Cornelli and Schankerman (1999) present a model where renewal feesplay this role. Welfare improving vis-a-vis uniform patent life (see alsoScotchmer, 1999).
Caillaud and Duchene (2011) for a congested patent office with imperfectexamination: there exists a range of values of application fees which leadto a unique high-R&D equilibrium in which firms self-select in theirdecision to apply for a patent.
Picard and van Pottelsberghe (2011) study how the mode of governanceof patent offices affects the setting of fees and the quality of theexamination process. In their model, the willingness to pay the feesincreases with the inventiveness of the patent
No empirical validation so far. Studies on patent fees focus on the price
elasticity of demand for patents (de Rassenfosse and van Pottelsberghe,
2012): approximately -0.3.
5/24

Context Research question Empirical approach Data Results Conclusion
Can filing fees be used to filter out low quality patents?
Yes, in theory, but unclear in practice.
Cornelli and Schankerman (1999) present a model where renewal feesplay this role. Welfare improving vis-a-vis uniform patent life (see alsoScotchmer, 1999).
Caillaud and Duchene (2011) for a congested patent office with imperfectexamination: there exists a range of values of application fees which leadto a unique high-R&D equilibrium in which firms self-select in theirdecision to apply for a patent.
Picard and van Pottelsberghe (2011) study how the mode of governanceof patent offices affects the setting of fees and the quality of theexamination process. In their model, the willingness to pay the feesincreases with the inventiveness of the patent
No empirical validation so far. Studies on patent fees focus on the price
elasticity of demand for patents (de Rassenfosse and van Pottelsberghe,
2012): approximately -0.3.
5/24

Context Research question Empirical approach Data Results Conclusion
Can filing fees be used to filter out low quality patents?
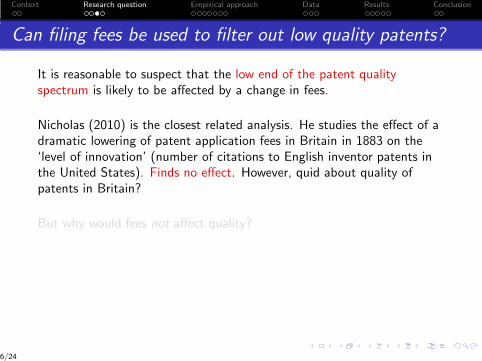
It is reasonable to suspect that the low end of the patent qualityspectrum is likely to be affected by a change in fees.
Nicholas (2010) is the closest related analysis. He studies the effect of adramatic lowering of patent application fees in Britain in 1883 on the‘level of innovation’ (number of citations to English inventor patents inthe United States). Finds no effect. However, quid about quality ofpatents in Britain?
But why would fees not affect quality?
6/24
Context Research question Empirical approach Data Results Conclusion
Can filing fees be used to filter out low quality patents?
It is reasonable to suspect that the low end of the patent qualityspectrum is likely to be affected by a change in fees.
Nicholas (2010) is the closest related analysis. He studies the effect of adramatic lowering of patent application fees in Britain in 1883 on the‘level of innovation’ (number of citations to English inventor patents inthe United States). Finds no effect. However, quid about quality ofpatents in Britain?
But why would fees not affect quality?
6/24
Context Research question Empirical approach Data Results Conclusion
Two factors could limit the effectiveness of fees on quality
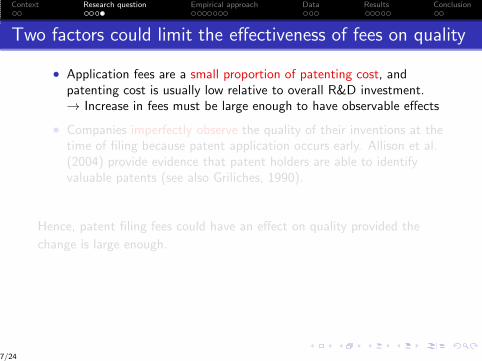
• Application fees are a small proportion of patenting cost, andpatenting cost is usually low relative to overall R&D investment.→ Increase in fees must be large enough to have observable effects
• Companies imperfectly observe the quality of their inventions at thetime of filing because patent application occurs early. Allison et al.(2004) provide evidence that patent holders are able to identifyvaluable patents (see also Griliches, 1990).
Hence, patent filing fees could have an effect on quality provided the
change is large enough.
7/24
Context Research question Empirical approach Data Results Conclusion
Two factors could limit the effectiveness of fees on quality
• Application fees are a small proportion of patenting cost, andpatenting cost is usually low relative to overall R&D investment.→ Increase in fees must be large enough to have observable effects
• Companies imperfectly observe the quality of their inventions at thetime of filing because patent application occurs early. Allison et al.(2004) provide evidence that patent holders are able to identifyvaluable patents (see also Griliches, 1990).
Hence, patent filing fees could have an effect on quality provided the
change is large enough.
7/24

Context Research question Empirical approach Data Results Conclusion
1 Context
2 Research question
3 Empirical approach
4 Data
5 Results
6 Conclusion
8/24
Context Research question Empirical approach Data Results Conclusion
A fivefold increase in fees
I analyze how the Patent Law Amendment Act of 1982 affected quality.Resulted in a fivefold increase in fees ($65 to $300).
Largest fee increase in the history of the USPTO, which raised overallpatenting cost by ∼50 per cent (attorney fees estimated at $440 in 1983from Helfgott, 1993).
Preparatory documents do not mention a change in examination rigor,nor do they express concerns about declining quality.
Act passed to strengthen the financial resources of the USPTO. Feesrevenue covered < 30 per cent of operating costs (not adjusted since1967).
8/24

Context Research question Empirical approach Data Results Conclusion
Strong changes in patent numbers
Figure : Patents granted, by application date (1981–1984).
4−81 10−81 4−82 10−82 4−83 10−83 4−842000
3000
4000
5000
6000
7000
8000
9000
10000
Application date (month−year)
Pat
ents
gra
nted
Patent applications (1982–1984) = 116,052, 96,847, and 109,100, while9 per cent annual increase in industrial R&D expenditures.How was quality affected?
9/24
Context Research question Empirical approach Data Results Conclusion
Difference-in-differences (DID) regression models
I only observe granted patents, i.e. those that went successfully throughthe examination process. Need to control for that.
DID regression framework: exploit variation in fees / cost both withinand between individuals.
Two DID approaches: (i) large group vs. small entities; and (ii) nationalvs. foreign patents.
Allows controlling for any actual change in examination rigor: even ifexamination rigor changed after the reform, unlikely to have changedbetween groups.
First DID approach exploits the fact that fees for small entities increasedfrom $65 to $150. Results difficult to interpret and approach subject tocaution. I focus on the second DID approach.
10/24

Context Research question Empirical approach Data Results Conclusion
DID2 - Patents by U.S. vs. foreign companies
Does not exploit an increase in fees per se, but rather a change in theoverall cost of patenting.
• Priority filing: first patent application protecting an invention(usually at home country)
• Second filings: subsequent patent applications protecting theinvention abroad
Idea: higher costs have been borne for inventions protected with a secondfiling. Costs include: official and attorney fees in the home country andthe USPTO, possibly translation fees.
Hence, increase in USPTO fees represents a (much) lower increase intotal patenting cost for second filings than for priority filings. The qualityof priority filings should have increased relative to that of second filings.
11/24

Context Research question Empirical approach Data Results Conclusion
DID2 - Patents by U.S. vs. foreign companies
I use second filings assigned to German large companies as the controlgroup:
Qit = γ + δw · postt + δb · locali + δDID · (post × local)it + βXi + εit
Strong control group:
• Usually seen as high quality system with high inventive step (Micheland Bettels, 2001)
• Patent law stable in the early 1980s (substantial change in 1976)
• Largest group of foreign assignees after Japanese companies
Estimation of translation cost of a ‘typical’ German patent applicationinto English: $1,400 (Helfgott, 1993). More expensive than U.S. attorneyand filing fees combined.
12/24
Context Research question Empirical approach Data Results Conclusion
DID2 - Patents by U.S. vs. foreign companies
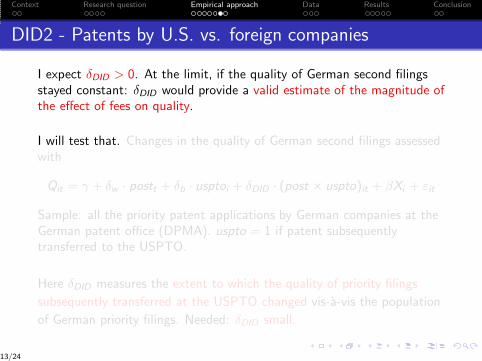
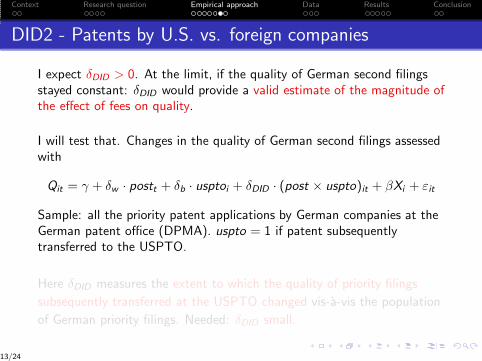
I expect δDID > 0. At the limit, if the quality of German second filingsstayed constant: δDID would provide a valid estimate of the magnitude ofthe effect of fees on quality.
I will test that. Changes in the quality of German second filings assessedwith
Qit = γ + δw · postt + δb · usptoi + δDID · (post × uspto)it + βXi + εit
Sample: all the priority patent applications by German companies at theGerman patent office (DPMA). uspto = 1 if patent subsequentlytransferred to the USPTO.
Here δDID measures the extent to which the quality of priority filings
subsequently transferred at the USPTO changed vis-a-vis the population
of German priority filings. Needed: δDID small.
13/24
Context Research question Empirical approach Data Results Conclusion
DID2 - Patents by U.S. vs. foreign companies
I expect δDID > 0. At the limit, if the quality of German second filingsstayed constant: δDID would provide a valid estimate of the magnitude ofthe effect of fees on quality.
I will test that. Changes in the quality of German second filings assessedwith
Qit = γ + δw · postt + δb · usptoi + δDID · (post × uspto)it + βXi + εit
Sample: all the priority patent applications by German companies at theGerman patent office (DPMA). uspto = 1 if patent subsequentlytransferred to the USPTO.
Here δDID measures the extent to which the quality of priority filings
subsequently transferred at the USPTO changed vis-a-vis the population
of German priority filings. Needed: δDID small.
13/24

Context Research question Empirical approach Data Results Conclusion
Dependent variables: Three patent quality indicators
1 Number of forward citations (QC ). Shown to be a good measure oftechnological importance (Carpenter et al., 1981; Narin et al., 1987;Albert et al., 1991) and its economic value (Trajtenberg, 1990).
2 Family size (QF ). Number of jurisdictions in which patentprotection is sought (Putnam, 1996; Lanjouw et al., 1998).Correlate well with patent value (Harhoff et al., 2003) and partlydetermined by invention quality (Chan, 2010).
3 Patent life (QL) Inventions for which patent protection is morevaluable will tend to be protected by payment of renewal fees forlonger periods (Schankerman and Pakes, 1986). At USPTO, feesare due at 3.5, 7.5 and 11.5 years after grant.
14/24

Context Research question Empirical approach Data Results Conclusion
1 Context
2 Research question
3 Empirical approach
4 Data
5 Results
6 Conclusion
15/24

Context Research question Empirical approach Data Results Conclusion
I combine data from three sources
• Patstat (April 2011): patents granted by the USPTO and patentapplications at the DPMA. Number of forward citations (QC ) andfamily size (QF ).
• USPTO Patent Maintenance Fees Events Database: active life ofUSPTO patents (QL)
• EPO Worldwide legal status database: active life of DPMA patents(QL)
Patents collected from January 1, 1981 to June 30, 1984 (42-month timewindow centered at the date of the reform). Driven by data availability ofindicator QL.
I need two samples, one for each DID regression.
15/24

Context Research question Empirical approach Data Results Conclusion
One sample for each DID regression
p
DID1 — small entities vs. large companies
Sample US firms at USPTO
Description USPTO priority patents granted to U.S. firms
Treatments 67,180 patents by large companies
Controls 29,143 patents by small entities
DID2a — large U.S. vs. large German companies
Sample large US and DE firms at USPTO
Description USPTO patents granted to large U.S. firms and large German firms
Treatments 67,180 priority patents by large U.S. companies
Controls 11,944 second filings by large German companies
DID2b — change in quality of German patents
Sample DE firms at DPMA
Description DPMA priority patent applications by German firms
Treatments 13,917 priority patent applications which have a direct equivalent at the
USPTO
Controls 70,096 priority patent applications which have no direct equivalent at
the USPTO
16/24

Context Research question Empirical approach Data Results Conclusion
Remember the strong peak in patenting observed 09/82
Is there a difference in quality between patents filed in September vs.October?
Average value of quality indicators:g y
Around the reform (N = 5,799)
September 1982 October 1982 Oct �= Sep
QC 5.66 6.05 0.05
QF 2.04 2.52 0.00
QL 11.77 12.86 0.00
One year before the reform (N = 4,600)
September 1981 October 1981 Oct �= Sep
QC 5.53 5.60 0.37
QF 2.33 2.21 0.94
QL 12.50 12.20 0.95
17/24

Context Research question Empirical approach Data Results Conclusion
1 Context
2 Research question
3 Empirical approach
4 Data
5 Results
6 Conclusion
18/24
Context Research question Empirical approach Data Results Conclusion
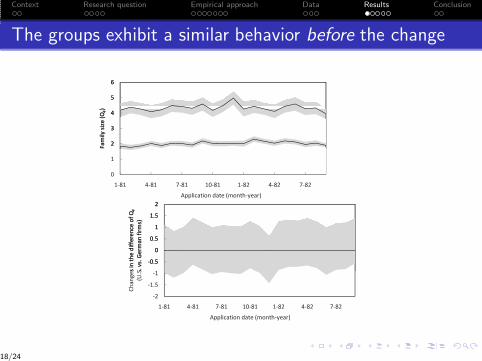
The groups exhibit a similar behavior before the change
2
3
4
5
6
Family
size(Q
F)
0
1
2
3
4
5
6
1 81 4 81 7 81 10 81 1 82 4 82 7 82
Family
size(Q
F)
Application date (month year)
1
0.5
0
0.5
1
1.5
2
sinthediffe
renceof
QF
S.vs.G
erman
firms)
2
1.5
1
0.5
0
0.5
1
1.5
2
1 81 4 81 7 81 10 81 1 82 4 82 7 82
Chan
gesinthediffe
renceof
QF
(U.S.vs.Ge
rman
firms)
Application date (month year)
18/24

Context Research question Empirical approach Data Results Conclusion
Estimation of DID2a (U.S. vs. German patents)
( )
(1) (2) (3) (4) (5) (6)
Dependent variable: QC QF QL QC QF QL
Time window: Short Large
post 0.148 0.057** 0.754* -0.354 -0.112 -0.147*
(0.068) (0.004) (0.083) (0.197) (0.076) (0.018)
local 1.598* -2.640** 2.089** 1.386** -2.785*** 2.132**
(0.181) (0.042) (0.042) (0.082) (0.030) (0.056)
post× local -0.145 0.395** 0.031 0.703*** 0.381** 0.290**
(0.025) (0.026) (0.117) (0.007) (0.022) (0.015)
Technology dummies Y*** Y*** Y*** Y Y Y
Year dummies N N N Y Y Y
R2 0.101 0.196 0.063 0.101 0.148 0.052
Observations 4,534 4,534 4,534 74,590 74,590 74,590
Does it make sense to interpret δDID ?
19/24

Context Research question Empirical approach Data Results Conclusion
Does it make sense? DID2b (quality at DPMA)
(1) (2) (3) (4) (5) (6)
Dependent variable: QC QF QL QC QF QL
Time window Short Large
post -0.044 -0.136 0.224 0.003 -0.051** -0.185
(0.024) (0.047) (0.176) (0.015) (0.010) (0.065)
uspto 0.327** 3.337*** 1.282*** 0.374** 3.674*** 0.844***
(0.052) (0.296) (0.105) (0.058) (0.307) (0.028)
post× uspto 0.024 0.137 0.490 -0.024 0.001 0.000
(0.087) (0.092) (0.265) (0.012) (0.017) (0.096)
Technology dummies Y*** Y*** Y*** Y** Y*** Y***
Year dummies N N N Y*** Y*** Y**
R2 0.074 0.348 0.098 0.042 0.360 0.026
Observations 4,302 4,302 1,758 79,711 79,711 32,684
Answer is yes. No significant change in the quality of German patentstransferred at the USPTO.
20/24

Context Research question Empirical approach Data Results Conclusion
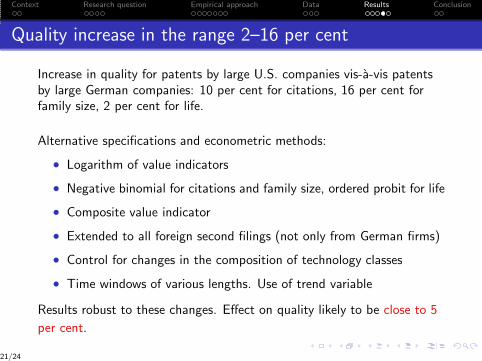
Quality increase in the range 2–16 per cent
Increase in quality for patents by large U.S. companies vis-a-vis patentsby large German companies: 10 per cent for citations, 16 per cent forfamily size, 2 per cent for life.
Alternative specifications and econometric methods:
• Logarithm of value indicators
• Negative binomial for citations and family size, ordered probit for life
• Composite value indicator
• Extended to all foreign second filings (not only from German firms)
• Control for changes in the composition of technology classes
• Time windows of various lengths. Use of trend variable
Results robust to these changes. Effect on quality likely to be close to 5
per cent.
21/24
Context Research question Empirical approach Data Results Conclusion
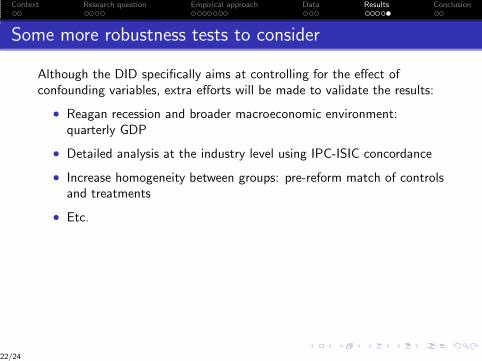
Some more robustness tests to consider
Although the DID specifically aims at controlling for the effect ofconfounding variables, extra efforts will be made to validate the results:
• Reagan recession and broader macroeconomic environment:quarterly GDP
• Detailed analysis at the industry level using IPC-ISIC concordance
• Increase homogeneity between groups: pre-reform match of controlsand treatments
• Etc.
22/24

Context Research question Empirical approach Data Results Conclusion
1 Context
2 Research question
3 Empirical approach
4 Data
5 Results
6 Conclusion
23/24

Context Research question Empirical approach Data Results Conclusion
Policy implications
Patent fee policy is worth considering. An increase in application feeswould:
• Decrease the number of patent filings (reduce processing time)
• Increase quality of incoming applications
• Help fund patent office in the short term because demand is inelastic
• Help fund patent office in the long term because higher renewalrates
Net welfare gains must be considered. Costs include exclusion of
cash-poor players and potential reduction in the incentives to invest in
research. One policy tool among many others.
23/24

Context Research question Empirical approach Data Results Conclusion
Limitations
• Patent quality is difficult to measure. Special attention devoted tobuilding quality indicators, but imperfectly capture ‘true’ quality.Results are consistent across all quality indicators.
• Approach subject to Lucas’ critique: analysis not guided by abehavioral model of the firm and its environment so limitedpredictive power. I expect elasticity to be stronger now because ofgreater number of low quality patents.
• Paper silent on the optimal level of quality and fees. True for theliterature in general: economists have been cautious about givingestimates of ‘optimal’ fees.
24/24

Additional tests
• First DID approach: small entities vs. large group
• Logarithm of the dependent variables
• Negative binomial and ordered probit regressions
• Composite value indicator as dependent variable
• Various time windows
• Industry classification
• Additional tests for forward citations
24/24

DID1 - Patents by large groups vs. small entities
Smaller increase in fees for ‘small entities’ (individual inventors, SMEs,not-for-profit institutions): from $65 to $150. Hence, quality of patentsby large companies should have increased more.
Qit = γ + δw · postt + δb · largei + δDID · (post × large)it + βXi + εit
I expect δDID > 0. Estimated using OLS with s.e. clustered at the grouplevel (small, large) to account for within group correlation.
(!) Not a standard DID approach: both groups experienced a change infees. If intensity of behavioral response differs across groups, then δDID
not true effect of fees on quality.
If anything, I expect small entities to be more affected (financialconstraints), hence δDID is probably downward biased: conservativeestimate.
24/24

Estimation of DID1 (small vs. large)
(1) (2) (3) (4)
Dependent variable: QC QF QC QF
Time window: Short Large
post -0.070 0.095 0.288 0.061
(0.066) (0.035) (0.283) (0.083)
large 1.163** 1.270*** 0.742** 1.330***
(0.026) (0.020) (0.037) (0.013)
post× large 0.096 0.375*** 0.149** 0.209**
(0.022) (0.003) (0.010) (0.004)
Technology dummies Y*** Y*** Y Y***
Year dummies N N Y*** Y***
R2 0.109 0.218 0.102 0.147
Observations 5,799 5,799 90,524 90,524
Short time window: two months centered at the time of the reform (=
troubled period). Large time window: exclude short time window.
24/24

Results of DID1 are difficult to interpret
Results from this approach should be treated with caution:
• Both controls and treatments experienced a change in fees
• Evidence that not all small entities pay the reduced fee (estimationof up to one quarter from Wilson and Sandell, 2010). This isbecause rules are complex and consequence in case of mistake canbe severe (deemed unenforceable if the court finds that claim wasmade to deceive the USPTO). Hence, controls and treatmentsmight not be exogenously determined.
Second DID approach is much less subject to these caveats.
24/24

Logarithm of QC and QF as dependent variables
(1) (2) (3) (4)
Dependent variable: lnQC lnQF lnQC lnQF
Time window: Short Large
post 0.027*** 0.024 -0.005 -0.030
(0.000) (0.008) (0.013) (0.016)
local 0.199* -0.944*** 0.194** -0.968***
(0.027) (0.002) (0.009) (0.007)
post× local -0.009 0.084** 0.043** 0.118**
(0.003) (0.002) (0.001) (0.004)
R2 0.109 0.253 0.105 0.203
Observations 4,534 4,534 74,590 74,590
24/24

Negative binomial and ordered probit regressions
(1) (2) (3) (4) (5) (6)
Dependent variable: QC QF QL QC QF QL
Time window: Short Large
post -0.185** 0.002 0.13*** -0.007 -0.042* -0.038***
(0.008) (0.022) (0.018) (0.023) (0.022) (0.001)
local 0.279*** -0.687*** 0.366*** 0.284*** -0.687*** 0.378***
(0.093) (0.032) (0.018) (0.020) (0.002) (0.013)
post× local 0.008 0.131*** 0.026 0.054*** 0.118*** 0.068***
(0.008) (0.017) (0.025) (0.002) (0.005) (0.004)
R2 - - 0.024 - - 0.020
Observations 4,534 4,534 4,534 74,590 74,590 74,590
Short time window: two months centered at the time of the reform (=
troubled period). Large time window: exclude short time window.
24/24

Composite value indicator
(1) (2) (3) (4) (5) (6)
Dependent variable: Composite Composite Composite
Time window: Short Large Short Large Short Large
post 0.305** -0.174 0.279** -0.005 -3.893*** 3.341**
(0.009) (0.078) (0.010) (0.110) (0.004) (0.071)
local 0.674* 0.580** -0.372** -0.407** 0.655* 0.604**
(0.057) (0.036) (0.015) (0.017) (0.067) (0.036)
post× local 0.054 0.373** 0.079*** 0.262** -0.110** 0.330**
(0.040) (0.012) (0.001) (0.014) (0.004) (0.008)
post× technology Y*** Y***
R2 0.090 0.093 0.072 0.069 0.107 0.097
Observations 4,534 74,590 7,065 118,779 4,534 74,590
Columns (3)–(4): control group of all second filings by large non-US
companies.24/24
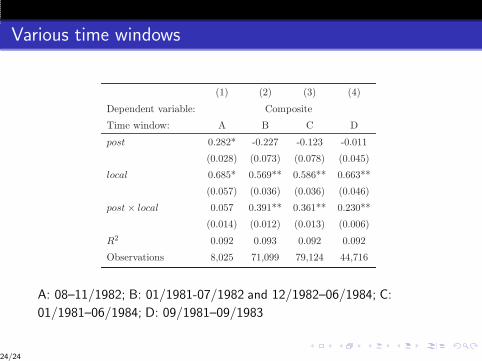
Various time windows
( )
(1) (2) (3) (4)
Dependent variable: Composite
Time window: A B C D
post 0.282* -0.227 -0.123 -0.011
(0.028) (0.073) (0.078) (0.045)
local 0.685* 0.569** 0.586** 0.663**
(0.057) (0.036) (0.036) (0.046)
post× local 0.057 0.391** 0.361** 0.230**
(0.014) (0.012) (0.013) (0.006)
R2 0.092 0.093 0.092 0.092
Observations 8,025 71,099 79,124 44,716
A: 08–11/1982; B: 01/1981-07/1982 and 12/1982–06/1984; C:
01/1981–06/1984; D: 09/1981–09/1983
24/24
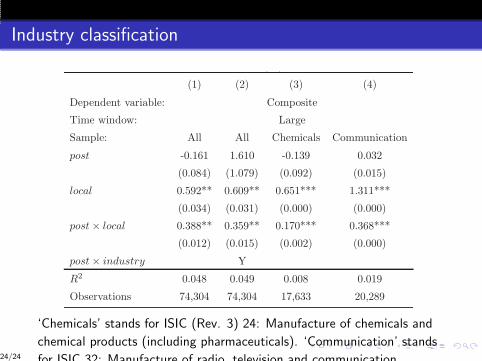
Industry classification
( )
(1) (2) (3) (4)
Dependent variable: Composite
Time window: Large
Sample: All All Chemicals Communication
post -0.161 1.610 -0.139 0.032
(0.084) (1.079) (0.092) (0.015)
local 0.592** 0.609** 0.651*** 1.311***
(0.034) (0.031) (0.000) (0.000)
post× local 0.388** 0.359** 0.170*** 0.368***
(0.012) (0.015) (0.002) (0.000)
post× industry Y
R2 0.048 0.049 0.008 0.019
Observations 74,304 74,304 17,633 20,289
‘Chemicals’ stands for ISIC (Rev. 3) 24: Manufacture of chemicals and
chemical products (including pharmaceuticals). ‘Communication’ stands
for ISIC 32: Manufacture of radio television and communication24/24
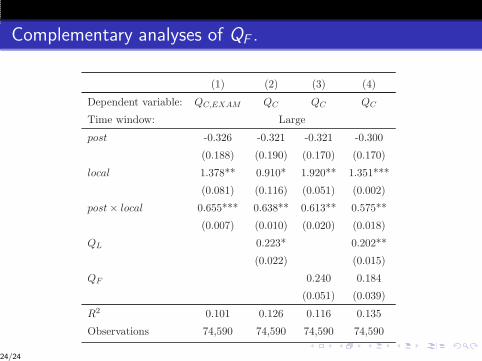
Complementary analyses of QF .
(1) (2) (3) (4)
Dependent variable: QC,EXAM QC QC QC
Time window: Large
post -0.326 -0.321 -0.321 -0.300
(0.188) (0.190) (0.170) (0.170)
local 1.378** 0.910* 1.920** 1.351***
(0.081) (0.116) (0.051) (0.002)
post× local 0.655*** 0.638** 0.613** 0.575**
(0.007) (0.010) (0.020) (0.018)
QL 0.223* 0.202**
(0.022) (0.015)
QF 0.240 0.184
(0.051) (0.039)
R2 0.101 0.126 0.116 0.135
Observations 74,590 74,590 74,590 74,590
24/24