arai crash test facility at chakan
TRANSCRIPT
Index Issue 2014-2015
Soot Mediated Oil Thickening Study using 3D CFD
Solar Photo-Voltaic System at ARAI
Pendulum and Rollover Test Facilities
Virtual Validation of Seating System to address Regulatory Requirements
Actual Failure Rate Prediction of Auto Electronics Systems from HALT Results
New Facilities to enhance Calibration Measurement Capability
Utilization of Digital Image Correlation (DIC) for Strain Measurement
Clutch Test Rig
CNG DI Engine Development
Engine Plant Model Parameterization & Validation for EMS Development
3-D Blue Light Scanning and 3-D/2-D CAD Data Generation
New state-of-the-art Crash Test Facility at ARAI-Chakan
ARAI Gears Up for Eligibility Assessment of Electric and Hybrid Electric Vehicles as per FAME India Scheme
Symposium on International Automotive Technology (SIAT) 2015 – Brief Overview
Introduction
Introduction of more stringent exhaust emission norms has forced the automotive industry to improve upon
engine-out emissions without compromising on performance, fuel economy and durability. NOx and Soot are
major pollutants from diesel engines and have trade off relation between them; therefore, measures taken to
reduce one pollutant cause other to increase. While meeting stringent NOx emission targets using retarded
injection timing and EGR approach, rapid oil deterioration due to soot mediated oil thickening has become
one of the most critical and challenging issues in modern engines. Typically in this combustion scenario, soot
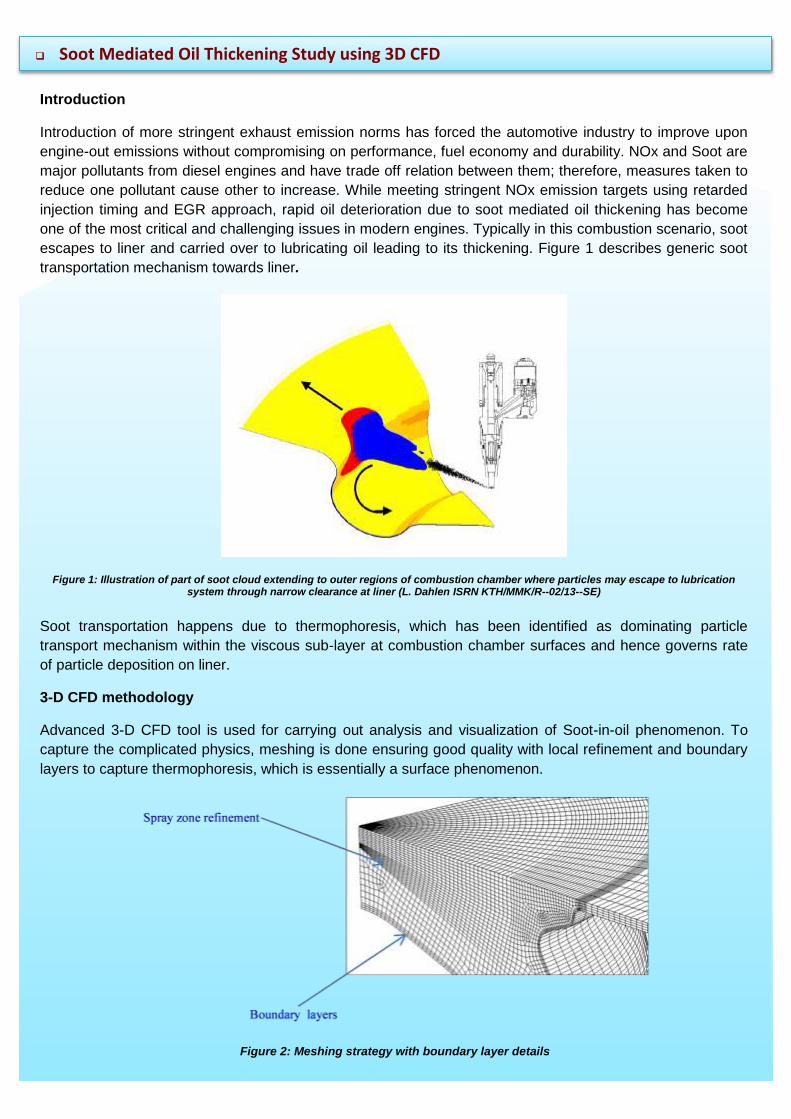
escapes to liner and carried over to lubricating oil leading to its thickening. Figure 1 describes generic soot
transportation mechanism towards liner.
Figure 1: Illustration of part of soot cloud extending to outer regions of combustion chamber where particles may escape to lubrication system through narrow clearance at liner (L. Dahlen ISRN KTH/MMK/R--02/13--SE)
Soot Mediated Oil Thickening Study using 3D CFD
Soot transportation happens due to thermophoresis, which has been identified as dominating particle
transport mechanism within the viscous sub-layer at combustion chamber surfaces and hence governs rate
of particle deposition on liner.
3-D CFD methodology
Advanced 3-D CFD tool is used for carrying out analysis and visualization of Soot-in-oil phenomenon. To
capture the complicated physics, meshing is done ensuring good quality with local refinement and boundary
layers to capture thermophoresis, which is essentially a surface phenomenon.
Figure 2: Meshing strategy with boundary layer details
Calibration of Model
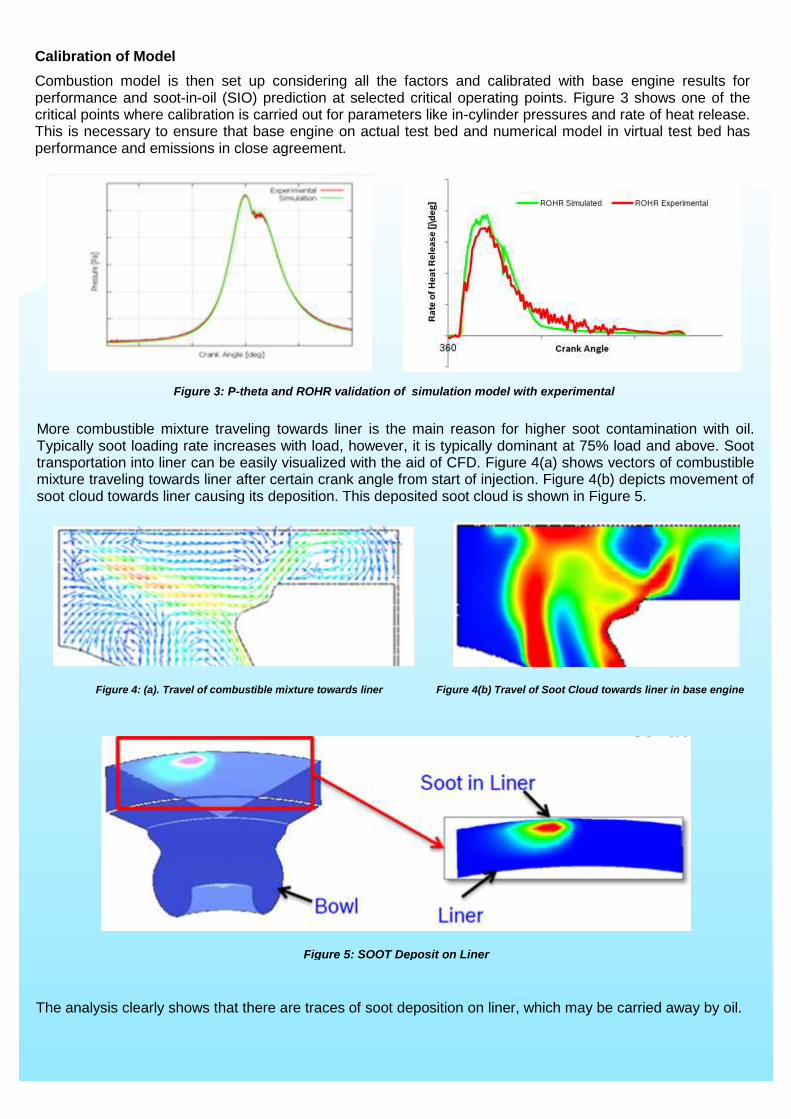
Combustion model is then set up considering all the factors and calibrated with base engine results for performance and soot-in-oil (SIO) prediction at selected critical operating points. Figure 3 shows one of the critical points where calibration is carried out for parameters like in-cylinder pressures and rate of heat release. This is necessary to ensure that base engine on actual test bed and numerical model in virtual test bed has performance and emissions in close agreement.
More combustible mixture traveling towards liner is the main reason for higher soot contamination with oil. Typically soot loading rate increases with load, however, it is typically dominant at 75% load and above. Soot transportation into liner can be easily visualized with the aid of CFD. Figure 4(a) shows vectors of combustible mixture traveling towards liner after certain crank angle from start of injection. Figure 4(b) depicts movement of soot cloud towards liner causing its deposition. This deposited soot cloud is shown in Figure 5.
Figure 3: P-theta and ROHR validation of simulation model with experimental
The analysis clearly shows that there are traces of soot deposition on liner, which may be carried away by oil.
Figure 4: (a). Travel of combustible mixture towards liner Figure 4(b) Travel of Soot Cloud towards liner in base engine
Figure 5: SOOT Deposit on Liner
Design Solution
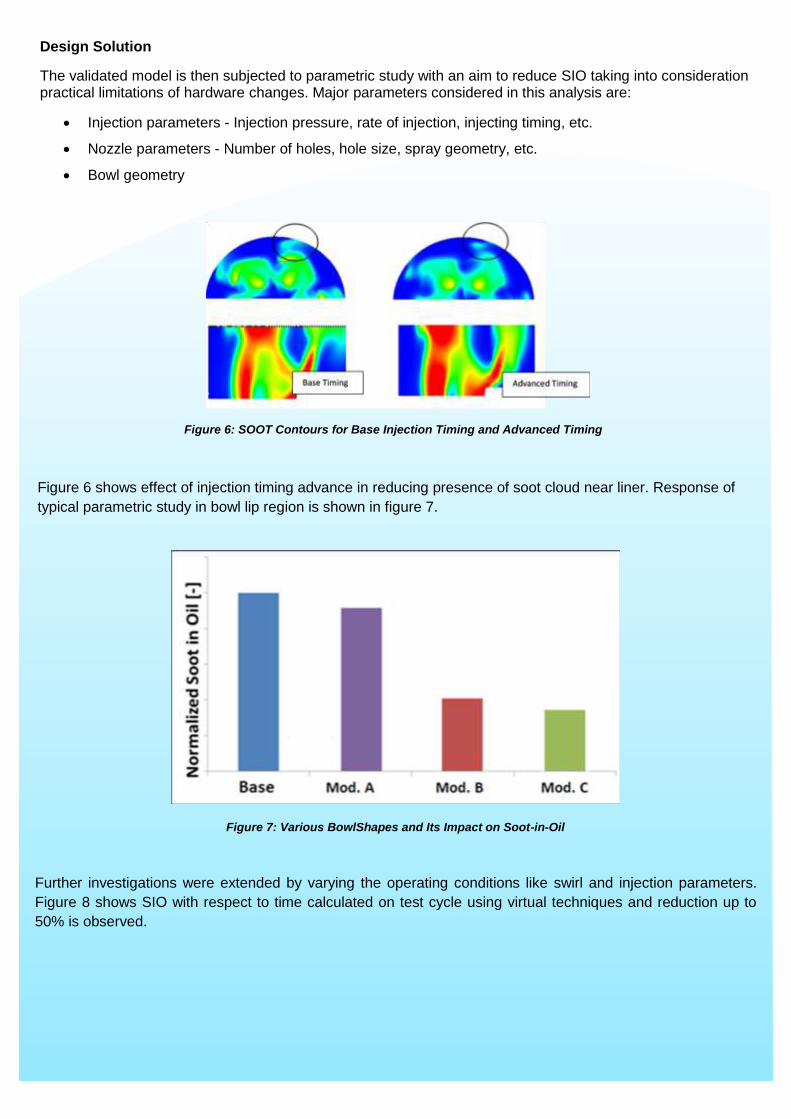
The validated model is then subjected to parametric study with an aim to reduce SIO taking into consideration practical limitations of hardware changes. Major parameters considered in this analysis are:
Injection parameters - Injection pressure, rate of injection, injecting timing, etc.
Nozzle parameters - Number of holes, hole size, spray geometry, etc.
Bowl geometry
Figure 6: SOOT Contours for Base Injection Timing and Advanced Timing
Figure 6 shows effect of injection timing advance in reducing presence of soot cloud near liner. Response of
typical parametric study in bowl lip region is shown in figure 7.
Figure 7: Various BowlShapes and Its Impact on Soot-in-Oil
Further investigations were extended by varying the operating conditions like swirl and injection parameters.
Figure 8 shows SIO with respect to time calculated on test cycle using virtual techniques and reduction up to
50% is observed.
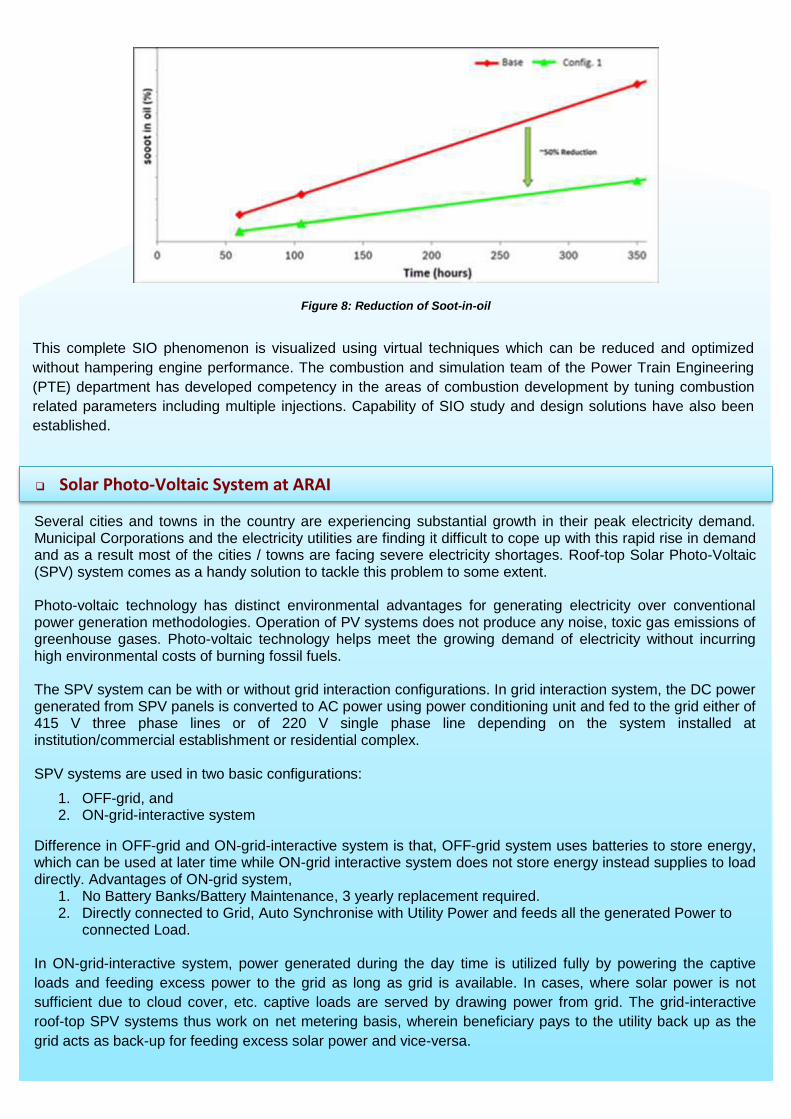
Figure 8: Reduction of Soot-in-oil
This complete SIO phenomenon is visualized using virtual techniques which can be reduced and optimized
without hampering engine performance. The combustion and simulation team of the Power Train Engineering
(PTE) department has developed competency in the areas of combustion development by tuning combustion
related parameters including multiple injections. Capability of SIO study and design solutions have also been
established.
Solar Photo-Voltaic System at ARAI
Several cities and towns in the country are experiencing substantial growth in their peak electricity demand. Municipal Corporations and the electricity utilities are finding it difficult to cope up with this rapid rise in demand and as a result most of the cities / towns are facing severe electricity shortages. Roof-top Solar Photo-Voltaic (SPV) system comes as a handy solution to tackle this problem to some extent. Photo-voltaic technology has distinct environmental advantages for generating electricity over conventional power generation methodologies. Operation of PV systems does not produce any noise, toxic gas emissions of greenhouse gases. Photo-voltaic technology helps meet the growing demand of electricity without incurring high environmental costs of burning fossil fuels. The SPV system can be with or without grid interaction configurations. In grid interaction system, the DC power generated from SPV panels is converted to AC power using power conditioning unit and fed to the grid either of 415 V three phase lines or of 220 V single phase line depending on the system installed at institution/commercial establishment or residential complex. SPV systems are used in two basic configurations:
1. OFF-grid, and 2. ON-grid-interactive system
Difference in OFF-grid and ON-grid-interactive system is that, OFF-grid system uses batteries to store energy, which can be used at later time while ON-grid interactive system does not store energy instead supplies to load directly. Advantages of ON-grid system,
1. No Battery Banks/Battery Maintenance, 3 yearly replacement required. 2. Directly connected to Grid, Auto Synchronise with Utility Power and feeds all the generated Power to
connected Load.
In ON-grid-interactive system, power generated during the day time is utilized fully by powering the captive
loads and feeding excess power to the grid as long as grid is available. In cases, where solar power is not
sufficient due to cloud cover, etc. captive loads are served by drawing power from grid. The grid-interactive
roof-top SPV systems thus work on net metering basis, wherein beneficiary pays to the utility back up as the
grid acts as back-up for feeding excess solar power and vice-versa.
In grid interactive systems, it is, however, essential to ensure that in case grid fails, solar power is fully utilized
or stopped immediately feeding the grid (if in excess) so as to safeguard any grid person/technician from
getting shock (electrocuted) while working on the grid for maintenance, etc. This feature is termed as “Islanding
Protection”
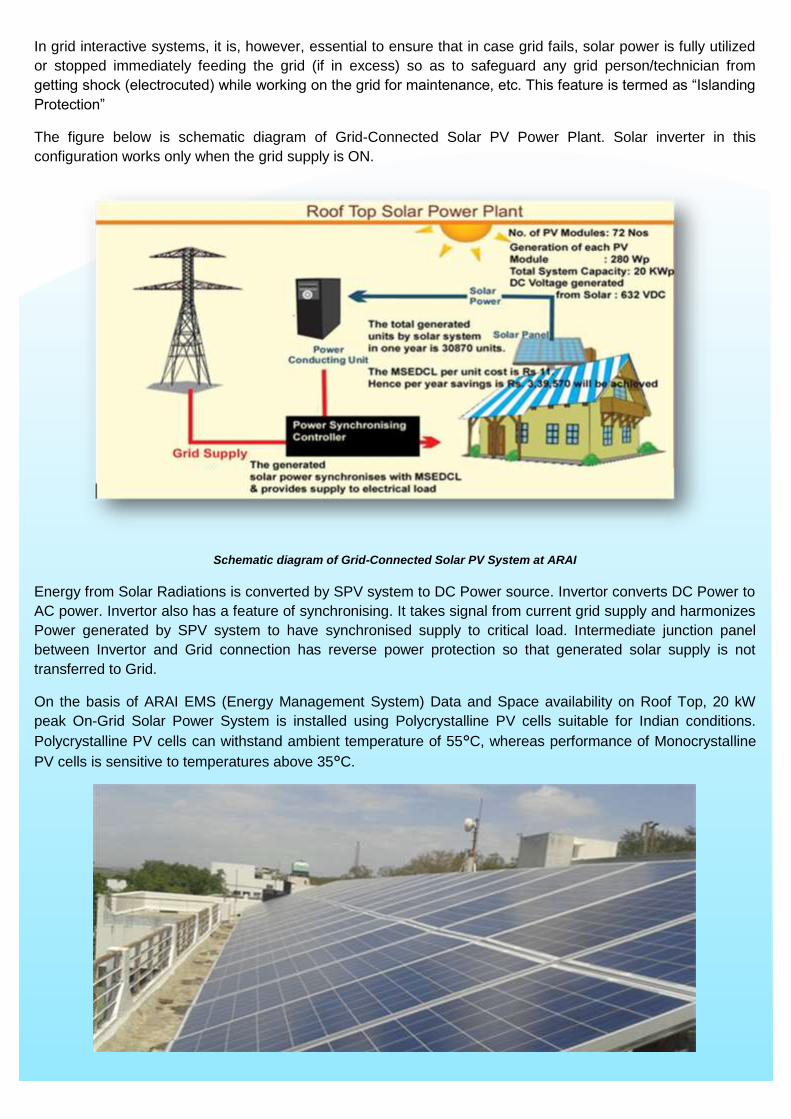
The figure below is schematic diagram of Grid-Connected Solar PV Power Plant. Solar inverter in this
configuration works only when the grid supply is ON.
Schematic diagram of Grid-Connected Solar PV System at ARAI
Energy from Solar Radiations is converted by SPV system to DC Power source. Invertor converts DC Power to
AC power. Invertor also has a feature of synchronising. It takes signal from current grid supply and harmonizes
Power generated by SPV system to have synchronised supply to critical load. Intermediate junction panel
between Invertor and Grid connection has reverse power protection so that generated solar supply is not
transferred to Grid.
On the basis of ARAI EMS (Energy Management System) Data and Space availability on Roof Top, 20 kW
peak On-Grid Solar Power System is installed using Polycrystalline PV cells suitable for Indian conditions.
Polycrystalline PV cells can withstand ambient temperature of 55°C, whereas performance of Monocrystalline
PV cells is sensitive to temperatures above 35°C.
Specifications of ARAI Solar Power System
• 20 kW peak Solar System comply IS/IEC 61683:1999-Photovoltaic systems.
• Reverse Power Relay protection.
• Communication System is integral part of Invertor.
• Good Earthing System conforming to IS 3043/IEC 60364-5.
• Guaranteed Power Generation for five years considering worst climatic conditions with Capital Cost
Recovery period of five years.
Inauguration of 20 kWp Solar PV Power Plant System at ARAI was done at the hands of Shri Ambuj Sharma (Additional Secretary, Department of Heavy Industry, Govt. of India).
Pendulum and Rollover Test Facilities
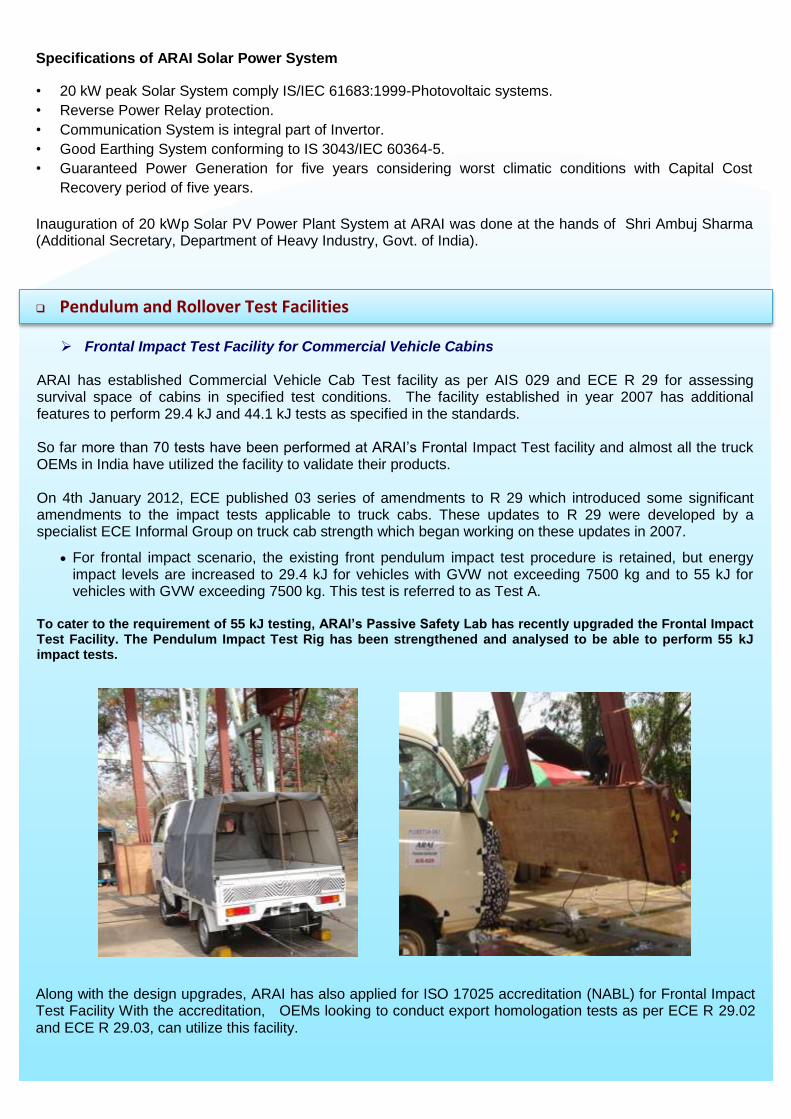
Frontal Impact Test Facility for Commercial Vehicle Cabins
ARAI has established Commercial Vehicle Cab Test facility as per AIS 029 and ECE R 29 for assessing survival space of cabins in specified test conditions. The facility established in year 2007 has additional features to perform 29.4 kJ and 44.1 kJ tests as specified in the standards. So far more than 70 tests have been performed at ARAI’s Frontal Impact Test facility and almost all the truck OEMs in India have utilized the facility to validate their products. On 4th January 2012, ECE published 03 series of amendments to R 29 which introduced some significant amendments to the impact tests applicable to truck cabs. These updates to R 29 were developed by a specialist ECE Informal Group on truck cab strength which began working on these updates in 2007.
For frontal impact scenario, the existing front pendulum impact test procedure is retained, but energy impact levels are increased to 29.4 kJ for vehicles with GVW not exceeding 7500 kg and to 55 kJ for vehicles with GVW exceeding 7500 kg. This test is referred to as Test A.
To cater to the requirement of 55 kJ testing, ARAI’s Passive Safety Lab has recently upgraded the Frontal Impact Test Facility. The Pendulum Impact Test Rig has been strengthened and analysed to be able to perform 55 kJ impact tests.
Along with the design upgrades, ARAI has also applied for ISO 17025 accreditation (NABL) for Frontal Impact Test Facility With the accreditation, OEMs looking to conduct export homologation tests as per ECE R 29.02 and ECE R 29.03, can utilize this facility.
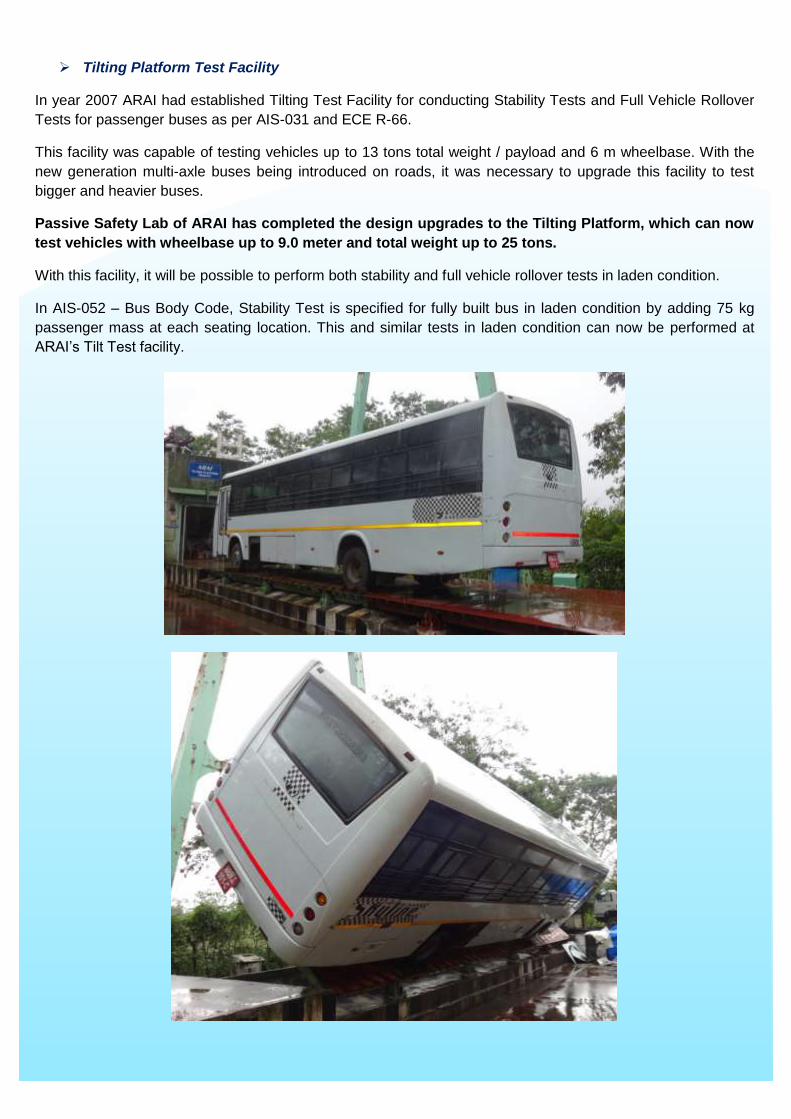
Tilting Platform Test Facility
In year 2007 ARAI had established Tilting Test Facility for conducting Stability Tests and Full Vehicle Rollover
Tests for passenger buses as per AIS-031 and ECE R-66.
This facility was capable of testing vehicles up to 13 tons total weight / payload and 6 m wheelbase. With the
new generation multi-axle buses being introduced on roads, it was necessary to upgrade this facility to test
bigger and heavier buses.
Passive Safety Lab of ARAI has completed the design upgrades to the Tilting Platform, which can now
test vehicles with wheelbase up to 9.0 meter and total weight up to 25 tons.
With this facility, it will be possible to perform both stability and full vehicle rollover tests in laden condition.
In AIS-052 – Bus Body Code, Stability Test is specified for fully built bus in laden condition by adding 75 kg
passenger mass at each seating location. This and similar tests in laden condition can now be performed at
ARAI’s Tilt Test facility.
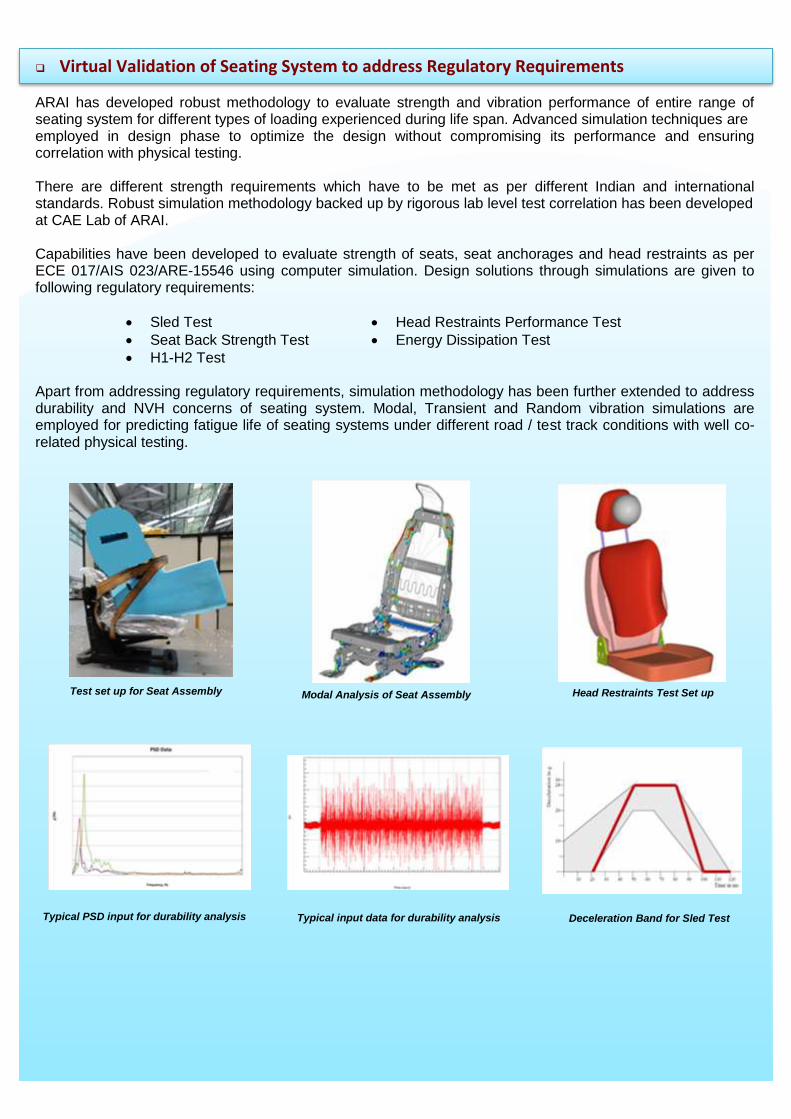
Virtual Validation of Seating System to address Regulatory Requirements
ARAI has developed robust methodology to evaluate strength and vibration performance of entire range of seating system for different types of loading experienced during life span. Advanced simulation techniques are employed in design phase to optimize the design without compromising its performance and ensuring correlation with physical testing. There are different strength requirements which have to be met as per different Indian and international standards. Robust simulation methodology backed up by rigorous lab level test correlation has been developed at CAE Lab of ARAI. Capabilities have been developed to evaluate strength of seats, seat anchorages and head restraints as per ECE 017/AIS 023/ARE-15546 using computer simulation. Design solutions through simulations are given to following regulatory requirements:
Sled Test
Seat Back Strength Test
H1-H2 Test
Head Restraints Performance Test
Energy Dissipation Test
Apart from addressing regulatory requirements, simulation methodology has been further extended to address durability and NVH concerns of seating system. Modal, Transient and Random vibration simulations are employed for predicting fatigue life of seating systems under different road / test track conditions with well co-related physical testing.
Test set up for Seat Assembly
Modal Analysis of Seat Assembly Head Restraints Test Set up
Typical PSD input for durability analysis Typical input data for durability analysis Deceleration Band for Sled Test
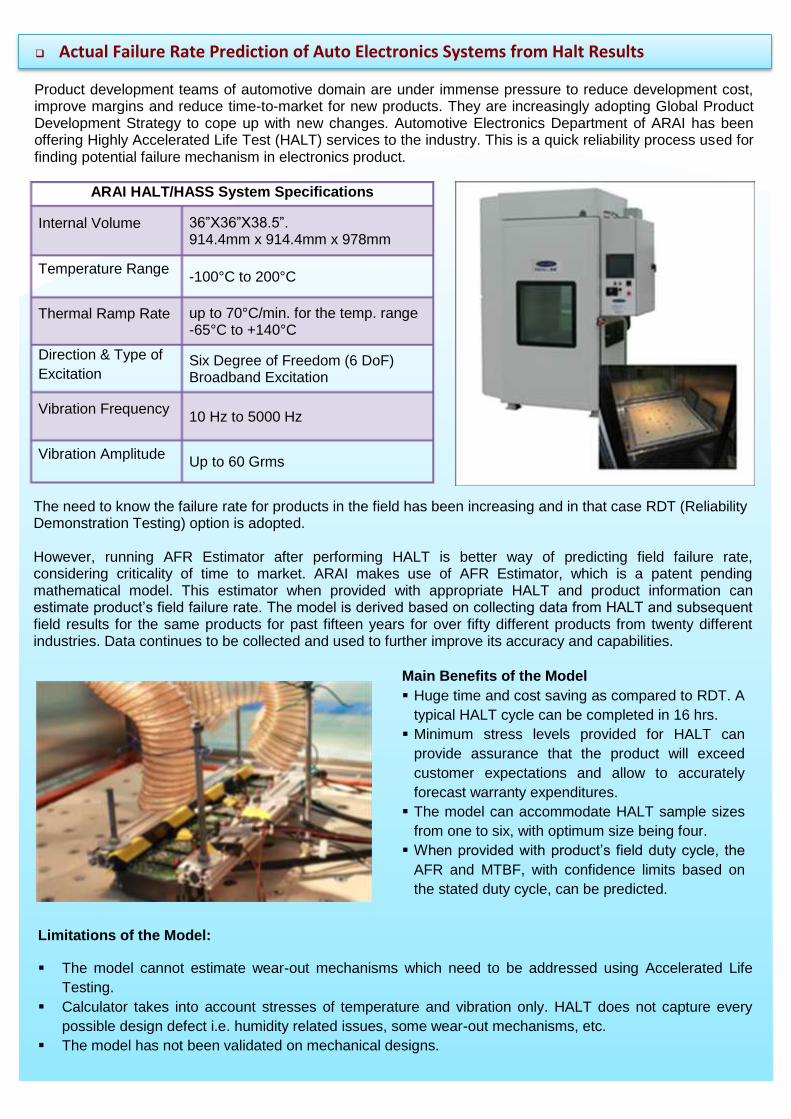
Actual Failure Rate Prediction of Auto Electronics Systems from Halt Results
Product development teams of automotive domain are under immense pressure to reduce development cost, improve margins and reduce time-to-market for new products. They are increasingly adopting Global Product Development Strategy to cope up with new changes. Automotive Electronics Department of ARAI has been offering Highly Accelerated Life Test (HALT) services to the industry. This is a quick reliability process used for finding potential failure mechanism in electronics product.
ARAI HALT/HASS System Specifications
Internal Volume 36”X36”X38.5”. 914.4mm x 914.4mm x 978mm
Temperature Range -100°C to 200°C
Thermal Ramp Rate up to 70°C/min. for the temp. range -65°C to +140°C
Direction & Type of
Excitation Six Degree of Freedom (6 DoF) Broadband Excitation
Vibration Frequency 10 Hz to 5000 Hz
Vibration Amplitude Up to 60 Grms
The need to know the failure rate for products in the field has been increasing and in that case RDT (Reliability Demonstration Testing) option is adopted. However, running AFR Estimator after performing HALT is better way of predicting field failure rate, considering criticality of time to market. ARAI makes use of AFR Estimator, which is a patent pending mathematical model. This estimator when provided with appropriate HALT and product information can estimate product’s field failure rate. The model is derived based on collecting data from HALT and subsequent field results for the same products for past fifteen years for over fifty different products from twenty different industries. Data continues to be collected and used to further improve its accuracy and capabilities.
Main Benefits of the Model
Huge time and cost saving as compared to RDT. A
typical HALT cycle can be completed in 16 hrs.
Minimum stress levels provided for HALT can
provide assurance that the product will exceed
customer expectations and allow to accurately
forecast warranty expenditures.
The model can accommodate HALT sample sizes
from one to six, with optimum size being four.
When provided with product’s field duty cycle, the
AFR and MTBF, with confidence limits based on
the stated duty cycle, can be predicted.
Limitations of the Model:
The model cannot estimate wear-out mechanisms which need to be addressed using Accelerated Life
Testing.
Calculator takes into account stresses of temperature and vibration only. HALT does not capture every
possible design defect i.e. humidity related issues, some wear-out mechanisms, etc.
The model has not been validated on mechanical designs.
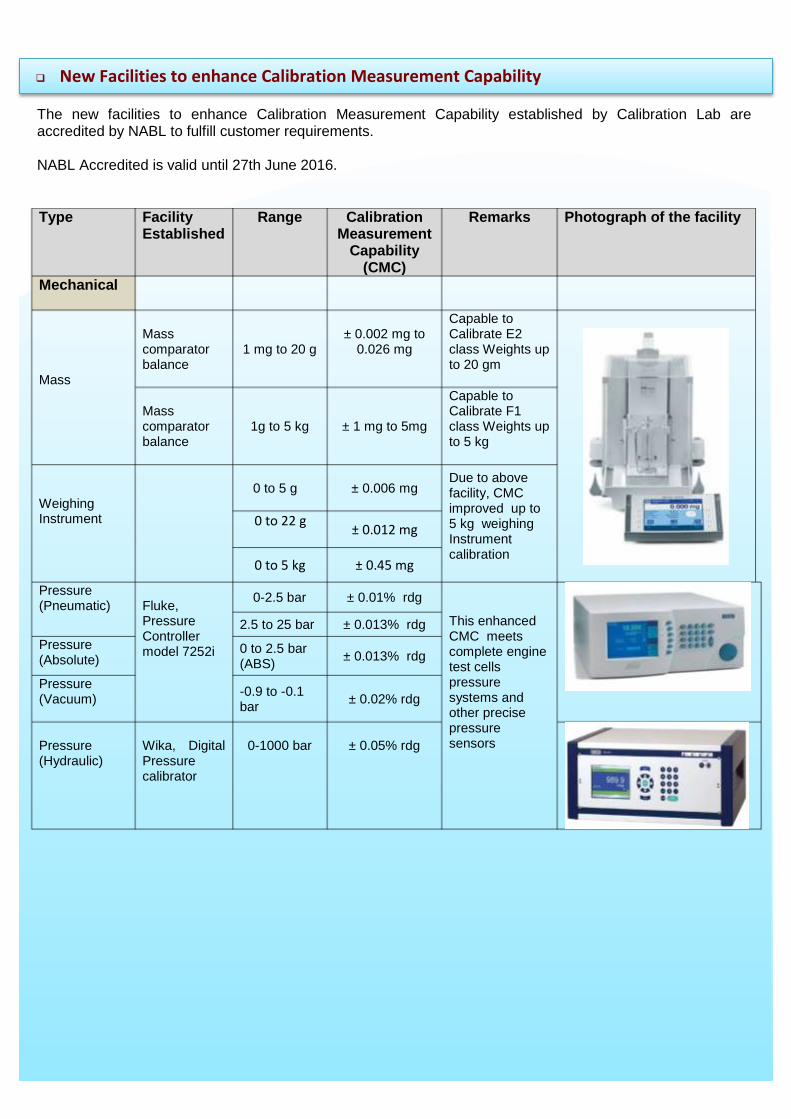
New Facilities to enhance Calibration Measurement Capability
The new facilities to enhance Calibration Measurement Capability established by Calibration Lab are accredited by NABL to fulfill customer requirements. NABL Accredited is valid until 27th June 2016.
Type Facility Established
Range Calibration Measurement
Capability (CMC)
Remarks Photograph of the facility
Mechanical
Mass
Mass comparator balance
1 mg to 20 g
± 0.002 mg to
0.026 mg
Capable to Calibrate E2 class Weights up to 20 gm
Mass comparator balance
1g to 5 kg
± 1 mg to 5mg
Capable to Calibrate F1 class Weights up to 5 kg
Weighing Instrument
0 to 5 g
± 0.006 mg Due to above facility, CMC improved up to 5 kg weighing Instrument calibration
0 to 22 g
± 0.012 mg
0 to 5 kg ± 0.45 mg
Pressure (Pneumatic)
Fluke, Pressure Controller model 7252i
0-2.5 bar ± 0.01% rdg This enhanced CMC meets complete engine test cells pressure systems and other precise pressure sensors
2.5 to 25 bar ± 0.013% rdg
Pressure (Absolute)
0 to 2.5 bar (ABS)
± 0.013% rdg
Pressure (Vacuum)
-0.9 to -0.1 bar
± 0.02% rdg
Pressure (Hydraulic)
Wika, Digital Pressure calibrator
0-1000 bar
± 0.05% rdg

Vibration Amplitude
Vibration transducer Calibration System-B&K With Reference Multimeter & Counter
0.1 g to 10 g ±1.35% to 2.2% For calibration of Vibration shaker, Exiter
Vibration Meter for Acceleration, Velocity, Displacement
Vibration transducer Calibration System-B&K
0.1g to 10g, 1mm/sec to 200mm/sec & 0.01mm to 5mm
± 2%
For calibration of Vibration Meters Analyser having transducer.
Sound Pressure Level
Reference microphone with pulse system
30 dB to 160 dB
± 0.24 dB For calibration of Sound Calibrator
Flow Fluid Flow
Blow By Meter calibration
10 to 200LPM
±1.02% to ±1.5% rdg
Facility established for meeting customer requirement
Thermal Thermal Field
Temperature and Humidity chamber calibration
-40 to 200°C, 20% to 95%
± 0.4°C and ± 2%
Facility established for meeting customer requirement
Utilization of Digital Image Correlation (DIC) for Strain Measurement
In continuously growing automotive industry, one of the critical areas of experimental mechanics is to measure
strain in loading conditions for complex components. In general applications, strain is usually measured using
strain gauges or if possible by extensometers. In both the methods, strain can be measured in between two
points only. It is important to know that the strain is not uniaxial always, and in case of complex components, it
is very much important to understand the straining behavior in 3 Dimensional spaces.
Two and three dimensional digital image correlation methods are full-field displacement and strain
measurement tools increasingly used for static and dynamic testing. Automotive Materials Lab of ARAI is
equipped with Three Dimensional Digital Image Correlation system to carry out strain measurement. The
system is capable of measuring strain distribution in material or component level, in compression or tensile
mode. Figure 1 shows the set up at ARAI.
Fig. 1 : Experimental set up at ARAI for DIC
Camera Camera
Image acquisition system with digitizer and Image correlation system
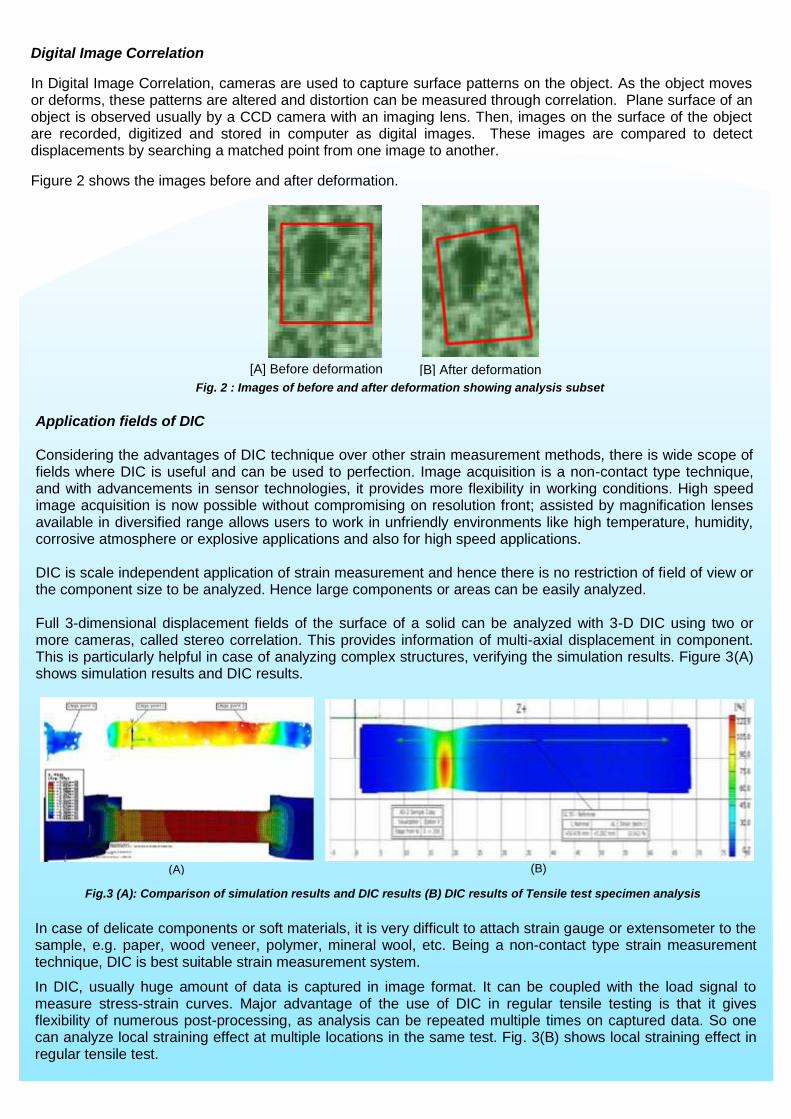
Digital Image Correlation
In Digital Image Correlation, cameras are used to capture surface patterns on the object. As the object moves or deforms, these patterns are altered and distortion can be measured through correlation. Plane surface of an object is observed usually by a CCD camera with an imaging lens. Then, images on the surface of the object are recorded, digitized and stored in computer as digital images. These images are compared to detect displacements by searching a matched point from one image to another.
Figure 2 shows the images before and after deformation.
[A] Before deformation [B] After deformation
Fig. 2 : Images of before and after deformation showing analysis subset
Application fields of DIC Considering the advantages of DIC technique over other strain measurement methods, there is wide scope of fields where DIC is useful and can be used to perfection. Image acquisition is a non-contact type technique, and with advancements in sensor technologies, it provides more flexibility in working conditions. High speed image acquisition is now possible without compromising on resolution front; assisted by magnification lenses available in diversified range allows users to work in unfriendly environments like high temperature, humidity, corrosive atmosphere or explosive applications and also for high speed applications. DIC is scale independent application of strain measurement and hence there is no restriction of field of view or the component size to be analyzed. Hence large components or areas can be easily analyzed. Full 3-dimensional displacement fields of the surface of a solid can be analyzed with 3-D DIC using two or more cameras, called stereo correlation. This provides information of multi-axial displacement in component. This is particularly helpful in case of analyzing complex structures, verifying the simulation results. Figure 3(A) shows simulation results and DIC results.
(A)
(B)
Fig.3 (A): Comparison of simulation results and DIC results (B) DIC results of Tensile test specimen analysis
In case of delicate components or soft materials, it is very difficult to attach strain gauge or extensometer to the sample, e.g. paper, wood veneer, polymer, mineral wool, etc. Being a non-contact type strain measurement technique, DIC is best suitable strain measurement system.
In DIC, usually huge amount of data is captured in image format. It can be coupled with the load signal to measure stress-strain curves. Major advantage of the use of DIC in regular tensile testing is that it gives flexibility of numerous post-processing, as analysis can be repeated multiple times on captured data. So one can analyze local straining effect at multiple locations in the same test. Fig. 3(B) shows local straining effect in regular tensile test.
Salient features of DIC
Non-contact type technique; provides more flexibility in working conditions.
Independent of the scale, hence large components or areas can be analyzed.
Flexibility of numerous post-processing and understanding of effect of notch or hole.
Competence to analyze local straining effect at multiple locations in the same test.
Three dimensional data acquisition provides feasibility to analyze complex components.
DIC is a very useful technique for analysis of critical parameters and components and to validate simulation results.
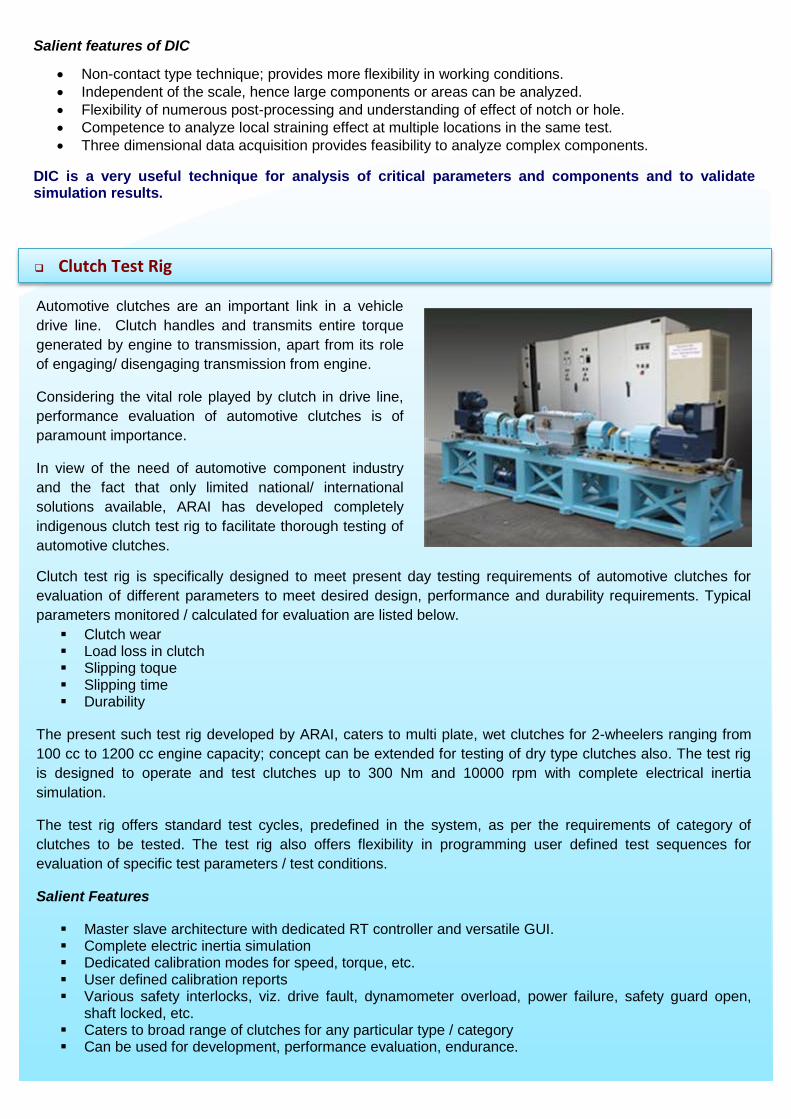
Clutch Test Rig
Automotive clutches are an important link in a vehicle
drive line. Clutch handles and transmits entire torque
generated by engine to transmission, apart from its role
of engaging/ disengaging transmission from engine.
Considering the vital role played by clutch in drive line,
performance evaluation of automotive clutches is of
paramount importance.
In view of the need of automotive component industry
and the fact that only limited national/ international
solutions available, ARAI has developed completely
indigenous clutch test rig to facilitate thorough testing of
automotive clutches.
Clutch test rig is specifically designed to meet present day testing requirements of automotive clutches for
evaluation of different parameters to meet desired design, performance and durability requirements. Typical
parameters monitored / calculated for evaluation are listed below.
Clutch wear Load loss in clutch Slipping toque Slipping time Durability
The present such test rig developed by ARAI, caters to multi plate, wet clutches for 2-wheelers ranging from
100 cc to 1200 cc engine capacity; concept can be extended for testing of dry type clutches also. The test rig
is designed to operate and test clutches up to 300 Nm and 10000 rpm with complete electrical inertia
simulation.
The test rig offers standard test cycles, predefined in the system, as per the requirements of category of
clutches to be tested. The test rig also offers flexibility in programming user defined test sequences for
evaluation of specific test parameters / test conditions.
Salient Features
Master slave architecture with dedicated RT controller and versatile GUI. Complete electric inertia simulation Dedicated calibration modes for speed, torque, etc. User defined calibration reports Various safety interlocks, viz. drive fault, dynamometer overload, power failure, safety guard open,
shaft locked, etc. Caters to broad range of clutches for any particular type / category Can be used for development, performance evaluation, endurance.
CNG DI Engine Development
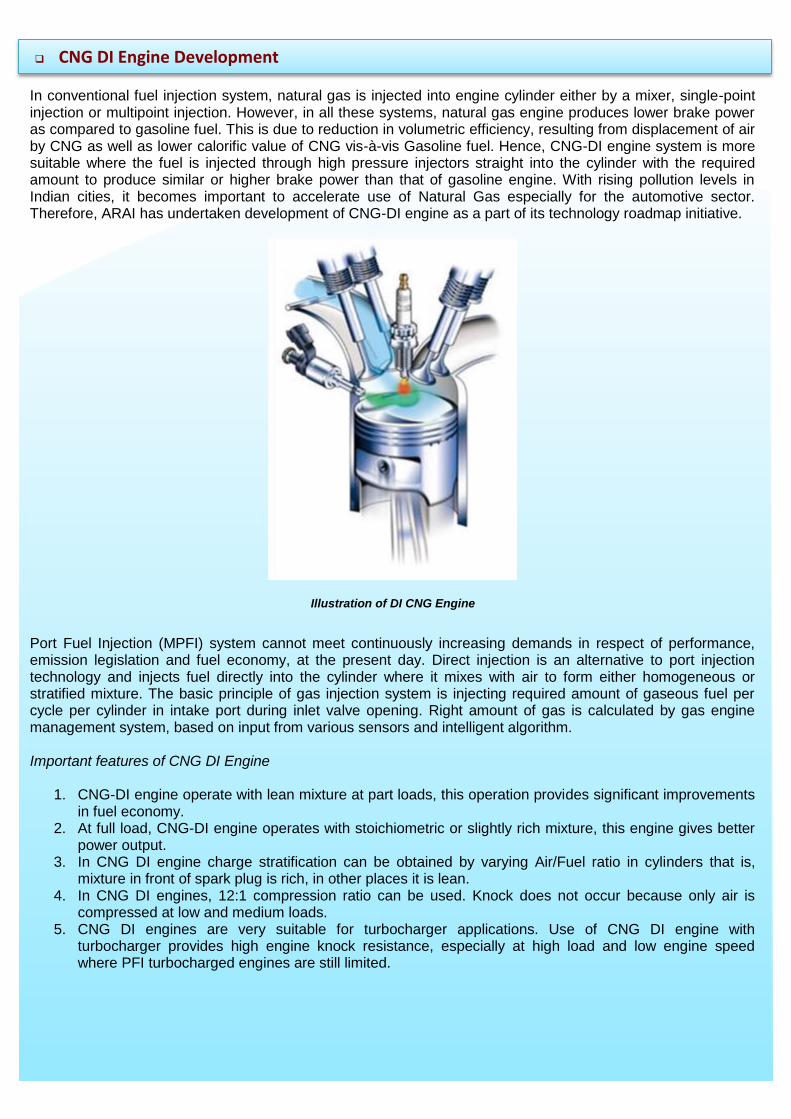
In conventional fuel injection system, natural gas is injected into engine cylinder either by a mixer, single-point injection or multipoint injection. However, in all these systems, natural gas engine produces lower brake power as compared to gasoline fuel. This is due to reduction in volumetric efficiency, resulting from displacement of air by CNG as well as lower calorific value of CNG vis-à-vis Gasoline fuel. Hence, CNG-DI engine system is more suitable where the fuel is injected through high pressure injectors straight into the cylinder with the required amount to produce similar or higher brake power than that of gasoline engine. With rising pollution levels in Indian cities, it becomes important to accelerate use of Natural Gas especially for the automotive sector. Therefore, ARAI has undertaken development of CNG-DI engine as a part of its technology roadmap initiative.
Illustration of DI CNG Engine
Port Fuel Injection (MPFI) system cannot meet continuously increasing demands in respect of performance, emission legislation and fuel economy, at the present day. Direct injection is an alternative to port injection technology and injects fuel directly into the cylinder where it mixes with air to form either homogeneous or stratified mixture. The basic principle of gas injection system is injecting required amount of gaseous fuel per cycle per cylinder in intake port during inlet valve opening. Right amount of gas is calculated by gas engine management system, based on input from various sensors and intelligent algorithm. Important features of CNG DI Engine
1. CNG-DI engine operate with lean mixture at part loads, this operation provides significant improvements in fuel economy.
2. At full load, CNG-DI engine operates with stoichiometric or slightly rich mixture, this engine gives better power output.
3. In CNG DI engine charge stratification can be obtained by varying Air/Fuel ratio in cylinders that is, mixture in front of spark plug is rich, in other places it is lean.
4. In CNG DI engines, 12:1 compression ratio can be used. Knock does not occur because only air is compressed at low and medium loads.
5. CNG DI engines are very suitable for turbocharger applications. Use of CNG DI engine with turbocharger provides high engine knock resistance, especially at high load and low engine speed where PFI turbocharged engines are still limited.
Engine Plant Model Parameterization & Validation for EMS Development
Control algorithm development for typical Engine Management System is a challenging task. Also, validation of Control algorithm on a standalone target engine is of prime importance. In turn, suitable closed loop testing environment is required. This can be achieved in engine test cell where actual engine will be controlled by prototype ECU. But this process involves higher testing cost, time consuming, non-reusability of test bed, etc. Simulating engine behavioral model in laboratory is becoming popular and an important industrial standard. This is very useful for various applications like
ECU Development
ECU Functional validation
Verification and Validation Simulation level check definitely provides added advantages like early problem detection, low fixing cost, cost effectiveness, etc. In lab, simulation of engine behavioral model requires many engine related parameters. Engine simulation requires some generic vehicle parameters like gross weight, vehicle inertia, wheel radius, gear ratio, etc. The parameters used for parameterization are typically obtained from engine design data and by performing actual steady state and transient trials on engine. For any development of control strategy, in lab validation with engine model is an important step of overall process. Various generic engine models are available for such application. But having a generic engine model is not sufficient; the generic model has to be parameterized with precise engine data from the target engine. Hence, first step is to set up and adjust response of this engine behavioral model similar to selected target engine. The task of matching the performance is challenging in itself in terms of torque, friction consideration, theoretical to actual variations, etc. Typically for control strategy development application, a mean value model is preferred because of its real-time simulation capability. Mean value model is simulation by solving physical equations and computations. Case Study
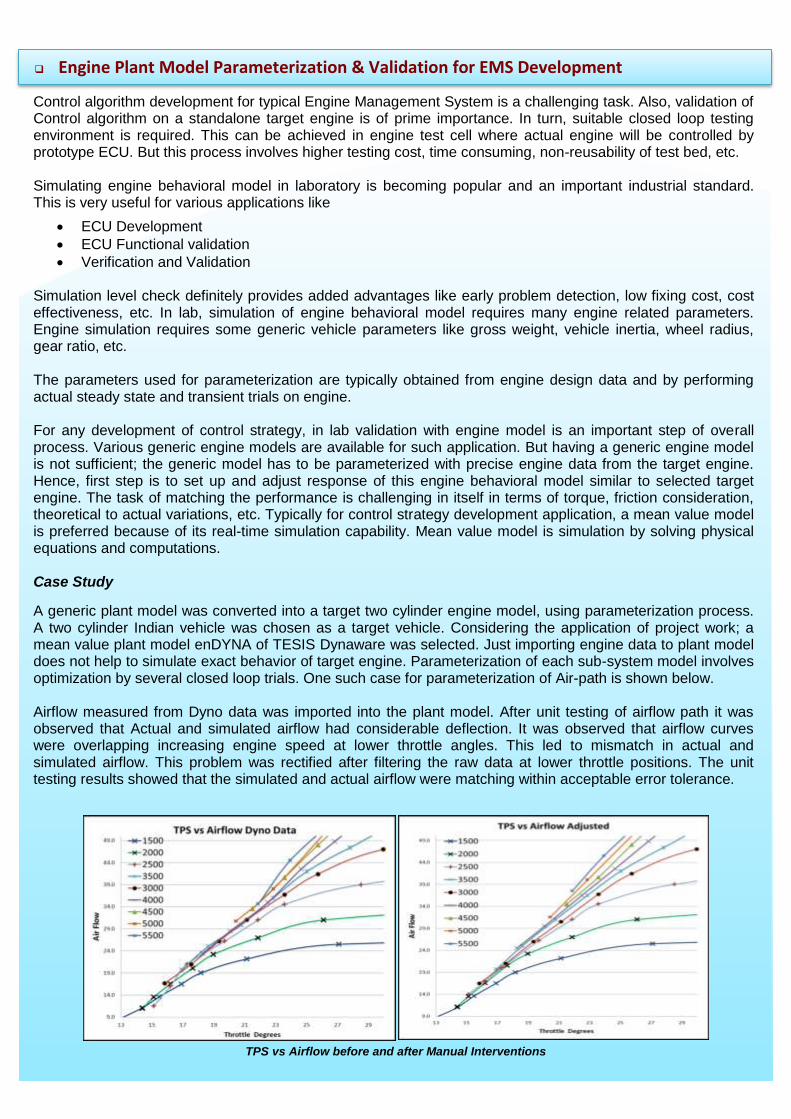
A generic plant model was converted into a target two cylinder engine model, using parameterization process. A two cylinder Indian vehicle was chosen as a target vehicle. Considering the application of project work; a mean value plant model enDYNA of TESIS Dynaware was selected. Just importing engine data to plant model does not help to simulate exact behavior of target engine. Parameterization of each sub-system model involves optimization by several closed loop trials. One such case for parameterization of Air-path is shown below. Airflow measured from Dyno data was imported into the plant model. After unit testing of airflow path it was observed that Actual and simulated airflow had considerable deflection. It was observed that airflow curves were overlapping increasing engine speed at lower throttle angles. This led to mismatch in actual and simulated airflow. This problem was rectified after filtering the raw data at lower throttle positions. The unit testing results showed that the simulated and actual airflow were matching within acceptable error tolerance.
TPS vs Airflow before and after Manual Interventions

Data Validation As a standard practice each sub-system was validated against input data fed into the engine model. After unit level validation complete plant was validated by creating similar test conditions as during actual dynamometer trials. Validation process was automated with varying throttle, RPM and Engine Torque, Manifold Absolute Pressure and Airflow were compared against measurement data and results so obtained were within the acceptance band.
Comparison of Simulated HIL Torque and Actual Engine torque
Comparison of Simulated HIL Airflow and Actual Engine Airflow
Driving Cycle
After steady-state trials the plant model was tested with transient tests for standard driving cycles. Urban Driving Cycle (UDC) and Extra Urban Driving Cycle (EUDC) were used to evaluate the performance. Mileage over the driving cycle is considered as a performance measure. For both the driving cycles, mileage was within the tolerance band. Additionally, instantaneous mileage and load torque were compared over the driving cycle. Actual results and simulated results were observed in close tolerance band. Error! Reference source not found shows fuel economy over UDC and EUDC comparison. Below figure shows speed of simulated vehicle while driving EUDC.
FUEL ECONOMY ON DRIVING CYCLE
EUDC Driving Cycle
Dynamometer
28.24 Km/L
Simulated
31.37 Km/L
UDC Driving Cycle
Dynamometer
20.48 Km/L
Simulated
24.5 Km/L
Table 1 - Comparison of Fuel Consumption
UDC Driving Cycle Results
Summary To get precise and realistic results from the simulated model, it is of prime importance to effectively parameterize the model with realistic engine behavior data. Iterative calibration of each individual subsystem helps to tune the model close to actual engine. After parameterization of plant model, next important step is validation of plant model against real engine. Simulations were carried out in Model In Loop (MIL) and Hardware In Loop (HIL), different phases were simulated and engine performance was compared with actual engine performance in various aspects. It was observed that the results were close enough to actual data and error tolerance was within 5 percent. This gives enough confidence to proceed to In-lab development, verification and validation of ECU. This study can be further extended to make efficient and precise parameterization of target engine, thus enabling us create an effective simulation environment for in-lab verification and validation of automotive ECUs.
Services that can be offered
Plant Model Parameterization and Validation
Chassis Dyno Trials and Data acquisition for Parameterization
OBD Verification and Validation
ECU Development and V&V
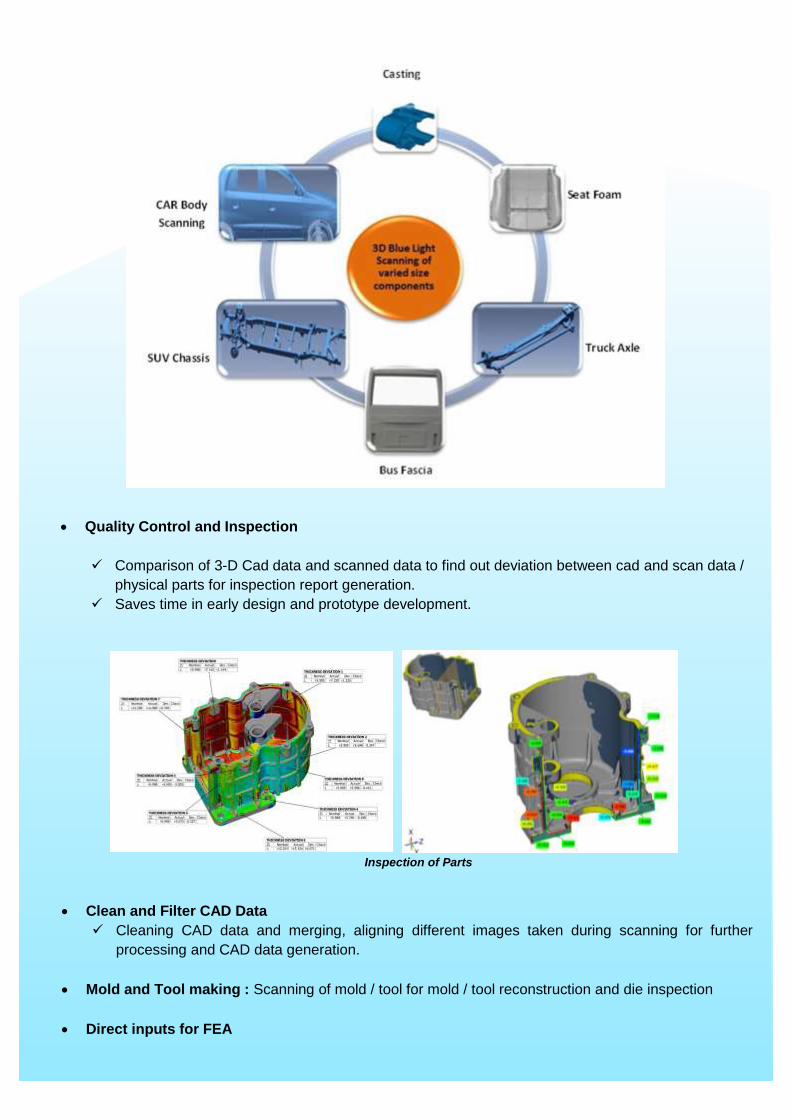
3-D Blue Light Scanning and 3-D/2-D CAD Data Generation
New Product Development in automotive domain is steered by number of simulation driven design programs
at vehicle and component level. Availability of CAD data is the preliminary requisite in executing such
programs for activities like benchmarking and product performance proving early at design stage. Based on
the demand for CAD data generation from customers, ARAI has enhanced its capability to address the
customer needs. 3-D scanning facility is established at ARAI Forging Industry Division, Chakan in January
2015. This service is also extended for onsite scanning to serve at customer’s premises. Presently, ARAI
has capabilities in the areas of design, development, analysis and testing of automotive components and
vehicles. Addition of this facility will be complementing to the design and analysis area. This high end
scanning facility has following broad range of applications:
Scanning of components and generating Cloud Point data for all types of parts, viz. sheet metal, plastic,
forging, casting, etc.
Digitized data generation for complex geometries like cylinder head and block, valves, turbochargers,
pump housing, blades, etc.
Inspection of various finished parts, prototypes, dies, etc.
Portable Scanner
3-D CAD generation using cloud point data with Geo magic Design-X, UG-NX and Pro-E (Creo)
Major Areas of Application
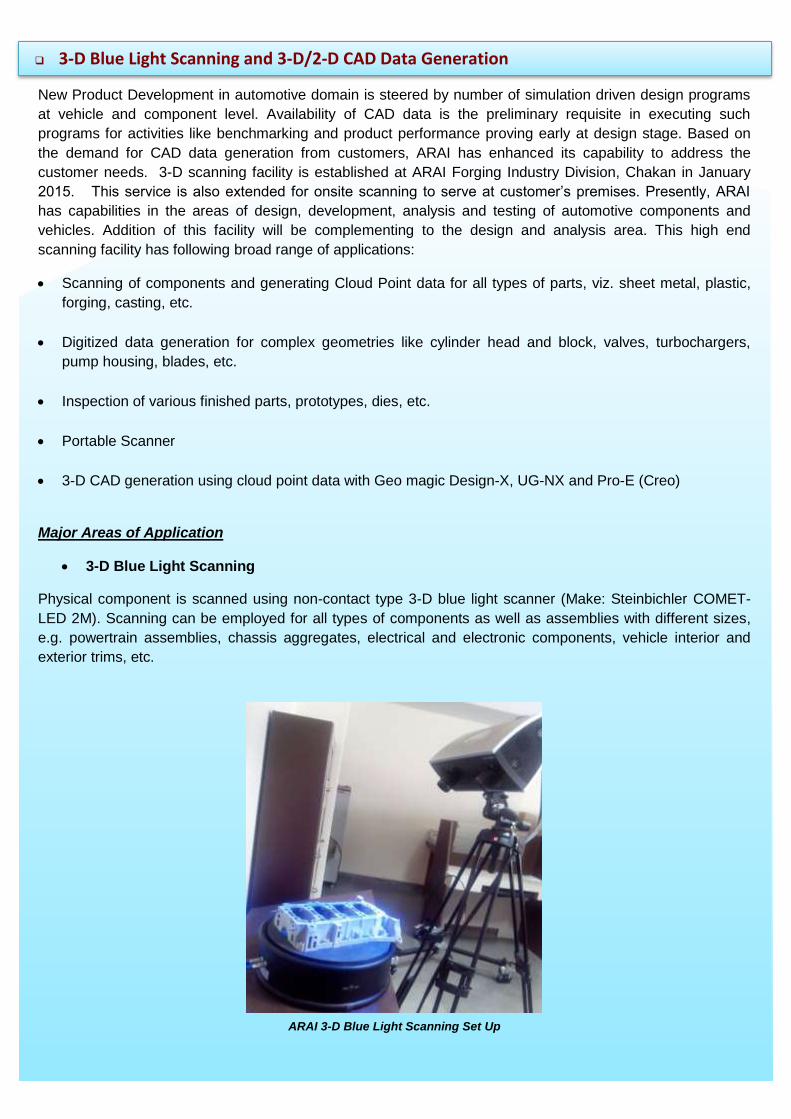
3-D Blue Light Scanning
Physical component is scanned using non-contact type 3-D blue light scanner (Make: Steinbichler COMET-
LED 2M). Scanning can be employed for all types of components as well as assemblies with different sizes,
e.g. powertrain assemblies, chassis aggregates, electrical and electronic components, vehicle interior and
exterior trims, etc.
ARAI 3-D Blue Light Scanning Set Up
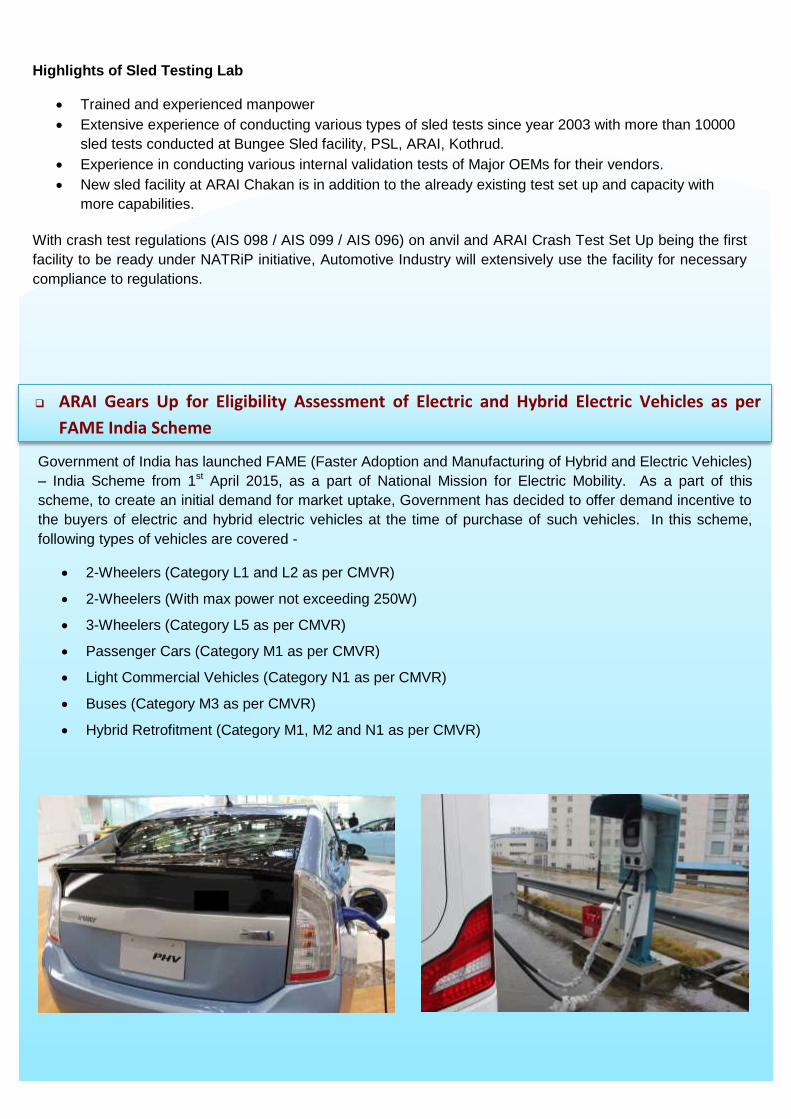
Quality Control and Inspection
Comparison of 3-D Cad data and scanned data to find out deviation between cad and scan data /
physical parts for inspection report generation.
Saves time in early design and prototype development.
Inspection of Parts
Clean and Filter CAD Data
Cleaning CAD data and merging, aligning different images taken during scanning for further
processing and CAD data generation.
Mold and Tool making : Scanning of mold / tool for mold / tool reconstruction and die inspection
Direct inputs for FEA

New state-of-the-art Crash Test Facility at ARAI-Chakan
3-D CAD Data Generation
From 3-D scanner, cloud point data is generated in *.stl format. To convert this cloud point data to CAD
format, following high end software are used
Geomagic Design-X
UG-NX
PRO-E
These softwares are capable of cleaning and filtering scan data, Point cloud data processing and editing, mesh editing, aligning CAD data and Scan Data, Inspection and deviation checking. It also helps in sketching, surface modeling, creating surfaces and solid parametric and un-parametric model.
New Crash Test Facility at Passive Safety Lab at ARAI Chakan Plant is successfully installed and
commissioned and now ready for use for vehicular crash testing to comply with applicable norms. Salient
features of the facility are -
Crash Testing
Electric AC Drive Crash Test System with maximum capacity of 3500 kg payload and propelling speed
of 80km/h.
Two Photo pits measuring 6m x 3m x 3m for capturing underbody view – one for full frontal / offset
frontal crash tests and other for Side Impact / Rear Impact Crash Tests.
High Speed cameras capable of capturing up to 2000 frames per second (as required for crash
applications).
Lighting Systems (on-board and off-board) capable of providing light intensity up to 1,50,000 lux
Static Rollover Test Facility
PHOTOGRAPHS OF FACILITY SET UP AT ARAI, CHAKAN PLANT
Crash Test Facility
Moving Barriers / Deformable Barriers

Pole Side Impact Static Rollover Facility
Facility Planned – Facility is planned for the following test configurations.
1. Full Frontal Test
2. Offset Frontal Test
3. Side Impact Test
4. Rear Impact Test
5. Crash tests for Airbag ECU Calibration 6. Crash tests for component evaluation of frontal structure
Highlights of Crash Testing Lab
Skilled, experienced and trained manpower
1500 man-days of crash testing experience
Experience of conducting crash tests since year 2003, with more than 65 crash tests conducted at
Passive Safety Lab, ARAI, Kothrud.
Experience of Developmental / Benchmarking Crash Tests
Evaluation of Road Restraint Systems and Security Devices like tire-ripper and bollards possible with
existing advanced Electronic Control Vehicle (ECV) facility
Motion analysis and signal analysis competency for impact tests
Experience of providing High Speed Photography and High Speed Multi Channel DAQ Services.

Sled Testing
Advanced Programmable Deceleration Sled with maximum trolley pay load of 1000 kg, maximum speed of
80 km/h and maximum deceleration of 60g.
Actual Laboratory Photos
Advanced Programmable Deceleration Sled
Facility planned for following test configurations
1. Seat Testing IS 15546 / AIS 023 / ECE R17 / ECE R80
2. Luggage Retention test IS 15546 / ECE R17
3. Door Locks and Door Retention Components GTR 1 / ECE R11
4. Child Restraint System Dynamic Test AIS 072 / ECE R44
5. Safety Belt Testing as per IS 15140 / ECE R16
6. Determination of Dynamically determined head impact zone IS 15223:2014 / ECE R21
7. Various crash test pulses (Few illustrative pulses)
Highlights of Sled Testing Lab
Trained and experienced manpower
Extensive experience of conducting various types of sled tests since year 2003 with more than 10000
sled tests conducted at Bungee Sled facility, PSL, ARAI, Kothrud.
Experience in conducting various internal validation tests of Major OEMs for their vendors.
New sled facility at ARAI Chakan is in addition to the already existing test set up and capacity with
more capabilities.
With crash test regulations (AIS 098 / AIS 099 / AIS 096) on anvil and ARAI Crash Test Set Up being the first
facility to be ready under NATRiP initiative, Automotive Industry will extensively use the facility for necessary
compliance to regulations.
ARAI Gears Up for Eligibility Assessment of Electric and Hybrid Electric Vehicles as per
FAME India Scheme
Government of India has launched FAME (Faster Adoption and Manufacturing of Hybrid and Electric Vehicles)
– India Scheme from 1st April 2015, as a part of National Mission for Electric Mobility. As a part of this
scheme, to create an initial demand for market uptake, Government has decided to offer demand incentive to
the buyers of electric and hybrid electric vehicles at the time of purchase of such vehicles. In this scheme,
following types of vehicles are covered -
2-Wheelers (Category L1 and L2 as per CMVR)
2-Wheelers (With max power not exceeding 250W)
3-Wheelers (Category L5 as per CMVR)
Passenger Cars (Category M1 as per CMVR)
Light Commercial Vehicles (Category N1 as per CMVR)
Buses (Category M3 as per CMVR)
Hybrid Retrofitment (Category M1, M2 and N1 as per CMVR)
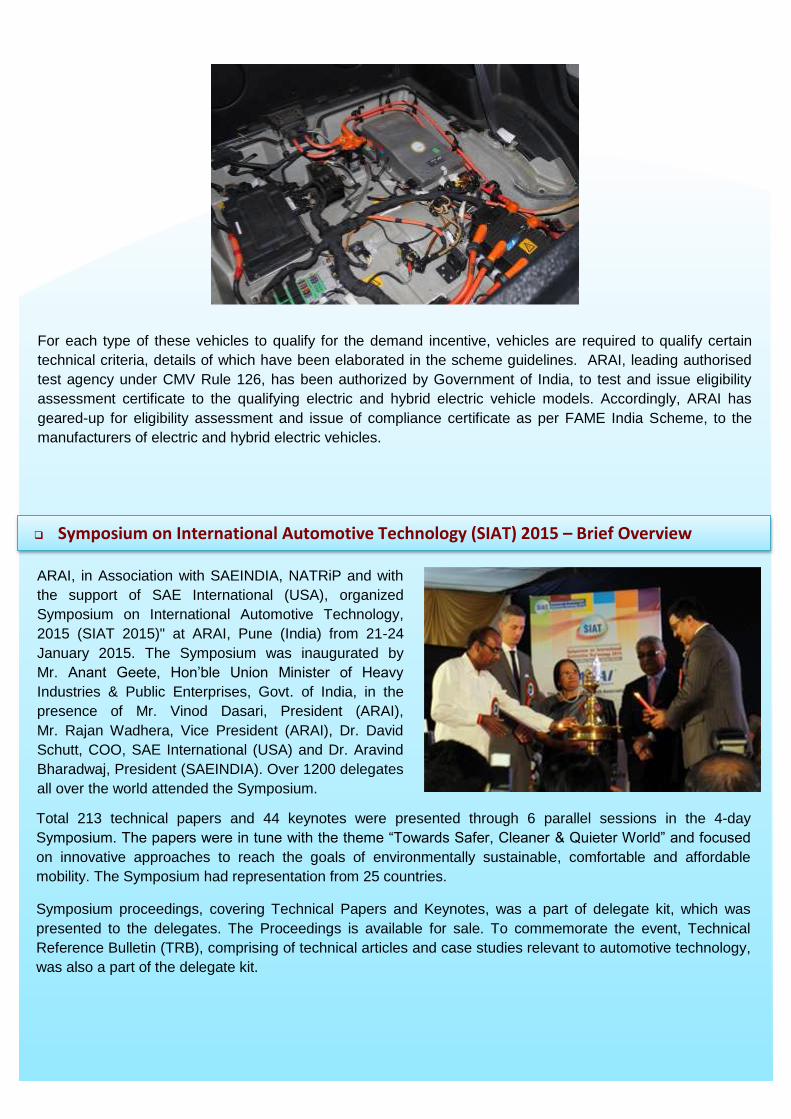
For each type of these vehicles to qualify for the demand incentive, vehicles are required to qualify certain
technical criteria, details of which have been elaborated in the scheme guidelines. ARAI, leading authorised
test agency under CMV Rule 126, has been authorized by Government of India, to test and issue eligibility
assessment certificate to the qualifying electric and hybrid electric vehicle models. Accordingly, ARAI has
geared-up for eligibility assessment and issue of compliance certificate as per FAME India Scheme, to the
manufacturers of electric and hybrid electric vehicles.
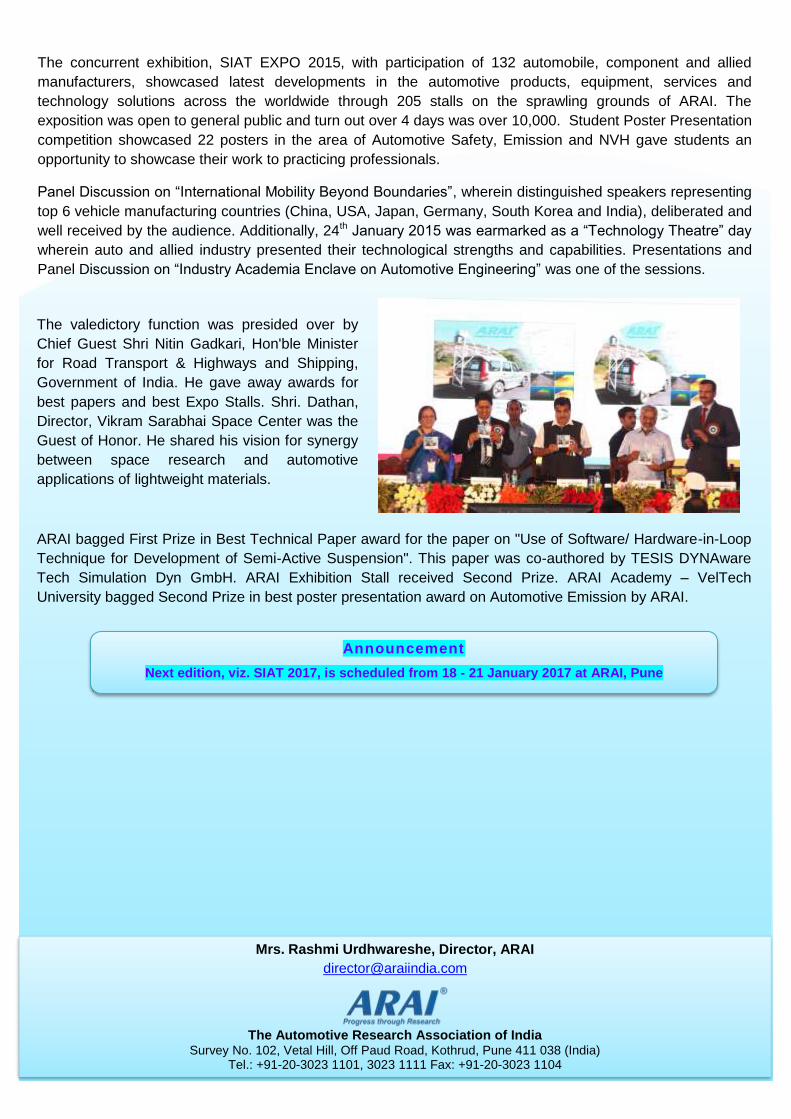
ARAI, in Association with SAEINDIA, NATRiP and with
the support of SAE International (USA), organized
Symposium on International Automotive Technology,
2015 (SIAT 2015)" at ARAI, Pune (India) from 21-24
January 2015. The Symposium was inaugurated by
Mr. Anant Geete, Hon’ble Union Minister of Heavy
Industries & Public Enterprises, Govt. of India, in the
presence of Mr. Vinod Dasari, President (ARAI),
Mr. Rajan Wadhera, Vice President (ARAI), Dr. David
Schutt, COO, SAE International (USA) and Dr. Aravind
Bharadwaj, President (SAEINDIA). Over 1200 delegates
all over the world attended the Symposium.
Symposium on International Automotive Technology (SIAT) 2015 – Brief Overview
Total 213 technical papers and 44 keynotes were presented through 6 parallel sessions in the 4-day
Symposium. The papers were in tune with the theme “Towards Safer, Cleaner & Quieter World” and focused
on innovative approaches to reach the goals of environmentally sustainable, comfortable and affordable
mobility. The Symposium had representation from 25 countries.
Symposium proceedings, covering Technical Papers and Keynotes, was a part of delegate kit, which was
presented to the delegates. The Proceedings is available for sale. To commemorate the event, Technical
Reference Bulletin (TRB), comprising of technical articles and case studies relevant to automotive technology,
was also a part of the delegate kit.
Mrs. Rashmi Urdhwareshe, Director, ARAI
The Automotive Research Association of India
Survey No. 102, Vetal Hill, Off Paud Road, Kothrud, Pune 411 038 (India) Tel.: +91-20-3023 1101, 3023 1111 Fax: +91-20-3023 1104
The concurrent exhibition, SIAT EXPO 2015, with participation of 132 automobile, component and allied
manufacturers, showcased latest developments in the automotive products, equipment, services and
technology solutions across the worldwide through 205 stalls on the sprawling grounds of ARAI. The
exposition was open to general public and turn out over 4 days was over 10,000. Student Poster Presentation
competition showcased 22 posters in the area of Automotive Safety, Emission and NVH gave students an
opportunity to showcase their work to practicing professionals.
Panel Discussion on “International Mobility Beyond Boundaries”, wherein distinguished speakers representing
top 6 vehicle manufacturing countries (China, USA, Japan, Germany, South Korea and India), deliberated and
well received by the audience. Additionally, 24th January 2015 was earmarked as a “Technology Theatre” day
wherein auto and allied industry presented their technological strengths and capabilities. Presentations and
Panel Discussion on “Industry Academia Enclave on Automotive Engineering” was one of the sessions.
The valedictory function was presided over by
Chief Guest Shri Nitin Gadkari, Hon'ble Minister
for Road Transport & Highways and Shipping,
Government of India. He gave away awards for
best papers and best Expo Stalls. Shri. Dathan,
Director, Vikram Sarabhai Space Center was the
Guest of Honor. He shared his vision for synergy
between space research and automotive
applications of lightweight materials.
ARAI bagged First Prize in Best Technical Paper award for the paper on "Use of Software/ Hardware-in-Loop
Technique for Development of Semi-Active Suspension". This paper was co-authored by TESIS DYNAware
Tech Simulation Dyn GmbH. ARAI Exhibition Stall received Second Prize. ARAI Academy – VelTech
University bagged Second Prize in best poster presentation award on Automotive Emission by ARAI.
Announcement
Next edition, viz. SIAT 2017, is scheduled from 18 - 21 January 2017 at ARAI, Pune