arab youth: missing educational foundations for a productive life?
DESCRIPTION
Report by Center for Universal Education at BrookingsTRANSCRIPT
Center for
Universal Educationat BROOKINGS
ARAB YOUTH: MISSING EDUCATIONAL FOUNDATIONS FOR A PRODUCTIVE LIFE?HAFEZ GHANEM, MAYSA JALBOUT, LIESBET STEER
With Lauren Greubel, Adam Parker & Katie Smith
This paper is a companion piece to the Arab World Learning Barometer, an interactive tool that provides a snapshot
of education access and learning among children and youth in the Arab world. The Arab World Learning Barometer
can be found at www.brookings.edu/arabworldlearning.
Center for Universal Education at the Brookings Institution
The Center for Universal Education (CUE) at the Brookings Institution is one of the leading policy centers focused
on universal quality education in the developing world. CUE develops and disseminates effective solutions to
achieve equitable learning, and plays a critical role in influencing the development of new international education
policies and in transforming them into actionable strategies for governments, civil society and private enterprise.
For more about the Center for Universal Education at Brookings, please visit: www.brookings.edu/universal-education.
Authors
Hafez Ghanem is a Senior Fellow at the Global
Economy and Development Program at the
Brookings Institution.
Maysa Jalbout is a nonresident Fellow at the Center
for Universal Education at the Brookings Institution.
Liesbet Steer is a Fellow at the Center for Universal
Education at the Brookings Institution.
Contributors
Lauren Greubel is a Masters candidate at Columbia
University’s School of International and Public Affairs
(SIPA). She was previously a Project Coordinator
and Research Assistant at the Center for Universal
Education at the Brookings Institution.
Adam Parker is a Research Assistant at the Center for
Universal Education at the Brookings Institution.
Katie Smith is a Research Analyst at the Center for
Universal Education at the Brookings Institution.
Acknowledgments:
We are grateful to Rebecca Winthrop, senior fellow and director of the Center for Universal Education, for her
advice and inputs into the paper. We are also thankful to Pearson* for their collaboration and support throughout
this project, in particular to Teodora Berkova, Amanda Gardiner, and Brendan O’Grady. Special thanks to
Christopher Ingraham for the design of the learning barometer interactive.
* Brookings recognizes that the value it provides is in its absolute commitment to quality, independence and
impact. Activities supported by its donors reflect this commitment and the analysis and recommendations are not
determined or influenced by any donation.
CONTENTS
Introduction . . . . . . . . . . . . . . . . . . . . . . . . . . . . . . . . . . . . . . . . . . . . . . . . . . . . . . . . . . . . . . . . . . . . . . . . . . .1
The Learning Barometer . . . . . . . . . . . . . . . . . . . . . . . . . . . . . . . . . . . . . . . . . . . . . . . . . . . . . . . . . . . . . . . . 3
Education for a Productive Life: Youth Employment Link . . . . . . . . . . . . . . . . . . . . . . . . . . . . . . . . . . 16
What Can Be Done? . . . . . . . . . . . . . . . . . . . . . . . . . . . . . . . . . . . . . . . . . . . . . . . . . . . . . . . . . . . . . . . . . . . 19
Endnotes . . . . . . . . . . . . . . . . . . . . . . . . . . . . . . . . . . . . . . . . . . . . . . . . . . . . . . . . . . . . . . . . . . . . . . . . . . . . 21
References . . . . . . . . . . . . . . . . . . . . . . . . . . . . . . . . . . . . . . . . . . . . . . . . . . . . . . . . . . . . . . . . . . . . . . . . . . 22
LIST OF FIGURES
Figure 1: Primary School Net Enrollment Rate, 2001/2 to 2010/11 . . . . . . . . . . . . . . . . . . . . . . . . . . . . 4
Figure 2: Secondary School Net Enrollment Rate, 2001/2 to 2010/11 . . . . . . . . . . . . . . . . . . . . . . . . . 5
Figure 3: Overlapping Disparities in Extreme Education Poverty: Share of Population Age 17-22, 2006 to 2008 . . . . . . . . . . . . . . . . . . . . . . . . . . . . . . . . . . . . . . . . . . . . . 6
Figure 4: Extreme Education Poverty in Yemen, 2006 . . . . . . . . . . . . . . . . . . . . . . . . . . . . . . . . . . . . . . 6
Figure 5: Survival Rate for Primary School, 2001/2 to 2010/11 . . . . . . . . . . . . . . . . . . . . . . . . . . . . . . . 7
Figure 6: Survival Rate for Lower Secondary School, 2001/2 to 2010/11 . . . . . . . . . . . . . . . . . . . . . . 8
Figure 7: Percentage of Primary Students Not Meeting Basic Learning Level (Average Literacy and Numeracy) By Gender, 2011 . . . . . . . . . . . . . . . . . . . . . . . . . . . 9
Figure 8: Percentage of Lower Secondary Students Not Meeting Basic Learning Level (Average Literacy and Numeracy) By Gender, 2009/11 . . . . . . . . . . . . . . . . . . . . . . . . . . . . . . . . . . . . . 10
Figure 9: Percentage of Lower Secondary School Students Not Meeting Basic Learning Level (Average Literacy and Numeracy) by Location, 2009/11 . . . . . . . . . . . . . . . . . . . . . . . . . . . . . . . . . . . . 10
Figure 10: Percentage of Grade 8 Students Not Meeting Basic Learning Level in Numeracy (TIMSS) as a Function of Income . . . . . . . . . . . . . . . . . . . . . . . . . . . . . . . . . . . . . . . . . . . . . 11
Figure 11: Percentage of Primary Students Not Meeting Basic Learning Level (Average of Literacy and Numeracy), 2006/7 to 2011 . . . . . . . . . . . . . . . . . . . . . . . . . . . . . . . . . . . . . . 12
Figure 12: Percentage of Lower Secondary Students Not Meeting Basic Learning Level (Average of Literacy and Numeracy), 2006/7 to 2009/11 . . . . . . . . . . . . . . . . . . . . . 12
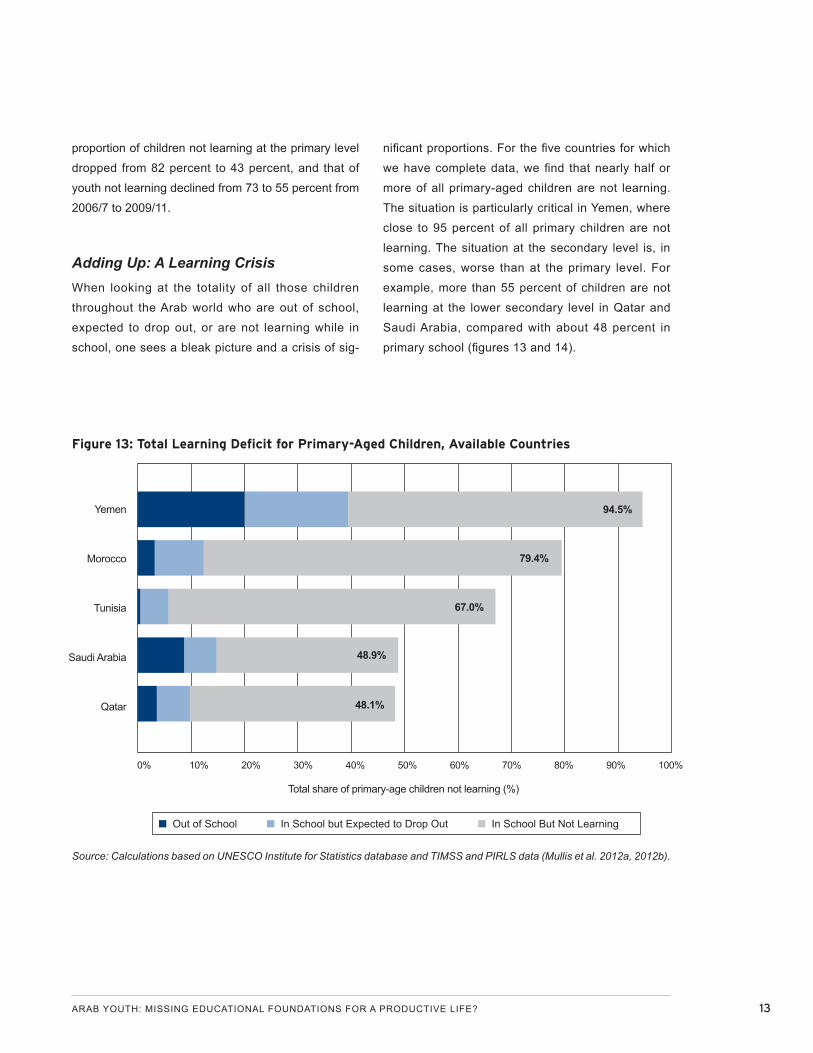
Figure 13: Total Learning Deficit for Primary-Aged Children, Available Countries . . . . . . . . . . . . . . 13
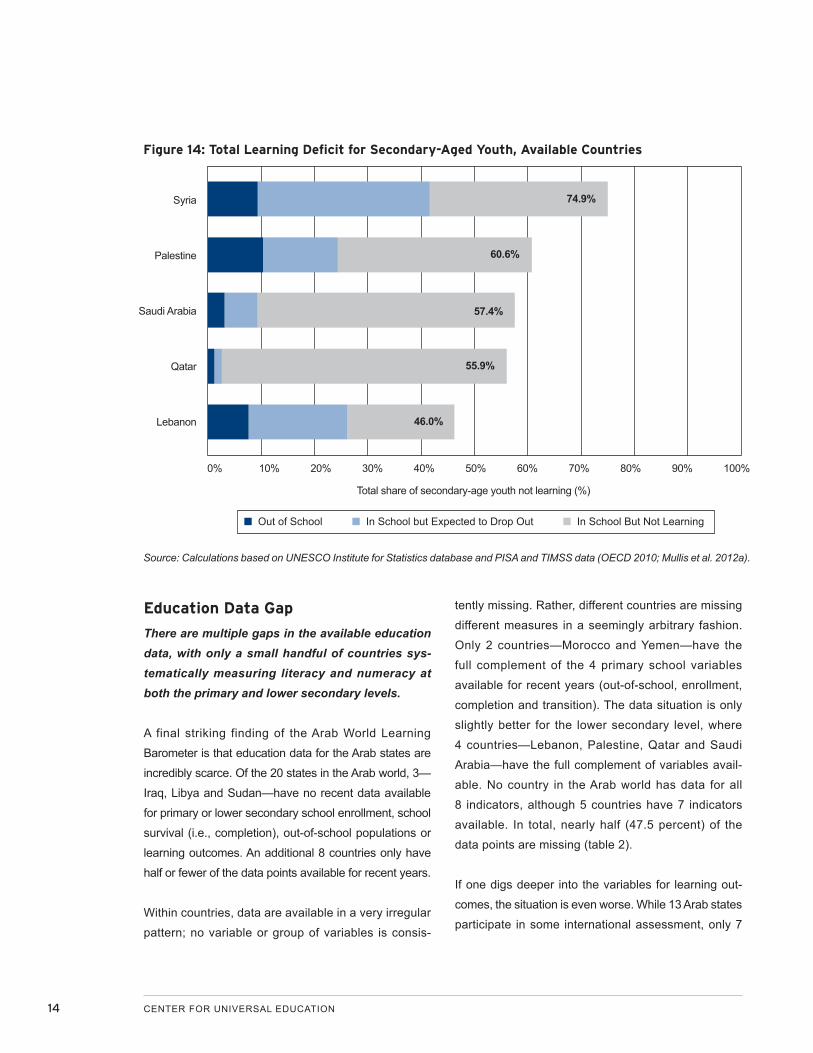
Figure 14: Total Learning Deficit for Secondary-Aged Youth, Available Countries . . . . . . . . . . . . . . 14
LIST OF TABLES
Table 1 . Arab World Learning Barometer: Percentage Not Meeting Basic Learning Level . . . . . . . . 8
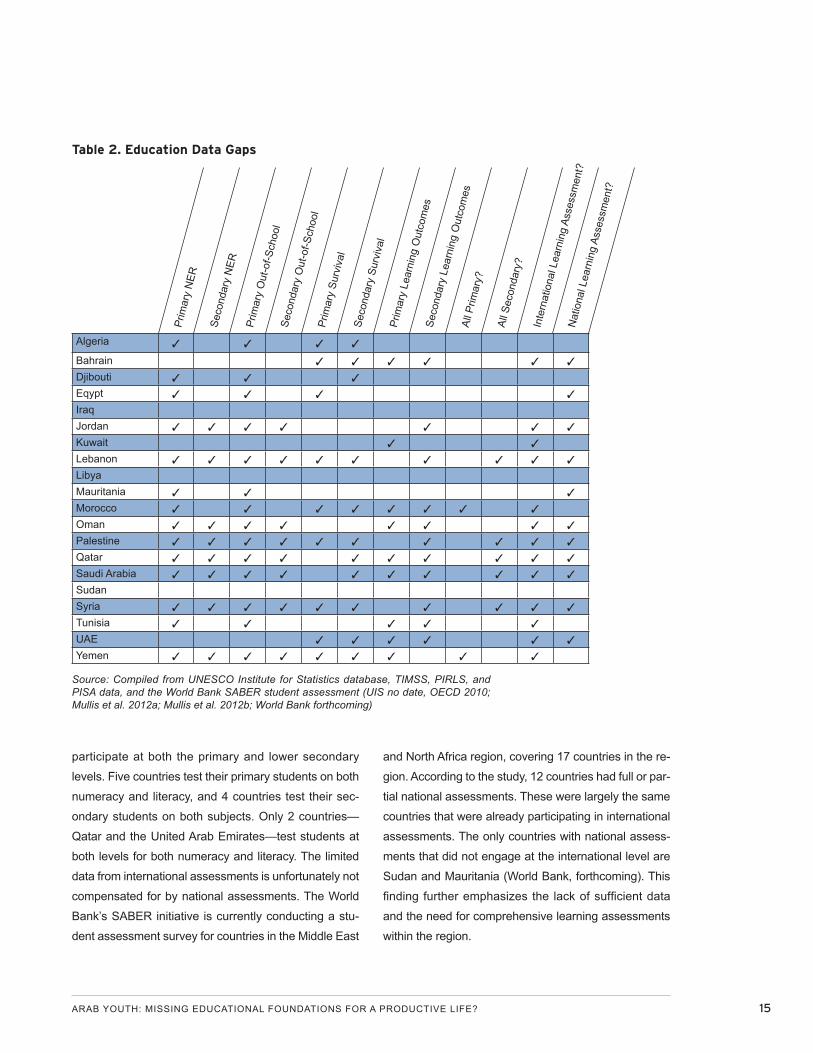
Table 2 . Education Data Gaps . . . . . . . . . . . . . . . . . . . . . . . . . . . . . . . . . . . . . . . . . . . . . . . . . . . . . . . . . . 15
Table 3 . Labor Force Participation Rates (percent), 2008–2011 . . . . . . . . . . . . . . . . . . . . . . . . . . . . . .17
Table 4 . Youth Unemployment Rates (percent), 2010 . . . . . . . . . . . . . . . . . . . . . . . . . . . . . . . . . . . . . . 18
ARAB YOUTH: MISSING EDUCATIONAL FOUNDATIONS FOR A PRODUCTIVE LIFE? 1
INTRODUCTIONRecent events continue to underline the fragility of the
Arab region. Civil war rages in Syria, refugees surge
across borders and the lasting effects of the Arab
Spring are uncertain. What is certain, however, is that
it is essential to give attention to the welfare of the re-
gion’s young people and to economic health in order
to build the foundations for lasting political stability
and, in many countries, for a transition to democracy.
Education is central to this effort. In particular, the abil-
ity of educational systems to help the region’s children
and youth develop the competencies and skills that will
serve them well for their future lives and livelihoods.
Economic conditions in a number of countries have
deteriorated recently, contributing to a sense of disillu-
sionment and frustration among the population and es-
pecially youth. In Egypt and Tunisia, for example, citizen
attitude surveys indicate that 83 percent of Tunisians
and more than 70 percent of Egyptians are unhappy
with current economic conditions (Pew Research
Center 2012). Youth unemployment is a grave concern.
Official unemployment figures tend to underestimate the
magnitude of the problem, and especially the problems
related to youth exclusion and women’s access to jobs.
In Tunisia, for instance, youth make up 33 percent of
the labor force but account for 75 percent of the unem-
ployed. Most governments have so far concentrated on
stimulating labor’s demand side (e.g., through invest-
ment climate policies) but have been paying less atten-
tion to the supply side (e.g., ensuring that youth have
the necessary skills to compete in the labor market).
The purpose of this report is to shine a spotlight on
education in the Arab world at a time when most public
attention is focused elsewhere, and thereby to open a
dialogue about this key issue. It is crucial now, more
than ever, to provide support for the ongoing efforts
of Arab educationalists—the many actors and innova-
tors who are working day by day to provide education
to the region’s young people. Progressive and smart
investments in education made today, including those
focused on children affected by conflict, will reap large
benefits in the future.
Increasingly, global actors are focusing both on who has
access to education but also, of particular importance,
on the types of skills, competencies and values that
young people acquire through their educational experi-
ence (United Nations 2013). New data show, globally,
that 250 million children are not able to read, write or
ARAB YOUTH: MISSING EDUCATIONAL FOUNDATIONS FOR A PRODUCTIVE LIFE?
HAFEZ GHANEM, MAYSA JALBOUT, LIESBET STEER
With Lauren Greubel, Adam Parker & Katie Smith
2 CENTER FOR UNIVERSAL EDUCATION
count well, even though many of them spent four years
in school, and that 200 million youth do not have the
skills needed for their future lives (UNESCO 2012).
But what about the young people in the Arab world?
Our analysis provides a regional overview of children’s
and youth’s ability to access, stay in and learn in
school. According to the latest data available at the pri-
mary and lower secondary school levels, we find that
1. Getting into School: There are 3.1 million fewer
children out of school since 2002 in the Arab region,
but 8.5 million children remain excluded. Many of
them are girls from poor, rural communities often liv-
ing in regions affected by conflict.
2. Staying in School: More children are finishing pri-
mary school than ever before, yet in many countries
more youth are dropping out of lower secondary
school than a decade ago.
3. Learning Foundational Skills: Using available
learning assessments in 13 Arab countries, the av-
erage proportion of children not learning while in
school stands at 56 percent at the primary level and
48 percent at the lower secondary level.
4. Regional Learning Crisis with Wide Variation Across Countries: Learning outcomes vary signifi-
cantly across countries in the region for which we
have data but are particularly worrying in Yemen,
Morocco, Kuwait and Tunisia where between two-
thirds and ninety percent of primary-age students
are failing to learn. At the lower secondary level,
over 60 percent of students are not learning in
Morocco and Oman. The learning performance of
children in Arab countries is also below expecta-
tions, given the countries’ income levels.
5. Girls versus Boys: There is a mixed, or “boomer-
ang,” dynamic for girls. While girls are less likely
to enter school than boys, they are more likely to
make the transition from primary to secondary ed-
ucation, and they tend to outperform boys in terms
of learning. However, despite significant invest-
ment and better performance in education, young
adult women are much less likely to be employed
than are men.
6. Education Data Gaps: There are multiple gaps
in education data in Arab countries—only a small
handful of countries systematically measure lit-
eracy and numeracy at both the primary and lower
secondary levels.
7. Education for a Productive Life—Youth Employment Link: The lack of appropriate foundational skills has
likely contributed to the employment crisis in the region,
but the dynamics between the education system and
the labor market, including the different reasons for
boys’ and girls’ participation in education and labor mar-
kets, need to be better understood.
The findings in this report have important implications
not only for families and education systems but also
for those policymakers focused on how the region can
better address important economic issues, including
youth unemployment. After reviewing the education
outcomes in depth, we discuss their implications for
youth employment in detail. In conclusion, we hope
these findings lead to further dialogue among actors
in the region on what actions could be most fruitful for
improving young people’s learning.
ARAB YOUTH: MISSING EDUCATIONAL FOUNDATIONS FOR A PRODUCTIVE LIFE? 3
THE LEARNING BAROMETERThe Arab World Learning Barometer, part of a regional
series developed by the Center of Universal Education
at Brookings, uses the latest available data to provide
a snapshot of the ability of children and youth in the
region to access school, complete school, and master
basic skills in literacy and numeracy.1 The Arab world is
considered here to be made up of 20 countries spread-
ing from North Africa to the Gulf,2 consistent with the
EFA Global Monitoring Report’s categorization. This
is a diverse region, with significant variation in levels
of income and development. The region is made up
of 8 lower-middle-income countries, 6 upper-middle-
income countries and 6 high-income countries, with a
per capita gross domestic product (GDP) ranging from
$1,361 for Yemen to $89,736 for Qatar. The Human
Development Index illustrates the equally wide varia-
tion in levels of human development; out of a total 186
countries, the United Arab Emirates is ranked 41st,
compared with 171st for Sudan. Pockets of fragility,
conflict and instability continue to threaten and under-
mine the region’s economic growth and human devel-
opment. Despite this diversity, there is an overriding
concern across the region regarding the ability of youth
to be successfully integrated into the labor market.
The Arab World Learning Barometer combines data on
four general indicators of education access and comple-
tion (net enrollment at the primary and lower secondary
levels, out-of-school primary children and youth, sur-
vival rates to the final grades of the primary and lower
secondary levels, and transition rates from the primary
to secondary levels) with data from international literacy
and numeracy tests. The percentage of children in
school who are not learning was determined by calcu-
lating the percentage of children who were not meeting
minimum requirements in those tests. The data cover
years from 2001 to 2011, and as such they do not reflect
much of the recent turmoil in the region. The conflict in
Syria, for example, is jeopardizing opportunities for hun-
dreds of thousands of children (see box 1).
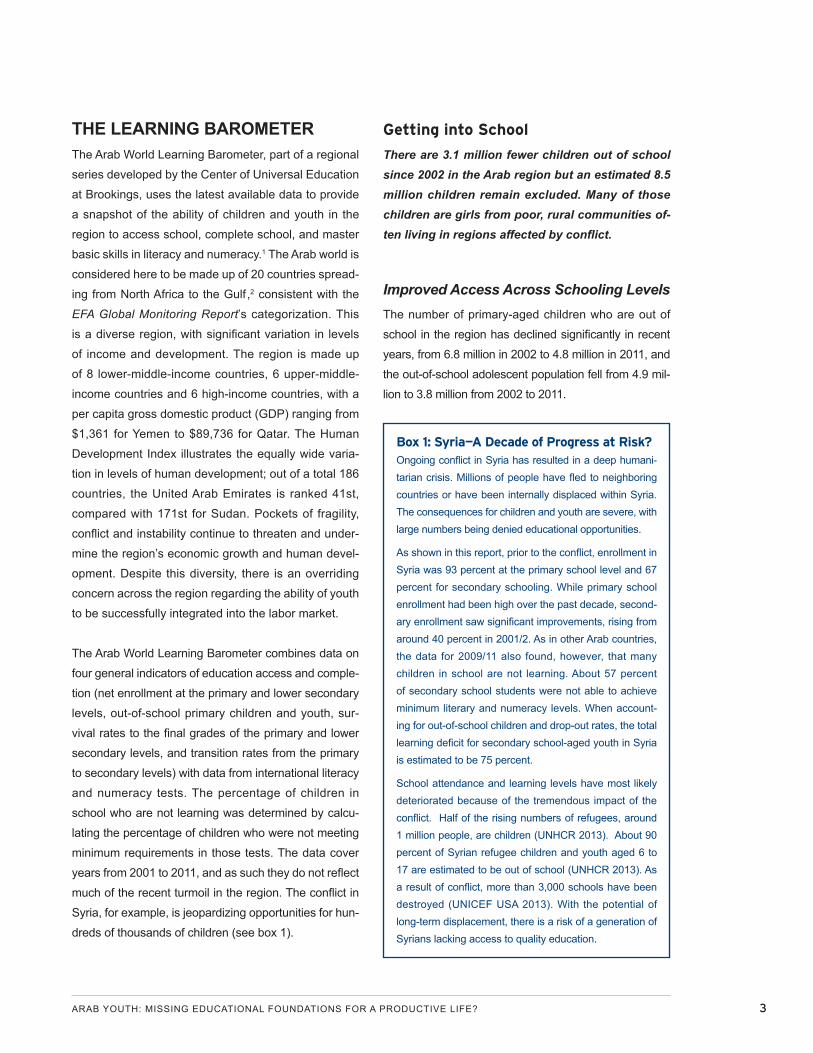
Getting into School
There are 3.1 million fewer children out of school since 2002 in the Arab region but an estimated 8.5 million children remain excluded. Many of those children are girls from poor, rural communities of-ten living in regions affected by conflict.
Improved Access Across Schooling LevelsThe number of primary-aged children who are out of
school in the region has declined significantly in recent
years, from 6.8 million in 2002 to 4.8 million in 2011, and
the out-of-school adolescent population fell from 4.9 mil-
lion to 3.8 million from 2002 to 2011.
Box 1: Syria—A Decade of Progress at Risk?Ongoing conflict in Syria has resulted in a deep humani-tarian crisis. Millions of people have fled to neighboring countries or have been internally displaced within Syria. The consequences for children and youth are severe, with large numbers being denied educational opportunities.
As shown in this report, prior to the conflict, enrollment in Syria was 93 percent at the primary school level and 67 percent for secondary schooling. While primary school enrollment had been high over the past decade, second-ary enrollment saw significant improvements, rising from around 40 percent in 2001/2. As in other Arab countries, the data for 2009/11 also found, however, that many children in school are not learning. About 57 percent of secondary school students were not able to achieve minimum literary and numeracy levels. When account-ing for out-of-school children and drop-out rates, the total learning deficit for secondary school-aged youth in Syria is estimated to be 75 percent.
School attendance and learning levels have most likely deteriorated because of the tremendous impact of the conflict. Half of the rising numbers of refugees, around 1 million people, are children (UNHCR 2013). About 90 percent of Syrian refugee children and youth aged 6 to 17 are estimated to be out of school (UNHCR 2013). As a result of conflict, more than 3,000 schools have been destroyed (UNICEF USA 2013). With the potential of long-term displacement, there is a risk of a generation of Syrians lacking access to quality education.
4 CENTER FOR UNIVERSAL EDUCATION
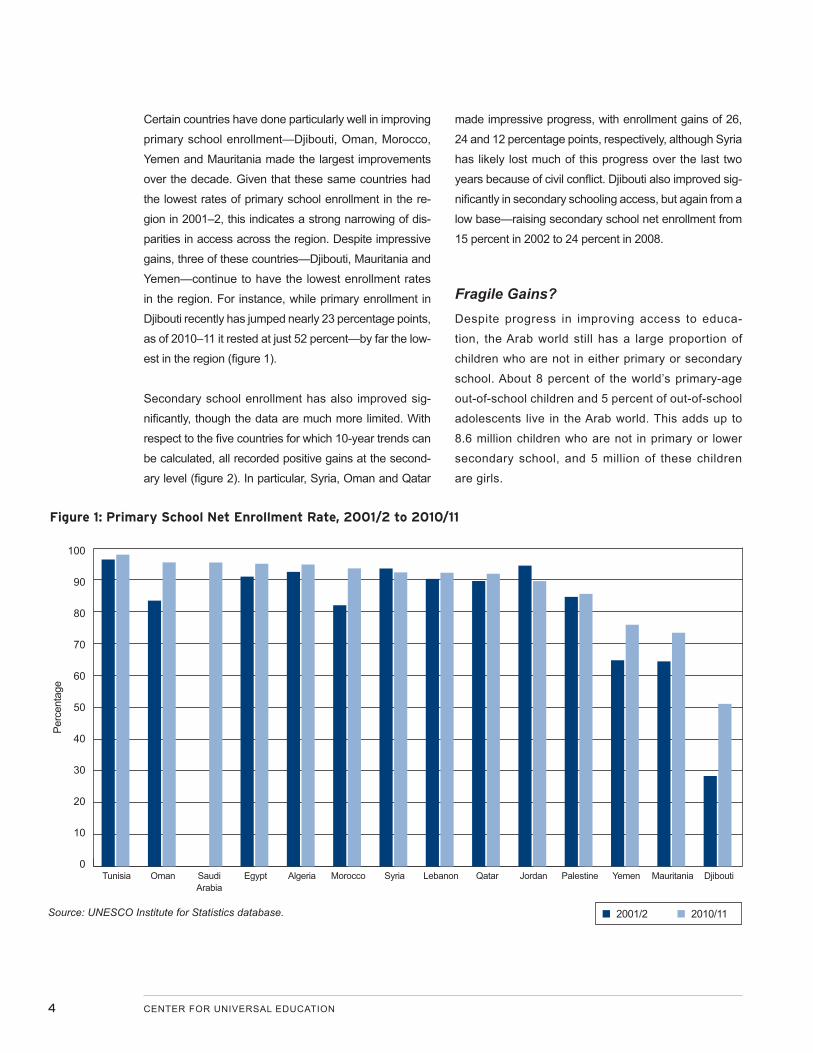
Certain countries have done particularly well in improving
primary school enrollment—Djibouti, Oman, Morocco,
Yemen and Mauritania made the largest improvements
over the decade. Given that these same countries had
the lowest rates of primary school enrollment in the re-
gion in 2001–2, this indicates a strong narrowing of dis-
parities in access across the region. Despite impressive
gains, three of these countries—Djibouti, Mauritania and
Yemen—continue to have the lowest enrollment rates
in the region. For instance, while primary enrollment in
Djibouti recently has jumped nearly 23 percentage points,
as of 2010–11 it rested at just 52 percent—by far the low-
est in the region (figure 1).
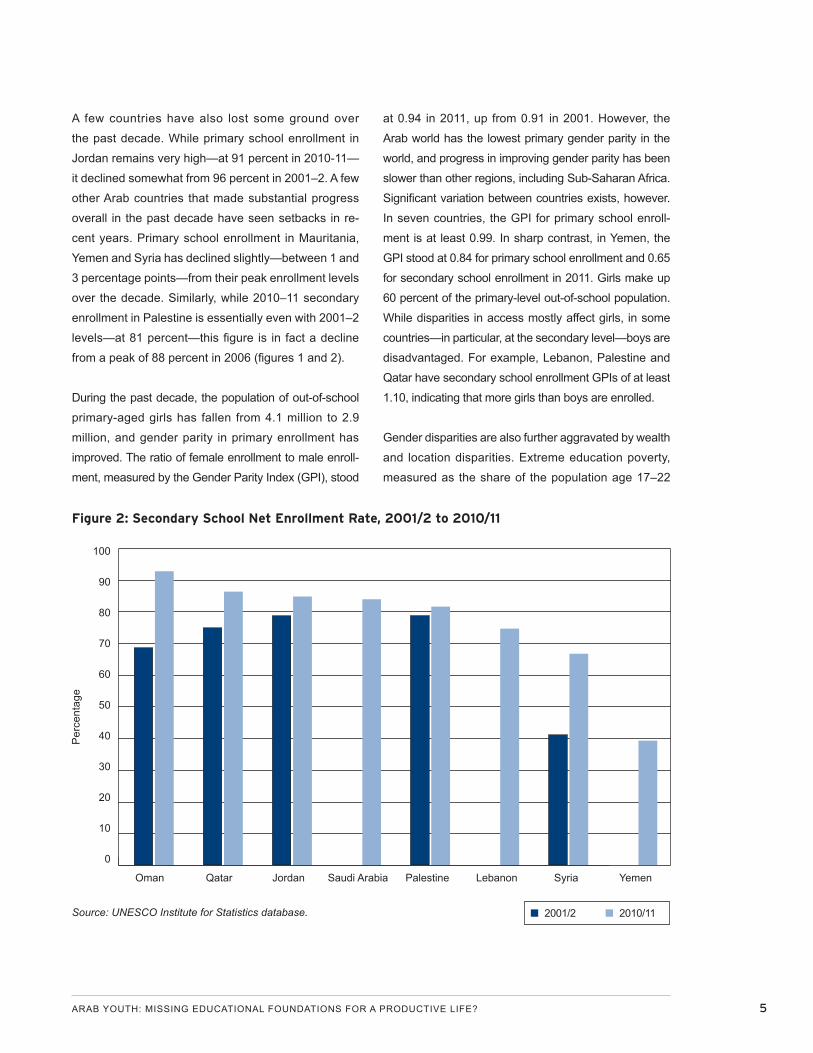
Secondary school enrollment has also improved sig-
nificantly, though the data are much more limited. With
respect to the five countries for which 10-year trends can
be calculated, all recorded positive gains at the second-
ary level (figure 2). In particular, Syria, Oman and Qatar
made impressive progress, with enrollment gains of 26,
24 and 12 percentage points, respectively, although Syria
has likely lost much of this progress over the last two
years because of civil conflict. Djibouti also improved sig-
nificantly in secondary schooling access, but again from a
low base—raising secondary school net enrollment from
15 percent in 2002 to 24 percent in 2008.
Fragile Gains?Despite progress in improving access to educa-
tion, the Arab world still has a large proportion of
children who are not in either primary or secondary
school. About 8 percent of the world’s primary-age
out-of-school children and 5 percent of out-of-school
adolescents live in the Arab world. This adds up to
8.6 million children who are not in primary or lower
secondary school, and 5 million of these children
are girls.
Figure 1: Primary School Net Enrollment Rate, 2001/2 to 2010/11
Source: UNESCO Institute for Statistics database.
Perc
enta
ge
Tunisia Oman Saudi Arabia
Egypt Algeria Morocco Syria Lebanon Qatar Jordan Palestine Yemen Mauritania Djibouti
100
90
80
70
60
50
40
30
20
10
0
■ 2001/2 ■ 2010/11
ARAB YOUTH: MISSING EDUCATIONAL FOUNDATIONS FOR A PRODUCTIVE LIFE? 5
A few countries have also lost some ground over
the past decade. While primary school enrollment in
Jordan remains very high—at 91 percent in 2010-11—
it declined somewhat from 96 percent in 2001–2. A few
other Arab countries that made substantial progress
overall in the past decade have seen setbacks in re-
cent years. Primary school enrollment in Mauritania,
Yemen and Syria has declined slightly—between 1 and
3 percentage points—from their peak enrollment levels
over the decade. Similarly, while 2010–11 secondary
enrollment in Palestine is essentially even with 2001–2
levels—at 81 percent—this figure is in fact a decline
from a peak of 88 percent in 2006 (figures 1 and 2).
During the past decade, the population of out-of-school
primary-aged girls has fallen from 4.1 million to 2.9
million, and gender parity in primary enrollment has
improved. The ratio of female enrollment to male enroll-
ment, measured by the Gender Parity Index (GPI), stood
at 0.94 in 2011, up from 0.91 in 2001. However, the
Arab world has the lowest primary gender parity in the
world, and progress in improving gender parity has been
slower than other regions, including Sub-Saharan Africa.
Significant variation between countries exists, however.
In seven countries, the GPI for primary school enroll-
ment is at least 0.99. In sharp contrast, in Yemen, the
GPI stood at 0.84 for primary school enrollment and 0.65
for secondary school enrollment in 2011. Girls make up
60 percent of the primary-level out-of-school population.
While disparities in access mostly affect girls, in some
countries—in particular, at the secondary level—boys are
disadvantaged. For example, Lebanon, Palestine and
Qatar have secondary school enrollment GPIs of at least
1.10, indicating that more girls than boys are enrolled.
Gender disparities are also further aggravated by wealth
and location disparities. Extreme education poverty,
measured as the share of the population age 17–22
Source: UNESCO Institute for Statistics database.
Figure 2: Secondary School Net Enrollment Rate, 2001/2 to 2010/11
Per
cent
age
Oman Qatar Jordan Saudi Arabia Palestine Lebanon Syria Yemen
100
90
80
70
60
50
40
30
20
10
0
■ 2001/2 ■ 2010/11
6 CENTER FOR UNIVERSAL EDUCATION
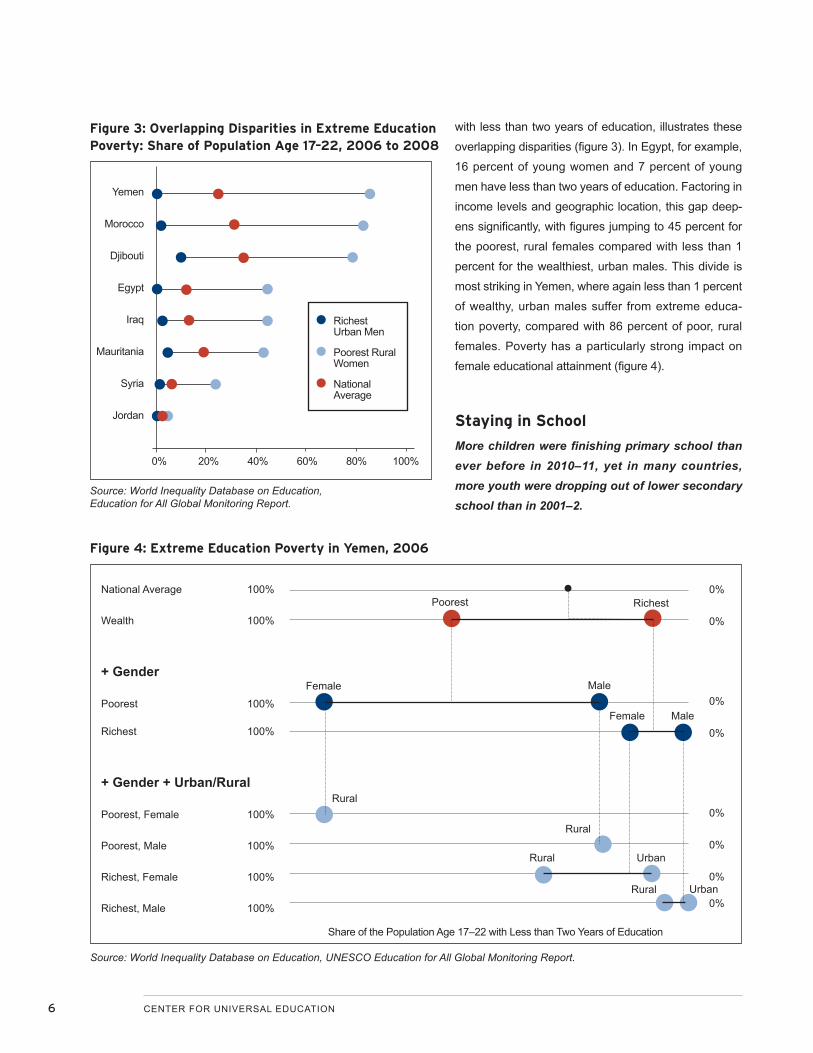
with less than two years of education, illustrates these
overlapping disparities (figure 3). In Egypt, for example,
16 percent of young women and 7 percent of young
men have less than two years of education. Factoring in
income levels and geographic location, this gap deep-
ens significantly, with figures jumping to 45 percent for
the poorest, rural females compared with less than 1
percent for the wealthiest, urban males. This divide is
most striking in Yemen, where again less than 1 percent
of wealthy, urban males suffer from extreme educa-
tion poverty, compared with 86 percent of poor, rural
females. Poverty has a particularly strong impact on
female educational attainment (figure 4).
Staying in School
More children were finishing primary school than ever before in 2010–11, yet in many countries, more youth were dropping out of lower secondary school than in 2001–2.
Yemen
Morocco
Djibouti
Egypt
Iraq
Mauritania
Syria
Jordan
0% 20% 40% 60% 80% 100%
● Richest Urban Men
● Poorest Rural Women
● National Average
Figure 3: Overlapping Disparities in Extreme Education Poverty: Share of Population Age 17–22, 2006 to 2008
Source: World Inequality Database on Education, Education for All Global Monitoring Report.
National Average 100%
Wealth 100%
+ Gender
Poorest 100%
Richest 100%
+ Gender + Urban/Rural
Poorest, Female 100%
Poorest, Male 100%
Richest, Female 100%
Richest, Male 100%
Rural
Rural
Rural
Rural
Urban
Urban
Female
Female
Male
Male
Poorest Richest0%
0%
0%
0%
0%
0%
0%
0%
Figure 4: Extreme Education Poverty in Yemen, 2006
Source: World Inequality Database on Education, UNESCO Education for All Global Monitoring Report.
Share of the Population Age 17–22 with Less than Two Years of Education
ARAB YOUTH: MISSING EDUCATIONAL FOUNDATIONS FOR A PRODUCTIVE LIFE? 7
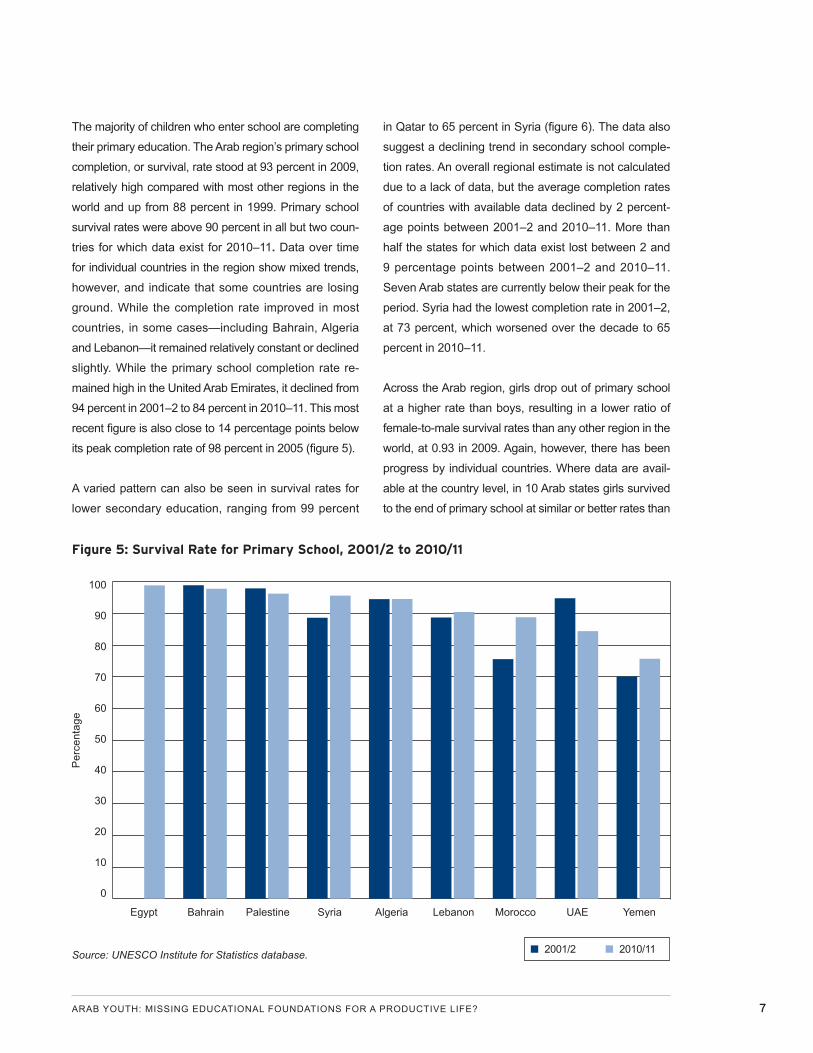
The majority of children who enter school are completing
their primary education. The Arab region’s primary school
completion, or survival, rate stood at 93 percent in 2009,
relatively high compared with most other regions in the
world and up from 88 percent in 1999. Primary school
survival rates were above 90 percent in all but two coun-
tries for which data exist for 2010–11. Data over time
for individual countries in the region show mixed trends,
however, and indicate that some countries are losing
ground. While the completion rate improved in most
countries, in some cases—including Bahrain, Algeria
and Lebanon—it remained relatively constant or declined
slightly. While the primary school completion rate re-
mained high in the United Arab Emirates, it declined from
94 percent in 2001–2 to 84 percent in 2010–11. This most
recent figure is also close to 14 percentage points below
its peak completion rate of 98 percent in 2005 (figure 5).
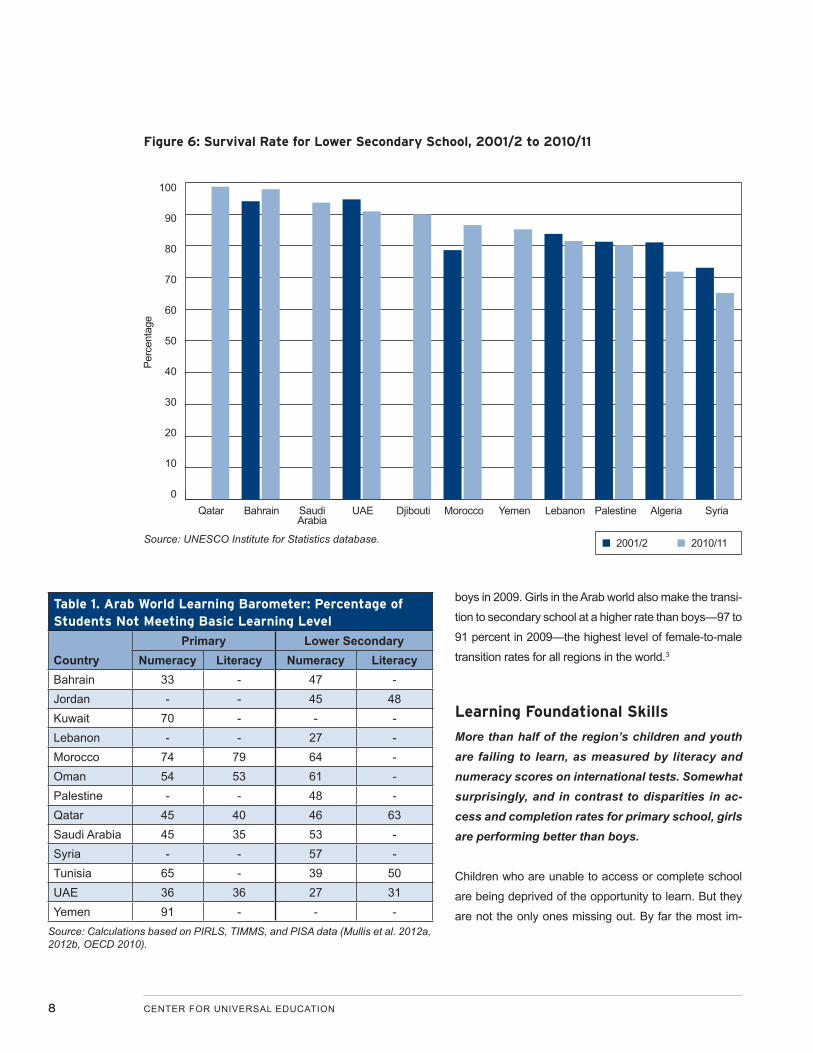
A varied pattern can also be seen in survival rates for
lower secondary education, ranging from 99 percent
in Qatar to 65 percent in Syria (figure 6). The data also
suggest a declining trend in secondary school comple-
tion rates. An overall regional estimate is not calculated
due to a lack of data, but the average completion rates
of countries with available data declined by 2 percent-
age points between 2001–2 and 2010–11. More than
half the states for which data exist lost between 2 and
9 percentage points between 2001–2 and 2010–11.
Seven Arab states are currently below their peak for the
period. Syria had the lowest completion rate in 2001–2,
at 73 percent, which worsened over the decade to 65
percent in 2010–11.
Across the Arab region, girls drop out of primary school
at a higher rate than boys, resulting in a lower ratio of
female-to-male survival rates than any other region in the
world, at 0.93 in 2009. Again, however, there has been
progress by individual countries. Where data are avail-
able at the country level, in 10 Arab states girls survived
to the end of primary school at similar or better rates than
Source: UNESCO Institute for Statistics database. ■ 2001/2 ■ 2010/11
Egypt Bahrain Palestine Syria Algeria Lebanon Morocco UAE Yemen
100
90
80
70
60
50
40
30
20
10
0
Per
cent
age
Figure 5: Survival Rate for Primary School, 2001/2 to 2010/11
8 CENTER FOR UNIVERSAL EDUCATION
boys in 2009. Girls in the Arab world also make the transi-
tion to secondary school at a higher rate than boys—97 to
91 percent in 2009—the highest level of female-to-male
transition rates for all regions in the world.3
Learning Foundational Skills
More than half of the region’s children and youth are failing to learn, as measured by literacy and numeracy scores on international tests. Somewhat surprisingly, and in contrast to disparities in ac-cess and completion rates for primary school, girls are performing better than boys.
Children who are unable to access or complete school
are being deprived of the opportunity to learn. But they
are not the only ones missing out. By far the most im-
Table 1. Arab World Learning Barometer: Percentage of Students Not Meeting Basic Learning Level
CountryPrimary Lower Secondary
Numeracy Literacy Numeracy LiteracyBahrain 33 - 47 -Jordan - - 45 48Kuwait 70 - - -Lebanon - - 27 -Morocco 74 79 64 -Oman 54 53 61 -Palestine - - 48 -Qatar 45 40 46 63Saudi Arabia 45 35 53 -Syria - - 57 -Tunisia 65 - 39 50UAE 36 36 27 31Yemen 91 - - -
Source: Calculations based on PIRLS, TIMMS, and PISA data (Mullis et al. 2012a, 2012b, OECD 2010).
Figure 6: Survival Rate for Lower Secondary School, 2001/2 to 2010/11
Source: UNESCO Institute for Statistics database. ■ 2001/2 ■ 2010/11
100
90
80
70
60
50
40
30
20
10
0Qatar Bahrain Saudi
ArabiaUAE Djibouti Morocco Yemen Lebanon Palestine Algeria Syria
Perc
enta
ge
ARAB YOUTH: MISSING EDUCATIONAL FOUNDATIONS FOR A PRODUCTIVE LIFE? 9
portant reason children are not learning is that they are
not receiving an adequate education, even if they go to
and stay in school. We estimate, based on the average
scores for literacy and numeracy for the 13 countries
for which we have available data, that 56 percent of
primary students and 48 percent of lower secondary
school students are not learning.4 By country, this fig-
ure ranges from 33 percent of children in Bahrain to 91
percent of children in Yemen who are not learning at the
primary level despite being in school. At the secondary
level, more than one-quarter of children are not learning
in Lebanon and the United Arab Emirates, while nearly
two-thirds are not learning in Morocco (table 1).
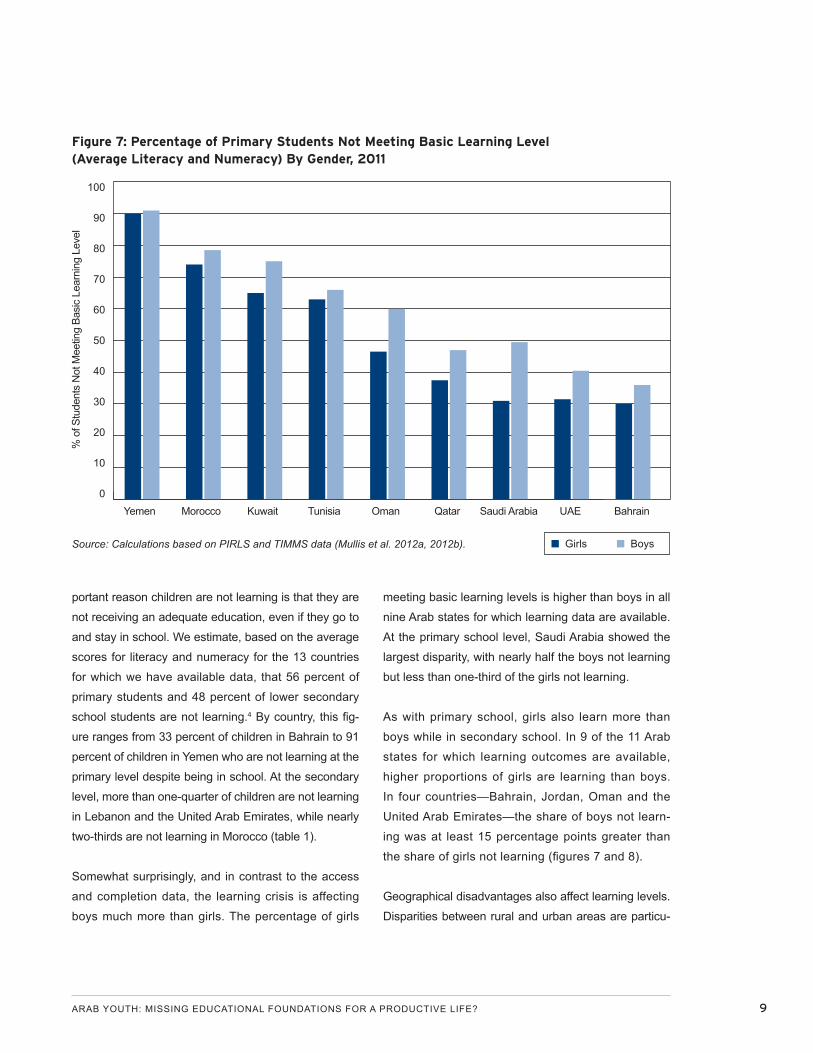
Somewhat surprisingly, and in contrast to the access
and completion data, the learning crisis is affecting
boys much more than girls. The percentage of girls
meeting basic learning levels is higher than boys in all
nine Arab states for which learning data are available.
At the primary school level, Saudi Arabia showed the
largest disparity, with nearly half the boys not learning
but less than one-third of the girls not learning.
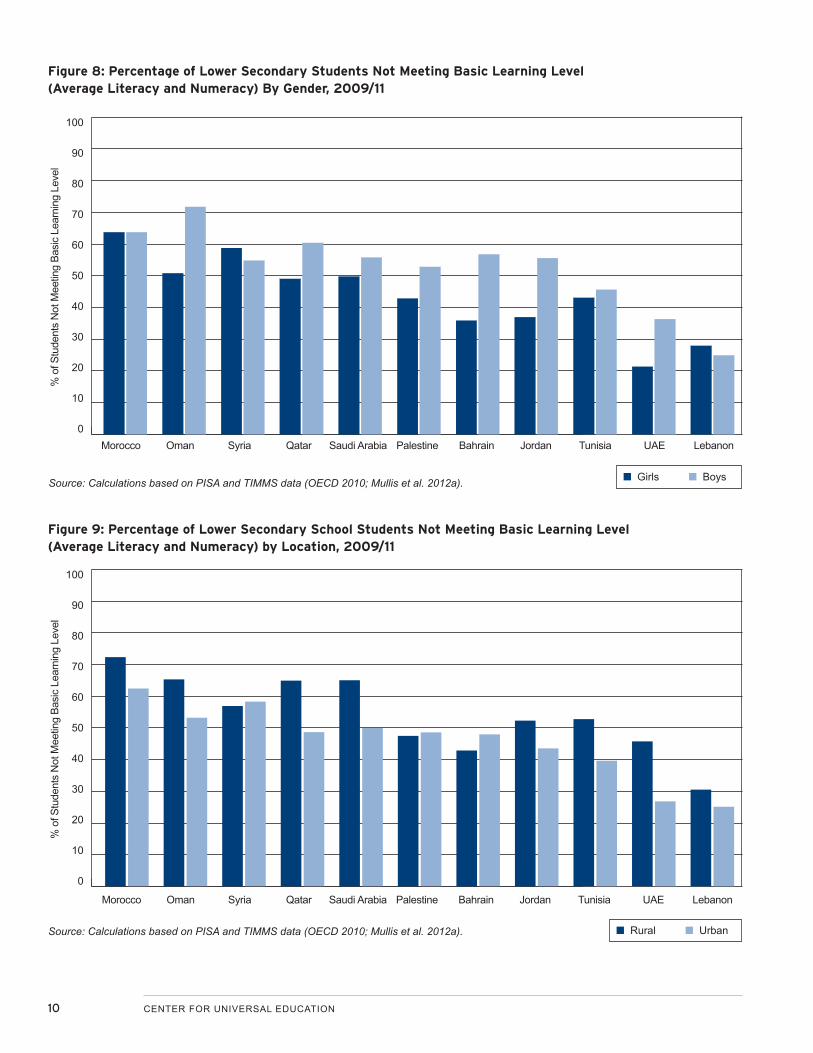
As with primary school, girls also learn more than
boys while in secondary school. In 9 of the 11 Arab
states for which learning outcomes are available,
higher proportions of girls are learning than boys.
In four countries—Bahrain, Jordan, Oman and the
United Arab Emirates—the share of boys not learn-
ing was at least 15 percentage points greater than
the share of girls not learning (figures 7 and 8).
Geographical disadvantages also affect learning levels.
Disparities between rural and urban areas are particu-
Figure 7: Percentage of Primary Students Not Meeting Basic Learning Level (Average Literacy and Numeracy) By Gender, 2011
% o
f Stu
dent
s N
ot M
eetin
g Ba
sic
Lear
ning
Lev
el
100
90
80
70
60
50
40
30
20
10
0Yemen Morocco Kuwait Tunisia Oman Qatar Saudi Arabia UAE Bahrain
■ Girls ■ BoysSource: Calculations based on PIRLS and TIMMS data (Mullis et al. 2012a, 2012b).
10 CENTER FOR UNIVERSAL EDUCATION
■ Girls ■ BoysSource: Calculations based on PISA and TIMMS data (OECD 2010; Mullis et al. 2012a).
Figure 8: Percentage of Lower Secondary Students Not Meeting Basic Learning Level (Average Literacy and Numeracy) By Gender, 2009/11
100
90
80
70
60
50
40
30
20
10
0Morocco Oman Syria Qatar Saudi Arabia Palestine Bahrain Jordan Tunisia UAE Lebanon
% o
f Stu
dent
s N
ot M
eetin
g Ba
sic
Lear
ning
Lev
el
Figure 9: Percentage of Lower Secondary School Students Not Meeting Basic Learning Level (Average Literacy and Numeracy) by Location, 2009/11
Morocco Oman Syria Qatar Saudi Arabia Palestine Bahrain Jordan Tunisia UAE Lebanon
■ Rural ■ UrbanSource: Calculations based on PISA and TIMMS data (OECD 2010; Mullis et al. 2012a).
100
90
80
70
60
50
40
30
20
10
0
% o
f Stu
dent
s N
ot M
eetin
g Ba
sic
Lear
ning
Lev
el
ARAB YOUTH: MISSING EDUCATIONAL FOUNDATIONS FOR A PRODUCTIVE LIFE? 11
larly pronounced at the secondary level. In 6 out of 11
countries, the proportion of youths not learning is at
least 10 percentage points higher in rural than in urban
areas. The difference is most pronounced in the United
Arab Emirates, where 46 percent of rural youths are not
learning, versus 27 percent of urban youths (figure 9).
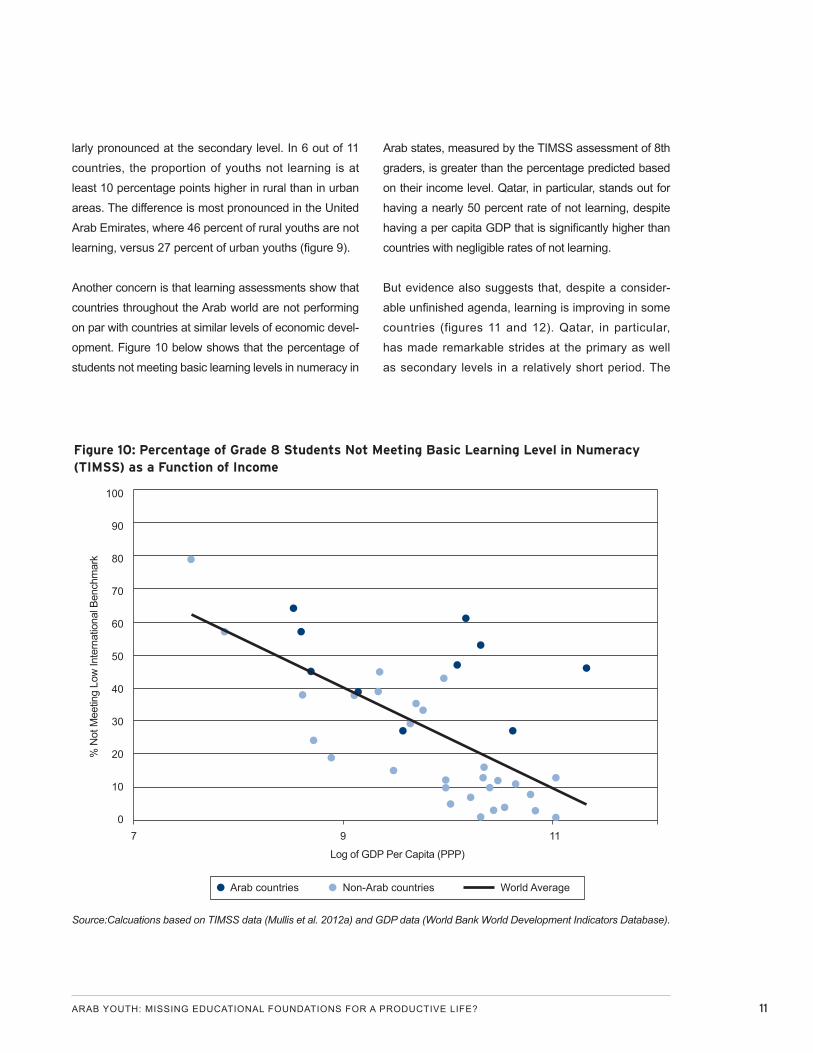
Another concern is that learning assessments show that
countries throughout the Arab world are not performing
on par with countries at similar levels of economic devel-
opment. Figure 10 below shows that the percentage of
students not meeting basic learning levels in numeracy in
Arab states, measured by the TIMSS assessment of 8th
graders, is greater than the percentage predicted based
on their income level. Qatar, in particular, stands out for
having a nearly 50 percent rate of not learning, despite
having a per capita GDP that is significantly higher than
countries with negligible rates of not learning.
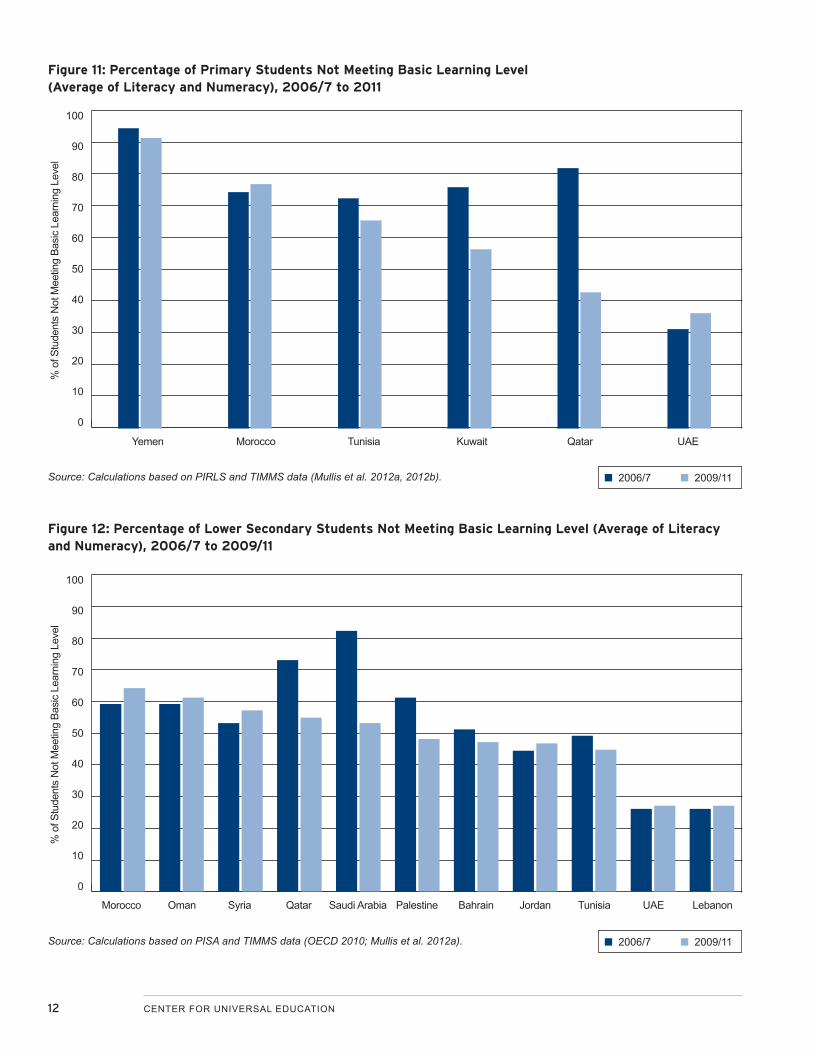
But evidence also suggests that, despite a consider-
able unfinished agenda, learning is improving in some
countries (figures 11 and 12). Qatar, in particular,
has made remarkable strides at the primary as well
as secondary levels in a relatively short period. The
Figure 10: Percentage of Grade 8 Students Not Meeting Basic Learning Level in Numeracy (TIMSS) as a Function of Income
100
90
80
70
60
50
40
30
20
10
0
% N
ot M
eetin
g Lo
w In
tern
atio
nal B
ench
mar
k
Log of GDP Per Capita (PPP)
7 9 11
● Arab countries ● Non-Arab countries World Average
Source:Calcuations based on TIMSS data (Mullis et al. 2012a) and GDP data (World Bank World Development Indicators Database).
12 CENTER FOR UNIVERSAL EDUCATION
Figure 11: Percentage of Primary Students Not Meeting Basic Learning Level (Average of Literacy and Numeracy), 2006/7 to 2011
100
90
80
70
60
50
40
30
20
10
0
% o
f Stu
dent
s N
ot M
eetin
g Ba
sic
Lear
ning
Lev
el
Yemen Morocco Tunisia Kuwait Qatar UAE
■ 2006/7 ■ 2009/11Source: Calculations based on PIRLS and TIMMS data (Mullis et al. 2012a, 2012b).
Source: Calculations based on PISA and TIMMS data (OECD 2010; Mullis et al. 2012a).
Figure 12: Percentage of Lower Secondary Students Not Meeting Basic Learning Level (Average of Literacy and Numeracy), 2006/7 to 2009/11
100
90
80
70
60
50
40
30
20
10
0
% o
f Stu
dent
s N
ot M
eetin
g Ba
sic
Lear
ning
Lev
el
■ 2006/7 ■ 2009/11
Morocco Oman Syria Qatar Saudi Arabia Palestine Bahrain Jordan Tunisia UAE Lebanon
ARAB YOUTH: MISSING EDUCATIONAL FOUNDATIONS FOR A PRODUCTIVE LIFE? 13
proportion of children not learning at the primary level
dropped from 82 percent to 43 percent, and that of
youth not learning declined from 73 to 55 percent from
2006/7 to 2009/11.
Adding Up: A Learning CrisisWhen looking at the totality of all those children
throughout the Arab world who are out of school,
expected to drop out, or are not learning while in
school, one sees a bleak picture and a crisis of sig-
nificant proportions. For the five countries for which
we have complete data, we find that nearly half or
more of all primary-aged children are not learning.
The situation is particularly critical in Yemen, where
close to 95 percent of all primary children are not
learning. The situation at the secondary level is, in
some cases, worse than at the primary level. For
example, more than 55 percent of children are not
learning at the lower secondary level in Qatar and
Saudi Arabia, compared with about 48 percent in
primary school (figures 13 and 14).
0% 10% 20% 30% 40% 50% 60% 70% 80% 90% 100%
Yemen
Morocco
Tunisia
Saudi Arabia
Qatar
94.5%
79.4%
67.0%
48.9%
48.1%
■ Out of School ■ In School but Expected to Drop Out ■ In School But Not Learning
Source: Calculations based on UNESCO Institute for Statistics database and TIMSS and PIRLS data (Mullis et al. 2012a, 2012b).
Figure 13: Total Learning Deficit for Primary-Aged Children, Available Countries
Total share of primary-age children not learning (%)
14 CENTER FOR UNIVERSAL EDUCATION
Figure 14: Total Learning Deficit for Secondary-Aged Youth, Available Countries
■ Out of School ■ In School but Expected to Drop Out ■ In School But Not Learning
0% 10% 20% 30% 40% 50% 60% 70% 80% 90% 100%
Syria
Palestine
Saudi Arabia
Qatar
Lebanon
74.9%
60.6%
57.4%
55.9%
46.0%
Source: Calculations based on UNESCO Institute for Statistics database and PISA and TIMSS data (OECD 2010; Mullis et al. 2012a).
Education Data Gap
There are multiple gaps in the available education data, with only a small handful of countries sys-tematically measuring literacy and numeracy at both the primary and lower secondary levels.
A final striking finding of the Arab World Learning
Barometer is that education data for the Arab states are
incredibly scarce. Of the 20 states in the Arab world, 3—
Iraq, Libya and Sudan—have no recent data available
for primary or lower secondary school enrollment, school
survival (i.e., completion), out-of-school populations or
learning outcomes. An additional 8 countries only have
half or fewer of the data points available for recent years.
Within countries, data are available in a very irregular
pattern; no variable or group of variables is consis-
tently missing. Rather, different countries are missing
different measures in a seemingly arbitrary fashion.
Only 2 countries—Morocco and Yemen—have the
full complement of the 4 primary school variables
available for recent years (out-of-school, enrollment,
completion and transition). The data situation is only
slightly better for the lower secondary level, where
4 countries—Lebanon, Palestine, Qatar and Saudi
Arabia—have the full complement of variables avail-
able. No country in the Arab world has data for all
8 indicators, although 5 countries have 7 indicators
available. In total, nearly half (47.5 percent) of the
data points are missing (table 2).
If one digs deeper into the variables for learning out-
comes, the situation is even worse. While 13 Arab states
participate in some international assessment, only 7
Total share of secondary-age youth not learning (%)
ARAB YOUTH: MISSING EDUCATIONAL FOUNDATIONS FOR A PRODUCTIVE LIFE? 15
participate at both the primary and lower secondary
levels. Five countries test their primary students on both
numeracy and literacy, and 4 countries test their sec-
ondary students on both subjects. Only 2 countries—
Qatar and the United Arab Emirates—test students at
both levels for both numeracy and literacy. The limited
data from international assessments is unfortunately not
compensated for by national assessments. The World
Bank’s SABER initiative is currently conducting a stu-
dent assessment survey for countries in the Middle East
and North Africa region, covering 17 countries in the re-
gion. According to the study, 12 countries had full or par-
tial national assessments. These were largely the same
countries that were already participating in international
assessments. The only countries with national assess-
ments that did not engage at the international level are
Sudan and Mauritania (World Bank, forthcoming). This
finding further emphasizes the lack of sufficient data
and the need for comprehensive learning assessments
within the region.
Table 2. Education Data Gaps
Source: Compiled from UNESCO Institute for Statistics database, TIMSS, PIRLS, and PISA data, and the World Bank SABER student assessment (UIS no date, OECD 2010; Mullis et al. 2012a; Mullis et al. 2012b; World Bank forthcoming)
Algeria ✓ ✓ ✓ ✓
Bahrain ✓ ✓ ✓ ✓ ✓ ✓
Djibouti ✓ ✓ ✓
Eqypt ✓ ✓ ✓ ✓
IraqJordan ✓ ✓ ✓ ✓ ✓ ✓ ✓
Kuwait ✓ ✓
Lebanon ✓ ✓ ✓ ✓ ✓ ✓ ✓ ✓ ✓ ✓
LibyaMauritania ✓ ✓ ✓
Morocco ✓ ✓ ✓ ✓ ✓ ✓ ✓ ✓
Oman ✓ ✓ ✓ ✓ ✓ ✓ ✓ ✓
Palestine ✓ ✓ ✓ ✓ ✓ ✓ ✓ ✓ ✓ ✓
Qatar ✓ ✓ ✓ ✓ ✓ ✓ ✓ ✓ ✓ ✓
Saudi Arabia ✓ ✓ ✓ ✓ ✓ ✓ ✓ ✓ ✓ ✓
SudanSyria ✓ ✓ ✓ ✓ ✓ ✓ ✓ ✓ ✓ ✓
Tunisia ✓ ✓ ✓ ✓ ✓
UAE ✓ ✓ ✓ ✓ ✓ ✓
Yemen ✓ ✓ ✓ ✓ ✓ ✓ ✓ ✓ ✓
Prim
ary
NER
All S
econ
dary
?
Seco
ndar
y N
ER
Prim
ary
Out
-of-S
choo
lSe
cond
ary
Out
-of-S
choo
lPr
imar
y Su
rviv
alSe
cond
ary
Surv
ival
Prim
ary
Lear
ning
Out
com
esSe
cond
ary
Lear
ning
Out
com
esAl
l Prim
ary?
Inte
rnat
iona
l Lea
rnin
g As
sess
men
t?N
atio
nal L
earn
ing
Asse
ssm
ent?
16 CENTER FOR UNIVERSAL EDUCATION
EDUCATION FOR A PRODUCTIVE LIFE: YOUTH EMPLOYMENT LINKThe Arab World Learning Barometer highlights the
successes and outstanding challenges in education
across the Arab region. It shows that more children
are entering school than ever before. But a signifi-
cant number of children remain out of school, either
because they never enter or because they drop
out. In this regard, girls are generally worse off than
boys. However, by far the biggest challenge is that,
once in school, about half the children do not learn.
Somewhat surprisingly in this case, boys are doing
much worse than girls. These challenges of access,
completion and learning combine into a significant
deficit of foundational skills in the Arab world, with
wider economic and societal effects. This section
explores how the lack of those skills can be con-
nected to wider employment challenges in the region.
Foundational skills are necessary for getting work
that pays enough to meet daily needs. They are also
a prerequisite for engaging in further education and
training and for acquiring transferable skills and tech-
nical and vocational skills.5 For those unable to read
basic texts or do basic sums and apply them, the pos-
sibility of gainful employment or entrepreneurial activ-
ity is greatly reduced (UNESCO 2012).
While not the only factor, evidence from private
sector surveys suggests that the skills crisis in the
Arab region has likely contributed to the depth of the
region’s employment crisis. Both have been further
exacerbated by rapid growth in the youth population,
which has produced a much larger labor force that
lacks the necessary skills to secure employment.
Some 55 percent of the population is under the age
of 24 years, and about 67 percent are under the age
of 30. While total employment has been growing at
3.3 percent annually, this growth has not been suf-
ficient to absorb the rapidly increasing working-age
population. Demand-side factors have also deep-
ened the crisis. Declines in public sector hiring have
resulted in much lower demand for labor from that
sector. Arab youth have traditionally found their first
job in the public sector. In Egypt in the mid-1970s,
about 80 percent of first job seekers, both men and
women, found employment in government or public
enterprises (UNESCO 2012). But such opportunities
no longer exist. Together, these supply and demand
factors have resulted in high unemployment rates
(averaging about 10 percent) (Amin et al. 2012).
With a declining public sector, Arab youth are be-
coming increasingly dependent on the employment
opportunities provided by the private sector. But
where private investment has been growing, surveys
have indicated that the lack of available skills is an
important constraint. According to surveys of private
sector employers, the skills of job applicants are
not matched with their needs. Using the Enterprise
Survey database, a recent World Bank report shows
that nearly 40 percent of employers in the formal
private sector in the Middle East and North Africa
region identify skill shortages as a major constraint
to business operation and firm growth (World Bank
2013). This share is the highest for all developing
regions of the world. Inadequate education is also
ranked as the fourth most important constraint to
economic growth in the Arab World Competitiveness
Report 2011–12 (World Economic Forum 2012).
Because young people have been lacking the skills de-
manded by modern business, and because the formal
private sector has remained underdeveloped, many
young Arabs have ended up being unemployed or work-
ing in the informal sector. Of the young men and women
who currently find jobs in Egypt, only 28 percent find
formal sector jobs—18 percent in the public sector, and
10 percent in the formal private sector. The vast major-
ARAB YOUTH: MISSING EDUCATIONAL FOUNDATIONS FOR A PRODUCTIVE LIFE? 17
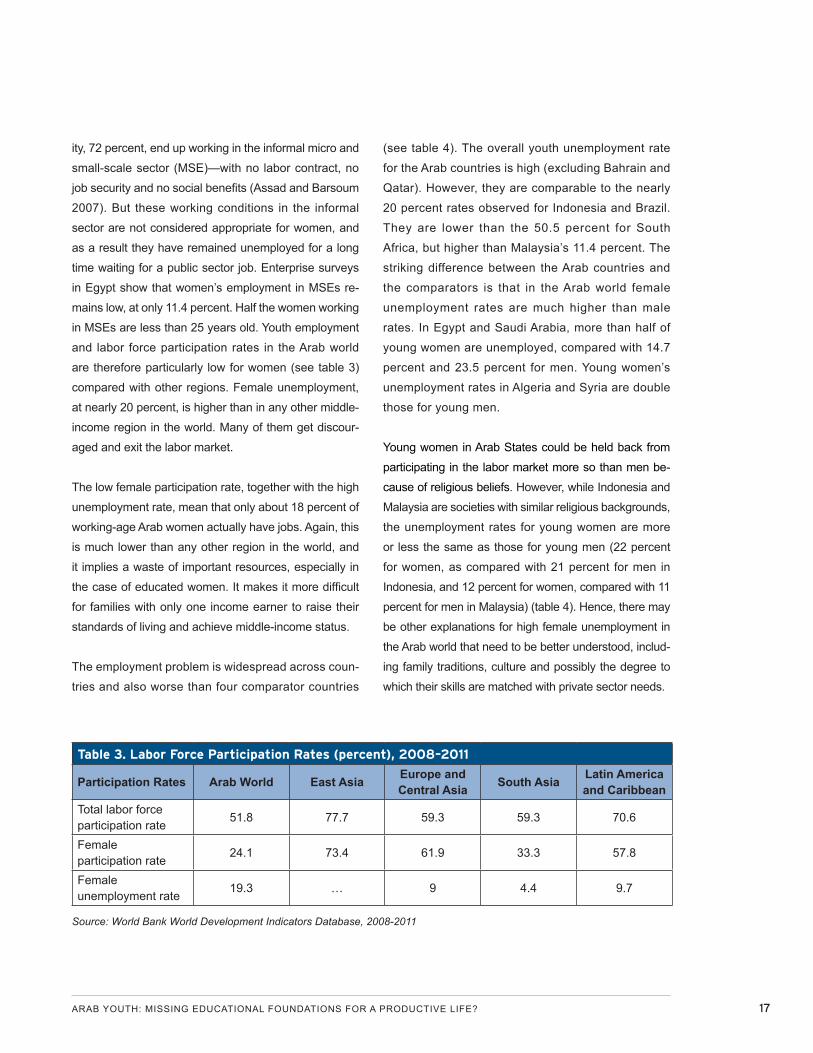
ity, 72 percent, end up working in the informal micro and
small-scale sector (MSE)—with no labor contract, no
job security and no social benefits (Assad and Barsoum
2007). But these working conditions in the informal
sector are not considered appropriate for women, and
as a result they have remained unemployed for a long
time waiting for a public sector job. Enterprise surveys
in Egypt show that women’s employment in MSEs re-
mains low, at only 11.4 percent. Half the women working
in MSEs are less than 25 years old. Youth employment
and labor force participation rates in the Arab world
are therefore particularly low for women (see table 3)
compared with other regions. Female unemployment,
at nearly 20 percent, is higher than in any other middle-
income region in the world. Many of them get discour-
aged and exit the labor market.
The low female participation rate, together with the high
unemployment rate, mean that only about 18 percent of
working-age Arab women actually have jobs. Again, this
is much lower than any other region in the world, and
it implies a waste of important resources, especially in
the case of educated women. It makes it more difficult
for families with only one income earner to raise their
standards of living and achieve middle-income status.
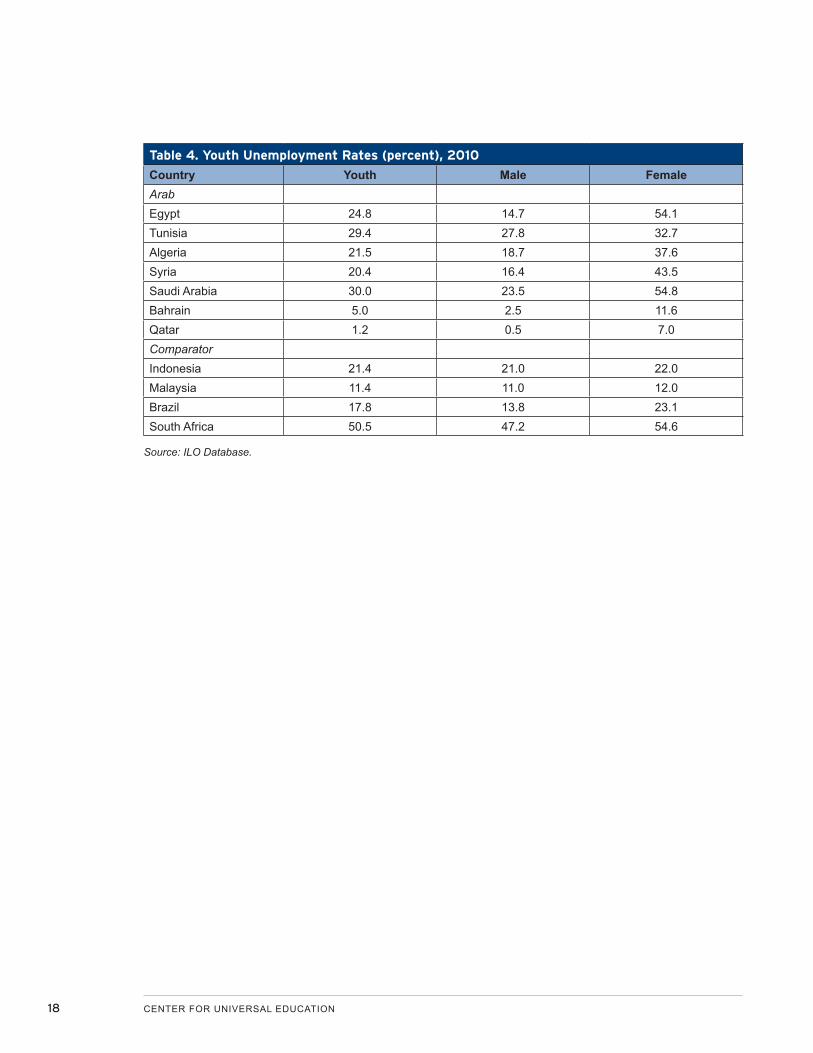
The employment problem is widespread across coun-
tries and also worse than four comparator countries
(see table 4). The overall youth unemployment rate
for the Arab countries is high (excluding Bahrain and
Qatar). However, they are comparable to the nearly
20 percent rates observed for Indonesia and Brazil.
They are lower than the 50.5 percent for South
Africa, but higher than Malaysia’s 11.4 percent. The
striking difference between the Arab countries and
the comparators is that in the Arab world female
unemployment rates are much higher than male
rates. In Egypt and Saudi Arabia, more than half of
young women are unemployed, compared with 14.7
percent and 23.5 percent for men. Young women’s
unemployment rates in Algeria and Syria are double
those for young men.
Young women in Arab States could be held back from
participating in the labor market more so than men be-
cause of religious beliefs. However, while Indonesia and
Malaysia are societies with similar religious backgrounds,
the unemployment rates for young women are more
or less the same as those for young men (22 percent
for women, as compared with 21 percent for men in
Indonesia, and 12 percent for women, compared with 11
percent for men in Malaysia) (table 4). Hence, there may
be other explanations for high female unemployment in
the Arab world that need to be better understood, includ-
ing family traditions, culture and possibly the degree to
which their skills are matched with private sector needs.
Table 3. Labor Force Participation Rates (percent), 2008–2011
Participation Rates Arab World East Asia Europe and Central Asia South Asia Latin America
and CaribbeanTotal labor force participation rate
51.8 77.7 59.3 59.3 70.6
Female participation rate
24.1 73.4 61.9 33.3 57.8
Female unemployment rate
19.3 … 9 4.4 9.7
Source: World Bank World Development Indicators Database, 2008-2011
18 CENTER FOR UNIVERSAL EDUCATION
Table 4. Youth Unemployment Rates (percent), 2010
Country Youth Male FemaleArabEgypt 24.8 14.7 54.1Tunisia 29.4 27.8 32.7Algeria 21.5 18.7 37.6Syria 20.4 16.4 43.5Saudi Arabia 30.0 23.5 54.8Bahrain 5.0 2.5 11.6Qatar 1.2 0.5 7.0ComparatorIndonesia 21.4 21.0 22.0Malaysia 11.4 11.0 12.0Brazil 17.8 13.8 23.1South Africa 50.5 47.2 54.6
Source: ILO Database.
ARAB YOUTH: MISSING EDUCATIONAL FOUNDATIONS FOR A PRODUCTIVE LIFE? 19
WHAT CAN BE DONE?The evidence presented above suggests that ur-
gent action is needed to improve Arab children’s and
youth’s foundational skills to enable them to progress
in school and find decent work. A number of complex
and interrelated issues need to be addressed to tackle
the current challenges in the Arab education system.
Indeed, many educators, policymakers, researchers
and other actors in the Arab world are actively in-
volved in advancing education reforms. We hope that
the findings given in this report will spur increased di-
alogue within the region on the way forward. We pose
five questions by way of conclusion that could prove
fruitful starting places for this discussion.
First, research confirms that investing early in chil-
dren’s lives is one of the most beneficial investments
a country can make in its future. Early childhood
education has been shown to improve learning ability,
school performance and labor market productivity. It
is also cost-effective; the earlier the investment, the
greater the economic return. For example, it is esti-
mated that raising the pre-primary gross enrollment
rate to 25 percent in countries such as Yemen would
lead to a future stream of wage income 6.4 times
higher than the per capita cost of providing access
to preschool. With the pre-primary gross enrollment
ratio at 22 percent in 2010, a multisectoral approach
(including the private and nonprofit sectors) is needed
to address the gap, especially for poor children. What
types of financial incentives (e.g., cash transfers and
vouchers) could accelerate progress in making good-
quality early childhood education and child care more
accessible and affordable?
Second, learning outcomes cannot be improved without
addressing the shortage of teachers and the quality of
teaching. According to UNESCO, the Arab states have
the second-largest share of the global teaching gap, af-
ter Sub-Saharan Africa. The region needs to create an
additional 500,000 posts and replace 1.4 million teach-
ers who are leaving the profession, in order to achieve
universal primary education by 2030. Filling this teacher
gap with qualified graduates as well as retraining in-
service teachers is a shared priority among countries in
the region. Are there good national practices that could
be replicated and scaled up? Could more cost-effective
models be developed? What are the potential benefits
for developing a regional approach to the teacher re-
cruitment and training challenge?
Third, solutions will need to take account of challenges
in conflict-affected countries. Before the Syrian conflict,
4 million children were already out of primary school
in conflict-affected countries with the greatest concen-
trations in Iraq, Sudan and Yemen. In addition, with
hundreds of thousands of Syrian children now out of
school, the region is facing its biggest education crisis
yet. For these children, more aid is urgently needed to
support education as part of the overall humanitarian
response. A longer-term development approach is also
needed to support the education of all refugee and
internally displaced children in the region, including
Palestinians. How could regional donor agencies help
leverage funds from regional and international corpo-
rations and philanthropists? How could the capacity of
national public schools and civil society organizations
be strengthened to respond to the needs of these chil-
dren over the longer term?
Fourth, governments cannot improve the quality of
education alone. The private sector in the region would
be among the greatest beneficiaries of higher learning
achievements, given that children and youth are their
future pool of employees. There is a need for more
structured and enduring dialogue between government,
education institutions and the private sector to not only
explore how to improve the alignment of education
20 CENTER FOR UNIVERSAL EDUCATION
outcomes with the job market, but also to continuously
explore and share practices and collaborate to encour-
age more effective corporate investments in education,
enhanced partnerships and stronger efforts to draw on
corporate resources and competencies. What mecha-
nisms need to be put in place to ensure that there are
such ongoing dialogues and joint efforts? What new
types of public-private partnerships could assist govern-
ments in increasing access to educational opportunities
and improving learning? What could governments do
to encourage the private sector to support innovation in
education, to devise innovative financing plans and to
scale up initiatives in education and training?
Fifth and finally, the systematic collection and use of
data on learning outcomes is an important first step for
any country that seeks to improve its students’ perfor-
mance. Given the gaps in student assessment data in
the region, how could the existing global efforts to sup-
port improved measurement of learning outcomes data
be leveraged regionally? Specifically, how could the
recommendations of the Learning Metrics Task Force
be rolled out in a way that supports countries efforts to
improve their systems?6
ARAB YOUTH: MISSING EDUCATIONAL FOUNDATIONS FOR A PRODUCTIVE LIFE? 21
ENDNOTES1. A detailed methodology of the Arab World
Learning Barometer is available online at www.brookings.edu/arabworldlearning.
2. These 20 countries are: Algeria, Bahrain, Djibouti, Egypt, Iraq, Jordan, Kuwait, Lebanon, Libya, Mauritania, Morocco, Oman, Palestinian National Authority (Palestine), Qatar, Saudi Arabia, Sudan (pre-secession), Syrian Arab Republic (Syria), Tunisia, the United Arab Emirates (UAE), and Yemen
3. Women in the Arab world are also enrolling in tertiary education at a higher rate than men, al-though this imbalance is lower than any other re-gion (all regions of the world see higher female than male tertiary enrollment rates).
4. The 2013 EFA Global Monitoring Report esti-mates that 43 percent of primary-aged children in the entire Arab region (including all 20 countries) are failing to learn.
5. Transferable skills are defined as skills that can be transferred and adapted to different work needs and environments, including problem solving, communicating ideas and information effectively, showing leadership and conscientiousness, etc. (UNESCO 2012).
6. The Learning Metrics Task Force outlines a se-ries of recommendations to use existing assess-ments of learning as well as innovative, new measures to improve learning opportunities and outcomes for all children and youth. See, http://www.brookings.edu/~/media/Research/Files/Re-ports/2013/09/learning%20metrics%20task%20force%20universal%20learning/LTMF%20Rec-ommendationsReportfinalweb.pdf .
22 CENTER FOR UNIVERSAL EDUCATION
REFERENCESAmin, M., R. Assaad, N. al-Baharna, K. Dervis, et al.
2012. After the Spring: Economic Transitions in the
Arab World. New York: Oxford University Press.
Assaad, R., and G. F. Barsoum. 2007. Youth Exclusion in
Egypt: In Search of Second Chances. Washington
D.C.: Wolfensohn Center for Development,
Brookings Institution.
ILO (International Labour Organization). No date. ILO
Statistics Database. Geneva: ILO.
Mullis, I. V. S., M. O. Martin, P. Foy, and A. Arora.
2012a. Trends in International Mathematics and
Science Study (TIMSS) 2011 International Results
in Mathematics. Boston: International Association
for the Evaluation of Educational Achievement.
Mullis, I. V. S., M. O. Martin, P. Foy, and K. T. Drucker.
2012b. Progress in International Reading Literacy
Study (PIRLS) 2011 International Results in
Reading. Boston: International Association for the
Evaluation of Educational Achievement.
OECD (Organization for Economic Cooperation and
Development). 2010. PISA 2009 Results: What
Students Know and Can Do. Paris: OECD.
Pew Research Center. 2012. Pervasive Gloom
about the World Economy: Faith in Hard Work,
Capitalism Falter but Emerging Markets Upbeat.
Global Attitude Project. Washington D.C.: Pew
Research Center.
UIS (UNESCO Institute of Statistics). No date. UNESCO
Institute of Statistics Database. Montreal: UIS.
UNESCO. 2012. Youth and Skills: Putting Education to
Work—2012 Education for All Global Monitoring
Report. Paris: UNESCO.
UNESCO. Forthcoming. Learning and Teaching for
Development: 2013/14 Education for All Global
Monitoring Report. Paris: UNESCO.
UNESCO. No date. World Inequality Database on
Education (WIDE). Paris: UNESCO.
UNHCR. 2013. Syria Regional Refugee Response.
Inter-agency Informat ion Shar ing Porta l .
http://data.unhcr.org/syrianrefugees/regional.php.
UNICEF USA. 2013. Syria: Going to School in
Wartime. 3 September 2013. http://fieldnotes.
unicefusa.org/2013/09/syria-going-to-school-in-
wartim0--e.html.
United Nations. 2013. A New Global Partnership:
Eradicate Poverty and Transform Economies
through Sustainable Development. Report of
the High-Level Panel of Eminent Persons on
the Post-2015 Development Agenda. New York:
United Nations.
World Bank. No date. World Development Indicators
Database. Washington D.C.: World Bank.
World Bank. 2013. Full Report: Volume 4 of Jobs
for Shared Prosperity—Time for Action in the
Middle East and North Africa. Washington D.C.:
World Bank.
World Bank. Forthcoming. SABER—Survey of Student
Assessment Systems, Middle East and North
Africa (MENA). Systems Approach for Better
Education Results (SABER) Country Reports.
Washington D.C.: World Bank.
World Economic Forum. 2011. The Arab World
Competitiveness Report: 2011-2012. Geneva:
World Economic Forum.

The views expressed in this paper do not necessarily reflect the official position of Brookings, its board or the advisory council members.
© 2013 The Brookings Institution
Selected photo courtesy of the World Bank: cover: Bill Lyons/ World Bank

1775 Massachusetts Avenue, NW Washington, DC 20036 202-797-6000 www.brookings.edu/universal-education