aqwest annual report 2015
DESCRIPTION
ÂTRANSCRIPT

Annual Report 2015

ivAQ
WES
T A
NN
UA
L RE
PORT
201
5

PurposeTo provide competition in the totality of water services to be managed locally and to
provide value to the owner and the customer.
VisionTo be an independent water utility providing diversity and competition in the
Western Australian water industry.
Guiding Principles • Committed to service excellence• Customer and community focused
• Striving for innovative solutions• Determined to be an employer of choice
Values• Integrity
• Accountability• Transparency

CONTENTS
PERFORMANCEStatement of Corporate Intent Directions in 2014/15 .....13Financial Summary ......................................................................14Key Performance Indicators .....................................................16Statistics - 10 Year Summary ....................................................18Performance Indicators .............................................................20
OPERATIONSAsset Management - Planning for the future ......................24Occupational Safety, Health and Injury Management .......26Customer Complaints .................................................................28Community ...................................................................................30Communications..........................................................................32
CORPORATE GOVERNANCECorporate Governance ..............................................................34Directors’ Report .........................................................................36
FINANCIAL REPORTDirectors’ Declaration ................................................................45Statement of Comprehensive Income ...................................46Statement of Financial Position ...............................................47Statement of Changes in Equity ..............................................48Statement of Cash Flows ..........................................................49Notes to the Financial Statements .........................................50Auditor General’s Report ...........................................................82
OVERVIEWWelcome to the Aqwest 2014/15 Annual Report ......................1Aqwest Highlights 2014/15 ..............................................................3Chief Executive Officer’s Report ......................................................4Chairman’s Report ................................................................................6The Aqwest Board................................................................................8Corporate Structure .............................................................................9Aqwest’s People .................................................................................10Aqwest’s Culture ................................................................................11

Welcome to the Aqwest 2014/15 Annual ReportThe 2015 Annual Report is a review of Aqwest’s performance for the financial year ended 30 June 2015.
This report is produced in accordance with the provisions of the Water Corporations Act 1995 and other relevant legislation, which governs our operations.
It is provided to the Minister for Water the Hon Mia Davies MLA and is tabled in the Parliament of Western Australia.
The objective of this report is to provide Aqwest’s owner, the State Government, customers, community and stakeholders with information about Aqwest’s operational and financial performance for the 2014/15 financial year.
This report and past annual reports can be found at www.aqwest.com.au
For customer enquiries or feedback about our services, email [email protected]
OVERVIEW
1
AQW
EST
AN
NU
AL
REPO
RT 2
015

2AQ
WES
T A
NN
UA
L RE
PORT
201
5

Aqwest Highlights 2014/15Community SatisfactionOverall community satisfaction with Aqwest continues to be high at 87%, providing us with assurance that our customers perceive that we have again performed very well in 2014/15.
Forward PlanningAqwest worked with the Western Australian Treasury Corporation to develop a business case for the construction of a new water treatment plant in Glen Iris.
This is part of Aqwest’s medium term plan to relocate production away from the sensitive seawater/freshwater interface of the Yarragadee Aquifer.
Water QualityAqwest compiled with the Australian Drinking Water Guidelines and achieved 100% microbiological compliance.
Reservoir RefurbishmentThe second stage of a five year refurbishment project was completed on the Tech Reservoir in College Grove, which is Aqwest’s largest potable water storage facility. $1.02 million was spent on ongoing joint repairs and further integrity checks on the grouting of the foundations.
RevenueAqwest’s financial strength has improved from prior years. This is a result of the water price increases required to cover growing costs, and from growth in development activity. Aqwest reported a profit after tax of $2.11 million.
OVERVIEW
3
AQW
EST
AN
NU
AL
REPO
RT 2
015

Financial PerformanceFinancial performance for 2014/15 was acceptable with total revenue exceeding budget and total expenses in line with budget expectations.
• Budgeted Operating Profit after Tax = $1.5m
• Actual Operating Profit after Tax = $2.1m.
• A full analysis is shown within the financial notes of this Annual Report.
Financial performance is monitored continuously and the Board was provided with monthly reports. Both the Audit Committee and Board of Directors considered formal quarterly budget reviews. A quarterly report was provided to the Minister for each of the first three quarters of the financial year as required by the Water Corporations Act 1995.
Performance IndicatorsThe Board has five key performance indicators and 19 management indicators. Four of five key performance indicators achieved their target in 2014/15.
Water PricingThere was again a significant increase in water prices in 2014/15 in line with the recommendations made by the Economic Regulation Authority (ERA) in its most recent Inquiry into Tariffs. The ERA’s recommended pricing is based on the recovery of costs. To ensure the long term sustainability of the business, it is obviously critical that costs are recovered.
The Board provided rebates in excess of $560,000 to pensioners and senior customers in 2014/15.
Human ResourcesThe Board remains committed to providing an environment that allows all employees the opportunity to thrive. The annual staff attitudinal survey was again conducted showing an overall improving trend and no areas below target.
The Board has employed two trainees in the water treatment and administration areas. The staff services program continues to provide tangible benefits. Attendance at industry forums including
Chief Executive Officer’s Report
4AQ
WES
T A
NN
UA
L RE
PORT
201
5

VicWater, OzWater and specialist technical forums including topics addressing smart metering and liveable cities is actively encouraged.
The Board’s Project Management Officer, Ms Amanda Caunt, presented her Research Paper titled “Comparison of Regional Urban Water Utility Structures in South West Western Australia” at OzWater in Adelaide in May 2015.
These forums provide relevant staff with the opportunity to expand their knowledge of the Australian water industry, therefore delivering better outcomes for Aqwest.
Key RelationshipsThe ongoing communication and assistance provided by key stakeholders including the Minister for Water, Water Corporation, Busselton Water, Economic Regulation Authority, Department of Water, Department of Treasury, RiskCover, Department of Health, City of Bunbury and Office of the Auditor General results in a stronger water industry in Western Australia. Aqwest highly values these links.
Water ProductionAnnual water production has remained at between 6 GL and 7 GL since the early 1980s. As customer numbers have doubled over this time, this is a credit to the water conservation practices adopted by Aqwest customers.
Water QualityAqwest strives to provide drinking water that meets and exceeds the relevant Australian Drinking Water Guidelines. Aqwest acknowledges the Department of Health as the regulator of drinking water quality in Western Australia. Aqwest has in place a highly experienced Water Quality Committee and appreciates the external expertise brought to this forum by the WA Department of Health, Hunter Water Australia and the City of Bunbury.
The Board of Aqwest identifies water quality as one of its five key performance indicators with a target to achieve 100 per cent microbiological compliance in seven out of seven water quality zones. This target has again been achieved in 2014/15 and for every year over the past decade.
ClosingI have greatly appreciated the support of all Board Directors, managers and staff throughout the financial year. I would again like to acknowledge and thank everyone at Aqwest who has made a commitment outside of their normal working hours to ensure this 24/7 business provides continuous excellence in customer service. Also to those staff who make an effort in their own time and sometimes at their own expense to make Aqwest a better place to work – thank you.
Brad Bevis Chief Executive Officer Aqwest
OVERVIEW
5
AQW
EST
AN
NU
AL
REPO
RT 2
015

Board of DirectorsDuring the year Edwin Abdo and Wayne Edgeloe were re-appointed to the Board. Unfortunately, Mr Edgeloe subsequently resigned from the Board in May 2015 due to a change in his employment circumstances resulting in a potential conflict of interest.
The Board actively embraces the practice of good corporate governance including the annual review of the Board Charter. The Board is acutely aware of its risk management responsibilities and again conducted a Special Meeting of the Board to consider Board level risks. Board Directors actively participate in the Risk Management and Audit Committees and attend relevant forums to increase their overall knowledge of the Australian water industry.
Business DevelopmentThe Board utilises multi criteria analysis to assess and rank business development opportunities. Potential opportunities are reviewed on a frequent basis by both the Executive Team and the Board.
A “priority” rating is included in the analysis to allow each business development opportunity to be ranked according to urgency and time criticality. This information is subsequently transferred to the Strategic Development Plan (SDP) as required.
Customer Satisfaction SurveyThe Board appoints an independent third party to conduct an annual customer satisfaction survey. The survey indicates that overall satisfaction with Aqwest is 87%. Customer feedback indicates that Aqwest needs to continue to work hard in regards to customer perceptions of water quality and water charges. Independent third party testing of water quality confirms that it is high quality. Similarly, national benchmarking confirms that Aqwest’s charges are amongst the lowest in Australia. Customer perception, however, differs.
Strategic Planning The Board had seven key result areas in 2014/15 – sustainability, water quality, customer service, community engagement, forward planning, human
resources and regulatory performance. The Board reviewed each key result area and the related objectives during the financial year. This resulted in some changes that are reflected in the 2015/16-2019/20 Strategic Development Plan.
National Performance Report For Urban Water Utilities 2013/14This report was released in May 2015. The Report provides a comparison of performance for 78 urban water utilities across Australia. Aqwest benchmarks extremely well in the 10,000-20,000 connected properties category. Whilst Aqwest recorded the highest increase in “typical” bill, the annual bill based on 200kL consumption remained amongst the lowest in Australia. Aqwest also benchmarked extremely well in the areas of operating costs ($/property) and complaints (per 1,000 properties). Aqwest is proud of this performance and is expecting similar outcomes for 2014/15 when the results are released in early 2016.
(Ref: Bureau of Meteorology, National Performance Report 2013/14, Urban Water Utilities)
Chairman’s Report
OVERVIEW
6AQ
WES
T A
NN
UA
L RE
PORT
201
5

ClosingAqwest maintains a good attitude, a good atmosphere and a continual focus on customer satisfaction and service. We continue to look forward to emerging opportunities in the Western Australian water industry.
I thank my fellow Board Directors Edwin Abdo, Hans Dopheide, Robert Nicholson, Neville Eastman and Wayne Edgeloe (to May 2015), Executive staff and all staff for their efforts and commitment during the 2014/15 financial year.
Judy Jones Chairman Bunbury Water Corporation
7
AQW
EST
AN
NU
AL
REPO
RT 2
015

The Aqwest Board
Ms Judy Jones (Chairman)
Judy Jones is a City of Bunbury Councillor, Chairman of the South West Regional Roads Group, Chairman of Alliance Housing and a member of the Bunbury Cemetery Board, Bunbury Aged Persons Housing Collective Inc,
Stirling Street Arts Centre and the Bunbury-Harvey Regional Council, a joint venture between the City of Bunbury and the Harvey Shire Council, convened to manage the Stanley Road landfill site.
Mr Hans DopheideHans Dopheide is the Manager Production - Power at BHP Billiton Worsley Alumina. He has a wealth of experience in operations, maintenance, construction and developing power plants and working with government. He has
a particular interest in conservation.
Mr Edwin AbdoEdwin Abdo is a retired Bunbury solicitor and has served on many committees and boards, including the Bunbury Rotary Club, and is a former member of the Law Society of WA and the Australian and New Zealand
College of Notaries. Mr Abdo has a keen interest in the availability and efficient use of water in Western Australia and a good knowledge of relevant legislation.
Mr Neville EastmanNeville Eastman is a former chartered accountant and partner of Eastman & Co Accountants, which was formed in 1969. He is a third generation resident of Bunbury and has a passionate interest in the wellbeing of the
city and its residents. Mr Eastman was previously a member of the Bunbury Port Authority for 10 years.
Mr Rob NicholsonRobert Nicholson is an architect who was previously a member of the Bunbury Water Board from 1996 to 2001. As a Bunbury resident since the 1980s, he has had a particular interest in the efficient running of Aqwest and
the development of contemporary water policy. He is also keen to maintain the current high water quality standards.
Mr Wayne EdgeloeMr Edgeloe is the Manager Land Development (WA) of Calibre Consulting Pty Ltd, an international engineering consultancy. He has particular expertise in water sensitive urban design and extensive experience
in the land development, infrastructure and water industries.
OVERVIEW
8AQ
WES
T A
NN
UA
L RE
PORT
201
5

PROJECT MANAGEMENT OFFICER
MINISTER FOR WATER
Hon Mia Davies MLA
CHAIRMAN
Judy Jones
BOARD
Neville Eastman, Wayne Edgeloe, Edwin Abdo, Rob Nicholson, Hans Dopheide
CHIEF EXECUTIVE OFFICER
Brad BevisMANAGER FINANCE & ADMINISTRATION
Joe Smith (Chief Finance Officer)
MANAGER WATER SERVICES
Gary Hallsworth
• Coordinator Water Distribution• Coordinator Water Treatment• Water Quality Supervisor• Asset Management Coordinator• Works Planner• Safety, Training and Compliance Officer• Customer Service Officers• Team Leader Water Distribution• Technical Support Officer• Supply Officer• Water Treatment Plant Operators• Water Services Operators
• Management Accountant• Accountant• Secretary/Records Officer• Supervisor Accounts• Accounts Officers• Customer Service Officers• Human Resources/Finance Officer• Meter Readers• Records Support Officer
CORPORATE STRUCTURE
9
AQW
EST
AN
NU
AL
REPO
RT 2
015

Aqwest’s PeopleAqwest has a Board and an Executive team which determine policies and ensure water services are provided in accordance with the Water Corporations Act 1995.
Aqwest believes people are its most important asset and aims to be an employer of choice, providing a healthy and supportive work environment.
A number of benefits are provided to staff as part of their employment conditions including annual skin cancer screening, flu shots, weekly physiotherapy clinics, health and fitness initiatives, dietary advice and an employee assistance program.
Aqwest has 42 staff including full-time, part-time and casual, employed under the Aqwest Enterprise Agreement 2014.
During the year, the Aqwest Project Management Officer Mandy Caunt was a keynote speaker at Australia’s premier water conference Ozwater, presenting findings on a research project completed as part of a Masters in Integrated Water Management.
Three staff celebrated employment milestones in 2014, including Water Treatment Plant Operator Robin Murray (20 years), Water Distribution Team Leader Adam Gornall (10 years) and Water Quality Supervisor Karl Woods (10 years).
Two trainees were welcomed to the Aqwest team in 2014/15. Josh Pickering started as a Water Services Trainee and Morganne Chapman is the new Administration Trainee.
10AQ
WES
T A
NN
UA
L RE
PORT
201
5

Aqwest’s Culture
Staff SurveyAqwest carries out a staff attitudinal survey each year to monitor employee satisfaction. The survey has been held since 1994 and results are used to continuously improve the Workforce and Diversity Plan. Staff satisfaction was above target and slightly higher than in 2013/14.
Internal CommunitiesThe survey showed employees remained very positive about the cooperation between all staff and particularly positive about relationships with co-workers and their supervisors. They valued the culture, diversity and inclusiveness of their workplace and were motivated to give their best efforts at work each day. Employees also regarded Aqwest highly as a safe place to work.
Work/Life BalanceEmployees have a high level of satisfaction with job flexibility and the benefits that Aqwest offers.
Aqwest responds to the circumstances of each individual employee to ensure their work/life balance is mutually beneficial. Aqwest’s aim is to be an employer of choice and the Directors and Executive Team strives to achieve this in all levels of the business.
Professional DevelopmentAll employees are encouraged to increase their knowledge and skills and take part in professional development training. The majority of staff in the water services area have obtained a Certificate III in Water Services or are working towards the qualification.
OVERVIEW
11
AQW
EST
AN
NU
AL
REPO
RT 2
015

12AQ
WES
T A
NN
UA
L RE
PORT
201
5

Statement of Corporate Intent Directions in 2014/15
The Board addressed the four (4) identified key directions in the Statement of Corporate Intent for 2014/15 as follows:
1 Maintain an ongoing focus on our core business of providing sustainable high quality water services Achieved.
2 Progress the desire to provide water services to all properties in Dalyellup
Aqwest has progressed an analysis of acquiring the water supply scheme at Dalyellup which is located immediately to the south of the current network. This option may be pursued should the analysis demonstrate increased value to the State Government and customers through improved operating efficiencies and economies of scale.
3 Respond to any demand to provide bulk water services A short term supply agreement negotiated with the Water Corporation. The agreement expired 30th April 2015.
4Continue to encourage the Department of Health to consult with the local Bunbury community regarding any potential plan to add fluoride to the water supply
The Department of Health is represented on Aqwest’s Water Quality Committee. The Committee has a standing agenda item on this topic.
PERFORMANCE
13
AQW
EST
AN
NU
AL
REPO
RT 2
015

Financial Summary Financial SummaryAqwest reported an operating profit before tax of $3.58 million in 2014/15, following an operating profit of $1.06 million the previous year. This is an improvement from the three preceding years where operating losses were recorded.
Total revenue increased by $3.16 million in 2014/15.
This was driven by tariff increases, higher levels of land development and building activity and the receipt of an operating subsidy from the State Government.
Despite recent increases, Aqwest‘s tariffs continue to be among the lowest in Australia.
Total operating expenditure increased by $0.63 million 2014/15. This was driven by business development expenditure, salaries and wages and
the first local government rate equivalent payment to State Government.
Investing in infrastructureAqwest‘s capital investment program benefits the community and the local industry partners which assist in construction, maintenance and operations works. A $2.74 million capital investment program was delivered in 2014/15.
Debts and borrowingsThe capital investment program over recent years has been funded from capital reserves and debt levels have remained low. There were no additional borrowings in 2014/15.
Supporting the RegionAqwest has more than 40 employees living and working in regional Western Australia, providing water services to customers. In 2014/15, Aqwest‘s asset value was more than $88 million.
16
2011 2012 2013 2014 2015
$ M
illio
ns
Total Revenue
Profit After Tax
REVENUE VS PROFIT AFTER TAX
1412
1086
4
2
0
-2-4
PERFORMANCE
14AQ
WES
T A
NN
UA
L RE
PORT
201
5

Returns to the StateAqwest is required by the Australian Tax Office to lodge an income tax return and pay tax equivalents to the State Government. In total Aqwest will pay $1.53 million for the 2014/15 year.
On 1 July 2014, Aqwest started receiving operating subsidy payments from the State Government to provide rebate concessions to seniors and pensioners.
On 1 July 2014, Aqwest also began paying a government rate equivalent to the State Government.
Aqwest is required to pay a dividend of 65 per cent of after-tax profits (excluding developer take-over asset contributions) to the State Government. The first dividend will be declared in 2015/16.
When operating subsidies are offset against the tax, dividend and local government rate equivalent payments to Government, the Net Accrual to Government (NATG) results.
The NATG for 2014/15 is $1.08 million . Components are shown in the chart (right).
2.000
2011 2012 2013 2014 2015
$ M
illio
ns
Income Tax Equivalent Operating SubsidyLocal Government Rate Equivalent
NET ACCRUAL TO STATE GOVERNMENT
1.500
1.000
0.500
0.000
-0.500
-1.000
PERFORMANCE
15
AQW
EST
AN
NU
AL
REPO
RT 2
015

Key Performance IndicatorsRelationship to Government Strategic GoalsThe State Government has a strategic goal to achieve results in key service delivery areas for the benefit of all Western Australians. Aqwest delivers this outcome by providing a sustainable, high quality drinking water supply.
Key Effectiveness IndicatorsKey Effectiveness Indicators measure how Aqwest has achieved its desired outcomes of a sustainable and high quality drinking water supply. To measure the extent to which this outcome has been achieved, two Key Effectiveness Indicators are used:
Quantity of water produced within licensed allocation
• Target: 7.6 Gigalitres
This target is based on the current groundwater licence issued by the Department of Water.
• Results: Target achieved - Aqwest produced 6.8 Gigalitres.
Number of zones where microbiological compliance is achieved
• Target: 7/7
Microbiological compliance relates to the water quality parameters of bacteriological, amoebae, aesthetic (non health related), health related (organic) and health related (inorganic) across each of Aqwest’s seven zones. The objective is 100 per cent compliance.
• Results: Target achieved – Aqwest achieved microbiological compliance across each of Aqwest’s seven zones.
Target
<7.6Gigalitres
Target Achieved
Target
7/7Target
Achieved
PERFORMANCE
16AQ
WES
T A
NN
UA
L RE
PORT
201
5

Key Efficiency Indicators Key Efficiency Indicators measure the level of resource inputs required to deliver them, including costs. Service delivery costs include all expenditure excluding capital costs and depreciation. These costs do not contribute to the delivery of services. To measure the costs and efficiency of supplying drinking water the following three efficiency indicators are used:
Target
<6%Target
Not AchievedTarget
<155Litres
Target Achieved
Target
<280Kilolitres
Target Achieved
Operating cost per property
• Target: <6 per cent
This indicator is provided to demonstrate that sustained high quality drinking water must be achieved at reasonable cost.
• Results: Target exceeded slightly. An increase of 7.2 per cent was recorded.
Real Water Losses (Litres/Service Connection/Day)
• Target: <115 Litres
Real losses refer to leakages from mains, reservoirs and service connections before the customer meter. Performance on this indicator can be influenced by the condition of mains and other infrastructure, water pressure and water consumption.
• Results: Target achieved. Aqwest recorded Real Water Losses of 106 Litres/Service Connection/Day.
Average annual residential water supplied (Kilolitres/Property)
• Target: <280 Kilolitres
Target set below historical long term average.
• Results: Target achieved. The average was 265 Kilolitres/property.
x
PERFORMANCE
17
AQW
EST
AN
NU
AL
REPO
RT 2
015

Statistics – 10 Year SummaryFINANCIAL
2015 2014 2013 2012 2011 2010 2009 2008 2007 2006
Total Revenue (000s) 14,217 11,059 9,233 9,460 9,046 9,492 9,858 10,007 8,981 8,621
Operating Subsidy (000s) 480 - - - - - - - - -
Developer Contributions (000s) 993 428 213 446 358 598 733 1,267 824 1,005
Percent of Developer Contributions to Revenue 7.0 3.9 2.3 4.7 4.0 6.3 7.4 12.7 9.2 11.7
Operating Costs (000s) 7,951 7,331 8,242 6,152 6,516 5,634 6,229 6,062 4,287 3,921
Depreciation (000s) 2,684 2,672 2,997 3,059 2,654 2,277 2,015 1,561 1,305 1,262
Total Expenses (000s) 10,635 10,003 11,239 9,211 9,170 7,911 8,244 7,623 5,583 5,183
Profit/ (Loss) Before Tax (000s) 3,582 1,057 (2,005) 249 (124) 1,580 1,613 2,384 3,398 3,438
Income Tax (000s) 1,472 696 - 380 391 550 656 1,082 1,179 782
Dividend (000s) - - - - - - - - - -
Capital Expenditure (000s) 2,738 3,276 3,928 3,936 3,427 6,732 3,174 12,533 1,196 2,708
Total Debt (000s) 507 561 612 - - - - - - -
Residential Tariff Increase (Percent) 18.6 19.6 9.3 8.4 7.8 4.0 3.0 4.3 3.3 2.3
Western Australian CPI (Percent) 2.6 2.4 2.4 2.1 2.8 2.6 3.0 4.5 3.0 4.8
Tariff Increase over CPI (Percent) 16.0 17.2 6.9 6.3 5.0 1.4 0.0 -0.2 0.3 -2.5
PERFORMANCE
18AQ
WES
T A
NN
UA
L RE
PORT
201
5

OPERATING
2015 2014 2013 2012 2011 2010 2009 2008 2007 2006
Water Production (Gigalitres) 6.81 6.70 6.33 6.47 6.49 6.72 6.67 6.29 6.77 6.50
Residential Consumption (Gigalitres) 4.09 4.08 3.83 3.81 3.98 4.05 4.12 3.75 4.05 4.10
Non Residential Consumption (Gigalitres) 1.63 1.61 1.58 1.71 1.70 1.70 1.85 1.69 1.74 1.70
Total Water Consumption (Gigalitres) 5.72 5.69 5.41 5.52 5.68 5.75 5.97 5.45 5.79 5.80
Average Residential Consumption (Kilolitres) 265 267 253 255 269 277 280 273 314 315
Residential Services 15,442 15,270 15,151 14,939 14,798 14,619 n/a n/a n/a n/a
Non –Residential Services 1,475 1,449 1,444 1,419 1,390 1,359 n/a n/a n/a n/a
Total Connected Properties 16,917 16,719 16,595 16,358 16,188 15,978 15,828 15,355 15,008 14,576
Growth in Connected Properties (Percent) 1.3 0.6 1.4 1.1 1.3 0.9 3.1 2.3 3.0 4.8
Total number of employees 40 39 39 36 36 35 32 34 34 34
Total number of full-time equivalents (FTEs) 39.8 38.9 36.3 30.5 30.5 28.3 27.0 26.7 26.7 28.6
PERFORMANCE
19
AQW
EST
AN
NU
AL
REPO
RT 2
015

Performance Indicators Target 2015
Actual 2015 2014 2013 2012 2011 Relationship to Aqwest’s
Objectives Standard Utilised to Set Target
KEY RESULT AREA - SUSTAINABILITY (S)
S1 Quantity of water produced within licensed allocation (Gigalitres) <7.6 6.8 6.7 6.3 6.5 6.5 Manage the long term viability of
the resource.Target based on current groundwater licence.
S2 Real Water Losses (Litres/service connection/day) <115 106 111 116 115 110
To manage the long term viability of the resource and act in an environmentally responsible way.
Benchmarked against National Water Initiative (NWI) historical averages for 2006 to 2010 for similar sized utilities.
S3 Average annual residential water supplied (Kilolitres/property) < 280 265 267 254 255 269
Manage the long term viability of the resource and act in an environmentally responsible way.
Target set below historical long term average. Reduced to 280kL for 2014/15.
S4 Operating cost per property (Percent increase per annum) < 6 7.2 -11.7 27.9 -3.1 15.9 Long term industry standard.
To ensure the long term financial viability of the business. Increased from 4% to 6% in 2011/12.
S5 Economic real rate of return (Percent) 5.1 9.4 5.0 -0.7 -0.1 -0.5 To ensure the long term financial
viability of the business. Based on projection for 2014/15.
S6Total net greenhouse gas emissions (net tonnes CO2 equivalent) per 1000 properties
2% reduction per annum
2.6% reduction
6.5% increase
3.0% reduction
10% reduction
2% reduction
To act in an environmentally responsible way.
WA Sustainable Energy Association 20% by 2020.
S7 Percent of fixed charges recouped from supply fees 100% 52% 47% 39% 42% 45% To ensure the long term financial
viability of the business.Full fixed cost recovery via supply fees.
S8 Operating cost per megalitre (Percent increase per annum) < 6 6.8 -16 33 -2 22 To ensure the long term financial viability of the business. Targets retained
as per recent years.
PERFORMANCE
20AQ
WES
T A
NN
UA
L RE
PORT
201
5

Target 2015
Actual 2015 2014 2013 2012 2011 Relationship to Aqwest’s
Objectives Standard Utilised to Set Target
KEY RESULT AREA - WATER QUALITY (WQ)
WQ1
Number of zones where microbiological compliance was achieved 7/7 7/7 7/7 7/7 7/7 7/7
Alignment with Australian Drinking Water Guidelines 2004 (ADWG).
ADWG 2004 ADWG 2011 now released.
KEY RESULT AREA – CUSTOMER SERVICE (CS)
CS1 Customer satisfaction survey targets met 9/9 3/9 5/9 4/9 4/9 5/9Actively consult and communicate with the community.
Target of 85% sets a high target level of customer satisfaction.
CS2Average frequency of an unplanned interruption (per 1000 properties)
<250 20 211 204 168 143To achieve excellence in the provision of customer service.
Over each 12 month period at least 75% of connected properties shall not experience a complete interruption of supply (no flow) exceeding 1 hour.
CS3 Average duration of an unplanned interruption (minutes) 60.0 43.7 47.5 56.7 61.8 50.3
To achieve excellence in the provision of customer service.
Target of 60 mins introduced 1 July 2012.
CS4 Water quality complaints (per 1000 properties) <10 0.12 0.06 7.0 9.0 7.0
Be aware of and respond to customer needs. Benchmarked with National Water Commission - National Performance Report.CS5 Water service complaints
(per 1000 properties) <4.0 0.2 0.2 4.4 4.7 3.8
CS6 Billing and account complaints (per 1000 properties) <2.0 0.9 0.8 0.7 0.5 0.5
PERFORMANCE
21
AQW
EST
AN
NU
AL
REPO
RT 2
015

Target 2015
Actual 2015 2014 2013 2012 2011 Relationship to Aqwest’s
Objectives Standard Utilised to Set Target
KEY RESULT AREA – COMMUNITY ENGAGEMENT (CE)
CE1 Refer Management Performance Indicator CS1
KEY RESULT AREA – FORWARD PLANNING (FP)
FP1 Debt to equity ratio (percent) 6.8 0.0 0.0 0.0 0.0 0.0
Ensure that sufficient funds are available to fund the replacement of Aqwest’s assets without having to take on debt.
Based on Debt / Equity % projected in ten (10) year Finance Plan. Note: Dividend and capital project assumption.
FP2 Properties served per kilometer of water main > 40.0 43.9 43.3 43.5 43.0 42.5Proactively investigate opportunities to expand the business.
Existing target used by Aqwest.
FP3 Water main breaks (per 100 kilometers of water main) < 20.0 12.5 10.4 12.2 10.2 10.2
Proactively investigate opportunities to expand the business.
Existing target used by Aqwest.
FP4 Energy Consumption (kilowatt-hours/kilolitre) < 0.45 0.45 0.48 0.44 0.48 0.50 Looking for continuous improvement.
FP5 Off peak energy use (percent) >70 72 75 75 78 75 Provides a high but attainable level of off peak power use.
Performance Indicators
PERFORMANCE
22AQ
WES
T A
NN
UA
L RE
PORT
201
5

Target 2015
Actual 2015 2014 2013 2012 2011 Relationship to Aqwest’s
ObjectivesStandard Utilised to Set
Target
KEY RESULT AREA – HUMAN RESOURCES (HR)
HR1 Annual completion of a staff attitudinal survey Yes Yes Yes Yes n/a n/a
Maintain an effective and efficient organisational structure. Maintain high levels of staff morale.
Completion of staff attitudinal survey demonstrates good practice.
HR2 Lost Time Injury Frequency Rate (LTIFR) < 4.2 32.4 31.2 32.8 16.9 0.0 To maintain a safe working
environment.
Industry average „Water Supply, Sewerage and Drainage Services“ (ref DoC website).
HR3 Average time lost per injury (days) < 2 59 40 4 18 0 To maintain a safe working environment.
KEY RESULT AREA – REGULATORY PERFORMANCE (RP)
RP1 Percentage of connections meeting pressure and flow requirements >99.80 99.98 n/a n/a n/a n/a
Compliance with Economic Regulation Authority (ERA) Operating Licence.
Requirements specified in Operating Licence.
RP2Percentage of customer complaints resolved in less than 15 business days
100 93 n/a n/a n/a n/aEnsure compliance with relevant regulatory and statutory requirements.
Customer Services Code requirement.
PERFORMANCE
23
AQW
EST
AN
NU
AL
REPO
RT 2
015

Asset Management - Planning for the future
In 2014/15 Aqwest worked to continuously improve the standards of asset management with the development of a Asset Risk and Criticality Framework, to support the Asset Management Strategy and Asset Management Plan.
Water qualityOne of the main capital works projects was the refurbishment of the filters at the Robertson Treatment Plant to improve water quality and increase the life of the plant.
Tech Reservoir refurbishmentThe second stage of the Tech Reservoir refurbishment project was completed which included joint repair and proving the grouting of the foundations. Under the five stage project, the high density polyethylene liner will be removed and the concrete joints reconstructed.
The Tech Reservoir holds 76 million litres of water, which is more than three days supply for Bunbury and is Aqwest‘s largest potable water storage facility.
Mains and valve replacementAqwest continued its ongoing maintenance program to replace water mains and valves, which are prioritised and completed on a rolling program to meet the long term capability strategies.
OPERATIONS
24AQ
WES
T A
NN
UA
L RE
PORT
201
5

Security reviewAqwest developed a Strategic Security Management plan following a review of security at all sites. Each facility was given a security criticality rating and will be upgraded as part of a staged project in 2015/16.
Water meter replacementA strategy was developed to replace meters with smart water meters, which are computerised and can read water usage and detect leaks from a central location. The meters will be trialled and then installed in stages from 2015/16.
The filters at the Tech Water Treatment Plant
25
AQW
EST
AN
NU
AL
REPO
RT 2
015

Aqwest is committed to the health and safety of its employees, customers, contractors, visitors and the communities in which we operate, and has comprehensive management systems in place. It has a solid safety record and a workplace culture which encourages employees to identify, assess and manage unsafe or hazardous situations to minimise risk.
The Chief Executive Officer chairs the Aqwest monthly Safety Committee meeting which communicates and consults with employees on health and safety matters. Safety meetings are also held by the Water Distribution, Water Treatment and Finance and Administration departments by employees who are qualified health and safety representatives.
In 2014/15 a Safety Values and Commitments poster was developed in conjunction with staff highlighting 11 key safety areas. Employees worked together to identify values and commitments for each area. The poster is now displayed in prominent
Indicator Target Results 2014/15
Results 2012/13
Number of fatalities Zero (0) Zero (0) Zero (0)
Lost time injury / disease (LTI/D) incidence rate Zero (0) or 10% reduction on the previous year
6.6% Zero (0)
Lost time injury severity rateZero (0) or 10% reduction on the previous year
33.33% Zero (0)
Percentage of injured workers returned to work within: (i) 13 weeks and (ii) 26 weeks
Actual percentage result to be reported
(i) 100%
(ii) 100%
(iii) 100%
(iv) 100%
Percentage of managers and supervisors trained in occ. Safety, health and injury management responsibilities
Greater than or equal to 80% 100% 87.56%
Occupational Safety, Health and Injury Management
OPERATIONS
26AQ
WES
T A
NN
UA
L RE
PORT
201
5

positions at sites and staff carry pocket cards summarising the values.
Promoting mental health awareness was an area of focus for the Safety Committee during 2014/15. Two staff achieved Mental Health First Aid Certification.
Aqwest provides an effective rehabilitation system for employees who are injured or become ill from work or non-work related causes, to assist them with an early return to full duties. Aqwest’s injury management system has been developed in accordance with the Workers’ Compensation and Injury Management Act 1981.
Numerous WorkSafe Plan audits have been completed in the last 10 years and Aqwest continues to provide and maintain safe working environment and systems of work through implementation of the Safety Policy, Safety Management Manual and associated tasks and procedures.
27
AQW
EST
AN
NU
AL
REPO
RT 2
015

Aqwest is committed to resolving complaints fairly, efficiently and in a courteous and effective manner. Feedback is valued and is assessed as part of a continuous improvement process to enhance products and customer service.
Under Aqwest‘s Water Services Operating Licence, customer complaints must be received, recorded, and where possible, resolved within 15 business days. Customers are kept fully informed on the progress of their complaint until a solution is found.
The Water Services Code of Conduct 2013 requires Aqwest‘s Complaints Management Procedure to conform to Australian Standard Customer Satisfaction - Guidelines for Complaints Handling in Organisations AS ISO 10002-2006.
Staff are trained to handle customer complaints and where necessary, liaise with officers who are authorised to settle complaints.
Customers are entitled to have their complaint investigated and resolved by the Energy and Water Ombudsman.
The following performance indicators were set by Aqwest for complaints in 2014/15 (per 1000 properties, per year):
Customer Complaints
Target ResultWater quality <10 0.12Water pressure or flow <4 0.2Billing or accounts <2 0.9
The performance indicators are monitored at monthly Board meetings.
Complaint statistics for 1 July 2014 to 30 June 2015 are:
Number of ComplaintsWater Quality 2Water Pressure or Flow 4Billing or Accounts 16Other 5Total 27
Resolution of Complaints Resolved by routine business practices 25Unresolved 2Total 27
Written Complaints Total number of written complaints 15Number of written complaints resolved in 15 days. 15
Number of written complaints resolved in more than 15 days. 0
Number of complaints outstanding at 30 June 2015 2
OPERATIONS
28AQ
WES
T A
NN
UA
L RE
PORT
201
5

Aqwest Water Services Trainee Josh Pickering inspects the filters at the
Tech Water Treatment Plant
29
AQW
EST
AN
NU
AL
REPO
RT 2
015

CommunitySponsorshipA number of community groups applied for sponsorship in 2014/15, receiving grants from a funding pool of $15,000.
Sponsorship is open to organisations which are based in the region served by Aqwest, provide a community service, an educational, social, cultural or environmental activity, are managed by a community based committee, are non profit and constituted or incorporated.
The Bunbury Eisteddfod received Aqwest sponsorship in 2014
30AQ
WES
T A
NN
UA
L RE
PORT
201
5

Rehydration StationThe Aqwest Rehydration Station was used for many community events during summer. The station is available for use by non-profit organisations, charities and sporting groups located in the Aqwest water licence area. The 500 litre tank has eight water dispensing points, an ice chest and is refrigerated.
In 2014/15 it was used by:
• Bunbury Postnatal Depression Awareness Week Big Pram Walk
• 2014 Hobie Cat National Championships, Koombana Bay Sailing Club
• Bunbury Show
• HBF Bunbury Three Waters Running Festival, Bunbury Runners Club
Photographic CompetitionStudents from throughout Bunbury entered the annual Aqwest Photographic Competition. Judges decided the winners from 259 entries depicting the theme “Climate Change - Water” in the 12 Years and Under and 13 to 17 years categories. The
winners received cash prizes and their photos were featured in the popular Aqwest calendar, which was distributed to entrants and participating schools and available free to customers.
Glass water bottlesAqwest produces glass water bottles for local restaurants, cafes and function centres for free. The water bottles are available from the Aqwest reception.
Water WeekAqwest highlighted the importance of water conservation and choosing water saving appliances by giving away a waterwise washing machine during National Water Week in October. Chairman Judy
Jones presented Lorna Samwell from Bunbury with the front loading washing machine. The competition attracted 900 entries and it was the fourth time Aqwest has given away a washing machine.
Customer surveyAqwest carries out a customer survey each year to measure performance and make recommendations for improvement where necessary. The overall satisfaction rating remains high at 87.3 per cent.
Developer surveyA survey of developers, planners and builders was carried out in 2014/15 to better understand performance in this area of the business and inform Aqwest’s strategy with regards to developer services.
The findings were: • Respondents were positive towards pricing• Relationships with survey respondents (including
professionalism and understanding) are good • Visiting the office to discuss projects was
important to a large proportion of respondents
OPERATIONS
31
AQW
EST
AN
NU
AL
REPO
RT 2
015

Our Purpose: To provide sustainable high quality water services
Our Vision: To be an independent water utility providing diversity and competition in the Western Australian water industry.
This is the first year we have been able to offer sponsorship in our community. We called for applications during September and the first two weeks in October and were pleased with the response.
Applications were assessed and the following clubs and organisations have received funding:
The Bunbury Bel Canto Singers is a mixed choir, which was formed
in 1998 and has a membership of around 35-40 people who just love to sing and enjoy themselves – We sponsored the purchase of music books.
City of Bunbury Eisteddfod which is a competitive music festival for dance, bands instruments, speech and drama, vocal, choirs and more.
Eisteddfod aims to foster the local appreciation and advancement
of the performing arts in the community – We sponsored the Gala concert awards.
The third recipient was the Bunbury & Districts Softball Association, which organises competitions for T-Ball, Junior’s Softball and Senior Men’s and Women’s Softball. Competitions cater for all ages and playing ability – We sponsored water bottles and shirts.
Courtney Butlion won the Juniors 12 years and under and Harvey Dykstra was first in the Juniors 13-17 years category. All the winning photographs are displayed on our website www.aqwest.com.au
We congratulate all the winners and are pleased to display them in our annual calendar, which is available from our foyer at the Water Services Centre in MacKinnon Way, Bunbury until supplies run out.
Our washing machine competition continues to be extremely successful. This year we received 900 entries and the winner was Ms Lorna Samwell from Bunbury. She received her prize from Board Chairman Ms Judy Jones.
Acting Chief Executive Officer, Gary Hallsworth, confirmed the competition is an outstanding initiative that is set to continue into the future.
“Our focus is on promoting water conservation and giving away a water efficient front-loading machine with a high star rating, reinforces our commitment,” he said.
The competition will be on again next year to coincide with National Water Week.
Community Sponsorship
Photographic Competition Success
Washing Machine Give Away
Last digit of house number*
Scheme water users, your two days a week are:
1 Wednesday and Saturday 2 Thursday and Sunday3 Friday and Monday4 Saturday and Tuesday5 Sunday and Wednesday 6 Monday and Thursday 7 Tuesday and Friday8 Wednesday and Saturday9 Thursday and Sunday 0 Friday and Monday
WATERING ROSTER
*or where there is no house number, lot number.No sprinkler or reticulation use on any day
between 9am-6pm. Two-day a week roster does not apply to bore users.
OnTapSummer 2014Issue 6 Vol 1
5 MacKinnon WayBunbury WA 6230
p: (08) 9780 9500f: (08) 9780 9509
e: [email protected]: www.aqwest.com.au
Contact AQWEST
Find us on Facebook
Communications
Aqwest keeps customers up to date about its activities with the On Tap newsletter published every four months, through media releases and with weekly Facebook posts. This ensures there are a number of mediums used to reach as many people in the community as possible.
Some of the news this year included the photographic competition, increased water charges, new Directors, court prosecutions for damage to water meters, Aqwest’s performance, the washing machine give-away during National Water Week and community sponsorship opportunities.
Aqwest also took the opportunity to highlight waterwise tips, how to read meters to detect leaks, the watering roster and promoted receiving water accounts by email.
A new Facebook site was launched during the year as another important medium to connect with social media users, with stories about disruptions to water services, Aqwest community activities, sponsorship, competition winners, waterwise tips, how to read water meters and sprinkler bans.
Water EfficiencyAqwest continued to highlight the importance of water efficiency during the year. The aim of the annual photographic competition was to raise awareness of water conservation among school students through the theme “Climate Change - Water”.
Other initiatives included stories in the On Tap newsletter and on Facebook about water conservation.
Average residential water consumption was 265 kilolitres per household during the year, which was below the Aqwest target of 280 kilolitres.
OPERATIONS
32AQ
WES
T A
NN
UA
L RE
PORT
201
5

Aqwest Supply Officer Dean Jendrzejak maintains
Aqwest’s stock inventory
33
AQW
EST
AN
NU
AL
REPO
RT 2
015

Accountability and IndependenceAs prescribed in the Water Corporations Act 1995, Directors are to act honestly, exercise due care and diligence and disclose all material personal interest in matters involving Aqwest that are raised in Board meetings.
The Board has powers to determine the policies and control the affairs of Aqwest subject to the requirements of the Water Corporations Act 1995.
Ministerial approval is required for transactions that are above a prescribed amount, will amount to a major initiative, or are likely to be of significant public interest.
Ministerial directionsUnder section 64(1) of the Waters Corporations Act 1995, the Minister may give directions in writing to Aqwest generally with respect to the performance of its functions and, subject to section 65, Aqwest is to give effect to any such direction.
During the reporting period, no directions were received from the Minister.
Corporate Governance ReportDirectors‘ and Senior Executives‘ remunerationA full disclosure of Directors‘ and Senior Executives‘ remuneration is detailed in the Remuneration report on page 39.
Internal controlThe Board of Directors is responsible for the overall control framework and approval of an internal control system monitored by an Audit Committee appointed by the Board. The system is based on written policy and a program of internal and external audits.
The Audit Committee manages Aqwest‘s internal audit function. This function supports the Audit Committee and the executive group by independently and objectively reviewing the effectiveness of internal control systems.
Risk managementAqwest has an objective to develop and promote a culture of risk management. This objective is measured
by the percent of planning processes that identify and treat risk. Under the Risk Management Calendar, the Risk Management Committee is required to review plans to consolidate and promote risk management culture annually.
Critical success factors for strong risk management are as follows:
a) Risk management is strongly linked to business objectives.
b) There is broad engagement in risk management across the agency.
c) Risk management is adequately resourced in terms of time, training and systems.
d) Documentation and processes consider the needs of stakeholders.
e) Risk treatments are based on a cost-benefit analysis.
f) Decision makers have a concise list of the most significant risks in their area of responsibility.
g) Subjective judgments in risk identification and assessment are challenged and tested.
h) Management of risks are clearly assigned to risk owners.
i) Independent assurance of risk management efforts.
CORPORATE GOVERNANCE
34AQ
WES
T A
NN
UA
L RE
PORT
201
5

Aqwest is working on planning processes as a means of addressing items (a) through to (h), to improve the linkage of risk management to business objectives and ensure a broad engagement in risk management.
Performance monitoring and reportingAqwest provides the Annual Report to the Minister for Water detailing its performance and progress made to fulfil the Statement of Corporate Intent. A written annual report on compliance with performance standards specified in the operating licence is also provided to the Economic Regulation Authority.
In addition, the Board and the Executive receive monthly performance reports covering a diverse range of financial and non-financial matters.
State Records Act 2000Aqwest is committed to maintaining good record keeping practices and meeting the legislative requirements of Section 61 of the State Records Act 2000 and the State Records Commission Standards (Standard 2 - Principle 6).
The most recent record keeping plan was approved by the State Records Commission in August 2014.
Record keeping training is mandatory for all staff to
gain an understanding of their responsibilities and obligations. As part of the induction process, all new staff are provided with an induction manual that addresses staff roles and responsibilities in respect to the record keeping plan. Inductees also attend individual record keeping training and information sessions.
Training sessions for current employees are available if the need is identified. Record keeping training requirements are also reviewed annually as part of a performance appraisal process.
Public Interest Disclosure (PID)Public Interest Disclosure training is provided to all staff annually. Aqwest has one PID officer.
There were no public interest disclosures in this reporting period.
Freedom of Information (FOI)Aqwest met its obligations under the Freedom of Information Act 1992. During 2014/15, no FOI applications were received. Under Section 96 of the Freedom of Information Act 1992, Aqwest is required to produce a FOI Information Statement. Its purpose is to provide a description of Aqwest‘s procedures for giving members of the public access to documents, as well as the types of documents held by the organisation.
Reportable ExpenditureThe Electoral Act 1907 (Section 175 ZE) requires the disclosure of certain categories of expenditure. Details of the organisations contracted by Aqwest and the amounts paid for advertising, market research, polling, direct mail and media advertising in 2014/15 are:
AMOUNT PAIDAdvertising agencies NilPolling organisations NilDirect mail organisations Nil
Media advertising organisationsBarb Clews and Associates $5,949 Rural Press Ltd $1,506 Western Australian Local Government Association
$6,496
The Local Link $714 Mycre Display $380 West Australian Newspapers $2,309
Market research organisationsAEC Group $11,975
CORPORATE GOVERNANCE
35
AQW
EST
AN
NU
AL
REPO
RT 2
015

Directors’ Report
Ms Judy Jones (Chairman)Board Member since March 2011Chairman since 1 January 2012Director since November 2013
Mr Neville EastmanBoard Member since July 2011Director since November 2013
Mr Edwin AbdoBoard Member since October 2011Director since November 2013
Mr Rob NicholsonBoard Member since June 2012Director since November 2013
Mr Hans DopheideBoard Member since November 2013Director since November 2013
Mr Wayne EdgeloeBoard Member since October 2009Director November 2013 to May 2015.
Directors’ biographies are shown on page 8.
The Directors of Aqwest present their report for the 12 months ended 30 June 2015.
The Aqwest Board of Directors provides leadership and direction to ensure Aqwest achieves excellence in providing services to its customers, completes regulatory and statutory compliance and operates in a responsible and ethical manner within the spirit of relevant legislation and the community it serves.
The Board develops an annual Statement of Corporate Intent (SCI) which outlines objectives and performance targets for the coming year.
The Board also prepares an annual Strategic Development Plan (SDP) which sets out the economic and financial objectives and operational targets over a five year period.
The Chief Executive Officer is responsible for the achievement of the objectives and targets set out in the SCI and SDP.
Principal activitiesThe principal functions of Aqwest are:• Acquire, store, treat, distribute, market and
otherwise supply water for any purpose• Undertake, maintain and operate any works,
system, facilities, apparatus or equipment required for any of these purposes.
State of affairsThere were no significant changes during the year ended 30 June 2015 in the state of affairs of Aqwest not otherwise disclosed in this report, or the financial statements.
Operating resultsAqwest operates in a regulatory framework comprising the Economic Regulation Authority, Department of Water, Department of Treasury, Department of Health and Department of Environment Regulation. During the year, Aqwest supplied 5.69 million kilolitres of water.
CORPORATE GOVERNANCE
36AQ
WES
T A
NN
UA
L RE
PORT
201
5

Aqwest made a profit before income tax equivalent of $3.582 million: (2014: Profit $1.057 million). On an after-tax equivalent basis, the profit was $2.110 million (2014: $0.361 million)
DividendsNo dividends were recommended, declared or paid during the 2014/15 year. Aqwest’s first dividend as a corporation will be declared in the 2015/16 financial year and is estimated to be $1.218 million.
Board meetingsThe number of Board and committee meetings held and attended by each Director during this reporting period are tabled below:
Events subsequent to balance dateSince 30 June 2015 and the date of the release of this report, the Directors are not aware of any matter or circumstance not otherwise dealt with in the report or financial statements that has significantly, or may significantly, affect Aqwest’s operations, the results of those operations, or Aqwest’s state of affairs in subsequent financial periods.
Board Meetings Audit Committee Risk Management Committee
Salary Review Committee
Attended Eligible to attend
Attended Eligible to attend
Attended Eligible to attend
Attended Eligible to attend
Number of meetings held 10 4 4 1
Judy Jones (Chairman) 10 10 4 4 4 4 1 1
Neville Eastman 10 10 4 4 1 1
Hans Dopheide 9 10
Edwin Abdo 9 10 4 4
Rob Nicholson 9 10
Wayne Edgeloe 5 8 0 1
Note: Only 10 Board Meetings as there was no meeting in February or October.
CORPORATE GOVERNANCE
37
AQW
EST
AN
NU
AL
REPO
RT 2
015

Directors’ interests and benefitsIn the 12 months to 30 June 2015, no Director received, or became entitled to receive, any benefit (other than a benefit included in the total amount of remuneration received or due and receivable by Directors) by reason of a contract made by Aqwest with the Director, or with a firm of which the Director is a member, or with an entity in which the Director has a substantial interest.
Indemnification of Directors and auditorsIn the 12 months ended 30 June 2015, Aqwest has not indemnified against a liability, a person who is, or has been, a Director or auditor of Aqwest. During the period ended 30 June 2015, Aqwest paid insurance premiums in respect of Directors’ and Officers’ liability insurance for any past, present or future director, board/committee member, secretary, executive officer or employee of Aqwest.
Remuneration reportKey management personnel comprise the Directors of the Board and Executives who are responsible for planning, directing and controlling Aqwest’s activities.
The Directors’ compensation is determined by the Public Sector Commission on an ad-hoc basis and is approved by the Minister.
At the Board Meeting held on Wednesday 10 August 2011, the Board endorsed the appointment of Local Government Workplace Solutions to complete a review of Executive Staff Remuneration and Employment Contract Arrangements.
Compensation consists of salary and superannuation contributions. Other than compulsory superannuation contributions and superannuation via salary sacrifice, Aqwest does not pay any other benefits to non-executive Directors.
The compensation packages for the Chief Executive Officer and Executives consist of a total reward that is a mix of salary, non-monetary benefits and
superannuation contributions and this compensation is fixed. Non-monetary benefits may include access to a fully maintained motor vehicle and fringe benefits tax. Other long-term benefits refer to long service leave.
The compensation of all staff is reviewed annually. The Board, with the Minister’s agreement, is responsible for the Chief Executive Officer’s compensation and this is reviewed annually.
The Chief Executive Officer and the Board sets Executive compensation based on advice from independent remuneration consultants regarding compensation practices.
Executives are employed on individual employment contracts under common law.
Details of compensation provided to key management personnel are as follows:
CORPORATE GOVERNANCE
38AQ
WES
T A
NN
UA
L RE
PORT
201
5

The names and positions of the executives were:
Executives Year ended 30 June 2015 Year ended 30 June 2014Brad Bevis Chief Executive Officer √ √
Joe Smith Manager Finance & Administration √ √
Gary Hallsworth Manager Water Services √ √
Executives remuneration fell within the following bands:
30 June 2015 Total Remuneration Band ($)
Number of Staff
Salary & Fees Non-monetary Benefits Superannuation Total
$'000 $'000 $'000 $'000
125,000 - 149,999 1 122 10 13 145
175,000 - 199,998 1 167 8 16 191
200,000 - 224,999 1 189 8 18 215
30 June 2014 Total Remuneration Band ($)
Number of Staff
Salary & Fees Non-monetary Benefits** Superannuation Total
$'000 $'000 $'000 $'000
125,000 - 149,999 1 115 8 11 134
175,000 - 199,999 2 172 8 15 195
* where there is more than one employee in a remuneration band the average remuneration is shown. ** Private use of motor vehicle
CORPORATE GOVERNANCE
39
AQW
EST
AN
NU
AL
REPO
RT 2
015

The directors during the financial year were:
Directors
J Jones Chairman (non executive) H Dopheide Director (non executive) N Eastman Deputy Chairman (non executive) R Nicholson Director (non executive)W Edgloe Director (non executive) E Abdo Director (non executive)
Directors remuneration fell within the following bands:
30 June 2015 Total Remuneration Band ($)
Number of Staff
Salary & Fees Non-monetary Benefits Superannuation Total
$'000 $'000 $'000 $'000
10,000 - 14,999 5 13.0 0.0 1.4 14.4
15,000 - 34,999 1 25.0 0.0 2.6 27.6
30 June 2014 Total Remuneration Band ($)
Number of Staff
Salary & Fees Non-monetary Benefits Superannuation Total
$'000 $'000 $'000 $'000
2,500 - 9,999 5 2.8 0.0 0.3 3.1
10,000 - 34,999 1 9.4 0.0 1.0 10.4
This statement is made in accordance with a resolution of the Board.
Judy Jones Neville Eastman Chairman Director
Bunbury, 24 August 2015 Bunbury, 24 August 2015
CORPORATE GOVERNANCE
40AQ
WES
T A
NN
UA
L RE
PORT
201
5

Refurbishment of the Tech Reservoir at College Grove, Bunbury
41
AQW
EST
AN
NU
AL
REPO
RT 2
015

42AQ
WES
T A
NN
UA
L RE
PORT
201
5

Financial Report
43
AQW
EST
AN
NU
AL
REPO
RT 2
015

Aqwest has an ongoing maintenance program to replace water mains and valves
44AQ
WES
T A
NN
UA
L RE
PORT
201
5

FINANCIAL REPORT
In the opinion of the Directors of Bunbury Water Corporation:
(a) the financial statements and notes are in accordance with the Water Corporations Act 1995, including:
(i) giving a true and fair view of the Corporation’s financial position as at 30 June 2015 and of its performance, for the financial year ended on that date; and
(ii) complying with Australian Accounting Standards (including the Australian Accounting Interpretations) and the Corporations Regulations 2001.
(b) there are reasonable grounds to believe that the Corporation will be able to pay its debts as and when they become due and payable.
Signed in accordance with a resolution of the Directors:
Judy Jones Chairman
Bunbury, 24 August 2015
Directors’ Declaration
Neville Eastman DirectorBunbury, 24 August 2015
45
AQW
EST
AN
NU
AL
REPO
RT 2
015

Note 2015 2014$ $
INCOMERevenueWater sales 7 12,470,757 10,571,272
Operating subsidy 7a 479,000 -
Interest revenue 8 149,477 98,210
Developer contributions 9 992,995 269,302
Other revenue 10 125,215 120,632
GainsGain on disposal of non current assets 15 - -
Impairment losses reversed 15 - -
Total income 14,217,444 11,059,416
EXPENSESOperational expenses 11 6,580,340 6,517,691
Administration expenses 14 3,038,581 2,712,059
Loss on disposal of non current assets 15 37,830 24,369
Finance Costs 16a 22,447 24,435
Other expenses 16 955,792 724,010
Total expenses 10,634,990 10,002,564
Profit/(loss) before income tax 3,582,454 1,056,852Income tax equivalent expense 18 1,472,275 695,585
Profit /(Loss) after income tax 2,110,180 361,273
PROFIT/(LOSS) FOR THE PERIOD 2,110,180 361,273
Note 2015 2014$ $
OTHER COMPREHENSIVE INCOMEItems not reclassified subsequently to Profit or LossChanges in asset revaluation surplus 28 - -
Gains/(losses) recognised directly in equity 28 (88,778)
(551,126)
Income tax on items of other comprehensive income 28 314,440 (973,452)
Total other comprehensive income 225,662 (1,524,578)
TOTAL COMPREHENSIVE INCOME FOR THE PERIOD 2,335,842 (1,163,305)
The Statement of Comprehensive Income should be read in conjunction with the accompanying notes.
STATEMENT OF COMPREHENSIVE INCOME for the year ended 30 June 2015
46AQ
WES
T A
NN
UA
L RE
PORT
201
5

Note 2015 2014$ $
ASSETSCurrent assetsCash and cash equivalents 30 802,242 811,794
Other financial assets 19 3,787,310 1,700,000
Receivables 20 1,608,466 1,489,110
Inventories 21 508,637 585,343
Other current assets 22 87,122 200,620
Total current assets 6,793,777 4,786,867
Non current assetsOther financial assets 19 750,000 -
Property, plant and equipment 23 88,617,546 88,647,766
Other non current assets 22 526,078 491,579
Total non current assets 89,893,624 89,139,343
TOTAL ASSETS 96,687,401 93,926,212
LIABILITIESCurrent liabilitiesPayables 25a 1,067,059 1,094,308
Borrowings 25b 57,045 55,426
Current tax liability 25c 696,159 -
Provisions 26 727,497 658,639
Total current liabilities 2,547,760 1,808,373
Note 2015 2014$ $
LIABILITIESNon current liabilitiesProvisions 26 70,426 59,923
Borrowings 25b 450,376 505,592
Deferred tax liabilities 27 9,892,121 10,161,448
Total non current liabilities 10,412,923 10,726,963
TOTAL LIABILITIES 12,960,683 12,535,336
NET ASSETS 83,726,718 81,390,786
EQUITYReserves 28 53,576,468 51,944,125
Retained earnings 30,150,250 29,446,751
TOTAL EQUITY 83,726,718 81,390,876
The Statement of Financial Position should be read in conjunction with the accompanying notes.
STATEMENT OF FINANCIAL POSITION AS AT 30 JUNE 2015
47
AQW
EST
AN
NU
AL
REPO
RT 2
015

Note Asset revaluation reserve Other reserves Retained profits Total equity
$ $ $ $
Balance at 1 July 2013 51,608,865 1,498,476 29,446,840 82,554,181
Total comprehensive income for the year 28 (973,452) - (189,853) (1,163,305)
Transfers to reserves 28 - 2,269,394 (2,269,394) -
Transfers from reserves 28 - (2,459,158) 2,459,158 -
Balance at 30 June 2014 50,635,413 1,308,712 29,446,751 81,390,876
Balance at 1 July 2014 50,635,413 1,308,712 29,446,751 81,390,876Total comprehensive income for the year 28 314,440 - 2,021,402 2,335,842
Transfers to reserves 28 - 3,465,025 (3,465,025) -
Transfers from reserves 28 - (2,147,122) 2,147,122 -
Balance at 30 June 2015 50,949,853 2,626,615 30,150,250 83,726,718
The Statement of Changes in Equity should be read in conjunction with the accompanying notes.
STATEMENT OF CHANGES IN EQUITY for the year ended 30 June 2015
48AQ
WES
T A
NN
UA
L RE
PORT
201
5

STATEMENT OF CASH FLOWS FOR THE YEAR ENDED 30 JUNE 2015
Note 2015 2014$ $
CASH FLOWS FROM OPERATING ACTIVITIESReceiptsSale of goods and services 12,363,777 10,226,541
Developer contributions 768,204 248,602
Interest received 140,813 92,741
GST receipts on sales 18,233 12,914
GST receipts from taxation authority 607,638 624,849
Other receipts 125,215 342,562
PaymentsSupplies and services (8,053,747) (7,426,186)
GST payments on purchases (579,200) (664,244)
Net cash provided by/(used in) operating activities (a) 30 5,390,934 3,497,775
CASH FLOWS FROM INVESTING ACTIVITIESProceeds from sale of non current physical assets 139,790 17,000
Purchase of non current physical assets (2,629,703) (2,835,174)
Purchase/(drawdown) of investments (2,837,310) (352,000)
Net cash provided by/(used in) investing activities (5,327,223) (3,170,174)
CASH FLOWS FROM FINANCING ACTIVITIESProceeds from borrowings - -
Interest Paid (23,043) (24,450)
Repayment of borrowings (55,840) (53,632)
Net cash provided by/(used in) financing activities (a) (76,044) (78,082)
Note 2015 2014$ $
CASH FLOWS TO STATE GOVERNMENT Taxation equivalents (387,533) 1,035
Local government rate equivalent (88,666) -
Operating subsidies 479,000 -
Net cash provided to/from State Government 2,781 1,035
Net increase/(decrease) in cash and cash equivalents (9,552) 250,564
Cash and cash equivalents at beginning of year 811,794 561,230
CASH AND CASH EQUIVALENT ASSETS AT THE END OF PERIOD 30 802,242 811,794
The Statement of Cash Flows should be read in conjunction with the accompanying notes.
(a) The comparatives have been restated to move interest paid from Operating to Financing activities.
49
AQW
EST
AN
NU
AL
REPO
RT 2
015

NOTES TO THE FINANCIAL STATEMENTS for the year ended 30 June 2015
Note 1 - Australian Accounting Standards
(a) GeneralAqwest’s financial statements for the year ended 30 June 2015 have been prepared in accordance with Australian Accounting Standards. The term Australian Accounting Standards’ includes Standards and Interpretations issued by the Australian Accounting Standards Board (AASB).
Aqwest has adopted any applicable, new and revised Australian Accounting Standards from their operative dates.
(b) Early adoption of standardsAqwest cannot early adopt an Australian Accounting Standard or Interpretation. No Australian Accounting Standards that have been issued or amended but are not operative have been early adopted by Aqwest for the annual reporting period ended 30 June 2015.
Note 2 - Summary of significant accounting policies
(a) General statementAqwest – Bunbury Water Corporation is a corporation domiciled in Australia. Aqwest is a not-for-profit entity primarily involved in the provision of potable water services. Aqwest prepares general purpose financial statements in accordance with Australian Accounting Standards, the Framework, Statements of Accounting Concepts and other authoritative pronouncements of the AASB.
(b) Basis of preparationThe financial statements have been prepared on the accrual basis of accounting using the historical cost convention, except for land, buildings and infrastructure, which have been measured at fair value.
The financial report is a general purpose financial report which has been prepared in accordance
with the Water Corporations Act 1995 and Australian Accounting Standards (including Australian Interpretations) adopted by the Australian Accounting Standards Board (AASB).
The accounting policies adopted in the preparation of the financial statements have been consistently applied throughout all periods presented unless otherwise stated.
The financial statements are presented in Australian dollars and all values are rounded to the nearest dollar.
Note 4 ‘Judgements made by management in applying accounting policies’ discloses judgements that have been made in the process of applying Aqwest’s accounting policies resulting in the most significant effect on amounts recognised in the financial statements.
Note 5 ‘Key sources of estimation uncertainty’ discloses key assumptions made concerning the future and other key sources of estimation uncertainty at the end of the reporting period, that have a significant risk of causing a material adjustment to the carrying amounts of assets and liabilities within the next financial year.
(c) IncomeRevenue recognitionRevenue is measured at the fair value of consideration received or receivable.
Revenue is recognised for the major business activities as follows:i) Water sales Revenue from annual supply and consumption charges is shown in the Statement
of Comprehensive Income as the amounts levied and billed for the period, including interest on overdue amounts, less rebates and concessions allowed to entitled customers. Other water charges include connection fees, relocation fees, disconnection fees, meter repair charges, meter reading charges and financial enquiries charges and are recognised as they are levied and billed.
ii) Interest Revenue is recognised on an accruals basis.
iii) Developer contributions Developer’s contributions are recognised as revenue at fair value when Aqwest takes
50AQ
WES
T A
NN
UA
L RE
PORT
201
5

control over the assets comprising the contributions. Aqwest receives capital contributions from external parties in the form of either cash or assets.
iv) Other revenue Other revenue includes hydrant hire, lease income and other miscellaneous revenue received.
v) Operating subsidies Operating subsidies are received from the State Government for revenue foregone from
rebates and concessions to Pensioners and Seniors on annual supply and consumption charges. They are recognised in the period in which they are received.
(d) Income taxAqwest operates within the National Tax Equivalent Regime (NTER) whereby an equivalent amount in respect of income tax is payable to the Treasury. The calculation of the liability in respect of income tax is governed by NTER guidelines and directions approved by Government.As a consequence of participation in the NTER, Aqwest is required to comply with AASB 112 ‘Income Taxes’.
The income tax expense or revenue for the period is the tax payable on the current period’s taxable income adjusted by changes in deferred tax assets and liabilities attributable to temporary differences between the tax bases of assets and liabilities and their carrying amounts in the financial statements, and to unused tax losses.
Deferred tax assets and liabilities are recognised for temporary differences at the tax rate expected to apply when the assets are recovered or liabilities settled, based on those tax rates which are enacted or substantively enacted. The relevant tax rates are applied to the cumulative amounts of deductible and taxable temporary differences to measure the deferred tax asset or liability. An exception is made for certain temporary differences arising from the initial recognition of an asset or liability.
No deferred tax asset or liability is recognised in relation to these temporary differences if they arose in a transaction, other than a business combination, that at the time of the transaction did not affect either accounting profit or taxable profit or loss.Deferred tax assets are recognised for deductible temporary differences and unused tax losses only if it is probable that future taxable amounts will be available to utilise those temporary differences and losses.
Current and deferred tax balances attributable to amounts recognised directly in equity are also recognised directly in equity.
(e) Property, plant, equipment, and infrastructurei) Capitalisation/expensing of assets Items of property, plant and equipment and infrastructure costing $5,000 or more are
recognised as assets and the cost of utilising assets is expensed (depreciated) over their useful lives. Items of property, plant, equipment and infrastructure costing less than $5,000 are immediately expensed direct to the Statement of Comprehensive Income.
Aqwest’s current Operating Licence expires in January 2022. However, Aqwest views ‘useful life’ to relate to the full useful life over which the assets will be utilised.
ii) Initial recognition and measurement Property, plant, equipment and infrastructure are initially recognised at cost. For items
of property, plant and equipment and infrastructure acquired at no cost or for nominal cost, cost is their fair value at the date of acquisition.
iii) Subsequent measurement Subsequent to initial recognition as an asset, the revaluation model is used for
measurement of land, buildings and infrastructure and historical cost for all other property, plant and equipment. Land, buildings and infrastructure are carried at fair value less accumulated depreciation on buildings and infrastructure and accumulated impairment losses.
All other items of property, plant and equipment are stated at historical cost less accumulated depreciation and accumulated impairment losses. Where market evidence is available, the fair value of land and buildings is determined on the basis of current market buying values by reference to recent market transactions.
When buildings are revalued by reference to recent market transactions, the accumulated depreciation is eliminated against the gross carrying amount of the asset and the net amount restated to the revalued amount.
In the absence of market-based evidence, fair value of land and buildings is determined on the basis of existing use. This normally applies where buildings are specialised
NOTES TO THE FINANCIAL STATEMENTS for the year ended 30 June 2015
51
AQW
EST
AN
NU
AL
REPO
RT 2
015

NOTES TO THE FINANCIAL STATEMENTS for the year ended 30 June 2015
or where land use is restricted. Fair value for existing use assets is determined by reference to the cost of replacing the remaining future economic benefits embodied in the asset, i.e. the depreciated replacement cost. Where the fair value of buildings is determined on the depreciated replacement cost basis, the gross carrying amount and the accumulated depreciation are restated proportionately.
Land and buildings are independently valued when an initial property index indicates that the carrying amount may differ materially from the asset’s fair value at the end of the reporting period, or at least every 5 years.
Fair value of infrastructure has been determined by reference to the depreciated replacement cost (existing use basis) as the assets are specialised and no market-based evidence of value is available. Independent valuations are obtained at least every 5 years for infrastructure, or when an initial assessment indicates that the fair value may differ materially from the carrying amount.
Land under infrastructure is included in land reported under note 23 ‘Property, Plant and Equipment’ and is valued with reference to current market values. Independent valuations are obtained at least every five years. An annual indexation exercise is conducted independently to ensure that the carrying amounts of infrastructure assets classes, which are not revalued, did not differ materially from that which would be determined using fair value at the end of the reporting period.
When infrastructure is revalued, the accumulated depreciation is eliminated against the gross carrying amount of the asset and the net amount restated to the revalued amount.
The most significant assumptions in estimating fair value are made in assessing whether to apply the existing use basis to assets and in determining estimated useful life. Professional judgment by the valuer is required where the evidence does not provide a clear distinction between market type and existing use assets.
iv) Derecognition Upon disposal or derecognition of an item of property, plant and equipment, any
revaluation surplus relating to that asset is retained in the asset revaluation reserve.
v) Asset revaluation reserve The asset revaluation reserve is used to record increments and decrements on
the revaluation of non-current assets as described in note 23 ‘Property plant and equipment’.
vi) Depreciation All non-current assets having a limited useful life are systematically depreciated over
their estimated useful lives in a manner that reflects the consumption of their future economic benefits.
Depreciation on other assets is calculated using the straight line (SL) method, using rates, which are reviewed annually. The estimated effective lives for each class of depreciable asset are as follows:
Asset class Effective life (yrs)Buildings at Fair Value 1 to 98Mains at Fair Value 1 to 84Meters at Fair Value 1 to 8Service Connections at Fair Value 1 to 19Treatment Plants at Fair Value 1 to 80Reservoirs at Fair Value 1 to 79Bores & Pumps at Fair Value 1 to 77Plant & Equipment at Cost 1 to 17Motor Vehicles at Cost 1 to 7Office Equipment at Cost 1 to 9Tools at Cost 1 to 8
(f) Intangible assetsi) Computer software Software that is an integral part of the related hardware is treated as property, plant and
equipment. Software that is not an integral part of the related hardware and cost less than $5,000 is expensed in the year of acquisition. The value of intangible software is shown at note 23 ‘Property plant and equipment’.
52AQ
WES
T A
NN
UA
L RE
PORT
201
5

NOTES TO THE FINANCIAL STATEMENTS for the year ended 30 June 2015
(g) Impairment of assetsProperty, plant, equipment and infrastructure assets are tested for any indication of impairment at the end of each reporting period. Where there is an indication of impairment, the recoverable amount is estimated. Where the recoverable amount is less than the carrying amount, the asset is considered impaired and is written down to the recoverable amount and an impairment loss is recognised. As Aqwest is a not-for-profit entity, unless an asset has been identified as surplus asset, the recoverable amount is the higher of an asset’s fair value less costs to sell and depreciated replacement cost.
The risk of impairment is generally limited to circumstances where an asset’s depreciation is materially understated, where the replacement cost is falling or where there is a significant change in useful life. Each relevant class of assets is reviewed annually to verify that the accumulated depreciation/amortisation reflects the level of consumption or expiration of asset’s future economic benefits and to evaluate any impairment risk from falling replacement costs.
Aqwest does not have any intangible assets with an indefinite useful life, or intangible assets not yet available for use.
(h) LeasesAqwest holds long term operating leases for telecommunications towers located at its facilities. Lease payments are receipted on a scheduled annual date and are generally indexed by the Consumer Price Index (CPI). The portion of lease income received in advance relating to a future financial year is shown as a liability (see note 25a ‘Payables’ and note 36 ‘Non cancellable operating lease revenue’).
(i) Financial instruments In addition to cash and bank overdraft, Aqwest has three categories of financial instruments: • Loans and receivables • Held-to-maturity investments (term deposits) • Financial liabilities measured at amortised costs.
These have been disaggregated into the following asset classes:
Financial assets Financial liabilitiesCash and cash equivalents PayablesReceivables WATC LoanTerm deposits
Initial recognition and measurement of financial instruments is at fair value, which normally equates to the transaction cost or face value. The fair value of short-term receivables and payables is the transaction cost or face value, because there is no interest rate applicable. And the effect of discounting is not material.
Held-to-maturity investments have been classified as short term where maturity terms are less than one year from the reporting date. Aqwest assesses at each balance date whether there is objective evidence that a financial asset or group of financial assets is impaired.
(j) Cash and cash equivalentsFor the purpose of the Statement of Cash Flows, cash and cash equivalent assets comprise cash in bank cheque accounts, and at call cash deposit account, petty cash and cash floats.
(k) InventoriesInventories are classified as held for distribution and are measured using the weighted average cost method. Inventories mainly consist of consumable engineering supplies and spare materials for use in the maintenance and operation of distribution and water treatment assets.
(l) Receivablesi) Trade receivables Receivables are recognised and carried at original invoice amount. The collectability of
receivables is reviewed on an ongoing basis. The carrying amount of trade receivables is equivalent to fair value, as the average collection period for outstanding debt is 42 Days (as at 30 June 2015).
53
AQW
EST
AN
NU
AL
REPO
RT 2
015
NOTES TO THE FINANCIAL STATEMENTS for the year ended 30 June 2015
(m) InvestmentsAqwest classifies its investments as held to maturity investments, comprising term deposits. Investments are initially recognised at cost, being the fair value of consideration given, including directly attributable transaction costs. As all term deposits have maturity dates within twelve months of the original investment date, their cost is equivalent to fair value and no amortisation is applied.
(n) PayablesPayables are recognised when Aqwest becomes obliged to make future payments as a result of a purchase of assets or services at the amounts payable. The carrying amount is equivalent to fair value, as they are generally settled within 30 days.
(o) BorrowingsAll loans payable are initially recognised at fair value, being the net proceeds received. Subsequent measurement is at amortised cost using the effective interest method.
(p) Accrued salaries and wagesAccrued salaries represent the amount due to staff but unpaid at the end of the financial year, as the end of the last pay period for that financial year does not coincide with the end of the financial year.
Accrued salaries are settled within a fortnight of the financial year end. Aqwest considers the carrying amount of accrued salaries to be equivalent to its net fair value. See note 25a ‘Payables’.
(q) Employee benefits provisions Employee benefits provisions are liabilities of uncertain timing and amount. Aqwest recognises a provision where there is a present legal, equitable or constructive obligation as a result of a past event and when the outflow of economic benefits is probable and can be measured reliably. Provisions are reviewed at the end of each reporting period.
i) Annual leave and Personal Leave Annual leave is not expected to be settled wholly within 12 months after the end of the
reporting period, is therefore considered to be ‘other long-term employee benefits’. The annual leave liability is recognised and measured at the present value of amounts expected
to be paid when the liabilities are settled using the remuneration rate expected to apply at the time of settlement.
When assessing expected future payments consideration is given to expected future wage and salary levels including non-salary components such as employer superannuation contributions, as well as the experience of employee departures and periods of service. The expected future payments are discounted using market yields at the end of the reporting period on national government bonds with terms to maturity that match, as closely as possible, the estimated future cash outflows.
The provision for annual leave is classified as a current liability, as Aqwest does not have an unconditional right to defer settlement of the liability for at least 12 months after the reporting period.
Personal leave entitlements for permanent employees are accumulating and partially vesting. The liability for personal leave is recognised only for the vesting component of entitlements.
ii) Rostered days off, Time in lieu The liability for rostered days off and time in lieu expected to be settled within 12 months
after the reporting period is recognised and measured at the undiscounted amounts expected to be paid when the liability is settled.
The provisions for rostered days off and time in lieu are classified as current liabilities, as Aqwest does not have an unconditional right to defer settlement of the liabilities for at least 12 months after the reporting period.
iii) Long service leave Long service leave is not expected to be settled wholly within 12 months after the end
of the reporting period and is therefore recognised and measured at the present value of amounts expected to be paid when the liabilities are settled using the remuneration rate expected to apply at the time of settlement.
When assessing expected future payments, consideration is given to expected future wage and salary levels including non-salary components such as employer superannuation contributions, as well as the experience of employee departures and periods of service. The expected future payments are discounted to present value using market yields at the
54AQ
WES
T A
NN
UA
L RE
PORT
201
5

NOTES TO THE FINANCIAL STATEMENTS for the year ended 30 June 2015
reporting date on national government bonds with terms to maturity that match, as closely as possible, the estimated future cash outflows.
Unconditional long service leave provisions are classified as current liabilities as Aqwest does
not have an unconditional right to defer settlement for at least 12 months after the end of the reporting period. Pre-conditional and conditional long service leave provisions are classified as non-current liabilities because Aqwest has an unconditional right to defer the settlement of the liability until the employee has completed the requisite years of service.
iv) Superannuation Aqwest does not participate in a defined benefits plan and as such, there is no
superannuation provision. Employer superannuation contributions relating to the employee benefits provisions are
included within the leave provision. The associated expense is included in other expenses (note 16), administration expenses (note 14) and cost of services (note 13).
(q) Other provisionsi) Employment on costs Employment on costs, including workers compensation insurance and payroll tax, are not
employee benefits and are recognised as expenses and liabilities when the employment to which they relate has occurred.
Employment on costs are shown at note 13 ‘Cost of services’ and at note 14 ‘Administration expenses’. The related liability is included in the provision for employment on costs.
ii) Superannuation Aqwest does not participate in a defined benefits plan, and as such, there is no related
superannuation provision.
(r) Superannuation expenseAqwest’s default fund for defined contribution plans is the WA Local Government Superannuation Plan. Employees have the option of electing the default plan or another plan of choice. The majority of Aqwest’s employees have plans with the default fund. The superannuation expense of the defined contribution plans is recognised as and when the contributions fall due.
(s) Comparative figuresComparative figures are, where appropriate, reclassified to be comparable with the figures presented in the current financial year.
(t) Reporting entityThe reporting entity comprises Bunbury Water Corporation (Aqwest). Aqwest is a corporation domiciled in Australia. The Corporation is a not-for-profit entity primarily involved in the provision of potable water services.
(u) DividendsDividends are recognised as a liability in the period in which they are declared. Aqwest’s first dividend as a Corporation will be declared in the 2015-2016 financial year. The dividend estimate is $1.218 milion, being 65% of profit after tax (excluding revenue from non cash capital contributions).
Note 3 – Other policies
(a) Assets and services received free of charge or for nominal cost Assets or services received free of charge that can be reliably measured are recognised as revenues and as assets at their equivalent fair value. For Aqwest, such resources are generally gifted mains pipeline from developers and are included at Note 9 ‘Developer Contributions’.
Note 4 – Judgements made by management in applying accounting policiesThe preparation of financial statements requires management to make judgements about the application of accounting policies that have a significant effect on the amounts recognised in the financial statements. Aqwest evaluates these judgements regularly.
55
AQW
EST
AN
NU
AL
REPO
RT 2
015

(a) Adoption of fair value versus cost basis for non current assets The Aqwest adopts the cost basis and fair value basis of accounting for valuing non-current physical assets. Gifted mains infrastructure assets are originally recognised at cost, based on the contractual value of the works transferred to Aqwest. Subsequent measurement of these assets utilises the revaluation model.
Note 5 – Key sources of estimation uncertaintyKey estimates and assumptions concerning the future are based on historical experience and various other factors that have a significant risk of causing a material adjustment to the carrying amount of assets and liabilities within the next financial year.
(a) Long service leave, Annual Leave and Personal Leave In calculating Aqwest’s long service leave, annual leave and personal leave provision, several estimations and assumptions have been made. These include discount rates, employee retention rates and expected future payments. Any changes in these estimations and assumptions may impact on the carrying amount of the long service leave provision.
Note 6 – Disclosure of changes in accounting policy and estimates
(a) Voluntary changes in accounting policy There were no voluntary changes in accounting policy applied in the 2014-2015 financial year.
(b) Initial application of an Australian Accounting Standard Aqwest has applied the following Australian Accounting Standards effective for annual reporting periods beginning on or after 1 July 2014 that impacted on Aqwest.
AASB 1031: Materiality This Standard supersedes AASB 1031 (February 2010), removing Australian guidance on
materiality not available in IFRSs and refers to guidance on materiality in other Australian pronouncements. There is no financial impact on Aqwest.
AASB 2013-3: Amendments to AASB 136 – Recoverable Amount Disclosures for Non Financial Assets This standard introduces editorial and disclosure changes. There is no financial impact on Aqwest.
Part B of this compiled Standard makes amendments to other Standards arising from the deletion of references to AASB 1031 in other Standards for periods beginning on or after 1 January 2014. It has no financial impact on Aqwest.
AASB 2014-1: Amendments to Australian Accounting Standards Part A of this Standard consists primarily of clarifications to Accounting Standards and has no financial impact for Aqwest.
Part B of this Standard has no financial impact on Aqwest as it does not contribute to Defined Benefit Plans.
Part C of this Standard has no financial impact on Aqwest as it removes references to AASB 1031 Materiality from a number of Accounting Standards.
(c) Future impact of Australian Accounting Standards not yet operative Aqwest has not early applied any of the following Australian Accounting Standards that have been issued that may impact Aqwest. Where applicable, Aqwest plans to apply these Australian Accounting Standards from their application date.
Operative for reporting periods beginning on/after 1 January 2015:
AASB 9 Financial Instruments This Standard supersedes AASB 139 Financial Instruments: Recognition and Measurement, introducing a number of changes to accounting treatments.
The mandatory application date of this Standard is currently 1 January 2018 after being amended by AASB 2012-6, AASB 2013-9 and AASB 2014-1 Amendments to Australian Accounting Standards. Aqwest has not yet determined the application or potential impact of the Standard.
NOTES TO THE FINANCIAL STATEMENTS for the year ended 30 June 2015
56AQ
WES
T A
NN
UA
L RE
PORT
201
5

AASB 15 Revenue from Contracts with Customers This Standard establishes the principles that the Aqwest shall apply to report useful information to users of financial statements about the nature, amount, timing and uncertainty of revenue and cash flows arising from a contract with a customer. Aqwest has not yet determined the application or potential impact of the Standard.
AASB 2010-7 Amendments to Australian Accounting Standards arising from AASB 9 (December 2010) [AASB 1, 3, 4, 5, 7, 101, 102, 108, 112, 118, 120, 121, 127, 128, 131, 132, 136, 137, 139, 1023 & 1038 and Int 2, 5, 10, 12, 19 & 127] This Standard makes consequential amendments to other Australian Accounting Standards and Interpretations as a result of issuing AASB 9 in December 2010. The mandatory application date of this Standard has been amended by AASB 2012-6 and AASB 2014-1 to 1 January 2018. Aqwest has not yet determined the application or potential impact of the Standard.
AASB 2013-9 Amendments to Australian Accounting Standards Conceptual Framework, Materiality and Financial Instruments. Part C of this omnibus Standard defers the application of AASB 9 to 1 January 2017. The application date of AASB 9 was subsequently deferred to 1 January 2018 by AASB 2014-1. Aqwest has not yet determined the application or the potential impact of AASB 9.
AASB 2014-1 Amendments to Australian Accounting Standards Part E of this Standard makes amendments to AASB 9 and consequential amendments to other Standards. Aqwest has not yet determined the application or potential impact of the Standard.
AASB 2014-4 Amendments to Australian Accounting Standards – Clarification of Acceptable Methods of Depreciation and Amortisation [AASB 116 & 138] The adoption of this Standard has no financial impact for Aqwest as depreciation and amortisation is not determined by reference to revenue generation, but by reference to consumption of future economic benefits.
AASB 2014-5 Amendments to Australian Accounting Standards arising from AASB 15 This Standard gives effect to the consequential amendments to Australian Accounting Standards (including Interpretations) arising from the issuance of AASB 15. Aqwest has not yet determined the application or potential impact of the Standard.
AASB 2014-7 Amendments to Australian Accounting Standards arising from AASB 9 (December 2014) This Standard gives effect to the consequential amendments to Australian Accounting
Standards (including Interpretations) arising from the issuance of AASB 9 (December 2014). Aqwest has not yet determined the application or potential impact of the Standard.
AASB 2014-8 Amendments to Australian Accounting Standards arising from AASB 9 (December 2014) – Application of AASB 9 (December 2009) and AASB 9 (December 2010) [AASB 9 (2009 & 2010)] This Standard makes amendments to AASB 9 Financial Instruments (December 2009) and AASB 9 Financial Instruments (December 2010), arising from the issuance of AASB 9 Financial Instruments in December 2014. Aqwest has not yet determined the application or potential impact of the Standard.
AASB 2015-1 Amendments to Australian Accounting Standards – Annual Improvements to Australian Accounting Standards 2012–2014 Cycle [AASB 1, 2, 3, 5, 7, 11, 110, 119, 121, 133, 134, 137 & 140] These amendments arise from the issuance of International Financial Reporting Standard Annual Improvements to IFRSs 2012–2014 Cycle in September 2014, and editorial corrections. Aqwest has not yet determined the application or potential impact of the Standard.
AASB 2015-2 Amendments to Australian Accounting Standards – Disclosure Initiative: Amendments to AASB 101 [AASB 7, 101, 134 & 1049] This Standard amends AASB 101 to provide clarification regarding the disclosure requirements in AASB 101. Specifically, the Standard proposes narrow-focus amendments to address some of the concerns expressed about existing presentation and disclosure requirements and to ensure entities are able to use judgement when applying a Standard in determining what information to disclose in their financial statements. There is no financial impact.
AASB 2015-3 Amendments to Australian Accounting Standards arising from the Withdrawal of AASB 1031 Materiality This Standard completes the withdrawal of references to AASB 1031 in all Australian Accounting Standards and Interpretations, allowing that Standard to effectively be withdrawn. There is no financial impact.
AASB 2015-6 Amendments to Australian Accounting Standards – Extending Related Party Disclosures to Not-for-Profit Public Sector Entities [AASB 10, 124 & 1049] The amendments extend the scope of AASB 124 to include application by not-for-profit public sector entities. Implementation guidance is included to assist application of the Standard by not-for-profit public sector entities. There is no financial impact.
NOTES TO THE FINANCIAL STATEMENTS for the year ended 30 June 2015
57
AQW
EST
AN
NU
AL
REPO
RT 2
015

NOTES TO THE FINANCIAL STATEMENTS for the year ended 30 June 2015
58AQ
WES
T A
NN
UA
L RE
PORT
201
5
2015 2014$ $
Note 7 – Water salesSupply charges 3,843,808 3,213,121
Consumption charges 8,549,506 7,273,073
Other water charges 695,504 585,851
Less: rebates given (a) (618,061) (500,773)
12,470,757 10,571,272(a) Comparative restated to include reimbursement from Department of Finance for Seniors Supply Fees, previously shown in Note 10.
Note 7b – Operating subsidies (a)
Pensioner and Senior consumption/supply rebates 479,000 -
479,000 -(a) Aqwest was first eligible for operating subsidies from the State Government in 2014/15, following corporatisation.
Note 8 – Interest revenueInterest from cash and cash equivalents 40,186 25,616
Interest from receivables 34,540 17,932
Interest from other financial assets 74,751 54,662
149,477 98,210
Note 9 – Developer contributionsContributions to headworks 727,694 251,620
Contributions to mains subdivisions 28,999 17,682
Transferred assets – non cash 236,302 -
992,995 269,302
2015 2014$ $
Note 10 – Other revenueLease income (a) 54,878 52,641
Other revenue (b) 70,337 67,991
125,215 120,632(a) See note 33 ‘Non cancellable operating lease revenue’.
(b) Comparative restated to exclude reimbursement from Department of Finance for Seniors Supply Fees, now shown in Note 7.
Note 11 – Operational expensesCost of servicesMaterials/Contractors 1,708,690 1,670,172
Electricity 567,603 637,656
Salaries and wages 1,135,519 1,044,218
Employee overheads 484,422 494,047
3,896,234 3,846,094
Depreciation 2,684,106 2,671,597
6,580,340 6,517,691
Note 12 – Cost of water salesCost of water sales (a) 1,758,687 1,871,760
1,758,687 1,871,760(a) Cost of water sales represents the costs incurred for water treatment, operation of
bores and reservoirs and the depreciation expense related to these processes.
These costs are included in note 11 ‘Operational expenses’.

NOTES TO THE FINANCIAL STATEMENTS for the year ended 30 June 2015
2015 2014$ $
Note 13 – Cost of servicesCost of services are allocated on a job basis as follows:Bore maintenance and operations 67,843 49,916Reservoir maintenance 57,489 107,346Reservoir leak repair contingency 57,262 55,979Treatment plant maintenance 288,008 363,163Mains maintenance 303,698 424,445Compliance water testing 168,940 181,914Leak detection 24,450 17,332Service maintenance 572,603 490,543Groundwater analysis 31,620 15,588Booster pump maintenance 30,641 38,016Treatment plant operations 219,814 210,097Chemical treatment 199,230 182,462Grounds maintenance 50,665 50,823Wages Operations Administration 394,753 255,964Private works 85,330 133,340New services – minor assets (c) 158,749 139,919Service replacement – minor assets 94,429 88,053Meter replacement – minor assets 258,519 181,862Valve replacement – minor assets (a) 102,549 -Gifted infrastructure – minor assets 69,952 -Electricity 567,603 637,656Other service expenses (b) 92,087 221,676
3,896,234 3,846,094
(a) Valve replacement was included in mains maintenance for 2014.
(b) Other services expenses includes consumables, tool box meetings and other minor projects.
(c) Service replacement was combined with new services in the 2014 financial statements.
2015 2014$ $
Note 14 – Administration expensesWrite offs 9,706 386Computer maintenance and software 337,993 312,924Insurance 112,438 56,565Legal expenses 15,758 25,572Salaries and wages 2,324,715 2,107,676Superannuation 237,971 208,936
3,038,581 2,712,059
Note 15 – Net (gain)/loss on disposal of non current assetsCost of disposal of non current assets: Plant, equipment and vehicles 177,620 41,369
Proceeds from disposal of non current assets: Plant, equipment and vehicles (139,790) (17,000)
Net (gain)/loss on disposal 37,830 24,369Impairment losses reversed - -
59
AQW
EST
AN
NU
AL
REPO
RT 2
015

NOTES TO THE FINANCIAL STATEMENTS for the year ended 30 June 2015
2015 2014$ $
Note 16 – Other expensesPublic relations 44,653 31,538
Audit expenses (a) 60,768 37,983
Corporate uniforms 15,502 12,719
Valuation expenses (b) 8,952 26,365
Administration building utilities 113,479 106,482
Postage, printing and stationary 94,154 113,754
Fringe benefits tax 28,977 20,734
Advertising and promotion (c) 28,276 31,185
Board expenses (d) 104,140 47,918
Administration building maintenance 97,837 88,800
Staff training (e) 67,171 47,589
Bank charges 24,204 28,112
Office expenses 103,994 20,544
Business development 97,877 20,743
Staff services program 29,039 31,308
Other 36,769 58,236
955,792 724,010
a) Includes contracted strategic internal audit service and remuneration of the Office of the Auditor General (OAG).
b) Includes asset revaluation consultancy.
c) Includes water conservation, publicity, customer survey and general advertising.
d) Includes directors remuneration, meeting expenses and travel and accommodation for directors.
e) Includes conference and seminar costs and associated travel and accommodation.
2015 2014$ $
Note 16a – Finance costsInterest expense 22,447 24,435
22,447 24,435
Note 17 – Gross cash salaries and wagesSalaries and wages by department:Finance and administration (a) 1,345,651 1,184,900
Water services administration (a) 896,563 857,549
Distribution and treatment operations (b) 1,353,531 1,147,905
Directors (c) 84,588 26,100
3,680,333 3,216,454
a) Included at note 14 ‘Administration expenses’ – salaries and wages.
b) Included at note 11 ‘Operational expenses’ - salaries and wages and employee overheads.
c) Included at note 16 ‘ Other expenses’ – Board expenses.
60AQ
WES
T A
NN
UA
L RE
PORT
201
5

2015 2014$ $
Note 18– Taxation equivalent
(a) Income tax expense
i) Current income tax: Current income tax charge 1,528,755 578,723
Under/(over) provisions in prior periods (12,815) -
ii) Deferred income tax: Relating to origination and reversal of temporary differences
(43,665) 116,862
Income tax expense 1,472,275 695,586
(b) Amounts recognised directly in equity
i) Deferred income tax:Fair value adjustments to property, plant and equipment (401,872) (1,524,578)
Income tax expense reported in equity (401,872) (1,524,578)
2015 2014$ $
(c) Reconciliation of income tax expense to prima facie tax payable
Profit before income tax equivalents 3,582,454 1,056,858
Tax at the statutory rate of 30% (2014: 30%) 1,074,736 317,057
Under/(over) provisions in prior periods (12,815) -
Tax effects of amounts which are not deductible in calculating taxable income 8,323 6,460
Temporary differences now brought to account 402,031 513,817
Tax loss carried forward - (141,748)
Income tax expense reported in Statement of Comprehensive Income 1,472,275 695,586
NOTES TO THE FINANCIAL STATEMENTS for the year ended 30 June 2015
61
AQW
EST
AN
NU
AL
REPO
RT 2
015

NOTES TO THE FINANCIAL STATEMENTS for the year ended 30 June 2015
(d) Deferred tax Assets Liabilities Net
Deferred tax assets and liabilities are attributable to the following:2015 2014 2015 2014 2015 2014
$ $ $ $ $ $
Fair value adjustments to property, plant and equipment - 10,005,437 10,416,072 10,005,437 10,416,072
Current tax liability adjustment - (176,210) - - - (176,210)
Interest receivable - - 4,760 2,160 4,760 2,160
Deferred developer contributions - - 118,874 132,568 118,874 132,568
Employee entitlements (236,950) (213,142) - - (236,950) (213,142)
Tax (assets)/liabilities (236,950) (389,352) 10,129,071 10,550,800 9,892,121 10,161,448
Set off of tax 236,950 389,352 (236,950) (389,352) - -
Net tax liabilities - - 9,892,121 10,161,448 9,892,121 10,161,448
Note 18 continued – Taxation equivalent
Movement in temporary differences during the year 2015:
Balance 1 July Recognised in income Recognised in equity Balance
30 June$ $ $ $
Fair value adjustments to property, plant and equipment 10,416,072 (8,762) (401,873) 10,005,437
Current tax liability adjustment (176,210) - 176,210 -
Interest receivable 2,160 2,600 - 4,760
Deferred developer contributions 132,568 (13,694) - 118,874
Employee entitlements (213,142) (23,808) - (236,950)
10,161,448 (43,664) (225,663) 9,892,121Movement in temporary differences during the year 2014:Fair value adjustments to property, plant and equipment 8,874,243 17,251 1,524,578 10,416,072
Current tax liability adjustment (176,210) - - (176,210)
Interest receivable 520 1,640 - 2,160
Tax losses carried forward (141,749) 141,749 - -
Deferred developer contributions 154,345 (21,777) - 132,568
Employee entitlements (191,140) (22,001) - (213,142)
8,520,008 116,862 1,524,578 10,161,448
62AQ
WES
T A
NN
UA
L RE
PORT
201
5

2015 2014$ $
Note 19 – Other financial assetsCurrentHeld to maturity investments:
Operating account 1,250,000 500,000
Computer upgrade reserve 250,000 220,000
Asset replacement reserve 700,000 -
Headworks reserve 815,000 159,000
Subdivision reserve 222,310 206,000
Business development reserve 550,000 615,000
3,787,310 1,700,000Non CurrentHeld to maturity investments:
Operating account 750,000 -
750,000 -
Total Other Financial Assets 4,537,310 1,700,000
2015 2014$ $
Note 20 – ReceivablesCurrentTrade debtors 1,458,202 1,381,609GST receivable 41,093 25,871Sundry debtors 82,080 61,017Accrued interest 15,865 7,201Pensioner rate deferrals* 11,226 13,412Total receivables 1,608,466 1,489,110
*Deferred rates are those that are owed by a property owner but legislation allows the owner to delay payments until the property is sold.
Note 21 – InventoriesInventories held for distribution (at cost) 508,637 585,343
508,637 585,343
Note 22 – Other assetsCurrentPrepayments 87,122 78,673Current tax asset - 121,947
87,122 200,620
Non currentWork in progress 526,078 491,579
526,078 491,579
NOTES TO THE FINANCIAL STATEMENTS for the year ended 30 June 2015
63
AQW
EST
AN
NU
AL
REPO
RT 2
015

NOTES TO THE FINANCIAL STATEMENTS for the year ended 30 June 2015
2015 2014$ $
Land at fair value 5,311,136 5,311,136
Buildings at fair value 5,134,307 5,131,449Accumulated depreciation (1,387,113) (1,267,270)
3,747,194 3,864,179
Mains at fair value 78,527,594 77,744,485Accumulated depreciation (28,055,078) (27,063,731)
50,472,516 50,680,754
Treatment plants at fair value 8,843,718 8,430,542Accumulated depreciation (4,254,080) (3,952,260)
4,589,638 4,478,282
Reservoirs at fair value 28,685,288 27,459,979Accumulated depreciation (10,602,054) (10,065,348)
18,083,234 17,394,631
Bores and pumps fair value 6,663,688 6,633,166Accumulated depreciation (1,892,905) (1,506,530)
4,770,783 5,126,636
2015 2014$ $
Services at fair value 195,229 -Accumulated depreciation (8,673) -
186,556 -
Plant and equipment at cost 1,837,442 1,827,686Accumulated depreciation (1,016,911) (868,028)
820,531 959,658
Motor vehicles at cost 775,903 826,722Accumulated depreciation (318,878) (325,310)
457,025 501,412
Office equipment at cost * 812,329 865,711Accumulated depreciation (637,542) (539,371)
174,787 326,340
Tools at cost 22,775 22,775Accumulated depreciation (18,629) (18,036)
4,146 4,739
Total property, plant and equipment 88,617,546 88,647,766
*Includes intangible assets of $147,710 (written down value, 2014 = $288,908).
Note 23 – Property, plant and equipment
64AQ
WES
T A
NN
UA
L RE
PORT
201
5

Note 23 continued – Property, plant and equipmentReconciliations of the carrying amounts of property, plant and equipment at the beginning and end of the reporting period are set out in the table below:
Carrying amount at
start of yearAdditions Disposals
Transfers between
categories
Revaluation increments
(decrements) to asset
revaluation reserve
Revaluation increments
(decrements) to income statement
Impairment losses
Impairment losses
reversedDepreciation
Carrying amount at end of year
2015 $ $ $ $ $ $ $ $ $ $
Land at fair value 5,311,136 - - - - - - - - 5,311,136
Buildings at fair value 3,864,178 2,859 - - - - - - (119,843) 3,747,194
Mains at fair value 50,680,756 834,285 - (56,057) - - - - (986,667) 50,472,516
Treatment plants at fair value 4,478,284 360,983 - - - - - - (249,629) 4,589,638
Reservoirs at fair value 17,394,631 1,225,309 - - - - - - (536,706) 18,083,234
Bores and pumps at fair value 5,126,636 30,522 - - - - - - (386,375) 4,770,783
Services at fair value 137,149 - 56,057 - - - - (6,650) 186,556
Plant and equipment at cost 959,656 9,758 - - - - - - (148,883) 820,531
Motor vehicles at cost 501,411 225,435 (177,620) - - - - - (92,201) 457,025
Office equipment at cost 326,338 5,007 - - - - - - (156,558) 174,787
Tools at cost 4,740 - - - - - - - (592) 4,146
TOTALS 88,647,766 2,831,307 (177,620) - - - - - (2,684,104) 88,617,546
NOTES TO THE FINANCIAL STATEMENTS for the year ended 30 June 2015
65
AQW
EST
AN
NU
AL
REPO
RT 2
015
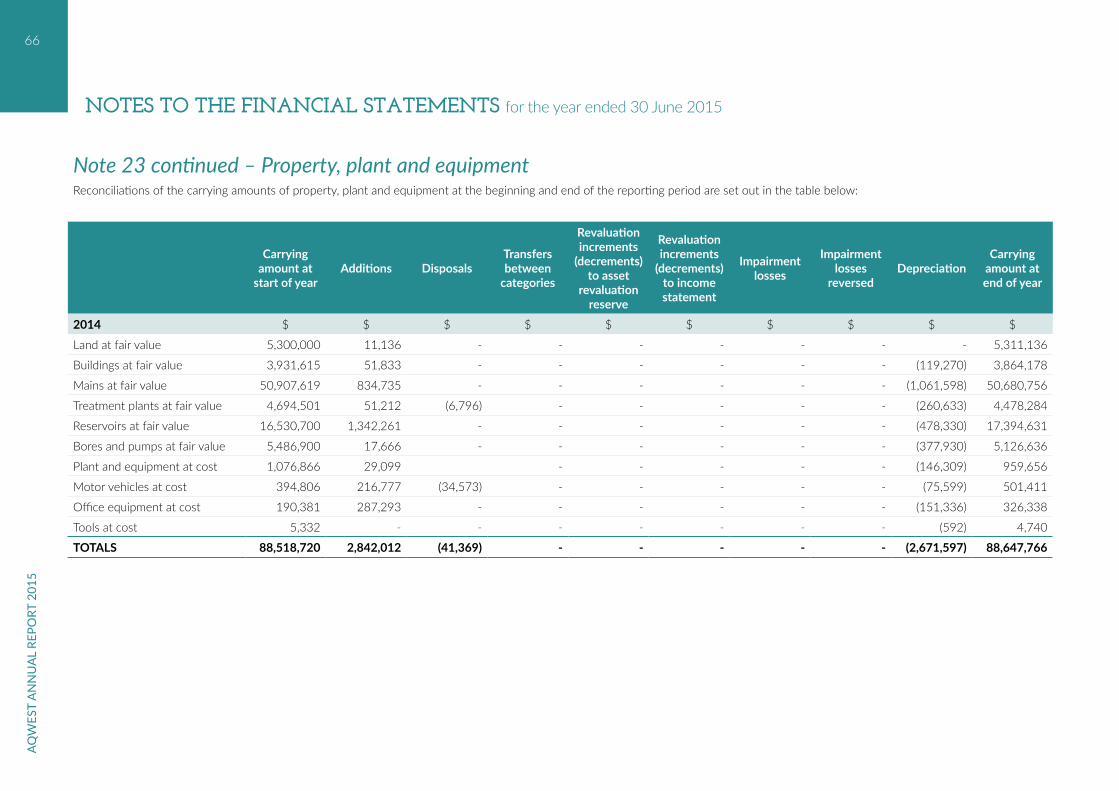
NOTES TO THE FINANCIAL STATEMENTS for the year ended 30 June 2015
Note 23 continued – Property, plant and equipmentReconciliations of the carrying amounts of property, plant and equipment at the beginning and end of the reporting period are set out in the table below:
Carrying amount at
start of yearAdditions Disposals
Transfers between
categories
Revaluation increments
(decrements) to asset
revaluation reserve
Revaluation increments
(decrements) to income statement
Impairment losses
Impairment losses
reversedDepreciation
Carrying amount at end of year
2014 $ $ $ $ $ $ $ $ $ $
Land at fair value 5,300,000 11,136 - - - - - - - 5,311,136
Buildings at fair value 3,931,615 51,833 - - - - - - (119,270) 3,864,178
Mains at fair value 50,907,619 834,735 - - - - - - (1,061,598) 50,680,756
Treatment plants at fair value 4,694,501 51,212 (6,796) - - - - - (260,633) 4,478,284
Reservoirs at fair value 16,530,700 1,342,261 - - - - - - (478,330) 17,394,631
Bores and pumps at fair value 5,486,900 17,666 - - - - - - (377,930) 5,126,636
Plant and equipment at cost 1,076,866 29,099 - - - - - (146,309) 959,656
Motor vehicles at cost 394,806 216,777 (34,573) - - - - - (75,599) 501,411
Office equipment at cost 190,381 287,293 - - - - - - (151,336) 326,338
Tools at cost 5,332 - - - - - - - (592) 4,740
TOTALS 88,518,720 2,842,012 (41,369) - - - - - (2,671,597) 88,647,766
66AQ
WES
T A
NN
UA
L RE
PORT
201
5

NOTES TO THE FINANCIAL STATEMENTS for the year ended 30 June 2015
Note 23a – Fair Value Measurement
Assets measured at fair value Level 1 Level 2 Level 3 Fair Value2015Land at fair value - 2,770,000 2,541,136 5,311,136
Buildings at fair value - 1,700,356 2,046,838 3,747,194
Mains at fair value - - 50,472,516 50,472,516
Services at fair value - - 186,556 186,556
Treatment plants at fair value - - 4,589,638 4,589,638
Reservoirs at fair value - - 18,083,234 18,083,234
Bores and pumps at fair value - - 4,770,783 4,770,783
- 4,470,356 82,690,701 87,161,057 There were no transfers between Levels 1, 2 or 3 during the period.
Valuation techniques to derive Level 2 fair values
Level 2 fair values of Non- current assets held for sale, Land and Buildings (Office Accommodation) are derived using the market approach. Market evidence of sales prices of comparable land and buildings (office accommodation) in close proximity is used to determine price per square metre.
Non-current assets held for sale have been written down to fair value less costs to sell. Fair value has been determined by reference to market evidence of sales prices of comparable assets.
Assets measured at fair value Level 1 Level 2 Level 3 Fair Value2014Land at fair value - 2,770,000 2,541,136 5,311,136
Buildings at fair value - 1,767,593 2,096,585 3,864,178
Mains at fair value - - 50,680,756 50,680,756
Services at fair value - - - -
Treatment plants at fair value - - 4,478,284 4,478,284
Reservoirs at fair value - - 17,394,631 17,394,631
Bores and pumps at fair value - - 5,126,636 5,126,636
- 4,537,593 82,318,028 86,855,621
67
AQW
EST
AN
NU
AL
REPO
RT 2
015

NOTES TO THE FINANCIAL STATEMENTS for the year ended 30 June 2015
68AQ
WES
T A
NN
UA
L RE
PORT
201
5
Note 23a Continued – Fair Value Measurement Fair Value measurements using significant unobservable inputs (Level 3) 2015 Land Buildings Mains Services Treatment
plants Reservoirs Bores and pumps
Fair Value at start of period 2,541,136 2,096,585 50,680,756 - 4,478,284 17,394,631 5,126,636Additions - - 834,285 137,149 360,983 1,225,309 30,522Revaluation increments/(decrements) recognised in Profit or Loss - - - - - - -Revaluation increments/(decrements) recognised in Other Comprehensive Income
- - - - - - -
Transfers (from/(to) Level 2) - - - - - - -Transfers between categories - - (56,057) 56,057 - - -Disposals - - - - - - -Depreciation Expense - (49,748) (986,667) (6,650) (249,629) (536,706) (386,375)Fair value at end of period 2,541,136 2,046,838 50,472,516 186,556 4,589,638 18,083,234 4,770,783Total gains or losses for the period included in profit or loss, under ‘Other Gains’ - - - - - - -Change in unrealised gains or losses for the period included in profit or loss for assets held at the end of the reporting period.
- - - - - - -
Fair Value measurements using significant unobservable inputs (Level 3) 2014 Land Buildings Mains Services Treatment plants Reservoirs Bores and
pumps Fair Value at start of period 2,530,000 2,094,500 50,907,619 - 4,694,501 16,530,700 5,486,900Additions 11,136 51,833 834,735 51,212 1,342,261 17,666Revaluation increments/(decrements) recognised in Profit or Loss - - - - - - -Revaluation increments/(decrements) recognised in Other Comprehensive Income
- - - - - - -
Transfers (from/(to) Level 2) - - - - - - -Disposals - - - - (6,796) - -Depreciation Expense - (49,748) (1,061,598) - (260,633) (478,330) (377,930)Fair value at end of period 2,541,136 2,096,585 50,680,756 - 4,478,284 17,394,631 5,126,636Total gains or losses for the period included in profit or loss, under ‘Other Gains’ - - - - - - -Change in unrealised gains or losses for the period included in profit or loss for assets held at the end of the reporting period.
- - - - - - -

NOTES TO THE FINANCIAL STATEMENTS for the year ended 30 June 2015
Note 23a Continued – Fair Value Measurement
Valuation Processes
There were no changes in valuation techniques during the period.
Transfers in and out of a fair value level are recognised in the date of the event or change in circumstances that caused the transfer. Transfers are generally limited to assets newly classified as non-current assets held for sale as Treasurer’s instructions require valuations of land, buildings and infrastructure to be categorised within Level 3 where valuations will utilise significant Level 3 inputs on a recurring basis.
Fair value for existing use specialised buildings and infrastructure assets is determined by reference to the cost of replacing the remaining future economic benefits embodied in the asset, i.e. the depreciated replacement cost.
Depreciated replacement cost is the current replacement cost of an asset less accumulated depreciation calculated on the basis of such cost to reflect the already consumed or expired economic benefit, or obsolescence, and optimisation (where applicable) of the asset.
Current replacement cost is generally determined by reference to the market observable replacement cost of a substitute asset of comparable utility and the gross project size specifications.
For some specialised buildings and infrastructure assets, the current replacement cost is determined by reference to the historical cost adjusted by relevant indices.
Fair value for restricted use land is based on market value, by either using market evidence of sales of comparable land that is unrestricted less restoration costs to return the site to a vacant and marketable condition (low restricted use land), or, comparison with market evidence for land with low level utility (high restricted use land).
Significant Level 3 Inputs used by Aqwest are derived and evaluated as follows:
Consumed economic benefit/obsolescence of asset These are estimated by AON Valuation Services.
Selection of Land with restricted utility Fair Value for restricted use land is determined by comparisons with Market evidence for land with low level utility. Relevant comparators of land with low level utility are selected by AON Valuation Services.
Basis of Valuation
In the absence of market-based evidence, due to the specialised nature of some non-financial assets, these assets are valued at Level 3 of the fair value hierarchy on an existing use basis. The existing use basis recognises that restrictions or limitations have been placed on their use and disposal when they are not determined to be surplus to requirements. These restrictions are imposed by virtue of the assets being held to deliver a specific community service and Aqwest’s enabling legislation.
69
AQW
EST
AN
NU
AL
REPO
RT 2
015

NOTES TO THE FINANCIAL STATEMENTS for the year ended 30 June 2015
Note 23a Continued – Fair Value Measurement
Information about significant unobservable inputs (Level 3) in fair value measurements
Description Fair Value
2015 ($000)
Fair Value 2014
($000)
Valuation technique(s) Unobservable inputs
Range of unobservable inputs (weighted average)
2015
Range of unobservable inputs (weighted average)
2014
Relationship of unobservable inputs to fair value
Land $2,541 $2,541 Market comparison approach
Restriction of Use Discount Selection of Land with similar approximate utility
$20 - $225 m² ($114 per m²)
$20 - $225 m² ($114 per m²)
Higher value of similar land increases estimated fair value.
Buildings $2,047 $2,097 Depreciated Replacement Cost
Consumed economic benefit/obsolescence of asset.
0.04% - 0.81% (0.06%)
0.04% - 0.59% (0.06%)
Greater consumption of economic benefit or increased obsolescence lowers fair value.
Mains $50,473 $50,681 Depreciated replacement cost
Consumed economic benefit/obsolescence of asset.
0.00% - 3.33% (0.03%)
0.00% - 2.78% (0.03%)
Greater consumption of economic benefit or increased obsolescence lowers fair value.
Services $187 - Depreciated replacement cost
Consumed economic benefit/obsolescence of asset.
0.11% - 0.26% (0.22%)
- Greater consumption of economic benefit or increased obsolescence lowers fair value.
Treatment plants $4,590 $4,478 Depreciated replacement cost
Consumed economic benefit/obsolescence of asset.
0.00% - 16.67% (0.21%)
0.00% - 11.11% (0.17%)
Greater consumption of economic benefit or increased obsolescence lowers fair value.
Reservoirs $18,083 $17,395 Depreciated replacement cost
Consumed economic benefit/obsolescence of asset.
0.00% - 1.52% (0.07%)
0.00% - 0.25% (0.06%)
Greater consumption of economic benefit or increased obsolescence lowers fair value.
Bores and pumps $4,771 $5,127 Depreciated replacement cost
Consumed economic benefit/obsolescence of asset.
0.00% - 5.00% (0.26%)
0.00% - 5.00% (0.23%)
Greater consumption of economic benefit or increased obsolescence lowers fair value.
Reconciliations of opening and closing balances are provided in note 23.
70AQ
WES
T A
NN
UA
L RE
PORT
201
5

NOTES TO THE FINANCIAL STATEMENTS for the year ended 30 June 2015
2015 2014$ $
Note 24 – Impairment of assets There were no indications of impairment to property, plant and equipment, infrastructure or intangible assets at 30 June 2015. Aqwest held no goodwill or intangible assets with an indefinite useful life during the reporting period.
At the end of the reporting period, there were no intangible assets not yet available for use. All surplus assets at 30 June 2015 have either been classified as assets held for sale or written-off.
Note 25a - PayablesCurrentTrade creditors 1,035,840 950,633
Accrued salaries and wages (a) - 113,769
Income in advance 31,219 29,906
1,067,059 1,094,308
(a) The last day of the 2014 pay year was 30 June 2015.
2015 2014$ $
Note 25b - BorrowingsCurrentAccrued interest 1,828 2,243
Western Australian Treasury Corporation (WATC) loan 55,217 53,183
57,045 55,426Non currentWestern Australian Treasury Corporation (WATC) loan 450,376 505,592
450,376 505,592
Note 25c – Current tax liabilities
Current tax liability 696,159 -
696,159 -
71
AQW
EST
AN
NU
AL
REPO
RT 2
015

NOTES TO THE FINANCIAL STATEMENTS for the year ended 30 June 2015
2015 2014$ $
Note 26 - Provisions(a) Current(i) Employee benefits provisions:Annual leave (a) 239,323 223,239
Long service leave (b) 290,386 269,557
Rostered days off (c) 5,368 4,403
Time in lieu (c) 21,722 17,666
Personal leave (d) 119,914 99,578
676,713 614,443
(ii) Other provisions:Employment on costs (e) 50,784 44,196
Total current provisions 727,497 658,639
(b) Non current(i) Employee benefits provisions:Long service leave (b) 61,595 52,302
(ii) Other provisions:Employment on costs (e) 8,831 7,621
Total non current provisions 70,426 59,923
a) Annual leave liabilities have been classified as current as there is no unconditional right to defer settlement for at least 12 months after the reporting period. Assessments indicate that actual settlement of liabilities will occur within 12 months of the reporting period.
2015 2014$ $
(b) Long service leave liabilities have been classified as current where there is no unconditional right to defer settlement for at least 12 months after the reporting period. Assessments indicate that actual settlement of the liabilities will occur as follows:
Within 12 months of reporting period 56,317 49,630
More than 12 months after reporting period 295,664 272,229
351,981 321,859
(c) Rostered days off and time in lieu liabilities have been classified as current as there is no unconditional right to defer settlement for at least 12 months after reporting date. Assessments indicate that actual settlement of the liabilities will occur within 12 months of the reporting period.
(d) Personal leave liabilities have been classified as current as there is no unconditional right to defer settlement for at least 12 months after the reporting period. Assessments indicate that actual settlement of the liabilities will occur as follows:
Within 12 months of reporting period 19,523 15,354
More than 12 months after reporting period 100,391 84,224
119,914 99,578
(e) The settlement of annual leave, long service leave, rostered days off and time in lieu liabilities gives rise to the payment of employment on costs including workers’ compensation premiums and payroll tax. The provision is measured at the present value of expected future payments. The associated expense is included in and costs of services (note 13), administration expenses (note 14) and all other expenses (note 16).
72AQ
WES
T A
NN
UA
L RE
PORT
201
5

NOTES TO THE FINANCIAL STATEMENTS for the year ended 30 June 2015
2015 2014$ $
Note 27 – Deferred tax liabilitiesDeferred tax liabilities 9,892,121 10,161,448
9,892,121 10,161,448
Note 28 – ReservesAqwest maintains the following reserves:
(a) Cash reservesComputer upgrade reserve (to provide for future upgrades of Aqwest’s information, communication and technology systems)
Balance at start of period 244,292 218,597
Transfers to reserve 59,433 105,753
Transfers from reserve (10,868) (80,058)
Balance at end of period 292,857 244,292
Asset replacement reserve (to cater for the ongoing replacement of Aqwest’s capital infrastructure)
Balance at start of period - 35,267
Transfers to reserve 2,608,646 1,878,581
Transfers from reserve (1,903,032) (1,913,847)
Balance at end of period 705,613 -
2015 2014$ $
Headworks reserve (to fund augmentation works to service growth requirements)
Balance at start of period 207,364 348,776
Transfers to reserve 738,405 237,950
Transfers from reserve (113,308) (379,362)
Balance at end of period 832,461 207,364
Mains subdivision reserve (to fund subdivisional development)
Balance at start of period 222,626 222,250
Transfers to reserve 36,588 24,366
Transfers from reserve (17,167) (23,990)
Balance at end of period 242,047 222,626
Business development reserve (to fund future business development)
Balance at start of period 634,432 673,587
Transfers to reserve 21,953 22,747
Transfers from reserve (102,747) (61,903)
Balance at end of period 553,639 634,432
Total reserves:Total opening balances 1,308,714 1,498,477
Total transfers to reserves 3,465,025 2,269,394
Total transfers from reserves (2,147,122) (2,459,158)
Total cash reserves 2,626,617 1,308,714
73
AQW
EST
AN
NU
AL
REPO
RT 2
015

NOTES TO THE FINANCIAL STATEMENTS for the year ended 30 June 2015
2015 2014
$ $
Note 28 continued– Reserves(b) Asset revaluation reserveBalance at start of period 50,635,413 51,608,865
Gains/(losses) from asset revaluation - -
Tax effect of revaluation (increments)/ decrements 314,440 (973,452)
Balance at end of period 50,949,853 50,635,413
Total reserves 53,576,468 51,944,125
(c) Retained EarningsBalance at Start of period 29,446,751 29,446,840
Result for the period 2,110,180 361,273
Income and expense recognised directly
in equity (a) (88,778) (551,126)
Transfers to Reserves (3,465,025) (2,269,394)
Transfers from Reserves 2,147,122 2,459,158
Balance at end of period 30,150,250 29,446,751Total Equity at end of period 83,726,718 81,390,876
(a) Relates to tax effect on non current assets which have depleted reserves and therefore recognised directly in retained earnings.
Note 29 – Financial instruments
(a) Financial risk management objectives and policies
Financial instruments held by Aqwest are cash and cash equivalents, receivables, held-to-maturity investments, payables, and WATC borrowings. Aqwest has limited exposure to financial risks. Aqwest’s overall risk management program focuses on managing the risks identified below.
(i) Credit risk
Credit risk arises when there is the possibility of Aqwest’s receivables defaulting on their contractual obligations, resulting in a financial loss to Aqwest.
The maximum exposure to credit risk at the end of the reporting period in relation to each class of recognised financial assets is the carrying amount of those assets as shown in the table at note 29(c).
All debts pertaining to water sales are secured against the land to which debts relate. Receivable balances are monitored on an ongoing basis with the result that Aqwest’s’ exposure to bad debts is minimal. At the end of the reporting period, there were no significant concentrations of credit risk.
(ii) Liquidity risk
Liquidity risk arises when Aqwest is unable to meet its financial obligations as they fall due. Aqwest is exposed to liquidity risk through its trading in the normal course of business.
Aqwest’s objective is to maintain sufficient cash assets on hand to meets its debts as and when they fall due, with flexibility available through the use of a bank overdraft facility. Aqwest has sufficient financial assets and appropriate procedures to manage cash flows by monitoring forecast cash flows to ensure that sufficient funds are available to meet its commitments.
74AQ
WES
T A
NN
UA
L RE
PORT
201
5

NOTES TO THE FINANCIAL STATEMENTS for the year ended 30 June 2015
Note 29 continued – Financial instruments(iii) Market risk
Market risk is the risk that changes in market prices such as foreign exchange rates and interest rates will affect Aqwest’s income or the value of its holdings of financial instruments.
Aqwest does not trade in foreign currency and is not materially exposed to other price risks (for example, equity securities or commodity price changes). Aqwest exposure to market risk for changes in interest rates relates primarily to short and long term cash investments.
All of Aqwest’s investments are at fixed interest rates with varying maturity periods. The risk is managed though portfolio diversification and variation in maturity dates. Portfolio diversification is limited to investments with financial institutions with a Standard and Poor’s credit rating of ‘A’ or greater.
All borrowings are with the Western Australian Treasury Corporation (WATC) and are repayable at fixed rates with varying maturities. Other than as detailed in the interest rate sensitivity analysis table at note 29(d), Aqwest is not exposed to interest rate risk because the majority of cash, cash equivalents and restricted cash are non-interest bearing and Aqwest has no borrowings other than WATC borrowings (fixed interest rate).
2015 2014$ $
(b) Categories of financial instruments
In addition to cash, the carrying amounts of each of the following categories of financial assets and financial liabilities at the end of the reporting period are as follows:
Financial assetsCash and cash equivalents 802,242 811,794
Receivables (a) 1,567,373 1,463,239
Held to maturity investments 4,537,310 1,700,000
6,906,925 3,975,033Financial liabilitiesPayables (b) 1,035,840 1,064,402
WATC loan 507,421 561,018
1,543,261 1,625,420
(a) The amount of receivables excludes GST recoverable from the Australian Taxation
Office (statutory receivable).
(b) The amount of payables excludes income received in advance.
75
AQW
EST
AN
NU
AL
REPO
RT 2
015

NOTES TO THE FINANCIAL STATEMENTS for the year ended 30 June 2015
Note 29 continued – Financial instruments
(c) Financial instrument disclosures
(i) Credit riskAqwest’s maximum exposure to credit risk at the end of the reporting period is the carrying amount of financial assets as shown below. The table discloses the ageing of financial assets that are past due but not impaired, based on information provided to senior management of Aqwest.
Past due but not impaired
Ageing analysis of financial assets: Carrying amount $
Not past due (current)
Not past due (deferred) (b)
Less than one year $
One year or more $
2015Cash and cash equivalents 802,242 - - - -Receivables (a) 1,567,373 1,417,781 11,226 50,652 87,717Held to maturity investments 4,537,310 - - - -
6,906,925 1,417,781 11,226 50,652 87,717
2014Cash and cash equivalents 811,794 - - - -Receivables (a) 1,463,239 1,324,781 13,412 125,046 -Held to maturity investments 1,700,000 - - - -
3,975,033 1,324,781 13,412 125,046 -
(a) The amount of receivables excludes the GST recoverable from the Australian Taxation Office (statutory receivable).(b) Pensioners are not required to pay rates issues as they are billed.
The collection of such rates is ultimately deferred until the property changes ownership from the pensioner’s title. These amounts are shown at note 20 ‘Receivables’ as non-current trade debtors.
76AQ
WES
T A
NN
UA
L RE
PORT
201
5

NOTES TO THE FINANCIAL STATEMENTS for the year ended 30 June 2015
Note 29 continued – Financial instruments
(c) Financial instrument disclosures continued
(ii) Liquidity risk and interest rate riskThe following table discloses Aqwest’s maximum exposure to interest rate risk and a contractual maturity analysis of financial assets and liabilities. The contractual maturity amounts in the table are representative of the undiscounted amounts at the end of the reporting period. Adjustments for discounting have not been made due to immateriality. The interest rate exposure section analyses only the carrying amounts of each item. Aqwest does not hold any collateral as security or other credit enhancements relating to the financial assets it holds. Aqwest does not hold any financial assets that had to have their terms renegotiated that would have otherwise resulted in them being past due. The maturity analysis section includes principal cash flows only.
Interest rate exposure Maturity date
2015
Weighted average
interest rate %
Carrying amount
$
Variable interest rate
$
Non interest bearing
$
Fixed interest rate
$
Up to 3 months
$
3 months to 12 months
$
1 – 2 years $
More than 2 years
$
Financial assetsCash and cash equivalents 2.11% 802,242 800,742 1,500 - 802,242 - - -Receivables (a) - 1,567,373 - 1,567,373 - 1,567,373 - - -Held to maturity investments 3.39% 4,537,310 - - 4,537,310 3,787,310 - - 750,000
6,906,925 800,742 1,568,873 4,537,310 6,156,925 - - 750,000Financial liabilitiesWATC loan 3.77% 507,421 - - 507,421 13,611 41,606 57,328 394,876Payables (b) - 1,035,840 - 1,035,840 - 1,035,840 - - -
1,543,261 - 1,035,840 507,421 1,049,451 41,606 57,328 394,876
(a) The amount of receivables excludes the GST recoverable from the Australian Taxation Office (statutory receivable).(b) The amount of payables excludes income received in advance.
77
AQW
EST
AN
NU
AL
REPO
RT 2
015

NOTES TO THE FINANCIAL STATEMENTS for the year ended 30 June 2015
Note 29 continued – Financial instruments
(c) Financial instrument disclosures continued
(ii) Liquidity risk and interest rate risk continued
Interest rate exposure Maturity date
2014
Weighted average
interest rate %
Carrying amount
$
Variable interest rate
$
Non interest bearing
$
Fixed interest rate
$
Up to 3 months
$
3 months to 12 months
$
1 – 2 years $
More than 2 years
$
Financial assetsCash and cash equivalents 2.28% 811,794 810,294 1,500 - 811,794 - - -Receivables (a) - 1,463,239 - 1,463,239 - 1,463,239 - - -Held to maturity investments 3.80% 1,700,000 - - 1,700,000 1,700,000 - - -
3,975,033 810,294 1,464,739 1,700,000 3,975,033 - - -Financial liabilitiesWATC Loan 3.77% 561,018 - - 561,018 15,352 40,074 55,217 450,376Payables (b) - 1,064,402 - 1,064,402 - 1,064,402 - - -
1,625,420 - 1,064,402 561,018 1,079,754 40,074 55,217 450,376
(a) The amount of receivables excludes the GST recoverable from the ATO (statutory receivable).(b) The amount of payables excludes income received in advance.
(d) Fair values All financial assets and liabilities recognised in the Statement of Financial Position, whether they are carried at cost or fair value, are recognised at amounts that represent a reasonable approximation of fair value unless otherwise stated in the applicable notes.
78AQ
WES
T A
NN
UA
L RE
PORT
201
5

NOTES TO THE FINANCIAL STATEMENTS for the year ended 30 June 2015
Note 29 continued – Financial instruments
(d) Interest rate sensitivity analysisThe following table represents a summary of the interest rate sensitivity of Aqwest’s financial assets and liabilities at the end of the reporting period on the surplus for the period and equity for a 1% change in interest rates. It is assumed that the change in interest rates is held constant throughout the reporting period.
- 1% change + 1 % change
2015 Carrying amount$
Profit$
Equity$
Profit$
Equity$
Financial assetsCash and cash equivalents 800,742 (8,007) (8,007) 8,007 8,007Other financial assets 4,537,310 (45,373) (45,373) 45,373 45,373
Financial liabilitiesWATC Loan 507,421 (5,074) (5,074) 5,074 5,074
Total increase/(decrease) (58,454) (58,454) 58,454 58,454
2014Financial assetsCash and cash equivalents 810,294 (8,103) (8,103) 8,103 8,103Other financial assets 1,700,000 (17,000) (17,000) 17,000 17,000
Financial liabilitiesAll non interest bearing 561,018 (5,610) (5,610) 5,610 5,610
Total increase/(decrease) (30,713) (30,713) 30,713 30,713
(e) Fair Values All financial assets and liabilities recognised in the statement of financial position, whether they are carried at cost or fair value, are recognised at amounts that represent a reasonable approximation of fair value unless otherwise stated in the applicable notes.
79
AQW
EST
AN
NU
AL
REPO
RT 2
015

2015 2014
$ $
Note 30 – Notes to the Statement of Cash Flows(a) Reconciliation of cash
Cash at the end of the financial period, as shown in the Statement of Cash Flows, is reconciled to the related items in the Statement of Financial Position as follows:
Current accountsWorking account 706,228 700,249
At call deposit - -
Headworks reserve account 23,910 49,443
Computer upgrade reserve account 42,912 24,293
Subdivision reserve account 20,805 16,628
Asset replacement reserve account 2,462 -
Business development reserve account 4,175 19,431
Floats 1,750 1,750
802,242 811,794
NOTES TO THE FINANCIAL STATEMENTS for the year ended 30 June 2015
2015 2014$ $
(b) Reconciliation of profit after income tax equivalent to net cash flows provided by/(used in) operating activities:
Profit after income tax equivalents 2,110,180 361,273Non cash items:Depreciation 2,684,106 2,671,597(Gain)/loss on disposal of non current assets 37,830 24,369Impairment losses reversed - -Developer contributions (236,302) -
(Increase)/decrease in assets:Trade and other debtors (104,134) (94,172)Inventories 76,706 (113,517)Prepayments (8,449) 34,481
Increase/(decrease) in liabilities:Trade creditors and accruals (a) (399,424) (172,479)Finance Costs (a) (595) 15Employee provisions 79,361 73,337
Other items:Income tax equivalents 1,472,275 695,586Finance costs (a) 23,043 24,450Operating subsidy (479,000) -Local government rate equivalent 88,666 -Net GST receipts/(payments) 61,894 (26,481)Change in GST receivable/payable (15,222) 6,491Net cash provided by/(used in) operating activities 5,390,934 3,497,775
(a) The comparatives have been restated to move interest paid from Operating to Financing activities.
80AQ
WES
T A
NN
UA
L RE
PORT
201
5

2015 2014$ $
Note 31 – Credit standby arrangements and loan facilities(a) Credit standby arrangements
Aqwest’s bankers provide standby funds. A total of $1,000,000 is accessible by Aqwest. The bank overdraft facility may be drawn at any time and is subject to annual review. At 30 June 2015, an aggregate amount of $1,000,000 remained unused (2014: $1,000,000 unused).
(b) Summary of loan facilitiesCredit standby arrangement 1,000,000 1,000,000
1,000,000 1,000,000
Note 32 – Remuneration of auditorRemuneration paid or payable to the Auditor General (OAG), in respect of the audit for the current financial year is as follows:
Auditing the accounts and financial statements 38,900 38,10038,900 38,100
Note 33 – Non cancellable operating lease revenueAqwest holds long term operating leases with payments receivable annually for telecommunications towers located on Aqwest facilities. The minimum lease payments receivable are as follows:
Within 1 year 58,565 56,159 Later than 1 year but not later than 5 years 57,467 116,032Later than 5 years - -
116,032 172,191
NOTES TO THE FINANCIAL STATEMENTS for the year ended 30 June 2015
2015 2014$ $
Note 34 – Commitments for expenditure(a) Operating expenditure commitments
Expenditure commitments, including information technology support, internal audit, external audit, office cleaning and sanitary services, grounds maintenance and chlorine supply, contracted for at the reporting date but not recognised as liabilities, are payable as follows:
Within 1 year 130,934 159,727Later than 1 year but not later than 5 years 166,239 11,974
297,173 171,701
(b) Capital expenditure commitments
Capital expenditure commitments, being contracted capital expenditure additional to the amounts reported in the financial statements, are payable as follows:
Within 1 year 799,154 523,927799,154 523,927
The capital commitments include amounts for:Reservoirs 799,154 523,927
799,154 523,927
Note 35 – Contingent assets and contingent liabilitiesAs at 30 June 2015, there are no material contingent assets or liabilities to report.
Note 36 – Subsequent events occurring after the reporting dateNone.
81
AQW
EST
AN
NU
AL
REPO
RT 2
015

INDEPENDENT AUDITOR’S REPORT for the year ended 30 June 2015
INDEPENDENT AUDITOR’S REPORT
To the Parliament of Western Australia
BUNBURY WATER CORPORATION
I have audited the financial report of the Bunbury Water Corporation. The financial repo rt comprises the Statement of Financial Position as at 30 June 2015, the Statement of Comprehensive Income, Statement of Changes in Equity and Statement of Cash Flows for the year then ended, and Notes comprising a summary of significant accounting policies and other explanatory information.
Directors’ Responsibility for the Financial ReportThe directors of the Bunbury Water Corporation are responsible for the preparation of the financial report that gives a true and fair view in accordance with Australian Accounting Standards and the Water Corporations Act 1995, and for such internal control as the directors determine is necessary to enable the preparation of the financial report that is free from material misstatement, whether due to fraud or error.
Auditor’s ResponsibilityAs required by the Water Corporations Act 1995, my responsibility is to express an opinion on the financial report based on my audit. The audit was conducted in accordance with Australian Auditing Standards. Those Standards require compliance with relevant ethical requirements relating to audit engagements and that the audit be planned and performed to obtain reasonable assurance about whether the financial report is free from material misstatement.
An audit involves performing procedures to obtain audit evidence about the amounts and disclosures in the financial report. The procedures selected depend on the auditor’s judgement, including the assessment of the risks of material misstatement of the financial report, whether due to fraud or error. In making those risk assessments, the auditor considers internal control relevant to the Corporation’s preparation of the financial report that gives a true and fair view in order to design audit procedures that are appropriate in the circumstances, but not for the purpose of expressing an opinion on the effectiveness of the Corporation’s internal control.
An audit also includes evaluating the appropriateness of the accounting policies used and the reasonableness of accounting estimates made by the directors, as well as evaluating the overall presentation of the financial report.
I believe that the audit evidence obtained is sufficient and appropriate to provide a basis for my audit opinion.
IndependenceIn conducting this audit, I have complied with the independence requirements of the Auditor General Act 2006 and Australian Auditing Standards, and other relevant ethical requirements.
7th Floor Albert Facey House 469 Wellington Street Perth MAIL TO: Perth BC PO Box 8489 Perth WA 6849 TEL: 08 6557 7500 FAX: 08 6557 7600
OpinionIn my opinion, the financial report of the Bunbury Water Corporation is in accordance with schedule 3 of the Water Corporations Act 1995, including:
(a) giving a true and fair view of the Corporation’s financial position as at 30 June 2015 and of its performance for the year ended on that date; and
(b) complying with Australian Accounting Standards and the Corporations Regulations 2001.
Matters Relating to the Electronic Publication of the Audited Financial ReportThis auditor’s report relates to the financial report of the Bunbury Water Corporation for the year ended 30 June 2015 included on the Corporation’s website. The Corporation’s management is responsible for the integrity of the Corporation’s website. This audit does not provide assurance on the integrity of the Corporation’s website. The auditor’s report refers only to the financial report described above. It does not provide an opinion on any other information which may have been hyperlinked to/from this financial report. If users of the financial report are concerned with the inherent risks arising from publication on a website, they are advised to refer to the hard copy of the audited financial report to confirm the information contained in this website version of the financial report.
GLEN CLARKEDEPUTY AUDITOR GENERALDelegate of the Auditor General for Western AustraliaPerth, Western Australia27 August 2015
82AQ
WES
T A
NN
UA
L RE
PORT
201
5


OUR PURPOSE: To provide competition in the totality of water services to be managed locally and to provide value to the owner and the customer. OUR VISION: To be an independent water utility providing diversity and competition in the Western Australian water industry.
5 MacKinnon Way, Bunbury WA 6230
P: (08) 9780 9500 I F: (08) 9780 9509E: [email protected]
www.aqwest.com.au