aquatic life uses for the lower rio ruidoso and upper … draft aquatic life uses for the lower rio...
TRANSCRIPT

Final Draft
AQUATIC LIFE USES FOR THE LOWER RIO RUIDOSO AND UPPER RIO HONDO IN NEW MEXICO
Use Attainability Analysis
Prepared for August 2017
Village of Ruidoso and City of Ruidoso Downs Regional Wastewater Treatment Plant Joint Use Board


Final Draft
AQUATIC LIFE USES FOR THE LOWER RIO RUIDOSO AND UPPER RIO HONDO IN NEW MEXICO
Use Attainability Analysis Prepared for Village of Ruidoso and City of Ruidoso Downs Regional Wastewater Treatment Plant Joint Use Board 313 Cree Meadow Drive Ruidoso, New Mexico 88345 Prepared by Jim Good Principal Associate ESA Project Number D160243.00
5309 Shilshole Avenue, NW Suite 200 Seattle, WA 98107 206.789.9658 www.esassoc.com
Irvine
Los Angeles
Oakland
Orlando
Pasadena
Petaluma
Portland
Sacramento
San Diego
San Francisco
Santa Monica
Seattle
Tampa
Woodland Hills

OUR COMMITMENT TO SUSTAINABILITY | ESA helps a variety of public and private sector clients plan and prepare for climate change and emerging regulations that limit GHG emissions. ESA is a registered assessor with the California Climate Action Registry, a Climate Leader, and founding reporter for the Climate Registry. ESA is also a corporate member of the U.S. Green Building Council and the Business Council on Climate Change (BC3). Internally, ESA has adopted a Sustainability Vision and Policy Statement and a plan to reduce waste and energy within our operations. This document was produced using recycled paper.

Aquatic Life Uses For the Lower Rio Ruidoso and Upper Rio Hondo in New Mexico i ESA / D160243.00 Use Attainability Analysis August 2017
SUMMARY This Use Attainability Analysis (UAA) was conducted to (1) determine factors affecting the attainment of aquatic life uses (ALUs), (2) identify the most protective attainable aquatic life uses for the lower Rio Ruidoso and upper Rio Hondo, and (3) perform a data-driven evaluation of current or existing uses. From the analysis, the Village of Ruidoso and City of Ruidoso Downs (Ruidoso) proposes to refine the currently designated uses based on a weight-of-evidence analysis.
The Clean Water Act (CWA) §101(a)(2) and 20.6.4.6 NMAC of the WQS require that, wherever attainable, water quality shall provide for the protection and propagation of fish, shellfish and wildlife and for recreation in and on the water. States are required to adopt the highest attainable use in designating the ALU for any water body. In order to remove a §101(a)(2) use or change it to one with less stringent criteria, a state or tribe must conduct a UAA (1) demonstrating that the use is not attainable due to one or more of the six factors listed in 40 CFR 131.10(g), and (2) determining the most protective aquatic life and contact uses that are attainable. This UAA focuses on Factor 1 in assessing whether the natural ambient air temperatures (i.e., naturally occurring thermal pollution) and other physical conditions prevent the attainment of the designated coldwater ALU (40 CFR 131.10[g][1]).
In Segment 20.6.4.209 the Rio Ruidoso originates in the high-elevation Rocky Mountain subalpine forests and encounters geomorphic and hydrologic changes as it flows eastward into Segment 20.6.4.208 where, with the Rio Bonito, it forms the Rio Hondo, passing through three ecoregions before entering the Southern New Mexico dissected plains. The variations in geomorphology along this gradient produce significant changes in hydrology, riparian vegetation, and water quality. The transition from Rocky Mountain Conifer Forests to Madrean Lower Montane Woodlands occurs near the Ruidoso fault zone and in the vicinity of the Hollywood, New Mexico, stream gauging station. This is also the area where the canyon opens into a broad floodplain with less shade from forested hillslopes, and the hydrology changes from a gaining to a losing stream where some of the surface flow enters an alluvial aquifer. The transition from defined incised canyons to a widening meandering active channel that may be occupied by flood waters during snowmelt and major storm events causes changes to the flow path in the middle and lower reaches of the Rio Ruidoso, limiting persistent riparian shading in some parts of the active channel. These natural transitions in geology, elevation, river geomorphology, hydrology, higher ambient air temperatures and reduced shade are the primary factors limiting the downstream extent of coldwater aquatic life.
Air-water temperature modeling and hourly temperature monitoring data suggest that coldwater aquatic life use is not attainable throughout much of the Rio Ruidoso, even in the Rocky Mountain Conifer Forest ecoregion. However, upstream from Hollywood the State applies a Special Trout Water regulation in managing a brown trout population that is maintained through natural reproduction. It appears that spring-fed cold water and/or refugia exist in the upper Rio Ruidoso that may support a reproducing population of brown trout, demonstrating that the coldwater ALU is attainable above Hollywood, despite occurrences of high air temperatures. Fish survey data, including surveys from various periods between 1916 and 2015,
Summary
Aquatic Life Uses For the Lower Rio Ruidoso and Upper Rio Hondo in New Mexico ii ESA / D160243.00 Use Attainability Analysis August 2017
indicate that reproducing populations of coldwater species are not present in the lower Rio Ruidoso below Hollywood or in the Rio Hondo.
Because documented anthropogenic stressors may influence lower Rio Ruidoso and upper Rio Hondo water temperatures and the attainability of a coldwater ALU, temperature analyses and fisheries data were also compared for the lower Mimbres River, a relatively undisturbed reference stream having similar latitude, elevations, and ecoregions. These comparisons help show that naturally occurring warm air temperatures would prevent the attainment of a coldwater ALU in the lower Rio Ruidoso and upper Rio Hondo regardless of anthropogenic stressors. In addition to high ambient air temperatures resulting in high water temperatures, modeling of dissolved oxygen (DO) solubility shows that the minimum DO criterion for coldwater (6.0 mg/L) is not consistently attainable due to physical factors (i.e., high elevation, atmospheric pressure) and the natural range of water temperatures. The DO solubility modeling was performed using data for the lower Mimbres River, considered to be representative of the water temperature and DO conditions that might be attainable in the lower Rio Ruidoso and upper Rio Hondo in the absence of extensive anthropogenic stressors. DO solubility modeling for the lower Rio Ruidoso using similar water temperatures, elevations and atmospheric pressures also showed that the minimum DO criterion for coldwater was not consistently attainable.
As the Rio Ruidoso transitions from the Rocky Mountain Conifer Forests to the Madrean Lower Montane Woodlands ecoregion, stream shading is diminished and both measured and modeled water temperatures increased. Downstream from the Rio Ruidoso and Rio Bonito confluence, the Rio Hondo flows through the Southern New Mexico Dissected Plains ecoregion characterized by sparse vegetative cover and an increasingly warm climate. Air-water temperature correlation modeling indicates that a coldwater ALU designation is even less attainable in the Rio Hondo than the lower Rio Ruidoso. The preponderance of evidence from geomorphic and hydrologic changes, ecoregion information, thermograph and sonde measurements, AWTC modeling, oxygen solubility modeling, and fish surveys indicates that the coldwater ALU is not attainable in the Rio Ruidoso below Hollywood; however, a coolwater designation is appropriate and attainable for the remainder of the river downstream from Hollywood to the Rio Bonito confluence. The presence of several coolwater species in each historical fish survey suggests that it is appropriate to extend a coolwater ALU designation downstream from the lower Rio Ruidoso through the Rio Hondo in Segment 20.6.4-208.
Because Segment 20.6.4.208 also includes several high-elevation streams where a coldwater ALU may be attainable (perennial reaches of the Rio Peñasco above state highway 24 near Dunken, perennial reaches of the Rio Bonito downstream from state highway 48 [near Angus], and perennial reaches of Agua Chiquita), it is proposed that the lower Rio Ruidoso and upper Rio Hondo are deleted from Segment 20.6.4.208 and a new segment is established for these warmer stream segments.
In summary, based on this UAA it is recommended to:
1. Change the upper Rio Ruidoso in Segment 20.6.4-209 from perennial reaches of the Rio Ruidoso and its tributaries “upstream of the U.S. 70 Bridge” to “upstream of the USGS gauging station at Hollywood, New Mexico”;
2. Delete from Segment 20.6.4-208 the Rio Ruidoso downstream of the U.S. highway 70 bridge near Seeping Springs lakes, and perennial reaches of the Rio Hondo upstream from Bonney canyon;

Summary
Aquatic Life Uses For the Lower Rio Ruidoso and Upper Rio Hondo in New Mexico iii ESA / D160243.00 Use Attainability Analysis August 2017
3. Establish a new Segment 20.6.4-230 that consists of the Rio Ruidoso downstream of the Hollywood, New Mexico stream gauging station, and perennial reaches of the Rio Hondo upstream from Bonney canyon. This new segment will have a coolwater ALU designation.
A weight-of-evidence approach was used to determine the attainable ALU, considering New Mexico’s ecoregional setting and watershed geomorphology, and analyzing recent water temperature monitoring data, air-water temperature correlations, dissolved oxygen solubility, and recent and historical surveys of fish communities. The lower Mimbres River was selected for reference site evaluations and similar analyses were compared to the Rio Ruidoso and Rio Hondo to consider where natural conditions prevent the attainment of a coldwater ALU in a similar but largely undisturbed watershed. Each of these lines of evidence is discussed in support of the UAA recommendations.

Aquatic Life Uses For the Lower Rio Ruidoso and Upper Rio Hondo in New Mexico v ESA / D160243.00 Use Attainability Analysis August 2017
TABLE OF CONTENTS
Page
Summary ............................................................................................................................................. i
1. Introduction .............................................................................................................................. 1 1.1 UAA Requirements ........................................................................................................... 1 1.2 Scope of the Lower Rio Ruidoso and Upper Rio Hondo UAA ........................................... 2 1.3 UAA Process .................................................................................................................... 2
2. Rio Ruidoso and Rio Hondo Watersheds .............................................................................. 5 2.1 Ecoregions and Watershed Description ............................................................................ 5 2.2 River Segments and Water Quality Standards ............................................................... 12
3. Comparable Reference Stream Selection ............................................................................ 17
4. Temperature Analyses .......................................................................................................... 21 4.1 Water Temperature Monitoring Large Data Sets ............................................................ 21 4.2 Water Temperature Statistics for 2003 and 2009 - 2012 ................................................ 23 4.3 Air Water Temperature Correlations ............................................................................... 26 4.4 Reference Site Evaluations ............................................................................................. 28
5. Oxygen Solubility ................................................................................................................... 30
6. Aquatic Life Observations .................................................................................................... 35 6.1 Historical Observations ................................................................................................... 35 6.2 September 2015 SWQB Fish Surveys ............................................................................ 41 6.3 Reference Site Aquatic Life Observations ...................................................................... 43
7. Discussion and Aquatic Life Use Recommendations ........................................................ 44 7.1 Upper Rio Ruidoso ......................................................................................................... 44 7.2 Lower Rio Ruidoso ......................................................................................................... 45 7.3 Rio Hondo ....................................................................................................................... 45 7.4 Reference Site Comparisons .......................................................................................... 46 7.5 Aquatic Life Use Recommendations ............................................................................... 47
8. References ............................................................................................................................. 49

Table of Contents
Aquatic Life Uses For the Lower Rio Ruidoso and Upper Rio Hondo in New Mexico vi ESA / D160243.00 Use Attainability Analysis August 2017
Appendices Appendix A USGS Surface Water Data: Monthly Mean Discharge for Rio Ruidoso at
Hollywood, New Mexico ........................................................................................... A-1 Appendix B Oxygen Solubility Modeling Input and Results by Station and Month ......................... B-1 List of Figures Figure 1. Rio Ruidoso and Upper Rio Hondo Level IV Ecoregions .................................................. 7 Figure 2. Rio Ruidoso Segments, Assessment Units, and Monitoring Stations ............................... 9 Figure 3. Rio Hondo Segments, Assessment Units, and Monitoring Stations ................................ 15 Figure 4. Mimbres River Level IV Ecoregions, Segments, and Assessment Units ........................ 19
List of Tables Table 1 Ecoregions of the Rio Ruidoso and Upper Rio Hondo. ........................................................ 12 Table 2. Temperature criteria (°C) for ALUs in New Mexico. ............................................................ 13 Table 3. Rio Ruidoso Monitoring Program Locations. ...................................................................... 21 Table 4. Summary Statistics for Water Temperature Measurements (°C) in the Rio Ruidoso
2009 – 2012, and Air-Water Temperature Correlation (AWTC)-Modeled Temperature Statistics (°C) for Parametrix Monitoring Locations. ............................... 24
Table 5. Summary Statistics for SWQB Water Temperature Measurements (°C) in the Rio Ruidoso in 2003 and 2012, and AWTC-Modeled Temperature Statistics (°C). ........... 26
Table 6. Summary Statistics for SWQB Water Temperature Measurements (°C) in the Rio Hondo in 2003 and 2012, and AWTC-Modeled Temperature Statistics (°C). .............. 28
Table 7. Summary Statistics for SWQB Water Temperature Measurements (°C) in the Mimbres River, and AWTC-Modeled Temperature Statistics (°C). .............................. 29
Table 8. Rio Ruidoso DO concentrations less than 6.0 mg/L at 90% saturation. .............................. 32 Table 9. Mimbres River DO concentrations less than 6.0 mg/L at 90% saturation. ........................... 33 Table 10. Summary of historical fish species observations in the Rio Ruidoso. ................................ 37 Table 11. Summary of historical fish species observations in the Rio Hondo. .................................. 39 Table 12. Summary of results from 2015 SWQB Fish Surveys. ........................................................ 42

Aquatic Life Uses For the Lower Rio Ruidoso and Upper Rio Hondo in New Mexico 1 ESA / D160243.00 Use Attainability Analysis August 2017
1. INTRODUCTION This Use Attainability Analysis (UAA) was conducted to identify the most appropriate and protective aquatic life uses (ALUs) for the lower Rio Ruidoso and upper Rio Hondo in Lincoln County, New Mexico. The Rio Ruidoso downstream of the U.S. highway 70 bridge near Seeping Springs lakes, and perennial reaches of the Rio Hondo upstream from Bonney Canyon are currently identified in the New Mexico Water Quality Standards for Interstate and Intrastate Surface Waters (WQS, Section 20.6.4.208 NMAC) as having designated uses that include coldwater aquatic life. This section of the WQS further states that a temperature criterion of 30°C (86°F) or less applies to this stream segment, a criterion that is substantially higher than the 24°C (75°F) maximum temperature that applies to other coldwater streams. The Village of Ruidoso and City of Ruidoso Downs Regional Wastewater Treatment Plant Joint Use Board (JUB) authorized this UAA due to the uncertainty of whether the designated coldwater ALU is attainable in the lower Rio Ruidoso and upper Rio Hondo where the WQS have established a relatively high temperature criterion.
Following examples of data-driven approaches used in UAAs recently completed for ALUs in the Mimbres River and Animas River by the New Mexico Environment Department Surface Water Quality Bureau (SWQB 2014a, SWQB 2014b), this UAA is intended to provide the weight of evidence needed to evaluate and potentially refine the currently designated aquatic life use in the lower Rio Ruidoso and upper Rio Hondo. Requirements for New Mexico’s UAA process are described in 20.6.4.15 NMAC, including provisions for a UAA conducted by an entity other than the New Mexico Environment Department.
1.1 UAA Requirements The Clean Water Act (CWA) §101(a)(2) and 20.6.4.6 NMAC of the WQS require that wherever attainable, water quality shall provide for the protection and propagation of fish, shellfish and wildlife and for recreation in and on the water. States are required to adopt the highest attainable use in designating the ALU for any water body. In order to remove a §101(a)(2) use or change it to one with less stringent criteria, a state or tribe must conduct a UAA demonstrating that the use is not attainable due to one or more of the six factors listed in 40 CFR 131.10(g), and to determine the most protective aquatic life and contact uses that are attainable. The six factors are:
1. Naturally occurring pollutant concentrations prevent the attainment of the use; or
2. Natural, ephemeral, intermittent or low flow conditions or water levels prevent the attainment of the use, unless these conditions may be compensated for by the discharge of sufficient volume of effluent discharges without violating State water conservation requirements to enable uses to be met; or
3. Human caused conditions or sources of pollution prevent the attainment of the use and cannot be remedied or would cause more environmental damage to correct than to leave in place; or
Introduction
Aquatic Life Uses For the Lower Rio Ruidoso and Upper Rio Hondo in New Mexico 2 ESA / D160243.00 Use Attainability Analysis August 2017
4. Dams, diversions or other types of hydrologic modifications preclude the attainment of the use and it is not feasible to restore the water body to its original condition or to operate such modification in a way that would result in the attainment of the use; or
5. Physical conditions related to the natural features of the water body, such as the lack of a proper substrate, cover, flow, depth, pools, riffles, and the like, unrelated to water quality, preclude attainment of aquatic life protection uses; or
6. Controls more stringent than those required by sections 301(b) and 306 of the Act would result in substantial and widespread economic and social impact
(CWA §131.10[g][1 – 6]).
This UAA focuses on Factor 1 above in assessing whether the natural ambient air temperatures (i.e., naturally occurring thermal pollution) and other physical conditions for oxygen solubility (e.g., elevation, atmospheric pressure) prevent the attainment of the designated coldwater ALU (40 CFR 131.10[g][1]).
1.2 Scope of the Lower Rio Ruidoso and Upper Rio Hondo UAA
Several of the 40 CFR 131.10(g) factors may affect the attainment of the coldwater ALU in the lower Rio Ruidoso and upper Rio Hondo, and anthropogenic stressors (e.g., stream channelization and destabilization, drought, grazing, water diversions, removal of riparian vegetation, and watershed forest fires) have the potential to impact the attainable water temperatures and ALUs throughout the Rio Ruidoso drainage. For example, the Total Maximum Daily Load (TMDL) for the Rio Hondo Watershed identified stream hydrograph alterations, removal of riparian vegetation, livestock grazing and natural causes as the most probable causes for temperatures exceeding the standards for the high quality aquatic life use designation that applied to the upper Rio Ruidoso (SWQB 2006). These impacts also influence attainable conditions in the lower river. However, this UAA examines historical fish survey information that dates back before some of the anthropogenic impacts, and focuses on assessing whether the natural ambient air temperatures (i.e., naturally occurring thermal pollution) and physical conditions influencing oxygen solubility prevent the attainment of the coldwater ALU (40 CFR 131.10[g][1]). Sites in less-impacted reference stream reaches of the lower Mimbres River, located in similar geophysical and ecological settings, are also evaluated to help characterize the natural temperature conditions and aquatic life uses that may be attainable. Altogether, these analyses address whether naturally occurring warm air temperatures and other physical conditions would prevent the attainment of a coldwater ALU in the lower Rio Ruidoso and upper Rio Hondo, regardless of anthropogenic stressors.
1.3 UAA Process Section 20.6.4.15.D summarizes the process for a UAA conducted by an entity other than the New Mexico Environment Department (Department). The first step was completed when Ruidoso submitted, on February 22, 2016, a notice to the Department of the intent to conduct a UAA. The second step was completed on September 9, 2016, with submittal of a UAA work plan (ESA 2016) to the Department, the U.S. Environmental Protection Agency (USEPA) Region 6, and the New Mexico Game and Fish Department (NMDFG), for review and comment. As required in the Section, the work plan identified the

Introduction
Aquatic Life Uses For the Lower Rio Ruidoso and Upper Rio Hondo in New Mexico 3 ESA / D160243.00 Use Attainability Analysis August 2017
scope of data currently available and the scope of data to be gathered, the factors affecting use attainment to be analyzed, and provisions for public notice and consultation with appropriate state and federal agencies. A first draft UAA was submitted to the Department on September 29, 2016, and coordinated comments from the Department and USEPA were returned to Ruidoso on March 8, 2017. Completing this Final Draft UAA, in accordance with the approved work plan, is the third step.
Public involvement was initiated when Ruidoso published a public notice regarding the UAA work plan in the Ruidoso News on May 4, 2016 (Ruidoso News 2016). The UAA public review and participation process is consistent with the state and federal requirements in New Mexico’s Statewide Water Quality Management Plan and Continuing Planning Process (NMWQCC 2011) and Section 20.6.4.15.D NMAC. If the Department’s review of the Final Draft UAA determines that the conclusions of the analysis support a water quality standards change, the Final Draft UAA will be posted on the SWQB website for a public review and comment period. Ruidoso may also public notice the document in a paper of local circulation, and conduct other public outreach activities to solicit input on the Final Draft UAA. Ruidoso will prepare responses to comments, and submit the Final Draft UAA and comment responses to the Department, and to the USEPA Region 6 for technical approval.
The Department or Ruidoso may then petition the New Mexico Water Quality Control Commission (WQCC) to modify the water quality standards. From that point forward the UAA petition will be subject to New Mexico’s rulemaking process. A hearing notice must be published in the New Mexico Register and a newspaper of local circulation, and mailed to the WQCC interested parties mailing list at least 45 days prior to the hearing date. Revisions approved by the WQCC and adopted into the water quality standards are subject to final Clean Water Act oversight approval by USEPA Region 6.
The following timeline identifies tasks for the UAA and the schedule planned for completing the process.
Rio Ruidoso Monitoring Program Quality Assurance Project Plan 5/8/2009
Ruidoso and SWQB water temperature data collection 6/3/2009 – 9/21/ 2012
SWQB fisheries data collection 9/16/2015 – 9/17/2015
Meeting with SWQB to discuss UAA 1/28/2016
Notice of Intent to conduct UAA 2/22/2016
Submit Draft UAA Work Plan to SWQB 3/1/2016
Comments on Draft UAA Work Plan (SWQB) 4/22/2016
Public notice regarding UAA Work Plan 5/4/2016
Submit Revised Draft UAA Work Plan to SWQB 5/25/2016
Comments on Revised Draft UAA Work Plan (SWQB) 6/23/2016
Submit UAA Work Plan to SWQB, USEPA and NMDGF 9/9/2016
Complete literature searches and data analyses 9/16/2016

Introduction
Aquatic Life Uses For the Lower Rio Ruidoso and Upper Rio Hondo in New Mexico 4 ESA / D160243.00
Use Attainability Analysis August 2017
Submit Draft UAA to SWQB 9/29/2016
Comments on Draft UAA (SWQB and USEPA) 3/8/2017
Submit Final Draft UAA to SWQB and USEPA 8/16/2017
Public notice period completed (SWQB)1 10/16/2017
Submit comment responses to commenters, SWQB, USEPA 11/16/2017
Submit Final UAA to SWQB and USEPA 11/16/2017
Petition WQCC for hearing (Ruidoso) 1/16/2017
Request for WQCC hearing date 3/13/2018
WQCC hearing2 6/12/2018
Submit WQCC-approved UAA, hearing transcripts to USEPA (Ruidoso) 6/22/2018
1This and subsequent steps are contingent on the Department supporting a UAA conclusion that water quality standards should be changed. 2At least 45 days must be allowed between publishing hearing notice and conducting the hearing.
In addition to the SWQB publishing the Final Draft UAA on their website, Ruidoso will continue to
publicize the UAA process and make it available for comment locally. The Ruidoso News published an
interview with the SWQB regarding the UAA on January 21, 2016 (Stallings 2016). Ruidoso submitted a
public notice about the UAA that was published by this same local newspaper on May 4, 2016 (Ruidoso
News 2016), and mailed the notice to local contacts at the New Mexico Council of Trout Unlimited and
the Ruidoso River Association.

Aquatic Life Uses For the Lower Rio Ruidoso and Upper Rio Hondo in New Mexico 5 ESA / D160243.00 Use Attainability Analysis August 2017
2. RIO RUIDOSO AND RIO HONDO WATERSHEDS
2.1 Ecoregions and Watershed Description The Rio Ruidoso subwatershed (Hydrologic Unit Code 1306000801) is located in the southwest part of the upper Rio Hondo Watershed (Hydrologic Unit Code 13060008) of east-central New Mexico (Figure 1). The Rio Hondo originates in the Sacramento Mountains and flows eastward to the Pecos River near Roswell, New Mexico. The Rio Hondo watershed is approximately 586 square miles and includes Rio Bonito subwatershed (SWQB 2006). The overall land use is 45% forest, 33% grassland, 20% shrubland, 1% agriculture, and less than 1% residential and commercial.
The Rio Ruidoso subwatershed lies mostly within Lincoln County, with the remaining portion in the Mescalero Apache reservation in Otero County. The river flows from headwaters near the 12,003-foot Sierra Blanca Peak generally eastward to the confluence with the Rio Bonito near the town of Hondo, New Mexico (elevation 5,230, Figure 1). The average elevation is 7,152 feet above sea level and the subwatershed receives approximately 20.2 inches of precipitation a year (SWQB 2006). Much of the Rio Ruidoso subwatershed is in the Lincoln National Forest or forest lands managed by the Mescalero Apache Tribe. Private land ownership supports agriculture primarily in the river valley, and residential and commercial development. Land uses are 77% forest, 13% grassland, 8% shrubland, 1% agriculture, and less than 1% commercial or residential (SWQB 2006).
Newcomer and Shomaker (1991) summarized information from Kelley and Thompson (1964) and Kelley (1971) describing the geology of the Ruidoso area:
“Rocks cropping out in the area range in age from Permian to Recent. The major structural features are the Ruidoso fault zone, Sierra Blanca Basin and Mescalero arch; the Ruidoso fault zone roughly separates the basin from the arch. In general, west of the Ruidoso fault zone, Tertiary Sierra Blanca volcanics and Quaternary sediments overlie Tertiary and Cretaceous sedimentary rocks. East of the Ruidoso fault zone, rocks of Permian age are overlain by Quaternary sediments.”
Newcomer and Shoemaker (1991) showed the Ruidoso fault zone roughly aligned north-south and crossing the Rio Ruidoso near the intersection of U.S. highway 70 and state route 48, close to the Hollywood stream gauging station (Figure 2). They described the flow of ground water west of the Ruidoso fault zone as being principally in fractured rocks with very low primary permeability, and the direction of flow being to the east, parallel with surface drainages. Ground water is recharged primarily from precipitation in the mountains west of the Ruidoso fault zone, and a portion of this precipitation infiltrates through the channels of the major streams and ephemeral drainages in the mountains and to a lesser degree on rock outcrops. Wells completed in Dakota Sandstone outcrops near fault zones have yielded water at rates of more than 100 gpm, but away from fault zones the unfractured sandstone is not expected to have enough permeability to yield large quantities of water.


!(
!(
!(
!(
!(
!(
!(
!(
!(!(
!(
!(
!(
+,380
+,70
+,380
+,285CR246
#SierraBlanca
CR48CR220
+,70CR395
WXE024
Mescalero Apache Reservation
23f23f
23f
Rio Ru id oso
Rio Bon it o
R i o Hondo
R i o B o n i to
Ea g l e C re e k
C ar ri zo C ree k
R io Ho n d o
B on i to Creek
23a
23b
23b
23b
23b
23e
23g
23g
24a
24b
26q
Bent Mescalero
Capitan
Ruidoso Downs
Hondo
Nogal
Ruidoso
Glencoe Roswell
RiversidePicacho
San Patricio
Rio Ruidoso. 160243.00Figure 1
Rio Ruidoso and Upper Rio Hondo Level IV EcoregionsSOURCE:NAIP, 2014; EPA, 2011; TIGER, 2014; US Census Bureau, 2010
0 6
Miles
Level IV Ecoregions23a Chihuahuan Desert Slopes23b Madrean Lower Montane Woodlands23e Conifer Woodlands and Savannas23f Rocky Mountain Conifer Forests23g Rocky Mountain Subalpine Forests24a Chihuahuan Basins and Playas24b Chihuahuan Desert Grasslands26q Southern New Mexico Dissected Plains
New MexcioRio Ruidoso
U:\G
IS\GI
S\Proj
ects\
16xx
xx\P1
6024
3_00
_RioR
uidos
o\03_
MXDs
_Proj
ects\
Overv
iew_R
ioRuid
oso.m
xd

70
380
70
48
Ruidoso
Fault
220
395
E024
Fox Cave
RuidosoDownsRacetrack
USGS Hollywood Gauging Stationat Friedenbloom Drive
RegionalWastewater
Treatment Plant
SeepingSprings
43
1
2
5
76
8
Ruidoso Downs
Ruidoso
Ri o Ru id o s o
Rio
B on i t o
Eag le C re e k Hondo
GlencoeSan Patricio
Rio Ruidoso. 160243.00Figure 2
Rio Ruidoso Segments, Assessment Units, and Monitoring Stations
SOURCE:NAIP, 2014; EPA, 2011; TIGER, 2014; US Census Bureau, 2010
0 2
Miles
Assessment Units / SegmentsNM-2208_20 / 20.6.4.208NM-2208_21 / 20.6.4.208NM-2208_30 / 20.6.4.208NM-2209.A_20 / 20.6.4.209NM-2209.A_21 / 20.6.4.209Monitoring Stations
1. Ruidoso above Carrizo Creek2. US 70 Bridge3. Above WWTP4. Vigil5. County Rd. E002 Bridge6. Tully7. Glencoe at FR 4338. Above Rio Bonito, County Rd. 16 BridgeU
:\GIS
\GIS
\Pro
ject
s\16
xxxx
\P16
0243
_00_
Rio
Rui
doso
\03_
MXD
s_Pr
ojec
ts\P
roje
ctAr
ea_R
ioR
uido
so.m
xd
2 3
4 & 5
6 &7

Rio Ruidoso and Rio Hondo Watersheds
Aquatic Life Uses For the Lower Rio Ruidoso and Upper Rio Hondo in New Mexico 11 ESA / D160243.00 Use Attainability Analysis August 2017
East of the Ruidoso fault zone, the important aquifers are principally in Permian sedimentary rocks (Yeso Formation and San Andres Limestone) and in Quaternary alluvium along major drainages (Newcomer and Shoemaker 1991). The shallowest aquifers within valleys and along drainages are unconfined and are in hydraulic connection with surface drainages. Well yields for the alluvial and San Andres aquifers have been reported to range from 10 to 1,000 gpm, with much lower yields from the Yeso Formation.
The Natural Resources Conservation Service (NRCS 2012) identified three hydrologic soil groups in the Rio Ruidoso subwatershed, based on estimates of runoff potential. The soils were classified as having moderate to very slow infiltration rates. The slower infiltration rates comprised most of the mapped area and correspond to high runoff potential. The Rio Ruidoso subwatershed overlies the Hondo groundwater basin (NRCS 2012).
Comparisons of flow measurements taken during four years of the Rio Ruidoso Monitoring Plan (RRMP) showed that the lower Rio Ruidoso is generally a losing reach downstream from the U.S. 70 bridge, between the Vigil and Tully monitoring sites (Figure 2), indicating that surface flows in the river channel are lost to the alluvial aquifer after the floodplain widens. This transition from a gaining reach to a losing reach appears to occur near the Ruidoso fault zone where the river leaves a narrow canyon and enters a broader valley with alluvial deposits. Hydrology through the river valley is complicated by numerous irrigation withdrawals and return flows.
The Rio Ruidoso and upper Rio Hondo flow through four Level IV ecoregions (Figure 1, USEPA 2012). The highest elevation headwater areas of the Rio Ruidoso are within the Rocky Mountain Subalpine Forests ecoregion, most of the upper watershed is in the Rocky Mountain Conifer Forests ecoregion, most of the lower watershed is in the Madrean Lower Montane Woodlands ecoregion, and the last few miles flow through the Southern New Mexico Dissected Plains ecoregion before joining the Rio Bonito to form the Rio Hondo. A small portion of the Rio Ruidoso subwatershed north of Eagle Creek lies within the Conifer Woodlands and Savannas ecoregion. Along the Rio Ruidoso the transition from Rocky Mountain Conifer Forests to Madrean Lower Montane Woodlands occurs near the Ruidoso fault zone and in the vicinity of the Hollywood stream gauging station (Figures 1 and 2). The upper Rio Hondo within segment 206.4.208 flows through the Southern New Mexico Dissected Plains ecoregion, a transitional area between the shortgrass prairies of Ecoregion 26 and the Chihuahuan Desert grasslands of Ecoregion 24 (Griffeth et al. 2006). This ecoregion is characterized by well-dissected topography with numerous draws and shallow canyons, and a rather sparse vegetative cover.
Table 1 summarizes information on the characteristics of each Rio Ruidoso and upper Rio Hondo ecoregion (Griffith et al. 2006).

Rio Ruidoso and Rio Hondo Watersheds
Aquatic Life Uses For the Lower Rio Ruidoso and Upper Rio Hondo in New Mexico 12 ESA / D160243.00 Use Attainability Analysis August 2017
TABLE 1 ECOREGIONS OF THE RIO RUIDOSO AND UPPER RIO HONDO.
Ecoregion Code
Level III
Level IV
River Segment(s) Name Elevation (ft) Hydrology Physiography
23 Arizona/New Mexico Mountains
23b 20.6.4.208 and 20.6.4.209
Madrean Lower Montane Woodlands
5,500 - 7,200 Moderate to high gradient streams, a few perennial rivers
High hills, low mountains & some canyons
23f 20.6.4.209 Rocky Mountain Conifer Forests
7,000 - 9,600 Moderate to high gradient intermittent streams, a few perennial rivers
Open low mountains & high mountains w/steep slopes, numerous canyons
23g 20.6.4.209 Rocky Mountain Subalpine Forests
9,500 - 11,973 A few small, high gradient streams
High mountain peaks & ridges w/steep slopes, some glaciation
26 Southwestern Tablelands
26q 20.6.4.208 Southern New Mexico Dissected Plains
3,800 - 5,959 No hydrology characterized
Well dissected irregular plains, numerous draws & canyons
2.2 River Segments and Water Quality Standards The WQS classify surface waters of the state into segments (20.6.4.7.S. NMAC), each having several designated uses, including a designated ALU. The Rio Ruidoso is currently classified in WQS segments 20.6.4.208 and 20.6.4.209 NMAC (with boldface type used below to highlight the Rio Ruidoso and Rio Hondo segments, SWQB):
20.6.4.206 PECOS RIVER BASIN – The main stem of the Pecos river from the headwaters of Brantley reservoir upstream to Salt creek (near Acme), perennial reaches of the Rio Peñasco downstream from state highway 24 near Dunken, perennial reaches of the Rio Hondo and its tributaries downstream of Bonney canyon and perennial reaches of the Rio Felix.
A. Designated uses: irrigation, livestock watering, wildlife habitat, secondary contact, and warmwater aquatic life.
B. Criteria: The use-specific numeric criteria set forth in 20.6.4.900 NMAC are applicable to the designated uses. At all flows above 50 cfs: total dissolved solids 14,000 mg/L or less, sulfate 3,000 mg/L or less and chloride 6,000 mg/L or less.

Rio Ruidoso and Rio Hondo Watersheds
Aquatic Life Uses For the Lower Rio Ruidoso and Upper Rio Hondo in New Mexico 13 ESA / D160243.00 Use Attainability Analysis August 2017
20.6.4.208 PECOS RIVER BASIN – Perennial reaches of the Rio Peñasco and its tributaries above state highway 24 near Dunken, perennial reaches of the Rio Bonito downstream from state highway 48 (near Angus), the Rio Ruidoso downstream of the U.S. highway 70 bridge near Seeping Springs lakes, perennial reaches of the Rio Hondo upstream from Bonney canyon and perennial reaches of Agua Chiquita.
A. Designated Uses: fish culture, irrigation, livestock watering, wildlife habitat, coldwater aquatic life and primary contact.
B. Criteria: the use-specific numeric criteria set forth in 20.6.4.900 NMAC are applicable to the designated uses, except that the following segment-specific criteria apply: temperature 30°C (86°F) or less, and phosphorus (unfiltered sample) less than 0.1 mg/L.
20.6.4.209 PECOS RIVER BASIN – Perennial reaches of Eagle creek upstream of Alto dam to the Mescalero Apache boundary, perennial reaches of the Rio Bonito and its tributaries upstream of state highway 48 (near Angus) excluding Bonito Lake, and perennial reaches of the Rio Ruidoso and its tributaries upstream of the U.S. highway 70 bridge near Seeping Springs lakes, above and below the Mescalero Apache boundary.
A. Designated Uses: domestic water supply, high quality coldwater aquatic life, irrigation, livestock watering, wildlife habitat, public water supply and primary contact.
B. Criteria: the use-specific numeric criteria set forth in 20.6.4.900 NMAC are applicable to the designated uses, except that the following segment-specific criteria apply: specific conductance 600 µS/cm or less in Eagle creek, 1,100 µS/cm or less in Bonito creek and 1,500 µS/cm or less in the Rio Ruidoso; phosphorus (unfiltered sample) less than 0.1 mg/L; the monthly geometric mean of E. coli bacteria 126 cfu/100 ml or less, single sample 235 cfu/100 ml or less.
Where segment-specific temperature criteria are not established, the water quality standards assign acute maximum (Tmax) and chronic (4T3 or 6T3) temperature criteria to protect ALUs in New Mexico (Table 2). Chronic temperature criteria (4T3, 6T3) are temperatures not to be exceeded for periods of 4 or 6 hours on more than three consecutive days.
TABLE 2. TEMPERATURE CRITERIA (°C) FOR ALUS IN NEW MEXICO.
Criterion
High Quality Coldwater Coldwater
Marginal Coldwater Coolwater Warmwater
Marginal Warmwater
4T3 20 - - - - - 6T3 - 20 25 - - - TMAX 23 24 29 29 32.2 32.2


380
380
368
395 70
Rio
Hondo
BonneyCanyon
Rio
R u idoso
RioB on i to
R i o H o ndo
Tinnie
Hondo
Riverside
Picacho
8 9
10
Rio Ruidoso. 160243.00Figure 3
Rio Hondo Segments, Assessment Units, and Monitoring Stations
SOURCE:NAIP, 2014; EPA, 2011; TIGER, 2014; US Census Bureau, 2010
0 2
Miles
Assessment Units / SegmentsNM-2208_21 / 20.6.4.208NM-2208_25 / 20.6.4.206NM-2208_30 / 20.6.4.208Monitoring Stations
8. Above Rio Bonito, County Rd. 16 Bridge9. Rio Hondo below Ruidoso/Bonito confluence10. Rio Hondo at Riverside
8
9
10


Aquatic Life Uses For the Lower Rio Ruidoso and Upper Rio Hondo in New Mexico 17 ESA / D160243.00 Use Attainability Analysis August 2017
3. COMPARABLE REFERENCE STREAM SELECTION
Because the Rio Ruidoso has been substantially impacted by anthropogenic stressors, sites in less-impacted reference stream reaches located in similar geophysical and ecological settings are evaluated to help characterize the natural temperature conditions and aquatic life uses that may be attainable. The SWQB provided Ruidoso with guidance on selection of reference sites and identified several potential reference sites located in the same or comparable ecoregions based on the ecosystem framework for New Mexico (Griffith et al. 2006).
A screening of potential reference sites was completed using ecoregion designations, latitude, elevation, topography and land uses, and evidence of anthropogenic impacts evident on aerial photographs.
• While sites on tributaries of the Gila River were the least impacted by human modifications, unlike the lower Rio Ruidoso these high-gradient mountain streams had minimal floodplain areas and were mostly in Montane Conifer Forest (23c) and Conifer Woodlands and Savannahs (23e) ecoregions.
• Sites on the Rio Peñasco with available hourly water temperature monitoring data were in the lower desert reaches within the Chihuahuan Basins and Playas (24a) ecoregion, or headwaters within the Rocky Mountain Conifer Forests (23f) ecoregion.
• A Tularosa Creek site was located in the same ecoregion (23b) as the Rio Ruidoso immediately below the U.S. highway 70 bridge; however, it has evidence of anthropogenic impacts from U.S. highway 70, the town of Mescalero, and other current and historical land uses in the floodplain and other watershed areas.
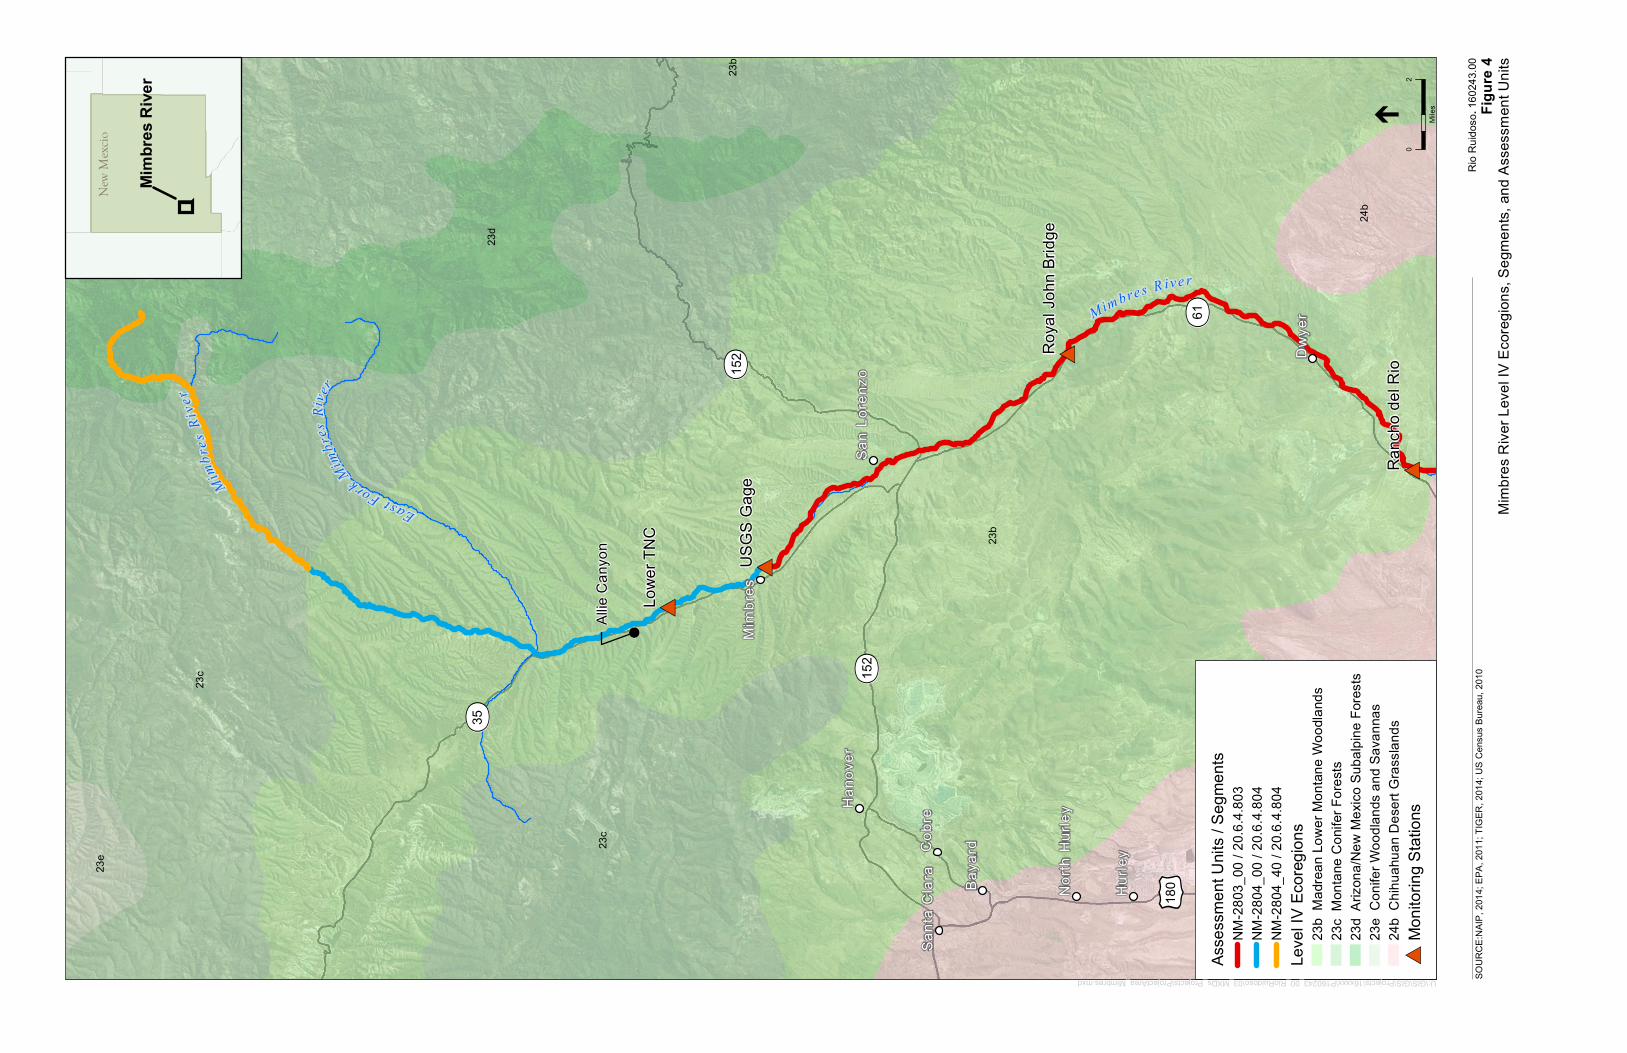
Sites on the lower Mimbres River below Allie Canyon appear to best fit ecoregional, geophysical, and land use characteristics for use as minimally impacted reference sites in comparisons to the lower Rio Ruidoso. Similar to the Rio Ruidoso, the Mimbres River originates in subalpine forests and flows through a watershed that is predominantly in the Montane Conifer Forests (23c) ecoregion, before entering the Madrean Lower Montaine Woodlands (23b) ecoregion and eventually flowing into desert grasslands (Griffith et al. 2006, Figure 4). The UAA for Mimbres River aquatic life uses (SWQB 2014a) describes the river as flowing through deep incised canyons with narrow, forested riparian zones before entering ecoregion 23b where stream physiognomy adopts a typical meandering river valley form with an active channel subject to overbank flooding. A similar transition is observed where the Rio Ruidoso exits the narrow valley upstream of Hollywood and meanders through a much broader river valley downstream in ecoregion 23b. Most of the Mimbres River watershed upstream from reference sites is managed by the U.S. Forest Service, including designated wilderness areas, and The Nature Conservancy manages five linear miles of the river within ecoregion 23b for riparian habitat protection and recovery. The Mimbres River has the added advantage of having available for comparisons the recent data collection and analyses completed for several sites within ecoregion 23b as part of a UAA (SWQB 2014a). These sites and the lower Rio Ruidoso are within one degree of latitude of each other, and lie between approximately 5,000 and 6,000 feet in elevation.

! (
# *
# *
# *
# *
QR35
QR152
QR152
QR61+,18
0
Mim bres R ive r
23b
23b
23c
23c
23d
23e
23e
24b
24b
Mimbr
esRi
ver
EastForkMimbr
esRi
v er
Hano
ver
Santa
Clar
a
Baya
rdCobr
e
Hurle
y
Dwye
r
San L
oren
zo
North
Hur
ley
Mimb
res
Allie
Cany
on
Lowe
r TNC
Roya
l Joh
n Brid
ge
Ranc
ho de
l Rio
USGS
Gag
e
Rio R
uidos
o. 16
0243
.00Fig
ure 4
Mimb
res R
iver L
evel
IV Ec
oregio
ns, S
egme
nts, a
nd A
sses
smen
t Unit
sSO
URCE
:NAIP
, 201
4; EP
A, 20
11; T
IGER
, 201
4; US
Cen
sus B
ureau
, 201
0
02
Miles
Asse
ssme
nt Un
its / S
egme
ntsNM
-2803
_00 /
20.6.
4.803
NM-28
04_0
0 / 20
.6.4.8
04NM
-2804
_40 /
20.6.
4.804
Leve
l IV Ec
oregio
ns23
b Ma
drean
Lowe
r Mon
tane W
oodla
nds
23c
Monta
ne C
onife
r Fore
sts23
d Ar
izona
/New
Mex
ico Su
balpi
ne Fo
rests
23e
Conif
er Wo
odlan
ds an
d Sav
anna
s24
b Ch
ihuah
uan D
esert
Gras
sland
s# *
Monit
oring
Stati
ons
New Me
xcio
Mimb
res R
iver
U:\GIS\GIS\Projects\16xxxx\P160243_00_RioRuidoso\03_MXDs_Projects\ProjectArea_Mimbres.mxd

Aquatic Life Uses For the Lower Rio Ruidoso and Upper Rio Hondo in New Mexico 21 ESA / D160243.00 Use Attainability Analysis August 2017
4. TEMPERATURE ANALYSES Water temperature analyses were the first line of evidence examined regarding the attainability of the coldwater ALU designation in the lower Rio Ruidoso and upper Rio Hondo. The first subsection in this chapter describes the large water temperature data sets that were available for analysis. The second subsection presents summary statistics for these data sets, with comparisons to water quality criteria that generally apply to coldwater ALU segments. In the third subsection the results of Air-Water Temperature Correlations (AWTC) are examined to see if modeled water temperatures are predicted to exceed water quality criteria for the coldwater ALU due solely to high ambient air temperatures. Finally, to further examine whether high water temperatures are occurring due to natural conditions, the fourth subsection presents similar data analyses and AWTC modeling for sites in the relatively undisturbed Mimbres River watershed where another UAA was recently completed.
4.1 Water Temperature Monitoring Large Data Sets Parametrix Temperature Data
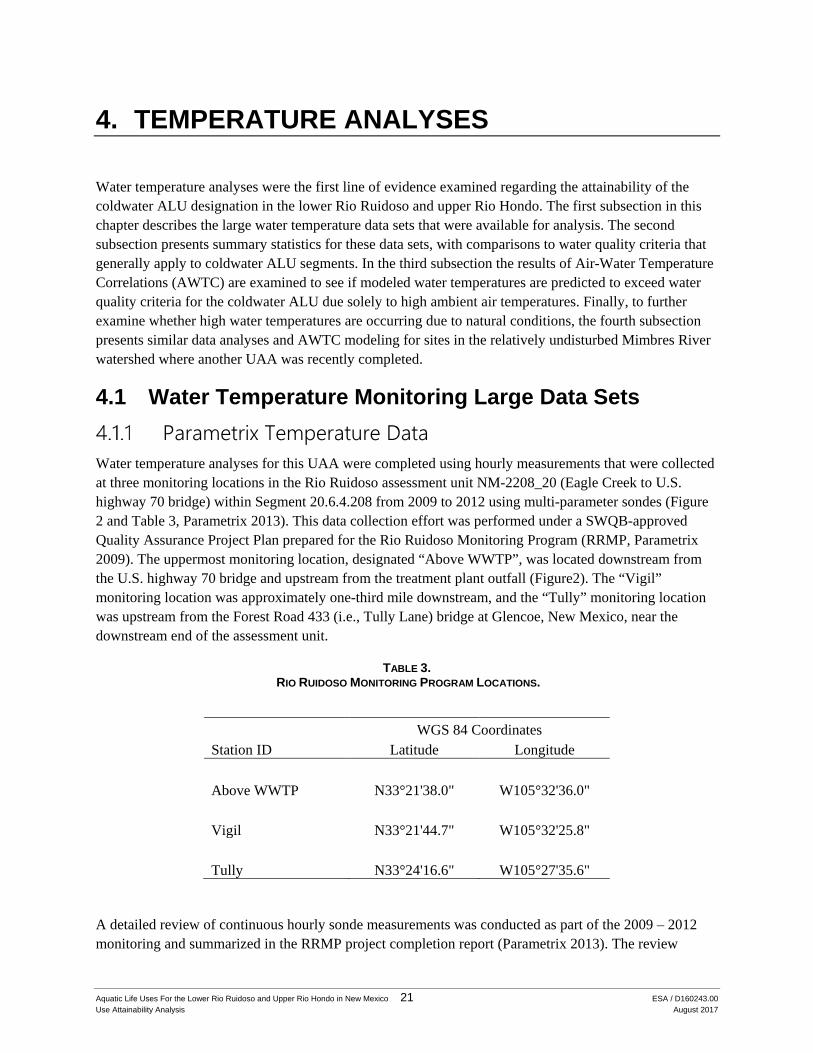
Water temperature analyses for this UAA were completed using hourly measurements that were collected at three monitoring locations in the Rio Ruidoso assessment unit NM-2208_20 (Eagle Creek to U.S. highway 70 bridge) within Segment 20.6.4.208 from 2009 to 2012 using multi-parameter sondes (Figure 2 and Table 3, Parametrix 2013). This data collection effort was performed under a SWQB-approved Quality Assurance Project Plan prepared for the Rio Ruidoso Monitoring Program (RRMP, Parametrix 2009). The uppermost monitoring location, designated “Above WWTP”, was located downstream from the U.S. highway 70 bridge and upstream from the treatment plant outfall (Figure2). The “Vigil” monitoring location was approximately one-third mile downstream, and the “Tully” monitoring location was upstream from the Forest Road 433 (i.e., Tully Lane) bridge at Glencoe, New Mexico, near the downstream end of the assessment unit.
TABLE 3. RIO RUIDOSO MONITORING PROGRAM LOCATIONS.
WGS 84 Coordinates Station ID Latitude Longitude
Above WWTP N33°21'38.0" W105°32'36.0" Vigil N33°21'44.7" W105°32'25.8"
Tully N33°24'16.6" W105°27'35.6"
A detailed review of continuous hourly sonde measurements was conducted as part of the 2009 – 2012 monitoring and summarized in the RRMP project completion report (Parametrix 2013). The review

Temperature Analyses
Aquatic Life Uses For the Lower Rio Ruidoso and Upper Rio Hondo in New Mexico 22 ESA / D160243.00 Use Attainability Analysis August 2017
indicated that certain dissolved oxygen (DO) measurements were determined to be invalid because of indications that the sonde was out of the water, buried with sediment, or otherwise malfunctioning. All data from these periods were examined for irregularities in temperature measurements, and values that were not considered representative of water temperatures were censored and excluded from the temperature statistics. Appendix B of the RRMP includes a graphical summary of data quality review findings by station for each month of monitoring.
Where there were data gaps during the warmest part of the summer due to data censoring, the actual TMAX
may not have been captured and the highest 6T3 calculation may also have not been recorded. Missing the warmest Rio Ruidoso temperatures may have occurred at the AWWTP site in 2011 and possibly 2012, at the Vigil site in 2011, and at the Tully site in 2010 and 2011. Temperature statistics were calculated for comparison to water temperature criteria for all three sites and all four years (with the exception of the Vigil site in 2009); however, these statistics may underestimate the actual maximum temperatures where data gaps were significant during the warmest part of the summer.
SWQB Temperature Data Water temperature analyses were also completed using hourly thermograph measurements from two SWQB data collection efforts at the Rio Ruidoso and Rio Hondo:
2003 monitoring at locations in the:
- lower Rio Ruidoso in Glencoe at Forest Road 443 bridge and at County Road 16 bridge above the Rio Bonito confluence (Figure 2),
- upper Rio Ruidoso at U.S. Geological Survey (USGS) Hollywood gauging station and above the U.S. highway 70 bridge (Figure 2), and the
- Rio Hondo below the Ruidoso/Bonito confluence and at Riverside (Figure 3);
and 2012 monitoring in the:
- lower Rio Ruidoso at County Road E002 bridge and in Glencoe at Forest Road 443 bridge (Figure 2),
- upper Rio Ruidoso above Carrizo Creek and above the U.S. 70 bridge (Figure 2), and
- Rio Hondo below the Ruidoso/Bonito confluence and at Riverside (Figure 3).
The 2003 data help characterize temperature conditions before the 2008 Rio Ruidoso flood, and flood recovery construction, altered the stream channel and riparian vegetation. The SWQB data were collected and validated under the Department’s Quality Assurance Project Plan that was current during those data collection activities, and most recently updated in 2016 (SWQB 2016c).
Temperature Analyses
Aquatic Life Uses For the Lower Rio Ruidoso and Upper Rio Hondo in New Mexico 23 ESA / D160243.00 Use Attainability Analysis August 2017
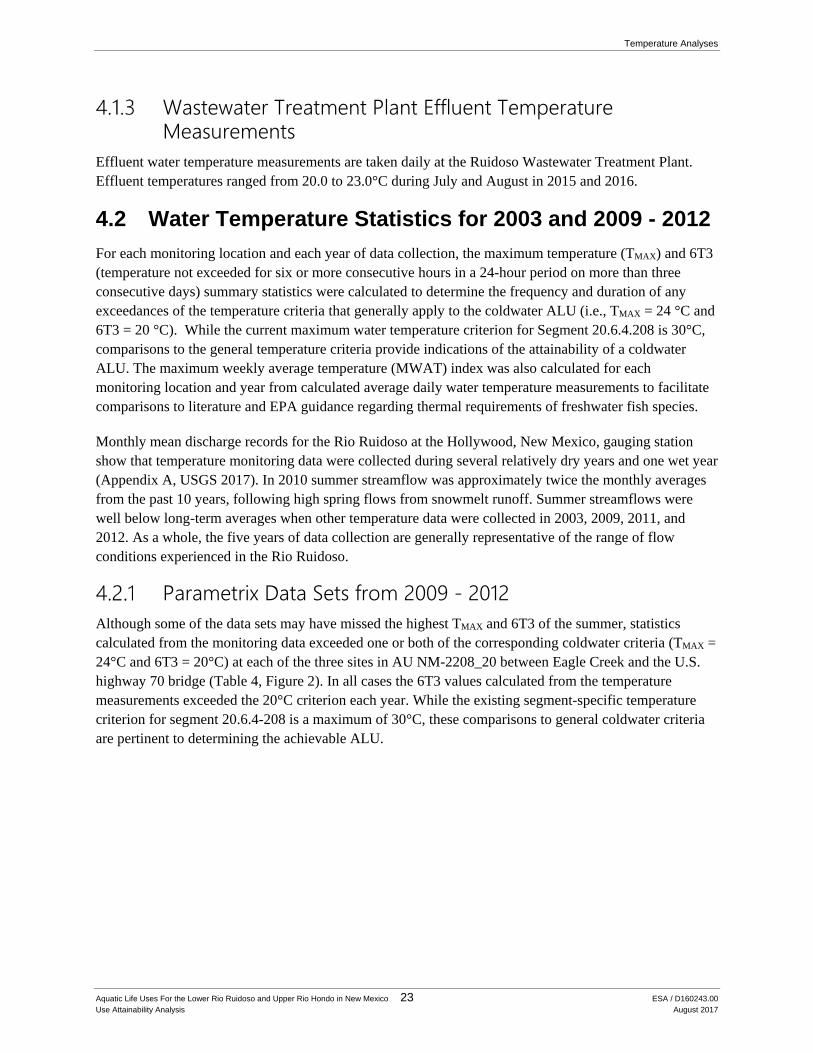
Wastewater Treatment Plant Effluent Temperature Measurements
Effluent water temperature measurements are taken daily at the Ruidoso Wastewater Treatment Plant. Effluent temperatures ranged from 20.0 to 23.0°C during July and August in 2015 and 2016.
4.2 Water Temperature Statistics for 2003 and 2009 - 2012 For each monitoring location and each year of data collection, the maximum temperature (TMAX) and 6T3 (temperature not exceeded for six or more consecutive hours in a 24-hour period on more than three consecutive days) summary statistics were calculated to determine the frequency and duration of any exceedances of the temperature criteria that generally apply to the coldwater ALU (i.e., TMAX = 24 °C and 6T3 = 20 °C). While the current maximum water temperature criterion for Segment 20.6.4.208 is 30°C, comparisons to the general temperature criteria provide indications of the attainability of a coldwater ALU. The maximum weekly average temperature (MWAT) index was also calculated for each monitoring location and year from calculated average daily water temperature measurements to facilitate comparisons to literature and EPA guidance regarding thermal requirements of freshwater fish species.
Monthly mean discharge records for the Rio Ruidoso at the Hollywood, New Mexico, gauging station show that temperature monitoring data were collected during several relatively dry years and one wet year (Appendix A, USGS 2017). In 2010 summer streamflow was approximately twice the monthly averages from the past 10 years, following high spring flows from snowmelt runoff. Summer streamflows were well below long-term averages when other temperature data were collected in 2003, 2009, 2011, and 2012. As a whole, the five years of data collection are generally representative of the range of flow conditions experienced in the Rio Ruidoso.
Parametrix Data Sets from 2009 - 2012 Although some of the data sets may have missed the highest TMAX and 6T3 of the summer, statistics calculated from the monitoring data exceeded one or both of the corresponding coldwater criteria (TMAX = 24°C and 6T3 = 20°C) at each of the three sites in AU NM-2208_20 between Eagle Creek and the U.S. highway 70 bridge (Table 4, Figure 2). In all cases the 6T3 values calculated from the temperature measurements exceeded the 20°C criterion each year. While the existing segment-specific temperature criterion for segment 20.6.4-208 is a maximum of 30°C, these comparisons to general coldwater criteria are pertinent to determining the achievable ALU.
Temperature Analyses
Aquatic Life Uses For the Lower Rio Ruidoso and Upper Rio Hondo in New Mexico 24 ESA / D160243.00 Use Attainability Analysis August 2017
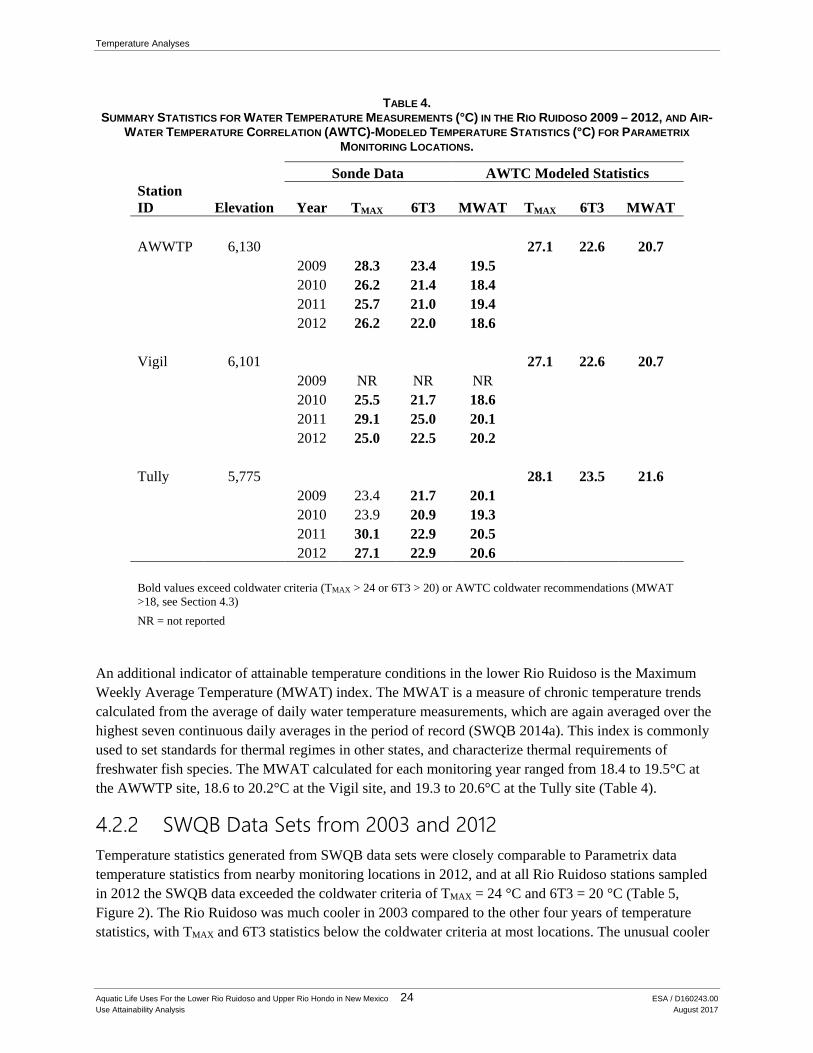
TABLE 4. SUMMARY STATISTICS FOR WATER TEMPERATURE MEASUREMENTS (°C) IN THE RIO RUIDOSO 2009 – 2012, AND AIR-
WATER TEMPERATURE CORRELATION (AWTC)-MODELED TEMPERATURE STATISTICS (°C) FOR PARAMETRIX MONITORING LOCATIONS.
Sonde Data AWTC Modeled Statistics Station ID Elevation Year TMAX 6T3 MWAT TMAX 6T3 MWAT AWWTP 6,130 27.1 22.6 20.7 2009 28.3 23.4 19.5 2010 26.2 21.4 18.4 2011 25.7 21.0 19.4 2012 26.2 22.0 18.6 Vigil 6,101 27.1 22.6 20.7 2009 NR NR NR 2010 25.5 21.7 18.6 2011 29.1 25.0 20.1 2012 25.0 22.5 20.2 Tully 5,775 28.1 23.5 21.6 2009 23.4 21.7 20.1 2010 23.9 20.9 19.3 2011 30.1 22.9 20.5 2012 27.1 22.9 20.6 Bold values exceed coldwater criteria (TMAX > 24 or 6T3 > 20) or AWTC coldwater recommendations (MWAT >18, see Section 4.3) NR = not reported
An additional indicator of attainable temperature conditions in the lower Rio Ruidoso is the Maximum Weekly Average Temperature (MWAT) index. The MWAT is a measure of chronic temperature trends calculated from the average of daily water temperature measurements, which are again averaged over the highest seven continuous daily averages in the period of record (SWQB 2014a). This index is commonly used to set standards for thermal regimes in other states, and characterize thermal requirements of freshwater fish species. The MWAT calculated for each monitoring year ranged from 18.4 to 19.5°C at the AWWTP site, 18.6 to 20.2°C at the Vigil site, and 19.3 to 20.6°C at the Tully site (Table 4).
SWQB Data Sets from 2003 and 2012 Temperature statistics generated from SWQB data sets were closely comparable to Parametrix data temperature statistics from nearby monitoring locations in 2012, and at all Rio Ruidoso stations sampled in 2012 the SWQB data exceeded the coldwater criteria of TMAX = 24 °C and 6T3 = 20 °C (Table 5, Figure 2). The Rio Ruidoso was much cooler in 2003 compared to the other four years of temperature statistics, with TMAX and 6T3 statistics below the coldwater criteria at most locations. The unusual cooler

Temperature Analyses
Aquatic Life Uses For the Lower Rio Ruidoso and Upper Rio Hondo in New Mexico 25 ESA / D160243.00 Use Attainability Analysis August 2017
temperatures at all sites monitored in 2003 may have been attributable to summer river flows from the upper Rio Ruidoso that were well below normal at the Hollywood gauge, indicating that more of the river water was base flows supplied by groundwater and a relatively low portion of the average flows came from summer storm runoff. Mean monthly flows from 2003 for the Hollywood gauge were among the lowest on record during the summer months (USGS 2016a).
Statistics calculated from the monitoring data also exceeded one or both of the corresponding coldwater criteria (TMAX = 24°C and 6T3 = 20°C) at both Rio Hondo stations in Segment 20.6.4.208 from Bonney Canyon to Rio Ruidoso (Table 6). In all cases the 6T3 values calculated from the temperature measurements exceeded the 20°C criterion each year. At the Riverside station, the 27.5°C value calculated for 6T3 also exceeded the 25°C criterion for marginal coldwater, and the 30.1°C TMAX value exceeded the 29°C criterion for marginal coldwater and coolwater aquatic life uses. While the existing segment-specific temperature criterion for Segment 20.6.4.208 is a maximum of 30°C, these comparisons to general criteria are pertinent to determining the attainable ALU.

Temperature Analyses
Aquatic Life Uses For the Lower Rio Ruidoso and Upper Rio Hondo in New Mexico 26 ESA / D160243.00 Use Attainability Analysis August 2017
TABLE 5. SUMMARY STATISTICS FOR SWQB WATER TEMPERATURE MEASUREMENTS (°C) IN THE RIO RUIDOSO IN 2003 AND
2012, AND AWTC-MODELED TEMPERATURE STATISTICS (°C).
Thermograph Data AWTC Modeled
Statistics
Station ID River Mile Elevation Year TMAX 6T3 MWAT TMAX 6T3 MWAT
Rio Ruidoso Above Carrizo Creek 45.3 ~6,500 26.0 21.6 19.7 2012 24.8 21.7 18.4 Hollywood USGS gage 42.3 6,420 25.9 21.5 19.6 2003 23.7 19.7 17.7 Above Hwy 70 Bridge 31.5 6,175 27.1 22.6 20.7 2003 23.7 20.3 17.3 2012 25.7 21.3 19.4 CR E002 30.5 ~6,080 27.1 22.6 20.7 2012 25.5 22.7 20.2 Glencoe FR443 19.8 5,771 28.1 23.5 21.6 2003 19.6 16.0 15.6 2012 25.5 22.7 19.3 Above Rio Bonito 1.3 5,367 28.8 24.3 22.3 2003 18.2 16.6 16.4 Bold values exceed coldwater criteria (TMAX > 24°C or 6T3 > 20°C) or AWTC coldwater recommendations (MWAT >18°C, see Section 4.3)
4.3 Air Water Temperature Correlations New Mexico’s water quality standards do not require the use of the MWAT for chronic temperature measurements; however, because of its utility in identifying attainable uses as related to fish communities, the SWQB developed an Air-Water Temperature Correlation (AWTC) for New Mexico streams (SWQB 2011). The correlation is based on the premise that other than in streams which receive significant groundwater inputs, air temperature has the greatest influence on stream temperature. As described in Section 2.1 above, while groundwater inputs feed the canyons of the upper Rio Ruidoso and mountain tributaries, the lower Rio Ruidoso and Rio Hondo are losing stream reaches that are generally not receiving cold groundwater inputs. Using a database of recorded thermograph measurements from 293
Temperature Analyses
Aquatic Life Uses For the Lower Rio Ruidoso and Upper Rio Hondo in New Mexico 27 ESA / D160243.00 Use Attainability Analysis August 2017
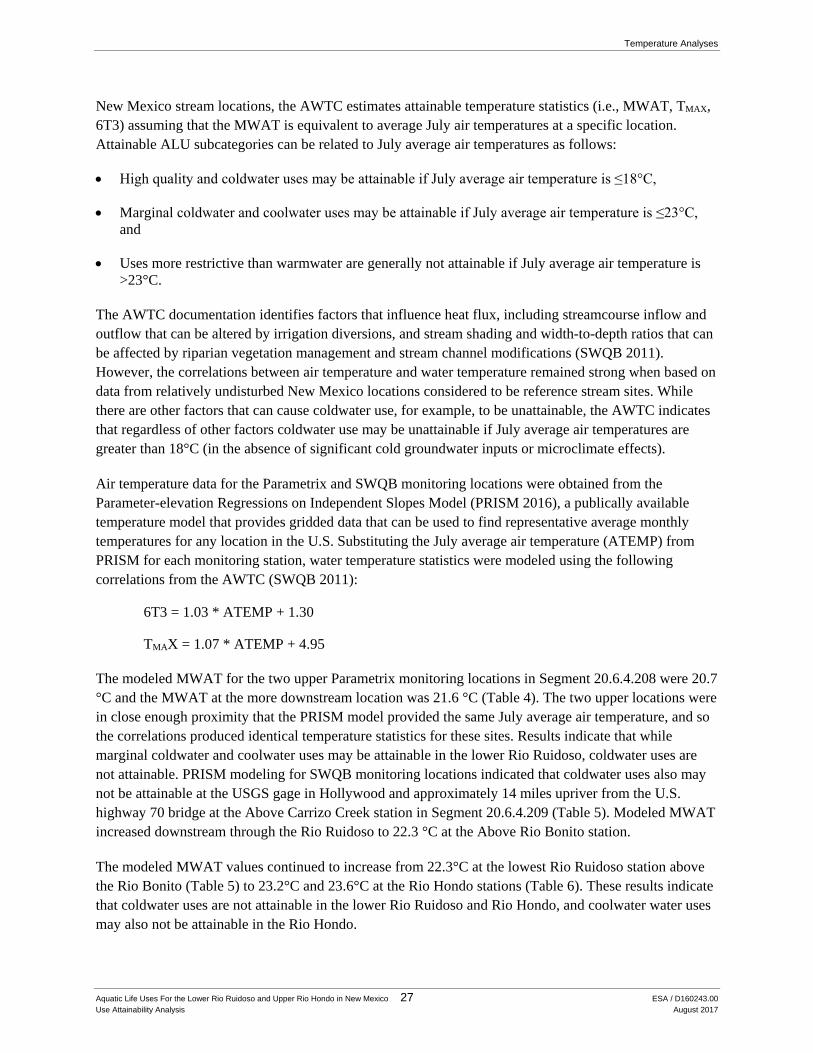
New Mexico stream locations, the AWTC estimates attainable temperature statistics (i.e., MWAT, TMAX, 6T3) assuming that the MWAT is equivalent to average July air temperatures at a specific location. Attainable ALU subcategories can be related to July average air temperatures as follows:
• High quality and coldwater uses may be attainable if July average air temperature is ≤18°C,
• Marginal coldwater and coolwater uses may be attainable if July average air temperature is ≤23°C, and
• Uses more restrictive than warmwater are generally not attainable if July average air temperature is >23°C.
The AWTC documentation identifies factors that influence heat flux, including streamcourse inflow and outflow that can be altered by irrigation diversions, and stream shading and width-to-depth ratios that can be affected by riparian vegetation management and stream channel modifications (SWQB 2011). However, the correlations between air temperature and water temperature remained strong when based on data from relatively undisturbed New Mexico locations considered to be reference stream sites. While there are other factors that can cause coldwater use, for example, to be unattainable, the AWTC indicates that regardless of other factors coldwater use may be unattainable if July average air temperatures are greater than 18°C (in the absence of significant cold groundwater inputs or microclimate effects).
Air temperature data for the Parametrix and SWQB monitoring locations were obtained from the Parameter-elevation Regressions on Independent Slopes Model (PRISM 2016), a publically available temperature model that provides gridded data that can be used to find representative average monthly temperatures for any location in the U.S. Substituting the July average air temperature (ATEMP) from PRISM for each monitoring station, water temperature statistics were modeled using the following correlations from the AWTC (SWQB 2011):
6T3 = 1.03 * ATEMP + 1.30
TMAX = 1.07 * ATEMP + 4.95
The modeled MWAT for the two upper Parametrix monitoring locations in Segment 20.6.4.208 were 20.7 °C and the MWAT at the more downstream location was 21.6 °C (Table 4). The two upper locations were in close enough proximity that the PRISM model provided the same July average air temperature, and so the correlations produced identical temperature statistics for these sites. Results indicate that while marginal coldwater and coolwater uses may be attainable in the lower Rio Ruidoso, coldwater uses are not attainable. PRISM modeling for SWQB monitoring locations indicated that coldwater uses also may not be attainable at the USGS gage in Hollywood and approximately 14 miles upriver from the U.S. highway 70 bridge at the Above Carrizo Creek station in Segment 20.6.4.209 (Table 5). Modeled MWAT increased downstream through the Rio Ruidoso to 22.3 °C at the Above Rio Bonito station.
The modeled MWAT values continued to increase from 22.3°C at the lowest Rio Ruidoso station above the Rio Bonito (Table 5) to 23.2°C and 23.6°C at the Rio Hondo stations (Table 6). These results indicate that coldwater uses are not attainable in the lower Rio Ruidoso and Rio Hondo, and coolwater water uses may also not be attainable in the Rio Hondo.

Temperature Analyses
Aquatic Life Uses For the Lower Rio Ruidoso and Upper Rio Hondo in New Mexico 28 ESA / D160243.00 Use Attainability Analysis August 2017
The accuracy of PRISM air temperature modeling was checked by entering the latitude and longitude of weather stations near the upper and lower Rio Ruidoso in the PRISM model to generate July average air temperatures, and comparing these averages to the mean monthly temperatures recorded at the weather stations (NCEI 2016). Both the PRISM model results and weather station results were based on the same period from 1981 to 2010. At Ruidoso, New Mexico (Station Ruidoso, NM US GHCND:USC00297649), the weather station recorded a July mean temperature of 65.9°F compared to the PRISM July average of 66.1°F. At Picacho, New Mexico (Station Picacho, NM US GHCND:USC00296804), the weather station recorded a July mean temperature of 74.4 °F compared to the PRISM July average of 74.2°F. The PRISM model air temperature was accurate within 0.2 °F, including at the Picacho weather station near the Rio Hondo within river segment 20.6.4.208.
TABLE 6. SUMMARY STATISTICS FOR SWQB WATER TEMPERATURE MEASUREMENTS (°C) IN THE RIO HONDO IN 2003 AND 2012,
AND AWTC-MODELED TEMPERATURE STATISTICS (°C).
Thermograph Data AWTC Modeled
Statistics
Station ID River Mile Elevation Year TMAX 6T3 MWAT TMAX 6T3 MWAT
Rio Hondo Below Ruidoso - Bonito confluence 131.1 5,312 29.8 25.2 23.2 2003 25.8 23.5 21.4 2012 25.0 23.7 21.9 Riverside 105.8 5,089 30.2 25.6 23.6 2003 30.1 27.5 25.0 Bold values exceed coldwater criteria (TMAX > 24°C or 6T3 > 20°C) or AWTC coldwater recommendations (MWAT >18°C)
4.4 Reference Site Evaluations To help characterize the natural temperature conditions and aquatic life uses that may be attainable in the lower Rio Ruidoso and upper Rio Hondo, reference sites in a relatively undisturbed watershed were selected for data comparisons. Sites on the lower Mimbres River below Allie Canyon were selected as having the most similar ecoregional, geophysical, and land use characteristics for use as minimally impacted reference sites in comparisons to the lower Rio Ruidoso (See Section 3). Temperature evaluations summarized here for the Mimbres River below Allie Canyon (proposed change to segment 20.6.4.803) were presented in the Use Attainability Analysis: Aquatic Life Uses for the Mimbres River in New Mexico, Public Discussion Draft (SWQB 2014a) and approved in 2017 by the WQCC and USEPA as part of the triennial review of water quality standards. In the lower Mimbres River the coldwater ALU temperature criteria (i.e., TMAX and 6T3) were exceeded at Rancho del Rio and at Royal John Bridge (Table 7, Figure 4). Upstream at the USGS Gage the TMAX coldwater ALU criterion was exceeded during

Temperature Analyses
Aquatic Life Uses For the Lower Rio Ruidoso and Upper Rio Hondo in New Mexico 29 ESA / D160243.00 Use Attainability Analysis August 2017
the 2003 thermograph survey (Table 7). Further upstream at the Lower TNC Preserve station, the TMAX coldwater ALU criterion was exceeded in both 2003 and 2009.
The MWAT was calculated for Mimbres River stations as an additional indication of attainable conditions (SWQB 2014a). The MWAT at the Rancho del Rio and Royal John Bridge stations exceeded the 18°C coldwater recommendation based on 2009 thermograph data, as did the MWAT at the Lower TNC Preserve station based on 2003 thermograph data (Table 7). AWTC modeled MWAT values were similar to or exceeded the MWAT values calculated from 2009 thermograph data.
In conclusion, comparing both the 2009 thermograph and modeled temperature statistics to criteria suggested that, for the reach downstream of the Upper TNC (i.e., below Allie Canyon), the coldwater ALU is not attainable and the TMAX suggested coolwater to warmwater ALU transitions are likely to be more appropriate and attainable (SWQB 2014a).
TABLE 7. SUMMARY STATISTICS FOR SWQB WATER TEMPERATURE MEASUREMENTS (°C) IN THE MIMBRES RIVER, AND AWTC-
MODELED TEMPERATURE STATISTICS (°C).
Thermograph Data AWTC Modeled
Statistics
Station ID River Mile Elevation Year TMAX 6T3 MWAT TMAX 6T3 MWAT
Mimbres River Lower TNC Preserve 109 6,024 28.1 23.5 21.6 2003 29.7 NR 19.6 2009 24.6 NR NR USGS Gage 104.3 5,920 28.5 24 22.0 2003 28.9 NR NR Royal John Bridge 85.7 5,453 29.9 25.3 23.3 2009 30.1 24.1 21.5 Rancho del Rio 62.8 5,052 31.4 26.7 24.7 2003 29.1 19.9 NR 2009 23.3 20.9 19.7 Bold values exceed coldwater criteria (TMAX > 24°C or 6T3 > 20°C) or AWTC coldwater recommendations (MWAT >18°C) NR = not reported

Aquatic Life Uses For the Lower Rio Ruidoso and Upper Rio Hondo in New Mexico 30 ESA / D160243.00 Use Attainability Analysis August 2017
5. OXYGEN SOLUBILITY With the current coldwater ALU designation, the water quality standards assign a minimum dissolved oxygen criterion of 6.0 mg/L in the lower Rio Ruidoso and upper Rio Hondo in Segment 20.6.4.208. In determining ALU support using continuously recorded DO data (i.e., at least 72 consecutive hours with a measurement frequency of at least once per hour), DO criteria excursions for four or more consecutive hours indicates the ALU is not supported (NMED 2017). In determining compliance with this criterion, the NMED has used a concurrent minimum saturation approach that specified that no excursion from the minimum DO criterion occurred when oxygen saturation was at least 90%. Recent updates to the Dissolved Oxygen Listing Methodology (formerly the DO Assessment Protocol) changed the “≥90% saturation = no excursion of criterion” exclusion to require further review of associated data.
For the purposes of this UAA, long-term data sets were analyzed to see if the minimum 6.0 mg/L DO concentration was consistently attainable during warm summer months at 90% oxygen saturation, given natural conditions of specific conductance (i.e., conductivity), elevation and atmospheric pressure at water quality monitoring stations. Long-term hourly temperature data were available for three lower Rio Ruidoso locations reported in the RRMP (Parametrix 2009 and 2013). To help characterize the natural temperature conditions and aquatic life uses that may be attainable in the lower Rio Ruidoso and upper Rio Hondo, oxygen solubility was also modeled at two reference sites in the relatively undisturbed Mimbres River watershed, using long-term thermograph data sets provided by the SWQB. The USGS Gage and Royal John Bridge sites on the Mimbres River are at elevations found along the lower Rio Ruidoso. Where the DO concentration at 90% saturation is less than 6.0 mg/L, natural conditions may prevent the coldwater ALU from being consistently attainable and a coolwater ALU with a minimum DO criterion of 5.0 mg/L may be more appropriate.
The following steps and assumptions were used to model oxygen solubility using available long-term data sets for each water quality monitoring site.
1. From hourly temperature measurements during the summer months, the 4 warmest consecutive hours were extracted for each day and the minimum temperatures were identified during each of these 4-hour periods. Based on quality assurance reviews of sonde measurements performed for the RRMP for Rio Ruidoso monitoring sites (Parametrix 2013), temperature data were excluded from these analyses where invalid measurements may have been caused by low battery power in the sonde, sediment burial, or the sonde being out of the water.
2. Custom searches for historical weather station measurements were performed using websites for the Sierra Blanca Regional Airport near Ruidoso, New Mexico, and the Grant County Airport in Silver City, New Mexico, near the Mimbres River. (Weather Underground 2017a, 2017b). The maximum daily barometric pressure was assumed to be a conservative and representative value for oxygen solubility modeling.
3. Elevation correction tables for barometric pressure sensors (NovaLynx 2016) were used to correct the sea level pressure reported for the airport to barometric pressure at the elevation of each monitoring station location, and pressure units were converted from inches of mercury (inHg) to millimeters of mercury (mmHg).

Oxygen Solubility
Aquatic Life Uses For the Lower Rio Ruidoso and Upper Rio Hondo in New Mexico 31 ESA / D160243.00 Use Attainability Analysis August 2017
4. After reviewing a range of conductivity measurements reported by the USGS for their Mimbres, NM station between 1981-1986 and 2001-2009, conductivity was assumed to be 335 µS/cm for the purposes of modeling oxygen solubility at Mimbres River sites (USGS 2017). Concurrent sonde measurements of conductivity at the Rio Ruidoso monitoring stations were paired with temperature measurements for oxygen solubility modeling at Rio Ruidoso sites. Conductivity was assumed to be 400 µS/cm when extremely low measurements were considered invalid during August and early September, 2011, at the Vigil site, possibly due to a calibration issue.
5. For each date with warm water temperatures (i.e., lowest temperature during the 4 warmest hours of the day > 24 °C) the Single-Value Computation calculator at the USGS dissolved oxygen solubility tables (i.e., DOTABLES) website was used to calculate the DO in mg/L at 90% saturation (USGS 2016b). After entering the minimum water temperature that was measured during the 4 warmest hours of each day, the barometric pressure, and the specific conductance for the monitoring site, different measured DO values were entered to find the DO concentrations (nearest 0.1 mg/L) that resulted in 90% saturation. Varying conductivity inputs showed that the solubility was not sensitive within the range of measured values for the Rio Ruidoso and Mimbres River, so outcomes were not dependent on conductivity assumptions.
Table 8 summarizes the modeled DO concentrations less than 6.0 mg/L in the Rio Ruidoso that occurred at 90% oxygen saturation.
• Twelve times in 2009 the DO concentration was 5.8 to 5.9 mg/L at 90% saturation at the AWWTP site upstream from the treatment plant discharge. Data for the Vigil site a short distance downstream were not available for 2009 due primarily to the sonde being repeatedly buried in sediment. (It is also noted that there were several 2009 temperature measurements from the AWWTP site that were flagged as questionable due to concurrent DO measurements that were deemed invalid.)
• Twice in 2010 the DO concentration was 5.9 mg/L at the AWWTP site at 90% saturation, and was 6.0 mg/L at the Vigil site on those dates.
• On twelve dates in August and early September 2011 the DO concentration was 5.7 to 5.9 mg/L at 90% saturation at the Vigil site. Sonde data were not available for this period at the AWWTP site.
• Modeled DO concentrations were less than 5.8 to 5.9 mg/L on two dates in June 2012 at the Tully site, but were otherwise 6.0 mg/L or greater at 90% saturation. Modeled DO concentrations were 6.0 mg/L or greater at the AWWTP and Vigil sites during the summer of 2012, at 90% saturation.
For the three stations in Segment 20.6.4.208 combined there was a total of 30 occurrences of modeled DO concentrations less than 6.0 mg/L at 90% saturation. This total would likely be higher if valid temperature data were available for modeling the complete summer season at each of the three sites. Overall the modeling indicates that the 6.0 mg/L minimum DO criterion for coldwater ALU is commonly not attainable in the lower Rio Ruidoso, particularly at the AWWTP and Vigil sites, due to conditions of water temperature, barometric pressure, and specific conductance. Tables showing the input values and oxygen solubility modeling results for each station and year with DO less than 6.0 mg/L at 90% saturation are included in Appendix B.

Oxygen Solubility
Aquatic Life Uses For the Lower Rio Ruidoso and Upper Rio Hondo in New Mexico 32 ESA / D160243.00 Use Attainability Analysis August 2017
TABLE 8. RIO RUIDOSO DO CONCENTRATIONS LESS THAN 6.0 MG/L AT 90% SATURATION.
Monitoring Station Date Time
Min of 4-hour Max Daily Temp (°C)
Specific Conductivity
(µS/cm)
Monitoring Station
Max Daily Barometric
Pressure (mmHg)
DO (mg/L) at
90% saturation
AWWTP 6/25/2009 16:55:00 26.0 1576 616.7 *5.9 Elevation 7/10/2009 17:00:00 26.3 1557 618.2 5.8 6,130' 7/11/2009 14:00:00 25.5 1587 620.0 5.9 7/12/2009 17:00:00 26.5 1565 619.8 5.8 7/17/2009 16:00:00 25.9 1534 620.0 5.9 7/20/2009 14:00:00 26.1 1470 618.2 5.9 7/23/2009 14:00:00 25.8 464.9 617.2 *5.9 7/24/2009 14:00:00 26.3 467.3 616.7 *5.8 7/25/2009 17:00:00 25.9 448.9 616.5 5.9 7/26/2009 13:00:00 25.8 396.1 618.2 5.9 7/28/2009 15:00:00 25.7 417.9 615.4 5.9 8/5/2009 14:00:00 26.4 1501 619.0 5.8 7/19/2010 16:11:11 25.2 931.6 616.0 5.9 7/20/2010 16:11:11 25.5 707.3 615.2 5.9 Vigil 8/8/2011 18:00:00 25.8 490.5 614.7 5.9 Elevation 8/16/2011 15:00:00 26.2 42.0 616.5 5.8 6,101' 8/22/2011 16:00:00 25.8 162.3 618.7 5.9 8/23/2011 16:00:00 27.8 58.3 616.7 5.7 8/24/2011 16:00:00 26.6 45.9 617.2 5.8 8/25/2011 13:00:00 26.5 49.1 619.3 5.8 8/26/2011 15:00:00 26.6 46.5 619.8 5.8 8/27/2011 16:00:00 27.3 51.9 619.3 5.8 8/28/2011 15:00:00 27.6 63.4 617.2 5.7 8/29/2011 13:00:00 27.0 82.9 616.2 5.8 9/1/2011 16:00:00 25.3 77.8 616.7 5.9 9/2/2011 16:00:00 26.0 74.5 616.2 5.9 Tully 7/2/2011 13:00:00 27.3 1531 625.6 5.8 Elevation 7/19/2011 14:09:27 27.2 444.5 625.6 5.8 5,775' 6/14/2012 15:00:00 26.5 1741 620.3 5.8 6/15/2012 17:00:00 25.7 1723 621.8 5.9 *Temperature readings are questionable due to invalid low DO measurements.
Sea level barometric pressures from Sierra Blanca Airport were corrected for monitoring station elevation.

Oxygen Solubility
Aquatic Life Uses For the Lower Rio Ruidoso and Upper Rio Hondo in New Mexico 33 ESA / D160243.00 Use Attainability Analysis August 2017
Table 9 summarizes the modeled DO concentrations less than 6.0 mg/L in the Mimbres River that occurred at 90% oxygen saturation. Twice in 2003 and 26 times in 2009 the modeled DO concentration was 5.7 to 5.9 mg/L at 90% saturation at the USGS Gage monitoring station. This also occurred 31 times downstream at the Royal John Bridge monitoring station in 2009. Using the Mimbres River to represent relatively undisturbed reference conditions, these results indicate that the minimum DO criterion is not attainable under natural conditions, and provide evidence that the coldwater designation is not attainable under a natural range of water temperatures due to physical factors (i.e. elevation, atmospheric pressure) that cannot be changed. In other words, if there were no anthropogenic disturbances the coldwater ALU DO criterion may still not be consistently attainable in the lower Rio Ruidoso.
TABLE 9. MIMBRES RIVER DO CONCENTRATIONS LESS THAN 6.0 MG/L AT 90% SATURATION.
Monitoring Station Date Time
Min of 4-hour Max Daily Temp (°C)
Monitoring Station Max
Daily Barometric
Pressure (mmHg)
DO (mg/L) at
90% saturation
USGS Gage 7/2/2003 13:05 25.4 616.0 5.9 Elevation 5,920' 7/9/2003 13:05 26.7 625.1 5.9 7/19/2009 12:02 25.1 628.4 5.9 7/24/2009 13:02 28.0 625.1 5.8 7/25/2009 13:02 28.1 625.1 5.7 7/26/2009 16:02 26.2 626.1 5.7 7/27/2009 12:02 26.9 625.1 5.9 7/28/2009 14:02 26.1 622.8 5.9 7/29/2009 13:02 27.5 623.1 5.9 7/30/2009 16:02 27.8 623.8 5.8 7/31/2009 13:02 28.0 625.9 5.8 8/1/2009 15:02 24.5 626.1 5.7 8/3/2009 12:02 26.0 625.6 5.8 8/5/2009 16:02 27.0 626.6 5.8 8/6/2009 17:02 25.7 625.9 5.9 8/8/2009 17:02 25.5 624.6 5.9 8/14/2009 17:02 26.2 624.3 5.9 8/15/2009 13:02 27.1 626.4 5.9 8/16/2009 13:02 27.3 624.3 5.8 8/17/2009 14:02 26.3 624.6 5.9 8/19/2009 13:02 27.4 622.3 5.8 8/20/2009 16:02 27.1 622.3 5.8 8/23/2009 14:02 27.6 625.3 5.8 8/29/2009 17:02 27.0 627.4 5.9 8/30/2009 14:02 27.2 625.9 5.8 8/31/2009 17:02 27.0 626.4 5.9
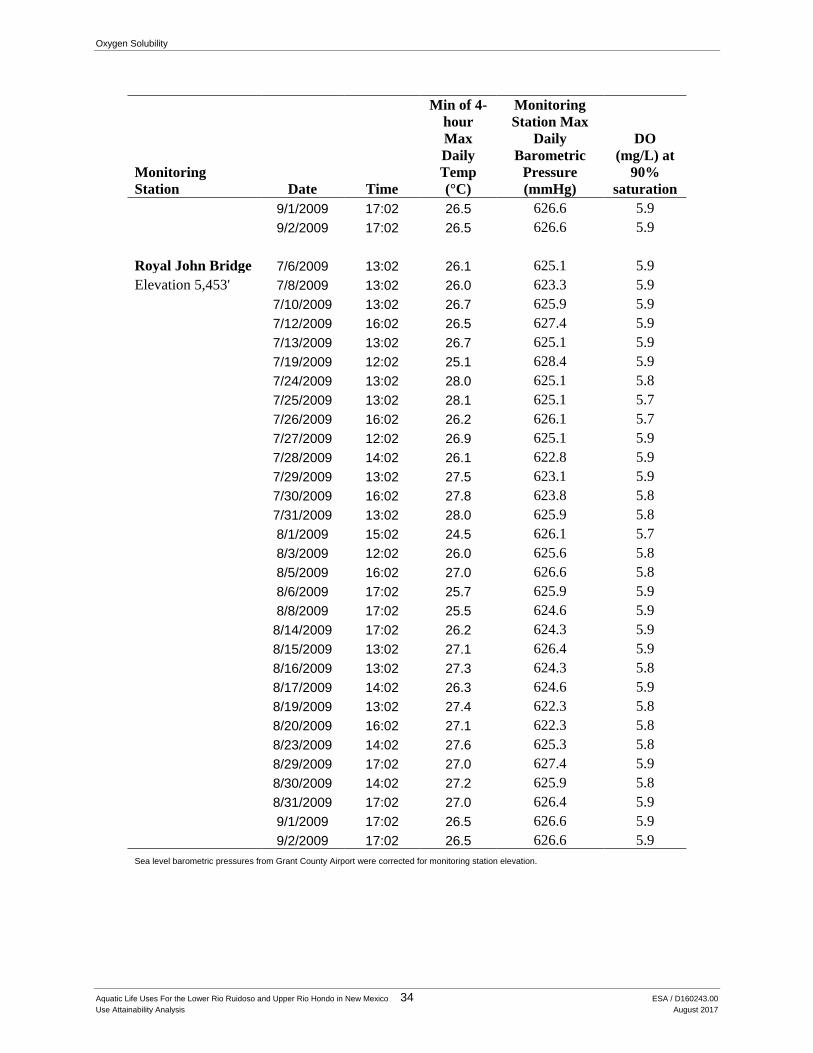
Oxygen Solubility
Aquatic Life Uses For the Lower Rio Ruidoso and Upper Rio Hondo in New Mexico 34 ESA / D160243.00 Use Attainability Analysis August 2017
Monitoring Station Date Time
Min of 4-hour Max Daily Temp (°C)
Monitoring Station Max
Daily Barometric
Pressure (mmHg)
DO (mg/L) at
90% saturation
9/1/2009 17:02 26.5 626.6 5.9 9/2/2009 17:02 26.5 626.6 5.9 Royal John Bridge 7/6/2009 13:02 26.1 625.1 5.9 Elevation 5,453' 7/8/2009 13:02 26.0 623.3 5.9 7/10/2009 13:02 26.7 625.9 5.9 7/12/2009 16:02 26.5 627.4 5.9 7/13/2009 13:02 26.7 625.1 5.9 7/19/2009 12:02 25.1 628.4 5.9 7/24/2009 13:02 28.0 625.1 5.8 7/25/2009 13:02 28.1 625.1 5.7 7/26/2009 16:02 26.2 626.1 5.7 7/27/2009 12:02 26.9 625.1 5.9 7/28/2009 14:02 26.1 622.8 5.9 7/29/2009 13:02 27.5 623.1 5.9 7/30/2009 16:02 27.8 623.8 5.8 7/31/2009 13:02 28.0 625.9 5.8 8/1/2009 15:02 24.5 626.1 5.7 8/3/2009 12:02 26.0 625.6 5.8 8/5/2009 16:02 27.0 626.6 5.8 8/6/2009 17:02 25.7 625.9 5.9 8/8/2009 17:02 25.5 624.6 5.9 8/14/2009 17:02 26.2 624.3 5.9 8/15/2009 13:02 27.1 626.4 5.9 8/16/2009 13:02 27.3 624.3 5.8 8/17/2009 14:02 26.3 624.6 5.9 8/19/2009 13:02 27.4 622.3 5.8 8/20/2009 16:02 27.1 622.3 5.8 8/23/2009 14:02 27.6 625.3 5.8 8/29/2009 17:02 27.0 627.4 5.9 8/30/2009 14:02 27.2 625.9 5.8 8/31/2009 17:02 27.0 626.4 5.9 9/1/2009 17:02 26.5 626.6 5.9 9/2/2009 17:02 26.5 626.6 5.9 Sea level barometric pressures from Grant County Airport were corrected for monitoring station elevation.

Aquatic Life Observations
Aquatic Life Uses For the Lower Rio Ruidoso and Upper Rio Hondo in New Mexico 35 ESA / D160243.00 Use Attainability Analysis August 2017
6. AQUATIC LIFE OBSERVATIONS Other lines of evidence that have been used in determining proper attainable aquatic life use designations in New Mexico streams are the thermal preferences of fish species that have been recorded during historical and recent observations of aquatic life (SWQB 2014a, SWQB 2014b). Available information for the Rio Ruidoso includes research on historical distributions of fish species in the Rio Ruidoso and upper Rio Hondo, and data from the most recent fish surveys conducted by the SWQB in September 2015. The SWQB used the backpack electrofishing method to collect, identify, count, and measure fish of different species in four reaches of the Rio Ruidoso on September 16 and 17, 2015 (SWQB 2015b). Research on historical information included reviewing data compiled by the University of New Mexico, Museum of Southwestern Biology and New Mexico Natural Heritage Program; consultation with the New Mexico Department of Game and Fish (NMDGF) and SWQB; and literature searches. Historical observations provide information on the distribution of fish species before many of the anthropogenic stressors that have occurred in recent years.
The fisheries data and information on fisheries management in the Rio Ruidoso and Rio Hondo were examined for evidence of the extent of populations of coldwater fish species in the Rio Ruidoso, either recently or historically. Information on the size classes and collectors’ observations can indicate if the fish were hatchery stocked individuals or whether there may be successfully reproducing populations of coldwater species.
The extent of coldwater species regulation in the Rio Ruidoso, as stated in the 2016 Statewide Fisheries Management Plan (NMDGF 2016a), is another indication of geographic distribution. Where water bodies such as the Rio Ruidoso are designated as Winter Trout Waters in the NMG&F fishing regulations, and hatchery-reared triploid rainbow trout are stocked as a “put and take” sport fishery only between November and March (NMDGF 2016a), when temperatures are suitable for trout. NMDGF’s 2015 stocking schedule listed 20,000 10-inch triploid rainbow trout annually. NMDGF manages a wild population of non-native brown trout in the Rio Ruidoso from the Mescalero Apache reservation downstream to Friedenbloom Drive, meaning that brown trout are maintained in the upper river by natural reproduction without any stocking.
6.1 Historical Observations Searching historical data compiled by the University of New Mexico, Museum of Southwestern Biology (MSB), the earliest records for Rio Ruidoso fish communities date to 1963, with two surveys also conducted in 1975, and more recent surveys in 1990 and 2003 (MSB 2016, Table 10). Each survey documented five to six fish species, with some studies conducted at multiple locations. Of the five surveys, only the April 1990 survey found multiple individuals of any coldwater species. Only warmwater and coolwater species were found in the other four historical Rio Ruidoso surveys, with the exception of a single brown trout specimen captured in 2003. None of the species found in the Rio Ruidoso appeared in a recent compilation of imperiled fish species of North America, with the exception of the Rio Grande chub whose population is classified as vulnerable in the Pecos freshwater ecoregion
Aquatic Life Observations
Aquatic Life Uses For the Lower Rio Ruidoso and Upper Rio Hondo in New Mexico 36 ESA / D160243.00 Use Attainability Analysis August 2017
(Jelks et al. 2008). Survey findings are summarized below by WQS Segment, from upstream to downstream.
In addition to the data presented in Table 10 and below by assessment unit, the New Mexico Department of Game and Fish has conducted several fish surveys of the upper Rio Ruidoso in the immediate Ruidoso area between 1998 and 2009, collecting longnose dace, brown trout and rainbow trout, with all three species consistently represented (NMDGF 2016b). They have also collected Rio Grande chub and white sucker in the lower reaches of the river.
Historical Fish Surveys in Rio Ruidoso, U.S. Highway 70 Bridge to Carrizo Creek (Segment 20.6.4.209)
• Longnose dace, a coolwater species, was collected by the University of Tulane in 1975 in the Rio Ruidoso at a location 3 miles east of Ruidoso Downs.
• A 2003 MSB survey collected longnose dace, Rio Grande chub, and one non-native brown trout individual at a site above U.S. highway 70.
Historical Fish Surveys in Rio Ruidoso, Eagle Creek to U.S. Highway 70 Bridge (Segment 20.6.4.208)
No historical fish survey data were found documenting the fish communities in this assessment unit.
Historical Fish Surveys in Rio Ruidoso, Rio Bonito to Eagle Creek (Segment 20.6.4.208)
• A 1963 Tulane University study found warmwater longfin dace and fathead minnows, in addition to several coolwater species: longnose dace, Sonora sucker, and Chihuahuan chub. The same species were found in the 1975 Tulane survey near Hondo, New Mexico, with the exception that white sucker was identified rather than Sonora sucker.
• An April 1990 MSB survey collected 5 specimens of non-native rainbow trout, a coldwater species, in addition to longnose dace and Rio Grande chub, at a site near San Patricio, New Mexico. Further downstream near the town of Hondo at Lincoln County Road E18 they collected these same three species in addition to white sucker, Rio Grande mountain sucker, and 9 specimens of another non-native coldwater species: brown trout. The presence of the coldwater fish in this spring survey do not indicate they survived a summer season of warm temperatures, as the trout may have been flushed into the lower reaches from the cooler habitat upstream.

Aquatic Life Observations
Aquatic Life Uses For the Lower Rio Ruidoso and Upper Rio Hondo in New Mexico 37 ESA / D160243.00 Use Attainability Analysis August 2017
TABLE 10. SUMMARY OF HISTORICAL FISH SPECIES OBSERVATIONS IN THE RIO RUIDOSO.
Survey Date Provider WQS Segment Location Species Abundance
Thermal Preference
7/24/1963 TU 20.6.4.208 2.5 mi. SE Hondo, just off Hwy. 380
Rhinichthys cataractae 450 Coolwater
Pimephales promelas confertus
374 Warmwater
Catostomus insignis 61 Coolwater
Agosia chrysogaster 1 Warmwater
Gila nigrescens 111 Coolwater
Fundulus zibrinus 51 Warmwater
3/19/1975
9/18/1975
TU
TU
20.6.4.209
20.6.4.209
Vicinity of San Patricio
3 mi. E of Ruidoso Downs, U.S. Hwy. 70
Gila pandora
Rhinichthys cataractae
?
13
Coolwater
Coolwater
20.6.4.208
2.5 mi. SE of Hondo, Hwy. 395
Pimephales promelas 6 Warmwater
Rhinichthys cataractae 19 Coolwater
Gila pandora 72 Coolwater
Catostomus commersonii 10 Coolwater
Agosia chrysogaster 30 Warmwater
4/19/1990 MSB 20.6.4.208 1.6 km west of San
Patricio, Lincoln Co. Rd E16 bridge
Rhinichthys cataractae 71 Coolwater
Gila pandora 3 Coolwater
Oncorhynchus mykiss 5 Coldwater
Lincoln Co. Road E18, 0.5 mi. W of U.S. Hwy. 70 and U.S. Hwy. 380
junction
Rhinichthys cataractae 27 Coolwater
Gila pandora 7 Coolwater

Aquatic Life Observations
Aquatic Life Uses For the Lower Rio Ruidoso and Upper Rio Hondo in New Mexico 38 ESA / D160243.00 Use Attainability Analysis August 2017
Survey Date Provider WQS Segment Location Species Abundance
Thermal Preference
Oncorhynchus sp. 9 Coldwater
Salmo trutta 9 Coldwater
Pantosteus plebeius 1 Coolwater
Catostomus commersonii 2 Coolwater
9/16/2003 MSB 20.6.4.209 Above U.S. Hwy. 70 Rhinichthys cataractae 3 Coolwater
Salmo trutta 1 Coldwater Gila pandora 3 Coolwater
9/15/2003 MSB 20.6.4.208 1.6 km above confluence with Rio Bonito
Rhinichthys cataractae 1 Coolwater
Gila pandora 2 Coolwater
Catostomus commersonii 1 Coolwater
TU = Tulane University Museum of Natural History - Royal D. Suttkus Fish Collection MSB = Museum of Southwestern Biology, University of New Mexico
• The 2003 MSB survey also collected fish from a lower reach of Segment 20.6.4.208 approximately 1.6 km above the Rio Ruidoso confluence with the Rio Bonito. Above the Rio Bonito confluence, they collected longnose dace, Rio Grande chub, and white suckers. More information on the 2003 fish survey is included in a water quality survey summary for the Rio Hondo watershed (SWQB 2013b) including the summary statements that (1) all locations were dominated by native cool water species, and (2) the nonnative brown trout and rainbow trout were the only cold water species present.
Historical Fish Surveys in Rio Hondo, Bonney Canyon to Rio Ruidoso
In the downstream waters of the Rio Hondo, historical observations of fish communities date back 100 years and include survey data from nearly every decade through 2003 (MSB 2016, Table 11). In addition to the vulnerable Rio Grande chub that has been identified in most surveys, the Pecos pupfish that was documented in the 1916 survey is listed as an endangered species (Jelks et al. 2008). Other species documented in the Rio Hondo were longnose dace, fathead minnow, white sucker, Rio Grande sucker, Chihuahuan chub, and brown trout. All fish documented in 19 surveys on the Rio Hondo were coolwater or warmwater species, with the exception of one brown trout specimen captured near Hondo in March, 1991. The presence of this one coldwater fish in a spring survey does not indicate it survived a summer season of warm temperatures, as the trout may have been flushed into the Rio Hondo from the cooler tributaries upstream.
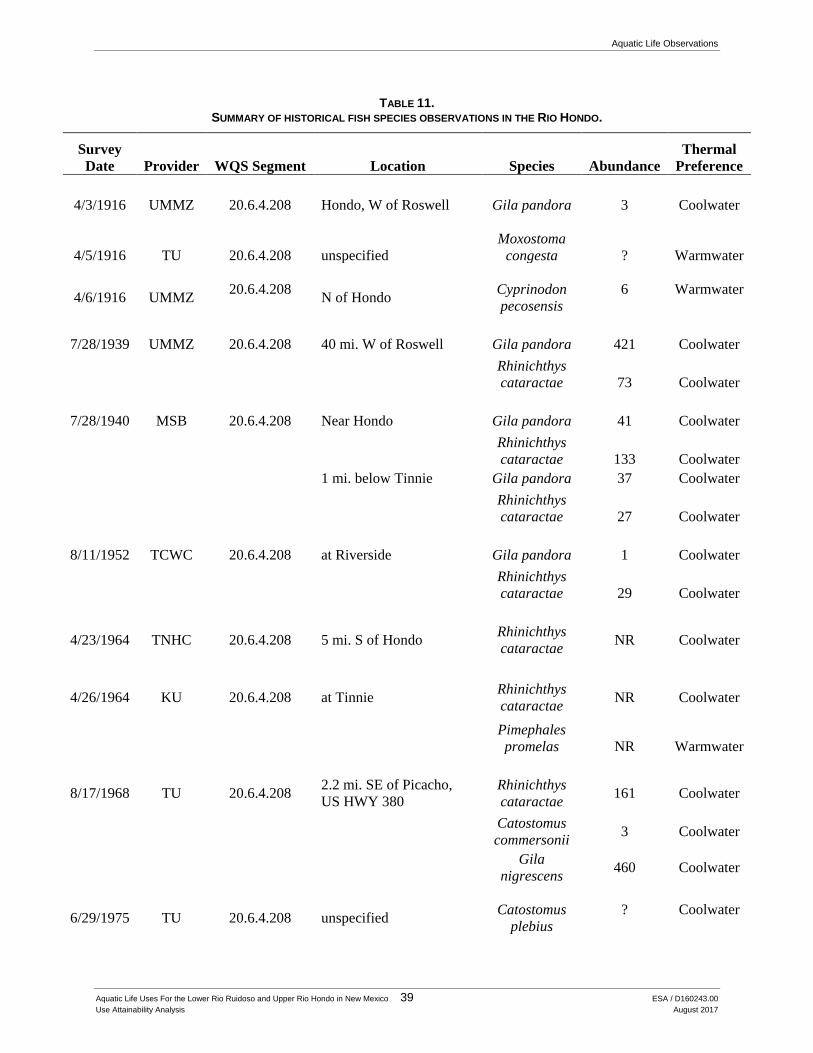
Aquatic Life Observations
Aquatic Life Uses For the Lower Rio Ruidoso and Upper Rio Hondo in New Mexico 39 ESA / D160243.00 Use Attainability Analysis August 2017
TABLE 11. SUMMARY OF HISTORICAL FISH SPECIES OBSERVATIONS IN THE RIO HONDO.
Survey Date Provider WQS Segment Location Species Abundance
Thermal Preference
4/3/1916 UMMZ 20.6.4.208 Hondo, W of Roswell Gila pandora 3 Coolwater
4/5/1916 TU 20.6.4.208 unspecified
Moxostoma
congesta ? Warmwater
4/6/1916
UMMZ 20.6.4.208
N of Hondo
Cyprinodon pecosensis
6 Warmwater
7/28/1939 UMMZ 20.6.4.208 40 mi. W of Roswell Gila pandora 421 Coolwater
Rhinichthys cataractae 73 Coolwater
7/28/1940 MSB 20.6.4.208 Near Hondo Gila pandora 41 Coolwater
Rhinichthys cataractae 133 Coolwater
1 mi. below Tinnie Gila pandora 37 Coolwater
Rhinichthys cataractae 27 Coolwater
8/11/1952 TCWC 20.6.4.208 at Riverside Gila pandora 1 Coolwater
Rhinichthys cataractae 29 Coolwater
4/23/1964 TNHC 20.6.4.208 5 mi. S of Hondo Rhinichthys cataractae NR Coolwater
4/26/1964 KU 20.6.4.208 at Tinnie Rhinichthys cataractae NR Coolwater
Pimephales promelas NR Warmwater
8/17/1968 TU 20.6.4.208 2.2 mi. SE of Picacho, US HWY 380
Rhinichthys cataractae 161 Coolwater
Catostomus commersonii 3 Coolwater
Gila nigrescens 460 Coolwater
6/29/1975
TU
20.6.4.208
unspecified
Catostomus
plebius ? Coolwater
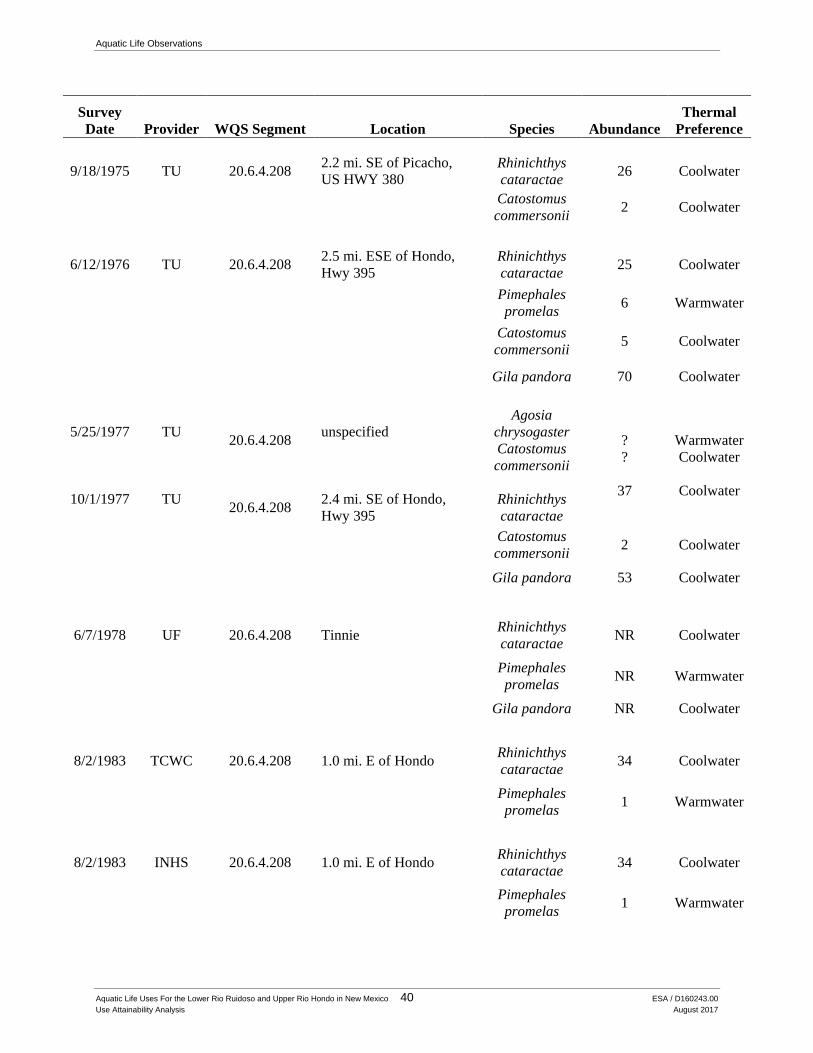
Aquatic Life Observations
Aquatic Life Uses For the Lower Rio Ruidoso and Upper Rio Hondo in New Mexico 40 ESA / D160243.00 Use Attainability Analysis August 2017
Survey Date Provider WQS Segment Location Species Abundance
Thermal Preference
9/18/1975
TU
20.6.4.208
2.2 mi. SE of Picacho, US HWY 380
Rhinichthys cataractae
26
Coolwater
Catostomus commersonii 2 Coolwater
6/12/1976 TU 20.6.4.208 2.5 mi. ESE of Hondo, Hwy 395
Rhinichthys cataractae 25 Coolwater
Pimephales promelas 6 Warmwater
Catostomus commersonii 5 Coolwater
Gila pandora 70 Coolwater
5/25/1977
10/1/1977
TU
TU
20.6.4.208
20.6.4.208
unspecified 2.4 mi. SE of Hondo, Hwy 395
Agosia chrysogaster Catostomus commersonii
Rhinichthys cataractae
? ?
37
Warmwater Coolwater
Coolwater
Catostomus commersonii 2 Coolwater
Gila pandora 53 Coolwater
6/7/1978 UF 20.6.4.208 Tinnie Rhinichthys cataractae NR Coolwater
Pimephales promelas NR Warmwater
Gila pandora NR Coolwater
8/2/1983 TCWC 20.6.4.208 1.0 mi. E of Hondo Rhinichthys cataractae 34 Coolwater
Pimephales promelas 1 Warmwater
8/2/1983 INHS 20.6.4.208 1.0 mi. E of Hondo Rhinichthys cataractae 34 Coolwater
Pimephales promelas 1 Warmwater

Aquatic Life Observations
Aquatic Life Uses For the Lower Rio Ruidoso and Upper Rio Hondo in New Mexico 41 ESA / D160243.00 Use Attainability Analysis August 2017
Survey Date Provider WQS Segment Location Species Abundance
Thermal Preference
Catostomus commersonii 5 Coolwater
Gila pandora 70 Coolwater
4/20/1990 MSB 20.6.4.208 at NM HWY 395 bridge, just E of Hondo
Rhinichthys cataractae 2 Coolwater
Gila pandora 2 Coolwater
Pantosteus
plebeius 2 Coolwater
3/12/1991 MSB 20.6.4.208 at NM HWY 395 bridge, just E of Hondo
Rhinichthys cataractae
9 Coolwater
Gila pandora 66 Coolwater
Catostomus commersonii
96 Coolwater
Salmo trutta 1 Coldwater
9/16/2003 MSB 20.6.4.208 at Riverside on US HWY 380
Rhinichthys cataractae
2 Coolwater
Gila pandora 2 Coolwater
Pantosteus
plebeius 2 Coolwater UMMZ = University of Michigan Ann Arbor TNHC = University of Texas at Austin UF = University of Florida TCWC = Texas A&M, Texas Cooperative Wildlife Collection KU = University of Kansas TU = Tulane University Museum of Natural History - Royal D. Suttkus Fish Collection MSB = Museum of Southwestern Biology, University of New Mexico NR = not reported
6.2 September 2015 SWQB Fish Surveys SWQB staffs conducted an electrofishing survey at four reaches of the Rio Ruidoso in mid-September 2015 (Table 12, SWQB 2015b). Only coolwater species were found near Highway 70 at the upper end of Segment 20.6.4.208. Collectors noted that the rainbow trout collected upstream in Segment 20.6.4.209 appeared to be hatchery stocked with total lengths between 260 and 320 mm. Brown trout ranged in total length from 100 to 280 mm below the Ruidoso Downs Racetrack. Brown trout likely mature at age 2-3 or approximately 100 to 150 mm in length (Belica 2007), after which time growth slows to roughly 5 cm per year (Simpson and Wallace 1982). Therefore, the brown trout below the racetrack were likely adults

Aquatic Life Observations
Aquatic Life Uses For the Lower Rio Ruidoso and Upper Rio Hondo in New Mexico 42 ESA / D160243.00 Use Attainability Analysis August 2017
between 2 and 6 years old. No young-of-the-year or juvenile brown trout were captured and it is unknown if the specimens found below the racetrack over-summered in this reach or were washed downstream from cooler upstream reaches during summer monsoon storms. Multiple size classes of longnose dace and Rio Grande chub were present, indicating successfully reproducing populations of these two coolwater species in both upper and lower Rio Ruidoso stream segments.
TABLE 12. SUMMARY OF RESULTS FROM 2015 SWQB FISH SURVEYS.
Survey Date WQS Segment Location
River Mile Species Abundance
Thermal Preference
9/17/2015 20.6.4.208 Below new WWTP, mile marker 267.5, Hwy70 30.2 Rhinichthys
cataractae 45 Coolwater
Gila pandora 123 Coolwater
9/16/2015 20.6.4.209 Below Ruidoso Downs Racetrack @ Joe Welch Dr
39.4 Rhinichthys cataractae 24 Coolwater
Gila pandora 3 Coolwater
Oncorhynchus sp. 3 Coldwater
Salmo trutta 20 Coldwater
9/16/2015 20.6.4.209 Above Carrizo Creek 45.3 Rhinichthys cataractae 67 Coolwater
Oncorhynchus mykiss 1 Coldwater
Salmo trutta 30 Coldwater
9/16/2015 20.6.4.209 At Mescalero boundary at USGS Gauge 08386505 52.4 Rhinichthys
cataractae 27 Coolwater
Salmo trutta 39 Coldwater

Aquatic Life Observations
Aquatic Life Uses For the Lower Rio Ruidoso and Upper Rio Hondo in New Mexico 43 ESA / D160243.00 Use Attainability Analysis August 2017
Of the six native and introduced species documented in the Rio Ruidoso according to the MSB historical database, four were collected during the 2015 survey. However, the recent survey did not include the lower Rio Ruidoso reaches of Segment 20.6.4.208 where the white sucker and Rio Grande mountain sucker were found historically. Below the U.S. highway 70 bridge in Segment20.6.4.208, only the coolwater species longnose dace and Rio Grande chub were collected in 2015. The coldwater species brown trout and a few rainbow trout were collected at upstream locations in Segment 20.6.4.209 listed as impaired for temperature under the Clean Water Act Section 303(d)/Section 305(b) Integrated Report (SWQB 2016a). The trout presence suggests that refugia from high temperatures may exist in the upper river reaches, allowing trout to escape higher temperatures downstream.
6.3 Reference Site Aquatic Life Observations The Mimbres River UAA summarized information from historical observations dating to 1944, and more recent fish surveys conducted in 2009 and 2010 (SWQB 2014a). Historical data indicated that three to five fish species can be considered native to the watershed, including the beautiful shiner, Chihuahuan chub, Rio Grande sucker and fathead minnow. Several successfully introduced species have also been recorded often from 1947 to the present, including rainbow trout and longfin dace. All of the native fish species found in the Mimbres basin are either coolwater or warmwater species.
The most recent assessments of fish in the Mimbres River showed that the introduced rainbow trout are able to persist in the upper reaches, but also can be found in segments of the stream that exceed both acute and chronic temperature criteria for coldwater use (SWQB 2014a). It is unknown whether refugia from high temperatures may exist in the lower river, rainbow trout may move in and out of less optimal habitat as a result of numerous pressures, or the fish are washed into the lower reaches during high flow events.
To better understand the potential for success of coldwater fish, size classes in the upper and lower segments of the Mimbres River were evaluated (SWQB 2014a). A variety of size classes present within a species (e.g., young-of-the-year and/or juvenile fish in addition to adults) would likely indicate a successfully reproducing population. The analysis showed that distinct habitat zones were not consistent with currently assigned ALUs. The warmwater longfin dace was present in upstream and downstream segments in size classes indicating a reproducing population tolerant of a wide range of stream temperatures. Coolwater species were also found in multiple size classes, with Chihuahuan chub found mostly in the upper segment and Rio Grande sucker in the lower river segment. Conversely, only a few adult rainbow trout were found in the lower river survey just south of Mimbres, New Mexico.

Aquatic Life Uses For the Lower Rio Ruidoso and Upper Rio Hondo in New Mexico 44 ESA / D160243.00 Use Attainability Analysis August 2017
7. DISCUSSION AND AQUATIC LIFE USE RECOMMENDATIONS
The Rio Ruidoso flows from headwaters near the 12,003-foot Sierra Blanca Peak generally eastward to the confluence with the Rio Bonito near the town of Hondo, New Mexico (elevation 5,230), passing through four Level IV ecoregions (Griffith et al. 2006). The variations in geomorphology along this gradient produce significant changes in hydrology, riparian vegetation, and water quality. The transition from Rocky Mountain Conifer Forests to Madrean Lower Montane Woodlands occurs near the Ruidoso fault zone and in the vicinity of the Hollywood stream gauging station at the Friedenbloom Drive bridge. East of the Ruidoso fault zone, the important aquifers are principally in Quaternary alluvium along major drainages (Newcomer and Shoemaker 1991). The shallowest aquifers within valleys and along drainages are unconfined and are in hydraulic connection with surface drainages. Comparisons of flow measurements taken during four years of the RRMP (Parametrix 2013) showed that the lower Rio Ruidoso is generally a losing reach between the Vigil and Tully monitoring sites in Segment 20.6.4.208, indicating that any groundwater inflows are minor and the loss of surface flows in the river channel to the alluvial aquifer increases as the floodplain widens.
7.1 Upper Rio Ruidoso Upstream from the Hollywood area the river is incised and confined in a narrow valley providing nearly continuous shade from mountain slopes, coniferous forests, and riparian deciduous trees. Downstream from Hollywood the river enters a broader floodplain where stream shading is intermittent as the river meanders through irrigated pastures and fields. The extent of riparian shade in these floodplain areas before agricultural development began is unknown; however, modeling performed as part of the 2006 TMDL found that increasing total shade from 7 to 15% could reduce maximum water temperatures by only 0.2°C (SWQB 2006). Much of the river is exposed to direct solar radiation between the racetrack at Ruidoso Downs and Fox Cave, an area that includes portions of the river upstream and downstream of the U.S. highway 70 bridge. Below a short reach where the channel is confined between the forested hillsides and the highway around Fox Cave, the Rio Ruidoso flows through a broad irrigated floodplain for most of its lower reaches to the Rio Hondo.
Air-water temperature modeling and thermograph data suggest that coldwater aquatic life use is not attainable throughout much of the Rio Ruidoso, even above Carrizo Creek in the Rocky Mountain Conifer Forest ecoregion. However, from the Mescalero Apache reservation boundary downstream to Friedenbloom Drive, (Hollywood, New Mexico) NMDGF (2016a) applies a Special Trout Water regulation in managing a brown trout population that is maintained through natural reproduction. It appears that spring-fed cold water and/or refugia exist in the upper Rio Ruidoso that may support a reproducing population of brown trout, demonstrating that the coldwater ALU is attainable above Hollywood, despite occurrences of high air temperatures. The Rio Ruidoso is also designated as Winter Trout Waters and managed as a put-and-take fishery for hatchery-raised rainbow trout (NMDGF 2016a). The Winter Trout Waters designation is used where temperatures may not be suitable for year-round reproducing populations. Consistent with the fisheries management information, the most recent fish

Discussion and Aquatic Life Use Recommendations
Aquatic Life Uses For the Lower Rio Ruidoso and Upper Rio Hondo in New Mexico 45 ESA / D160243.00 Use Attainability Analysis August 2017
surveys in the upper river segment noted that the few rainbow trout collected appeared to be hatchery stocked fish in the same size class, while the more numerous brown trout at sites above the U.S. Highway 70 bridge were in multiple size classes (SWQB 2015b). The larger brown trout were more abundant below the Rio Downs Racetrack. The reproduction of brown trout may be limited to reaches upstream from Hollywood, with some larger individuals migrating downstream or washed downstream during high flow events.
7.2 Lower Rio Ruidoso As the Rio Ruidoso transitions from the Rocky Mountain Conifer Forests to the Madrean Lower Montane Woodlands ecoregion, stream shading is diminished and both measured and modeled temperatures increase. The transition from defined incised canyons to a wider meandering active channel that may be occupied by flood waters during snowmelt and major storm events causes changes to the flow path in the middle and lower reaches of the Rio Ruidoso, limiting persistent riparian shading in some parts of the active channel. Oxygen solubility modeling indicates that the 6.0 mg/L minimum DO criterion for coldwater ALU is commonly not attainable in the lower Rio Ruidoso, due to conditions of water temperature, barometric pressure, and specific conductance.
During the most recent fish survey, only the coolwater species longnose dace and Rio Grande chub were present downstream from the U.S. Highway 70 bridge. Rio Ruidoso historical fish observations since 1963 from three miles east of Ruidoso Downs to 1.6 miles above the confluence with the Rio Bonito have not documented any coldwater fish species in the Rio Ruidoso, with the exception of April 1990 surveys and a September 2003 survey (MSB 2016). The 1990 survey collected five rainbow trout in the lower river near San Patricio, New Mexico, and nine specimens each of rainbow trout and brown trout near Hondo, New Mexico. The 2003 survey noted one brown trout individual collected above U.S. Highway 70. There is no evidence that reproducing populations of coldwater species are present in the lower river segment. Several warmwater fish species were reported in the lower Rio Ruidoso in surveys before 1990, and all surveys collected coolwater species at each location.
The preponderance of evidence from geomorphic and hydrologic changes, ecoregion information, thermograph measurements, AWTC monitoring, oxygen solubility modeling, and fish surveys indicates that the coldwater ALU is not attainable in the Rio Ruidoso below Hollywood; however, a coolwater designation is appropriate and attainable for the remainder of the river downstream from Hollywood to the Rio Bonito confluence.
7.3 Rio Hondo Downstream from the Rio Ruidoso and Rio Bonito confluence, the Rio Hondo flows through the Southern New Mexico Dissected Plains ecoregion characterized by sparse vegetative cover (Griffith et al. 2006), with an increasingly warm climate. AWTC modeling indicated that a coldwater ALU designation is even less attainable in the Rio Hondo than the lower Rio Ruidoso, and in fact the modeled MWAT exceeded the threshold where uses more restrictive than warmwater are generally not attainable. All fish documented in the Rio Hondo since 2016 were coolwater or warmwater species, with the exception of one brown trout individual captured near Hondo in 1991. The presence of several coolwater species in

Discussion and Aquatic Life Use Recommendations
Aquatic Life Uses For the Lower Rio Ruidoso and Upper Rio Hondo in New Mexico 46 ESA / D160243.00 Use Attainability Analysis August 2017
each historical fish survey suggests that it is appropriate to extend a coolwater ALU designation downstream from the lower Rio Ruidoso through the Rio Hondo in Segment 20.6.4-2208.
7.4 Reference Site Comparisons Because the Rio Ruidoso has been substantially impacted by anthropogenic stressors, it is useful to evaluate sites in less-impacted reference stream reaches located in similar geophysical and ecological settings – to help characterize the natural temperature conditions and aquatic life uses that may be attainable. Sites on the lower Mimbres River below Allie Canyon were selected as the best fit of ecoregional, geophysical, and land use characteristics for use as minimally impacted reference sites in comparisons to the lower Rio Ruidoso. The Mimbres River has the added advantage of having available for comparisons the recent data collection and analyses completed for several sites within ecoregion 23b as part of a UAA (SWQB 2014a).
• Both the 2009 thermograph and modeled temperature statistics compared to criteria suggested that, for the reach downstream of the Upper TNC (i.e., Mimbres River below Allie Canyon), the coldwater ALU is not attainable and the TMAX suggested coolwater to warmwater ALU transitions are likely to be more appropriate and attainable (SWQB 2014a). Similarly, most of the thermograph-generated statistics for Rio Ruidoso sites below Hollywood exceeded coldwater temperature criteria (except data from 2003, a year that was a hydrologic anomaly) and AWTC-modeled temperature statistics exceeded coldwater recommendations.
• Mimbres River oxygen solubility modeling results were similar to results for the lower Rio Ruidoso, indicating that the minimum DO criterion is not attainable under natural conditions, and providing evidence that the coldwater designation is not attainable under a natural range of water temperatures due to physical factors (i.e., elevation, atmospheric pressure) that cannot be changed.
• Similar to the recent and historical fish surveys for the Rio Ruidoso, all of the native fish species found in the Mimbres basin are either coolwater or warmwater species. The most recent assessments of fish in both rivers showed that introduced trout are able to persist in the upper reaches, and also can be found in segments of the stream that exceed both acute and chronic temperature criteria for coldwater use.
• A variety of size classes within a species (e.g., young-of-the-year and/or juveniles present in addition to adult fish) would likely indicate a successfully reproducing population, however, size class information demonstrated that coldwater species were only found in significant numbers and multiple size classes in the upper reaches of the Rio Ruidoso and Mimbres River. Only a few adult rainbow trout were found in the survey downstream from Mimbres, New Mexico, and only a limited number of adults of coldwater species were found in the lower Rio Ruidoso.
The Mimbres River UAA concluded with recommending changes to ALU designations that included moving the lower river segment boundary upstream from Willow Springs to Allie Canyon and changing the ALU from coldwater to coolwater below Allie Canyon. These recommendations were part of changes to the water quality standards approved by the WQCC effective March 2, 2017, and subsequently approved by the USEPA on May 26, 2017. Mimbres River UAA conclusions, based on very similar information to what is presented in this UAA for the Rio Ruidoso within the same aquatic ecoregion, found that a coldwater ALU was not attainable in the relatively undisturbed Mimbres River watershed, due to Factor 1 in 40 CFR 131.10(g).

Discussion and Aquatic Life Use Recommendations
Aquatic Life Uses For the Lower Rio Ruidoso and Upper Rio Hondo in New Mexico 47 ESA / D160243.00 Use Attainability Analysis August 2017
7.5 Aquatic Life Use Recommendations The boundary between Rio Ruidoso Segment 20.6.4.208 and 20.6.4.209 should be moved from the U.S. Highway 70 bridge location upstream to Hollywood where the Ruidoso fault zone and transition from the Rocky Mountain Conifer Forests to the Madrean Lower Montane Woodlands ecoregion coincide with reduced stream shading, a change from a hydrologically gaining to losing stream, increased air and water temperatures, the downstream end of wild trout management in the watershed, and a lack of reproducing populations of coldwater fish species. The lower Rio Ruidoso segment from Hollywood to the confluence with Rio Bonito, and the Rio Hondo upstream from Bonney Canyon should be removed from Segment 20.6.4.208, placed in a new Segment 20.6.4.230, and re-designated from coldwater to coolwater ALU.
These changes in ALU designation are supported by the weight of evidence from water temperature monitoring, AWTC modeling, recent and historical fish surveys, and comparisons to the relatively undisturbed Mimbres River that is similar in latitude, elevation and ecoregions. While the segment-specific maximum water temperature criterion (30 °C) was only rarely exceeded in monitoring during 5 summer seasons, natural ambient air temperatures (i.e., naturally occurring thermal pollution) prevent the attainment of the default coldwater ALU temperature criteria in the lower Rio Ruidoso and Rio Hondo. Although extensive anthropogenic stressors have been documented, these natural factors indicate a transition from coldwater to coolwater at Hollywood:
Ruidoso fault zone and geologic change from a narrow canyon to a broad floodplain, with reduced topographic shade
Change from a gaining stream to a losing stream where surface flows are distributed to a broad alluvial aquifer
Change from Rocky Mountain Conifer Forest to Madrean Lower Montane Woodland ecoregion with reduced shade from ponderosa pine forests
Increased air temperatures moving out of the pine forest and into lower elevations resulting in higher water temperatures
Inability to consistently meet the minimum DO criterion for coldwater ALU.
Segment 20.6.4.208 also includes several high-elevation streams where a coldwater ALU is likely attainable (perennial reaches of the Rio Peñasco above state highway 24 near Dunken, perennial reaches of the Rio Bonito downstream from state highway 48 [near Angus], and perennial reaches of Agua Chiquita). These high-elevation streams were not studied in this UAA and it is recommended that they remain unchanged in Segment 20.6.4.208 with a coldwater ALU. In summary, the following changes to the water quality standards are recommended:
20.6.4.208 PECOS RIVER BASIN - Perennial reaches of the Rio Peñasco and its tributaries above state highway 24 near Dunken, perennial reaches of the Rio Bonito downstream from state highway 48 (near Angus), the Rio Ruidoso downstream of the U.S. highway 70 bridge near Seeping Springs lakes, perennial reaches of the Rio Hondo upstream from Bonney canyon and perennial reaches of Agua Chiquita.
Discussion and Aquatic Life Use Recommendations
Aquatic Life Uses For the Lower Rio Ruidoso and Upper Rio Hondo in New Mexico 48 ESA / D160243.00 Use Attainability Analysis August 2017
A. Designated Uses: fish culture, irrigation, livestock watering, wildlife habitat, coldwater aquatic life and primary contact.
NOTE: This segment was divided effective MM-DD-YYYY. The standards for portions of the Rio Ruidoso and Rio Hondo that are not included in this segment are under 20.6.4.230 NMAC.
20.6.4.209 PECOS RIVER BASIN - Perennial reaches of Eagle creek upstream of Alto dam to the Mescalero Apache boundary, perennial reaches of the Rio Bonito and its tributaries upstream of state highway 48 (near Angus) excluding Bonito lake, and perennial reaches of the Rio Ruidoso and its tributaries upstream of Hollywood at the Friedenbloom Drive bridge near Seeping Springs lakes, above and below the Mescalero Apache boundary.
A. Designated Uses: domestic water supply, high quality coldwater aquatic life, irrigation, livestock watering, wildlife habitat, public water supply and primary contact.
NOTE: This segment was divided effective MM-DD-YYYY. The standards for portions of the Rio Ruidoso that are not included in this segment are under 20.6.4.230 NMAC.
20.6.4.230 PECOS RIVER BASIN – Perennial reaches of the Rio Ruidoso downstream of Hollywood at the Friedenbloom Drive bridge, and perennial reaches of the Rio Hondo upstream from Bonney canyon.
A. Designated Uses: fish culture, irrigation, livestock watering, wildlife habitat, coolwater aquatic life and primary contact.
Aquatic Life Uses For the Lower Rio Ruidoso and Upper Rio Hondo in New Mexico 49 ESA / D160243.00 Use Attainability Analysis August 2017
8. REFERENCES Belica, L. 2007. Brown trout (Salmo trutta): A technical conservation assessment. USDA Forest Service,
Rocky Mountain Region, Species Conservation Project. Laramie, Wyoming. https://www.fs.usda.gov/Internet/FSE_DOCUMENTS/stelprdb5209386.pdf
Clothier, V. and Vrooman, S. 2010. Rio Ruidoso assessment. Stream Dynamics. Silver City, New Mexico. July 30, 2010. http://www.restoration-ecology.net/images/watershed-assessment/Rio-Ruidoso-Assessment-Report.pdf.
Griffith, G.E., Omernik, J.M., McGraw, M.M., Jacobi, G.Z., Canavan, C.M., Schrader, T.S., Mercer, D., Hill, R., and Moran, B.C. 2006. Ecoregions of New Mexico. U.S. Environmental Protection Agency, Western Ecology Region. https://nhnm.unm.edu/sites/default/files/nonsensitive/publications/other/M06GRI01NMUS_front.pdf.
Jelks, H.L., S.J. Walsh, N.M. Burkhead, S. Contreras-Balderas, E. Diaz-Pardo, D.A. Hendrickson, J. Lyons, N.E. Mandrak, F. McCormick, J.S. Nelson, S.P. Platania, B.A. Porter, C.B. Renaud, J.J. Schmitter-Soto, E.B. Taylor and M.L. Warren, Jr. 2008. Conservation status of imperiled North American freshwater and diadromous fishes. In Fisheries Vol. 33 No. 8: 372 – 401. American Fisheries Society. Bethesda, Maryland. http://www.fs.fed.us/rm/pubs_other/rmrs_2008_jelks_h001.pdf.
MSB. 2016. Fish data obtained from the University of Tulane Museum of Natural History – Royal D. Suttkus Fish Collection and the University of New Mexico Museum of Southwestern Biology. Accessed through the Fishnet2 portal. March 14, 2016. http://www.fishnet2.net/search.aspx.
NCEI. 2016. Summary of monthly normals, 1981-2010, for Station Picacho, NM US GHCND:USC00296804. National Oceanic and Atmospheric Administration, National Centers for Environmental Information. Asheville, North Carolina.
Newcomer, R.W. Jr. and J.W. Shomaker. 1991. Water resources of the Ruidoso-Carrizozo-Tularosa areas, Lincoln and Otero Counties, New Mexico. New Mexico Geological Society Guidebook, 42nd Field Conference: Sierra Blanca, Sacramento, Capitan Ranges. Pgs 339 – 342. https://nmgs.nmt.edu/publications/guidebooks/downloads/42/42_p0339_p0341.pdf.
NMDGF. 2016a. Trout and salmon regulations. New Mexico Department of Game and Fish. Santa Fe, New Mexico. http://www.wildlife.state.nm.us/fishing/game-fish/cold-water-regulations-2/.
NMDGF. 2016b. Personal e-mail communications with Eric Frey and Shawn Denny. New Mexico Department of Game and Fish. Santa Fe, New Mexico. March 16, 2016.
NMWQCC. 2011. State of New Mexico statewide water quality management plan and continuing planning process. New Mexico Water Quality Control Commission. Santa Fe, New Mexico. December 23, 2011.
NovaLynx. 2016. Elevation correction tables for barometric pressure sensors. NovaLynx Corporation. Grass Valley, California. http://novalynx.com/manuals/bp-elevation-correction-tables.pdf

References
Aquatic Life Uses For the Lower Rio Ruidoso and Upper Rio Hondo in New Mexico 50 ESA / D160243.00 Use Attainability Analysis August 2017
NRCS. 2012. Rapid watershed assessment: Rio Hondo watershed. Natural Resources Conservation Service, U.S. Department of Agriculture. Albuquerque, New Mexico.
Parametrix. 2009. Rio Ruidoso Monitoring Program: Quality Assurance Project Plan. Prepared by Parametrix, Inc. Albuquerque, New Mexico. May 8, 2009.
Parametrix. 2013. Rio Ruidoso Monitoring Program: Draft Project Completion Report. Prepared for Village of Ruidoso and City of Ruidoso Downs by Parametrix, Inc. Albuquerque, New Mexico. February 2013.
PRISM. 2016. Data explorer: Time series values for individual locations. PRISM Climate Group. Northwest Alliance for Computational Science and Engineering. Oregon State University. Corvallis, Oregon. http://www.prism.oregonstate.edu/explorer/
Ruidoso News. 2016. Public notice of Use Attainability Analysis: Aquatic life uses for the lower Rio Ruidoso in New Mexico. May 4, 2016. Ruidoso, New Mexico.
Simpson, J.C. and R.L. Wallace. 1982. Fishes of Idaho. University of Idaho Press. Moscow, Idaho. 238 pp.
Stallings. 2016. Designation change explored for section of the Rio Ruidoso. Interview published in the Ruidoso News. January 21, 2016. Ruidoso, New Mexico.
SWQB. 2006. Final approved total maximum daily load (TMDL) for the Rio Hondo watershed (Lincoln County): Pecos River to headwaters. New Mexico Environment Department. Surface Water Quality Bureau. Santa Fe, New Mexico. February 10, 2006. https://www.env.nm.gov/swqb/RioHondo-LincolnCounty/RioHondoTMDL-LincolnCounty.pdf
SWQB. 2010. Water quality survey summary for the Rio Hondo watershed (Rio Ruidoso and selected tributaries) 2003. New Mexico Environment Department. Surface Water Quality Bureau. Santa Fe, New Mexico. June 2010.
SWQB. 2011. Air-water temperature correlation. New Mexico Environment Department. Surface Water Quality Bureau. Santa Fe, New Mexico. August 2011.
SWQB. 2014a. Use attainability analysis: Aquatic life uses for the Mimbres River in New Mexico. Public discussion draft. New Mexico Environment Department. Surface Water Quality Bureau. Santa Fe, New Mexico. March 2014.
SWQB. 2014b. Use attainability analysis: Aquatic life uses for the Animas River in New Mexico. Final draft. New Mexico Environment Department. Surface Water Quality Bureau. Santa Fe, New Mexico. July 7, 2014.
SWQB. 2015a. Total maximum daily load (TMDL) for the Sacramento Mountains (Rio Hondo, Tularosa, and Rio Peñasco Watersheds): Final draft. New Mexico Environment Department. Surface Water Quality Bureau. Santa Fe, New Mexico. July 31, 2015.
SWQB. 2015b. Rio Ruidoso fish ecology report. Unpublished data from the New Mexico Environment Department. Surface Water Quality Bureau. Santa Fe, New Mexico.
References
Aquatic Life Uses For the Lower Rio Ruidoso and Upper Rio Hondo in New Mexico 51 ESA / D160243.00 Use Attainability Analysis August 2017
SWQB. 2016a. WQCC-approved 2016 – 2018 State of New Mexico Clean Water Act Section 303(d)/Section 305(b) integrated report: Appendix A – Integrated list. New Mexico Environment Department. Surface Water Quality Bureau. Santa Fe, New Mexico. June 14, 2016. https://www.env.nm.gov/swqb/303d-305b/2016-2018/documents/FINALDRAFT2016APPA--IntegratedList.pdf
SWQB. 2016b. Total maximum daily load (TMDL) for the Rio Ruidoso: EPA-approved. New Mexico Environment Department. Surface Water Quality Bureau. Santa Fe, New Mexico. December 13, 2016. https://www.env.nm.gov/swqb/TMDL/SacramentoMnts/RioRuidosonutrientTMDLs_EPAapproved_121316.pdf
SWQB. 2016c. Quality assurance project plan for water quality monitoring programs, 2016. New Mexico Environment Department. Surface Water Quality Bureau. Santa Fe, New Mexico. January 26, 2016. https://www.env.nm.gov/swqb/QAPP/2016QAPPFinal_Complete_withAppendices_Approval_Signatures.pdf
SWQB. 2017. Dissolved oxygen listing methodology. New Mexico Environment Department. Surface Water Quality Bureau. Santa Fe, New Mexico. June 14, 2017. https://www.env.nm.gov/wp-content/uploads/2017/03/FINAL-2018-APP-E-DO.pdf
TUHWC. 2004. Watershed restoration action strategy (WRAS): Upper Rio Hondo, 2nd edition. Prepared by The Upper Hondo Watershed Coalition. Ruidoso, New Mexico. April, 2004.
USEPA. 1994. Water quality standards handbook: Chapter 2: Designation of Uses. U.S. Environmental Protection Agency. Office of Water. Washington, D.C. EPA 823-B-94-0005a. August 1994.
USEPA. 2012. U.S. Level III and IV Ecoregions. Mapping service provided by U.S. Environmental Protection Agency. Research Triangle Park. Durham, North Carolina. April 26, 2012. https://catalog.data.gov/dataset/u-s-level-iii-and-iv-ecoregions-u-s-epa
USGS. 2016a. Surface water data for USA: USGS surface-water monthly statistics. U.S. Geological Survey. National water system information: Web interface. September 15, 2016. http://waterdata.usgs.gov/nwis/monthly?referred_module=sw&site_no=08387000&por_08387000_99999=559093,00060,99999,1953-10,2016-03&format=html_table&date_format=YYYY-MM-DD&rdb_compression=file&submitted_form=parameter_selection_list
USGS. 2016b. Dissolved oxygen solubility tables. U.S. Geological Survey. Reston, Virginia. Last modified December 5, 2016. https://water.usgs.gov/software/DOTABLES/
USGS. 2017. Water quality data for Mimbres River at Mimbres, New Mexico. U.S. Geological Survey National Water Information System database. https://nwis.waterdata.usgs.gov/nwis/qwdata/?site_no=08477110&agency_cd=USGS¶m_group=PHY&format=rdb
Weather Underground. 2017a. Custom search of weather history for KSRR, Sierra Blanca Regional Airport, Ruidoso, New Mexico. The Weather Company, LLC. https://www.wunderground.com/history/airport/KSRR/2017/7/11/CustomHistory.html?req_city=Ruidoso%20Downs&req_state=NM&reqdb.zip=88346&reqdb.magic=1&reqdb.wmo=99999

References
Aquatic Life Uses For the Lower Rio Ruidoso and Upper Rio Hondo in New Mexico 52 ESA / D160243.00 Use Attainability Analysis August 2017
Weather Underground. 2017b. Custom search of weather history for KSVC, Grant County Airport, Silver City, New Mexico. The Weather Company, LLC. https://www.wunderground.com/history/airport/KSVC/2017/7/11/CustomHistory.html?req_city=Silver%20City&req_state=NM&reqdb.zip=88061&reqdb.magic=1&reqdb.wmo=99999

Aquatic Life Uses For the Lower Rio Ruidoso and Upper Rio Hondo in New Mexico A-1 ESA / D160243.00 Use Attainability Analysis August 2017
APPENDIX A
USGS SURFACE WATER DATA: MONTHLY MEAN DISCHARGE FOR RIO RUIDOSO AT HOLLYWOOD, NEW MEXICO

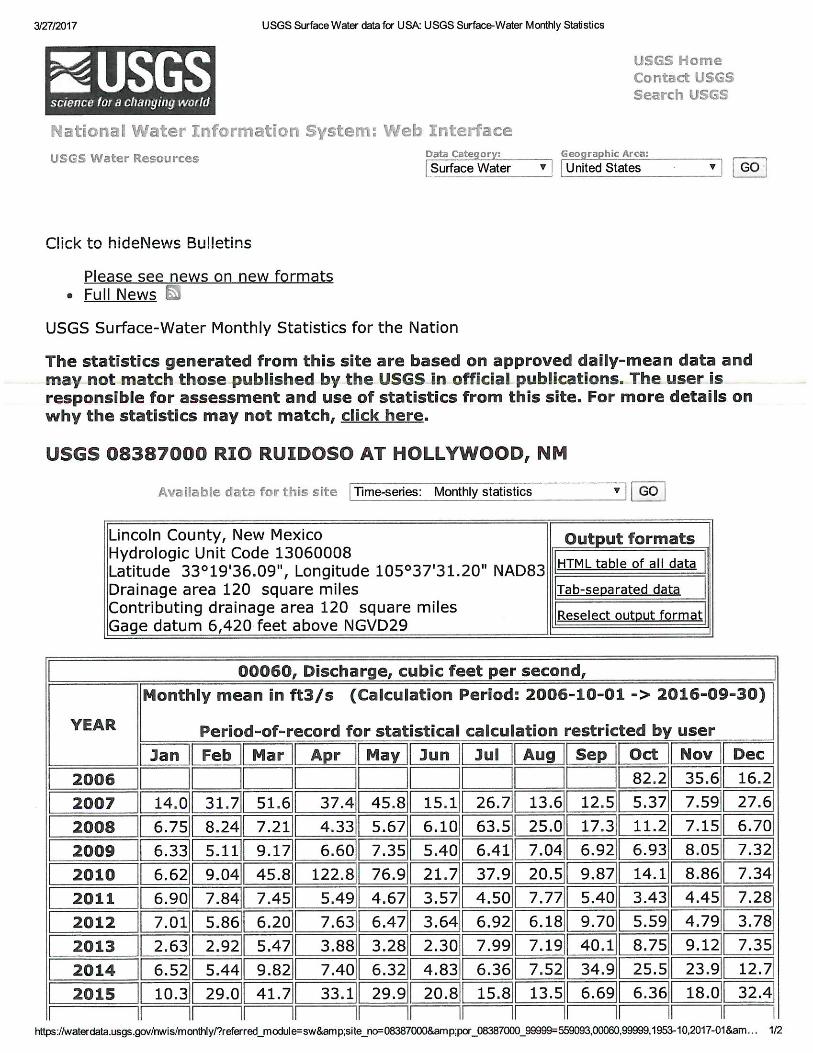

Aquatic Life Uses For the Lower Rio Ruidoso and Upper Rio Hondo in New Mexico B-1 ESA / D160243.00 Use Attainability Analysis August 2017
APPENDIX B
OXYGEN SOLUBILITY MODELING INPUT AND RESULTS BY STATION AND MONTH

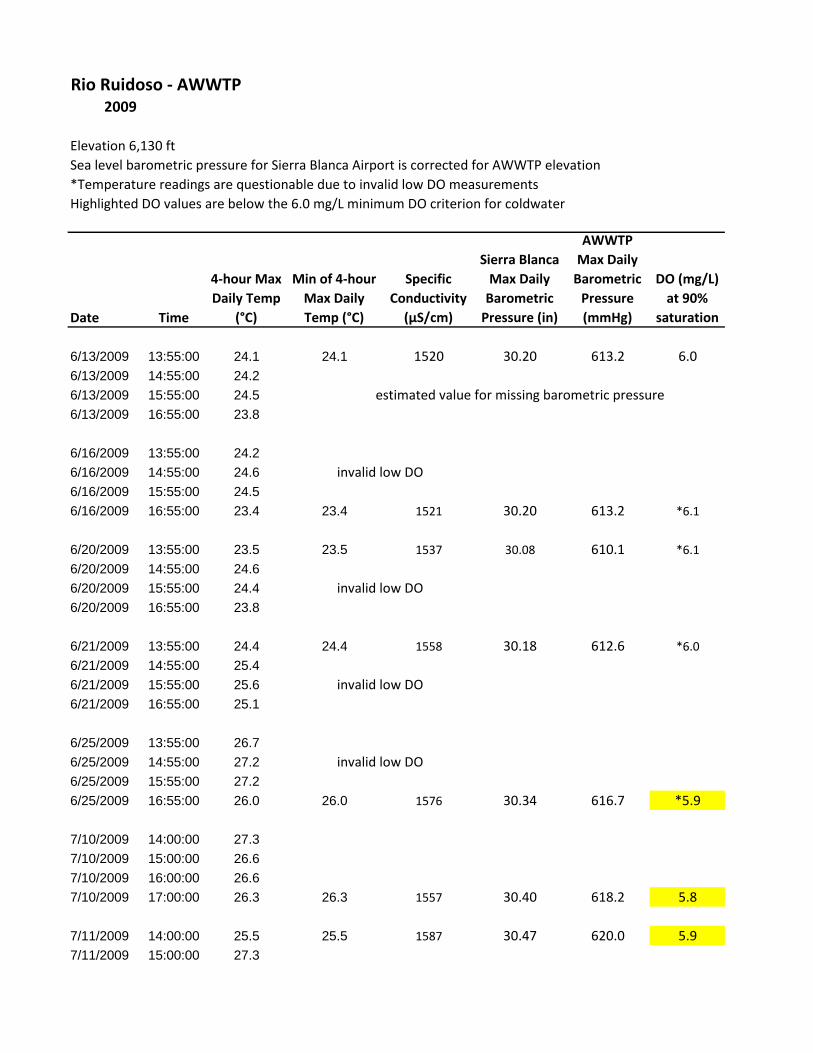
Rio Ruidoso - AWWTP2009
Elevation 6,130 ft
Sea level barometric pressure for Sierra Blanca Airport is corrected for AWWTP elevation
*Temperature readings are questionable due to invalid low DO measurements
Highlighted DO values are below the 6.0 mg/L minimum DO criterion for coldwater
Date Time
4-hour Max
Daily Temp
(°C)
Min of 4-hour
Max Daily
Temp (°C)
Specific
Conductivity
(µS/cm)
Sierra Blanca
Max Daily
Barometric
Pressure (in)
AWWTP
Max Daily
Barometric
Pressure
(mmHg)
DO (mg/L)
at 90%
saturation
6/13/2009 13:55:00 24.1 24.1 1520 30.20 613.2 6.0
6/13/2009 14:55:00 24.2
6/13/2009 15:55:00 24.5 estimated value for missing barometric pressure
6/13/2009 16:55:00 23.8
6/16/2009 13:55:00 24.2
6/16/2009 14:55:00 24.6
6/16/2009 15:55:00 24.5
6/16/2009 16:55:00 23.4 23.4 1521 30.20 613.2 *6.1
6/20/2009 13:55:00 23.5 23.5 1537 30.08 610.1 *6.1
6/20/2009 14:55:00 24.6
6/20/2009 15:55:00 24.4
6/20/2009 16:55:00 23.8
6/21/2009 13:55:00 24.4 24.4 1558 30.18 612.6 *6.0
6/21/2009 14:55:00 25.4
6/21/2009 15:55:00 25.6
6/21/2009 16:55:00 25.1
6/25/2009 13:55:00 26.7
6/25/2009 14:55:00 27.2
6/25/2009 15:55:00 27.2
6/25/2009 16:55:00 26.0 26.0 1576 30.34 616.7 *5.9
7/10/2009 14:00:00 27.3
7/10/2009 15:00:00 26.6
7/10/2009 16:00:00 26.6
7/10/2009 17:00:00 26.3 26.3 1557 30.40 618.2 5.8
7/11/2009 14:00:00 25.5 25.5 1587 30.47 620.0 5.9
7/11/2009 15:00:00 27.3
invalid low DO
invalid low DO
invalid low DO
invalid low DO
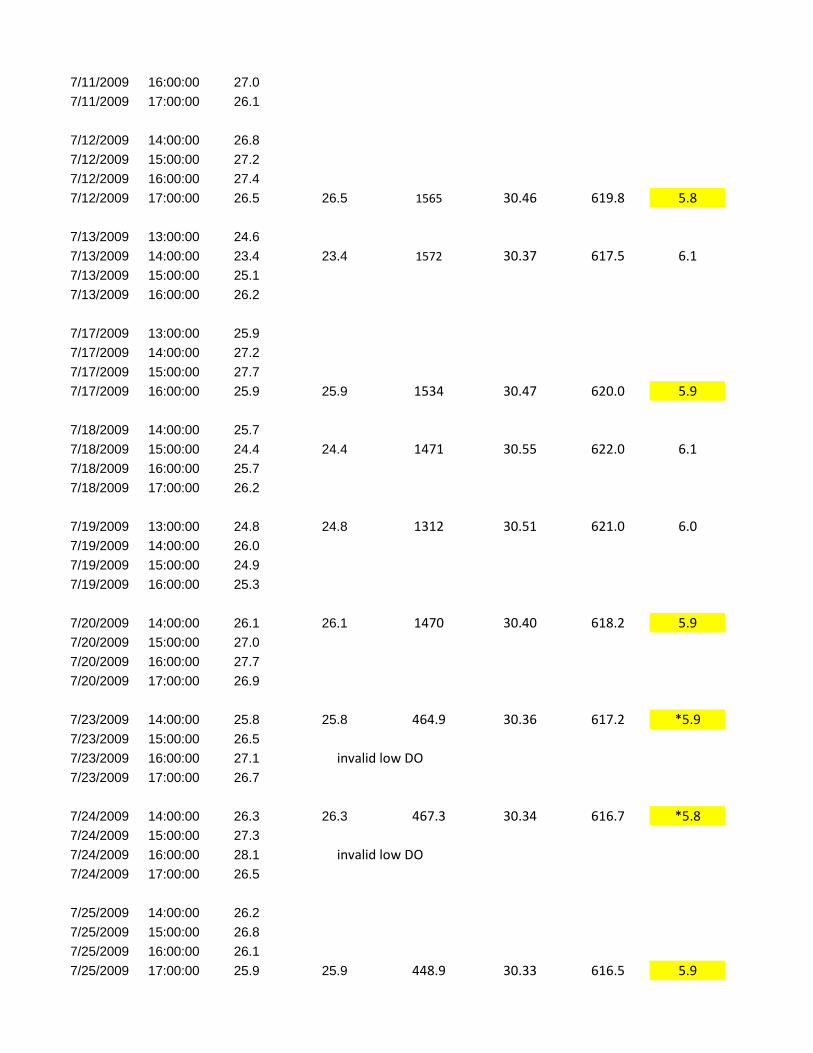
7/11/2009 16:00:00 27.0
7/11/2009 17:00:00 26.1
7/12/2009 14:00:00 26.8
7/12/2009 15:00:00 27.2
7/12/2009 16:00:00 27.4
7/12/2009 17:00:00 26.5 26.5 1565 30.46 619.8 5.8
7/13/2009 13:00:00 24.6
7/13/2009 14:00:00 23.4 23.4 1572 30.37 617.5 6.1
7/13/2009 15:00:00 25.1
7/13/2009 16:00:00 26.2
7/17/2009 13:00:00 25.9
7/17/2009 14:00:00 27.2
7/17/2009 15:00:00 27.7
7/17/2009 16:00:00 25.9 25.9 1534 30.47 620.0 5.9
7/18/2009 14:00:00 25.7
7/18/2009 15:00:00 24.4 24.4 1471 30.55 622.0 6.1
7/18/2009 16:00:00 25.7
7/18/2009 17:00:00 26.2
7/19/2009 13:00:00 24.8 24.8 1312 30.51 621.0 6.0
7/19/2009 14:00:00 26.0
7/19/2009 15:00:00 24.9
7/19/2009 16:00:00 25.3
7/20/2009 14:00:00 26.1 26.1 1470 30.40 618.2 5.9
7/20/2009 15:00:00 27.0
7/20/2009 16:00:00 27.7
7/20/2009 17:00:00 26.9
7/23/2009 14:00:00 25.8 25.8 464.9 30.36 617.2 *5.9
7/23/2009 15:00:00 26.5
7/23/2009 16:00:00 27.1
7/23/2009 17:00:00 26.7
7/24/2009 14:00:00 26.3 26.3 467.3 30.34 616.7 *5.8
7/24/2009 15:00:00 27.3
7/24/2009 16:00:00 28.1
7/24/2009 17:00:00 26.5
7/25/2009 14:00:00 26.2
7/25/2009 15:00:00 26.8
7/25/2009 16:00:00 26.1
7/25/2009 17:00:00 25.9 25.9 448.9 30.33 616.5 5.9
invalid low DO
invalid low DO

7/26/2009 13:00:00 25.8 25.8 396.1 30.40 618.2 5.9
7/26/2009 14:00:00 27.3
7/26/2009 15:00:00 28.3
7/26/2009 16:00:00 27.2
7/28/2009 13:00:00 26.0
7/28/2009 14:00:00 25.7
7/28/2009 15:00:00 25.7 25.7 417.9 30.29 615.4 5.9
7/28/2009 16:00:00 25.7
7/30/2009 14:00:00 25.8
7/30/2009 15:00:00 26.1
7/30/2009 16:00:00 24.8 24.8 457.3 30.32 616.2 *6.0
7/30/2009 17:00:00 24.9
8/5/2009 14:00:00 26.4 26.4 1501 30.43 619.0 5.8
8/5/2009 15:00:00 27.2
8/5/2009 16:00:00 27.2
8/5/2009 17:00:00 26.6
8/8/2009 14:00:00 24.9
8/8/2009 15:00:00 25.8
8/8/2009 16:00:00 25.6
8/8/2009 17:00:00 24.5 24.5 859.2 30.29 615.4 6.0
8/9/2009 13:00:00 24.3 24.3 857.8 30.31 616.0 6.0
8/9/2009 14:00:00 25.0
8/9/2009 15:00:00 25.8
8/9/2009 16:00:00 24.9
8/12/2009 13:00:00 24.4 24.4 858.4 30.46 619.8 6.1
8/12/2009 14:00:00 26.1
8/12/2009 15:00:00 26.5
8/12/2009 16:00:00 24.6
8/14/2009 15:00:00 25.6
8/14/2009 16:00:00 26.1
8/14/2009 17:00:00 25.7
8/14/2009 18:00:00 24.6 24.6 841.4 30.29 615.4 6.0
8/15/2009 14:00:00 24.9
8/15/2009 15:00:00 25.4
8/15/2009 16:00:00 25.4
8/15/2009 17:00:00 24.9 24.9 861.4 30.25 614.4 6.0
8/16/2009 14:00:00 24.6 24.6 886.9 30.30 615.7 6.0
invalid low DO

8/16/2009 15:00:00 25.7
8/16/2009 16:00:00 26.0
8/16/2009 17:00:00 25.6
8/17/2009 14:00:00 25.0 25.0 870.9 30.32 616.2 6.0
8/17/2009 15:00:00 25.8
8/17/2009 16:00:00 26.2
8/17/2009 17:00:00 25.8
8/19/2009 15:00:00 25.6
8/19/2009 16:00:00 25.9
8/19/2009 17:00:00 25.7
8/19/2009 18:00:00 24.9 24.9 879.6 30.22 613.7 *6.0
8/29/2009 14:00:00 24.0
8/29/2009 15:00:00 25.0
8/29/2009 16:00:00 25.2
8/29/2009 17:00:00 23.5 23.5 790.3 30.42 618.7 6.1
invalid low DO
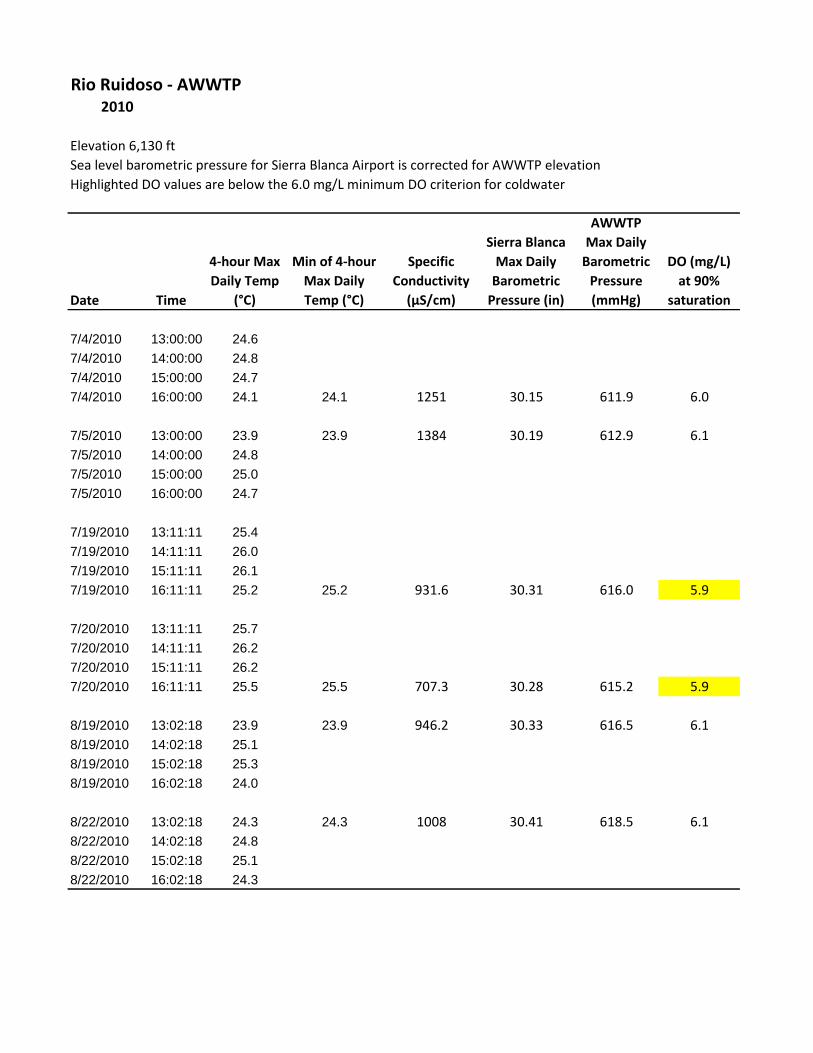
Rio Ruidoso - AWWTP2010
Elevation 6,130 ft
Sea level barometric pressure for Sierra Blanca Airport is corrected for AWWTP elevation
Highlighted DO values are below the 6.0 mg/L minimum DO criterion for coldwater
Date Time
4-hour Max
Daily Temp
(°C)
Min of 4-hour
Max Daily
Temp (°C)
Specific
Conductivity
(µS/cm)
Sierra Blanca
Max Daily
Barometric
Pressure (in)
AWWTP
Max Daily
Barometric
Pressure
(mmHg)
DO (mg/L)
at 90%
saturation
7/4/2010 13:00:00 24.6
7/4/2010 14:00:00 24.8
7/4/2010 15:00:00 24.7
7/4/2010 16:00:00 24.1 24.1 1251 30.15 611.9 6.0
7/5/2010 13:00:00 23.9 23.9 1384 30.19 612.9 6.1
7/5/2010 14:00:00 24.8
7/5/2010 15:00:00 25.0
7/5/2010 16:00:00 24.7
7/19/2010 13:11:11 25.4
7/19/2010 14:11:11 26.0
7/19/2010 15:11:11 26.1
7/19/2010 16:11:11 25.2 25.2 931.6 30.31 616.0 5.9
7/20/2010 13:11:11 25.7
7/20/2010 14:11:11 26.2
7/20/2010 15:11:11 26.2
7/20/2010 16:11:11 25.5 25.5 707.3 30.28 615.2 5.9
8/19/2010 13:02:18 23.9 23.9 946.2 30.33 616.5 6.1
8/19/2010 14:02:18 25.1
8/19/2010 15:02:18 25.3
8/19/2010 16:02:18 24.0
8/22/2010 13:02:18 24.3 24.3 1008 30.41 618.5 6.1
8/22/2010 14:02:18 24.8
8/22/2010 15:02:18 25.1
8/22/2010 16:02:18 24.3
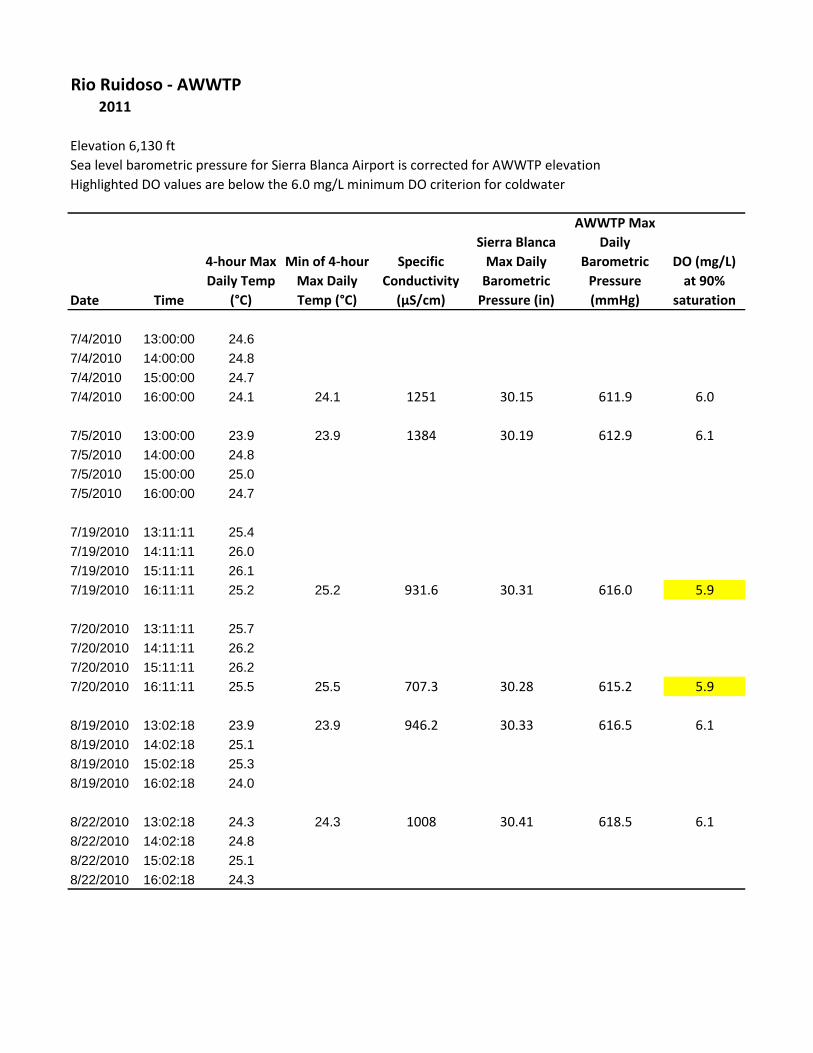
Rio Ruidoso - AWWTP2011
Elevation 6,130 ft
Sea level barometric pressure for Sierra Blanca Airport is corrected for AWWTP elevation
Highlighted DO values are below the 6.0 mg/L minimum DO criterion for coldwater
Date Time
4-hour Max
Daily Temp
(°C)
Min of 4-hour
Max Daily
Temp (°C)
Specific
Conductivity
(µS/cm)
Sierra Blanca
Max Daily
Barometric
Pressure (in)
AWWTP Max
Daily
Barometric
Pressure
(mmHg)
DO (mg/L)
at 90%
saturation
7/4/2010 13:00:00 24.6
7/4/2010 14:00:00 24.8
7/4/2010 15:00:00 24.7
7/4/2010 16:00:00 24.1 24.1 1251 30.15 611.9 6.0
7/5/2010 13:00:00 23.9 23.9 1384 30.19 612.9 6.1
7/5/2010 14:00:00 24.8
7/5/2010 15:00:00 25.0
7/5/2010 16:00:00 24.7
7/19/2010 13:11:11 25.4
7/19/2010 14:11:11 26.0
7/19/2010 15:11:11 26.1
7/19/2010 16:11:11 25.2 25.2 931.6 30.31 616.0 5.9
7/20/2010 13:11:11 25.7
7/20/2010 14:11:11 26.2
7/20/2010 15:11:11 26.2
7/20/2010 16:11:11 25.5 25.5 707.3 30.28 615.2 5.9
8/19/2010 13:02:18 23.9 23.9 946.2 30.33 616.5 6.1
8/19/2010 14:02:18 25.1
8/19/2010 15:02:18 25.3
8/19/2010 16:02:18 24.0
8/22/2010 13:02:18 24.3 24.3 1008 30.41 618.5 6.1
8/22/2010 14:02:18 24.8
8/22/2010 15:02:18 25.1
8/22/2010 16:02:18 24.3

Rio Ruidoso - AWWTP2012
Elevation 6,130 ft
Sea level barometric pressure for Sierra Blanca Airport is corrected for AWWTP elevation
*Temperature readings are questionable due to invalid low DO measurements
Highlighted DO values are below the 6.0 mg/L minimum DO criterion for coldwater
Date Time
4-hour Max
Daily Temp
(°C)
Min of 4-hour
Max Daily
Temp (°C)
Specific
Conductivity
(µS/cm)
Sierra Blanca
Max Daily
Barometric
Pressure (in)
AWWTP
Max Daily
Barometric
Pressure
(mmHg)
DO (mg/L)
at 90%
saturation
6/14/2012 13:00:00 25.0
6/14/2012 14:00:00 25.2
6/14/2012 15:00:00 25.2
6/14/2012 16:00:00 24.5 24.5 1592 30.16 612.1 6.0
6/15/2012 13:00:00 24.3
6/15/2012 14:00:00 25.0
6/15/2012 15:00:00 25.0
6/15/2012 16:00:00 24.2 24.2 1594 30.22 613.7 6.0
6/20/2012 13:11:11 24.6 24.6 428.7 30.18 612.6 *6.0
6/20/2012 14:11:11 25.3
6/20/2012 15:11:11 25.6 invalid low DO
6/20/2012 16:11:11 24.8
6/21/2012 14:00 24.2 24.2 421 30.36 617.2 *6.1
6/21/2012 15:00 24.8
6/21/2012 16:00 24.9 invalid low DO
6/21/2012 17:00 24.6
6/24/2012 14:00 24.4 24.4 423 30.34 616.7 *6.1
6/24/2012 15:00 25.1
6/24/2012 16:00 25.2 invalid low DO
6/24/2012 17:00 24.6
7/11/2012 14:00:00 24.0 24.0 736.4 30.41 618.5 6.1
7/11/2012 15:00:00 24.3
7/11/2012 16:00:00 24.4
7/11/2012 17:00:00 24.2
7/12/2012 14:00:00 25.3
7/12/2012 15:00:00 26.2
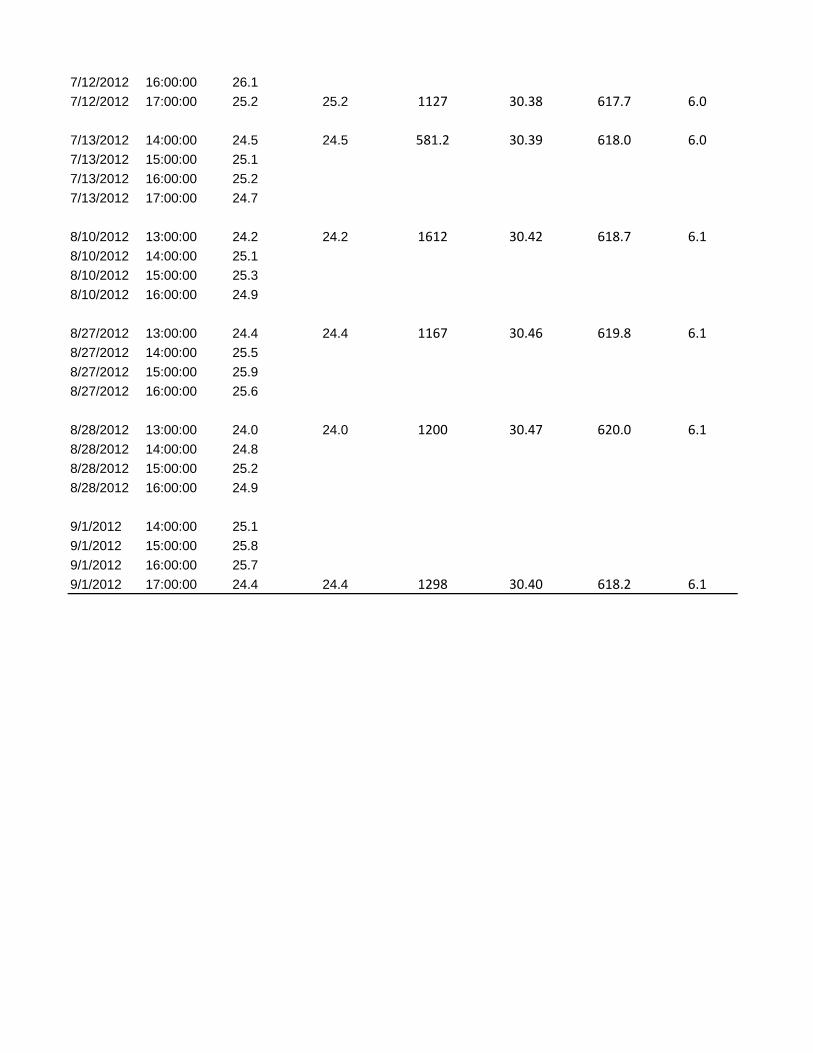
7/12/2012 16:00:00 26.1
7/12/2012 17:00:00 25.2 25.2 1127 30.38 617.7 6.0
7/13/2012 14:00:00 24.5 24.5 581.2 30.39 618.0 6.0
7/13/2012 15:00:00 25.1
7/13/2012 16:00:00 25.2
7/13/2012 17:00:00 24.7
8/10/2012 13:00:00 24.2 24.2 1612 30.42 618.7 6.1
8/10/2012 14:00:00 25.1
8/10/2012 15:00:00 25.3
8/10/2012 16:00:00 24.9
8/27/2012 13:00:00 24.4 24.4 1167 30.46 619.8 6.1
8/27/2012 14:00:00 25.5
8/27/2012 15:00:00 25.9
8/27/2012 16:00:00 25.6
8/28/2012 13:00:00 24.0 24.0 1200 30.47 620.0 6.1
8/28/2012 14:00:00 24.8
8/28/2012 15:00:00 25.2
8/28/2012 16:00:00 24.9
9/1/2012 14:00:00 25.1
9/1/2012 15:00:00 25.8
9/1/2012 16:00:00 25.7
9/1/2012 17:00:00 24.4 24.4 1298 30.40 618.2 6.1

Rio Ruidoso - Vigil2010
Elevation 6,101 ft
Sea level barometric pressure for Sierra Blanca Airport is corrected for Vigil elevation
Highlighted DO values are below the 6.0 mg/L minimum DO criterion for coldwater
Date Time
4-hour Max
Daily Temp
(°C)
Min of 4-hour
Max Daily
Temp (°C)
Specific
Conductivity
(µS/cm)
Sierra Blanca
Max Daily
Barometric
Pressure (in)
Vigil Max
Daily
Barometric
Pressure
(mmHg)
DO (mg/L)
at 90%
saturation
7/19/2010 15:00:00 24.4 24.4 1156 30.31 616.5 6.0
7/19/2010 16:00:00 25.1
7/19/2010 17:00:00 25.5
7/19/2010 18:00:00 25.2
7/20/2010 16:00:00 25.2
7/20/2010 17:00:00 25.5
7/20/2010 18:00:00 25.3
7/20/2010 19:00:00 24.4 24.4 1194 30.28 615.7 6.0

Rio Ruidoso - Vigil2011
Elevation 6,101 ft
Sea level barometric pressure for Sierra Blanca Airport is corrected for Vigil elevation
*Temperature readings are questionable due to invalid low DO measurements
Conservatively assumed a conductivity of 400 µS/cm where readings invalid
Highlighted DO values are below the 6.0 mg/L minimum DO criterion for coldwater
Date Time
4-hour Max
Daily Temp
(°C)
Min of 4-hour
Max Daily
Temp (°C)
Specific
Conductance
(µS/cm)
Sierra Blanca
Max Daily
Barometric
Pressure (in)
Vigil Max
Daily
Barometric
Pressure
(mmHg)
DO (mg/L)
at 90%
saturation
7/7/2011 13:11:11 23.7 23.7 1855 30.33 617.0 6.1
7/7/2011 14:11:11 24.1
7/7/2011 15:11:11 24.4
7/7/2011 16:11:11 24.3
7/8/2011 12:11:11 23.6 23.6 1876 30.38 618.2 6.1
7/8/2011 13:11:11 24.5
7/8/2011 14:11:11 24.9
7/8/2011 15:11:11 23.9
7/9/2011 14:11:11 24.4 24.4 1858 30.39 618.5 6.0
7/9/2011 15:11:11 24.8
7/9/2011 16:11:11 25.1
7/9/2011 17:11:11 24.7
7/10/2011 14:11:11 24.3 24.3 1818 30.40 618.7 6.1
7/10/2011 15:11:11 24.6
7/10/2011 16:11:11 24.8
7/10/2011 17:11:11 24.6
7/24/2011 13:11:11 24.0 24.0 412.5 30.40 618.7 6.1
7/24/2011 14:11:11 25.4
7/24/2011 15:11:11 26.2
7/24/2011 16:11:11 25.2
7/28/2012 14:11:11 25.8
7/28/2012 15:11:11 26.5
7/28/2012 16:11:11 25.8
7/28/2012 17:11:11 24.7 24.7 470 30.44 619.8 *6.0
7/29/2012 14:11:11 25.2

7/29/2012 15:11:11 25.0
7/29/2012 16:11:11 25.4
7/29/2012 17:11:11 24.2 24.2 473.4 30.44 619.8 *6.1
7/30/2012 13:11:11 24.3 24.3 468.6 30.39 618.5 *6.1
7/30/2012 14:11:11 24.6
7/30/2012 15:11:11 24.9
7/30/2012 16:11:11 25.0
8/1/2011 13:11:11 24.4 24.4 481.3 30.37 618.0 *6.1
8/1/2011 14:11:11 25.6
8/1/2011 15:11:11 26.1
8/1/2011 16:11:11 25.1
8/6/2011 13:00:00 24.3
8/6/2011 14:00:00 25.7
8/6/2011 15:00:00 25.3
8/6/2011 16:00:00 23.7 23.7 500.3 30.33 617.0 6.1
8/8/2011 15:00:00 26.4
8/8/2011 16:00:00 27.1
8/8/2011 17:00:00 26.2
8/8/2011 18:00:00 25.8 25.8 490.5 30.24 614.7 5.9
8/13/2011 15:00:00 24.1
8/13/2011 16:00:00 25.4 invalid conductivity
8/13/2011 17:00:00 25.3
8/13/2011 18:00:00 24.0 24.0 36.9 30.37 618.0 6.1
8/14/2011 13:00:00 25.2
8/14/2011 14:00:00 25.3 invalid conductivity
8/14/2011 15:00:00 24.4 24.4 35.3 30.39 618.5 6.1
8/14/2011 16:00:00 25.4
8/15/2011 11:00:00 25.2
8/15/2011 12:00:00 26.0 invalid conductivity
8/15/2011 13:00:00 23.7
8/15/2011 14:00:00 23.9 23.9 43.5 30.31 616.5 6.1
8/16/2011 12:00:00 27.5
8/16/2011 13:00:00 28.5 invalid conductivity
8/16/2011 14:00:00 28.5
8/16/2011 15:00:00 26.2 26.2 42 30.31 616.5 5.8
8/22/2011 13:00:00 25.9
8/22/2011 14:00:00 25.1 invalid conductivity
8/22/2011 15:00:00 25.4

8/22/2011 16:00:00 25.8 25.8 162.3 30.40 618.7 5.9
8/23/2011 13:00:00 28.5
8/23/2011 14:00:00 29.0 invalid conductivity
8/23/2011 15:00:00 28.8
8/23/2011 16:00:00 27.8 27.8 58.3 30.32 616.7 5.7
8/24/2011 13:00:00 26.8
8/24/2011 14:00:00 27.6 invalid conductivity
8/24/2011 15:00:00 27.2
8/24/2011 16:00:00 26.6 26.6 45.9 30.34 617.2 5.8
8/25/2011 13:00:00 26.5 26.5 49.1 30.42 619.3 5.8
8/25/2011 14:00:00 27.2
8/25/2011 15:00:00 27.3 invalid conductivity
8/25/2011 16:00:00 26.7
8/26/2011 12:00:00 27.1
8/26/2011 13:00:00 27.6 invalid conductivity
8/26/2011 14:00:00 27.1
8/26/2011 15:00:00 26.6 26.6 46.5 30.44 619.8 5.8
8/27/2011 13:00:00 27.7
8/27/2011 14:00:00 27.9 invalid conductivity
8/27/2011 15:00:00 28.4
8/27/2011 16:00:00 27.3 27.3 51.9 30.42 619.3 5.8
8/28/2011 12:00:00 27.9
8/28/2011 13:00:00 28.8 invalid conductivity
8/28/2011 14:00:00 29.1
8/28/2011 15:00:00 27.6 27.6 63.4 30.34 617.2 5.7
8/29/2011 13:00:00 27.0 27.0 82.9 30.30 616.2 5.8
8/29/2011 14:00:00 27.6
8/29/2011 15:00:00 28.2 invalid conductivity
8/29/2011 16:00:00 27.6
8/30/2011 11:00:00 25.6
8/30/2011 12:00:00 28.4 invalid conductivity
8/30/2011 13:00:00 28.4
8/30/2011 14:00:00 24.9 24.9 102.5 30.25 614.9 6.0
9/1/2011 13:00:00 25.8
9/1/2011 14:00:00 26.3 invalid conductivity
9/1/2011 15:00:00 25.8
9/1/2011 16:00:00 25.3 25.3 77.8 30.32 616.7 5.9
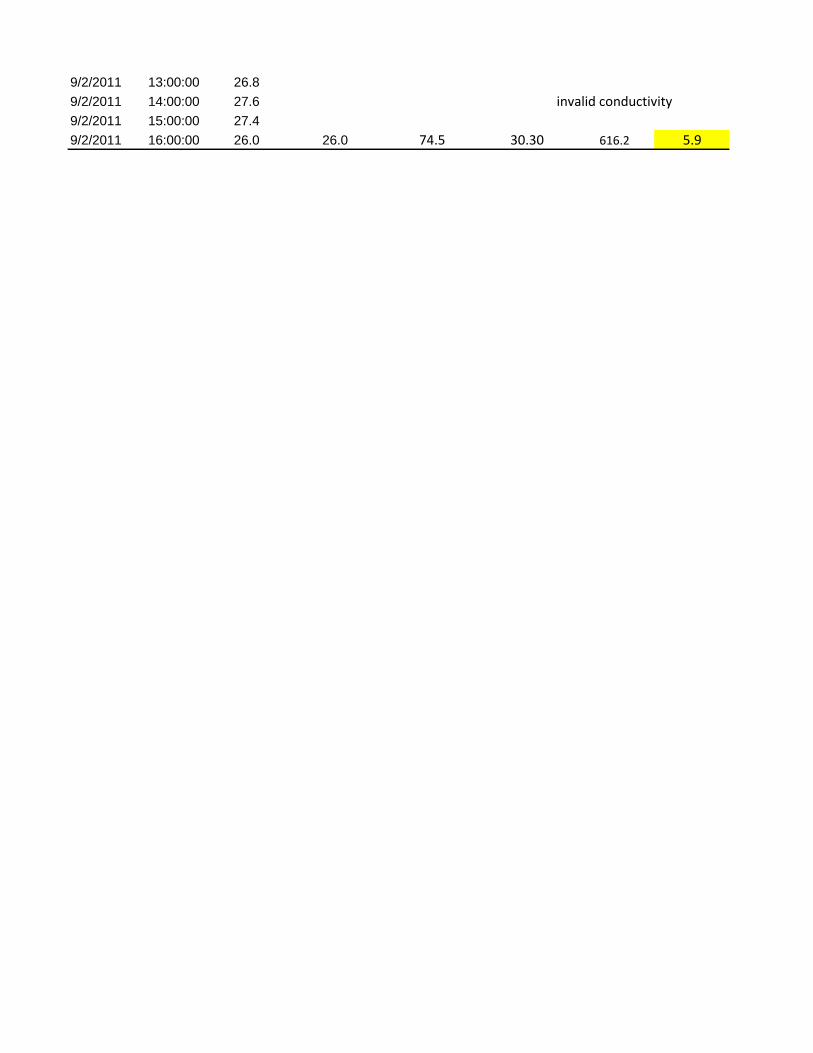
9/2/2011 13:00:00 26.8
9/2/2011 14:00:00 27.6 invalid conductivity
9/2/2011 15:00:00 27.4
9/2/2011 16:00:00 26.0 26.0 74.5 30.30 616.2 5.9
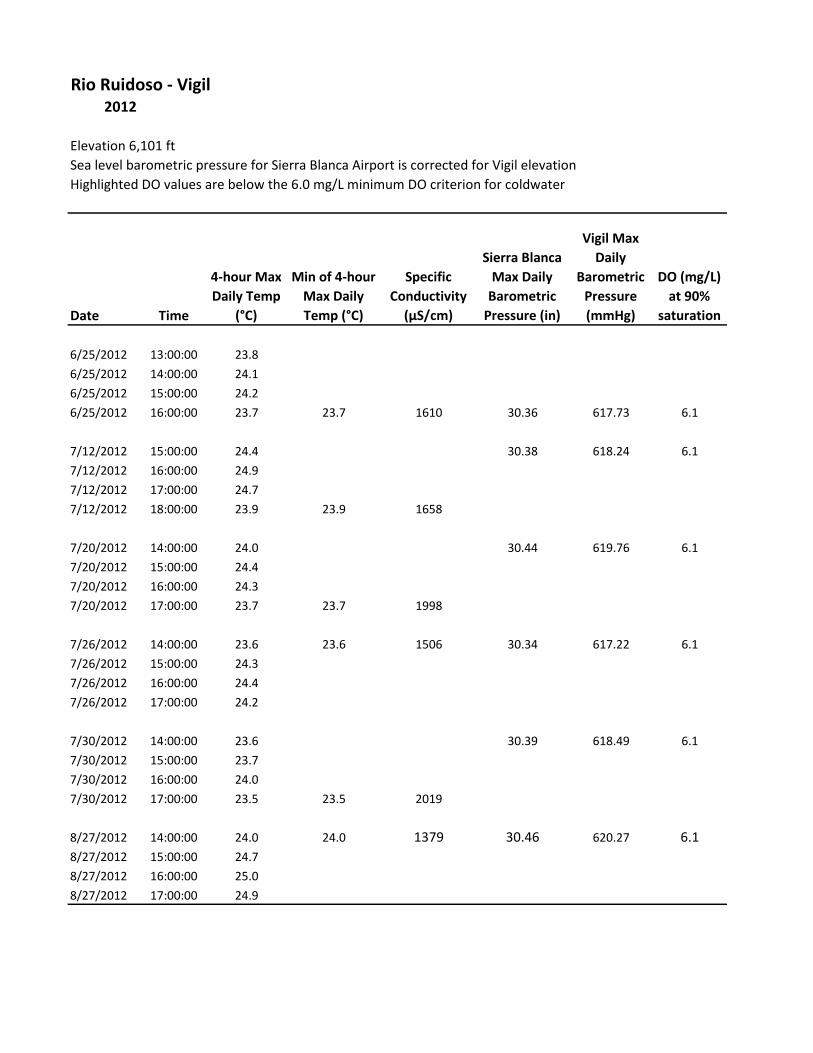
Rio Ruidoso - Vigil2012
Elevation 6,101 ft
Sea level barometric pressure for Sierra Blanca Airport is corrected for Vigil elevation
Highlighted DO values are below the 6.0 mg/L minimum DO criterion for coldwater
Date Time
4-hour Max
Daily Temp
(°C)
Min of 4-hour
Max Daily
Temp (°C)
Specific
Conductivity
(µS/cm)
Sierra Blanca
Max Daily
Barometric
Pressure (in)
Vigil Max
Daily
Barometric
Pressure
(mmHg)
DO (mg/L)
at 90%
saturation
6/25/2012 13:00:00 23.8
6/25/2012 14:00:00 24.1
6/25/2012 15:00:00 24.2
6/25/2012 16:00:00 23.7 23.7 1610 30.36 617.73 6.1
7/12/2012 15:00:00 24.4 30.38 618.24 6.1
7/12/2012 16:00:00 24.9
7/12/2012 17:00:00 24.7
7/12/2012 18:00:00 23.9 23.9 1658
7/20/2012 14:00:00 24.0 30.44 619.76 6.1
7/20/2012 15:00:00 24.4
7/20/2012 16:00:00 24.3
7/20/2012 17:00:00 23.7 23.7 1998
7/26/2012 14:00:00 23.6 23.6 1506 30.34 617.22 6.1
7/26/2012 15:00:00 24.3
7/26/2012 16:00:00 24.4
7/26/2012 17:00:00 24.2
7/30/2012 14:00:00 23.6 30.39 618.49 6.1
7/30/2012 15:00:00 23.7
7/30/2012 16:00:00 24.0
7/30/2012 17:00:00 23.5 23.5 2019
8/27/2012 14:00:00 24.0 24.0 1379 30.46 620.27 6.1
8/27/2012 15:00:00 24.7
8/27/2012 16:00:00 25.0
8/27/2012 17:00:00 24.9

Rio Ruidoso - Tully2011
Elevation 5,775 ft
Sea level barometric pressure for Sierra Blanca Airport is corrected for Tully elevation
Highlighted DO values are below the 6.0 mg/L minimum DO criterion for coldwater
Date Time
4-hour Max
Daily Temp
(°C)
Min of 4-hour
Max Daily
Temp (°C)
Specific
Conductivity
(µS/cm)
Sierra Blanca
Max Daily
Barometric
Pressure (in)
Tully Max
Daily
Barometric
Pressure
(mmHg)
DO (mg/L)
at 90%
saturation
7/2/2011 13:00:00 27.3 27.3 1531 30.37 625.6 5.8
7/2/2011 14:00:00 28.4
7/2/2011 15:00:00 28.6
7/2/2011 16:00:00 27.8
7/3/2011 17:00:00 28.4
7/3/2011 18:00:00 26.7
7/3/2011 19:00:00 25.4
7/3/2011 20:00:00 24.7 24.7 1518 30.37 625.6 6.1
7/16/2011 11:09:27 25.4 25.4 474.9 30.28 623.3 6.0
7/16/2011 12:09:27 27.2
7/16/2011 13:09:27 26.1
7/16/2011 14:09:27 24.9
7/17/2011 10:09:27 24.2
7/17/2011 11:09:27 25.1
7/17/2011 12:09:27 25.8
7/17/2011 13:09:27 24.5 24.5 449.7 30.38 625.9 6.1
7/18/2011 11:09:27 26.5
7/18/2011 12:09:27 29.0
7/18/2011 13:09:27 27.5
7/18/2011 14:09:27 25.1 25.1 447.3 30.4 626.4 6.1
7/19/2011 11:09:27 27.5 24.2
7/19/2011 12:09:27 29.9
7/19/2011 13:09:27 28.7
7/19/2011 14:09:27 27.2 27.2 444.5 30.37 625.6 5.8
7/20/2011 10:09:27 24.5 24.5 434.9 30.26 622.8 6.1
7/20/2011 11:09:27 29.0
7/20/2011 12:09:27 28.9

7/20/2011 13:09:27 25.3
7/21/2011 10:09:27 25.3 25.3 411.8 30.22 621.8 6.0
7/21/2011 11:09:27 28.5
7/21/2011 12:09:27 30.1
7/21/2011 13:09:27 25.9
8/8/2011 16:00:00 24.5
8/8/2011 17:00:00 24.5
8/8/2011 18:00:00 24.5
8/8/2011 19:00:00 24.3 24.3 526.5 30.24 622.3 6.1

Rio Ruidoso - Tully2012
Elevation 5,775 ft
Sea level barometric pressure for Sierra Blanca Airport is corrected for Tully elevation
Highlighted DO values are below the 6.0 mg/L minimum DO criterion for coldwater
Date Time
4-hour Max
Daily Temp
(°C)
Min of 4-hour
Max Daily
Temp (°C)
Specific
Conductivity
(µS/cm)
Sierra Blanca
Max Daily
Barometric
Pressure (in)
Tully Max
Daily
Barometric
Pressure
(mmHg)
DO (mg/L)
at 90%
saturation
6/14/2012 14:00:00 26.8
6/14/2012 15:00:00 26.5 26.5 1741 30.16 620.3 5.8
6/14/2012 16:00:00 27.1
6/14/2012 17:00:00 26.9
6/15/2012 14:00:00 25.8
6/15/2012 15:00:00 26.6
6/15/2012 16:00:00 26.6
6/15/2012 17:00:00 25.7 25.7 1723 30.22 621.8 5.9
7/25/2012 14:00:00 24.6
7/25/2012 15:00:00 24.7
7/25/2012 16:00:00 24.5 24.5 1695 30.26 622.8 6.1
7/25/2012 17:00:00 24.5
7/26/2012 15:00:00 24.2 24.2 1348 30.34 624.8 6.1
7/26/2012 16:00:00 24.8
7/26/2012 17:00:00 24.7
7/26/2012 18:00:00 24.4

Mimbres River - USGS Gage
Elevation 5,920 ft
Sea level barometric pressure reported for Silver City, NM is corrected for USGS Gage elevation
Assumes conductivity of 335 µS/cm reported by USGS at Mimbres station
Highlighted DO values are below the 6.0 mg/L minimum DO criterion for coldwater
Date Time
4-hour Max
Daily Temp
(°C)
Min of 4-hour
Max Daily
Temp (°C)
Grant County
Airport Max
Daily
Barometric
Pressure (in)
USGS Gage
Max Daily
Barometric
Pressure
(mmHg)
DO (mg/L)
at 90%
saturation
7/2/03 13:05 25.4 25.4 30.12 615.95 5.9
7/2/03 14:05 27.5
7/2/03 15:05 27.7
7/2/03 16:05 26.4
7/3/03 13:05 2.47 2.47 30.9 615.2 6.0
7/3/03 14:05 25.4
7/3/03 15:05 25.7
7/3/03 16:05 26.3
7/4/03 13:05 26.1
7/4/03 14:05 28.2
7/4/03 15:05 27.7
7/4/03 16:05 25.2 25.2 30.13 616.2 6.0
7/5/03 12:05 26.1
7/5/03 13:05 28.2
7/5/03 14:05 27.7
7/5/03 15:05 25.2 25.2 30.13 616.2 6.0
7/8/03 13:05 24.5 24.5 30.2 618.0 6.1
7/8/03 14:05 26.1
7/8/03 15:05 25.4
7/8/03 16:05 25.0
7/9/03 13:05 26.7 26.7 30.19 625.1 5.9
7/9/03 14:05 27.1
7/9/03 15:05 26.8
7/9/03 16:05 26.7
7/15/09 12:02 24.8
7/15/09 13:02 26.8

7/15/09 14:02 26.9
7/15/09 15:02 24.4 24.4 30.29 626.4 6.1
7/16/09 13:02 25.6
7/16/09 14:02 27.4
7/16/09 15:02 26.8
7/16/09 16:02 24.8 24.8 30.32 627.1 6.1
7/17/09 13:02 26.0 26.0 30.36 628.1 6.1
7/17/09 14:02 27.4
7/17/09 15:02 27.8
7/17/09 16:02 27.2
7/18/09 14:02 27.4
7/18/09 15:02 28.5
7/18/09 16:02 27.9
7/18/09 17:02 27.0 27.0 30.40 629.2 6.0
7/19/09 12:02 25.1 25.1 30.37 628.4 5.9
7/19/09 13:02 26.9
7/19/09 14:02 28.3
7/19/09 15:02 28.0
7/20/09 13:02 25.1 25.1 30.23 624.8 6.1
7/20/09 14:02 27.3
7/20/09 15:02 27.1
7/20/09 16:02 25.6
7/21/09 12:02 25.6
7/21/09 13:02 25.3
7/21/09 14:02 24.3
7/21/09 15:02 24.3 24.3 30.20 624.1 6.0
7/22/09 13:02 26.9
7/22/09 14:02 28.5
7/22/09 15:02 26.2
7/22/09 16:02 25.3 25.3 30.23 624.7 6.1
7/23/09 13:02 27.1 27.1 30.27 625.9 6.0
7/23/09 14:02 27.7
7/23/09 15:02 28.5
7/23/09 16:02 28.0
7/24/09 13:02 28.0 28.0 30.24 625.1 5.8
7/24/09 14:02 29.3
7/24/09 15:02 29.6
7/24/09 16:02 29.0

7/25/09 13:02 28.1 28.1 30.24 625.1 5.7
7/25/09 14:02 29.2
7/25/09 15:02 29.4
7/25/09 16:02 28.6
7/26/09 13:02 27.0
7/26/09 14:02 27.4
7/26/09 15:02 26.6
7/26/09 16:02 26.2 26.2 30.28 626.1 5.7
7/27/09 12:02 26.9 26.9 30.24 625.1 5.9
7/27/09 13:02 28.7
7/27/09 14:02 29.9
7/27/09 15:02 30.1
7/28/09 12:02 26.8
7/28/09 13:02 27.9
7/28/09 14:02 26.1 26.1 30.15 622.8 5.9
7/28/09 15:02 26.4
7/29/09 13:02 27.5 27.5 30.16 623.1 5.9
7/29/09 14:02 28.2
7/29/09 15:02 28.4
7/29/09 16:02 27.6
7/30/09 13:02 27.9
7/30/09 14:02 28.6
7/30/09 15:02 28.4
7/30/09 16:02 27.8 27.8 30.19 623.8 5.8
7/31/09 13:02 28.0 28.0 30.27 625.9 5.8
7/31/09 14:02 29.0
7/31/09 15:02 28.9
7/31/09 16:02 28.4
8/1/09 12:02 26.0
8/1/09 13:02 26.5
8/1/09 14:02 26.0
8/1/09 15:02 24.5 24.5 30.28 626.1 5.7
8/2/09 13:02 27.9 27.9 30.29 626.4 6.1
8/2/09 14:02 29.0
8/2/09 15:02 28.3
8/2/09 16:02 28.0
8/3/09 12:02 26.0 26.0 30.26 625.6 5.8

8/3/09 13:02 27.9
8/3/09 14:02 29.1
8/3/09 15:02 29.2
8/4/09 13:02 27.9 27.9 30.25 625.3 6.0
8/4/09 14:02 28.6
8/4/09 15:02 28.7
8/4/09 16:02 28.2
8/5/09 13:02 27.6
8/5/09 14:02 28.2
8/5/09 15:02 28.0
8/5/09 16:02 27.0 27.0 30.30 626.6 5.8
8/6/09 14:02 26.7
8/6/09 15:02 27.4
8/6/09 16:02 26.9
8/6/09 17:02 25.7 25.7 30.27 625.9 5.9
8/7/09 13:02 27.0
8/7/09 14:02 27.4
8/7/09 15:02 27.6
8/7/09 16:02 26.5 26.5 30.22 624.9 6.0
8/8/09 14:02 25.7
8/8/09 15:02 26.3
8/8/09 16:02 26.2
8/8/09 17:02 25.5 25.5 30.22 624.6 5.9
8/9/09 14:02 26.3
8/9/09 15:02 27.3
8/9/09 16:02 26.8
8/9/09 17:02 25.7 25.7 30.22 624.6 6.0
8/10/09 13:02 25.4
8/10/09 14:02 25.2
8/10/09 15:02 24.4 24.4 30.29 626.4 6.0
8/10/09 16:02 25.2
8/12/09 13:02 27.5
8/12/09 14:02 28.6
8/12/09 15:02 28.6
8/12/09 16:02 27.1 27.1 30.32 627.1 6.1
8/14/09 14:02 26.5
8/14/09 15:02 27.4
8/14/09 16:02 26.9
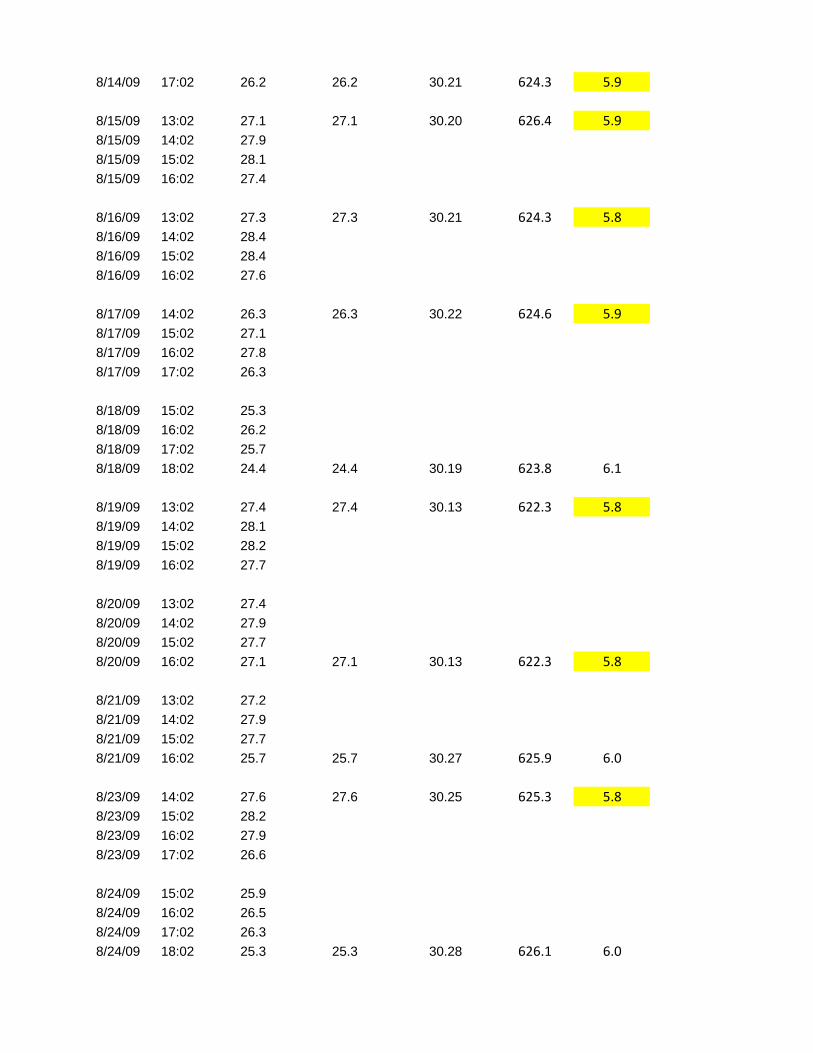
8/14/09 17:02 26.2 26.2 30.21 624.3 5.9
8/15/09 13:02 27.1 27.1 30.20 626.4 5.9
8/15/09 14:02 27.9
8/15/09 15:02 28.1
8/15/09 16:02 27.4
8/16/09 13:02 27.3 27.3 30.21 624.3 5.8
8/16/09 14:02 28.4
8/16/09 15:02 28.4
8/16/09 16:02 27.6
8/17/09 14:02 26.3 26.3 30.22 624.6 5.9
8/17/09 15:02 27.1
8/17/09 16:02 27.8
8/17/09 17:02 26.3
8/18/09 15:02 25.3
8/18/09 16:02 26.2
8/18/09 17:02 25.7
8/18/09 18:02 24.4 24.4 30.19 623.8 6.1
8/19/09 13:02 27.4 27.4 30.13 622.3 5.8
8/19/09 14:02 28.1
8/19/09 15:02 28.2
8/19/09 16:02 27.7
8/20/09 13:02 27.4
8/20/09 14:02 27.9
8/20/09 15:02 27.7
8/20/09 16:02 27.1 27.1 30.13 622.3 5.8
8/21/09 13:02 27.2
8/21/09 14:02 27.9
8/21/09 15:02 27.7
8/21/09 16:02 25.7 25.7 30.27 625.9 6.0
8/23/09 14:02 27.6 27.6 30.25 625.3 5.8
8/23/09 15:02 28.2
8/23/09 16:02 27.9
8/23/09 17:02 26.6
8/24/09 15:02 25.9
8/24/09 16:02 26.5
8/24/09 17:02 26.3
8/24/09 18:02 25.3 25.3 30.28 626.1 6.0

8/26/09 13:02 25.9 25.9 30.32 627.1 6.0
8/26/09 14:02 27.5
8/26/09 15:02 28.0
8/26/09 16:02 26.6
8/27/09 15:02 25.0
8/27/09 16:02 25.4
8/27/09 17:02 25.0
8/27/09 18:02 24.8 24.8 30.30 626.6 6.1
8/28/09 14:02 26.8
8/28/09 15:02 27.4
8/28/09 16:02 27.0
8/28/09 17:02 25.7 25.7 30.36 628.1 6.0
8/29/09 14:02 27.3
8/29/09 15:02 28.0
8/29/09 16:02 28.1
8/29/09 17:02 27.0 27.0 30.33 627.4 5.9
8/30/09 14:02 27.2 27.2 30.27 625.9 5.8
8/30/09 15:02 27.8
8/30/09 16:02 27.9
8/30/09 17:02 27.2
8/31/09 14:02 27.2
8/31/09 15:02 27.9
8/31/09 16:02 27.9
8/31/09 17:02 27.0 27.0 30.29 626.4 5.9
9/1/09 14:02 27.0
9/1/09 15:02 27.3
9/1/09 16:02 27.2
9/1/09 17:02 26.5 26.5 30.30 626.6 5.9
9/2/09 14:02 27.1
9/2/09 15:02 27.5
9/2/09 16:02 27.2
9/2/09 17:02 26.5 26.5 30.30 626.6 5.9
9/3/09 14:02 25.2
9/3/09 15:02 25.5
9/3/09 16:02 24.6
9/3/09 17:02 24.3 24.3 30.24 625.1 6.1

Mimbres River - Royal John Bridge
Elevation 5,656 ft
Sea level barometric pressure reported for Silver City, NM is corrected for RJB elevation
Assumes maximum conductivity of 335 µS/cm reported by USGS at Mimbres station
Highlighted DO values are below the 6.0 mg/L minimum DO criterion for coldwater
Date Time
4-hour Max
Daily Temp
(°C)
Min of 4-hour
Max Daily
Temp (°C)
Grant County
Airport Max
Daily
Barometric
Pressure (in)
Royal John
Bridge Max
Daily
Barometric
Pressure
(mmHg)
DO (mg/L)
at 90%
saturation
6/21/09 13:02 24.8 24.8 30.09 621.3 6.0
6/21/09 14:02 25.7
6/21/09 15:02 26.0
6/21/09 16:02 25.1
6/22/09 13:02 25.6
6/22/09 14:02 26.4
6/22/09 15:02 26.4
6/22/09 16:02 25.1 25.1 30.05 620.3 6.0
6/25/09 13:02 24.2 24.2 30.21 624.3 6.1
6/25/09 14:02 25.1
6/25/09 15:02 24.9
6/25/09 16:02 24.3
6/30/09 13:02 25.9
6/30/09 14:02 25.8
6/30/09 15:02 24.7
6/30/09 16:02 24.6 24.6 30.13 622.3 6.1
7/1/09 13:02 25.5
7/1/09 14:02 25.9
7/1/09 15:02 25.8
7/1/09 16:02 25.3 25.3 30.16 623.1 6.0
7/6/09 13:02 26.1 26.1 30.24 625.1 5.9
7/6/09 14:02 26.6
7/6/09 15:02 26.4
7/6/09 16:02 26.1
7/7/09 13:02 25.4 25.4 30.18 623.6 6.0
7/7/09 14:02 25.9

7/7/09 15:02 25.9
7/7/09 16:02 26.1
7/8/09 13:02 26.0 26.0 30.17 623.3 5.9
7/8/09 14:02 26.9
7/8/09 15:02 27.5
7/8/09 16:02 26.9
7/9/09 12:02 25.3 25.3 30.20 624.1 6.0
7/9/09 13:02 26.5
7/9/09 14:02 27.3
7/9/09 15:02 26.3
7/10/09 13:02 26.7 26.7 30.27 625.9 5.9
7/10/09 14:02 27.6
7/10/09 15:02 27.5
7/10/09 16:02 26.9
7/11/09 13:02 25.9 25.9 30.33 627.4 6.0
7/11/09 14:02 26.4
7/11/09 15:02 26.7
7/11/09 16:02 26.4
7/12/09 13:02 26.5
7/12/09 14:02 27.7
7/12/09 15:02 26.9
7/12/09 16:02 26.5 26.5 30.33 627.4 5.9
7/13/09 13:02 26.7 26.7 30.24 625.1 5.9
7/13/09 14:02 27.1
7/13/09 15:02 26.8
7/13/09 16:02 26.7
7/15/09 12:02 24.8
7/15/09 13:02 26.8
7/15/09 14:02 26.9
7/15/09 15:02 24.4 24.4 30.29 626.4 6.1
7/16/09 13:02 25.6
7/16/09 14:02 27.4
7/16/09 15:02 26.8
7/16/09 16:02 24.8 24.8 30.32 627.1 6.1
7/17/09 13:02 26.0 26.0 30.36 628.1 6.1
7/17/09 14:02 27.4
7/17/09 15:02 27.8
7/17/09 16:02 27.2

7/18/09 14:02 27.4
7/18/09 15:02 28.5
7/18/09 16:02 27.9
7/18/09 17:02 27.0 27.0 30.40 629.2 6.0
7/19/09 12:02 25.1 25.1 30.37 628.4 5.9
7/19/09 13:02 26.9
7/19/09 14:02 28.3
7/19/09 15:02 28.0
7/20/09 13:02 25.1 25.1 30.23 624.8 6.1
7/20/09 14:02 27.3
7/20/09 15:02 27.1
7/20/09 16:02 25.6
7/21/09 12:02 25.6
7/21/09 13:02 25.3
7/21/09 14:02 24.3
7/21/09 15:02 24.3 24.3 30.20 624.1 6.0
7/22/09 13:02 26.9
7/22/09 14:02 28.5
7/22/09 15:02 26.2
7/22/09 16:02 25.3 25.3 30.22 624.7 6.1
7/23/09 13:02 27.1 27.1 30.27 625.9 6.0
7/23/09 14:02 27.7
7/23/09 15:02 28.5
7/23/09 16:02 28.0
7/24/09 13:02 28.0 28.0 30.24 625.1 5.8
7/24/09 14:02 29.3
7/24/09 15:02 29.6
7/24/09 16:02 29.0
7/25/09 13:02 28.1 28.1 30.24 625.1 5.7
7/25/09 14:02 29.2
7/25/09 15:02 29.4
7/25/09 16:02 28.6
7/26/09 13:02 27.0
7/26/09 14:02 27.4
7/26/09 15:02 26.6
7/26/09 16:02 26.2 26.2 30.28 626.1 5.7
7/27/09 12:02 26.9 26.9 30.24 625.1 5.9

7/27/09 13:02 28.7
7/27/09 14:02 29.9
7/27/09 15:02 30.1
7/28/09 12:02 26.8
7/28/09 13:02 27.9
7/28/09 14:02 26.1 26.1 30.15 622.8 5.9
7/28/09 15:02 26.4
7/29/09 13:02 27.5 27.5 30.16 623.1 5.9
7/29/09 14:02 28.2
7/29/09 15:02 28.4
7/29/09 16:02 27.6
7/30/09 13:02 27.9
7/30/09 14:02 28.6
7/30/09 15:02 28.4
7/30/09 16:02 27.8 27.8 30.19 623.8 5.8
7/31/09 13:02 28.0 28.0 30.27 625.9 5.8
7/31/09 14:02 29.0
7/31/09 15:02 28.9
7/31/09 16:02 28.4
8/1/09 12:02 26.0
8/1/09 13:02 26.5
8/1/09 14:02 26.0
8/1/09 15:02 24.5 24.5 30.28 626.1 5.7
8/2/09 13:02 27.9 27.9 30.29 626.4 6.1
8/2/09 14:02 29.0
8/2/09 15:02 28.3
8/2/09 16:02 28.0
8/3/09 12:02 26.0 26.0 30.26 625.6 5.8
8/3/09 13:02 27.9
8/3/09 14:02 29.1
8/3/09 15:02 29.2
8/4/09 13:02 27.9 27.9 30.25 625.3 6.0
8/4/09 14:02 28.6
8/4/09 15:02 28.7
8/4/09 16:02 28.2
8/5/09 13:02 27.6
8/5/09 14:02 28.2
8/5/09 15:02 28.0
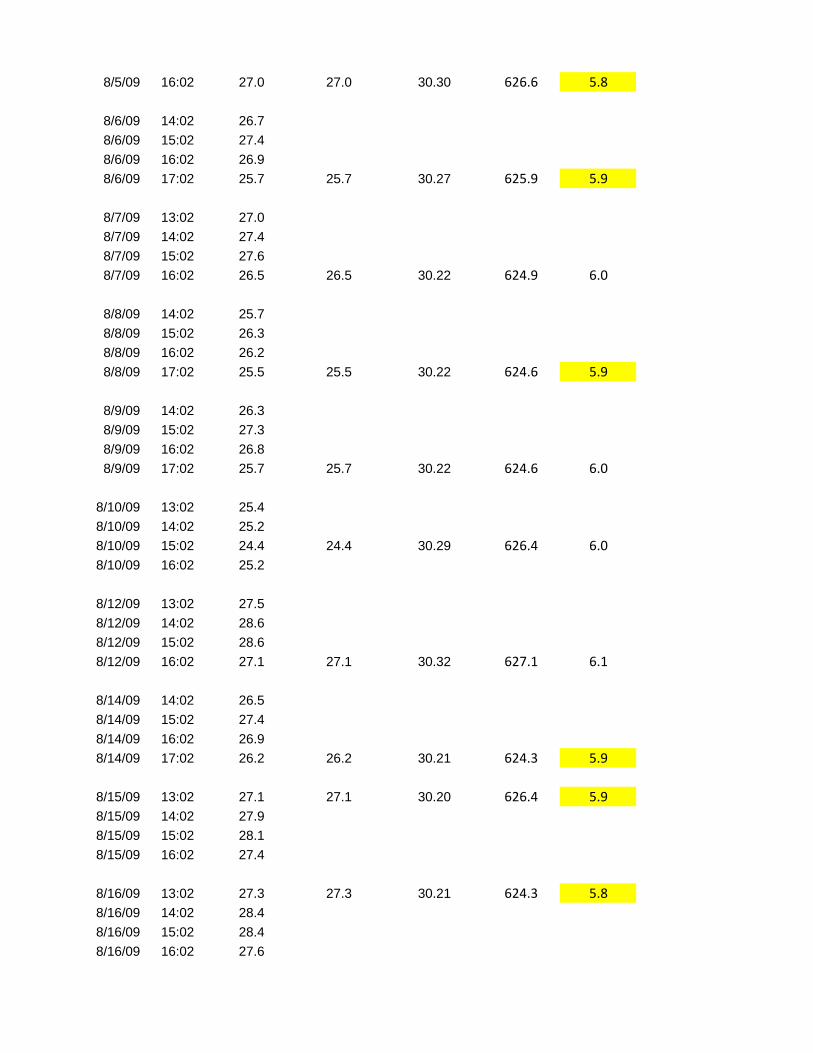
8/5/09 16:02 27.0 27.0 30.30 626.6 5.8
8/6/09 14:02 26.7
8/6/09 15:02 27.4
8/6/09 16:02 26.9
8/6/09 17:02 25.7 25.7 30.27 625.9 5.9
8/7/09 13:02 27.0
8/7/09 14:02 27.4
8/7/09 15:02 27.6
8/7/09 16:02 26.5 26.5 30.22 624.9 6.0
8/8/09 14:02 25.7
8/8/09 15:02 26.3
8/8/09 16:02 26.2
8/8/09 17:02 25.5 25.5 30.22 624.6 5.9
8/9/09 14:02 26.3
8/9/09 15:02 27.3
8/9/09 16:02 26.8
8/9/09 17:02 25.7 25.7 30.22 624.6 6.0
8/10/09 13:02 25.4
8/10/09 14:02 25.2
8/10/09 15:02 24.4 24.4 30.29 626.4 6.0
8/10/09 16:02 25.2
8/12/09 13:02 27.5
8/12/09 14:02 28.6
8/12/09 15:02 28.6
8/12/09 16:02 27.1 27.1 30.32 627.1 6.1
8/14/09 14:02 26.5
8/14/09 15:02 27.4
8/14/09 16:02 26.9
8/14/09 17:02 26.2 26.2 30.21 624.3 5.9
8/15/09 13:02 27.1 27.1 30.20 626.4 5.9
8/15/09 14:02 27.9
8/15/09 15:02 28.1
8/15/09 16:02 27.4
8/16/09 13:02 27.3 27.3 30.21 624.3 5.8
8/16/09 14:02 28.4
8/16/09 15:02 28.4
8/16/09 16:02 27.6

8/17/09 14:02 26.3 26.3 30.22 624.6 5.9
8/17/09 15:02 27.1
8/17/09 16:02 27.8
8/17/09 17:02 26.3
8/18/09 15:02 25.3
8/18/09 16:02 26.2
8/18/09 17:02 25.7
8/18/09 18:02 24.4 24.4 30.19 623.8 6.1
8/19/09 13:02 27.4 27.4 30.13 622.3 5.8
8/19/09 14:02 28.1
8/19/09 15:02 28.2
8/19/09 16:02 27.7
8/20/09 13:02 27.4
8/20/09 14:02 27.9
8/20/09 15:02 27.7
8/20/09 16:02 27.1 27.1 30.13 622.3 5.8
8/21/09 13:02 27.2
8/21/09 14:02 27.9
8/21/09 15:02 27.7
8/21/09 16:02 25.7 25.7 30.27 625.9 6.0
8/22/09 13:02 24.8
8/22/09 14:02 24.5
8/22/09 15:02 24.9
8/22/09 16:02 24.2 24.2 30.30 626.6 6.2
8/23/09 14:02 27.6 27.6 30.25 625.3 5.8
8/23/09 15:02 28.2
8/23/09 16:02 27.9
8/23/09 17:02 26.6
8/24/09 15:02 25.9
8/24/09 16:02 26.5
8/24/09 17:02 26.3
8/24/09 18:02 25.3 25.3 30.28 626.11 6.0
8/26/09 13:02 25.9 25.9 30.32 627.1 6.0
8/26/09 14:02 27.5
8/26/09 15:02 28.0
8/26/09 16:02 26.6
8/27/09 15:02 25.0
8/27/09 16:02 25.4

8/27/09 17:02 25.0
8/27/09 18:02 24.8 24.8 30.30 626.6 6.1
8/28/09 14:02 26.8
8/28/09 15:02 27.4
8/28/09 16:02 27.0
8/28/09 17:02 25.7 25.7 30.36 628.1 6.0
8/29/09 14:02 27.3
8/29/09 15:02 28.0
8/29/09 16:02 28.1
8/29/09 17:02 27.0 27.0 30.33 627.4 5.9
8/30/09 14:02 27.2 27.2 30.27 625.9 5.8
8/30/09 15:02 27.8
8/30/09 16:02 27.9
8/30/09 17:02 27.2
8/31/09 14:02 27.2
8/31/09 15:02 27.9
8/31/09 16:02 27.9
8/31/09 17:02 27.0 27.0 30.29 626.4 5.9
9/1/09 14:02 27.0
9/1/09 15:02 27.3
9/1/09 16:02 27.2
9/1/09 17:02 26.5 26.5 30.30 626.6 5.9
9/2/09 14:02 27.1
9/2/09 15:02 27.5
9/2/09 16:02 27.2
9/2/09 17:02 26.5 26.5 30.30 626.6 5.9
9/3/09 14:02 25.2
9/3/09 15:02 25.5
9/3/09 16:02 24.6
9/3/09 17:02 24.3 24.3 30.24 625.1 6.1