aquatic habitat - onondaga environmental institute · the transitional zone between adjacent...
TRANSCRIPT

Onondaga Creek Fact Sheet
CONCEPTUAL REVITALIZATION PLANCONCEPTUAL REVITALIZATION PLAN
Aquatic HabitatINTRODUCTION
The term ‘habitat’ is usually used with respect to a specific group of organisms, most frequently a species. This section introduces methods broadly applied in the Onondaga Creek watershed for assessing habitat degradation in general terms that are relevant to biological communities rather than individual species. Species-specific methods may be important if either conservation or reintroduction of individual species is an eventual goal for Onondaga Creek. Scores from habitat and biological surveys are usually interpreted in comparison to a reference system. A generalized stream habitat continuum concept is described to illustrate expected conditions in an unimpacted system.
What is the relationship between an aquatic “ecosystem” and “habitat”? An aquatic ecosystem is made up of the interactions between all of the animals and plants, and their physical and chemical surroundings (e.g., physical habitat, nutrients, oxygen, temperature), in a specific place. The term “habitat” may be broadly defined as the subset of ecosystem components that directly relate to the biological requirements and preferences of a particular group of organisms (see Text Box 1). Typically, habitat is thought of in relation to a particular species, but can also apply to a larger group such as coldwater fish, or a subset of individuals within a species, such as early life stages. Habitat for a species may include other organisms as part of their surroundings. For instance, some fish prefer the presence of rooted aquatic plants, which in turn have their own habitat requirements. A species’ habitat can differ between life stages and between seasons for adults.
How are habitat assessments and restoration goals related? Habitat assessments cannot by themselves lead to restoration planning goals. The field of ecological restoration draws a clear distinction between value-based goals themselves, and the knowledge that can be used to formulate the value-based goals (Davis and Slobodkin 2004; Lancaster 2000). The knowledge obtained from habitat assessments could be used in prioritizing steps toward achieving goals.
Text Box 1Examples of factors that are used to
describe stream habitat:Water quality
temperature• nutrients (phosphorus, nitrogen)• dissolved oxygen• pH• turbidity•
Hydrology water flow (volume / time)• water velocity• water level relative to bank full• channel shape• steepness of grade•
Physical structure shading• substrate composition• cover from predation• riffle/pool alternation• stream bed shape• size and shape of riparian wetlands and flood-• plainssinuousity (degree of stream meandering)•
Biological structure aquatic plants• riparian wetland plants• floodplain plants•
Relative importance among these factors depends on:Species - size, resource requirements, and toler-• ance rangesAnnual cycles – some fish spawn under one set • of conditions, but live the rest of the year under other conditions, such as migratory species that live only part of their lives in streamsLife stage - preferred habitat for adults and early • life stages may differ significantly
The State of Onondaga Creek Fact Sheet - 2Aquatic Habitat
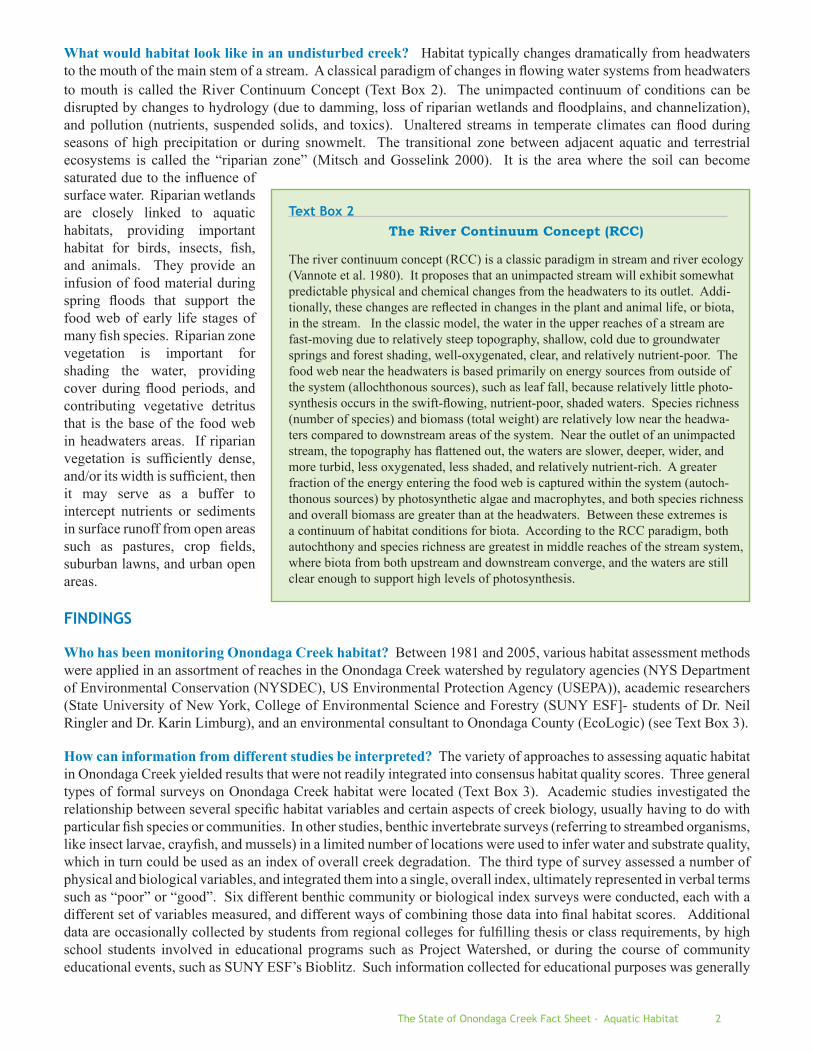
What would habitat look like in an undisturbed creek? Habitat typically changes dramatically from headwaters to the mouth of the main stem of a stream. A classical paradigm of changes in flowing water systems from headwaters to mouth is called the River Continuum Concept (Text Box 2). The unimpacted continuum of conditions can be disrupted by changes to hydrology (due to damming, loss of riparian wetlands and floodplains, and channelization), and pollution (nutrients, suspended solids, and toxics). Unaltered streams in temperate climates can flood during seasons of high precipitation or during snowmelt. The transitional zone between adjacent aquatic and terrestrial ecosystems is called the “riparian zone” (Mitsch and Gosselink 2000). It is the area where the soil can become saturated due to the influence of surface water. Riparian wetlands are closely linked to aquatic habitats, providing important habitat for birds, insects, fish, and animals. They provide an infusion of food material during spring floods that support the food web of early life stages of many fish species. Riparian zone vegetation is important for shading the water, providing cover during flood periods, and contributing vegetative detritus that is the base of the food web in headwaters areas. If riparian vegetation is sufficiently dense, and/or its width is sufficient, then it may serve as a buffer to intercept nutrients or sediments in surface runoff from open areas such as pastures, crop fields, suburban lawns, and urban open areas.
FINDINGS
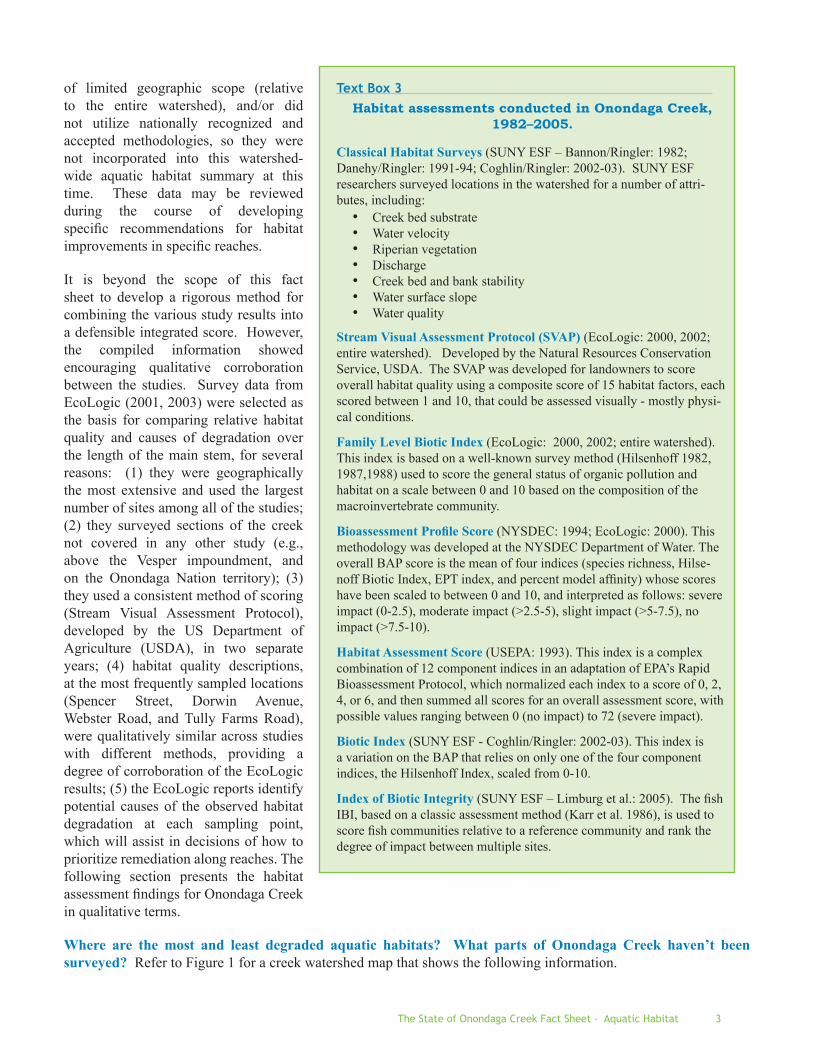
Who has been monitoring Onondaga Creek habitat? Between 1981 and 2005, various habitat assessment methods were applied in an assortment of reaches in the Onondaga Creek watershed by regulatory agencies (NYS Department of Environmental Conservation (NYSDEC), US Environmental Protection Agency (USEPA)), academic researchers (State University of New York, College of Environmental Science and Forestry (SUNY ESF]- students of Dr. Neil Ringler and Dr. Karin Limburg), and an environmental consultant to Onondaga County (EcoLogic) (see Text Box 3).
How can information from different studies be interpreted? The variety of approaches to assessing aquatic habitat in Onondaga Creek yielded results that were not readily integrated into consensus habitat quality scores. Three general types of formal surveys on Onondaga Creek habitat were located (Text Box 3). Academic studies investigated the relationship between several specific habitat variables and certain aspects of creek biology, usually having to do with particular fish species or communities. In other studies, benthic invertebrate surveys (referring to streambed organisms, like insect larvae, crayfish, and mussels) in a limited number of locations were used to infer water and substrate quality, which in turn could be used as an index of overall creek degradation. The third type of survey assessed a number of physical and biological variables, and integrated them into a single, overall index, ultimately represented in verbal terms such as “poor” or “good”. Six different benthic community or biological index surveys were conducted, each with a different set of variables measured, and different ways of combining those data into final habitat scores. Additional data are occasionally collected by students from regional colleges for fulfilling thesis or class requirements, by high school students involved in educational programs such as Project Watershed, or during the course of community educational events, such as SUNY ESF’s Bioblitz. Such information collected for educational purposes was generally
Text Box 2The River Continuum Concept (RCC)
The river continuum concept (RCC) is a classic paradigm in stream and river ecology (Vannote et al. 1980). It proposes that an unimpacted stream will exhibit somewhat predictable physical and chemical changes from the headwaters to its outlet. Addi-tionally, these changes are reflected in changes in the plant and animal life, or biota, in the stream. In the classic model, the water in the upper reaches of a stream are fast-moving due to relatively steep topography, shallow, cold due to groundwater springs and forest shading, well-oxygenated, clear, and relatively nutrient-poor. The food web near the headwaters is based primarily on energy sources from outside of the system (allochthonous sources), such as leaf fall, because relatively little photo-synthesis occurs in the swift-flowing, nutrient-poor, shaded waters. Species richness (number of species) and biomass (total weight) are relatively low near the headwa-ters compared to downstream areas of the system. Near the outlet of an unimpacted stream, the topography has flattened out, the waters are slower, deeper, wider, and more turbid, less oxygenated, less shaded, and relatively nutrient-rich. A greater fraction of the energy entering the food web is captured within the system (autoch-thonous sources) by photosynthetic algae and macrophytes, and both species richness and overall biomass are greater than at the headwaters. Between these extremes is a continuum of habitat conditions for biota. According to the RCC paradigm, both autochthony and species richness are greatest in middle reaches of the stream system, where biota from both upstream and downstream converge, and the waters are still clear enough to support high levels of photosynthesis.
The State of Onondaga Creek Fact Sheet - 3Aquatic Habitat
Text Box 3Habitat assessments conducted in Onondaga Creek,
1982–2005.
Classical Habitat Surveys (SUNY ESF – Bannon/Ringler: 1982; Danehy/Ringler: 1991-94; Coghlin/Ringler: 2002-03). SUNY ESF researchers surveyed locations in the watershed for a number of attri-butes, including:
Creek bed substrate• Water velocity• Riperian vegetation• Discharge• Creek bed and bank stability• Water surface slope• Water quality•
Stream Visual Assessment Protocol (SVAP) (EcoLogic: 2000, 2002; entire watershed). Developed by the Natural Resources Conservation Service, USDA. The SVAP was developed for landowners to score overall habitat quality using a composite score of 15 habitat factors, each scored between 1 and 10, that could be assessed visually - mostly physi-cal conditions.
Family Level Biotic Index (EcoLogic: 2000, 2002; entire watershed). This index is based on a well-known survey method (Hilsenhoff 1982, 1987,1988) used to score the general status of organic pollution and habitat on a scale between 0 and 10 based on the composition of the macroinvertebrate community.
Bioassessment Profile Score (NYSDEC: 1994; EcoLogic: 2000). This methodology was developed at the NYSDEC Department of Water. The overall BAP score is the mean of four indices (species richness, Hilse-noff Biotic Index, EPT index, and percent model affinity) whose scores have been scaled to between 0 and 10, and interpreted as follows: severe impact (0-2.5), moderate impact (>2.5-5), slight impact (>5-7.5), no impact (>7.5-10).
Habitat Assessment Score (USEPA: 1993). This index is a complex combination of 12 component indices in an adaptation of EPA’s Rapid Bioassessment Protocol, which normalized each index to a score of 0, 2, 4, or 6, and then summed all scores for an overall assessment score, with possible values ranging between 0 (no impact) to 72 (severe impact).
Biotic Index (SUNY ESF - Coghlin/Ringler: 2002-03). This index is a variation on the BAP that relies on only one of the four component indices, the Hilsenhoff Index, scaled from 0-10.
Index of Biotic Integrity (SUNY ESF – Limburg et al.: 2005). The fish IBI, based on a classic assessment method (Karr et al. 1986), is used to score fish communities relative to a reference community and rank the degree of impact between multiple sites.
of limited geographic scope (relative to the entire watershed), and/or did not utilize nationally recognized and accepted methodologies, so they were not incorporated into this watershed-wide aquatic habitat summary at this time. These data may be reviewed during the course of developing specific recommendations for habitat improvements in specific reaches.
It is beyond the scope of this fact sheet to develop a rigorous method for combining the various study results into a defensible integrated score. However, the compiled information showed encouraging qualitative corroboration between the studies. Survey data from EcoLogic (2001, 2003) were selected as the basis for comparing relative habitat quality and causes of degradation over the length of the main stem, for several reasons: (1) they were geographically the most extensive and used the largest number of sites among all of the studies; (2) they surveyed sections of the creek not covered in any other study (e.g., above the Vesper impoundment, and on the Onondaga Nation territory); (3) they used a consistent method of scoring (Stream Visual Assessment Protocol), developed by the US Department of Agriculture (USDA), in two separate years; (4) habitat quality descriptions, at the most frequently sampled locations (Spencer Street, Dorwin Avenue, Webster Road, and Tully Farms Road), were qualitatively similar across studies with different methods, providing a degree of corroboration of the EcoLogic results; (5) the EcoLogic reports identify potential causes of the observed habitat degradation at each sampling point, which will assist in decisions of how to prioritize remediation along reaches. The following section presents the habitat assessment findings for Onondaga Creek in qualitative terms.
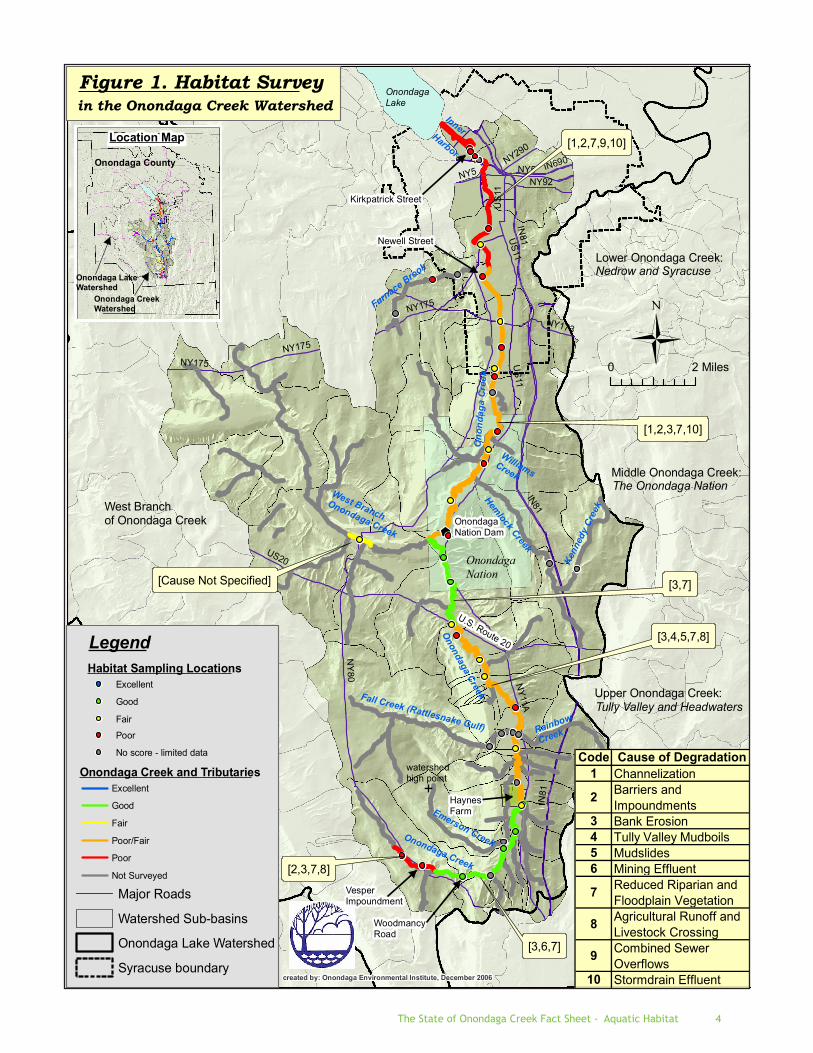
Where are the most and least degraded aquatic habitats? What parts of Onondaga Creek haven’t been surveyed? Refer to Figure 1 for a creek watershed map that shows the following information.
The State of Onondaga Creek Fact Sheet - 4Aquatic Habitat
NY
80
IN81
NY11A
US20
NY173
US
11
NY175
IN690
NY92
NY290
NY5 NY5
US
11NY175
IN81
IN81U
S11
NY175
Figure 1. Habitat Survey
Onondaga Nation
Onondaga Lakein the Onondaga Creek Watershed
0 2 Miles
created by: Onondaga Environmental Institute, December 2006
Middle Onondaga Creek:The Onondaga Nation
West Branch of Onondaga Creek
Major Roads
Lower Onondaga Creek:Nedrow and Syracuse
Williams Creek
Hemlock Creek
Kenn
edy
Cree
k
Ono
ndag
a C
reek
Furnace Brook
Rainbow
Creek
Onondaga Creek
West Branch Onondaga Creek
Onondaga Creek
Fall Creek (Rattlesnake Gulf)
Emerson Creek
+watershed high point
Location Map
Onondaga County
Onondaga LakeWatershed
Onondaga CreekWatershed
Onondaga Creek and TributariesExcellent
Good
Fair
Poor/Fair
Poor
Not Surveyed
Syracuse boundary
Watershed Sub-basins
Onondaga Lake Watershed
Vesper Impoundment
Woodmancy Road
Haynes Farm
U.S. Route 20
Onondaga Nation Dam
Newell Street
Kirkpatrick Street
[1,2,7,9,10]
[1,2,3,7,10]
[3,7]
[3,4,5,7,8]
[3,6,7]
[2,3,7,8]
[Cause Not Specified]
Inner Harbor
Upper Onondaga Creek:Tully Valley and Headwaters
Code Cause of Degradation1 Channelization
2 Barriers and Impoundments
3 Bank Erosion4 Tully Valley Mudboils5 Mudslides6 Mining Effluent
7 Reduced Riparian and Floodplain Vegetation
8 Agricultural Runoff and Livestock Crossing
9 Combined Sewer Overflows
10 Stormdrain Effluent
LegendHabitat Sampling Locations
Excellent
Good
Fair
Poor
No score - limited data
The State of Onondaga Creek Fact Sheet - 5Aquatic Habitat
Onondaga Creek reaches having the worst habitat or biological community survey scores (most degraded conditions) were located in:
Vesper near the old mill impoundment on NY Route 80; and• Syracuse below Newell Street (see Figure 1). • These areas are shaded red for “poor” on Figure 1.
The best survey scores (least degraded conditions) were in: The main stem of Onondaga Creek in the reach above the mudboils in the Tully Valley to Woodmancy Road • (shaded green for “good” on Figure 1)
The next best scores were obtained: Between the dam on the Onondaga Nation territory and US Route 20 (shaded green on Figure 1). •
Reaches of Onondaga Creek not surveyed intensively or not surveyed at all were shaded grey on Figure 1 map:West Branch of Onondaga Creek;• Tributaries of the main stem of Onondaga Creek, including Furnace Brook, Williams Creek, Hemlock Creek, • Kennedy Creek, Fall Creek, Rainbow Creek, Emerson Creek, and many smaller, unnamed tributaries. Grey-shaded survey points on Figure 1 represent sites studied by researchers, but resulting data can not be readily interpreted using a “good/poor” scale.
Interestingly, fish community structure upstream of the urbanized areas was a fairly consistent cold water assemblage (see Fish Fact Sheet), despite a wide range of habitat assessment scores, although fish densities varied with reach. Other tributary reaches off the main stem and areas of the West Branch sub-watershed that were not intensively surveyed may also be relatively intact. High densities of brook trout were observed in the upper reaches of tributaries in NYSDEC fish surveys that did not also score habitat.
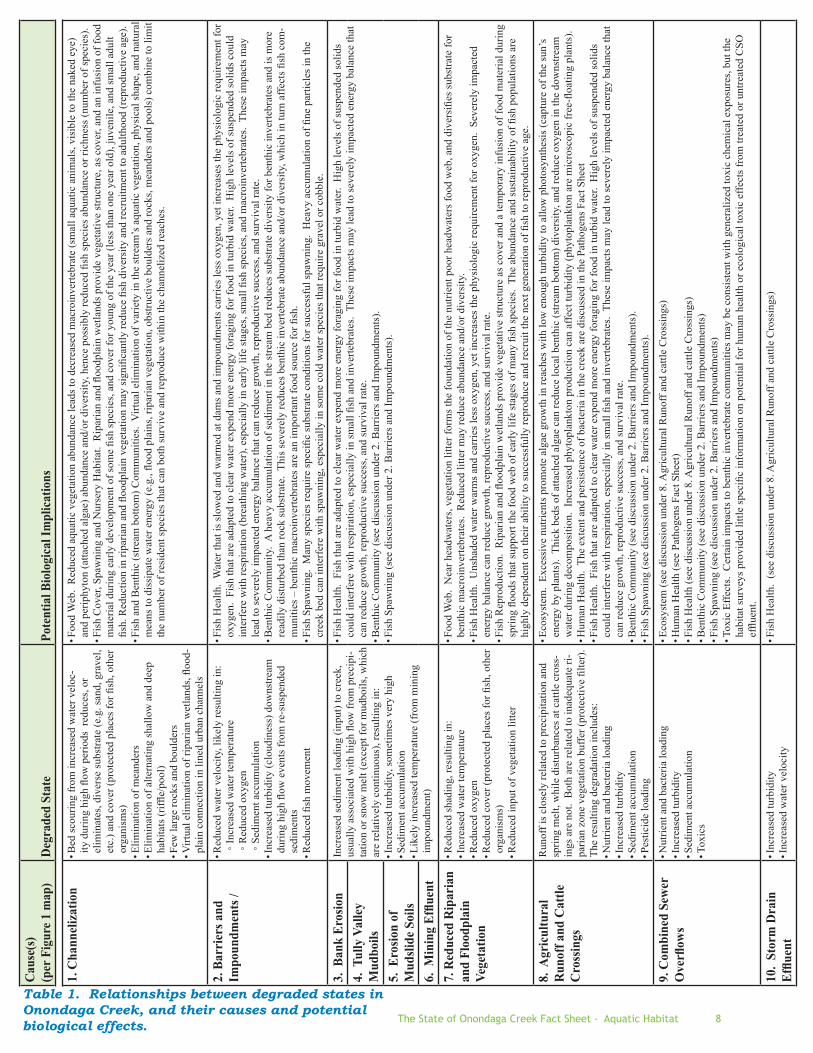
What are the primary causes of habitat degradation in Onondaga Creek? A number of causes of aquatic habitat degradation were identified in surveys conducted along the main stem of Onondaga Creek (numbers below correspond to Figure 1 and Table 1), but limited information is available elsewhere in the watershed. Results of a number of habitat and biological community surveys are generally in agreement as to the nature and principal causes of degradation in the Onondaga Creek watershed. The following factors were repeatedly identified as important impacts (Table 1 describes biological implications for each cause of habitat degradation):
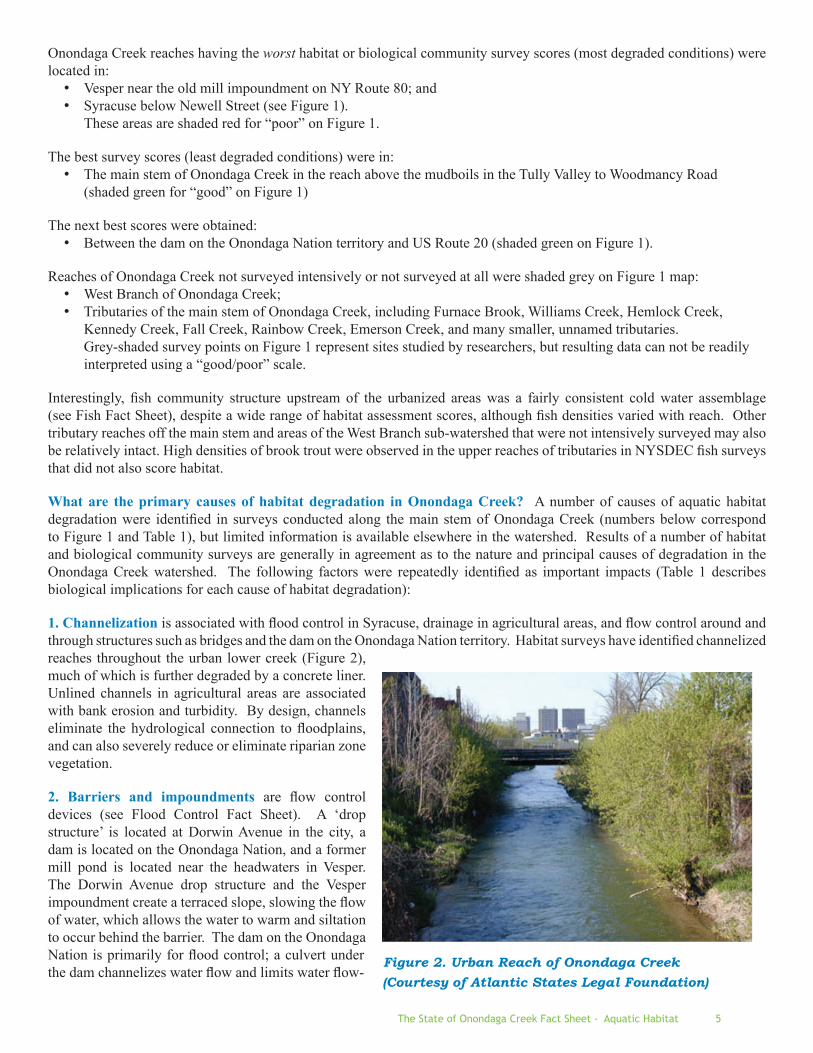
1. Channelization is associated with flood control in Syracuse, drainage in agricultural areas, and flow control around and through structures such as bridges and the dam on the Onondaga Nation territory. Habitat surveys have identified channelized reaches throughout the urban lower creek (Figure 2), much of which is further degraded by a concrete liner. Unlined channels in agricultural areas are associated with bank erosion and turbidity. By design, channels eliminate the hydrological connection to floodplains, and can also severely reduce or eliminate riparian zone vegetation.
2. Barriers and impoundments are flow control devices (see Flood Control Fact Sheet). A ‘drop structure’ is located at Dorwin Avenue in the city, a dam is located on the Onondaga Nation, and a former mill pond is located near the headwaters in Vesper. The Dorwin Avenue drop structure and the Vesper impoundment create a terraced slope, slowing the flow of water, which allows the water to warm and siltation to occur behind the barrier. The dam on the Onondaga Nation is primarily for flood control; a culvert under the dam channelizes water flow and limits water flow-
Figure 2. Urban Reach of Onondaga Creek(Courtesy of Atlantic States Legal Foundation)
The State of Onondaga Creek Fact Sheet - 6Aquatic Habitat
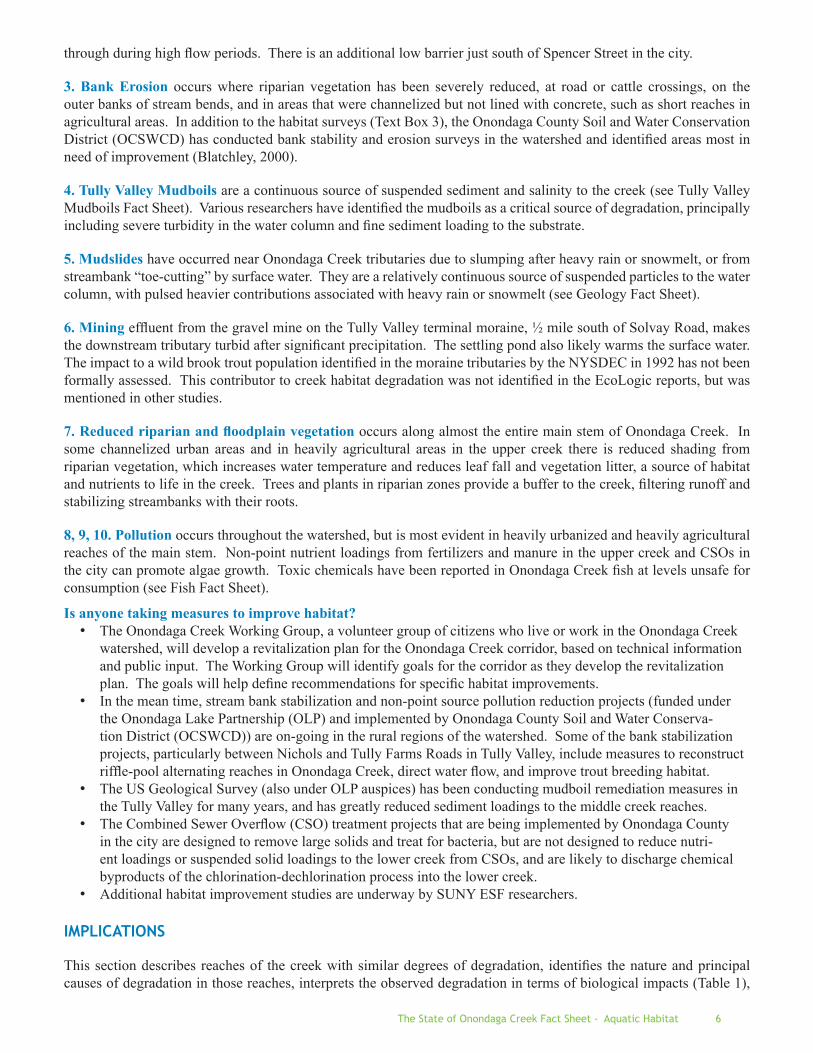
through during high flow periods. There is an additional low barrier just south of Spencer Street in the city.
3. Bank Erosion occurs where riparian vegetation has been severely reduced, at road or cattle crossings, on the outer banks of stream bends, and in areas that were channelized but not lined with concrete, such as short reaches in agricultural areas. In addition to the habitat surveys (Text Box 3), the Onondaga County Soil and Water Conservation District (OCSWCD) has conducted bank stability and erosion surveys in the watershed and identified areas most in need of improvement (Blatchley, 2000).
4. Tully Valley Mudboils are a continuous source of suspended sediment and salinity to the creek (see Tully Valley Mudboils Fact Sheet). Various researchers have identified the mudboils as a critical source of degradation, principally including severe turbidity in the water column and fine sediment loading to the substrate.
5. Mudslides have occurred near Onondaga Creek tributaries due to slumping after heavy rain or snowmelt, or from streambank “toe-cutting” by surface water. They are a relatively continuous source of suspended particles to the water column, with pulsed heavier contributions associated with heavy rain or snowmelt (see Geology Fact Sheet).
6. Mining effluent from the gravel mine on the Tully Valley terminal moraine, ½ mile south of Solvay Road, makes the downstream tributary turbid after significant precipitation. The settling pond also likely warms the surface water. The impact to a wild brook trout population identified in the moraine tributaries by the NYSDEC in 1992 has not been formally assessed. This contributor to creek habitat degradation was not identified in the EcoLogic reports, but was mentioned in other studies.
7. Reduced riparian and floodplain vegetation occurs along almost the entire main stem of Onondaga Creek. In some channelized urban areas and in heavily agricultural areas in the upper creek there is reduced shading from riparian vegetation, which increases water temperature and reduces leaf fall and vegetation litter, a source of habitat and nutrients to life in the creek. Trees and plants in riparian zones provide a buffer to the creek, filtering runoff and stabilizing streambanks with their roots.
8, 9, 10. Pollution occurs throughout the watershed, but is most evident in heavily urbanized and heavily agricultural reaches of the main stem. Non-point nutrient loadings from fertilizers and manure in the upper creek and CSOs in the city can promote algae growth. Toxic chemicals have been reported in Onondaga Creek fish at levels unsafe for consumption (see Fish Fact Sheet).
Is anyone taking measures to improve habitat? The Onondaga Creek Working Group, a volunteer group of citizens who live or work in the Onondaga Creek • watershed, will develop a revitalization plan for the Onondaga Creek corridor, based on technical information and public input. The Working Group will identify goals for the corridor as they develop the revitalization plan. The goals will help define recommendations for specific habitat improvements. In the mean time, stream bank stabilization and non-point source pollution reduction projects (funded under • the Onondaga Lake Partnership (OLP) and implemented by Onondaga County Soil and Water Conserva-tion District (OCSWCD)) are on-going in the rural regions of the watershed. Some of the bank stabilization projects, particularly between Nichols and Tully Farms Roads in Tully Valley, include measures to reconstruct riffle-pool alternating reaches in Onondaga Creek, direct water flow, and improve trout breeding habitat. The US Geological Survey (also under OLP auspices) has been conducting mudboil remediation measures in • the Tully Valley for many years, and has greatly reduced sediment loadings to the middle creek reaches. The Combined Sewer Overflow (CSO) treatment projects that are being implemented by Onondaga County • in the city are designed to remove large solids and treat for bacteria, but are not designed to reduce nutri-ent loadings or suspended solid loadings to the lower creek from CSOs, and are likely to discharge chemical byproducts of the chlorination-dechlorination process into the lower creek.Additional habitat improvement studies are underway by SUNY ESF researchers.•
IMPLICATIONS
This section describes reaches of the creek with similar degrees of degradation, identifies the nature and principal causes of degradation in those reaches, interprets the observed degradation in terms of biological impacts (Table 1),
The State of Onondaga Creek Fact Sheet - 7Aquatic Habitat
and provides a general assessment of the usefulness of the aquatic habitat surveys for prioritizing improvements.
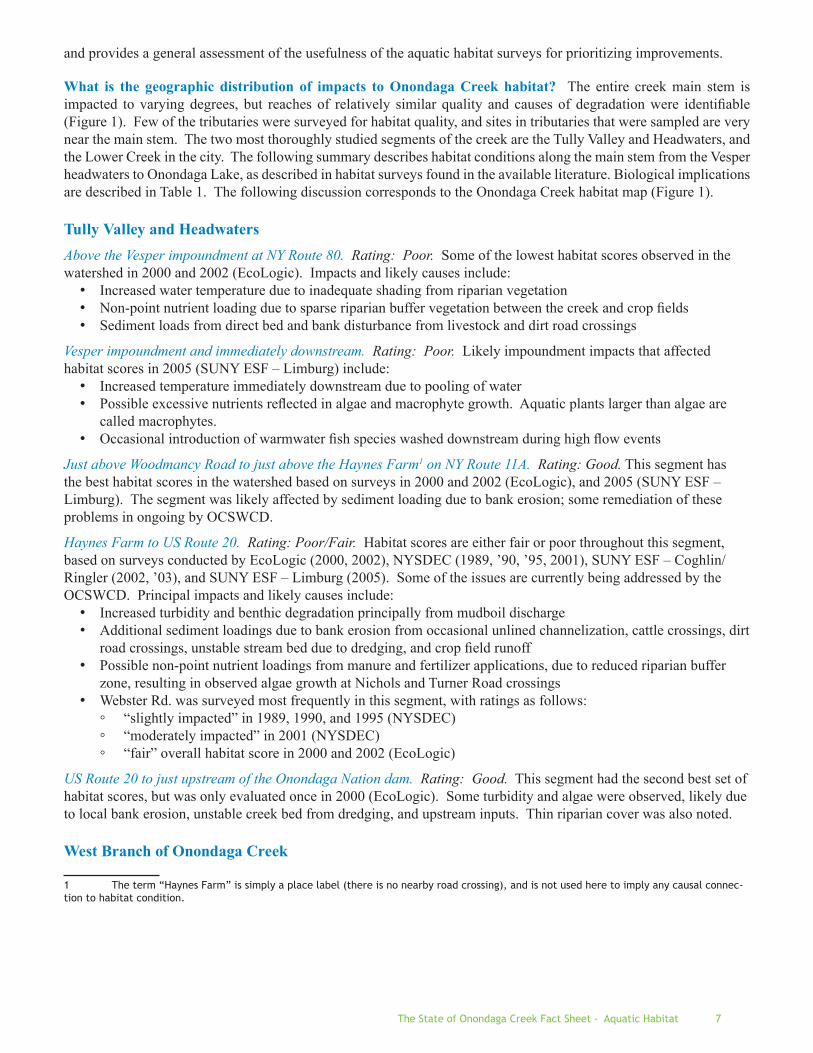
What is the geographic distribution of impacts to Onondaga Creek habitat? The entire creek main stem is impacted to varying degrees, but reaches of relatively similar quality and causes of degradation were identifiable (Figure 1). Few of the tributaries were surveyed for habitat quality, and sites in tributaries that were sampled are very near the main stem. The two most thoroughly studied segments of the creek are the Tully Valley and Headwaters, and the Lower Creek in the city. The following summary describes habitat conditions along the main stem from the Vesper headwaters to Onondaga Lake, as described in habitat surveys found in the available literature. Biological implications are described in Table 1. The following discussion corresponds to the Onondaga Creek habitat map (Figure 1).
Tully Valley and HeadwatersAbove the Vesper impoundment at NY Route 80. Rating: Poor. Some of the lowest habitat scores observed in the watershed in 2000 and 2002 (EcoLogic). Impacts and likely causes include:
Increased water temperature due to inadequate shading from riparian vegetation• Non-point nutrient loading due to sparse riparian buffer vegetation between the creek and crop fields• Sediment loads from direct bed and bank disturbance from livestock and dirt road crossings•
Vesper impoundment and immediately downstream. Rating: Poor. Likely impoundment impacts that affected habitat scores in 2005 (SUNY ESF – Limburg) include:
Increased temperature immediately downstream due to pooling of water• Possible excessive nutrients reflected in algae and macrophyte growth. Aquatic plants larger than algae are • called macrophytes.Occasional introduction of warmwater fish species washed downstream during high flow events•
Just above Woodmancy Road to just above the Haynes Farm1 on NY Route 11A. Rating: Good. This segment has the best habitat scores in the watershed based on surveys in 2000 and 2002 (EcoLogic), and 2005 (SUNY ESF – Limburg). The segment was likely affected by sediment loading due to bank erosion; some remediation of these problems in ongoing by OCSWCD.
Haynes Farm to US Route 20. Rating: Poor/Fair. Habitat scores are either fair or poor throughout this segment, based on surveys conducted by EcoLogic (2000, 2002), NYSDEC (1989, ’90, ’95, 2001), SUNY ESF – Coghlin/Ringler (2002, ’03), and SUNY ESF – Limburg (2005). Some of the issues are currently being addressed by the OCSWCD. Principal impacts and likely causes include:
Increased turbidity and benthic degradation principally from mudboil discharge• Additional sediment loadings due to bank erosion from occasional unlined channelization, cattle crossings, dirt • road crossings, unstable stream bed due to dredging, and crop field runoffPossible non-point nutrient loadings from manure and fertilizer applications, due to reduced riparian buffer • zone, resulting in observed algae growth at Nichols and Turner Road crossingsWebster Rd. was surveyed most frequently in this segment, with ratings as follows:•
“slightly impacted” in 1989, 1990, and 1995 (NYSDEC) ◦“moderately impacted” in 2001 (NYSDEC) ◦“fair” overall habitat score in 2000 and 2002 (EcoLogic) ◦
US Route 20 to just upstream of the Onondaga Nation dam. Rating: Good. This segment had the second best set of habitat scores, but was only evaluated once in 2000 (EcoLogic). Some turbidity and algae were observed, likely due to local bank erosion, unstable creek bed from dredging, and upstream inputs. Thin riparian cover was also noted.
West Branch of Onondaga Creek
1 The term “Haynes Farm” is simply a place label (there is no nearby road crossing), and is not used here to imply any causal connec-tion to habitat condition.
The State of Onondaga Creek Fact Sheet - 8Aquatic Habitat
Table 1. Relationships between degraded states in Onondaga Creek, and their causes and potential biological effects.
Cau
se(s
)(p
er F
igur
e 1 m
ap)
Deg
rade
d St
ate
Pote
ntia
l Bio
logi
cal I
mpl
icat
ions
1. C
hann
eliz
atio
n B
ed sc
ourin
g fr
om in
crea
sed
wat
er v
eloc
-• ity
dur
ing
high
flow
per
iods
red
uces
, or
elim
inat
es, d
iver
se su
bstra
te (e
.g. s
and,
gra
vel,
etc.
) and
cov
er (p
rote
cted
pla
ces f
or fi
sh, o
ther
or
gani
sms)
Elim
inat
ion
of m
eand
ers
• Elim
inat
ion
of a
ltern
atin
g sh
allo
w a
nd d
eep
• habi
tats
(riffl
e/po
ol)
Few
larg
e ro
cks a
nd b
ould
ers
• Virt
ual e
limin
atio
n of
ripa
rian
wet
land
s, flo
od-
• plai
n co
nnec
tion
in li
ned
urba
n ch
anne
ls
Food
Web
. R
educ
ed a
quat
ic v
eget
atio
n ab
unda
nce
lead
s to
decr
ease
d m
acro
inve
rtebr
ate
(sm
all a
quat
ic a
nim
als,
visi
ble
to th
e na
ked
eye)
• an
d pe
riphy
ton
(atta
ched
alg
ae) a
bund
ance
and
/or d
iver
sity
, hen
ce p
ossi
bly
redu
ced
fish
spec
ies a
bund
ance
or r
ichn
ess (
num
ber o
f spe
cies
).Fi
sh C
over
, Spa
wni
ng a
nd N
urse
ry H
abita
t. R
ipar
ian
and
flood
plai
n w
etla
nds p
rovi
de v
eget
ativ
e st
ruct
ure,
as c
over
, and
an
infu
sion
of f
ood
• mat
eria
l dur
ing
early
dev
elop
men
t of s
ome
fish
spec
ies,
and
cove
r for
you
ng o
f the
yea
r (le
ss th
an o
ne y
ear o
ld),
juve
nile
, and
smal
l adu
lt fis
h. R
educ
tion
in ri
paria
n an
d flo
odpl
ain
vege
tatio
n m
ay si
gnifi
cant
ly re
duce
fish
div
ersi
ty a
nd re
crui
tmen
t to
adul
thoo
d (r
epro
duct
ive
age)
.Fi
sh a
nd B
enth
ic (s
tream
bot
tom
) Com
mun
ities
. V
irtua
l elim
inat
ion
of v
arie
ty in
the
stre
am’s
aqu
atic
veg
etat
ion,
phy
sica
l sha
pe, a
nd n
atur
al
• mea
ns to
dis
sipa
te w
ater
ene
rgy
(e.g
., flo
od p
lain
s, rip
aria
n ve
geta
tion,
obs
truct
ive
boul
ders
and
rock
s, m
eand
ers a
nd p
ools
) com
bine
to li
mit
the
num
ber o
f res
iden
t spe
cies
that
can
bot
h su
rviv
e an
d re
prod
uce
with
in th
e ch
anne
lized
reac
hes.
2. B
arri
ers a
nd
Impo
undm
ents
/ R
educ
ed w
ater
vel
ocity
, lik
ely
resu
lting
in:
• In
crea
sed
wat
er te
mpe
ratu
re ◦ R
educ
ed o
xyge
n ◦ Se
dim
ent a
ccum
ulat
ion
◦ Incr
ease
d tu
rbid
ity (c
loud
ines
s) d
owns
tream
• du
ring
high
flow
eve
nts f
rom
re-s
uspe
nded
se
dim
ents
Red
uced
fish
mov
emen
t•
Fish
Hea
lth.
Wat
er th
at is
slow
ed a
nd w
arm
ed a
t dam
s and
impo
undm
ents
car
ries l
ess o
xyge
n, y
et in
crea
ses t
he p
hysi
olog
ic re
quire
men
t for
• ox
ygen
. Fi
sh th
at a
re a
dapt
ed to
cle
ar w
ater
exp
end
mor
e en
ergy
fora
ging
for f
ood
in tu
rbid
wat
er.
Hig
h le
vels
of s
uspe
nded
solid
s cou
ld
inte
rfer
e w
ith re
spira
tion
(bre
athi
ng w
ater
), es
peci
ally
in e
arly
life
stag
es, s
mal
l fish
spec
ies,
and
mac
roin
verte
brat
es.
Thes
e im
pact
s may
le
ad to
seve
rely
impa
cted
ene
rgy
bala
nce
that
can
redu
ce g
row
th, r
epro
duct
ive
succ
ess,
and
surv
ival
rate
.B
enth
ic C
omm
unity
. A
hea
vy a
ccum
ulat
ion
of se
dim
ent i
n th
e st
ream
bed
redu
ces s
ubst
rate
div
ersi
ty fo
r ben
thic
inve
rtebr
ates
and
is m
ore
• read
ily d
istu
rbed
than
rock
subs
trate
. Th
is se
vere
ly re
duce
s ben
thic
inve
rtebr
ate
abun
danc
e an
d/or
div
ersi
ty, w
hich
in tu
rn a
ffec
ts fi
sh c
om-
mun
ities
– b
enth
ic m
acro
inve
rtebr
ates
are
an
impo
rtant
food
sour
ce fo
r fish
.Fi
sh S
paw
ning
. M
any
spec
ies r
equi
re sp
ecifi
c su
bstra
te c
ondi
tions
for s
ucce
ssfu
l spa
wni
ng.
Hea
vy a
ccum
ulat
ion
of fi
ne p
artic
les i
n th
e • cr
eek
bed
can
inte
rfer
e w
ith sp
awni
ng, e
spec
ially
in so
me
cold
wat
er sp
ecie
s tha
t req
uire
gra
vel o
r cob
ble.
3. B
ank
Eros
ion
Incr
ease
d se
dim
ent l
oadi
ng (i
nput
) to
cree
k,
usua
lly a
ssoc
iate
d w
ith h
igh
flow
from
pre
cipi
-ta
tion
or sn
ow m
elt (
exce
pt fo
r mud
boils
, whi
ch
are
rela
tivel
y co
ntin
uous
), re
sulti
ng in
:In
crea
sed
turb
idity
, som
etim
es v
ery
high
• Sedi
men
t acc
umul
atio
n• Li
kely
incr
ease
d te
mpe
ratu
re (f
rom
min
ing
• impo
undm
ent)
Fish
Hea
lth.
Fish
that
are
ada
pted
to c
lear
wat
er e
xpen
d m
ore
ener
gy fo
ragi
ng fo
r foo
d in
turb
id w
ater
. H
igh
leve
ls o
f sus
pend
ed so
lids
• coul
d in
terf
ere
with
resp
iratio
n, e
spec
ially
in sm
all fi
sh a
nd in
verte
brat
es.
Thes
e im
pact
s may
lead
to se
vere
ly im
pact
ed e
nerg
y ba
lanc
e th
at
can
redu
ce g
row
th, r
epro
duct
ive
succ
ess,
and
surv
ival
rate
.B
enth
ic C
omm
unity
(see
dis
cuss
ion
unde
r 2. B
arrie
rs a
nd Im
poun
dmen
ts).
• Fish
Spa
wni
ng (s
ee d
iscu
ssio
n un
der 2
. Bar
riers
and
Impo
undm
ents
).•
4. T
ully
Val
ley
Mud
boils
5. E
rosio
n of
M
udsli
de S
oils
6. M
inin
g Ef
fluen
t7.
Red
uced
Rip
aria
n an
d Fl
oodp
lain
Ve
geta
tion
Red
uced
shad
ing,
resu
lting
in:
• Incr
ease
d w
ater
tem
pera
ture
• Red
uced
oxy
gen
• Red
uced
cov
er (p
rote
cted
pla
ces f
or fi
sh, o
ther
• or
gani
sms)
Red
uced
inpu
t of v
eget
atio
n lit
ter
•
Food
Web
. N
ear h
eadw
ater
s, ve
geta
tion
litte
r for
ms t
he fo
unda
tion
of th
e nu
trien
t poo
r hea
dwat
ers f
ood
web
, and
div
ersi
fies s
ubst
rate
for
• bent
hic
mac
roin
verte
brat
es.
Red
uced
litte
r may
redu
ce a
bund
ance
and
/or d
iver
sity
.Fi
sh H
ealth
. U
nsha
ded
wat
er w
arm
s and
car
ries l
ess o
xyge
n, y
et in
crea
ses t
he p
hysi
olog
ic re
quire
men
t for
oxy
gen.
Sev
erel
y im
pact
ed
• ener
gy b
alan
ce c
an re
duce
gro
wth
, rep
rodu
ctiv
e su
cces
s, an
d su
rviv
al ra
te.
Fish
Rep
rodu
ctio
n. R
ipar
ian
and
flood
plai
n w
etla
nds p
rovi
de v
eget
ativ
e st
ruct
ure
as c
over
and
a te
mpo
rary
infu
sion
of f
ood
mat
eria
l dur
ing
• sprin
g flo
ods t
hat s
uppo
rt th
e fo
od w
eb o
f ear
ly li
fe st
ages
of m
any
fish
spec
ies.
The
abu
ndan
ce a
nd su
stai
nabi
lity
of fi
sh p
opul
atio
ns a
re
high
ly d
epen
dent
on
thei
r abi
lity
to su
cces
sful
ly re
prod
uce
and
recr
uit t
he n
ext g
ener
atio
n of
fish
to re
prod
uctiv
e ag
e.
8. A
gric
ultu
ral
Run
off a
nd C
attle
C
ross
ings
Run
off i
s clo
sely
rela
ted
to p
reci
pita
tion
and
sprin
g m
elt,
whi
le d
istu
rban
ces a
t cat
tle c
ross
-in
gs a
re n
ot.
Bot
h ar
e re
late
d to
inad
equa
te ri
-pa
rian
zone
veg
etat
ion
buff
er (p
rote
ctiv
e fil
ter)
. Th
e re
sulti
ng d
egra
datio
n in
clud
es:
Nut
rient
and
bac
teria
load
ing
• Incr
ease
d tu
rbid
ity• Se
dim
ent a
ccum
ulat
ion
• Pest
icid
e lo
adin
g•
Ecos
yste
m.
Exce
ssiv
e nu
trien
ts p
rom
ote
alga
e gr
owth
in re
ache
s with
low
eno
ugh
turb
idity
to a
llow
pho
tosy
nthe
sis (
capt
ure
of th
e su
n’s
• ener
gy b
y pl
ants
). T
hick
bed
s of a
ttach
ed a
lgae
can
redu
ce lo
cal b
enth
ic (s
tream
bot
tom
) div
ersi
ty, a
nd re
duce
oxy
gen
in th
e do
wns
tream
w
ater
dur
ing
deco
mpo
sitio
n. I
ncre
ased
phy
topl
ankt
on p
rodu
ctio
n ca
n af
fect
turb
idity
(phy
topl
ankt
on a
re m
icro
scop
ic fr
ee-fl
oatin
g pl
ants
).H
uman
Hea
lth.
The
exte
nt a
nd p
ersi
sten
ce o
f bac
teria
in th
e cr
eek
are
disc
usse
d in
the
Path
ogen
s Fac
t She
et• Fi
sh H
ealth
. Fi
sh th
at a
re a
dapt
ed to
cle
ar w
ater
exp
end
mor
e en
ergy
fora
ging
for f
ood
in tu
rbid
wat
er.
Hig
h le
vels
of s
uspe
nded
solid
s • co
uld
inte
rfer
e w
ith re
spira
tion,
esp
ecia
lly in
smal
l fish
and
inve
rtebr
ates
. Th
ese
impa
cts m
ay le
ad to
seve
rely
impa
cted
ene
rgy
bala
nce
that
ca
n re
duce
gro
wth
, rep
rodu
ctiv
e su
cces
s, an
d su
rviv
al ra
te.
Ben
thic
Com
mun
ity (s
ee d
iscu
ssio
n un
der 2
. Bar
riers
and
Impo
undm
ents
).• Fi
sh S
paw
ning
(see
dis
cuss
ion
unde
r 2. B
arrie
rs a
nd Im
poun
dmen
ts).
•
9. C
ombi
ned
Sew
er
Ove
rflow
sN
utrie
nt a
nd b
acte
ria lo
adin
g• In
crea
sed
turb
idity
• Sedi
men
t acc
umul
atio
n• To
xics
•
Ecos
yste
m (s
ee d
iscu
ssio
n un
der 8
. Agr
icul
tura
l Run
off a
nd c
attle
Cro
ssin
gs)
• Hum
an H
ealth
(see
Pat
hoge
ns F
act S
heet
)• Fi
sh H
ealth
(see
dis
cuss
ion
unde
r 8. A
gric
ultu
ral R
unof
f and
cat
tle C
ross
ings
)• B
enth
ic C
omm
unity
(see
dis
cuss
ion
unde
r 2. B
arrie
rs a
nd Im
poun
dmen
ts)
• Fish
Spa
wni
ng (s
ee d
iscu
ssio
n un
der 2
. Bar
riers
and
Impo
undm
ents
)• To
xic
Effe
cts.
Cer
tain
impa
cts t
o be
nthi
c in
verte
brat
e co
mm
uniti
es m
ay b
e co
nsis
tent
with
gen
eral
ized
toxi
c ch
emic
al e
xpos
ures
, but
the
• habi
tat s
urve
ys p
rovi
ded
little
spec
ific
info
rmat
ion
on p
oten
tial f
or h
uman
hea
lth o
r eco
logi
cal t
oxic
eff
ects
from
trea
ted
or u
ntre
ated
CSO
ef
fluen
t.
10.
Stor
m D
rain
Ef
fluen
tIn
crea
sed
turb
idity
• Incr
ease
d w
ater
vel
ocity
• Fi
sh H
ealth
. (s
ee d
iscu
ssio
n un
der 8
. Agr
icul
tura
l Run
off a
nd c
attle
Cro
ssin
gs)
•
The State of Onondaga Creek Fact Sheet - 9Aquatic Habitat
Rating: Fair. This entire segment was assessed only once at a single location in 2001 by the NYSDEC at the NY Route 80 crossing, where water quality was scored as “slightly impacted” based on a biological survey, but the likely cause of degradation was not discussed.
Onondaga NationRating: Poor/Fair. Only one formal survey was located, conducted by EcoLogic in 2000, which included four sites on the Onondaga Nation territory. Scores were fair and poor throughout this segment; the principal impact was high turbidity, likely from upstream contributions, as well as local bank erosion, thin riparian buffer, and some channelization and dredging. Poor riparian cover was noted just above the flood control dam, and at other locations.
Lower Creek (Nedrow and Syracuse)Onondaga Nation to Newell Street. Rating: Poor/Fair. This segment was surveyed in 1999, 2000, and 2002 (EcoLogic) and in 2005 (SUNY ESF – Limburg). The most frequently sampled location was Dorwin Ave., which was rated as “slightly impacted” in 1999 and 2000 (EcoLogic), and “poor’ in 2002 (EcoLogic). Survey scores were mostly ‘poor,’ due to effects from channelization and poor riparian zone vegetation.
Newell Street to Kirkpatrick Street. Rating: Poor. Various sites within this segment were sampled during numerous surveys conducted between 1989 and 2005. This is the largest severely impacted segment of the main stem, with ratings of ‘poor’ in nearly all cases, interspersed with occasional ‘fair’ and ‘severe impact’ scores. There is no evidence in the available survey data that conditions changed during that time. Degradation includes: no floodplain; channelization essentially throughout this segment; bacteria and loading of solids from CSO effluent; algal growth from CSO nutrient loadings; garbage and stormdrain effluent; and poor riparian zone and benthic substrate.
Are existing survey data adequate for prioritizing habitat improvements? It depends on the goals for the biological communities. If conservation of a general community type – such as a cold water fish community - is the goal, then the existing surveys likely provide sufficient information for prioritizing the most obvious improvements in the main stem of the creek. Habitat information is generally more sparse in tributaries, and may need to be supplemented. Remediation of obvious sources of degradation, such as mudboils and bank erosion, is already occurring. Additional information is likely necessary to evaluate the efficacy of those remediation efforts. On the other hand, if the conservation or increase of a naturally sustainable population of a particular set of species is a goal, then detailed information particular to those species (e.g., Coghlan and Ringler, 2005) is likely required.
Onondaga Environmental Institute102 West Division Street, 3rd FloorSyracuse, NY 13210Phone: (315) 472-2150Fax: (315) 474-0537Email: [email protected]
FOR MORe INFORMATION:
This fact sheet and additional information about the Onondaga Creek Revitalization Plan project can be found on the World Wide Web at www.esf.edu/onondagacreek/.
The Onondaga Lake Partnership (OLP) sponsors the Onondaga Creek Revitalization Plan project with funds from the U.S. Environmental Protection Agency. Visit www.onlakepartners.org for more information about the OLP.
ReFeReNCeSBannon, E. 1984. Prediction of diet in a natural population of brown trout (Salmo trutta) from the analysis of foraging costs. Master’s Thesis. SUNY College of Environmental Science and Forestry, Syracuse, New York.
Blatchley, T.C. 2000. A streambank and roadbank erosion inventory of the Onondaga Creek watershed, Onondaga County, NY. Onondaga County Soil and Water Conservation District report. August 17, 2000.
Bode, R.W., and M.A. Nowak. 1988. Proposed biological criteria for New York State streams. In: T. Simon, L. Holst, L.J. Shepard (Eds). Proceedings of the 1st National Workshop on Biological Criteria, Lincolnwood, IL. Dec 2-4, 1987. EPA Region 5, Chicago, IL. EPA Doc. No. EPA-905/9-89/003..
Bode, R.W., M.A. Novak, and L.E. Abele. 1989. Biological stream assess-ment: Streams tributary to Onondaga Lake, Onondaga County, New York. 1989 Survey. Stream Biomonitoring Unit, Bureau of Monitoring and Assess-ment, Division of Water, NYSDEC.
Coghlan, S.M. and N.H. Ringler. 2005. Survival and bioenergetic responses of juvenile Atlantic salmon along a perturbation gradient in a natural stream. Ecol Freshwat Fish 14: 111-124.
Danehy, R.J. 1994. Geomorphic, hydrologic, and hydraulic determinants of fish and macroinvertebrate communities in a small watershed. PhD Disserta-tion. SUNY College of Environmental Science and Forestry, Syracuse, New York.
Davis, M.A. and L.B. Slobodkin. 2004. The science and values of restoration ecology. Restor Ecol 12(1): 1-3.
Danehy, R.J., N.H. Ringler and J.Ruby. 1999. Hydraulic and geomorphic influence on macroinvertebrate distribution in the headwaters of a small waters. J Freshwat Ecol 14: 79-91.
EcoLogic. 2001. 2000 Onondaga lake tributary mapping. Prepared for: Onondaga County Department of Water Environment Protection, Syracuse, NY. Prepared by: EcoLogic, LLC., Cazenovia, NY.
EcoLogic. 2001. 2000 Onondaga lake and tributaries macroinvertebrate monitoring. Prepared for: Onondaga County Department of Water Environ-ment Protection, Syracuse, NY. Prepared by: EcoLogic, LLC., Cazenovia, NY. October, 2001.
EcoLogic. 2003. 2002 Onondaga lake tributary mapping. Prepared for: Onondaga County Department of Water Environment Protection, Syracuse, NY. Prepared by: EcoLogic, LLC., Cazenovia, NY. April, 2003.
EcoLogic. 2003. 2002 Onondaga lake and tributaries macroinvertebrate monitoring: Significant findings and data summaries. Prepared for: Onon-daga County Department of Water Environment Protection, Syracuse, NY. Prepared by: EcoLogic, LLC., Cazenovia, NY. April, 2003.
Hilsenhoff, W.L. 1982. Using a biotic index to evaluate water quality in streams. Wisconsin Department of Natural Resources Technical Bulletin No. 132. 22 pp. As cited in Bode and Novak 1988.
Hilsenhoff, W.L. 1987. An improved biotic index of organic stream pollu-
tion. The Great Lakes Entomologist. 20(1): 31-40. As cited in Bode and Novak 1988.
Hilsenhoff, W.L. 1988. Rapid field assessment of organic pollution with a family-level biotic index. J N Amer Benthol Soc 7: 65-68.
Karr, J.R., K.D. Fausch, P.L. Angermeier, P.R. Yant and I.J. Schlosser. 1986. Assessing biological integrity in running waters: A method and its rationale. Illinois Natural History Survey. Special Publication 5. September, 1986.
Lancaster, J. 2000. The ridiculous notion of assessing ecological health and identifying useful concepts underneath. Human Ecol Risk Assessm 6(2): 213-222.
Limburg, K., V. Collins, C. Landis, J. Popoli, C. Whritenour, and A. Wilson. 2005. (Unpublished data).
Misch, W.J. and J.G. Gosselink. 2000. Riparian Ecosystems (Chapter 15). pp 513-567. In Wetlands (3rd ed.), John Wiley & Sons, Inc., New York.
Natural Resources Conservation Service (NRCS). 1998. Stream Visual Assessment Protocol. United States Department of Agriculture. National Water and Climate Center Technical Note 99-1. 36 pp. December, 1998. http://www.nrcs.usda.gov/technical/ECS/aquatic/svapfnl.pdf.
Simpson, K.W. 1982. Technical Memorandum: Biological Survey of Onondaga Creek. Center for Laboratories and Research, NYS Department of Health, Albany, NY. November, 1982. 28 pp.
Smith, A.J. and R.W. Bode. 2004. Analysis of variability in New York State benthic macroinvertebrate samples. Division of Water, NYSDEC, Albany, NY.
Ringler, N.A., C. Gandino, P. Hirethota, R. Danehy, P. Tango, C. Morgan, C. Millard, M. Murphy, M.A. Arrigo, R.J. Sloan and S.W. Effler. 1996. Fish communities and habitats in Onondaga Lake, adjoining portions of the Seneca River, and lake tributaries. pp 453-494. In: S.W. Effler (Ed). Limnological and Engineering Analysis of a Polluted Urban Lake: Prelude to Environmen-tal Management of Onondaga Lake, New York. Springer-Verlag, New York.
Upstate Freshwater Institute. 1994. The state of Onondaga Lake. Prepared by: Upstate Freshwater Institute, Syracuse, NY. Prepared for: Onondaga Lake Management Conference, Syracuse, NY. pp 6-97 to 6-102.
US Environmental Protection Agency (USEPA). 1996. Combined sewer overflows and the multimetric evaluation of their biological effects: Case studies in Ohio and New York. USEPA Office of Water, Washington, DC. EPA Doc. No. EPA-823-R-96-002.
Vannote, R.L., G.W. Minshall, K.W. Cummins, J.R. Sedell, and C.E. Cushing. 1980. The river continuum concept. Canadian Journal of Fisheries and Aquatic Sciences 37:130-137.
© 2008 Onondaga Environmental Institute Printed on 30% post-consumer recycled paper