aqualis asa
TRANSCRIPT

aqualis.no
Aqualis ASATHIRD QUARTER RESULTS 2015
Oslo, 27 October 2015
Disclaimer This Presentation has been produced by Aqualis ASA (the “Company” or “Aqualis ”) solely for use at the presentation to investors and other stake holders and may not be
reproduced or redistributed, in whole or in part, to any other person. This presentation is strictly confidential, has not been reviewed or registered with any public authority or stock exchange, and may not be reproduced or redistributed, in whole or in part, to any other person. To the best of the knowledge of the Company, the information contained in this Presentation is in all material respect in accordance with the facts as of the date hereof, and contains no material omissions likely to affect its importance. However, no representation or warranty (express or implied) is made as to, and no reliance should be placed on, any information, including projections, estimates, targets and opinions, contained herein, and no liability whatsoever is accepted as to any errors, omissions or misstatements contained herein, and, accordingly, neither the Company nor any of its subsidiary companies or any such person’s officers or employees accepts any liability whatsoever arising directly or indirectly from the use of this Presentation. This Presentation contains information obtained from third parties. Such information has been accurately reproduced and, as far as the Company is aware and able to ascertain from the information published by that third party, no facts have been omitted that would render the reproduced information to be inaccurate or misleading.
This Presentation contains certain forward-looking statements relating to the business, financial performance and results of the Company and/or the industry in which it operates. Forward-looking statements concern future circumstances and results and other statements that are not historical facts, sometimes identified by the words “believes”, expects”, “predicts”, “intends”, “projects”, “plans”, “estimates”, “aims”, “foresees”, “anticipates”, “targets”, and similar expressions. The forward-looking statements contained in this Presentation, including assumptions, opinions and views of the Company or cited from third party sources are solely opinions and forecasts which are subject to risks, uncertainties and other factors that may cause actual events to differ materially from any anticipated development. None of the Company or any of its parent or subsidiary undertakings or any such person’s officers or employees provides any assurance that the assumptions underlying such forward-looking statements are free from errors nor does any of them accept any responsibility for the future accuracy of the opinions expressed in this Presentation or the actual occurrence of the forecasted developments. The Company assumes no obligation, except as required by law, to update any forward-looking statements or to conform these forward-looking statements to our actual results.
AN INVESTMENT IN THE COMPANY INVOLVES RISK, AND SEVERAL FACTORS COULD CAUSE THE ACTUAL RESULTS, PERFORMANCE OR ACHIEVEMENTS OF THE COMPANY TO BE MATERIALLY DIFFERENT FROM ANY FUTURE RESULTS, PERFORMANCE OR ACHIEVEMENTS THAT MAY BE EXPRESSED OR IMPLIED BY STATEMENTS AND INFORMATION IN THIS PRESENTATION, INCLUDING, AMONG OTHERS, RISKS OR UNCERTAINTIES ASSOCIATED WITH THE COMPANY’S BUSINESS, SEGMENTS, DEVELOPMENT, GROWTH MANAGEMENT, FINANCING, MARKET ACCEPTANCE AND RELATIONS WITH CUSTOMERS, AND, MORE GENERALLY, GENERAL ECONOMIC AND BUSINESS CONDITIONS, CHANGES IN DOMESTIC AND FOREIGN LAWS AND REGULATIONS, TAXES, CHANGES IN COMPETITION AND PRICING ENVIRONMENTS, FLUCTUATIONS IN CURRENCY EXCHANGE RATES AND INTEREST RATES AND OTHER FACTORS.
SHOULD ONE OR MORE OF THESE RISKS OR UNCERTAINTIES MATERIALISE, OR SHOULD UNDERLYING ASSUMPTIONS PROVE INCORRECT, ACTUAL RESULTS MAY VARY MATERIALLY FROM THOSE DESCRIBED IN THIS PRESENTATION. THE COMPANY DOES NOT INTEND, AND DOES NOT ASSUME ANY OBLIGATION, TO UPDATE OR CORRECT THE INFORMATION INCLUDED IN THIS PRESENTATION.
By attending or receiving this Presentation you acknowledge that you will be solely responsible for your own assessment of the market and the market position of the Company and that you will conduct your own analysis and be solely responsible for forming your own view of the potential future performance of the Company’s business. This Presentation does not constitute an offer to sell or a solicitation of an offer to buy any securities in any jurisdiction to any person to whom it is unlawful to make such an offer or solicitation in such jurisdiction.
2

2. Financial highlightsChristian OpsahlCFO
1. Operational highlightsDavid WellsCEO
Agenda
3
3. OutlookDavid WellsCEO

Q3 2015 – operational highlights
4
Signed MoU to acquire a 49.9 percent stake in Adler Solar – a Germany-based company specialising in the provision of engineering consultancy and testing services for all lifecycle phases of PV plants and PV modules. Transaction expected to be closed in Q4 2015
Continued investment in business growth: Three new offices opened in Q3: Germany, Malaysia and South Korea Most of costs associated with new offices and growth of workforce are expensed and not
capitalized
Several new contracts signed in Q3 Successful strategic change towards supporting clients with day to day offshore operations,
as new investment related opportunities weaken
As guided in Q2, Middle East operation affected by slowdown due to monsoon season
Steady inflow of short term engineering and marine operational work in Europe
Healthy offshore wind market despite withdrawal of government subsidies
Capacity reduction in Rio de Janeiro office as consequence of weak Brazil market
Continued solid HSE performance: no lost time incidents (LTIs) during the quarter
* Includes contractors on 100% utilization equivalent basis

0,0
2,0
4,0
6,0
8,0
10,0
12,0
Q1 2014 Q2 2014 Q3 2014 Q4 2014 Q1 2015 Q2 2015 Q3 2015
Revenues
Notes: (1) Tristein AS included from May 2014; OWC Ltd from July 2014
USDm
2014 2015
-16%
9.5
11.3

0
50
100
150
200
250
Q3 2013 Q4 2013 Q1 2014 Q2 2014 Q3 2014 Q4 2014 Q1 2015 Q2 2015 Q3 2015
Recruitment – quarterly development
6
Notes: (1) Numbers include contractors on 100% utilization equivalent basis (2) Tristein AS included from May 2014; OWC Ltd from July 2014
# of employees+42%
2013 2014 2015
166
236

0
5
10
15
20
25
Q1 2014 Q2 2014 Q3 2014 Q4 2014 Q1 2015 Q2 2015 Q3 2015
Order backlog
Notes: (1) Tristein AS included from May 2014; OWC Ltd from July 2014
Backlog level maintained from end of Q2 2015
Backlog affected by re-focused strategy of supporting clients on day-to-day service operations which are typically call-out contracts that do not get included in backlog figures
Pipeline of work expected from call out contracts continues to look solid
-28%
21.9
15,1
2014 2015

Q3 2015 – main new contract wins
8
MWS services for dry transportation of jack-up unit to China
Brazil: engineering consultancy services
for 3 FPSO units
Korea: FMEA audits of new build shuttle
tankers
Offshore Saudi Arabia: Marine
representation for marine spreads
Middle East: detail engineering design
on new build landing craft China: construction
monitoring new build liftboat project
Denmark: geotechnical
consultancy for Horns 3 windfarm
Geotechnical consultancy to utility
company’s cable burial investigation

Global presence – 19 offices in 14 countries
9
Current locations
RIO DE JANEIRO
MEXICO CITY
HOUSTON
OSLO/SANDEFJORDKRITIANSUND
SINGAPORE
SHANGHAIDAMMAM
DUBAI
ABU DHABI
MANAMA
LONDON
KUALA LUMPUR
ABERDEEN
HAMBURG
DOHABUSAN

2. Financial highlightsChristian OpsahlCFO
1. Operational highlightsDavid WellsCEO
Agenda
10
3. OutlookDavid WellsCEO

Q3 2015 – key figures
11
2015 2014 2015 2014
(USD '000) Q3 Q3 YTD FY*
Total revenues and other income 9,5 11,3 32,2 33,3
Operating profit (EBIT) -1,4 -1,0 -0,9 -1,9
Operating profit (EBIT) adjusted** -1,4 -1,0 -0,9 -0,7
Profit after taxes -1,5 -1,2 -0,5 -0,3
Profit after taxes adjusted** -1,5 -1,2 -0,5 1,1
Cash & cash equivalents 18,6 21,4 18,6 21,8
Number of outstanding shares (thousands) 43 506 43 191 43 191 43 191
* due to change in accounting principles, travel costs are included both in revenues
and other operating cost. There is no change in EBIT compared to actual reported
in 2014.
** adjusted by one-off costs in Aqualis ASA of 1.4m in third quarter 2014, relating
to corporate restructuring and listing
0,00%
10,00%
20,00%
30,00%
40,00%
50,00%
60,00%
70,00%
80,00%
90,00%
100,00%
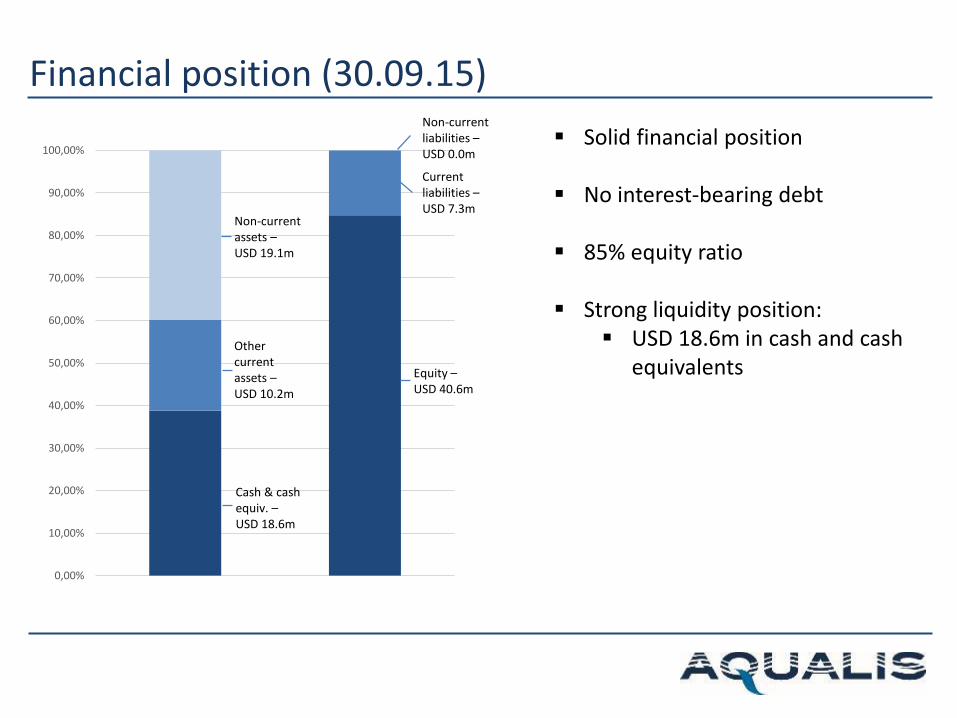
Financial position (30.09.15)
Solid financial position
No interest-bearing debt
85% equity ratio
Strong liquidity position: USD 18.6m in cash and cash
equivalents
Cash & cash equiv. –USD 18.6m
Other current assets –USD 10.2m
Non-current assets –USD 19.1m
Equity –USD 40.6m
Current liabilities –USD 7.3m
Non-current liabilities –USD 0.0m

Q3 2015 – cash flow
13
USDm Q3 2015 Q3 2014
Operating cash flow -2.0 -1.1
Investing cash flow -0.1 -0.3
Financing cash flow 0.3 19.3
Cash beg. of period 20.4 3.4
Net FX difference 0.1 0.0
Change in cash & cash equiv. -1.8 18
Cash end of period 18.6 21.4
Negative operating cash flow of approximately USD 2 million for Q3 2015
Financing cash flow of USD 0.3 million relates to proceeds from shares issued in connection with the employee share scheme
Net positive cash flow in Q3 2014 related to proceeds from share issue and contribution in kind

2. Financial highlightsChristian OpsahlCFO
1. Operational highlightsDavid WellsCEO
Agenda
14
3. OutlookDavid WellsCEO

Outlook
15
Market Good activity level for service operations on
existing oil and gas assets
Market for new large engineering opportunities remains very weak
Middle East oil and gas markets expected to remain buoyant, especially marine related
Plenty of oil and gas prospects in Asia Pacific
Brazil to remain weak, and North America increasingly so
Good opportunities within offshore wind, despite withdrawal of government subsidies
Continued strong rig moving market
Pipeline of work from Aqualis’ call-out contracts continues to look solid
Micro Continue to grow focus on day-to-day offshore
operations of oil and gas assets as new investment related opportunities weaken
Plenty of available quality staff in the market –expansion of workforce to remain selective
Consolidation of recent fast-paced footprint growth and focus on developing opportunities within those countries
Close Adler Solar transaction in Q4
Achieve original strategy of operating as “energy consultants” across three main sectors:
Oil and gas (Aqualis Offshore)
Offshore renewables (Offshore Wind Consultants)
Solar industry (Adler Solar)
Evaluating several M&A opportunities

Summary
16
Sound operational performance in Q3, but results negativelyimpacted by certain weak oil and gas markets and segments
Maintained healthy backlog level and strong financial position
Three new offices opened in Q3
Signed MoU to acquire 49.9% stake in Adler Solar
Maintain successful strategy of supporting clients on day-to-dayoffshore operations, with focus on operations and niche engineeringincluding upgrades, modification and conversion of existing assets
Healthy offshore wind market
Keeping a close eye on cost base – adapting to changed marketconditions

aqualis.no
Aqualis ASAAPPENDIX

18
Aqualis Offshore Ltd* Offshore Wind Consultants Ltd
Aqualis ASA(listed entity – OSE: AQUA)
Marine & engineering consultancy services
* Tristein AS merged with Aqualis Offshore AS, effective date 1 Jan 2015

Corporate structure
19
**The company is 100% controlled by Aqualis Offshore
Aqualis ASA
* In KSA / Bahrain, Aqualis operates through agency agreement with AET
Aqualis Offshore Inc
(Houston, USA)
Aqualis Offshore Marine Services LLC
(Dubai,UAE)
Aqualis Offshore Pte Ltd
(Singapore)
Aqualis Offshore UK Ltd
(London, Aberdeen UK)
Aqualis Offshore Serviçõs Ltda
(Rio de Janeiro, Brazil)
Aqualis Offshore AS
(Sandefjord, Norway)
49%** 100%
100% 100%
Aqualis Offshore Ltd
(London, UK)
100%
100%
Aqualis Dammam, KSA*
100%
100%
100%
Offshore Wind Consultants Ltd
(London, UK)
100%
Aqualis Offshore S. de R.L. de C.V.(Mexico City,
Mexico)
Aqualis Offshore Marine Consulting
LLC(Abu Dhabi, UAE)
100%
Aqualis Manama, Bahrain*
100% 49%**
Aqualis Offshore Marine Consulting
Co., Ltd.(Shanghai, China)
Aqualis Offshore LLC
(Doha, Qatar)
100%
OWC (Aqualis) GmbH
(Hamburg, Germany)
Aqualis Offshore Korea Ltd
(Busan, South Korea)
100%
Aqualis Offshore Malaysia Sdn. Bhd.
(Kuala Lumpur, Malaysia)
100% 100%

Complete life cycle involvement with offshore assets
Project initiationEngineering / design phase
Project procurement
ConstructionHook-up and
commissioningAsset
managementDe-
commissioning
Marine project / asset life cycle
Aq
ual
is O
ffsh
ore
serv
ice
s
Engineering (niche-focus):
Basic / conceptual design / FEED
Modifications and upgrades of drilling rigs / FPSOs / FSOs / lift-boats
Transportation & installation analysis
Inspection & approvals:
Marine warranty services
Mooring analysis
Condition and suitability surveys / audits
DP inspections and audits
Jack-up site assessments
Construction yard supervision:
Site attendance on behalf of owners, shipyards, financial institutions, 3rd
parties
New-builds + conversions & upgrades
Due diligence / compliancy; financial community focus
Marine operations:
Transport and installation services; “moving of offshore assets”
Rig moving
Float-overs
Site attendance & procedure management
Aqualis’ key competencies are conjointly exposed to both offshore opex and capex cycles
20

Offshore operations are key for all business lines
21
Moving of rigs
Offshore Construction
Projects
Transportation &
installation
Marine Warranty
Services (MWS)
FPSO/MOPU engineering
and installation
Towages
Offshore operations«Doing» «Observing»
Jack up engineering
(basic design, upgrade
and conversion)
FPSO marine engineering
Construction supervision
Engineering design and
consultancy
Key staff provision
Technical Due diligence
DP FMEAs and audits
Vessel inspections and
surveys
Marine and engineering
approvals
Site assessments
Engineering reviews /
verifications
Marine consultancy

NOCs / IOCs: Offshore cont. / shipyards:
Underwriters / financial inst.:
Selected clients
22
Rig / vessel owners:

Selected clients
23
Vattenfall
East Anglia Offshore Wind
Gwynt y Mor Offshore Wind Limited
RWE Innogy GmbH
Galloper Offshore Wind Limited
Trianel GmbH
Dong Energy
Mainstream Renewable Power Limited
Navitus Bay Offshore Park
Iberdrola Renewables
ScottishPower
SNC Lavalin Capital

Top 20 shareholders (30.09.15)
24
Ferncliff and associated companies + Gross: approx. 27%
Management and employees: approx. 24%
NAME COUNTRY # OF SHARES % HELD
STRATA MARINE & OFFSHORE AS NORWAY 5450973 12,53 %
GROSS MANAGEMENT AS NORWAY 5281109 12,14 %
AQUALIS HOLDCO LIMITED UK 2187500 5,03 %
PERSHING LLC USA 2082491 4,79 %
ARCTIC FUNDS PLC BELGIUM 1461830 3,36 %
QVT FUND V LP BELGIUM 1190105 2,74 %
BINKLEY CAPITAL AS NORWAY 1133664 2,61 %
AGITO HOLDING AS NORWAY 900000 2,07 %
FERNCLIFF LISTED DAI AS NORWAY 843310 1,94 %
PHILIP ALAN LENOX SINGAPORE 830583 1,91 %
T10 INVEST AS NORWAY 825856 1,90 %
BADREDDIN DIAB USA 814648 1,87 %
SAXO BANK A/S DENMARK 732812 1,68 %
VERDIPAPIRFONDET DNB SMB NORWAY 700000 1,61 %
SIX SIS AG SWITZERLAND 642087 1,48 %
ALSTO CONSULTANCY LTD SEYCHELLES 598122 1,37 %
IAN DENNIS BONNON UK 555074 1,28 %
OFFSHORE & MARINE CONSULTING AS NORWAY 525000 1,21 %
ANDREAS THEOFANATOS BRAZIL 512188 1,18 %
AMAN MARINE LIMITED UNITED ARAB EMIRATES 492187 1,13 %
27759539 63,81 %

Consolidated statement of comprehensive income
25
*Due to change in accounting principles, travel costs are included in both revenues and other operating costs. There is no change in EBIT compared to actual reported in 2014
2015 2014 2015 2014*
(USD '000) Note Q3 Q3 YTD FY
Operating revenues 7 9 511 11 253 32 243 33 303
Other income - - - -
Total revenues and other income 9 511 11 253 32 243 33 303
Payroll and payroll related costs 6 5 840 5 437 17 641 18 563
Depreciation, amortisation and impairment 129 223 526 900
Other operating costs 4 964 6 563 14 995 15 788
Total operating expenses 7 10 933 12 223 33 162 35 251
Operating profit (EBIT) -1 422 -970 -918 -1 948
Finance income 56 52 94 120
Finance costs 2 123 12 205
Net currency exhange gain/-loss 4 -23 -59 617 1 994
Profit before taxes -1 391 -1 100 -219 -39
Taxes 71 87 250 211
Profit after taxes -1 462 -1 187 -469 -250
Other comprehensive income
Currency translation differences -3 026 -1 246 -6 041 -8 834
Income tax effect - - - -
Total comprehensive income for the period -4 488 -2 433 -6 510 -9 084
Total comprehensive income for the year, net of tax attributable to:
Equity holders of the parent company -4 488 -2 433 -6 510 -9 084
Non-controlling interests - - - -
Total -4 488 -2 433 -6 510 -9 084
Earnings per share (USD): basic and diluted -0,03 n/a -0,01 -0,01
Other comprehensive income to be reclassified to profit or loss in subsequent
periods
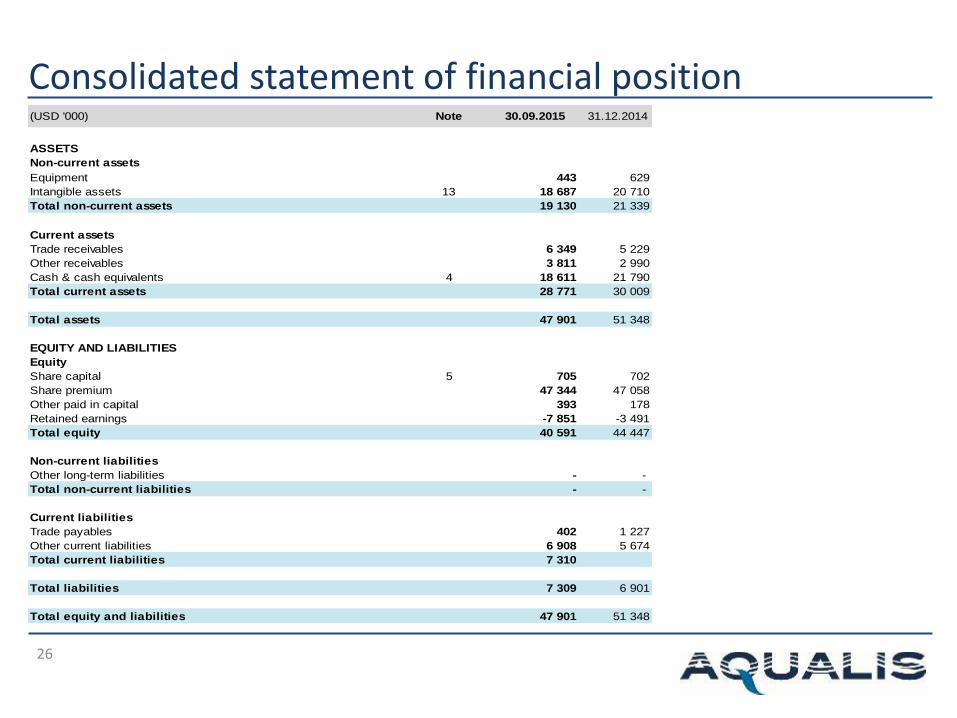
Consolidated statement of financial position
26
(USD '000) Note 30.09.2015 31.12.2014
ASSETS
Non-current assets
Equipment 443 629
Intangible assets 13 18 687 20 710
Total non-current assets 19 130 21 339
Current assets
Trade receivables 6 349 5 229
Other receivables 3 811 2 990
Cash & cash equivalents 4 18 611 21 790
Total current assets 28 771 30 009
Total assets 47 901 51 348
EQUITY AND LIABILITIES
Equity
Share capital 5 705 702
Share premium 47 344 47 058
Other paid in capital 393 178
Retained earnings -7 851 -3 491
Total equity 40 591 44 447
Non-current liabilities
Other long-term liabilities - -
Total non-current liabilities - -
Current liabilities
Trade payables 402 1 227
Other current liabilities 6 908 5 674
Total current liabilities 7 310
Total liabilities 7 309 6 901
Total equity and liabilities 47 901 51 348

Consolidated cash flow statement
27
2015 2014 2015 2014
(USD '000) Note Q3 Q3 YTD FY
Cash flow from operating activities
Profit before taxes -1 391 -1 100 -219 -39
Non-cash adjustment to reconcile profit before taxes to cash flow:
Estimated value of employee share options 40 105 215 178
Depreciation, amortisation and impairment 129 223 526 900
Changes in working capital:
Changes in trade receivables and trade creditors 621 -739 -1 945 -2 497
Changes in deferred income
Changes in other accruals - 492 413 1 570
Effects related to aqcquisition of subsidiaries - - - 2 147
Effects related to currency unrealized -1 443 -38 -2 109 -2 050
Net cash flow from operating activities -2 044 -1 057 -3 119 208
Cash flow from investing activities
Purchase of equipment 7 -96 -282 -287 -691
Acquisition of subsidiaries, net of cash 12 - - - 1 997
Net cash flow from investing activities -96 -282 -287 1 306
Cash flow from financing activities
Proceeds from share issue 4 290 10 475 290 10 642
Proceed from contribution in kind - 8 857 - 8 857
Net cash flow from financing activities 290 19 332 290 19 499
Net change in cash and cash equivalents -1 850 17 993 -3 116 21 014
Cash and cash equivalents beginning period 20 397 3 403 21 790 838
Net foreign exhange difference 64 -31 -62 -62
Cash and cash equivalents end period 18 611 21 365 18 611 21 790

Segment information
28
(USD '000)
Marine &
OffshoreTotal
Marine &
OffshoreTotal
Marine &
OffshoreTotal
Marine &
OffshoreTotal
Revenues
Norway 1 606 1 606 2 611 2 611 6 398 6 398 6 836 6 836
Singapore 3 359 3 359 3 766 3 766 10 252 10 252 11 309 11 309
UAE 2 655 2 655 2 486 2 486 9 993 9 993 8 322 8 322
USA 755 755 1 700 1 700 2 851 2 851 3 746 3 746
Brazil 307 307 851 851 1 249 1 249 2 796 2 796
UK 1 205 1 205 964 964 3 569 3 569 2 015 2 015
China 217 217 16 16 427 427 51 51
Mexico 483 483 - - 1 336 1 336 32 32
Qatar 13 13 - - 13 13 - -
Germany 10 10 - - 10 10 - -
Elimination -1 099 -1 099 -1 141 -1 141 -3 855 -3 855 -1 803 -1 803
Total revenue 9 511 9 511 11 253 11 253 32 243 32 243 33 303 33 303
Operating profit (EBIT)
Norway 74 74 272 272 982 982 164 164
Singapore 323 323 916 916 1 497 1 497 2 453 2 453
UAE -423 -423 315 315 -123 -123 509 509
USA -147 -147 320 320 -169 -169 547 547
Brazil -160 -160 -32 -32 -381 -381 -86 -86
UK -85 -85 55 55 -60 -60 129 129
China -56 -56 -276 -276 -210 -210 -418 -418
Mexico 38 38 -59 -59 98 98 -84 -84
Qatar -104 -104 - - -143 -143 - -
Germany -22 -22 - - -22 -22 - -
Korea -46 -46 - - -46 -46 - -
Central cost -772 -772 -2 280 -2 280 -1 607 -1 607 -4 535 -4 535
Elimination -42 -42 -201 -201 -734 -734 -626 -626
Total operating profit (EBIT) -1 422 -1 422 -970 -970 -918 -918 -1 948 -1 948
EBITDA -1 293 -1 293 -747 -747 -392 -392 -1 048 -1 048
Depreciation and amortisation -129 -129 -223 -223 -526 -526 -900 -900
Operating profit/loss (EBIT) -1 422 -1 422 -970 -970 -918 -918 -1 948 -1 948
Capex 96 70 282 282 287 287 691 691
Q3 2015 Q3 2014* 2014 FY*2015 YTD