aquaenv
DESCRIPTION
R AquaEnv manualTRANSCRIPT
Package ‘AquaEnv’April 9, 2010
Version 1.0-1
Date 2010-04-07
Title AquaEnv - an integrated development toolbox for aquatic chemical model generation
Author Andreas F. Hofmann, Karline Soetaert, Filip J.R. Meysman
Maintainer Andreas F. Hofmann <[email protected]> and<[email protected]>
Depends minpack.lm, deSolve
Description AquaEnv is an integrated development toolbox for aquatic chemical model generationfocused on (ocean) acidification and CO2 air-water exchange. It contains all elements necessaryto model the pH, the related CO2 air-water exchange, as well as aquatic acid-base chemistry ingeneral for an arbitrary marine, estuarine or freshwater system. Also chemical batches can bemodelled. Next to the routines necessary to calculate desired information, AquaEnv also containsa suite of tools to visualize this information. Furthermore, AquaEnv can not only be used to builddynamic models of aquatic systems, but it can also serve as a simple desktop tool for theexperimental aquatic chemist to generate and visualize all possible derived information from aset of measurements with one single easy to use R function. Additionally, the sensitivity of thesystem to variations in the input variables can be visualized. The corresponding publication inAquatic Geochemistry can be found athttp://www.springerlink.com/content/l4747417w0k50463/
License GPL (>= 2)
LazyData yes
Repository CRAN
Date/Publication 2010-04-09 17:50:57
R topics documented:aquaenv . . . . . . . . . . . . . . . . . . . . . . . . . . . . . . . . . . . . . . . . . . . 2AquaEnv_package . . . . . . . . . . . . . . . . . . . . . . . . . . . . . . . . . . . . . 8as.data.frame.aquaenv . . . . . . . . . . . . . . . . . . . . . . . . . . . . . . . . . . . . 9
1
2 aquaenv
c.aquaenv . . . . . . . . . . . . . . . . . . . . . . . . . . . . . . . . . . . . . . . . . . 10ConcRelCl . . . . . . . . . . . . . . . . . . . . . . . . . . . . . . . . . . . . . . . . . . 10convert . . . . . . . . . . . . . . . . . . . . . . . . . . . . . . . . . . . . . . . . . . . . 11DeltaPcoeffs . . . . . . . . . . . . . . . . . . . . . . . . . . . . . . . . . . . . . . . . . 13gauge_p . . . . . . . . . . . . . . . . . . . . . . . . . . . . . . . . . . . . . . . . . . . 13K0_CO2 . . . . . . . . . . . . . . . . . . . . . . . . . . . . . . . . . . . . . . . . . . . 14K0_O2 . . . . . . . . . . . . . . . . . . . . . . . . . . . . . . . . . . . . . . . . . . . . 14Ksp_aragonite . . . . . . . . . . . . . . . . . . . . . . . . . . . . . . . . . . . . . . . . 15Ksp_calcite . . . . . . . . . . . . . . . . . . . . . . . . . . . . . . . . . . . . . . . . . 16K_BOH3 . . . . . . . . . . . . . . . . . . . . . . . . . . . . . . . . . . . . . . . . . . 17K_CO2 . . . . . . . . . . . . . . . . . . . . . . . . . . . . . . . . . . . . . . . . . . . 18K_H2PO4 . . . . . . . . . . . . . . . . . . . . . . . . . . . . . . . . . . . . . . . . . . 19K_H2S . . . . . . . . . . . . . . . . . . . . . . . . . . . . . . . . . . . . . . . . . . . 20K_H3PO4 . . . . . . . . . . . . . . . . . . . . . . . . . . . . . . . . . . . . . . . . . . 21K_HCO3 . . . . . . . . . . . . . . . . . . . . . . . . . . . . . . . . . . . . . . . . . . 22K_HF . . . . . . . . . . . . . . . . . . . . . . . . . . . . . . . . . . . . . . . . . . . . 23K_HPO4 . . . . . . . . . . . . . . . . . . . . . . . . . . . . . . . . . . . . . . . . . . 24K_HSO4 . . . . . . . . . . . . . . . . . . . . . . . . . . . . . . . . . . . . . . . . . . 25K_NH4 . . . . . . . . . . . . . . . . . . . . . . . . . . . . . . . . . . . . . . . . . . . 26K_SiOH4 . . . . . . . . . . . . . . . . . . . . . . . . . . . . . . . . . . . . . . . . . . 27K_SiOOH3 . . . . . . . . . . . . . . . . . . . . . . . . . . . . . . . . . . . . . . . . . 28K_W . . . . . . . . . . . . . . . . . . . . . . . . . . . . . . . . . . . . . . . . . . . . . 29length.aquaenv . . . . . . . . . . . . . . . . . . . . . . . . . . . . . . . . . . . . . . . 30MeanMolecularMass . . . . . . . . . . . . . . . . . . . . . . . . . . . . . . . . . . . . 30merge.aquaenv . . . . . . . . . . . . . . . . . . . . . . . . . . . . . . . . . . . . . . . 31PhysChemConst . . . . . . . . . . . . . . . . . . . . . . . . . . . . . . . . . . . . . . . 31plot.aquaenv . . . . . . . . . . . . . . . . . . . . . . . . . . . . . . . . . . . . . . . . . 32sample_dickson1981 . . . . . . . . . . . . . . . . . . . . . . . . . . . . . . . . . . . . 37sample_dickson2007 . . . . . . . . . . . . . . . . . . . . . . . . . . . . . . . . . . . . 38TAfit . . . . . . . . . . . . . . . . . . . . . . . . . . . . . . . . . . . . . . . . . . . . . 38Technicals . . . . . . . . . . . . . . . . . . . . . . . . . . . . . . . . . . . . . . . . . . 45titration . . . . . . . . . . . . . . . . . . . . . . . . . . . . . . . . . . . . . . . . . . . 46watdepth . . . . . . . . . . . . . . . . . . . . . . . . . . . . . . . . . . . . . . . . . . . 48
Index 50
aquaenv aquaenv
Description
PUBLIC function: the main function of the package AquaEnv: creates an object of class aquaenv
aquaenv 3
Usage
aquaenv(S, t, p=pmax((P-Pa), gauge_p(d, lat, Pa)),P=Pa, Pa=1.01325, d=0, lat=0,SumCO2=0, SumNH4=0, SumH2S=0, SumH3PO4=0,SumSiOH4=0, SumHNO3=0, SumHNO2=0, SumBOH3=NULL,SumH2SO4=NULL,SumHF=NULL, TA=NULL, pH=NULL, fCO2=NULL, CO2=NULL,speciation=TRUE, dsa=FALSE, ae=NULL, from.data.frame=FALSE,SumH2SO4_Koffset=0,SumHF_Koffset=0, revelle=FALSE, skeleton=FALSE,k_w=NULL, k_co2=NULL, k_hco3=NULL, k_boh3=NULL, k_hso4=NULL,k_hf=NULL, k1k2="roy", khf="dickson", khso4="dickson", fCO2atm=0.000390, fO2atm=0.20946)
Arguments
S salinity in practical salinity units (i.e. no unit)
t temperature in degrees centigrade
p gauge pressure (total pressure minus atmospheric pressure) in bars, standard iscalculated either from the given P, or the given d, lat, and Pa
P total pressure in bars, standard: Pa (at the surface)
Pa atmospheric pressure in bars, standard: 1 atm (at sea-level)
d depth below the surface in meters, standard: 0 (at the surface)
lat latitude in degrees (-90 to +90) to calculate the gravitational constant g for cal-culating the water depth from the pressure and vice versa, standard: 0
SumCO2 total carbonate concentration in mol/kg-solution, if NULL is supplied it is cal-culated
SumNH4 total ammonium concentration in mol/kg-solution, optional
SumH2S total sulfide concentration in mol/kg-solution, optional
SumH3PO4 total phosphate concentration in mol/kg-solution, optional
SumSiOH4 total silicate concentration in mol/kg-solution, optional
SumHNO3 total nitrate concentration in mol/kg-solution, optional
SumHNO2 total nitrite concentration in mol/kg-solution, optional
SumBOH3 total borate concentration in mol/kg-solution, calculated from S if not supplied
SumH2SO4 total sulfate concentration in mol/kg-solution, calculated from S if not supplied
SumHF total fluoride concentration in mol/kg-solution, calculated from S if not supplied
TA total alkalinity in mol/kg-solution, if supplied, pH will be calculated
pH pH on the free proton concentration scale, if supplied, total alkalinity will becalculated
fCO2 fugacity of CO2 in the water in atm (i.e. the fugacity of CO2 in a small volumeof air fully equilibrated with a sufficiently large sample of water), can be usedwith either [TA], pH, or [CO2] to define the system
CO2 concentration of CO2, can be used with either [TA], pH, or fCO2 to define thesystem
speciation flag: TRUE = full speciation is calculated
4 aquaenv
dsa flag: TRUE = all information necessary to build a pH model with the directsubstitution approach (DSA, Hofmann2008) is calculated
ae either an object of class aquaenv used for the cloning functionality or a dataframeused for the from.data.frame functionality. Note that for cloning the desiredk1k2 and khf values need to be specified! (otherwise the default values are usedfor the cloned object)
from.data.frameflag: TRUE = the object of class aquaenv is built from the data frame suppliedin ae
SumH2SO4_Koffsetonly used internally to calculate dTAdKdKdSumH2SO4
SumHF_Koffsetonly used internally to calculate dTAdKdKdSumHF
revelle flag: TRUE = the revelle factor is calculated
skeleton flag: TRUE = a reduced amount of information is calculated yielding a smallerobject of type aquaenv
k_w a fixed K\_W can be specified
k_co2 a fixed K\_CO2 can be specified; used for TA fitting: give a K\_CO2 and NOTcalculate it from T and S: i.e. K\_CO2 can be fitted in the routine as well
k_hco3 a fixed K\_HCO3 can be specified
k_boh3 a fixed K\_BOH3 can be specified
k_hso4 a fixed K\_HSO4 can be specified
k_hf a fixed K\_HF can be specified
k1k2 either "roy" (default, Roy1993a), "lueker" (Lueker2000), or "millero" (Millero2006)for K\_CO2 and K\_HCO3.
khf either "dickson" (default, Dickson1979a) or "perez" (Perez1987a) for K\_HF
khso4 either "dickson" (default, Dickson1990) or "khoo" (Khoo1977) for K\_HSO4
fCO2atm atmospheric fugacity of CO2 in atm, default = 0.000390 atm
fO2atm atmospheric fugacity of O2 in atm, default = 0.20946 atm
Value
a list containing: "S" "t" "p" "T" "Cl" "I" "P" "Pa" "d" "density" "SumCO2" "SumNH4" "SumH2S""SumHNO3" "SumHNO2" "SumH3PO4" "SumSiOH4" "SumBOH3" "SumH2SO4" "SumHF" "Br""ClConc" "Na" "Mg" "Ca" "K" "Sr" "molal2molin" "free2tot" "free2sws" "tot2free" "tot2sws""sws2free" "sws2tot" "K0\_CO2" "K0\_O2" "fCO2atm" "fO2atm" "CO2\_sat" "O2\_sat" "K\_W""K\_HSO4" "K\_HF" "K\_CO2" "K\_HCO3" "K\_BOH3" "K\_NH4" "K\_H2S" "K\_H3PO4" "K\_H2PO4""K\_HPO4" "K\_SiOH4" "K\_SiOOH3" "K\_HNO2" "K\_HNO3" "K\_H2SO4" "K\_HS" "Ksp\_calcite""Ksp\_aragonite" "TA" "pH" "fCO2" "CO2" "HCO3" "CO3" "BOH3" "BOH4" "OH" "H3PO4""H2PO4" "HPO4" "PO4" "SiOH4" "SiOOH3" "SiO2OH2" "H2S" "HS" "S2min" "NH4" "NH3""H2SO4" "HSO4" "SO4" "HF" "F" "HNO3" "NO3" "HNO2" "NO2" "omega\_calcite" "omega\_aragonite""revelle" "c1" "c2" "c3" "dTAdSumCO2" "b1" "b2" "dTAdSumBOH3" "so1" "so2" "so3" "dTAdSumH2SO4""f1" "f2" "dTAdSumHF" "dTAdH" "dTAdKdKdS" "dTAdKdKdT" "dTAdKdKdd" "dTAdKdKd-SumH2SO4" "dTAdKdKdSumHF" or a subset of this set. Please consult the vignette of AquaEnvfor more details
aquaenv 5
Author(s)
Andreas F. Hofmann ([email protected])
Examples
## Not run:############################# Minimal aquaenv definition############################ae <- aquaenv(S=30, t=15)ae$K_CO2
ae$Ksp_calciteae$Ksp_aragonite
ae <- aquaenv(S=30, t=15, p=10)ae <- aquaenv(S=30, t=15, P=11)ae <- aquaenv(S=30, t=15, d=100)ae <- aquaenv(S=30, t=15, d=100, Pa=0.5)ae$K_CO2
ae$Ksp_calciteae$Ksp_aragonite
ae
######################################################### Defining the complete aquaenv system in different ways########################################################S <- 30t <- 15p <- gauge_p(d=10) # ~ p <- 0.1*10*1.01325SumCO2 <- 0.0020pH <- 8TA <- 0.002140798fCO2 <- 0.0005326744CO2 <- 2.051946e-05
ae <- aquaenv(S, t, p, SumCO2=SumCO2, pH=pH)ae$TA
ae <- aquaenv(S, t, p, SumCO2=SumCO2, TA=TA)ae$pH
ae <- aquaenv(S, t, p, SumCO2=SumCO2, CO2=CO2)ae$pH
ae <- aquaenv(S, t, p, SumCO2=SumCO2, fCO2=fCO2)ae$pH
ae <- aquaenv(S, t, p, SumCO2=SumCO2, CO2=CO2, fCO2=fCO2)
6 aquaenv
ae <- aquaenv(S, t, p, SumCO2=SumCO2, pH=pH, TA=TA)ae <- aquaenv(S, t, p, SumCO2=SumCO2, pH=pH, CO2=CO2)ae <- aquaenv(S, t, p, SumCO2=SumCO2, pH=pH, fCO2=fCO2)ae <- aquaenv(S, t, p, SumCO2=SumCO2, TA=TA, CO2=CO2)ae <- aquaenv(S, t, p, SumCO2=SumCO2, TA=TA, fCO2=fCO2)
################################################################# Cloning the aquaenv system: 1 to 1 and with different pH or TA################################################################S <- 30t <- 15SumCO2 <- 0.0020TA <- 0.00214
ae <- aquaenv(S, t, SumCO2=SumCO2, TA=TA)
aeclone1 <- aquaenv(ae=ae)
pH <- 9
aeclone2 <- aquaenv(ae=ae, pH=pH)
TA <- 0.002
aeclone3 <- aquaenv(ae=ae, TA=TA)
ae$pHaeclone1$pHaeclone2$TAaeclone3$pH
########################################################################## Vectors as input variables (only ONE input variable may be a vector)# (with full output: including the Revelle factor and the DSA properties)#########################################################################SumCO2 <- 0.0020pH <- 8
S <- 30t <- 1:15p <- gauge_p(10)ae <- aquaenv(S, t, p, SumCO2=SumCO2, pH=pH, revelle=TRUE, dsa=TRUE)plot(ae, xval=t, xlab="T/(deg C)", newdevice=FALSE)
S <- 1:30t <- 15ae <- aquaenv(S, t, p, SumCO2=SumCO2, pH=pH, revelle=TRUE, dsa=TRUE)plot(ae, xval=S, xlab="S", newdevice=FALSE)
aquaenv 7
S <- 30p <- gauge_p(seq(1,1000, 100))ae <- aquaenv(S, t, p, SumCO2=SumCO2, pH=pH, revelle=TRUE, dsa=TRUE)plot(ae, xval=p, xlab="gauge pressure/bar", newdevice=FALSE)
TA <- 0.0023
S <- 30t <- 1:15d <- gauge_p(10)ae <- aquaenv(S, t, p, SumCO2=SumCO2, TA=TA, revelle=TRUE, dsa=TRUE)plot(ae, xval=t, xlab="T/(deg C)", newdevice=FALSE)
S <- 1:30t <- 15ae <- aquaenv(S, t, p, SumCO2=SumCO2, TA=TA, revelle=TRUE, dsa=TRUE)plot(ae, xval=S, xlab="S", newdevice=FALSE)
S <- 30p <- gauge_p(seq(1,1000, 100))ae <- aquaenv(S, t, p, SumCO2=SumCO2, TA=TA, revelle=TRUE, dsa=TRUE)plot(ae, xval=p, xlab="gauge pressure/bar", newdevice=FALSE)
################################################################### Calculating SumCO2 by giving a constant pH&CO2, pH&fCO2, pH&TA,# TA&CO2, or TA&fCO2##################################################################fCO2 <- 0.0006952296CO2 <- 2.678137e-05pH <- 7.888573TA <- 0.0021
S <- 30t <- 15p <- gauge_p(10)
ae <- aquaenv(S, t, p, SumCO2=NULL, pH=pH, CO2=CO2, dsa=TRUE, revelle=TRUE)ae$SumCO2ae$revelleae$dTAdH
ae <- aquaenv(S, t, p, SumCO2=NULL, pH=pH, fCO2=fCO2)ae$SumCO2
ae <- aquaenv(S, t, p, SumCO2=NULL, pH=pH, TA=TA)ae$SumCO2
ae <- aquaenv(S, t, p, SumCO2=NULL, TA=TA, CO2=CO2)ae$SumCO2
8 AquaEnv_package
ae <- aquaenv(S, t, p, SumCO2=NULL, TA=TA, fCO2=fCO2)ae$SumCO2
t <- 1:15ae <- aquaenv(S, t, p, SumCO2=NULL, pH=pH, CO2=CO2)plot(ae, xval=t, xlab="T/(deg C)", mfrow=c(9,10), newdevice=FALSE)
ae <- aquaenv(S, t, p, SumCO2=NULL, pH=pH, CO2=CO2, revelle=TRUE, dsa=TRUE)plot(ae, xval=t, xlab="T/(deg C)", newdevice=FALSE)
S <- 1:30t <- 15ae <- aquaenv(S, t, p, SumCO2=NULL, pH=pH, fCO2=fCO2, revelle=TRUE, dsa=TRUE)plot(ae, xval=S, xlab="S", newdevice=FALSE)
S <- 30p <- gauge_p(seq(1,1000, 100))ae <- aquaenv(S, t, p, SumCO2=NULL, pH=pH, TA=TA, revelle=TRUE, dsa=TRUE)plot(ae, xval=p, xlab="gauge pressure/bar", newdevice=FALSE)
## End(Not run)
AquaEnv_package AquaEnv - an integrated development toolbox for aquatic chemicalmodel generation
Description
AquaEnv is an integrated development toolbox for aquatic chemical model generation focused on(ocean) acidification and CO2 air-water exchange.
It contains all elements necessary to model the pH, the related CO2 air-water exchange, as well asaquatic acid-base chemistry in general for an arbitrary marine, estuarine or freshwater system. Alsochemical batches can be modelled.
Next to the routines necessary to calculate desired information, AquaEnv also contains a suite oftools to visualize this information. Furthermore, AquaEnv can not only be used to build dynamicmodels of aquatic systems, but it can also serve as a simple desktop tool for the experimental aquaticchemist to generate and visualize all possible derived information from a set of measurements withone single easy to use R function.
Additionally, the sensitivity of the system to variations in the input variables can be visualized.
Details
Package: AquaEnvType: PackageVersion: 0.7
as.data.frame.aquaenv 9
Date: 2009-01-21License: GNU Public License 2 or above
Author(s)
Andreas Hofmann (Maintainer)
Examples
## Not run:## show examples (see respective help pages for details)example(aquaenv)
## open the directory with source code of demosbrowseURL(paste(system.file(package="AquaEnv"), "/demo", sep=""))
## run demosdemo(basicfeatures )
## show package vignette with tutorial about how to use aquaenvvignette("AquaEnv")edit(vignette("AquaEnv"))browseURL(paste(system.file(package="AquaEnv"), "/doc", sep=""))
## show index file of package vignettes and documentation filesbrowseURL(paste(system.file(package="AquaEnv"), "/doc/index.html", sep=""))
## show documentation about private functions in the packetbrowseURL(paste(system.file(package="AquaEnv"), "/doc/AquaEnv-PrivateFunctions.pdf", sep=""))
## show documentation about physical-chemical constants and formulae used in the packetbrowseURL(paste(system.file(package="AquaEnv"), "/doc/AquaEnv-ConstantsAndFormulae.pdf", sep=""))
## End(Not run)
as.data.frame.aquaenvas.data.frame.aquaenv
Description
PUBLIC function: converts an object of class aquaenv to a standard R data frame
Usage
as.data.frame.aquaenv(x, ...)
10 c.aquaenv
Arguments
x object of type aquaenv
... further arguments are passed on
Value
data frame containing all elements of aquaenv
Author(s)
Andreas F. Hofmann ([email protected])
c.aquaenv c.aquaenv
Description
PRIVATE function: adds an element to an object of class aquaenv
Usage
c.aquaenv(aquaenv, x, ...)
Arguments
aquaenv object of class aquaenv
x a vector of the form c(value, name) representing the element to be inserted intothe object of class aquaenv
... further arguments will be passed
Value
object of class aquaenv with the added element
Author(s)
Andreas F. Hofmann ([email protected])
ConcRelCl 11
ConcRelCl ConcRelCl
Description
PUBLIC data frame: a collection of concentrations of key chemical species in seawater, relativewith respect to chlorinity (DOE1994))
Author(s)
Andreas F. Hofmann ([email protected])
convert convert
Description
PUBLIC function: converts either a single value (the pH scale of a pH value, the pH scale of adissociation constant (K*), the unit of a concentration value), or all elements of a special unit or pHscale in an object of class aquaenv
Arguments
x object to be converted: either a single value (pH value, K* value, or concentra-tion value) or an object of class aquaenv
vartype only valid if x is a single value: the type of x, either "pHscale", "KHscale", or"conc"
what only valid if x is a single value: only valid if x is a single value: the type ofconversion to be done, for pH scales one of "free2tot", "free2sws", "free2nbs",... (any combination of "free", "tot", "sws", and "nbs"); for concentrations one of"molar2molal", "molar2molin", ... (any combination of "molar" (mol/l), "molal"(mol/kg-H2O), and "molin" (mol/kg-solution))
S only valid if x is a single value: salinity (in practical salinity units: no unit)
t only valid if x is a single value: temperature in degrees centigrade
p only valid if x is a single value: gauge pressure (total pressure minus atmo-spheric pressure) in bars
SumH2SO4 only valid if x is a single value: total sulfate concentration in mol/kg-solution; ifnot supplied this is calculated from S
SumHF only valid if x is a single value: total fluoride concentration in mol/kg-solution;if not supplied this is calculated from S
khf only valid if x is a single value: either "dickson" (default, Dickson1979a) or"perez" (Perez1987a) for K\_HF
12 convert
khso4 only valid if x is a single value: either "dickson" (default, Dickson1990) or"khoo" (Khoo1977) for K\_HSO4
from only valid if x is an object of class aquaenv: the unit which needs to be converted(as a string; must be a perfect match)
to only valid if x is an object of class aquaenv: the unit to which the conversionshould go
factor only valid if x is an object of class aquaenv: the conversion factor to be applied:can either be a number (e.g. 1000 to convert from mol to mmol), or any of theconversion factors given in an object of class aquaenv
convattr only valid if x is an object of class aquaenv: which attribute should be converted?can either be "unit" or "pH scale"
Details
Possible usages are
convert(x, vartype, what, S, t, p, SumH2SO4, SumHF, khf)convert(x, from, to, factor, convattr)
Value
converted single value or object of class aquaenv with converted elements
Author(s)
Andreas F. Hofmann ([email protected])
Examples
## Not run:### 1#####
t <- 15S <- 10
pH_NBS <- 8.142777SumCO2molar <- 0.002016803
pH_free <- convert(pH_NBS, "pHscale", "nbs2free", S=S, t=t)SumCO2molin <- convert(SumCO2molar, "conc", "molar2molin", S=S, t=t)
ae <- aquaenv(S, t, SumCO2=SumCO2molin, pH=pH_free)ae$pHae$SumCO2
### 2#####
DeltaPcoeffs 13
ae <- aquaenv(30,10)ae$SumBOH3ae <- convert(ae, "mol/kg-soln", "umol/kg-H2O", 1e6/ae$molal2molin, "unit")ae$SumBOH3
## End(Not run)
DeltaPcoeffs DeltaPcoeffs
Description
PUBLIC data frame: a collection of coefficients for the pressure correction of dissociation constantsand solubility products (Millero1995 WITH CORRECTIONS BY Lewis1998 (CO2Sys)!)
Author(s)
Andreas F. Hofmann ([email protected])
gauge_p gauge_p
Description
PUBLIC function: calculates the gauge pressure (total pressure minus atmospheric pressure) fromthe depth (in m) and the latitude (in degrees: -90 to 90) and the atmospheric pressure (in bar)
Usage
gauge_p(d, lat=0, Pa=1.01325)
Arguments
d water depth in meters
lat latitude in degrees: -90 to 90, standard: 0
Pa atmospheric pressure in bar, standard: 1 atm (at sea level)
Value
gauge pressure (total pressure minus atmospheric pressure) p in bars
Author(s)
Andreas F. Hofmann ([email protected])
14 K0_CO2
References
Fofonoff1983
Examples
gauge_p(100)plot(gauge_p(1:100))
K0_CO2 K0_CO2
Description
PUBLIC function: calculates the Henry’s constant (solubility) for CO2
Usage
K0_CO2(S, t)
Arguments
S salinity in practical salinity units (i.e. no unit)
t temperature in degrees centigrade
Value
the Henry’s constant for CO2 in mol/(kg-solution*atm)
Author(s)
Andreas F. Hofmann ([email protected])
References
Weiss1974, DOE1994, Millero1995, Zeebe2001
Examples
K0_CO2(35, 15)plot(K0_CO2(35, 1:25), xlab="temperature / degC")
K0_O2 15
K0_O2 K0_O2
Description
PUBLIC function: calculates the Henry’s constant (solubility) for O2
Usage
K0_O2(S, t)
Arguments
S salinity in practical salinity units (i.e. no unit)
t temperature in degrees centigrade
Value
the Henry’s constant for CO2 in mol/(kg-solution*atm)
Author(s)
Andreas F. Hofmann ([email protected])
References
derived from a formulation for [O2]sat given in Weiss1970
Examples
K0_O2(35, 15)plot(K0_O2(35, 1:25), xlab="temperature / degC")
Ksp_aragonite Ksp_aragonite
Description
PUBLIC function: calculates the solubility product for aragonite
Usage
Ksp_aragonite(S, t, p=0)
16 Ksp_calcite
Arguments
S salinity in practical salinity units (i.e. no unit)
t temperature in degrees centigrade
p gauge pressure (total pressure minus atmospheric pressure) in bars
Value
the solubility product for aragonite in (mol/kg-solution)2
Author(s)
Andreas F. Hofmann ([email protected])
References
Mucci1983, Boudreau1996
Examples
Ksp_aragonite(35, 15)Ksp_aragonite(35, 15, 10)plot(Ksp_aragonite(35, 1:25), xlab="temperature / degC")
Ksp_calcite Ksp_calcite
Description
PUBLIC function: calculates the solubility product for aragonite
Usage
Ksp_calcite(S, t, p=0)
Arguments
S salinity in practical salinity units (i.e. no unit)
t temperature in degrees centigrade
p gauge pressure (total pressure minus atmospheric pressure) in bars
Value
the solubility product for calcite in (mol/kg-solution)2
Author(s)
Andreas F. Hofmann ([email protected])
K_BOH3 17
References
Mucci1983, Boudreau1996
Examples
Ksp_calcite(35, 15)Ksp_calcite(35, 15, 10)plot(Ksp_aragonite(35, 1:25), xlab="temperature / degC")
K_BOH3 K_BOH3
Description
PUBLIC function: calculates the dissociation constant of B(OH)3
Usage
K_BOH3(S, t, p=0, SumH2SO4=NULL, SumHF=NULL, khf="dickson", khso4="dickson")
Arguments
S salinity in practical salinity units (i.e. no unit)
t temperature in degrees centigrade
p gauge pressure (total pressure minus atmospheric pressure) in bars
SumH2SO4 total sulfate concentration in mol/kg-solution (calculated from S if not supplied)
SumHF total fluoride concentration in mol/kg-solution (calculated from S if not sup-plied)
khf S, t relation for K\_HF needed for scale conversion: either "dickson" (default,Dickson1979a) or "perez" (Perez1987a)
khso4 S, t relation for K\_HSO4 needed for scale conversion: either "dickson" (default,Dickson1990) or "khoo" (Khoo1977)
Value
the dissociation constant of B(OH)3 in mol/kg-solution on the free proton pH scale
Author(s)
Andreas F. Hofmann ([email protected])
References
Dickson1990, DOE1994, Millero1995 (molality version given), Zeebe2001
18 K_CO2
Examples
K_BOH3(35, 15)K_BOH3(35, 15, 10)K_BOH3(S=35, t=15, p=10, SumH2SO4=0.03)plot(K_BOH3(35, 1:25), xlab="temperature / degC")
K_CO2 K_CO2
Description
PUBLIC function: calculates the dissociation constant of CO2
Usage
K_CO2(S, t, p=0, SumH2SO4=NULL, SumHF=NULL, k1k2="roy", khf="dickson", khso4="dickson")
Arguments
S salinity in practical salinity units (i.e. no unit)
t temperature in degrees centigrade
p gauge pressure (total pressure minus atmospheric pressure) in bars
SumH2SO4 total sulfate concentration in mol/kg-solution (calculated from S if not supplied)
SumHF total fluoride concentration in mol/kg-solution (calculated from S if not sup-plied)
k1k2 "roy", "lueker", or "millero": specifies the S, t, dependency to be used. Defaultis "roy". (see section below for references)
khf S, t relation for K\_HF needed for scale conversion: either "dickson" (default,Dickson1979a) or "perez" (Perez1987a)
khso4 S, t relation for K\_HSO4 needed for scale conversion: either "dickson" (default,Dickson1990) or "khoo" (Khoo1977)
Value
the dissociation constant of CO2 in mol/kg-solution on the free proton pH scale
Author(s)
Andreas F. Hofmann ([email protected])
References
k1k2 = "roy": Roy1993b, DOE1994, Millero1995, Zeebe2001; k1k2 = "lueker": Lueker2000; k1k2= "millero": Millero2006
K_H2PO4 19
Examples
K_CO2(35, 15)K_CO2(35, 15, 10)K_CO2(S=35, t=15, p=10, SumH2SO4=0.03)plot(K_CO2(35, 1:25), xlab="temperature / degC")
K_H2PO4 K_H2PO4
Description
PUBLIC function: calculates the dissociation constant of H2PO4
Usage
K_H2PO4(S, t, p=0, SumH2SO4=NULL, SumHF=NULL, khf="dickson", khso4="dickson")
Arguments
S salinity in practical salinity units (i.e. no unit)t temperature in degrees centigradep gauge pressure (total pressure minus atmospheric pressure) in barsSumH2SO4 total sulfate concentration in mol/kg-solution (calculated from S if not supplied)SumHF total fluoride concentration in mol/kg-solution (calculated from S if not sup-
plied)khf S, t relation for K\_HF needed for scale conversion: either "dickson" (default,
Dickson1979a) or "perez" (Perez1987a)khso4 S, t relation for K\_HSO4 needed for scale conversion: either "dickson" (default,
Dickson1990) or "khoo" (Khoo1977)
Value
the dissociation constant of H2PO4 in mol/kg-solution on the free proton pH scale
Author(s)
Andreas F. Hofmann ([email protected])
References
Millero1995 (original, SWS pH version), DOE1994 (in a later revision cites Millero1995)
Examples
K_H2PO4(35, 15)K_H2PO4(35, 15, 10)K_H2PO4(S=35, t=15, p=10, SumH2SO4=0.03)plot(K_H2PO4(35, 1:25), xlab="temperature / degC")

20 K_H2S
K_H2S K_H2S
Description
PUBLIC function: calculates the dissociation constant of H2S
Usage
K_H2S(S, t, p=0, SumH2SO4=NULL, SumHF=NULL, khf="dickson", khso4="dickson")
Arguments
S salinity in practical salinity units (i.e. no unit)
t temperature in degrees centigrade
p gauge pressure (total pressure minus atmospheric pressure) in bars
SumH2SO4 total sulfate concentration in mol/kg-solution (calculated from S if not supplied)
SumHF total fluoride concentration in mol/kg-solution (calculated from S if not sup-plied)
khf S, t relation for K\_HF needed for scale conversion: either "dickson" (default,Dickson1979a) or "perez" (Perez1987a)
khso4 S, t relation for K\_HSO4 needed for scale conversion: either "dickson" (default,Dickson1990) or "khoo" (Khoo1977)
Value
the dissociation constant of H2S in mol/kg-solution on the free proton pH scale
Author(s)
Andreas F. Hofmann ([email protected])
References
Millero1988, Millero1995
Examples
K_H2S(35, 15)K_H2S(35, 15, 10)K_H2S(S=35, t=15, p=10, SumH2SO4=0.03)plot(K_H2S(35, 1:25), xlab="temperature / degC")

K_H3PO4 21
K_H3PO4 K_H3PO4
Description
PUBLIC function: calculates the dissociation constant of H3PO4
Usage
K_H3PO4(S, t, p=0, SumH2SO4=NULL, SumHF=NULL, khf="dickson", khso4="dickson")
Arguments
S salinity in practical salinity units (i.e. no unit)
t temperature in degrees centigrade
p gauge pressure (total pressure minus atmospheric pressure) in bars
SumH2SO4 total sulfate concentration in mol/kg-solution (calculated from S if not supplied)
SumHF total fluoride concentration in mol/kg-solution (calculated from S if not sup-plied)
khf S, t relation for K\_HF needed for scale conversion: either "dickson" (default,Dickson1979a) or "perez" (Perez1987a)
khso4 S, t relation for K\_HSO4 needed for scale conversion: either "dickson" (default,Dickson1990) or "khoo" (Khoo1977)
Value
the dissociation constant of H3PO4 in mol/kg-solution on the free proton pH scale
Author(s)
Andreas F. Hofmann ([email protected])
References
Millero1995 (original, SWS pH version), DOE1994 (in a later revision cites Millero1995)
Examples
K_H3PO4(35, 15)K_H3PO4(35, 15, 10)K_H3PO4(S=35, t=15, p=10, SumH2SO4=0.03)plot(K_H3PO4(35, 1:25), xlab="temperature / degC")
22 K_HCO3
K_HCO3 K_HCO3
Description
PUBLIC function: calculates the dissociation constant of HCO3
Usage
K_HCO3(S, t, p=0, SumH2SO4=NULL, SumHF=NULL, k1k2="roy", khf="dickson", khso4="dickson")
Arguments
S salinity in practical salinity units (i.e. no unit)
t temperature in degrees centigrade
p gauge pressure (total pressure minus atmospheric pressure) in bars
SumH2SO4 total sulfate concentration in mol/kg-solution (calculated from S if not supplied)
SumHF total fluoride concentration in mol/kg-solution (calculated from S if not sup-plied)
k1k2 "roy", "lueker", or "millero": specifies the S, t, dependency to be used. Defaultis "roy". (see section below for references)
khf S, t relation for K\_HF needed for scale conversion: either "dickson" (default,Dickson1979a) or "perez" (Perez1987a)
khso4 S, t relation for K\_HSO4 needed for scale conversion: either "dickson" (default,Dickson1990) or "khoo" (Khoo1977)
Value
the dissociation constant of HCO3 in mol/kg-solution on the free proton pH scale
Author(s)
Andreas F. Hofmann ([email protected])
References
k1k2 = "roy": Roy1993b, DOE1994, Millero1995, Zeebe2001; k1k2 = "lueker": Lueker2000; k1k2= "millero": Millero2006
Examples
K_HCO3(35, 15)K_HCO3(35, 15, 10)K_HCO3(S=35, t=15, p=10, SumH2SO4=0.03)plot(K_HCO3(35, 1:25), xlab="temperature / degC")

K_HF 23
K_HF K_HF
Description
PUBLIC function: calculates the dissociation constant of HF
Usage
K_HF(S, t, p=0, SumH2SO4=NULL, SumHF=NULL, khf="dickson", khso4="dickson")
Arguments
S salinity in practical salinity units (i.e. no unit)
t temperature in degrees centigrade
p gauge pressure (total pressure minus atmospheric pressure) in bars
SumH2SO4 total sulfate concentration in mol/kg-solution (calculated from S if not supplied)
SumHF total fluoride concentration in mol/kg-solution (calculated from S if not sup-plied)
khf "dickson" or "perez": specifies the S, t, dependency to be used. Default is "dick-son". (see section below for references)
khso4 S, t relation for K\_HSO4 needed for scale conversion: either "dickson" (default,Dickson1990) or "khoo" (Khoo1977)
Value
the dissociation constant of HF in mol/kg-solution on the free proton pH scale
Author(s)
Andreas F. Hofmann ([email protected])
References
khf = "dickson": Dickson1979a, Dickson1987, Roy1993b, DOE1994, Millero1995, Zeebe2001;khf = "perez": Perez1987
Examples
K_HF(35, 15)K_HF(35, 15, 10)plot(K_HF(35, 1:25), xlab="temperature / degC")

24 K_HPO4
K_HPO4 K_HPO4
Description
PUBLIC function: calculates the dissociation constant of HPO4
Usage
K_HPO4(S, t, p=0, SumH2SO4=NULL, SumHF=NULL, khf="dickson", khso4="dickson")
Arguments
S salinity in practical salinity units (i.e. no unit)
t temperature in degrees centigrade
p gauge pressure (total pressure minus atmospheric pressure) in bars
SumH2SO4 total sulfate concentration in mol/kg-solution (calculated from S if not supplied)
SumHF total fluoride concentration in mol/kg-solution (calculated from S if not sup-plied)
khf S, t relation for K\_HF needed for scale conversion: either "dickson" (default,Dickson1979a) or "perez" (Perez1987a)
khso4 S, t relation for K\_HSO4 needed for scale conversion: either "dickson" (default,Dickson1990) or "khoo" (Khoo1977)
Value
the dissociation constant of HPO4 in mol/kg-solution on the free proton pH scale
Author(s)
Andreas F. Hofmann ([email protected])
References
Millero1995 (original, SWS pH version), DOE1994 (in a later revision cites Millero1995)
Examples
K_HPO4(35, 15)K_HPO4(35, 15, 10)K_HPO4(S=35, t=15, p=10, SumH2SO4=0.03)plot(K_HPO4(35, 1:25), xlab="temperature / degC")
K_HSO4 25
K_HSO4 K_HSO4
Description
PUBLIC function: calculates the dissociation constant of HSO4
Usage
K_HSO4(S, t, p=0, khso4="dickson")
Arguments
S salinity in practical salinity units (i.e. no unit)
t temperature in degrees centigrade
p gauge pressure (total pressure minus atmospheric pressure) in bars
khso4 "dickson" or "khoo": specifies the S, t, dependency to be used. Default is "dick-son". (see section below for references)
Value
the dissociation constant of HSO4 in mol/kg-solution on the free proton pH scale
Author(s)
Andreas F. Hofmann ([email protected])
References
"dickson": Dickson1990, DOE1994, Zeebe2001; "khoo": Khoo1977, Roy1993, Millero1995
Examples
K_HSO4(35, 15)K_HSO4(35, 15, 10)plot(K_HSO4(35, 1:25), xlab="temperature / degC")
26 K_NH4
K_NH4 K_NH4
Description
PUBLIC function: calculates the dissociation constant of NH4
Usage
K_NH4(S, t, p=0, SumH2SO4=NULL, SumHF=NULL, khf="dickson", khso4="dickson")
Arguments
S salinity in practical salinity units (i.e. no unit)
t temperature in degrees centigrade
p gauge pressure (total pressure minus atmospheric pressure) in bars
SumH2SO4 total sulfate concentration in mol/kg-solution (calculated from S if not supplied)
SumHF total fluoride concentration in mol/kg-solution (calculated from S if not sup-plied)
khf S, t relation for K\_HF needed for scale conversion: either "dickson" (default,Dickson1979a) or "perez" (Perez1987a)
khso4 S, t relation for K\_HSO4 needed for scale conversion: either "dickson" (default,Dickson1990) or "khoo" (Khoo1977)
Value
the dissociation constant of NH4 in mol/kg-solution on the free proton pH scale
Author(s)
Andreas F. Hofmann ([email protected])
References
Millero1995a, Millero1995, corrected by Lewis1998
Examples
K_NH4(35, 15)K_NH4(35, 15, 10)K_NH4(S=35, t=15, p=10, SumH2SO4=0.03)plot(K_NH4(35, 1:25), xlab="temperature / degC")
K_SiOH4 27
K_SiOH4 K_SiOH4
Description
PUBLIC function: calculates the dissociation constant of SiOH4
Usage
K_SiOH4(S, t, p=0, SumH2SO4=NULL, SumHF=NULL, khf="dickson", khso4="dickson")
Arguments
S salinity in practical salinity units (i.e. no unit)
t temperature in degrees centigrade
p gauge pressure (total pressure minus atmospheric pressure) in bars
SumH2SO4 total sulfate concentration in mol/kg-solution (calculated from S if not supplied)
SumHF total fluoride concentration in mol/kg-solution (calculated from S if not sup-plied)
khf S, t relation for K\_HF needed for scale conversion: either "dickson" (default,Dickson1979a) or "perez" (Perez1987a)
khso4 S, t relation for K\_HSO4 needed for scale conversion: either "dickson" (default,Dickson1990) or "khoo" (Khoo1977)
Value
the dissociation constant of SiOH4 in mol/kg-solution on the free proton pH scale
Author(s)
Andreas F. Hofmann ([email protected])
References
Millero1988, DOE1994, Millero1995
Examples
K_SiOH4(35, 15)K_SiOH4(35, 15, 10)K_SiOH4(S=35, t=15, p=10, SumH2SO4=0.03)plot(K_SiOH4(35, 1:25), xlab="temperature / degC")
28 K_SiOOH3
K_SiOOH3 K_SiOOH3
Description
PUBLIC function: calculates the dissociation constant of SiOOH3
Usage
K_SiOOH3(S, t, p=0, SumH2SO4=NULL, SumHF=NULL, khf="dickson", khso4="dickson")
Arguments
S salinity in practical salinity units (i.e. no unit)
t temperature in degrees centigrade
p gauge pressure (total pressure minus atmospheric pressure) in bars
SumH2SO4 total sulfate concentration in mol/kg-solution (calculated from S if not supplied)
SumHF total fluoride concentration in mol/kg-solution (calculated from S if not sup-plied)
khf S, t relation for K\_HF needed for scale conversion: either "dickson" (default,Dickson1979a) or "perez" (Perez1987a)
khso4 S, t relation for K\_HSO4 needed for scale conversion: either "dickson" (default,Dickson1990) or "khoo" (Khoo1977)
Value
the dissociation constant of SiOOH3 in mol/kg-solution on the free proton pH scale
Author(s)
Andreas F. Hofmann ([email protected])
References
Wischmeyer2003 (incl. corrections)
Examples
K_SiOOH3(35, 15)K_SiOOH3(35, 15, 10)K_SiOOH3(S=35, t=15, p=10, SumH2SO4=0.03)plot(K_SiOOH3(35, 1:25), xlab="temperature / degC")
K_W 29
K_W K_W
Description
PUBLIC function: calculates the ion product of H2O
Usage
K_W(S, t, p=0, SumH2SO4=NULL, SumHF=NULL, khf="dickson", khso4="dickson")
Arguments
S salinity in practical salinity units (i.e. no unit)
t temperature in degrees centigrade
p gauge pressure (total pressure minus atmospheric pressure) in bars
SumH2SO4 total sulfate concentration in mol/kg-solution (calculated from S if not supplied)
SumHF total fluoride concentration in mol/kg-solution (calculated from S if not sup-plied)
khf S, t relation for K\_HF needed for scale conversion: either "dickson" (default,Dickson1979a) or "perez" (Perez1987a)
khso4 S, t relation for K\_HSO4 needed for scale conversion: either "dickson" (default,Dickson1990) or "khoo" (Khoo1977)
Value
the ion product of H2O in (mol/kg-solution)2 on the free proton pH scale
Author(s)
Andreas F. Hofmann ([email protected])
References
Millero1995 (SWS pH version), DOE1994 (cites Millero1995), Zeebe2001
Examples
K_W(35, 15)K_W(35, 15, 10)K_W(S=35, t=15, p=10, SumH2SO4=0.03)plot(K_W(35, 1:25), xlab="temperature / degC")
30 MeanMolecularMass
length.aquaenv length.aquaenv
Description
PRIVATE function: returns the (maximal) length of the elements in an object of class aquaenv (i.e.> 1 if one of the input variables was a vector)
Usage
length.aquaenv(x, ...)
Arguments
x object of class aquaenv
... further arguments will be passed
Value
the maximal length of the elements in the object of class aquaenv
Author(s)
Andreas F. Hofmann ([email protected])
MeanMolecularMass MeanMolecularMass
Description
PUBLIC data frame: a collection of mean molecular masses of key chemical species in seawater ing/mol (DOE1994))
Author(s)
Andreas F. Hofmann ([email protected])
merge.aquaenv 31
merge.aquaenv merge.aquaenv
Description
PRIVATE function: merges the elements of two objects of class aquaenv: element names are takenfrom the first argument, the elements of which are also first in the merged object
Usage
merge.aquaenv(x, y, ...)
Arguments
x object of class aquaenv: this is where the element names are taken from
y object of class aquaenv: must contain at leas all the element (names) as aquaenv1,extra elements are ignored
... further arguments will be passed
Value
object of class aquaenv with merged elements
Author(s)
Andreas F. Hofmann ([email protected])
PhysChemConst PhysChemConst
Description
PUBLIC list: a collection of physical and chemical constants
Value
A list containing:
R (bar*cm3)/(mol*K) the gas constant (corrected after Lewis1998, in Millero1995:R = 83.131); digits extended after Dickson2007)
F C/mol the Faraday constant (charge per mol of electrons) (N\_A*e-): Dick-son2007
uMolToMol conversion factor from umol to mol
absZero absolute zero in degrees centigrade
32 plot.aquaenv
e relative dielectric constanf of seawater (Zeebe2001)
K_HNO2 dissociation constant of HNO2: mol/l, NBS pH scale, hybrid constant (Rior-dan2005)
K_HNO3 dissociation constant of HNO3: assumed on mol/kg-soln and free pH scale,stoichiometric constant (Soetaert pers. comm.)
K_H2SO4 dissociation constant of H2SO4: assumed on mol/kg-soln and free pH scale,stoichiometric constant (Atkins1996)
K_HS dissociation constant of HHS: assumed on mol/kg-soln and free pH scale, stoi-chiometric constant (Atkins1996)
Author(s)
Andreas F. Hofmann ([email protected])
plot.aquaenv plot.aquaenv
Description
PUBLIC function: high level plot function for objects of class aquaenv
Arguments
x object of class aquaenv
xval only valid if bjerrum=FALSE: a vector of the (maximal) length of the elementsof aquaenv against which they are to be plotted
what a list of names of the elements of aquaenv that are to be plotted, if not suppliedand bjerrum=FALSE and cumulative=FALSE: all elements are plotted, if notsupplied and bjerrum=TRUE then what is set to be c("CO2", "HCO3", "CO3","BOH3", "BOH4", "OH", "H3PO4", "H2PO4", "HPO4", "PO4", "SiOH4", "SiOOH3","SiO2OH2", "H2S", "HS", "S2min", "NH4", "NH3", "H2SO4", "HSO4", "SO4","HF", "F", "HNO3", "NO3", "HNO2", "NO2"), needs to be supplied for cumu-lative=TRUE
bjerrum flag: TRUE = a bjerrum plot is done (by calling bjerrumplot)
cumulative flag: TRUE = a cumulative plot is done (by calling cumulativeplot)
newdevice flag: if TRUE, new plot device is opened
setpar flag: if TRUE parameters are set with the function par
xlab x axis label
log only valif if bjerrum=TRUE: should the plot be on a logarithmic y axis?
total only valid if cumulative=TRUE: should the sum of all elements specified in whatbe plotted as well?
device the device to plot on; default: "x11" (can also be "eps" or "pdf")
filename filename to be used if "eps" or "pdf" is selected for device
plot.aquaenv 33
size the size of the plot device; default: 12 (width) by 10 (height) inches
ylim standard plot parameter; if not supplied it will be calculated by range() of theelements to plot
lwd standard plot parameter; width of the lines in the plot
mgp standard plot parameter; default: axis title on line 1.8, axis labels on line 0.5,axis on line 0
mar standard plot parameter; default: margin of 3 lines bottom and left and 0.5 linestop and right
oma standard plot parameter; default: no outer margin
palette only valid if bjerrum=TRUE or cumulative=TRUE: a vector of colors to use inthe plot (either numbers or names given in colors())
legendpositiononly valid if bjerrum=TRUE or cumulative=TRUE: position of the legend
legendinset only valid if bjerrum=TRUE or cumulative=TRUE: standard legend parameterinset
legendlwd only valid if bjerrum=TRUE or cumulative=TRUE: standard legend parameterlwd: line width of lines in legend
bg only valid if bjerrum=TRUE or cumulative=TRUE: standard legend parameter:default background color: white
y.intersp standard legend parameter; if cumulative=TRUE then default: 1.2 lines spacebetween the lines in the legend
... further arguments are passed on to the plot function
Details
Top level generic usage is
plot.aquaenv(x, xval, what=NULL, bjerrum=FALSE,cumulative=FALSE, newdevice=TRUE, setpar=TRUE,
device="x11", ...)
Generic usages for standard plotting are
plot.aquaenv(x, xval, ...)
plot.aquaenv(x, xval, what, mfrow=c(1,1), size=c(7,7), ...)
Generic usage for creating a bjerrum plot is
plot.aquaenv(x, what, log=FALSE, palette=NULL,device="x11", filename="aquaenv",size=c(12,10), ylim=NULL, lwd=2, xlab="free scale pH",
mgp=c(1.8, 0.5, 0), mar=c(3,3,0.5,0.5), oma=c(0,0,0,0),legendposition="bottomleft", legendinset=0.05,legendlwd=4, bg="white", newdevice=TRUE, setpar=TRUE,device="x11",...)
34 plot.aquaenv
Generic usage for creating a cumulative plot is
plot.aquaenv(x, xval, what, total=TRUE, palette=NULL,device="x11", filename="aquaenv", size=c(12,10), ylim=NULL,lwd=2, mgp=c(1.8, 0.5, 0), mar=c(3,3,0.5,0.5), oma=c(0,0,0,0),legendposition="bottomleft", legendinset=0.05, legendlwd=4,bg="white", y.intersp=1.2, newdevice=TRUE, setpar=TRUE,
device="x11",...)
Author(s)
Andreas F. Hofmann ([email protected])
Examples
## Not run:### 0#####A <- aquaenv(35, 15, SumCO2=0.003, TA=seq(0.001,0.004, 0.0001))plot(A, xval=A$TA, xlab="[TA]/(mol/kg-soln)")plot(A, what=c("CO2", "HCO3", "CO3"), bjerrum=TRUE, log=TRUE)plot(A, xval=A$TA, xlab="[TA]/(mol/kg-soln)", what=c("CO2", "HCO3", "CO3"),
cumulative=TRUE, ylab="mol/kg-soln", ylim=c(0,0.0031))
### 1#####
SumCO2 <- 0.0020pH <- 8
S <- 30t <- 1:15p <- 10ae <- aquaenv(S, t, p, SumCO2=SumCO2, pH=pH, revelle=TRUE, dsa=TRUE)plot(ae, xval=t, xlab="T/(deg C)", newdevice=FALSE)
### 2#####S <- 35t <- 15
SumCO2 <- 0.003500SumNH4 <- 0.000020
mass_sample <- 0.01 # the mass of the sample solution in kgmass_titrant <- 0.02 # the total mass of the added titrant solution in
# kgconc_titrant <- 0.01 # the concentration of the titrant solution in
# mol/kg-soln
plot.aquaenv 35
S_titrant <- 0.5 # the salinity of the titrant solution (the# salinity of a solution with a ionic strength of# 0.01 according to: I = (19.924 S) / (1000 - 1.005S)
steps <- 50 # the amount of steps the mass of titrant is added# in
type <- "HCl"
pHstart <- 11.3
ae <- titration(aquaenv(S=S, t=t, SumCO2=SumCO2, SumNH4=SumNH4,pH=pHstart), mass_sample, mass_titrant, conc_titrant,S_titrant, steps, type)
# plotting everythingplot(ae, xval=ae$delta_mass_titrant, xlab="HCl solution added [kg]",mfrow=c(10,10))
# plotting selectivelysize <- c(12,8) #inchesmfrow <- c(4,4)what <- c("TA", "pH", "CO2", "HCO3", "CO3", "BOH3", "BOH4", "OH",
"NH4", "NH3", "H2SO4", "HSO4", "SO4", "HF", "F", "pCO2")
plot(ae, xval=ae$delta_mass_titrant, xlab="HCl solution added [kg]",what=what, size=size, mfrow=mfrow)
plot(ae, xval=ae$pH, xlab="free scale pH", what=what, size=size,mfrow=mfrow)
# different x valuesplot(ae, xval=ae$delta_conc_titrant, xlab="[HCl] offset added
[mol/kg-soln]", what=what, size=size, mfrow=mfrow)
plot(ae, xval=ae$delta_moles_titrant, xlab="HCl added [mol]", what=what,size=size, mfrow=mfrow, newdevice=FALSE)
# bjerrum plotsplot(ae, bjerrum=TRUE)
what <- c("CO2", "HCO3", "CO3")plot(ae, what=what, bjerrum=TRUE)plot(ae, what=what, bjerrum=TRUE, lwd=4, palette=c("cyan", "magenta",
"yellow"), bg="gray", legendinset=0.1, legendposition="topleft")
what <- c("CO2", "HCO3", "CO3", "BOH3", "BOH4", "OH", "NH4", "NH3",
36 plot.aquaenv
"H2SO4", "HSO4", "SO4", "HF", "F")
plot(ae, what=what, bjerrum=TRUE, log=TRUE, newdevice=FALSE)plot(ae, what=what, bjerrum=TRUE, log=TRUE, ylim=c(-6,-1),
legendinset=0, lwd=3, palette=c(1,3,4,5,6,colors()[seq(100,250,6)]))
### 3#####parameters <- list(
t = 15 , # degrees CS = 35 , # psu
SumCO2_t0 = 0.002 , # mol/kg-soln (comparable to Wang2005)TA_t0 = 0.0022 , # mol/kg-soln (comparable to Millero1998)
kc = 0.5 , # 1/d proportionality factor# for air-water exchange
kp = 0.000001 , # mol/(kg-soln*d) max rate of calcium# carbonate precipitation
n = 2.0 , # - exponent for kinetic# rate law of precipitation
modeltime = 20 , # d duration of the modeloutputsteps = 100 # number of outputsteps
)
boxmodel <- function(timestep, currentstate, parameters){
with (as.list(c(currentstate,parameters)),{ae <- aquaenv(S=S, t=t, SumCO2=SumCO2, pH=-log10(H), SumSiOH4=0,
SumBOH3=0, SumH2SO4=0, SumHF=0, dsa=TRUE)
Rc <- kc * ((ae$CO2_sat) - (ae$CO2))Rp <- kp * (1-ae$omega_calcite)^n
dSumCO2 <- Rc - Rp
dHRc <- ( -(ae$dTAdSumCO2*Rc ))/ae$dTAdHdHRp <- (-2*Rp -(ae$dTAdSumCO2*(-Rp)))/ae$dTAdHdH <- dHRc + dHRp
ratesofchanges <- c(dSumCO2, dH)
processrates <- c(Rc=Rc, Rp=Rp)outputvars <- c(dHRc=dHRc, dHRp=dHRp)
return(list(ratesofchanges, list(processrates, outputvars, ae)))})
}
sample_dickson1981 37
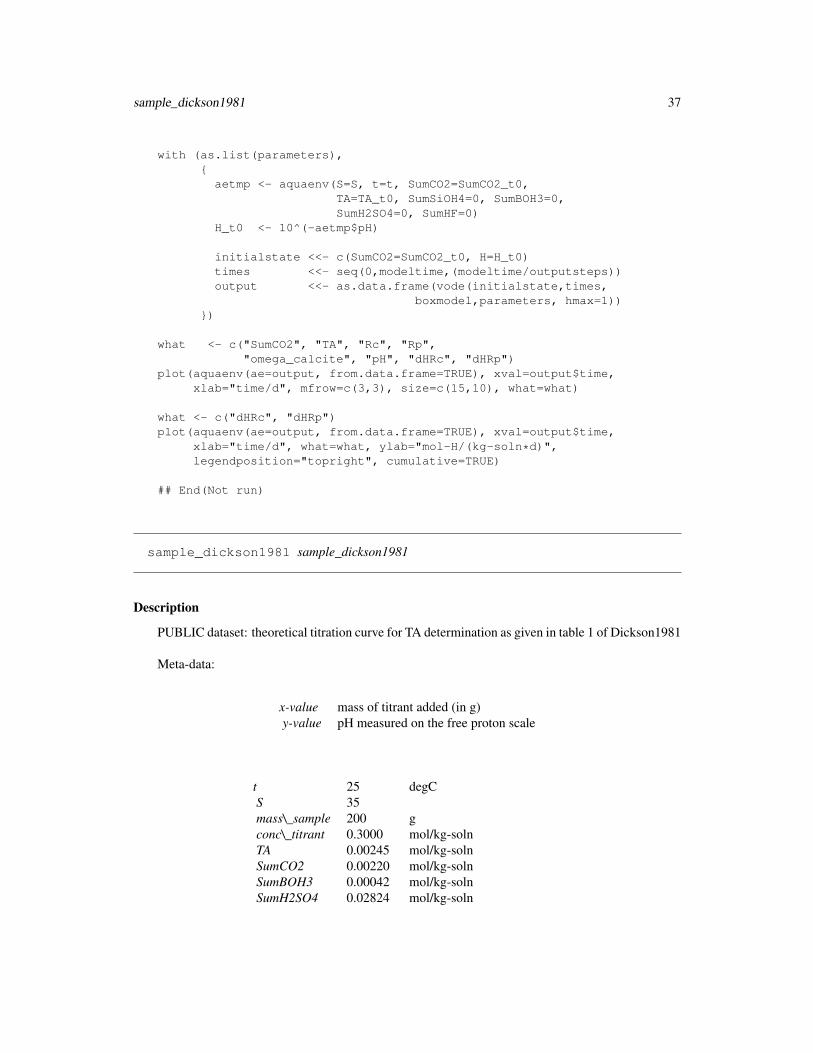
with (as.list(parameters),{aetmp <- aquaenv(S=S, t=t, SumCO2=SumCO2_t0,
TA=TA_t0, SumSiOH4=0, SumBOH3=0,SumH2SO4=0, SumHF=0)
H_t0 <- 10^(-aetmp$pH)
initialstate <<- c(SumCO2=SumCO2_t0, H=H_t0)times <<- seq(0,modeltime,(modeltime/outputsteps))output <<- as.data.frame(vode(initialstate,times,
boxmodel,parameters, hmax=1))})
what <- c("SumCO2", "TA", "Rc", "Rp","omega_calcite", "pH", "dHRc", "dHRp")
plot(aquaenv(ae=output, from.data.frame=TRUE), xval=output$time,xlab="time/d", mfrow=c(3,3), size=c(15,10), what=what)
what <- c("dHRc", "dHRp")plot(aquaenv(ae=output, from.data.frame=TRUE), xval=output$time,
xlab="time/d", what=what, ylab="mol-H/(kg-soln*d)",legendposition="topright", cumulative=TRUE)
## End(Not run)
sample_dickson1981 sample_dickson1981
Description
PUBLIC dataset: theoretical titration curve for TA determination as given in table 1 of Dickson1981
Meta-data:
x-value mass of titrant added (in g)y-value pH measured on the free proton scale
t 25 degCS 35mass\_sample 200 gconc\_titrant 0.3000 mol/kg-solnTA 0.00245 mol/kg-solnSumCO2 0.00220 mol/kg-solnSumBOH3 0.00042 mol/kg-solnSumH2SO4 0.02824 mol/kg-soln
38 TAfit
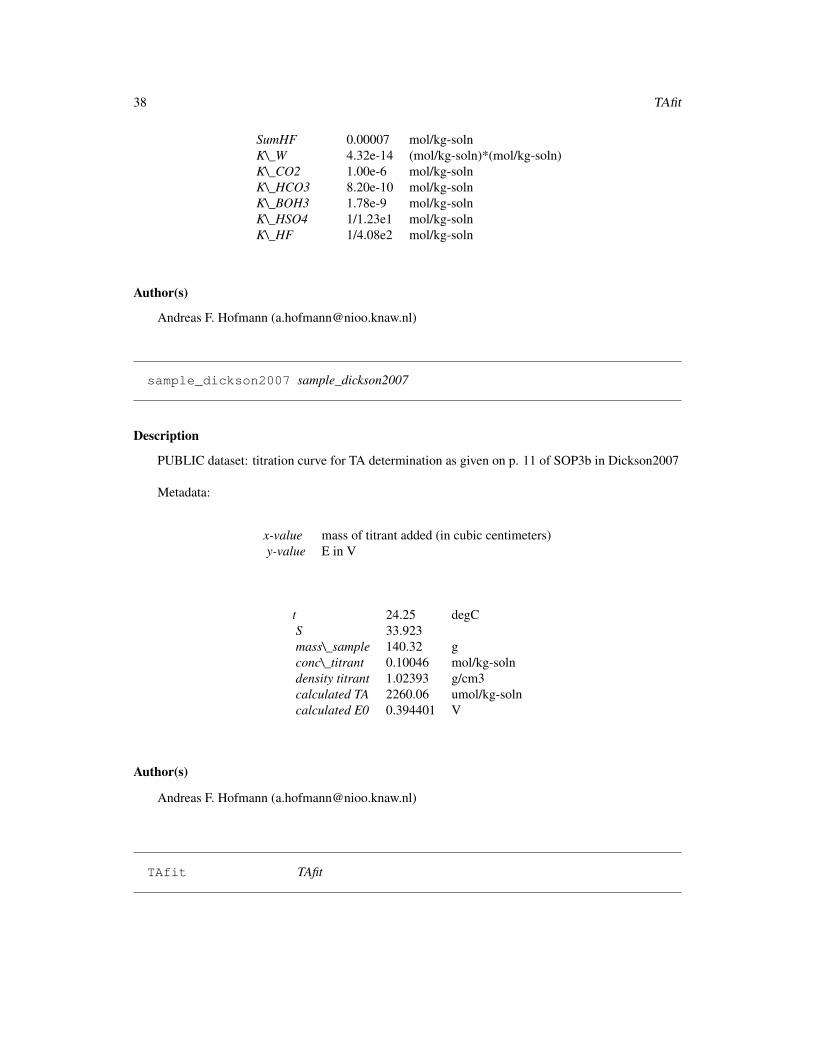
SumHF 0.00007 mol/kg-solnK\_W 4.32e-14 (mol/kg-soln)*(mol/kg-soln)K\_CO2 1.00e-6 mol/kg-solnK\_HCO3 8.20e-10 mol/kg-solnK\_BOH3 1.78e-9 mol/kg-solnK\_HSO4 1/1.23e1 mol/kg-solnK\_HF 1/4.08e2 mol/kg-soln
Author(s)
Andreas F. Hofmann ([email protected])
sample_dickson2007 sample_dickson2007
Description
PUBLIC dataset: titration curve for TA determination as given on p. 11 of SOP3b in Dickson2007
Metadata:
x-value mass of titrant added (in cubic centimeters)y-value E in V
t 24.25 degCS 33.923mass\_sample 140.32 gconc\_titrant 0.10046 mol/kg-solndensity titrant 1.02393 g/cm3calculated TA 2260.06 umol/kg-solncalculated E0 0.394401 V
Author(s)
Andreas F. Hofmann ([email protected])
TAfit TAfit
TAfit 39
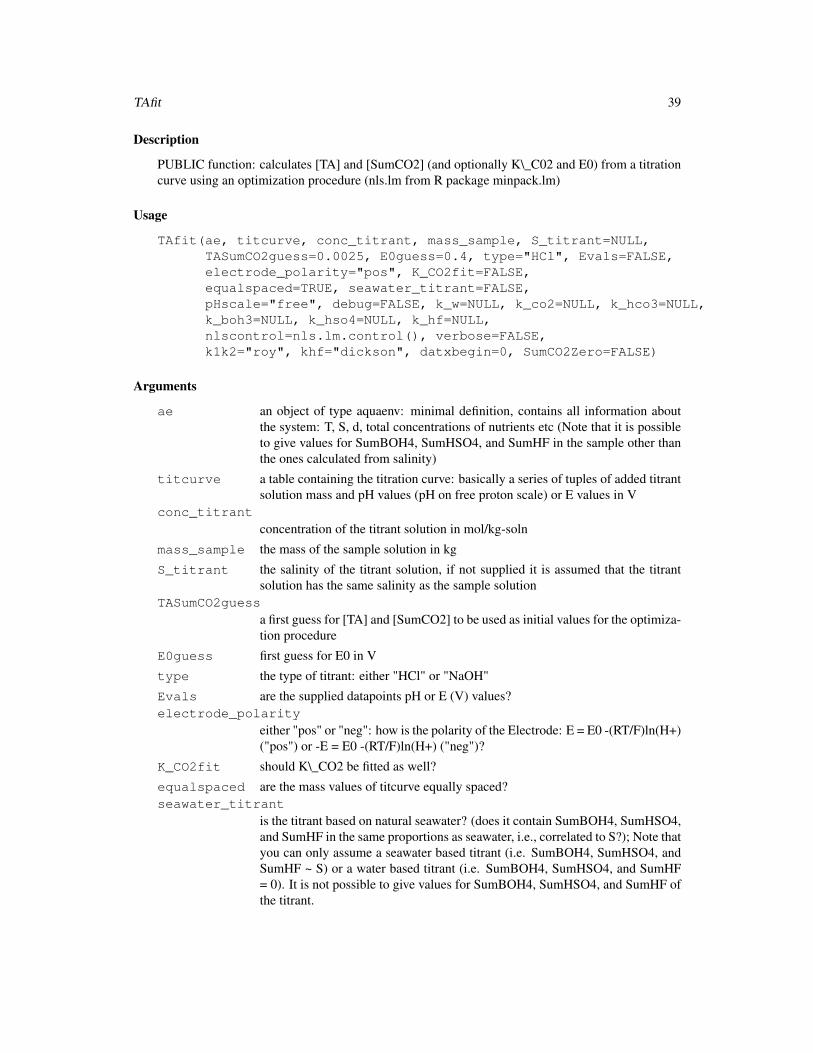
Description
PUBLIC function: calculates [TA] and [SumCO2] (and optionally K\_C02 and E0) from a titrationcurve using an optimization procedure (nls.lm from R package minpack.lm)
Usage
TAfit(ae, titcurve, conc_titrant, mass_sample, S_titrant=NULL,TASumCO2guess=0.0025, E0guess=0.4, type="HCl", Evals=FALSE,electrode_polarity="pos", K_CO2fit=FALSE,equalspaced=TRUE, seawater_titrant=FALSE,pHscale="free", debug=FALSE, k_w=NULL, k_co2=NULL, k_hco3=NULL,k_boh3=NULL, k_hso4=NULL, k_hf=NULL,nlscontrol=nls.lm.control(), verbose=FALSE,k1k2="roy", khf="dickson", datxbegin=0, SumCO2Zero=FALSE)
Arguments
ae an object of type aquaenv: minimal definition, contains all information aboutthe system: T, S, d, total concentrations of nutrients etc (Note that it is possibleto give values for SumBOH4, SumHSO4, and SumHF in the sample other thanthe ones calculated from salinity)
titcurve a table containing the titration curve: basically a series of tuples of added titrantsolution mass and pH values (pH on free proton scale) or E values in V
conc_titrantconcentration of the titrant solution in mol/kg-soln
mass_sample the mass of the sample solution in kg
S_titrant the salinity of the titrant solution, if not supplied it is assumed that the titrantsolution has the same salinity as the sample solution
TASumCO2guessa first guess for [TA] and [SumCO2] to be used as initial values for the optimiza-tion procedure
E0guess first guess for E0 in V
type the type of titrant: either "HCl" or "NaOH"
Evals are the supplied datapoints pH or E (V) values?electrode_polarity
either "pos" or "neg": how is the polarity of the Electrode: E = E0 -(RT/F)ln(H+)("pos") or -E = E0 -(RT/F)ln(H+) ("neg")?
K_CO2fit should K\_CO2 be fitted as well?
equalspaced are the mass values of titcurve equally spaced?seawater_titrant
is the titrant based on natural seawater? (does it contain SumBOH4, SumHSO4,and SumHF in the same proportions as seawater, i.e., correlated to S?); Note thatyou can only assume a seawater based titrant (i.e. SumBOH4, SumHSO4, andSumHF ~ S) or a water based titrant (i.e. SumBOH4, SumHSO4, and SumHF= 0). It is not possible to give values for SumBOH4, SumHSO4, and SumHF ofthe titrant.
40 TAfit
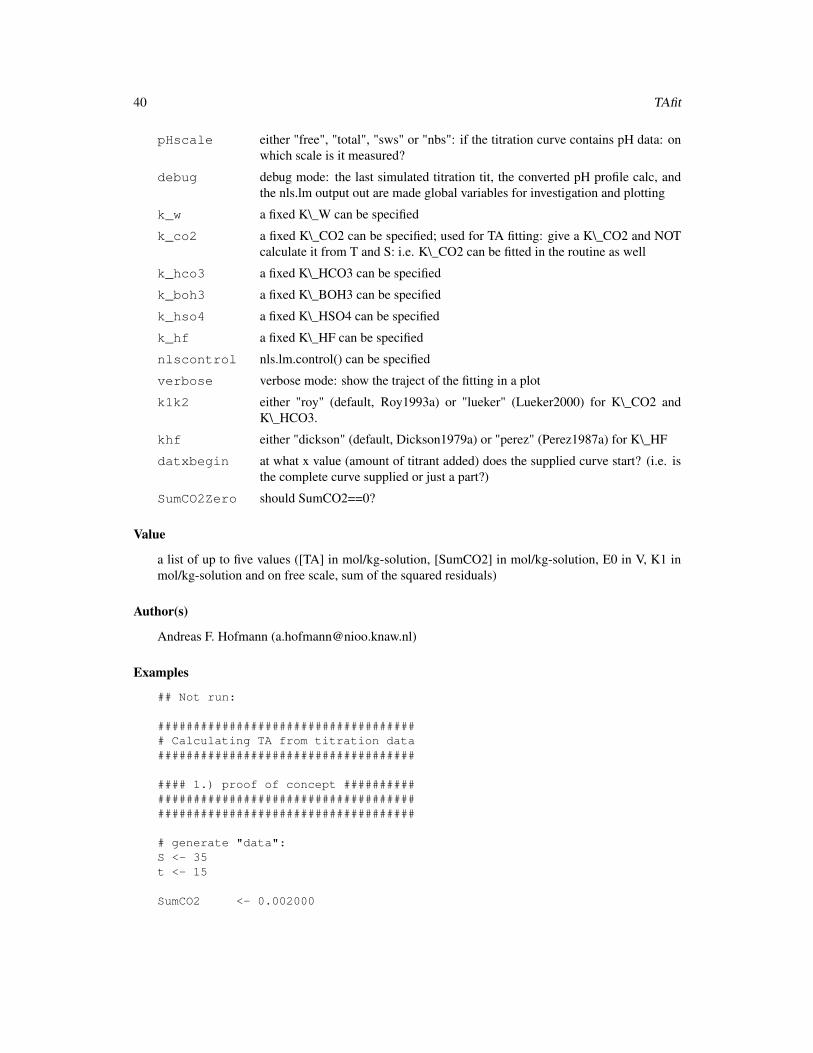
pHscale either "free", "total", "sws" or "nbs": if the titration curve contains pH data: onwhich scale is it measured?
debug debug mode: the last simulated titration tit, the converted pH profile calc, andthe nls.lm output out are made global variables for investigation and plotting
k_w a fixed K\_W can be specified
k_co2 a fixed K\_CO2 can be specified; used for TA fitting: give a K\_CO2 and NOTcalculate it from T and S: i.e. K\_CO2 can be fitted in the routine as well
k_hco3 a fixed K\_HCO3 can be specified
k_boh3 a fixed K\_BOH3 can be specified
k_hso4 a fixed K\_HSO4 can be specified
k_hf a fixed K\_HF can be specified
nlscontrol nls.lm.control() can be specified
verbose verbose mode: show the traject of the fitting in a plot
k1k2 either "roy" (default, Roy1993a) or "lueker" (Lueker2000) for K\_CO2 andK\_HCO3.
khf either "dickson" (default, Dickson1979a) or "perez" (Perez1987a) for K\_HF
datxbegin at what x value (amount of titrant added) does the supplied curve start? (i.e. isthe complete curve supplied or just a part?)
SumCO2Zero should SumCO2==0?
Value
a list of up to five values ([TA] in mol/kg-solution, [SumCO2] in mol/kg-solution, E0 in V, K1 inmol/kg-solution and on free scale, sum of the squared residuals)
Author(s)
Andreas F. Hofmann ([email protected])
Examples
## Not run:
##################################### Calculating TA from titration data####################################
#### 1.) proof of concept ##################################################################################
# generate "data":S <- 35t <- 15
SumCO2 <- 0.002000
TAfit 41
TA <- 0.002200initial_ae <- aquaenv(S=S, t=t, SumCO2=SumCO2, TA=TA)
mass_sample <- 0.01 # the mass of the sample solution in kgmass_titrant <- 0.003 # the total mass of the added titrant solution
# in kgconc_titrant <- 0.01 # the concentration of the titrant solution in
# mol/kg-solnS_titrant <- 0.5 # the salinity of the titrant solution (the
# salinity of a solution with a ionic strength# of 0.01 according to:# I = (19.924 S) / (1000 - 1.005 S)
steps <- 20 # the amount of steps the mass of titrant is# added in
type <- "HCl"
ae <- titration(initial_ae, mass_sample, mass_titrant, conc_titrant,S_titrant, steps, type)
plot(ae, ae$delta_mass_titrant, what="pH", newdevice=FALSE)
# the input data for the TA fitting routine: a table with the added# mass of the titrant and the resulting free scale pHtitcurve <- cbind(ae$delta_mass_titrant, ae$pH)
# for the TA fitting procedure all total quantities except SumCO2# (SumNH4, SumH2S, SumH3PO4, SumSiOH4, SumHNO3, SumHNO2, SumBOH3,# SumH2SO4, SumHF) need to be known. However, the latter three# can be calculated from salinity as it is done in this example.
fit1 <- TAfit(initial_ae, titcurve, conc_titrant, mass_sample,S_titrant)
fit1
# E (V) values as input variables: generate E values using# E0=0.4 V and the nernst equationtottitcurve <- convert(titcurve[,2], "pHscale", "free2sws", S=S,
t=t)# (Nernst equation relates E to TOTAL [H+] (DOE1994, p.7,# ch.4, sop.3), BUT, if fluoride is present, its SWS, so# we use SWS!Etitcurve <- cbind(titcurve[,1], (0.4 - ((PhysChemConst$R/10)
*initial_ae$T/PhysChemConst$F)
*log(10^-tottitcurve))) # Nernst equation
fit2 <- TAfit(initial_ae, Etitcurve, conc_titrant, mass_sample,S_titrant, Evals=TRUE, verbose=TRUE)
fit2
# k_co2 fitting: one K_CO2 (k_co2) for the whole titration curve# is fitted, i.e. there is NO correction for K_CO2 changes due to
42 TAfit
# changing S due to mixing with the titrantfit3 <- TAfit(initial_ae, titcurve, conc_titrant, mass_sample,
S_titrant, K_CO2fit=TRUE)fit3
# assume the titrant has the same salinity as the sample# (and is made up of natural seawater, i.e. containing SumBOH4,# SumH2SO4 and SumHF as functions of S), then the "right" K_CO2# should be fitted i.e we do NOT give the argument S_titrant# and set the flag seawater_titrant to TRUEae <- titration(initial_ae, mass_sample, mass_titrant,
conc_titrant, steps=steps, type=type,seawater_titrant=TRUE)
titcurve <- cbind(ae$delta_mass_titrant, ae$pH)
fit4 <- TAfit(initial_ae, titcurve, conc_titrant, mass_sample,K_CO2fit=TRUE, seawater_titrant=TRUE)
fit4
# fitting of TA, SumCO2, K_CO2 and E0Etitcurve <- cbind(titcurve[,1], (0.4 - ((PhysChemConst$R/10)
*initial_ae$T/PhysChemConst$F)
*log(10^-titcurve[,2])))fit5 <- TAfit(initial_ae, Etitcurve, conc_titrant, mass_sample,
K_CO2fit=TRUE, seawater_titrant=TRUE, Evals=TRUE)fit5
# fitting of non equally spaced data:neqsptitcurve <- rbind(titcurve[1:9,], titcurve[11:20,])fit6 <- TAfit(initial_ae, neqsptitcurve, conc_titrant,
mass_sample, seawater_titrant=TRUE,equalspaced=FALSE)
fit6
#add some "noise" on the generated datanoisetitcurve <- titcurve * rnorm(length(titcurve),
mean=1, sd=0.01) #one percent error possibleplot(ae, ae$delta_mass_titrant, what="pH", type="l", col="red",
xlim=c(0,0.003), ylim=c(3,8.1), newdevice=FALSE)par(new=TRUE)plot(noisetitcurve[,1],noisetitcurve[,2], type="l",
xlim=c(0,0.003), ylim=c(3,8.1))
fit7 <- TAfit(initial_ae, noisetitcurve, conc_titrant,mass_sample, seawater_titrant=TRUE)
fit7
# 2.) test with generated data from Dickson1981 ###################################################################################################
TAfit 43
conc_titrant = 0.3 # mol/kg-solnmass_sample = 0.2 # kgS_titrant = 14.835 # is aequivalent to the ionic strength
# of 0.3 mol/kg-soln
SumBOH3 = 0.00042 # mol/kg-solnSumH2SO4 = 0.02824 # mol/kg-solnSumHF = 0.00007 # mol/kg-soln
# convert mass of titrant from g to kgsam <- cbind(sample_dickson1981[,1]/1000, sample_dickson1981[,2])
dicksonfit <- TAfit(aquaenv(t=25, S=35, SumBOH3=SumBOH3,SumH2SO4=SumH2SO4, SumHF=SumHF), sam,conc_titrant, mass_sample,S_titrant=S_titrant, debug=TRUE)
dicksonfit#TA Dickson1981: 0.00245#SumCO2 Dickson1981: 0.00220
# => not exactly the same! why?
# a.) does salinity correction (S_titrant) matter or not?##########################################################
# without salinity correctiondicksontitration1 <- titration(aquaenv(t=25, S=35, SumCO2=0.00220,
SumBOH3=SumBOH3, SumH2SO4=SumH2SO4,SumHF=SumHF, TA=0.00245),mass_sample=mass_sample,mass_titrant=0.0025,conc_titrant=conc_titrant,steps=50, type="HCl")
# with salinity correctiondicksontitration2 <- titration(aquaenv(t=25, S=35, SumCO2=0.00220,
SumBOH3=SumBOH3, SumH2SO4=SumH2SO4,SumHF=SumHF, TA=0.00245),mass_sample=mass_sample,mass_titrant=0.0025,conc_titrant=conc_titrant,S_titrant=S_titrant,steps=50, type="HCl")
plot(dicksontitration1, xval=dicksontitration1$delta_mass_titrant,what="pH", xlim=c(0,0.0025), ylim=c(3,8.2), newdevice=FALSE,col="red")
par(new=TRUE)plot(dicksontitration2, xval=dicksontitration2$delta_mass_titrant,
what="pH", xlim=c(0,0.0025), ylim=c(3,8.2), newdevice=FALSE,
44 TAfit
col="blue")par(new=TRUE)plot(sam[,1], sam[,2], type="l", xlim=c(0,0.0025), ylim=c(3,8.2))
# => salinity correction makes NO difference, because the relation# between total sample and added titrant is very large:# salinity only drops from 35 to 34.75105
#BUT: there is an offset between the "Dickson" curve and our curve:plot(dicksontitration2$pH - sam[,2])
# b.) does it get better if we fit K_CO2 as well?#################################################dicksonfit2 <- TAfit(aquaenv(t=25, S=35, SumBOH3=SumBOH3,
SumH2SO4=SumH2SO4, SumHF=SumHF), sam,conc_titrant, mass_sample,
S_titrant=S_titrant, debug=TRUE,K_CO2fit=TRUE)
dicksonfit2#TA Dickson1981: 0.00245#SumCO2 Dickson1981: 0.00220
# => yes it does, but it is not perfect yet!
# c.) differing K values########################## Dickson uses fixed K values that are slightly different than oursdicksontitration3 <- titration(aquaenv(t=25, S=35, SumCO2=0.00220,
SumBOH3=SumBOH3, SumH2SO4=SumH2SO4,SumHF=SumHF, TA=0.00245, k_w=4.32e-14,
k_co2=1e-6, k_hco3=8.20e-10,k_boh3=1.78e-9, k_hso4=(1/1.23e1),k_hf=(1/4.08e2)),mass_sample=mass_sample,mass_titrant=0.0025,conc_titrant=conc_titrant,steps=50, type="HCl",S_titrant=S_titrant, k_w=4.32e-14,k_co2=1e-6, k_hco3=8.20e-10,k_boh3=1.78e-9, k_hso4=(1/1.23e1),k_hf=(1/4.08e2))
plot(dicksontitration3, xval=dicksontitration3$delta_mass_titrant,what="pH", xlim=c(0,0.0025), ylim=c(3,8.2), newdevice=FALSE,col="blue")
par(new=TRUE)plot(sam[,1], sam[,2], type="l", xlim=c(0,0.0025), ylim=c(3,8.2))
plot(dicksontitration3$pH - sam[,2])# => no offset between the pH curves
# => exactly the same curves!
Technicals 45
dicksonfit3 <- TAfit(aquaenv(t=25, S=35, SumBOH3=SumBOH3,SumH2SO4=SumH2SO4, SumHF=SumHF, k_w=4.32e-14,k_co2=1e-6, k_hco3=8.20e-10, k_boh3=1.78e-9,
k_hso4=(1/1.23e1), k_hf=(1/4.08e2)),sam, conc_titrant, mass_sample,
S_titrant=S_titrant, debug=TRUE,k_w=4.32e-14, k_co2=1e-6, k_hco3=8.20e-10,
k_boh3=1.78e-9, k_hso4=(1/1.23e1),k_hf=(1/4.08e2))
dicksonfit3
# PERFECT fit!
plot(sam[,1], sam[,2], xlim=c(0,0.0025), ylim=c(3,8.2), type="l")par(new=TRUE)plot(tit$delta_mass_titrant, calc, xlim=c(0,0.0025), ylim=c(3,8.2),
type="l", col="red")
## End(Not run)
Technicals Technicals
Description
PUBLIC list: a collection programming-technical constants
Value
A list with elements:
Haccur accuracy for iterative (Follows2006) pH calculations (max. deviation in [H+])Hstart start [H+] for an iterative pH calculationmaxiter maximum number of iterations for iterative (Follows2006) pH calculation method
as well as for the application of the standard R function unirootunirootinterval
the interval (in terms of [H+]) for pH calculation using the standard R functionuniroot
uniroottol the interval (in terms of [H+]) for pH calculation using the standard R functionuniroot
epsilon_fractionfraction of disturbance for the numerical calculation of derivatives of TA withrespect to changes in the dissociation constants
revelle_fractionfraction of disturbance for the numerical calculation of the revelle factor
CO2 fugacity of CO2 in atm
46 titration
Author(s)
Andreas F. Hofmann ([email protected])
titration titration
Description
PUBLIC function: creates an object of class aquaenv which contains a titration simulation
Usage
titration(aquaenv, mass_sample, mass_titrant, conc_titrant,S_titrant=NULL, steps, type="HCl", seawater_titrant=FALSE,k_w=NULL, k_co2=NULL, k_hco3=NULL, k_boh3=NULL, k_hso4=NULL,k_hf=NULL, k1k2="roy", khf="dickson")
Arguments
aquaenv an object of type aquaenv: minimal definition, contains all information aboutthe system: T, S, d, total concentrations of nutrients etc (Note that it is possibleto give values for SumBOH4, SumHSO4, and SumHF in the sample other thanthe ones calculated from salinity)
mass_sample the mass of the sample solution in kg
mass_titrant the total mass of the added titrant solution in kg
conc_titrant the concentration of the titrant solution in mol/kg-soln
S_titrant the salinity of the titrant solution, if not supplied it is assumed that the titrantsolution has the same salinity as the sample solution
steps the amount of steps the mass of titrant is added in
type the type of titrant: either "HCl" or "NaOH", default: "HCl"seawater_titrant
is the titrant based on natural seawater? (does it contain SumBOH4, SumHSO4,and SumHF in the same proportions as seawater, i.e., correlated to S?); Note thatyou can only assume a seawater based titrant (i.e. SumBOH4, SumHSO4, andSumHF ~ S) or a water based titrant (i.e. SumBOH4, SumHSO4, and SumHF= 0). It is not possible to give values for SumBOH4, SumHSO4, and SumHF ofthe titrant.
k_w a fixed K\_W can be specified
k_co2 a fixed K\_CO2 can be specified; used for TA fitting: give a K\_CO2 and NOTcalculate it from T and S: i.e. K\_CO2 can be fitted in the routine as well
k_hco3 a fixed K\_HCO3 can be specified
k_boh3 a fixed K\_BOH3 can be specified
k_hso4 a fixed K\_HSO4 can be specified
titration 47
k_hf a fixed K\_HF can be specified
k1k2 either "roy" (default, Roy1993a) or "lueker" (Lueker2000) for K\_CO2 andK\_HCO3.
khf either "dickson" (default, Dickson1979a) or "perez" (Perez1987a) for K\_HF
Value
object of class aquaenv which contains a titration simulation
Author(s)
Andreas F. Hofmann ([email protected])
Examples
## Not run:##################### Titration with HCl####################S <- 35t <- 15
SumCO2 <- 0.003500SumNH4 <- 0.000020
mass_sample <- 0.01 # the mass of the sample solution in kgmass_titrant <- 0.02 # the total mass of the added titrant solution in
# kgconc_titrant <- 0.01 # the concentration of the titrant solution in
# mol/kg-solnS_titrant <- 0.5 # the salinity of the titrant solution (the
# salinity of a solution with a ionic strength of# 0.01 according to: I = (19.924 S) / (1000 - 1.005S)
steps <- 50 # the amount of steps the mass of titrant is added# in
type <- "HCl"
pHstart <- 11.3
ae <- titration(aquaenv(S=S, t=t, SumCO2=SumCO2, SumNH4=SumNH4,pH=pHstart), mass_sample, mass_titrant, conc_titrant,S_titrant, steps, type)
# plotting everythingplot(ae, xval=ae$delta_mass_titrant, xlab="HCl solution added [kg]",mfrow=c(10,10))
# plotting selectivelysize <- c(12,8) #inches
48 watdepth
mfrow <- c(4,4)what <- c("TA", "pH", "CO2", "HCO3", "CO3", "BOH3", "BOH4", "OH",
"NH4", "NH3", "H2SO4", "HSO4", "SO4", "HF", "F", "pCO2")
plot(ae, xval=ae$delta_mass_titrant, xlab="HCl solution added [kg]",what=what, size=size, mfrow=mfrow)
plot(ae, xval=ae$pH, xlab="free scale pH", what=what, size=size,mfrow=mfrow)
# different x valuesplot(ae, xval=ae$delta_conc_titrant, xlab="[HCl] offset added
[mol/kg-soln]", what=what, size=size, mfrow=mfrow)
plot(ae, xval=ae$delta_moles_titrant, xlab="HCl added [mol]", what=what,size=size, mfrow=mfrow)
# bjerrum plotspar(mfrow=c(1,1))plot(ae, bjerrum=TRUE)
what <- c("CO2", "HCO3", "CO3")plot(ae, what=what, bjerrum=TRUE)plot(ae, what=what, bjerrum=TRUE, lwd=4, palette=c("cyan", "magenta",
"yellow"), bg="gray", legendinset=0.1, legendposition="topleft")
what <- c("CO2", "HCO3", "CO3", "BOH3", "BOH4", "OH", "NH4", "NH3","H2SO4", "HSO4", "SO4", "HF", "F")
plot(ae, what=what, bjerrum=TRUE, log=TRUE)plot(ae, what=what, bjerrum=TRUE, log=TRUE, ylim=c(-6,-1),
legendinset=0, lwd=3, palette=c(1,3,4,5,6,colors()[seq(100,250,6)]))
## End(Not run)
watdepth watdepth
Description
PUBLIC function: calculates the depth (in m) from the gauge pressure p (or the total pressure P)and the latitude (in degrees: -90 to 90) and the atmospheric pressure Pa (in bar)
Usage
watdepth(P=Pa, p=pmax(0, P-Pa), lat=0, Pa=1.013253)
watdepth 49
Arguments
P total pressure in bar, standard: 1 atm (at the sea surface)
p gauge pressure in bar (total pressure minus atmospheric pressure), standard: 0(at the water surface)
lat latitude in degrees: -90 to 90, standard: 0
Pa atmospheric pressure in bar, standard: 1 atm (at sea level)
Value
water depth d in meters
Author(s)
Andreas F. Hofmann ([email protected])
References
Fofonoff1983
Examples
watdepth(100)plot(watdepth(1:100))
Index
∗Topic miscaquaenv, 2as.data.frame.aquaenv, 9c.aquaenv, 9ConcRelCl, 10convert, 10DeltaPcoeffs, 12gauge_p, 12K0_CO2, 13K0_O2, 14K_BOH3, 16K_CO2, 17K_H2PO4, 18K_H2S, 19K_H3PO4, 20K_HCO3, 21K_HF, 22K_HPO4, 23K_HSO4, 24K_NH4, 25K_SiOH4, 26K_SiOOH3, 27K_W, 28Ksp_aragonite, 14Ksp_calcite, 15length.aquaenv, 29MeanMolecularMass, 29merge.aquaenv, 30PhysChemConst, 30plot.aquaenv, 31sample_dickson1981, 36sample_dickson2007, 37TAfit, 37Technicals, 44titration, 45watdepth, 47
∗Topic packageAquaEnv_package, 7
AquaEnv (AquaEnv_package), 7
aquaenv, 2AquaEnv_package, 7as.data.frame.aquaenv, 9
c.aquaenv, 9ConcRelCl, 10convert, 10
DeltaPcoeffs, 12
gauge_p, 12
K0_CO2, 13K0_O2, 14K_BOH3, 16K_CO2, 17K_H2PO4, 18K_H2S, 19K_H3PO4, 20K_HCO3, 21K_HF, 22K_HPO4, 23K_HSO4, 24K_NH4, 25K_SiOH4, 26K_SiOOH3, 27K_W, 28Ksp_aragonite, 14Ksp_calcite, 15
length.aquaenv, 29
MeanMolecularMass, 29merge.aquaenv, 30
PhysChemConst, 30plot.aquaenv, 31
sample_dickson1981, 36sample_dickson2007, 37
TAfit, 37
50

INDEX 51
Technicals, 44titration, 45
watdepth, 47